Early Damage Detection in Composites during Fabrication and Mechanical Testing


1
I-Composites Lab, School of Materials, University of Manchester, Manchester M1 3NJ, UK
2
Aerospace Research Institute, University of Manchester, Manchester M1 3NJ, UK
*
Authors to whom correspondence should be addressed.
Materials 2017, 10(7), 685; https://doi.org/10.3390/ma10070685
Submission received: 2 May 2017
/
Revised: 30 May 2017
/
Accepted: 19 June 2017
/
Published: 22 June 2017
(This article belongs to the Special Issue Structural Health Monitoring for Aerospace Applications 2017)
Abstract
:Fully integrated monitoring systems have shown promise in improving confidence in composite materials while reducing lifecycle costs. A distributed optical fibre sensor is embedded in a fibre reinforced composite laminate, to give three sensing regions at different levels through-the-thickness of the plate. This study follows the resin infusion process during fabrication of the composite, monitoring the development of strain in-situ and in real time, and to gain better understanding of the resin rheology during curing. Piezoelectric wafer active sensors and electrical strain gauges are bonded to the plate after fabrication. This is followed by progressive loading/unloading cycles of mechanical four point bending. The strain values obtained from the optical fibre are in good agreement with strain data collected by surface mounted strain gauges, while the sensing regions clearly indicate the development of compressive, neutral, and tensile strain. Acoustic emission event detection suggests the formation of matrix (resin) cracks, with measured damage event amplitudes in agreement with values reported in published literature on the subject. The Felicity ratio for each subsequent loading cycle is calculated to track the progression of damage in the material. The methodology developed here can be used to follow the full life cycle of a composite structure, from manufacture to end-of-life.
1. Introduction
Fibre reinforced polymer (FRP) composites are known to be stronger, more corrosion resistant, and more lightweight than traditional metals and metal alloys. Improvements in the achievable properties and manufacturing techniques has led to an increase in their use in critically loaded structural applications. However, with new techniques comes uncertainty of the parameters involved. It is not uncommon to find voids, dry and resin rich regions, and other imperfections in finished composite parts. Defects and damage can often be imparted during fabrication. These and the inherent nature of the process can lead to residual strains in the finished product, which may affect the overall performance. Non-destructive inspection/evaluation (NDI/E) techniques are often employed for the detection, localisation, and quantification of flaws and damage. Widely researched methods include the use of X-rays [1], ultrasonic waves [2], eddy currents [3], shearography [4,5,6], and infrared thermography [7,8,9,10]. Though they improve safety and often minimise premature replacements, inspections can represent significant down-time and labour costs. In the aerospace industry, for example, inspection of composite structures accounts for one third of the operation costs [11], so it becomes necessary to develop in-situ monitoring methods. Structural health monitoring (SHM) systems are permanently integrated within structures using embedded or surface mounted sensor networks [12]. The layered nature of FRP composites allows small sensors to be integrated, thus allowing real time process monitoring. Optical fibres [13,14,15] and piezoelectric sensors [12,16,17,18,19,20] have been introduced for SHM in composite materials.
This paper presents an experimental study where a distributed optical fibre sensor is embedded and used to follow the full manufacturing process of a composite laminate, providing valuable information related to the rheology of the system and captures the magnitude of residual strains. During mechanical four point bending, distributed strain and acoustic emissions are monitored to be able to detect the initiation and monitor the progress of damage in the structure as the maximum load is increased. The use of these ‘smart sensors’ has proven to be effective and reliable in the authors’ and others’ previous work when applied to the SHM of composite materials. Similar experimental observations are made in this work, thus validating that it is scientifically sound and has relevance in this research field.
2. Distributed Optical Fibre Sensors
Introduced in the late 80s to early 90s, fibre Bragg grating (FBG) sensors are the most common optical fibre sensor in SHM applications [14,21]. FBGs comprise a grating—periodically modulated refractive index—along a segment of optical fibre which acts as an optical filter by reflecting the Bragg wavelength while transmitting others. The spacing of the grating is a function of strain and temperature, so when the sensor experiences mechanical and/or thermal strains, the Bragg wavelength undergoes a shift. FBG sensors have been employed in many cases for in-situ and real time monitoring of composites due to their non-invasive nature [21,22,23,24], but, without multiplexing technology, each FBG requires its own interrogator system.
A distributed optical fibre sensor (DOFS) is a single optical fibre, sensitive at multiple points along its length [25]; thus, it is possible to use a single distributed sensor in the place of several discrete sensors. When a narrow band of light is passed through the core of a DOFS, three different scattering processes take place: Raman, Brillouin, and Rayleigh scattering [26]. The higher signal intensity and losses below 20 dB/km from Rayleigh-based systems makes them favourable [27]. Rayleigh scattering occurs due to interactions between the light and silica glass core; this allows individual sensors to be distinguished by their unique “fingerprint”. Optical time-domain reflectometry (OTDR) is a known technique for distributed sensing using Brillouin or Raman scattering, but the sensing range is limited by the reliance on signal intensity by OTDR systems. Improved spatial resolution can be achieved by optical frequency domain reflectometry (OFDR). OFDR systems use a variable frequency laser beam coupled into an interferometer and are capable of providing measurements with high spatial resolution (~1 mm) and the potential to resolve strain and temperature measurements as fine as 1 µstrain and 0.1 °C, respectively [28]. The mechanical effect of embedding a single-mode, low-bend-loss optical fibre (~155 µm diameter) has been shown to be negligible [29], making distributed sensing with optical fibres one of the few viable methods for process monitoring as well as in-service monitoring.
3. Acoustic Emission in Composite Materials
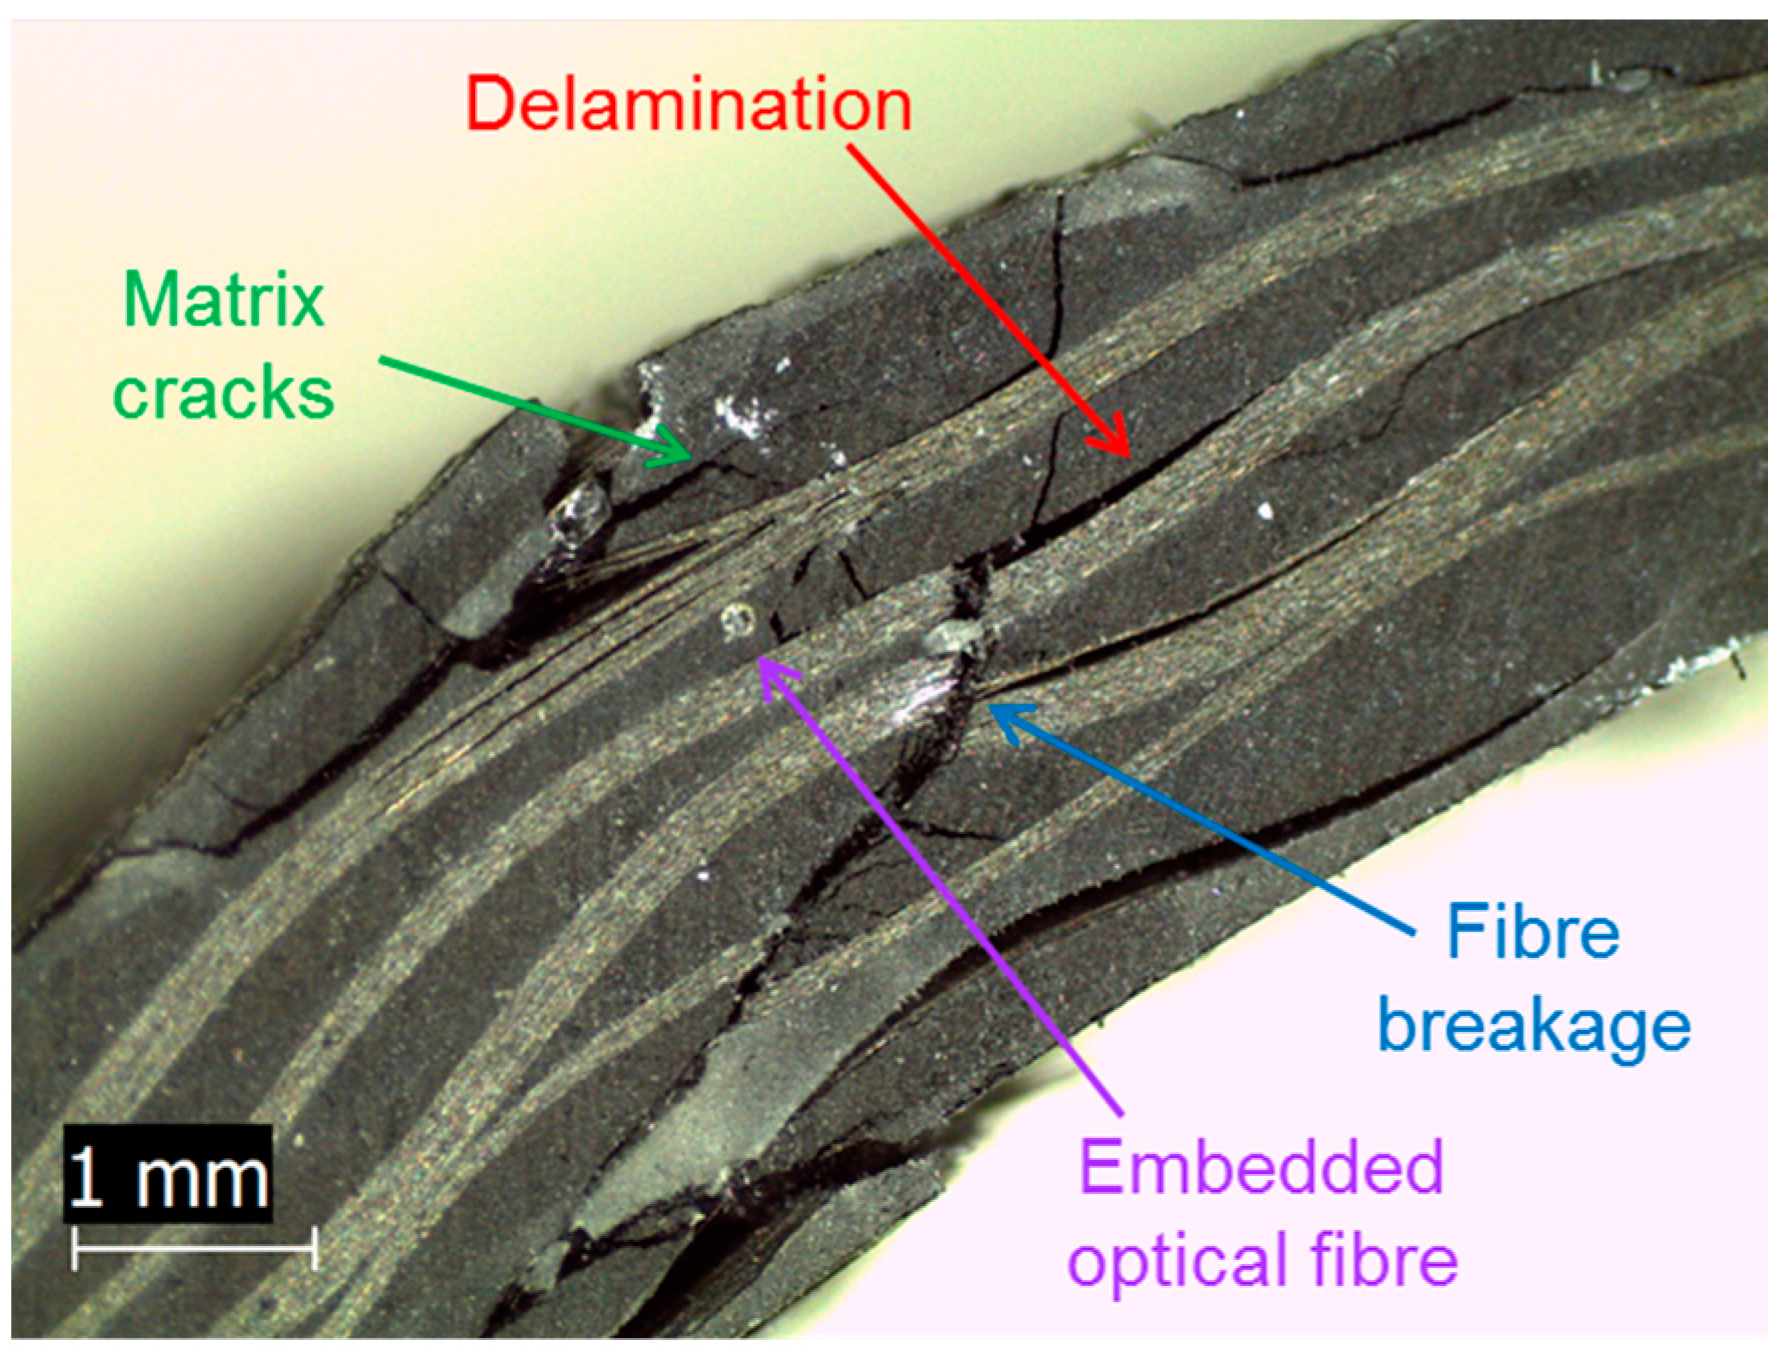
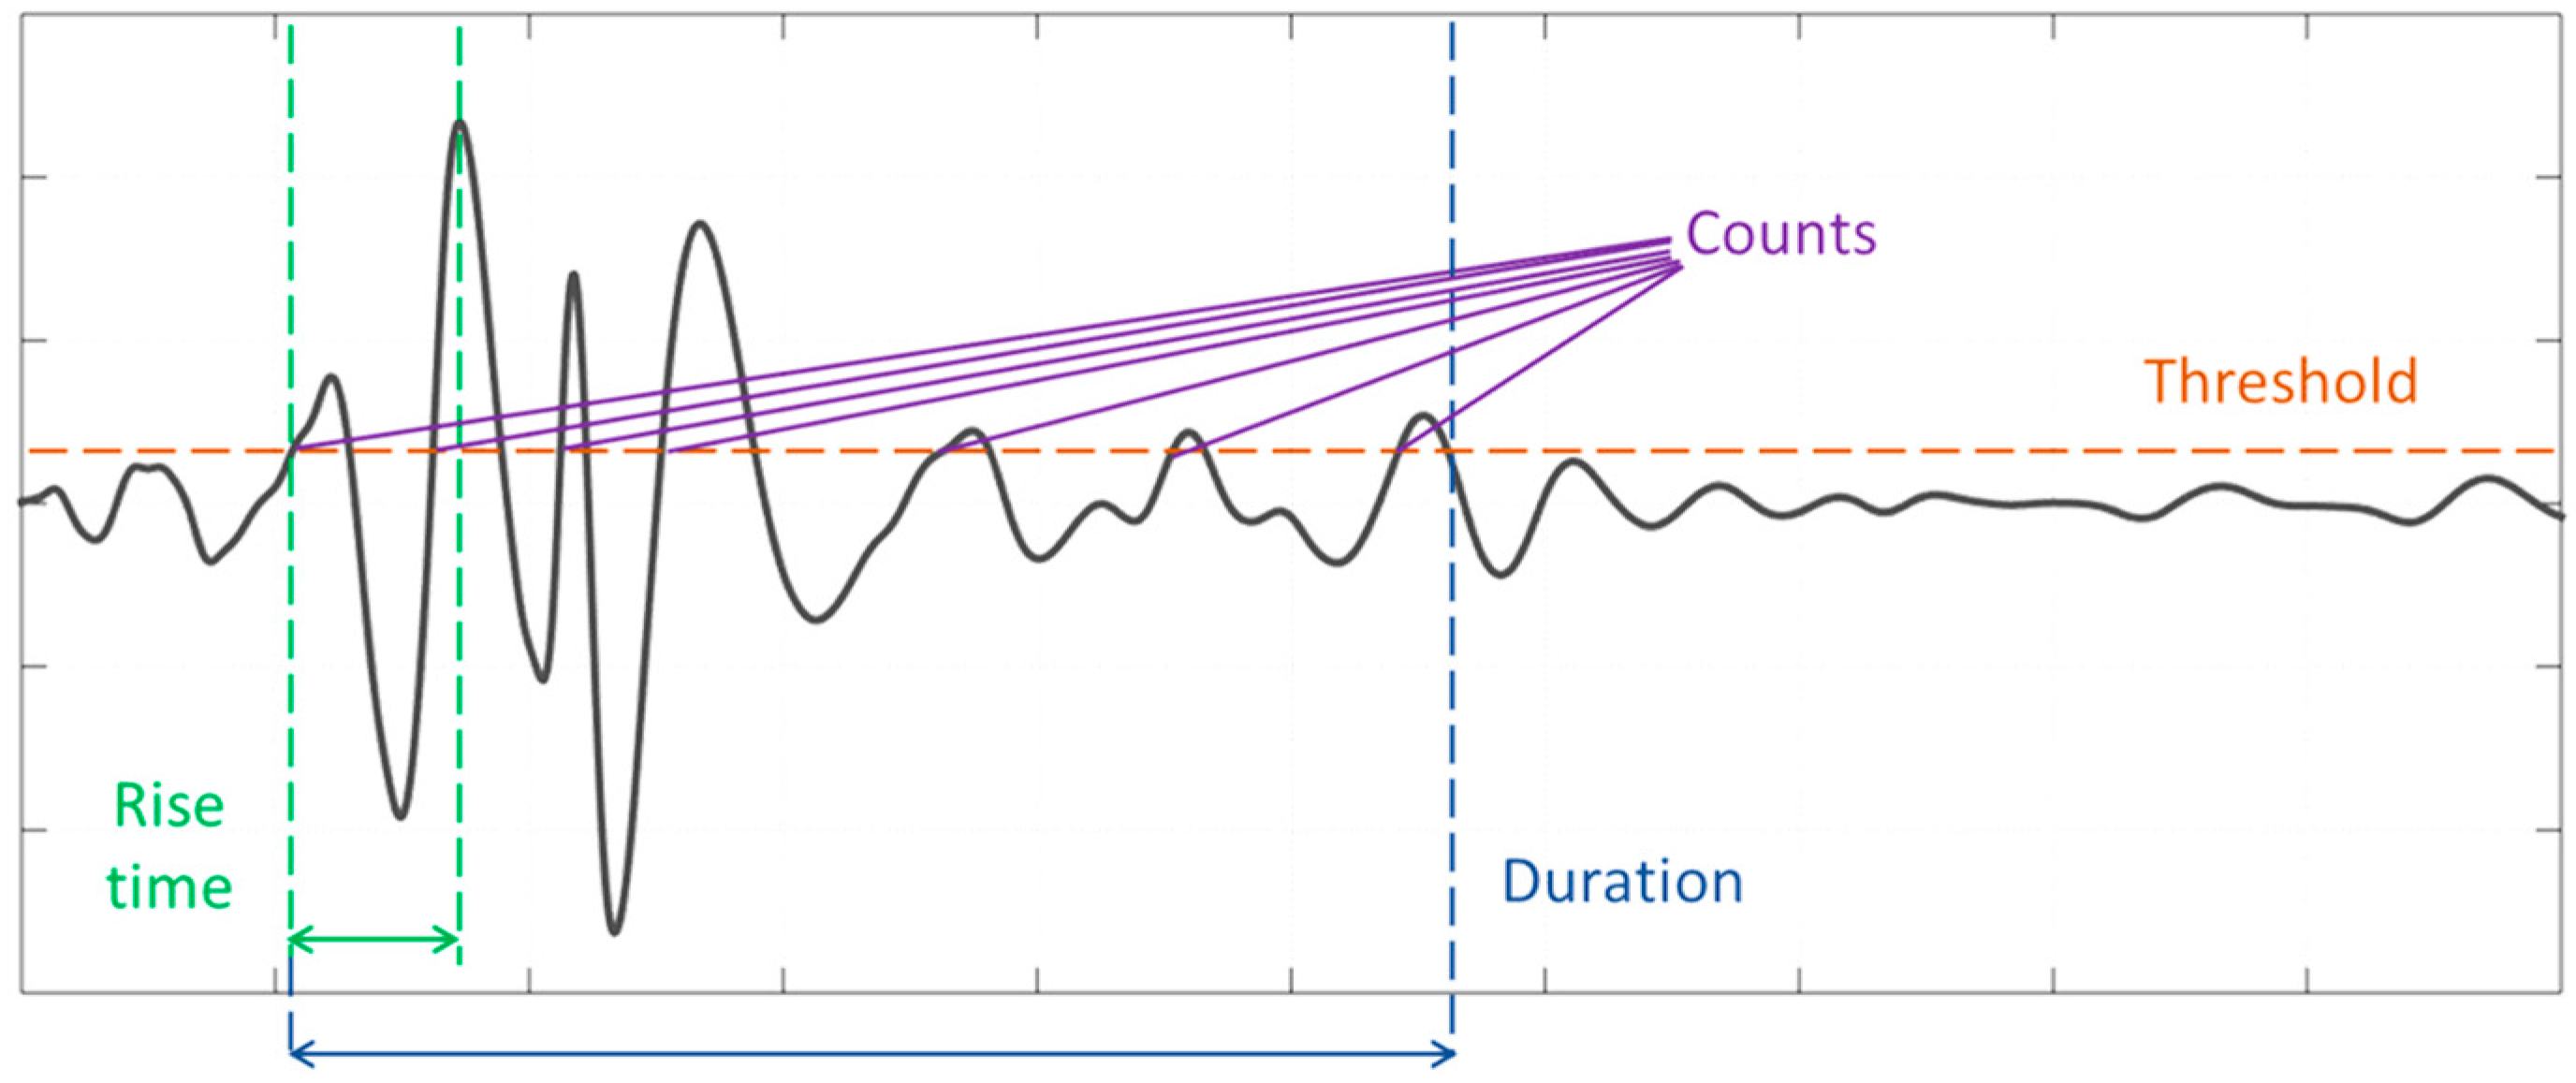
Acoustic emission (AE) is an SHM technique which uses piezoelectric sensors as receivers of elastic waves, generated by microstructural damage, as they propagate through the material. A network of three or more sensors can be used to determine the damage source location and estimate the severity and type of damage. The use of AE for early damage detection in composites is well established [30], with the last forty years of research concluding that there are four main damage mechanisms in composite materials identifiable by their AE “signature” [31,32]: (i) matrix cracking; (ii) interfacial debonding; (iii) fibre-matrix friction/fibre pull-out; and (iv) fibre breakage. Some of these are shown in Figure 1. Researchers have used many different methods to distinguish these damage mechanisms during mechanical testing, including, but not limited to, classification of acoustic signature [16,32], amplitude and frequency distribution analysis [16,32,33,34,35,36,37,38], and analysis of different features of the waveform [32,39]. Figure 2 shows a typical AE signal and the parameters that are commonly used for analysis of AE-generating damage events. Typical waveforms have also been associated with different damage modes based on the signal geometry: A-type signals (slow increase times around 10–20 µs) are associated with matrix cracking, B-type signals (sharp rising, lasting for around 10 µs and abruptly decreasing) are associated with fibre/matrix debonding, C-type signals (very sharp rising and short duration, <10 µs) are associated with fibre breakage, and D-type signals (long rising times, high amplitudes, and long duration) are associated with delamination [32].
Table 1 and Table 2 show a compilation of the amplitude and frequency distributions used to classify different damage mechanisms from the literature. These studies clearly demonstrate the difficulty of identifying damage modes in composite materials, though there is a clear trend that shows an increase in both amplitude and frequency as the type of damage becomes more severe. The ability to record signals with an amplitude as low as 30–40 dB is made possible by use of a low signal threshold, which applied in a real structural health monitoring application would not be appropriate. In the present work, we have utilised a higher threshold value to better represent the real application of the technique. The waveforms obtained can be dependent on many parameters, including, but not limited to: the choice of sensors, method of coupling/bonding between the sensors and host structure, structural materials used, number of sensors, size of the specimen, and the arrangement and spacing of sensors.
3.1. Felicity Effect
When a homogeneous, isotropic specimen is loaded incrementally, a phenomenon known as the ‘Kaiser Effect’ is observed; AE signals are only emitted in subsequent loadings when the previous maximum load is exceeded. In composite materials, a similar effect is observed; this is known as the Felicity effect [55]. In composites, the friction between the constituents during loading can cause significant acoustic emission signals, without exceeding the previous maximum load. A Felicity ratio can be calculated as:
During subsequent loadings of a component, a reduction in the Felicity ratio generally tends to be observed. Observation of the load at which AE events start to occur during a mechanical loading test can, therefore, reveal information about the load-time history of a component, providing the material properties are known.
4. Materials and Methods
A composite laminate (400 mm × 200 mm) was manufactured by vacuum assisted resin infusion moulding of six plies of carbon fibre fabric—5-harness satin weave, supplied by Cytec Solvay Group (formerly ACG, NJ, USA)—with an epoxy resin system (Araldite LY 564 and Aradur 2594, supplied by Huntsman, Basel, Switzerland). For more information about the manufacturing process, the reader is referred to [56]. A single-mode, low-bend-loss, polyimide coated silica glass optical fibre sensor, of 155 µm diameter and 2 m length, was embedded during the lay-up process to give three defined strain sensing regions near the ‘top’, ‘middle’, and ‘bottom’ surface of the laminate in the panel (Figure 3a). The distance between each parallel sensing region was 50 mm. Figure 3b is a schematic of the cross-section illustrating the path of the optical fibre through the thickness of the panel. Strain data was recorded from the optical fibre during resin infusion and curing. Three K-type thermocouples were embedded in the panel for measurement of temperature during the curing process. Each thermocouple was embedded at the same position through-the-thickness as the three optical fibre sensing regions. For AE monitoring, piezoelectric wafer active sensors (PWAS)—PIC255 with 10 mm diameter and 0.5 mm thickness [57]—were bonded to the surface of the panel using a cyanoacrylate adhesive.
After manufacture, quasi-static four point bending was conducted on the plate (trimmed to 385 mm × 145 mm) using an adaptation of the ASTM standard D7264: ‘Flexural properties of polymer matrix composite materials’ on an Instron 5969 testing machine fitted with a 10 kN load cell (Figure 3). Though more complex than uniaxial loading, four point bending offers the ability to observe tensile and compressive strains contained within a single specimen. Aluminium ‘spreader bars’ are placed between the specimen and loading noses to ensure even distribution of the load across the width of the panel. In the initial stages of this work, five progressive quasi-static loading steps were completed. Loading steps 6–13 were completed at a later date for validation of each measurement method. The maximum strain observed in each of the cycles is stated in Table 3.
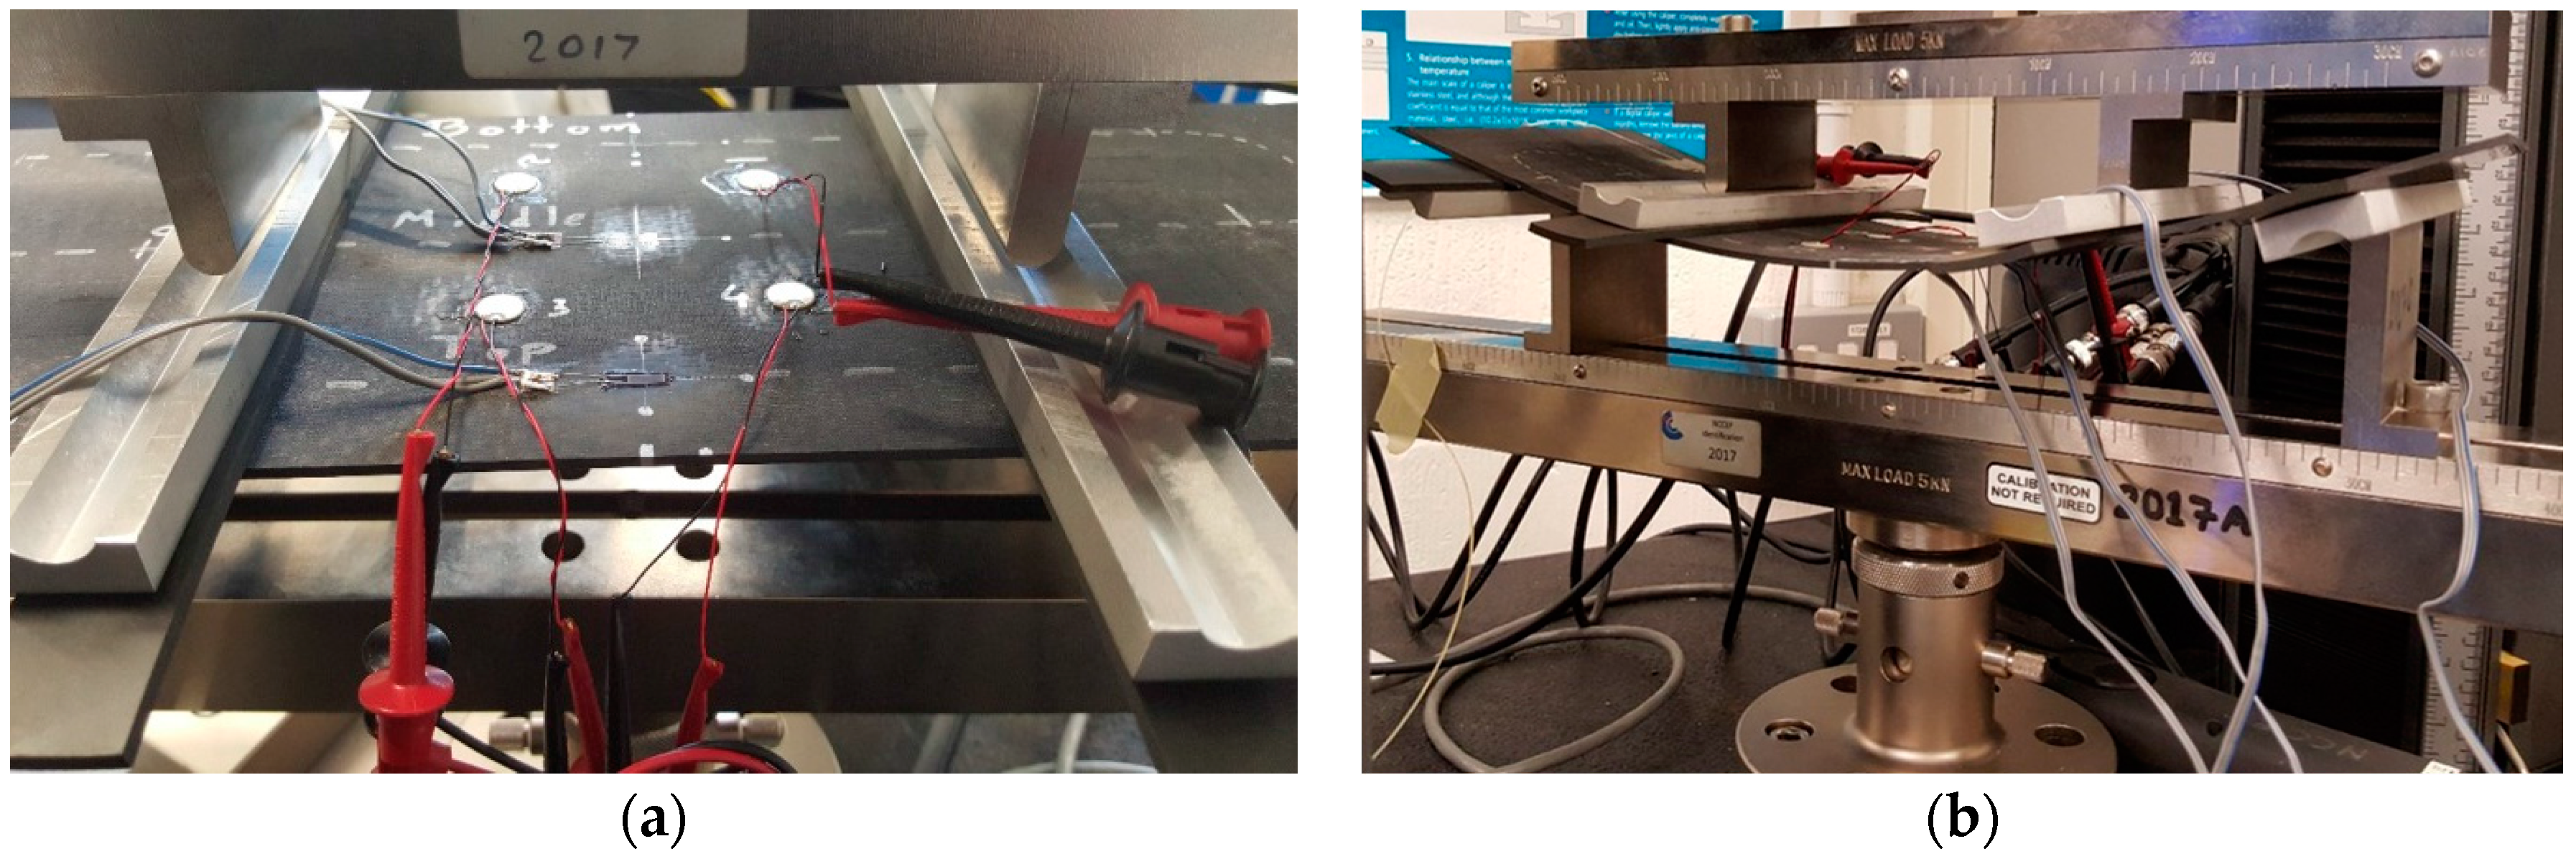
During each loading, the surface strain on the top and bottom surfaces of the panel was measured by uniaxial strain gauges. Four piezoelectric wafer active sensors (PWAS) acted as receivers of AE during loading were bonded on the top of the plate (Figure 4a). Figure 4b shows the mechanical four point bending set-up. Distributed strain data was collected from the optical fibre sensor via an optical frequency domain reflectometry (OFDR) based interrogator (ODiSI-B model) from Luna Inc. (Roanoke, VA, USA) while AE data was recorded by the software ‘AEWin for PCI2’ (version E5.60) from Mistras Group (NJ, USA) with a sampling rate of 10 MHz and 20 dB of pre-amplification per sensor. A threshold amplitude value (58–65 dB) was assigned to each PWAS based on its sensitivity to extraneous noise during preliminary pencil-lead-break tests.
5. Results and Discussion
5.1. Manufacturing Process Monitoring
Resin infusion was carried out at room temperature, using a vacuum to draw the resin through the fibres. During this process, the strain in the optical fibre can be attributed only to mechanical strain. During the curing process, thermocouples were used to follow the change in temperature, while the DOFS measures the total strain, which comprises two components: mechanical strain and thermal strain. The temperature influences greatly the total strain in the panel, thus concealing the mechanical strain that results from the curing process; so, using data obtained from a short length of optical fibre, sensitive only to changes in temperature, it was possible to offset the total strain to give the value of mechanical strain. When plotted against temperature, taken as an average from the three thermocouples, the effect of each stage of the curing cycle on the mechanical strain experienced by different regions of the laminate becomes clear (Figure 5). During the first ramp in temperature to 80 °C (1 °C/min) the resin begins to contract as its viscosity decreases, causing a sharp increase in compressive mechanical strain. This increase continues until the first stationary point in mechanical strain (A). The continuing increase in temperature forces thermal expansion of the composite—and reduction in strain—until no additional energy is made available to aid this process, thus, the dwell point (B) is reached. A second ramp in temperature to 160 °C causes a second increase in compressive strain; the additional thermal energy aids further crosslinking between the resin components until the last turning point (C), when the resin goes through a glass transition. A decrease in chemical contraction sees a decrease in compressive strain until point D, after which the rate of chemical contraction reaches a plateau. During cooling, contraction of the panel causes, once again, an increase in mechanical strain.
Figure 6 shows the residual strain profile of the optical fibre in the finished composite panel. When compared with the strain developed in the panel during the resin infusion process, there is a clear correlation. This observation can be particularly helpful when manufacturing complex composite parts, since it becomes possible to predict the residual strain profile of the finished part before completing the full manufacturing process. Residual strains could impact the damage tolerance of the final part and are, therefore, of interest in many applications. The detection of manufacturing defects such as resin rich areas or dry fibres has also been possible using distributed optical fibres in previous work by the authors [13].
5.2. Four Point Bending Monitoring
5.2.1. Distributed Strain Monitoring
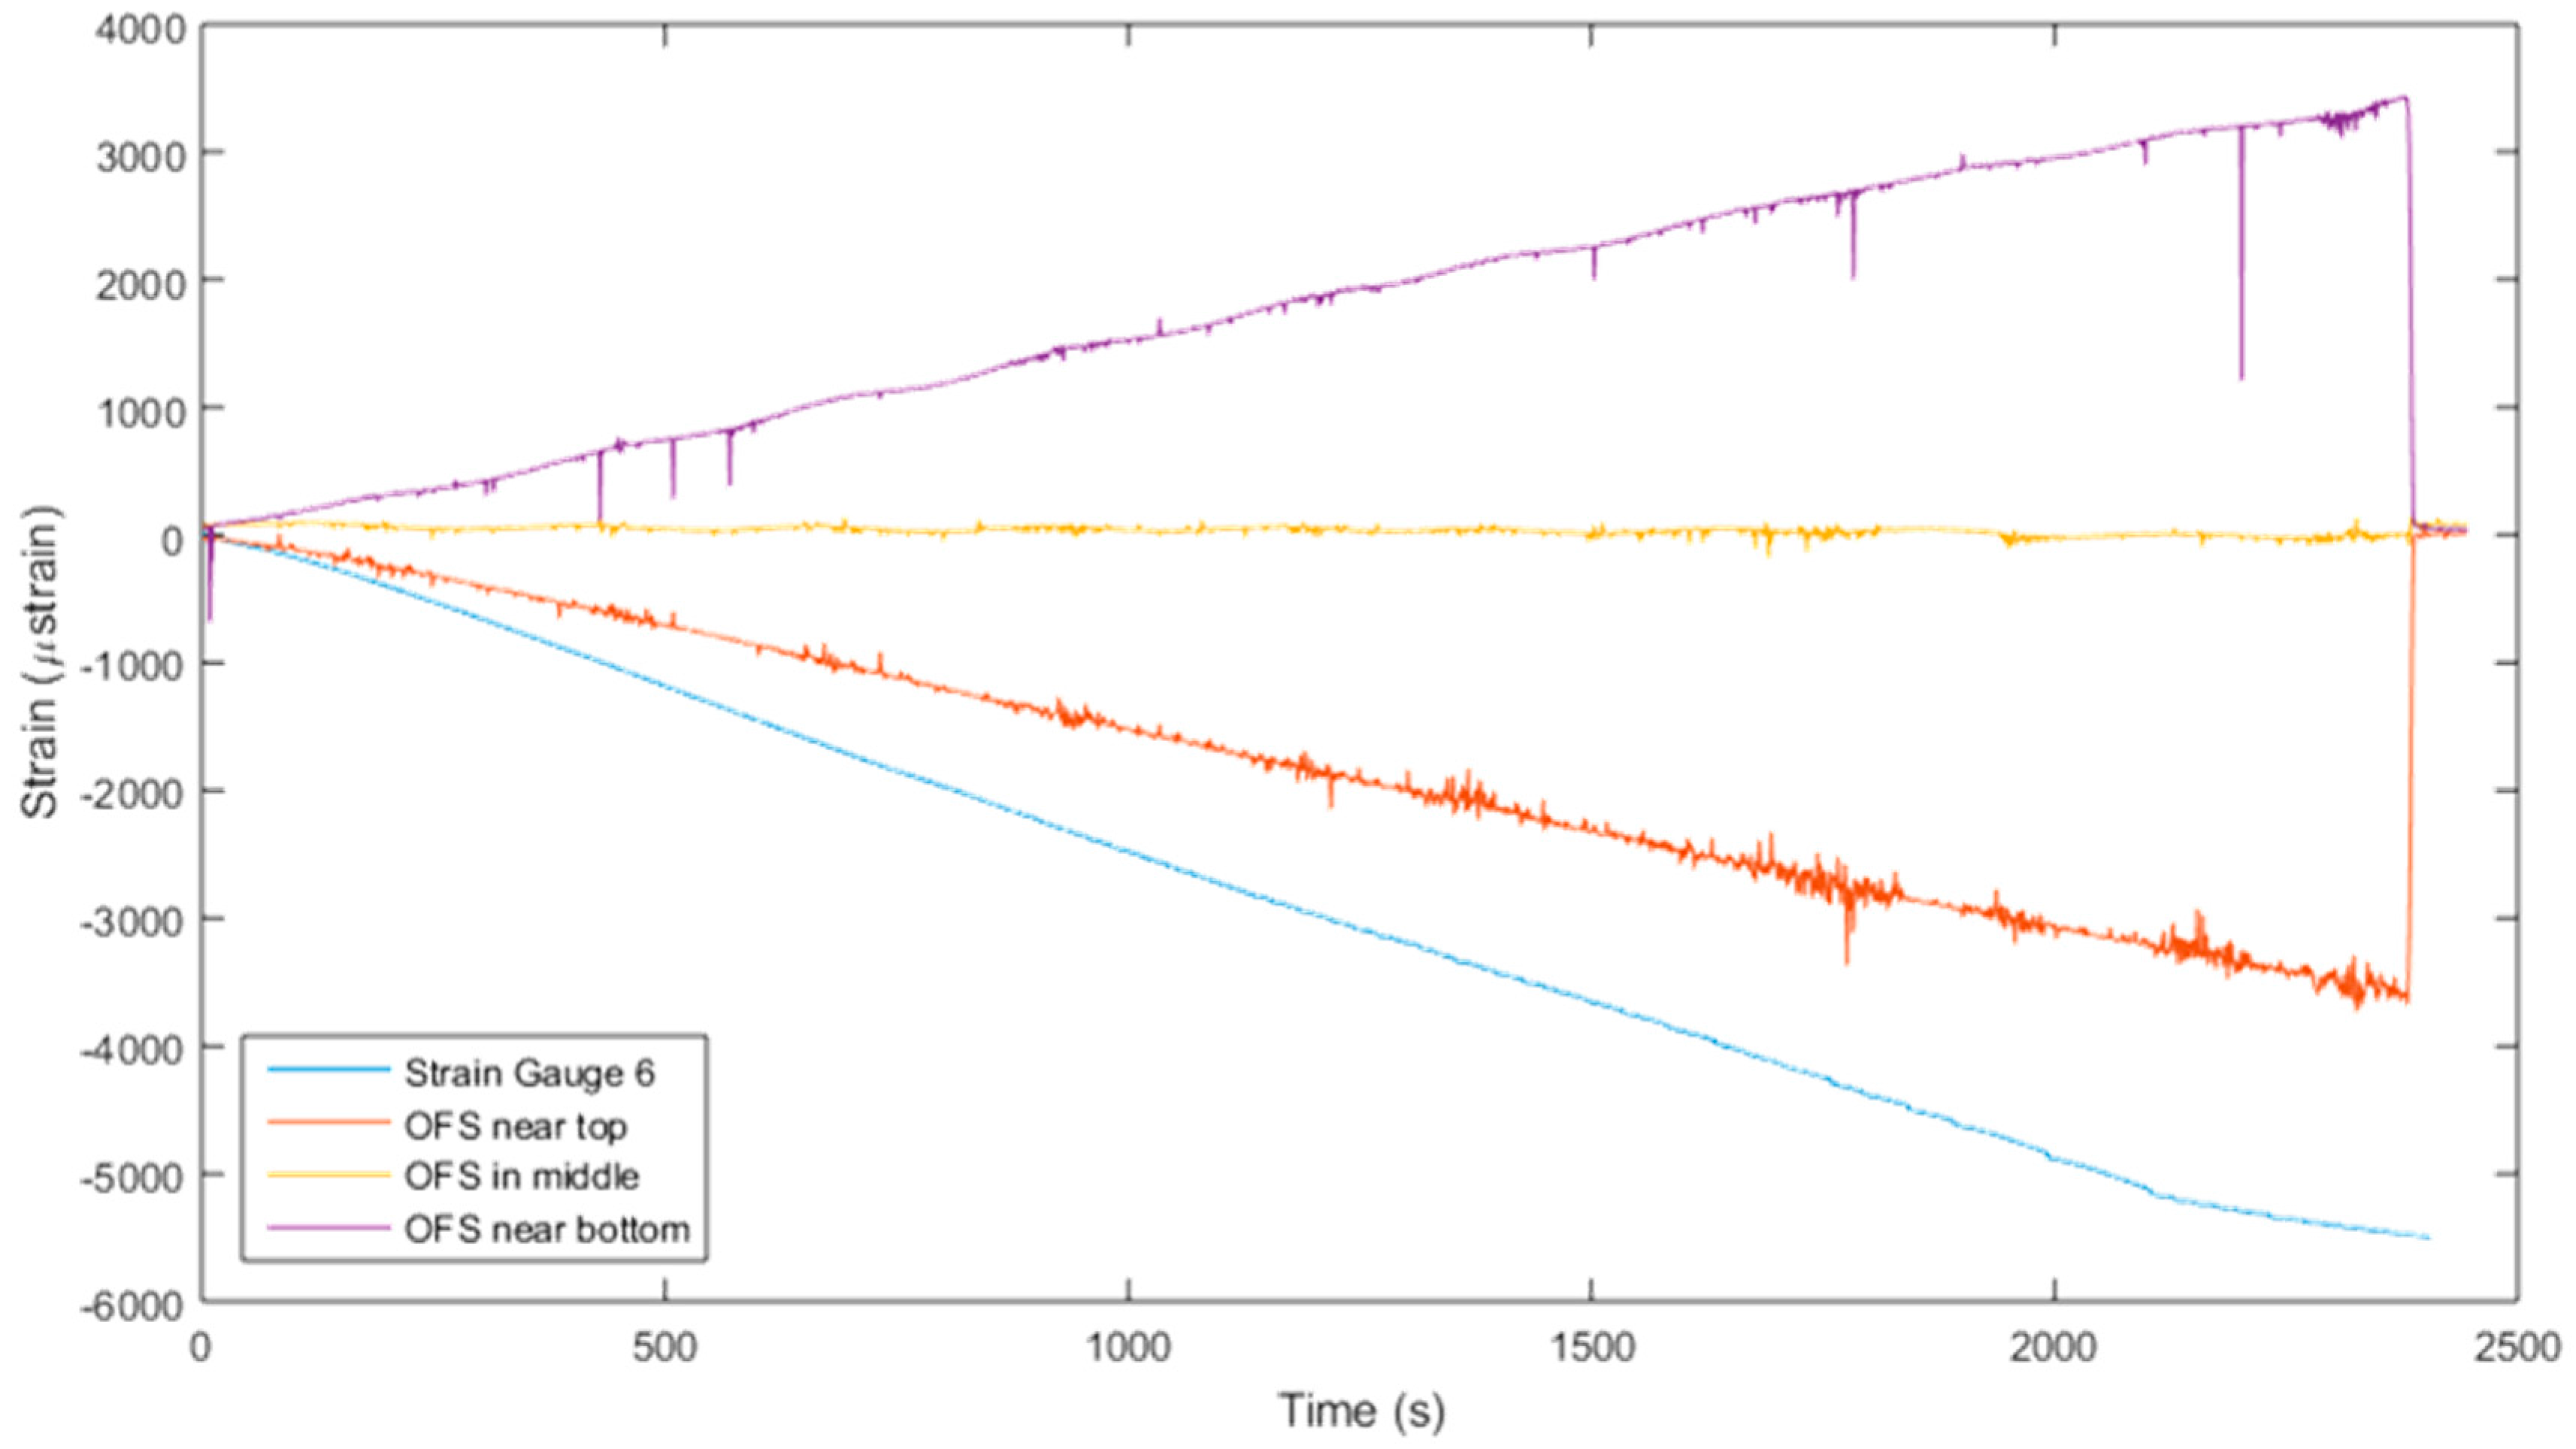
Figure 7 shows the development of strain in the panel during the final loading step as recorded by both the optical fibre and the surface mounted strain gauges. The ‘middle’ sensing region, embedded along the neutral axis of the cross-section of the laminate, successfully records a neutral strain reading during loading. A good correlation is observed between the strain gauges and optical fibre strain, with lower values of strain recorded by the optical fibre attributed to the respective positioning of each sensing region through-the-thickness of the laminate. The thickness of the composite panel is approximately 3 mm, so the three sensing regions in the optical fibre can be approximated to be positioned at 0.5 mm, 1.5 mm, and 2.5 mm through-the-thickness. Since the normal stress of the longitudinally oriented optical fibre is proportional to its distance from the neutral surface, the sensitivity of the placement of the optical fibre through-the-thickness is perfectly demonstrated here.
Figure 8 shows the strain developed in the optical fibre during each loading of the plate, up to a maximum measured strain of 0.4% on the central strain gauge. Once again, the sensitivity of the optical fibre sensor (OFS) through-the-thickness of the plate is clearly demonstrated by the compressive, neutral, and tensile strains recorded by the ‘top’, ‘middle’, and ‘bottom’ sensing regions, respectively.
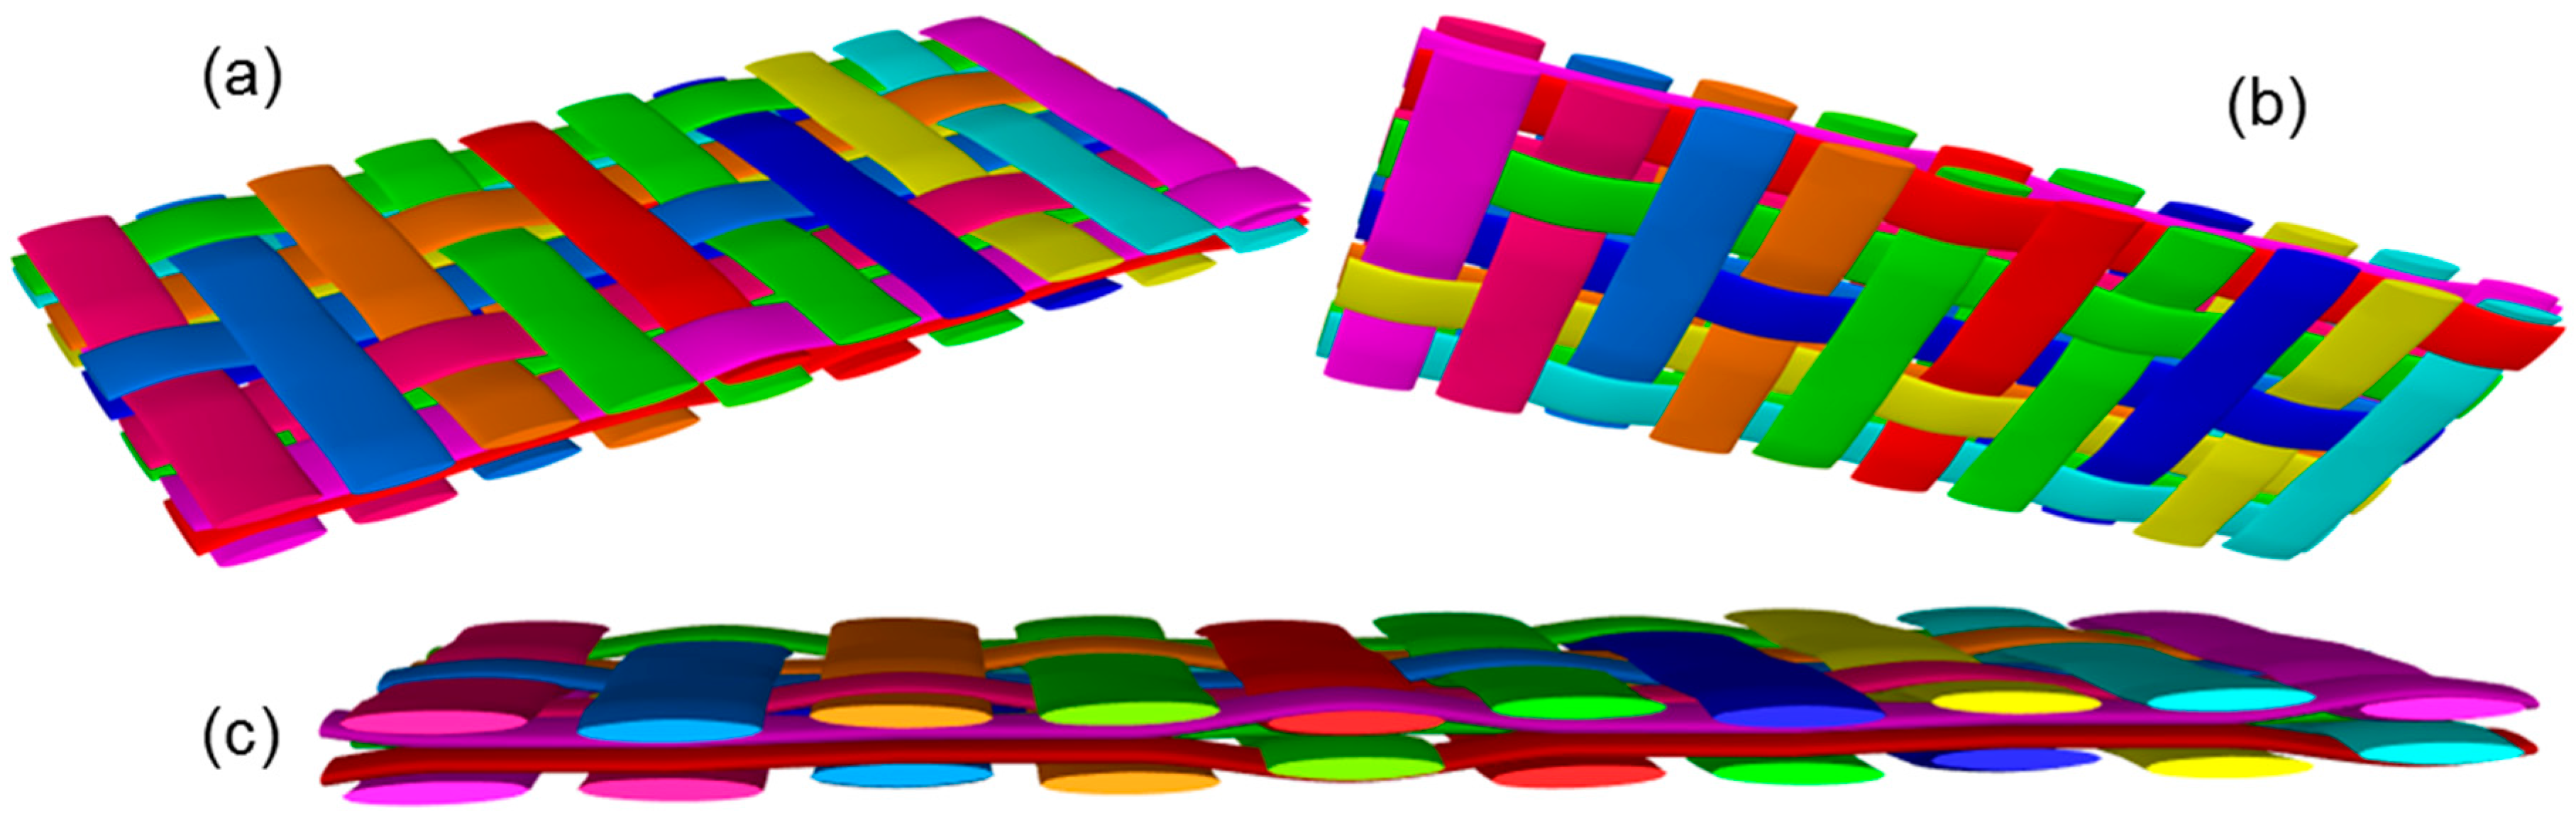
A small peak is visible in each measurement region, increasing in amplitude from 400 s to 1600 s. On first glance it may appear that this is a concentration of stress caused by the presence of local damage in the structure which occurred during loading. A more plausible possibility is that this peak is caused by yarn crimp within the fabric plies above and below the embedded optical fibre sensor. With this in mind, the possible nesting characteristics of the fabric plies above and below the optical fibre were investigated. Figure 9 shows clearly the oscillating nature of the distributed strain signal at different stages of the experiment. The wavelength of the peaks seen in the signal was calculated as an average from multiple peaks in the bottom and top sensing regions; this data is displayed in Table 4. Each data point is 0.625 mm away from the next, allowing the wavelength to be calculated in millimetres. The values from different sensing regions are consistent, confirming that the effect of geometry at different thickness levels is similar. A model of two fabric layers was produced in the open source software, TexGen (v3.9.0, Nottingham, UK) [58].
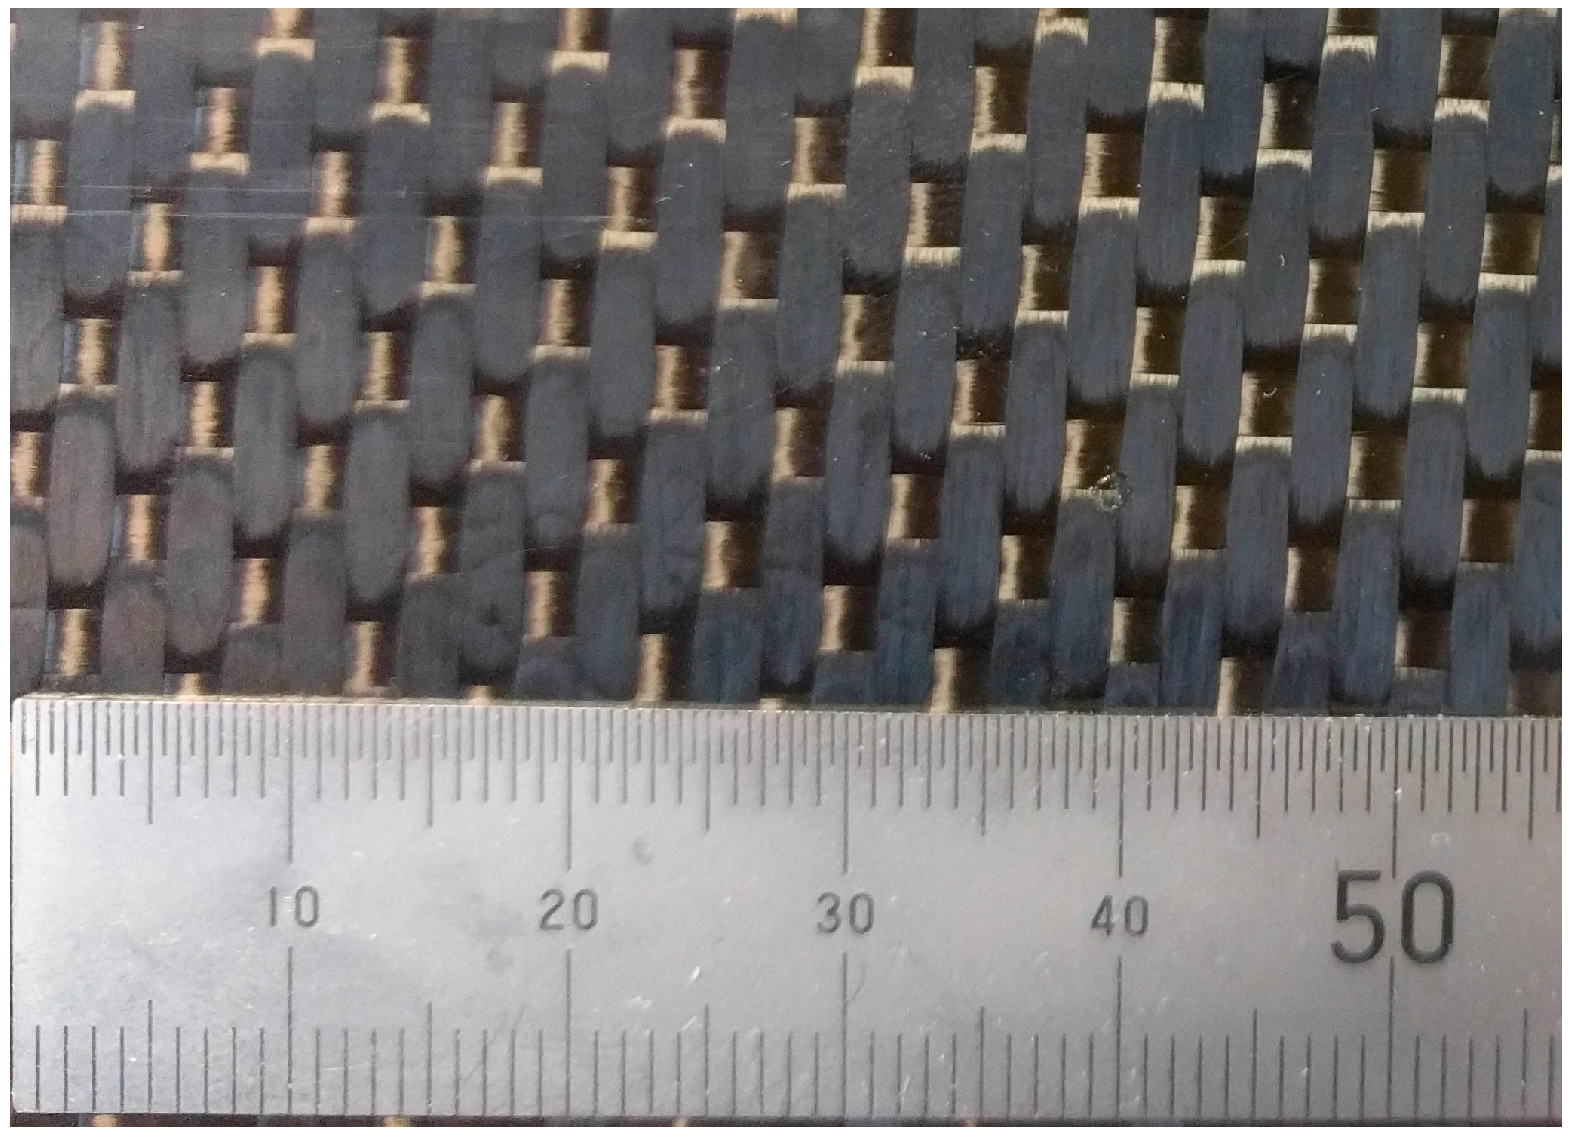
Figure 10 shows the potential nesting of two layers. Figure 11 is a photograph of the laminate used in this work, showing clearly that the weave repeats in the orientation of the optical fibre approximately every 10.1 mm. This value correlates well with the measurements from optical fibre data (i.e., ~10.45 mm), thus supporting the hypothesis that the geometry of the plot is a consequence of the fabric nesting which results in local strain variation.
5.2.2. Acoustic Emission Monitoring
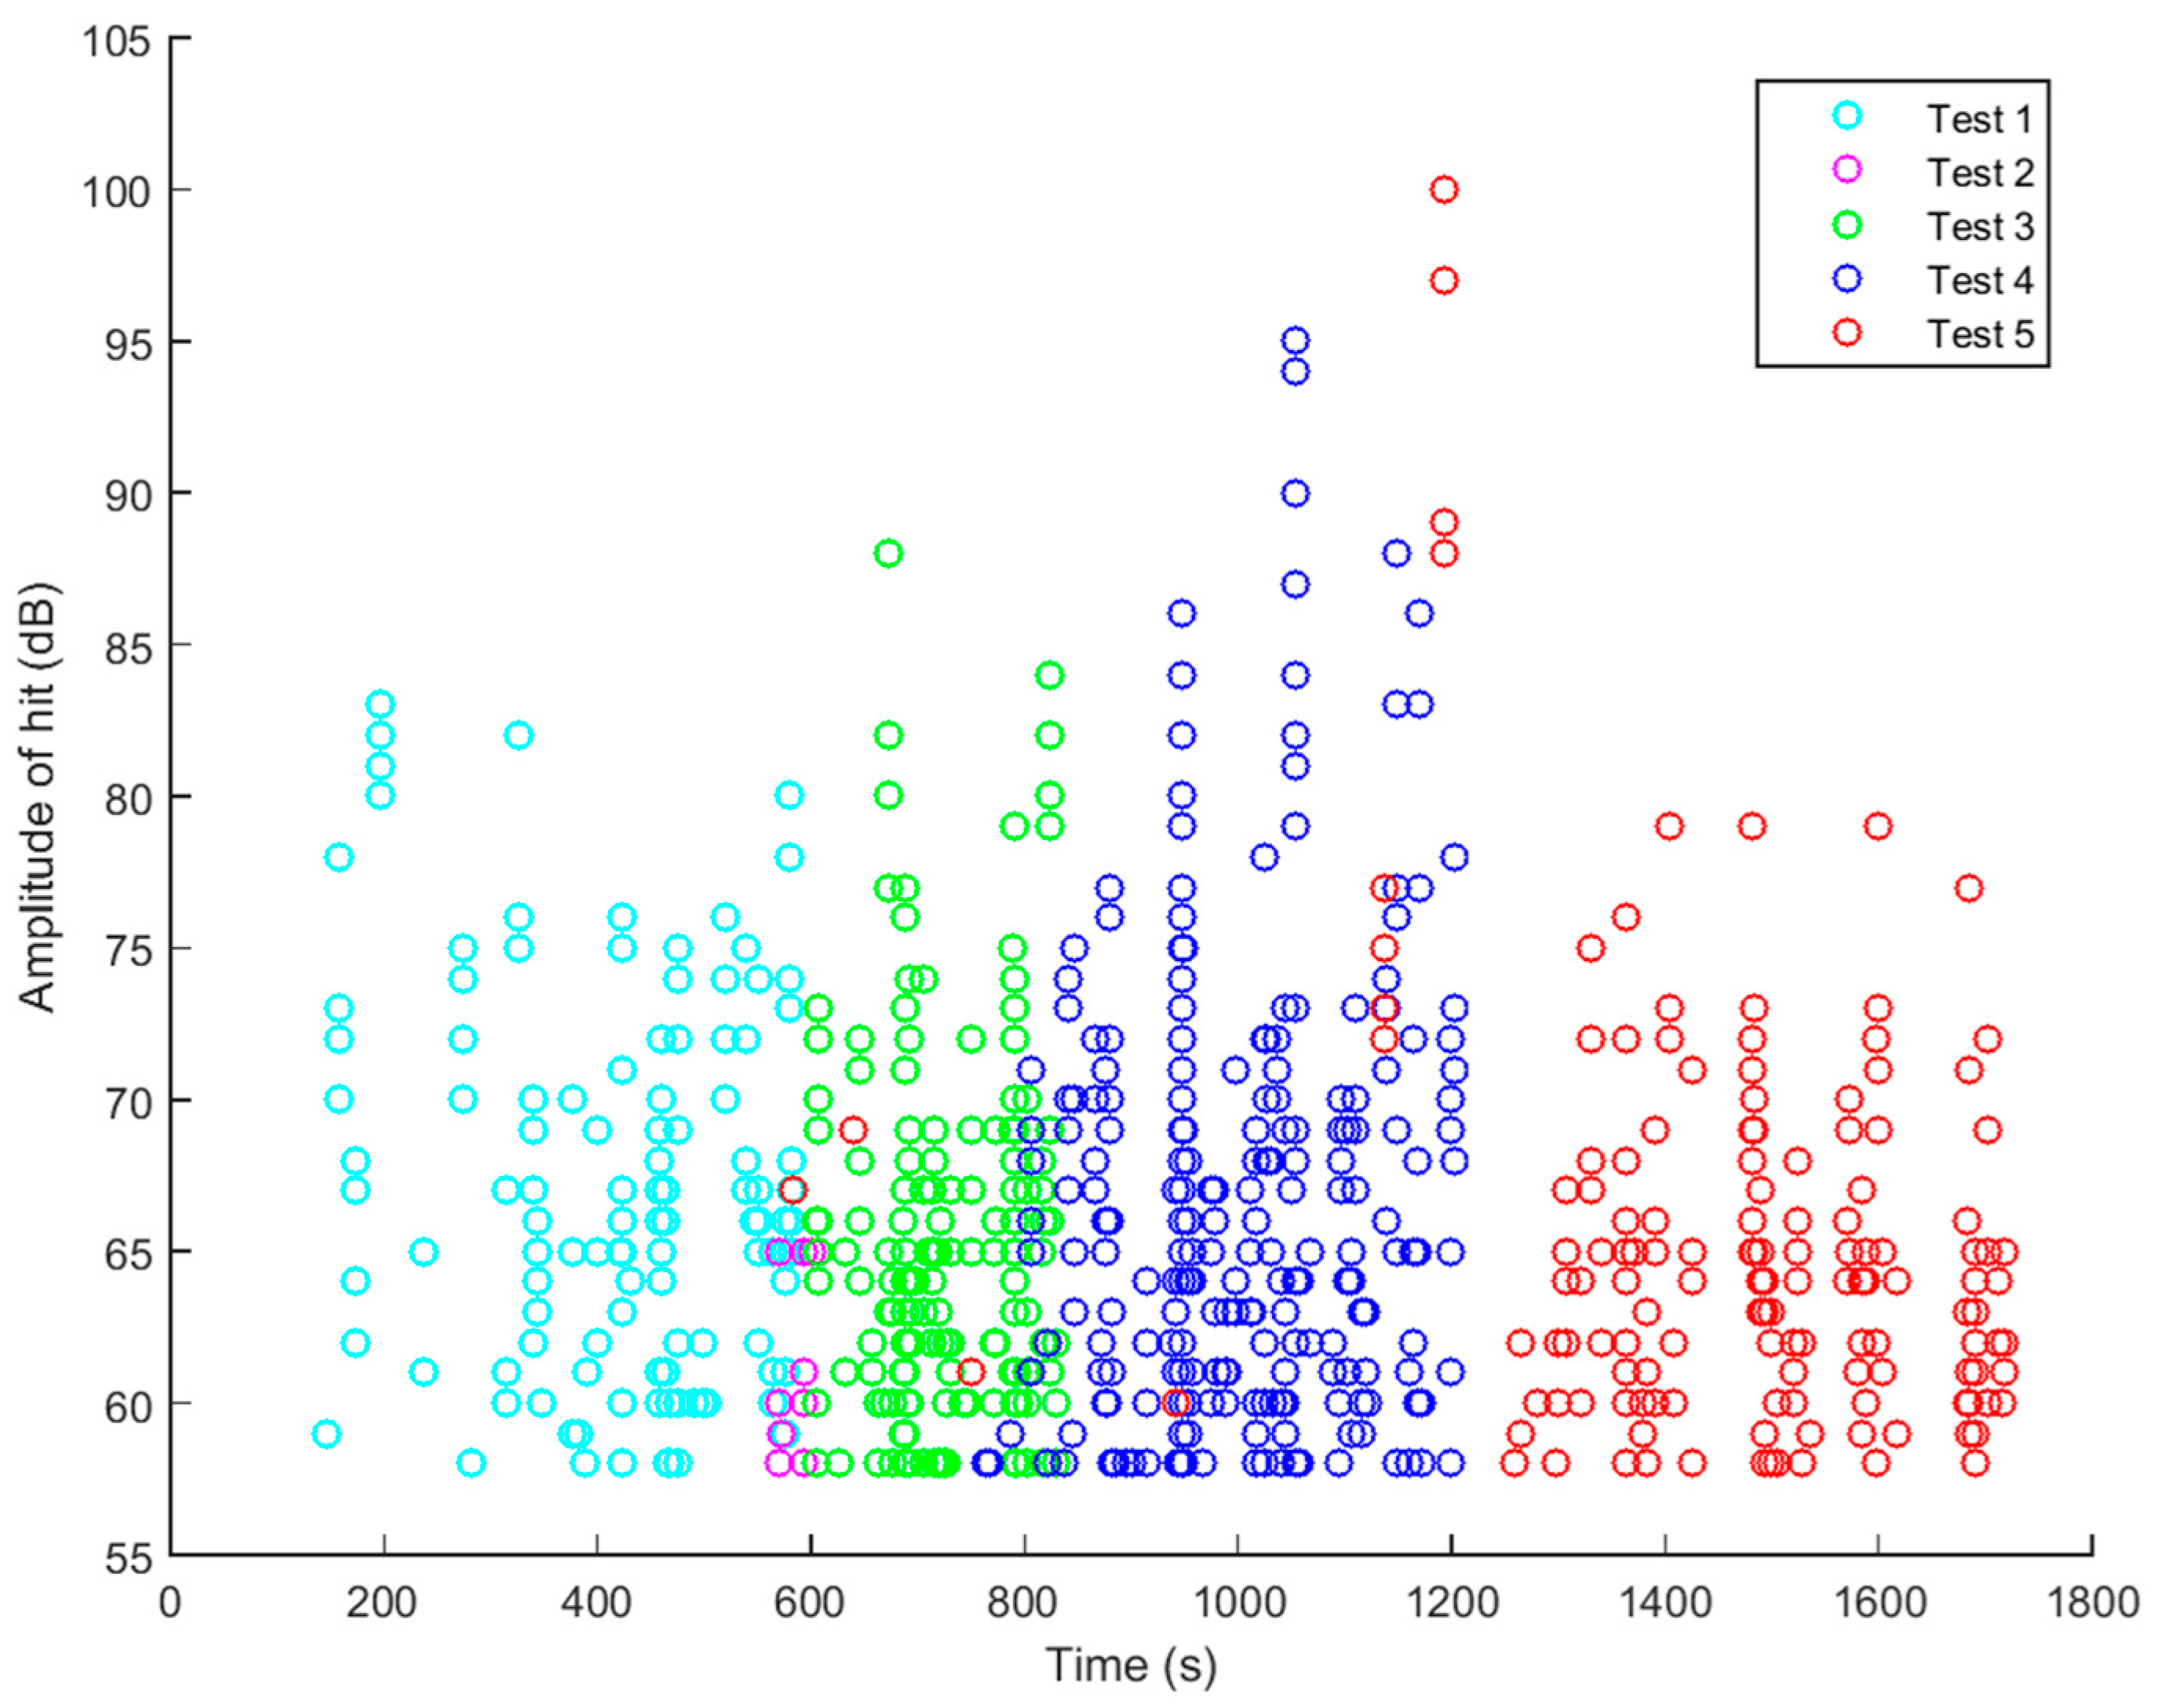
Figure 12 is a plot of the maximum amplitude of each AE ‘hit’ above the threshold gain recorded from all of the PWAS sensors during loadings 1–5. The threshold for each PWAS was set between 58–65 dB and digital filtering (100 kHz–1 MHz) was used to eliminate extraneous noise in the acoustic range. When plotted on a single graph, it becomes clear that the majority of AE hits during each loading are recorded mainly after exceeding the previous maximum load. Based on this, the Felicity ratio of each loading was calculated using the equation presented in Section 3.1; the results are shown in Table 5. It is seen here that on increasing the loading of the specimen, the felicity ratio decreases; this is to say that the number of AE events recorded prior to reaching the previous maximum load/extension increases as the load is increased in each cycle. The data presented here fits with the theory of the Felicity effect.
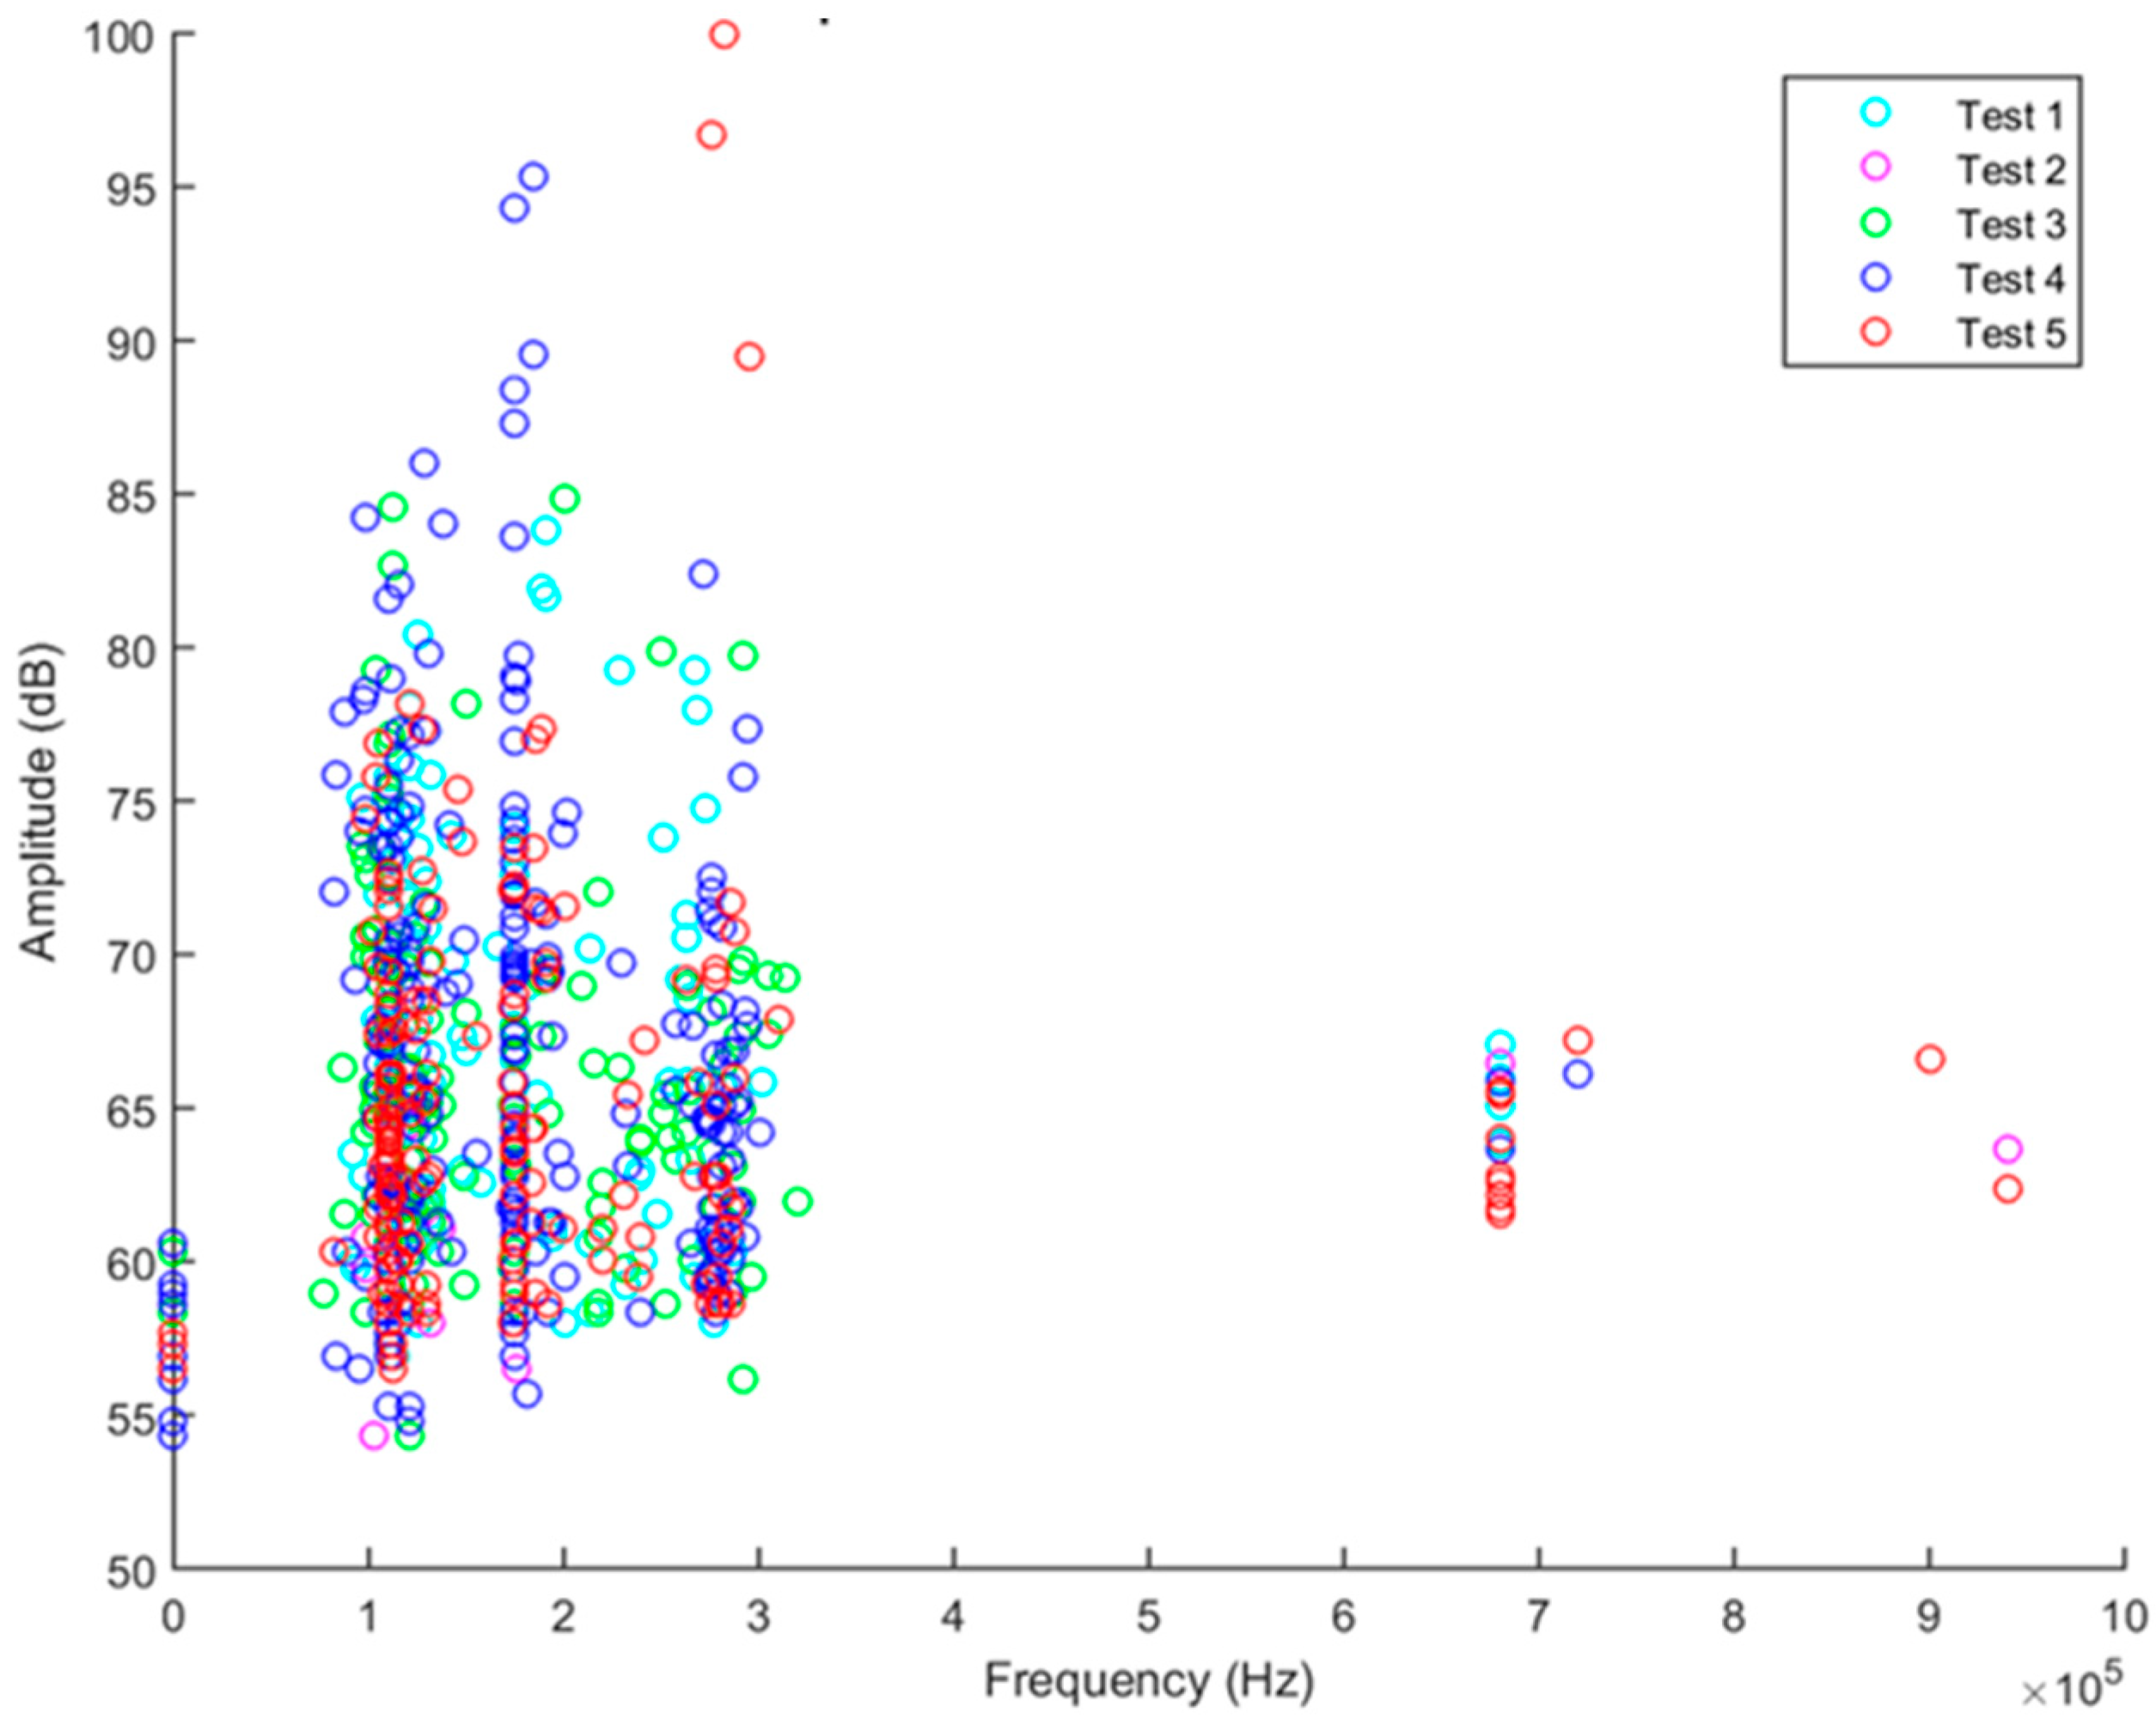
If analysis of the recorded acoustic emission signals was constrained to the distribution of amplitude, as many researchers have done in the past, the AE signals recorded would suggest the formation of matrix cracks. The general trend for AE hit amplitudes is to increase as the strain is increased, demonstrating the development of damage in the structure. Particularly high amplitude hits in the range 90–100 dB, which researchers [33,35,44,46] have previously attributed to fibre fracture, are observed during the fourth and fifth loading steps of the plate. The data could, in fact, be interpreted to show micro fibre breakage observed due to stress concentration at the tip of a crack or delamination, as mentioned by Gresil et al. [16], since the signals are received at relatively low levels of strain where fibre fracture would not be expected to occur. However, analysis of the maximum amplitude-peak frequency distribution during the same loading cycles (Figure 13) reveals that there are very few high frequency events (700 kHz–1 MHz) which researchers have previously attributed to high energy damage mechanisms. The majority of the AE activity is focused around 100–300 kHz during all of the cycles. In addition, the high amplitude hits previously encountered fall into this low frequency range. It is possible to conclude from this, with confidence, that the high amplitude is not related to the size of the damage event, but perhaps is a consequence of sensor position.
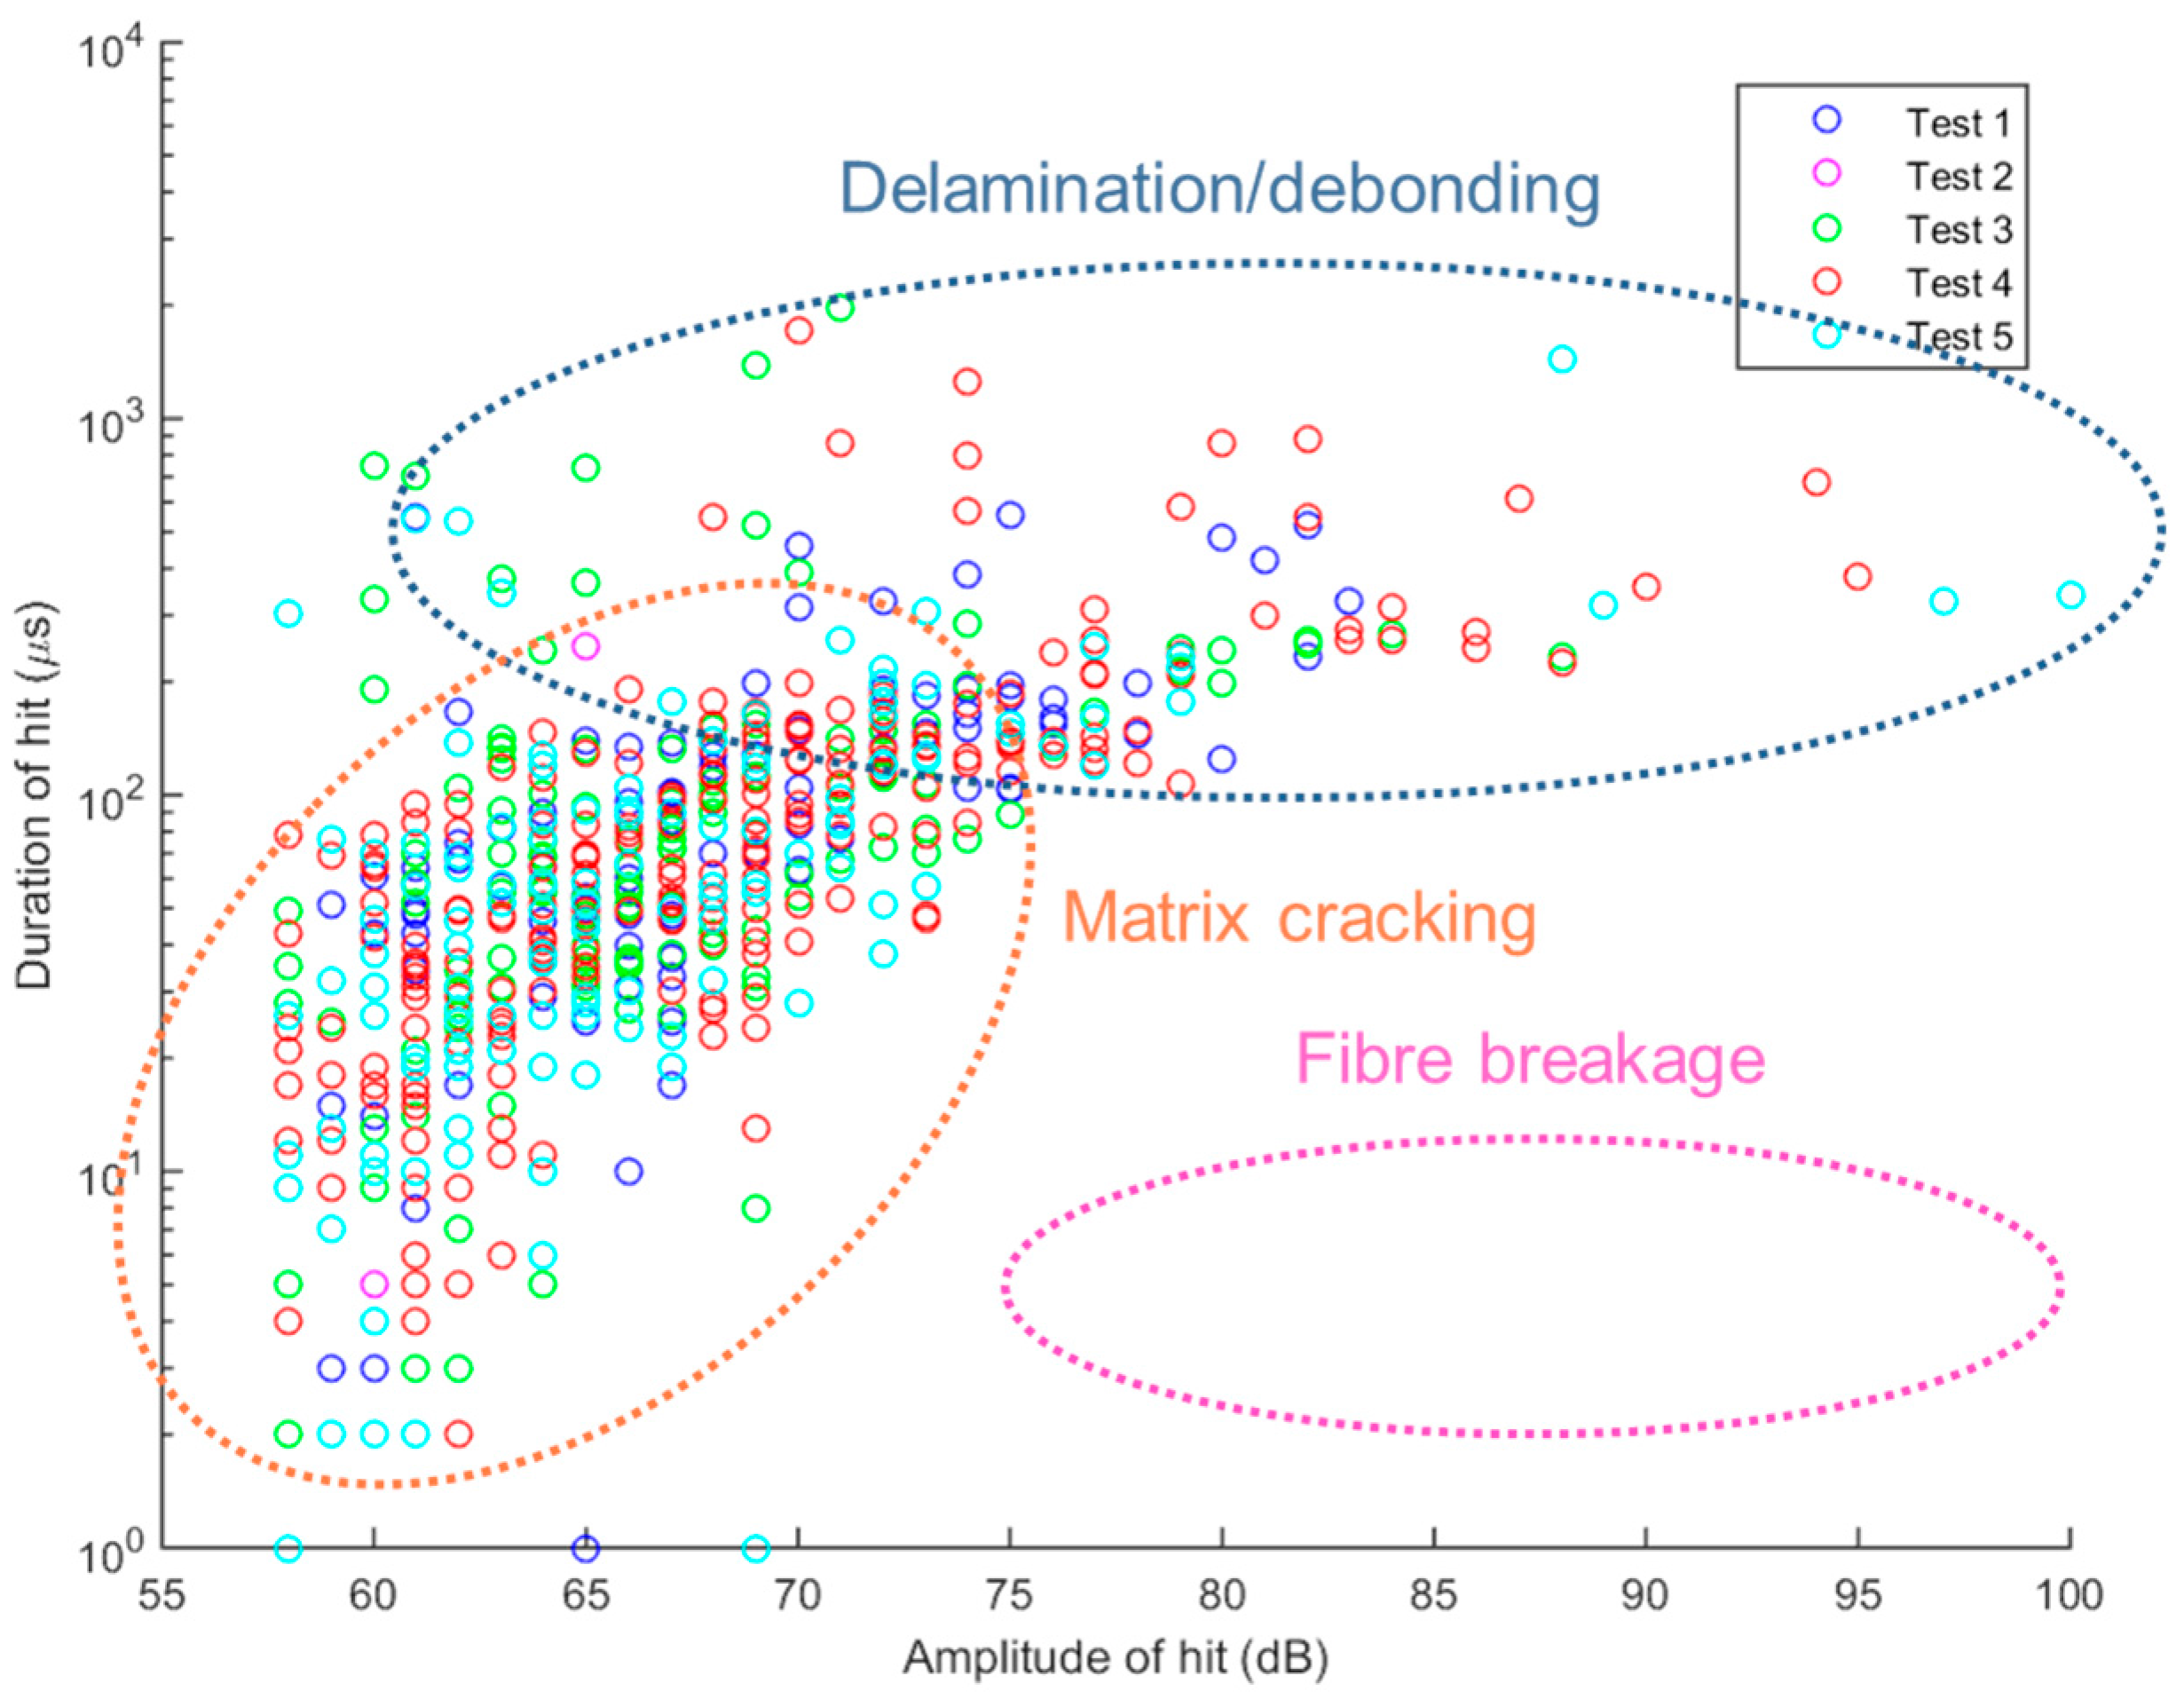
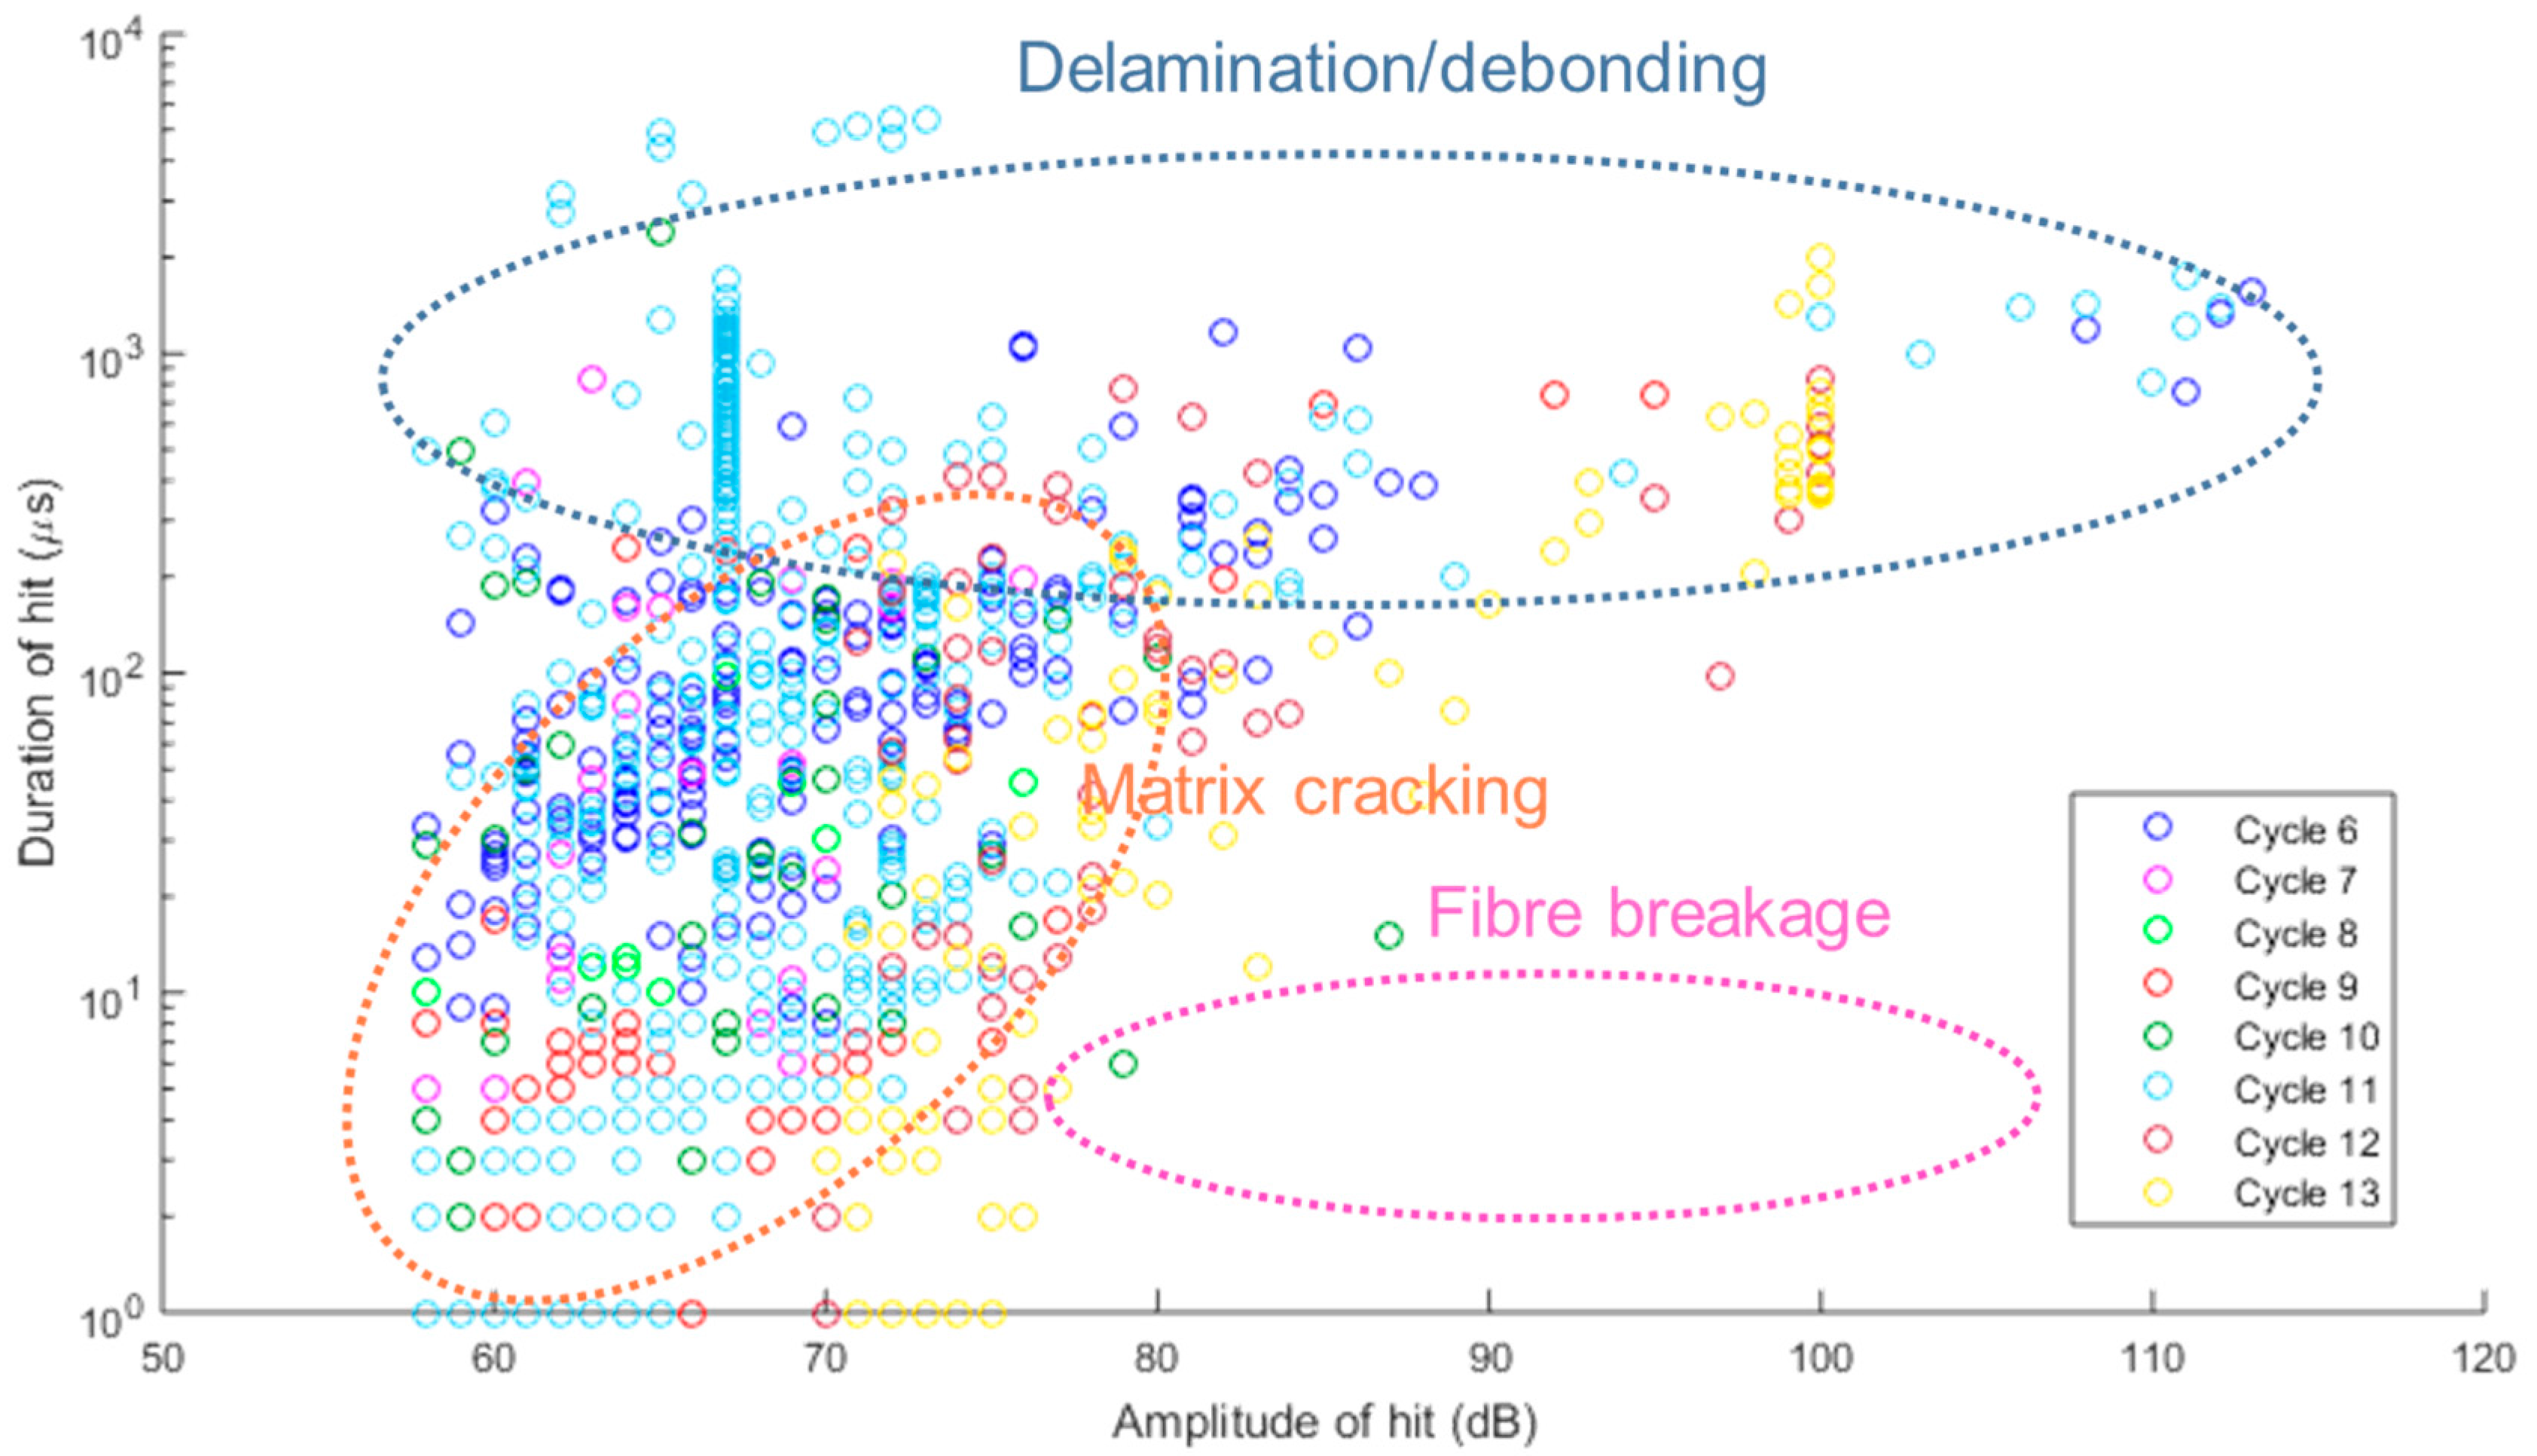
Figure 14 and Figure 15 show the relationship between signal duration and maximum amplitude of acoustic emission signals received during cycles 1–5 and 6–13, respectively. The trend is in agreement with work presented by Kotsikos et al. [39]. Taking into account the different signal types described by researchers [16,32] in the past, we have been able to speculate with a higher degree of certainty, on the damage types exhibited here: A-type signals—associated with matrix cracking—tend towards the lower amplitudes while signal durations can vary; C-type signals are short signals (~10 μs duration) with high amplitudes, associated with fibre breakage; D-type signals with high amplitudes and long duration are associated with delamination [32]. These figures further support the suggestion that the cycles of loading and unloading on this specimen have not caused severe damage to the material. Further work is required on analysis of signals based on sensor type, sensor location, bonding layer properties, etc. to be able to decipher the results with more confidence.
6. Concluding Remarks
This work has shown the ability to combine two different types of sensors for structural health monitoring of composite structures. Distributed strain monitoring during fabrication can provide valuable information about the resin rheology in addition to mechanical properties of a part prior to the completion of its manufacture. Once it goes into service, the embedded optical fibre can continuously monitor applied strains that could determine its performance. The undulating geometry of strain data recorded by the optical fibre sensor is a result of crimp in the yarns which make up the layers of fabric above and below the optical fibre sensing regions. These small peaks are accentuated as the strain is increased—an observation which should be taken into account when this technique is used in service.
The use of AE monitoring has shown promise in the early distinction and quantification of damage mechanisms in composite materials. The Felicity effect can be used to determine the time-load history of a component. When combined with historical strain data, this information can be particularly beneficial in informing the design of structures based on the distribution and concentration of strains. The importance of taking into account multiple features in each AE signal to be able to distinguish between different damage mechanisms has been highlighted in this work. In addition, the material/sensor system should not be neglected in the interpretation of the results. To use acoustic emission monitoring in-service, it is important to consider the effect of extraneous noise on the system and to define carefully an appropriate threshold. It is possible to use the PWAS to calculate an AE source location based on the time of arrival of signals to different sensors. Repetition of damage in the same or different locations can, therefore, be distinguished and correlated against any residual strains observed along the length of the embedded optical fibre. In near future work, AE data will be validated by sectioning and optical microscopy as well as by conventional non-destructive testing (NDT) techniques.
Acknowledgments
The authors would like to acknowledge the funding and technical support from BP through the BP International Centre for Advanced Materials (BP-ICAM) which made this research possible. We also acknowledge financial support from EPSRC (EP/L01680X) through the Materials for Demanding Environments Centre for Doctoral Training and the Northwest Composites Centre of the University of Manchester for the use of facilities.
Author Contributions
Neha Chandarana, Daniel Martinez Sanchez, and Matthieu Gresil conceived and designed the experiments; Neha Chandarana and Daniel Martinez Sanchez performed the experiments and analysed the data; Neha Chandarana, Matthieu Gresil, and Constantinos Soutis contributed materials/analysis tools; Neha Chandarana wrote the paper.
Conflicts of Interest
The authors declare no conflict of interest. The funding sponsors played a role in the decision to publish these results.
References
- Gresil, M.; Revol, V.; Kitsianos, K.; Kanderakis, G.; Koulalis, I.; Sauer, M.-O. EVITA Project: Comparison between traditional non-destructive techniques and phase contrast X-ray imaging applied to aerospace carbon fibre reinforced polymer. Appl. Compos. Mater. 2017, 24, 513–524. [Google Scholar] [CrossRef]
- Rose, J.L. Ultrasonic guided waves in structural health monitoring. Key Eng. Mater. 2004, 270–273, 14–21. [Google Scholar] [CrossRef]
- Cheng, L.; Tian, G.Y. Surface crack detection for carbon fiber reinforced plastic (CFRP) materials using pulsed eddy current thermography. IEEE Sens. J. 2011, 11, 3261–3268. [Google Scholar] [CrossRef]
- Cawley, P. The rapid non-destructive inspection of large composite structures. Composites 1994, 25, 351–357. [Google Scholar] [CrossRef]
- Hung, Y.Y. Shearography for the nondestructive evaluation of composite structures. Opt. Lasers Eng. 1996, 24, 161–182. [Google Scholar] [CrossRef]
- Hung, Y.Y.; Chen, Y.S.; Ng, S.P.; Liu, L.; Huang, Y.H.; Luk, B.L.; Ip, R.W.L.; Wu, C.M.L.; Chung, P.S. Review and comparison of shearography and active thermography for nondestructive evaluation. Mater. Sci. Eng. R Rep. 2009, 64, 73–112. [Google Scholar] [CrossRef]
- Meola, C.; Carlomagno, G.M. Recent advances in the use of infrared thermography. Meas. Sci. Technol. 2004, 15, R27–R58. [Google Scholar] [CrossRef]
- Mayr, G.; Plank, B.; Sekelja, J.; Hendorfer, G. Active thermography as a quantitative method for non-destructive evaluation of porous carbon fiber reinforced polymers. NDT E Int. 2011, 44, 537–543. [Google Scholar] [CrossRef]
- Munoz, V.; Valès, B.; Perrin, M.; Pastor, M.L.; Welemane, H.; Cantarel, A.; Karama, M. Damage detection in CFRP by coupling acoustic emission and infrared thermography. Compos. Part B Eng. 2016, 85, 68–75. [Google Scholar] [CrossRef]
- Chandarana, N.; Lansiaux, H.; Gresil, M. Characterisation of damaged tubular composites by acoustic emission, thermal diffusivity mapping and TSR-RGB projection technique. Appl. Compos. Mater. 2017, 24, 525–551. [Google Scholar] [CrossRef]
- Diamanti, K.; Soutis, C. Structural health monitoring techniques for aircraft composite structures. Prog. Aerosp. Sci. 2010, 46, 342–352. [Google Scholar] [CrossRef]
- Giurgiutiu, V. Structural Health Monitoring with Piezoelectric Wafer Active Sensors, 1st ed.; Academic Press: Cambridge, MA, USA, 2008; ISBN 9780120887606. [Google Scholar] [CrossRef]
- Sánchez, D.M.; Gresil, M.; Soutis, C. Distributed internal strain measurement during composite manufacturing using optical fibre sensors. Compos. Sci. Technol. 2015, 120, 49–57. [Google Scholar] [CrossRef]
- Ferdinand, P. The Evolution of Optical Fiber Sensors Technologies During the 35 Last Years and Their Applications in Structural Health Monitoring. In Proceedings of the 7th European Workshop on Structural Health Monitoring, Nantes, France, 8–11 July 2014; pp. 914–929. [Google Scholar]
- Kang, H.-K.; Kang, D.-H.; Bang, H.-J.; Hong, C.-S.; Kim, C.-G. Cure monitoring of composite laminates using fiber optic sensors. Smart Mater. Struct. 2002, 11, 279–287. [Google Scholar] [CrossRef]
- Gresil, M.; Saleh, M.; Soutis, C. Transverse crack detection in 3D angle interlock glass fibre composites using acoustic emission. Materials (Basel) 2016, 9, 699. [Google Scholar] [CrossRef]
- Chandarana, N.; Sanchez, D.M.; Soutis, C.; Gresil, M. Early damage detection in composites by distributed strain and acoustic event monitoring. In Proceedings of the 6th Asia-Pacific Workshop on Structural Health Monitoring, Tasmania, Australia, 7–9 December 2016. [Google Scholar]
- Gresil, M.; Giurgiutiu, V. Guided wave propagation in composite laminates using piezoelectric wafer active sensor. Aeronaut. J. 2013, 117, 971–995. [Google Scholar] [CrossRef]
- Giurgiutiu, V. Tuned lamb wave excitation and detection with piezoelectric wafer active sensors for structural health monitoring. J. Intell. Mater. Syst. Struct. 2005, 16, 291–305. [Google Scholar] [CrossRef]
- Lin, M.; Chang, F.-K. The manufacture of composite structures with a built-in network of piezoceramics. Compos. Sci. Technol. 2002, 62, 919–939. [Google Scholar] [CrossRef]
- Bektas, G.; Boz, T.; Keulen, C.J.; Yildiz, M.; Ozturk, C.; Menceloglu, Y.Z.; Suleman, A. Fiber Bragg grating and etched optic sensors for flow and cure monitoring of resin transfer molded composite structures. In Proceedings of the 18th International Conference on Composite Matererials (ICCM 2011), Jeju Island, Korea, 21–26 August 2011; pp. 1–6. [Google Scholar]
- Kuang, K.S.C.; Kenny, R.; Whelan, M.P.; Cantwell, W.J.; Chalker, P.R. Embedded fibre Bragg grating sensors in advanced composite materials. Compos. Sci. Technol. 2001, 61, 1379–1387. [Google Scholar] [CrossRef]
- Murukeshan, V.M.; Chan, P.Y.; Ong, L.S.; Seah, L.K. Cure monitoring of smart composites using Fiber Bragg Grating based embedded sensors. Sens. Actuators A Phys. 2000, 79, 153–161. [Google Scholar] [CrossRef]
- Kim, W.-S.; Kim, S.-H.; Lee, J.-J.; Ye, L.; Mai, Y.W.; Su, Z. A damage detection technique of composite laminates with embedded FBG sensors. In Composites Technologies for; Woodhead Publishing Limited: Cambridge, UK, 2004; pp. 981–986. [Google Scholar] [CrossRef]
- Glisic, B. Distributed fiber optic sensing technologies and applications—An overview. ACI Spec. Publ. 2013, 292, 1–18. [Google Scholar]
- Palmieri, L.; Schenato, L. Distributed Optical Fiber Sensing Based on Rayleigh Scattering. Open Opt. J. 2013, 7, 104–127. [Google Scholar] [CrossRef]
- Samiec, D. Distributed fibre-optic temperature and strain measurement with extremely high spatial resolution. Photonik Int. 2012, 6, 10–13. [Google Scholar]
- Güemes, A.; Fernández-López, B. Soller, optical fiber distributed sensing—Physical principles and applications. Struct. Health Monit. 2010, 9, 233–245. [Google Scholar] [CrossRef]
- Chiesura, G.; Luyckx, G.; Dierick, M.; Van Paepegem, W.; Degrieck, J. Assessing the damage evolution of composites containing embedded fibre optics. JEC Mag. 2015, 97, 60–63. [Google Scholar]
- Hamstad, M.A. Testing fiber composites with acoustic emission monitoring. J. Acoust. Emiss. 1982, 1, 151–164. [Google Scholar]
- Mehan, R.L.; Mullin, J.V. Analysis of composite failure mechanisms using acoustic emissions. J. Compos. Mater. 1971, 5, 266–269. [Google Scholar] [CrossRef]
- Godin, N.; Huguet, S.; Gaertner, R. Integration of the Kohonen’s self-organising map and k-means algorithm for the segmentation of the AE data collected during tensile tests on cross-ply composites. NDT E Int. 2005, 38, 299–309. [Google Scholar] [CrossRef]
- Masmoudi, S.; El Mahi, A.; El Guerjouma, R. Mechanical behaviour and health monitoring by acoustic emission of sandwich composite integrated by piezoelectric implant. Compos. Part B Eng. 2014, 67, 76–83. [Google Scholar] [CrossRef]
- Li, L.; V Lomov, S.; Yan, X.; Carvelli, V. Cluster analysis of acoustic emission signals for 2D and 3D woven glass/epoxy composites. Compos. Struct. 2014, 116, 286–299. [Google Scholar] [CrossRef]
- Liu, P.F.; Chu, J.K.; Liu, Y.L.; Zheng, J.Y. A study on the failure mechanisms of carbon fiber/epoxy composite laminates using acoustic emission. Mater. Des. 2012, 37, 228–235. [Google Scholar] [CrossRef]
- Ramirez-Jimenez, C.R.; Papadakis, N.; Reynolds, N.; Gan, T.H.; Purnell, P.; Pharaoh, M. Identification of failure modes in glass/polypropylene composites by means of the primary frequency content of the acoustic emission event. Compos. Sci. Technol. 2004, 64, 1819–1827. [Google Scholar] [CrossRef]
- Gutkin, R.; Green, C.J.; Vangrattanachai, S.; Pinho, S.T.; Robinson, P.; Curtis, P.T. On acoustic emission for failure investigation in CFRP: Pattern recognition and peak frequency analyses. Mech. Syst. Signal Process. 2011, 25, 1393–1407. [Google Scholar] [CrossRef]
- Bussiba, A.; Kupiec, M.; Ifergane, S.; Piat, R.; Böhlke, T. Damage evolution and fracture events sequence in various composites by acoustic emission technique. Compos. Sci. Technol. 2008, 68, 1144–1155. [Google Scholar] [CrossRef]
- Kotsikos, G.; Evans, J.T.; Gibson, A.G.; Hale, J. Use of acoustic emission to characterize corrosion fatigue damage accumulation in glass fiber reinforced polyester laminates. Polym. Compos. 1999, 20, 689–696. [Google Scholar] [CrossRef]
- Wadim, J.R. Acoustic Emission Applications; Dunegan Endevco: San Juan Capistrano, CA, USA, 1978. [Google Scholar]
- Chen, O.; Karandikar, P.; Takeda, N.; Kishi, T. Acoustic emission characterization of a glass-matrix composite. Nondestruct. Test. Eval. 1992, 8–9, 869–878. [Google Scholar] [CrossRef]
- Ceysson, O.; Salvia, M.; Vincent, L. Damage mechanisms characterisation of carbon fibre/epoxy composite laminates by both electrical resistance measurements and acoustic emission analysis. Scr. Mater. 1996, 34, 1273–1280. [Google Scholar] [CrossRef]
- Kim, S.-T.; Lee, Y.-T. Characteristics of damage and fracture process of carbon fiber reinforced plastic under loading-unloading test by using AE method. Mater. Sci. Eng. A 1997, 234–236, 322–326. [Google Scholar] [CrossRef]
- Gong, X.L.; Gong, X.J.; Laksimi, A.; Benzeggagh, M.L. Application of Tsai-Wu Criterion to Notched and Unnotched Composite Laminates under Torque Loading. J. Compos. Mater. 2000, 34, 460–478. [Google Scholar] [CrossRef]
- Masmoudi, S.; El Mahi, A.; Turki, S.; El Guerjouma, R. Mechanical behavior and health monitoring by Acoustic Emission of unidirectional and cross-ply laminates integrated by piezoelectric implant. Appl. Acoust. 2014, 86, 118–125. [Google Scholar] [CrossRef]
- Barré, S.; Benzeggagh, M.L. On the use of acoustic emission to investigate damage mechanisms in glass-fibre-reinforced polypropylene. Compos. Sci. Technol. 1994, 52, 369–376. [Google Scholar] [CrossRef]
- Komai, K.; Minoshima, K.; Shibutani, T. Investigations of the fracture mechanism of carbon/epoxy composites by AE signal analyses. JSME Int. J. 1991, 34, 381–388. [Google Scholar] [CrossRef]
- Mahdavi, H.R.; Rahimi, G.H.; Farrokhabadi, A. Failure analysis of (±55°)9 filament-wound GRE pipes using acoustic emission technique. Eng. Fail. Anal. 2015, 62, 178–187. [Google Scholar] [CrossRef]
- Ben Khalifa, A.; Zidi, M.; Abdelwahed, L. Mechanical characterization of glass/vinylester +/-55’ filament wound pipes by acoustic emission under axial monotonic loading. Comptes Rendus Mec. 2012, 340, 453–460. [Google Scholar] [CrossRef]
- Russell, S.S.; Henneke, E.G. Signature Analysis of Acoustic Emission from Graphite/Epoxy Composites; Interim Report, NASA-CR-153414; NASA Grant NSG-1238: Hampton, VA, USA, September 1997.
- Suzuki, M.; Nakanishi, H.; Iwamoto, M.; Jiao, G.-K.; Koike, K.; Imura, M. Fatigue fracture mechanism of class A-SMC by acoustic emission method. J. Soc. Mater. Sci. Jpn. 1987, 36, 1402–1408. [Google Scholar] [CrossRef]
- Suzuki, M.; Kida, S.; Shimbo, M.; Miyano, Y. Effects of fiber content on fracture mechanisms of short fiber reinforced PET composites. Trans. Jpn. Soc. Mech. Eng. Ser. A 1990, 56, 1030–1035. [Google Scholar] [CrossRef]
- De Groot, P.J.; Wijnen, P.A.M.; Janssen, R.B.F. Real-time frequency determination of acoustic emission for different fracture mechanisms in carbon/epoxy composites. Compos. Sci. Technol. 1995, 55, 405–412. [Google Scholar] [CrossRef]
- Jong, H.-J. Transverse cracking in a cross-ply composite laminate—Detection in acoustic emission and source characterization. J. Compos. Mater. 2006, 40, 37–69. [Google Scholar] [CrossRef]
- Rotem, A.; Baruch, J. Determining the load-time history of fibre composite materials by acoustic emission. J. Mater. Sci. 1974, 9, 1789–1796. [Google Scholar] [CrossRef]
- Goren, A.; Atas, C. Manufacturing of polymer matrix composites using vacuum assisted resin infusion molding. Arch. Mater. Sci. Eng. 2008, 34, 117–120. [Google Scholar]
- PI Ceramic, Piezoelectric Ceramic Products, n.d. Available online: http://www.piceramic.com/download/PI_Piezoelectric_Ceramic_Products_CAT125E.pdf (accessed on 1 May 2017).
- Lin, H.; Brown, L.P.; Long, A.C. Modelling and Simulating Textile Structures Using TexGen. Adv. Mater. Res. 2011, 331, 44–47. [Google Scholar] [CrossRef]
Figure 1.
Cross-section of damaged carbon fibre woven composite with embedded optical fibre.

Figure 2.
Typical acoustic emission waveform annotated with signal features.

Figure 3.
(a) Network of sensors in smart composite laminate; (b) Schematic of the cross-section showing the path of the optical fibre through-the-thickness; (c) Micrograph of embedded optical fibre of 155 µm diameter. PWAS = piezoelectric wafer active sensors.
Figure 3.
(a) Network of sensors in smart composite laminate; (b) Schematic of the cross-section showing the path of the optical fibre through-the-thickness; (c) Micrograph of embedded optical fibre of 155 µm diameter. PWAS = piezoelectric wafer active sensors.
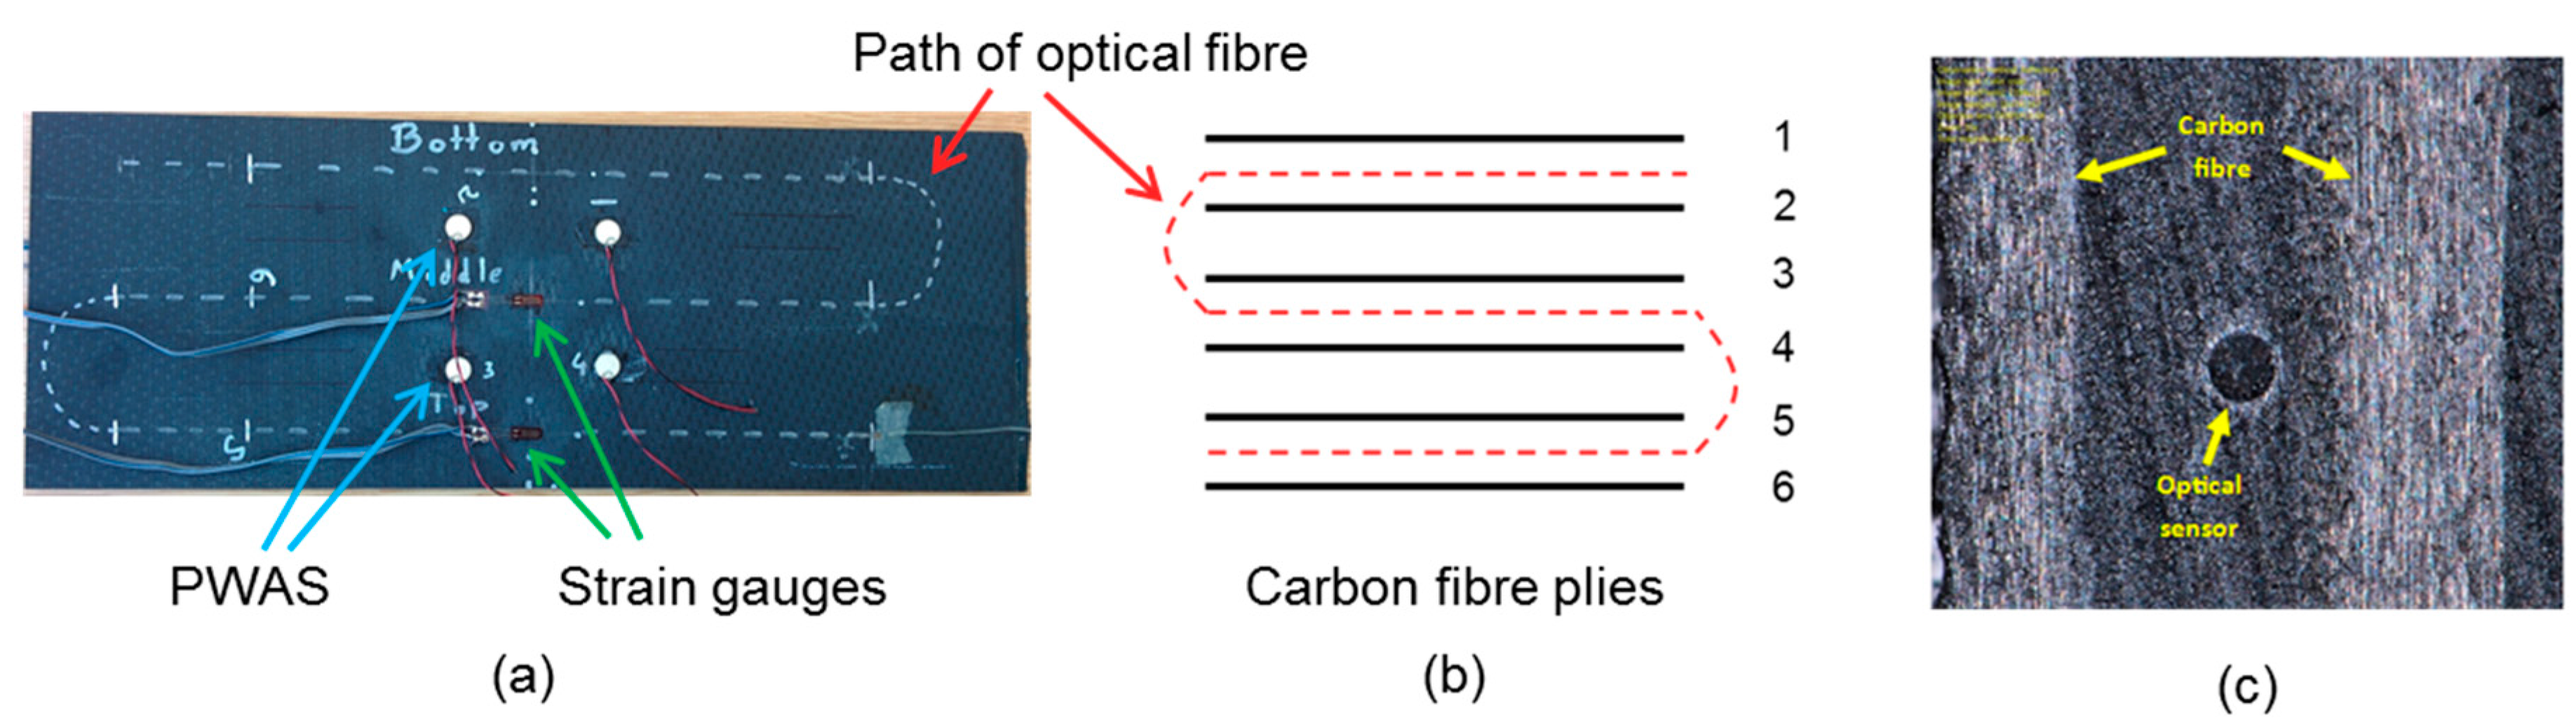
Figure 4.
Four point bending of the laminate (a) before loading; (b) during loading.

Figure 5.
Temperature measured by thermocouples (red) and mechanical strain measured by the embedded optical fibre (blue) in the panel during the curing cycle of the composite laminate.
Figure 5.
Temperature measured by thermocouples (red) and mechanical strain measured by the embedded optical fibre (blue) in the panel during the curing cycle of the composite laminate.
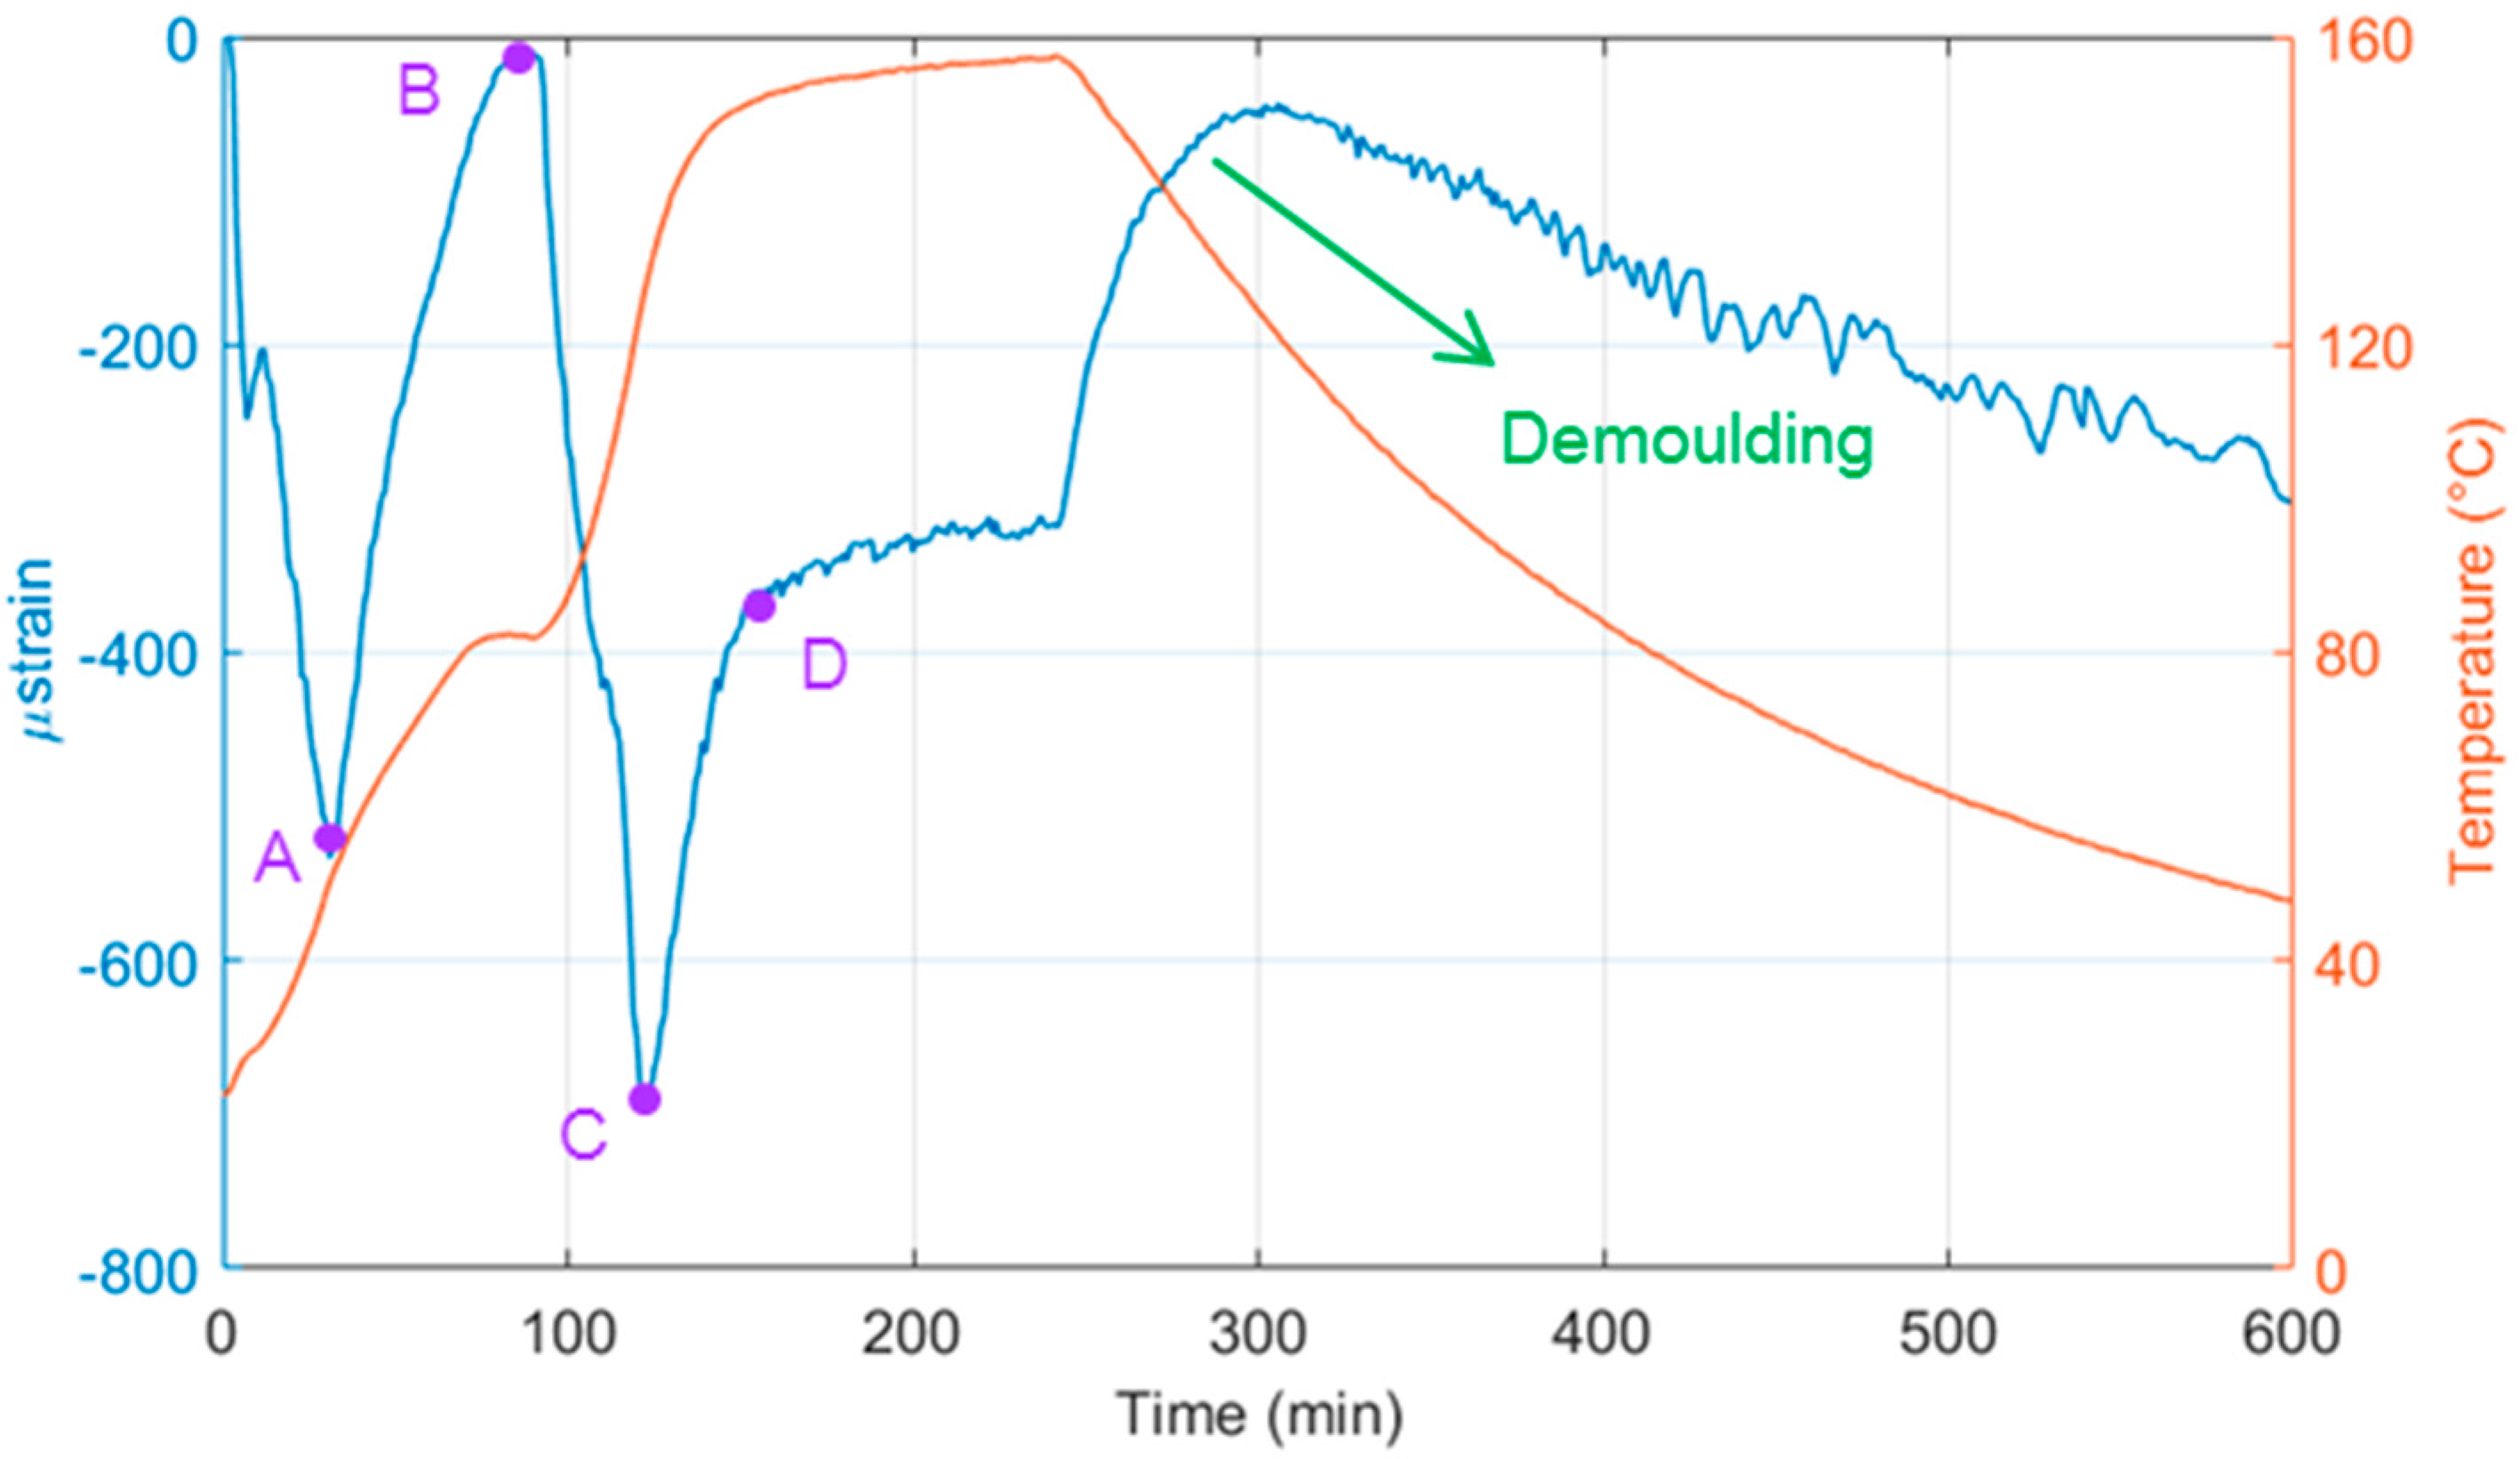
Figure 6.
Strain developed in the panel during resin infusion (blue) and the residual strain in the panel after manufacture (red). Left to right: top, middle, and bottom optical fibre sensing regions.
Figure 6.
Strain developed in the panel during resin infusion (blue) and the residual strain in the panel after manufacture (red). Left to right: top, middle, and bottom optical fibre sensing regions.
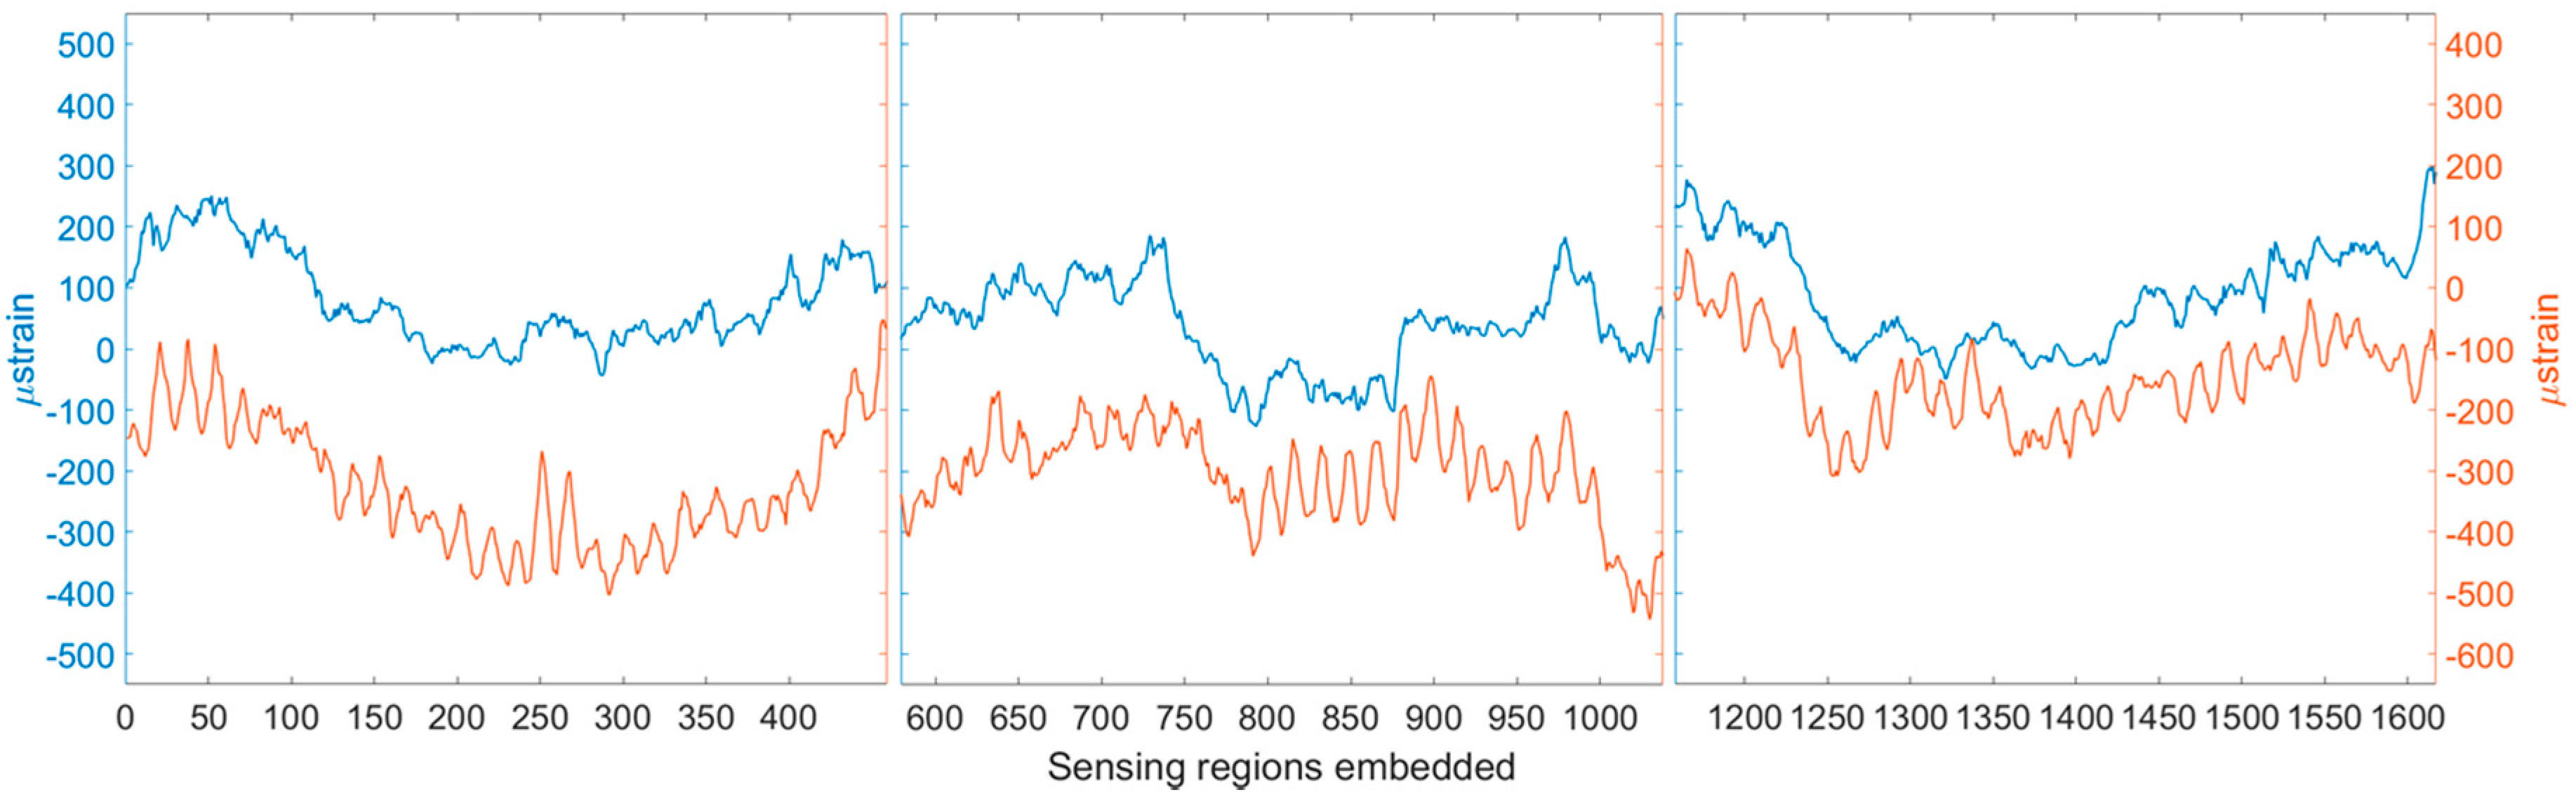
Figure 7.
Development of surface strain measured by SG6 and strain in the optical fibre during bending cycle 13.
Figure 7.
Development of surface strain measured by SG6 and strain in the optical fibre during bending cycle 13.

Figure 8.
Strain developed in the panel during cycles 1–5.
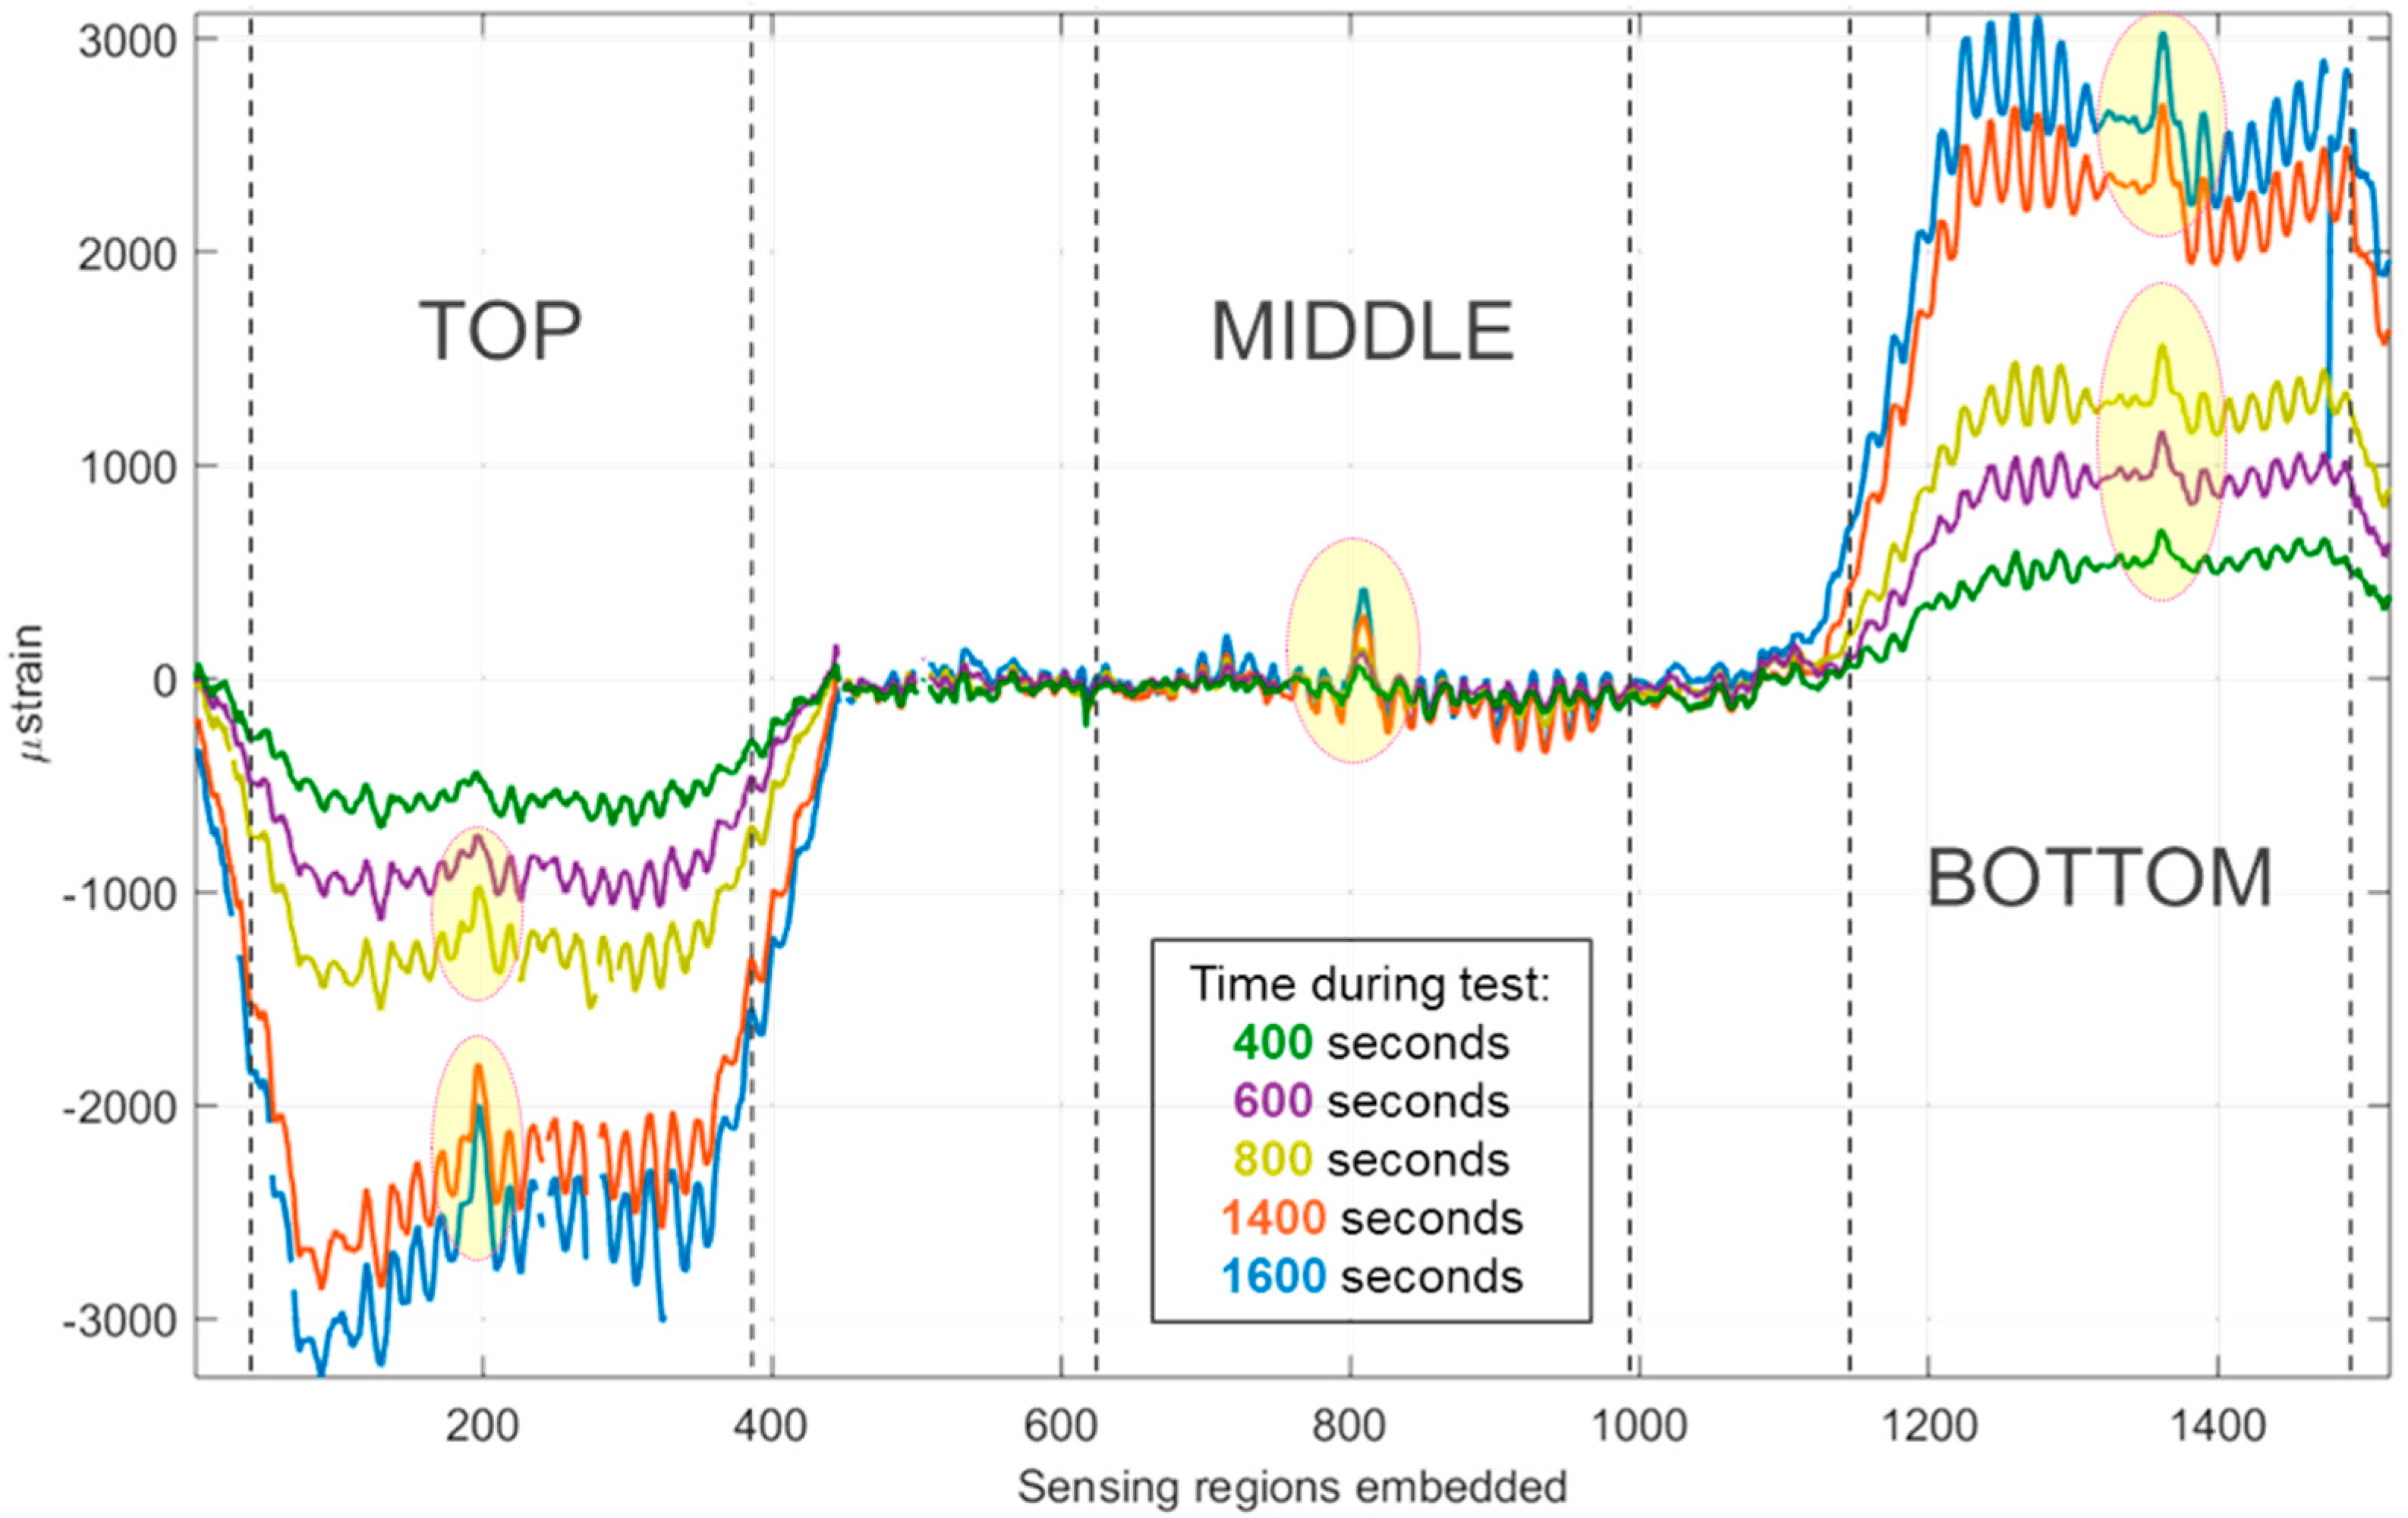
Figure 9.
Strain developed in the ‘bottom’ sensing region during cycles 1–5 with wavelength measurement points annotated.
Figure 9.
Strain developed in the ‘bottom’ sensing region during cycles 1–5 with wavelength measurement points annotated.
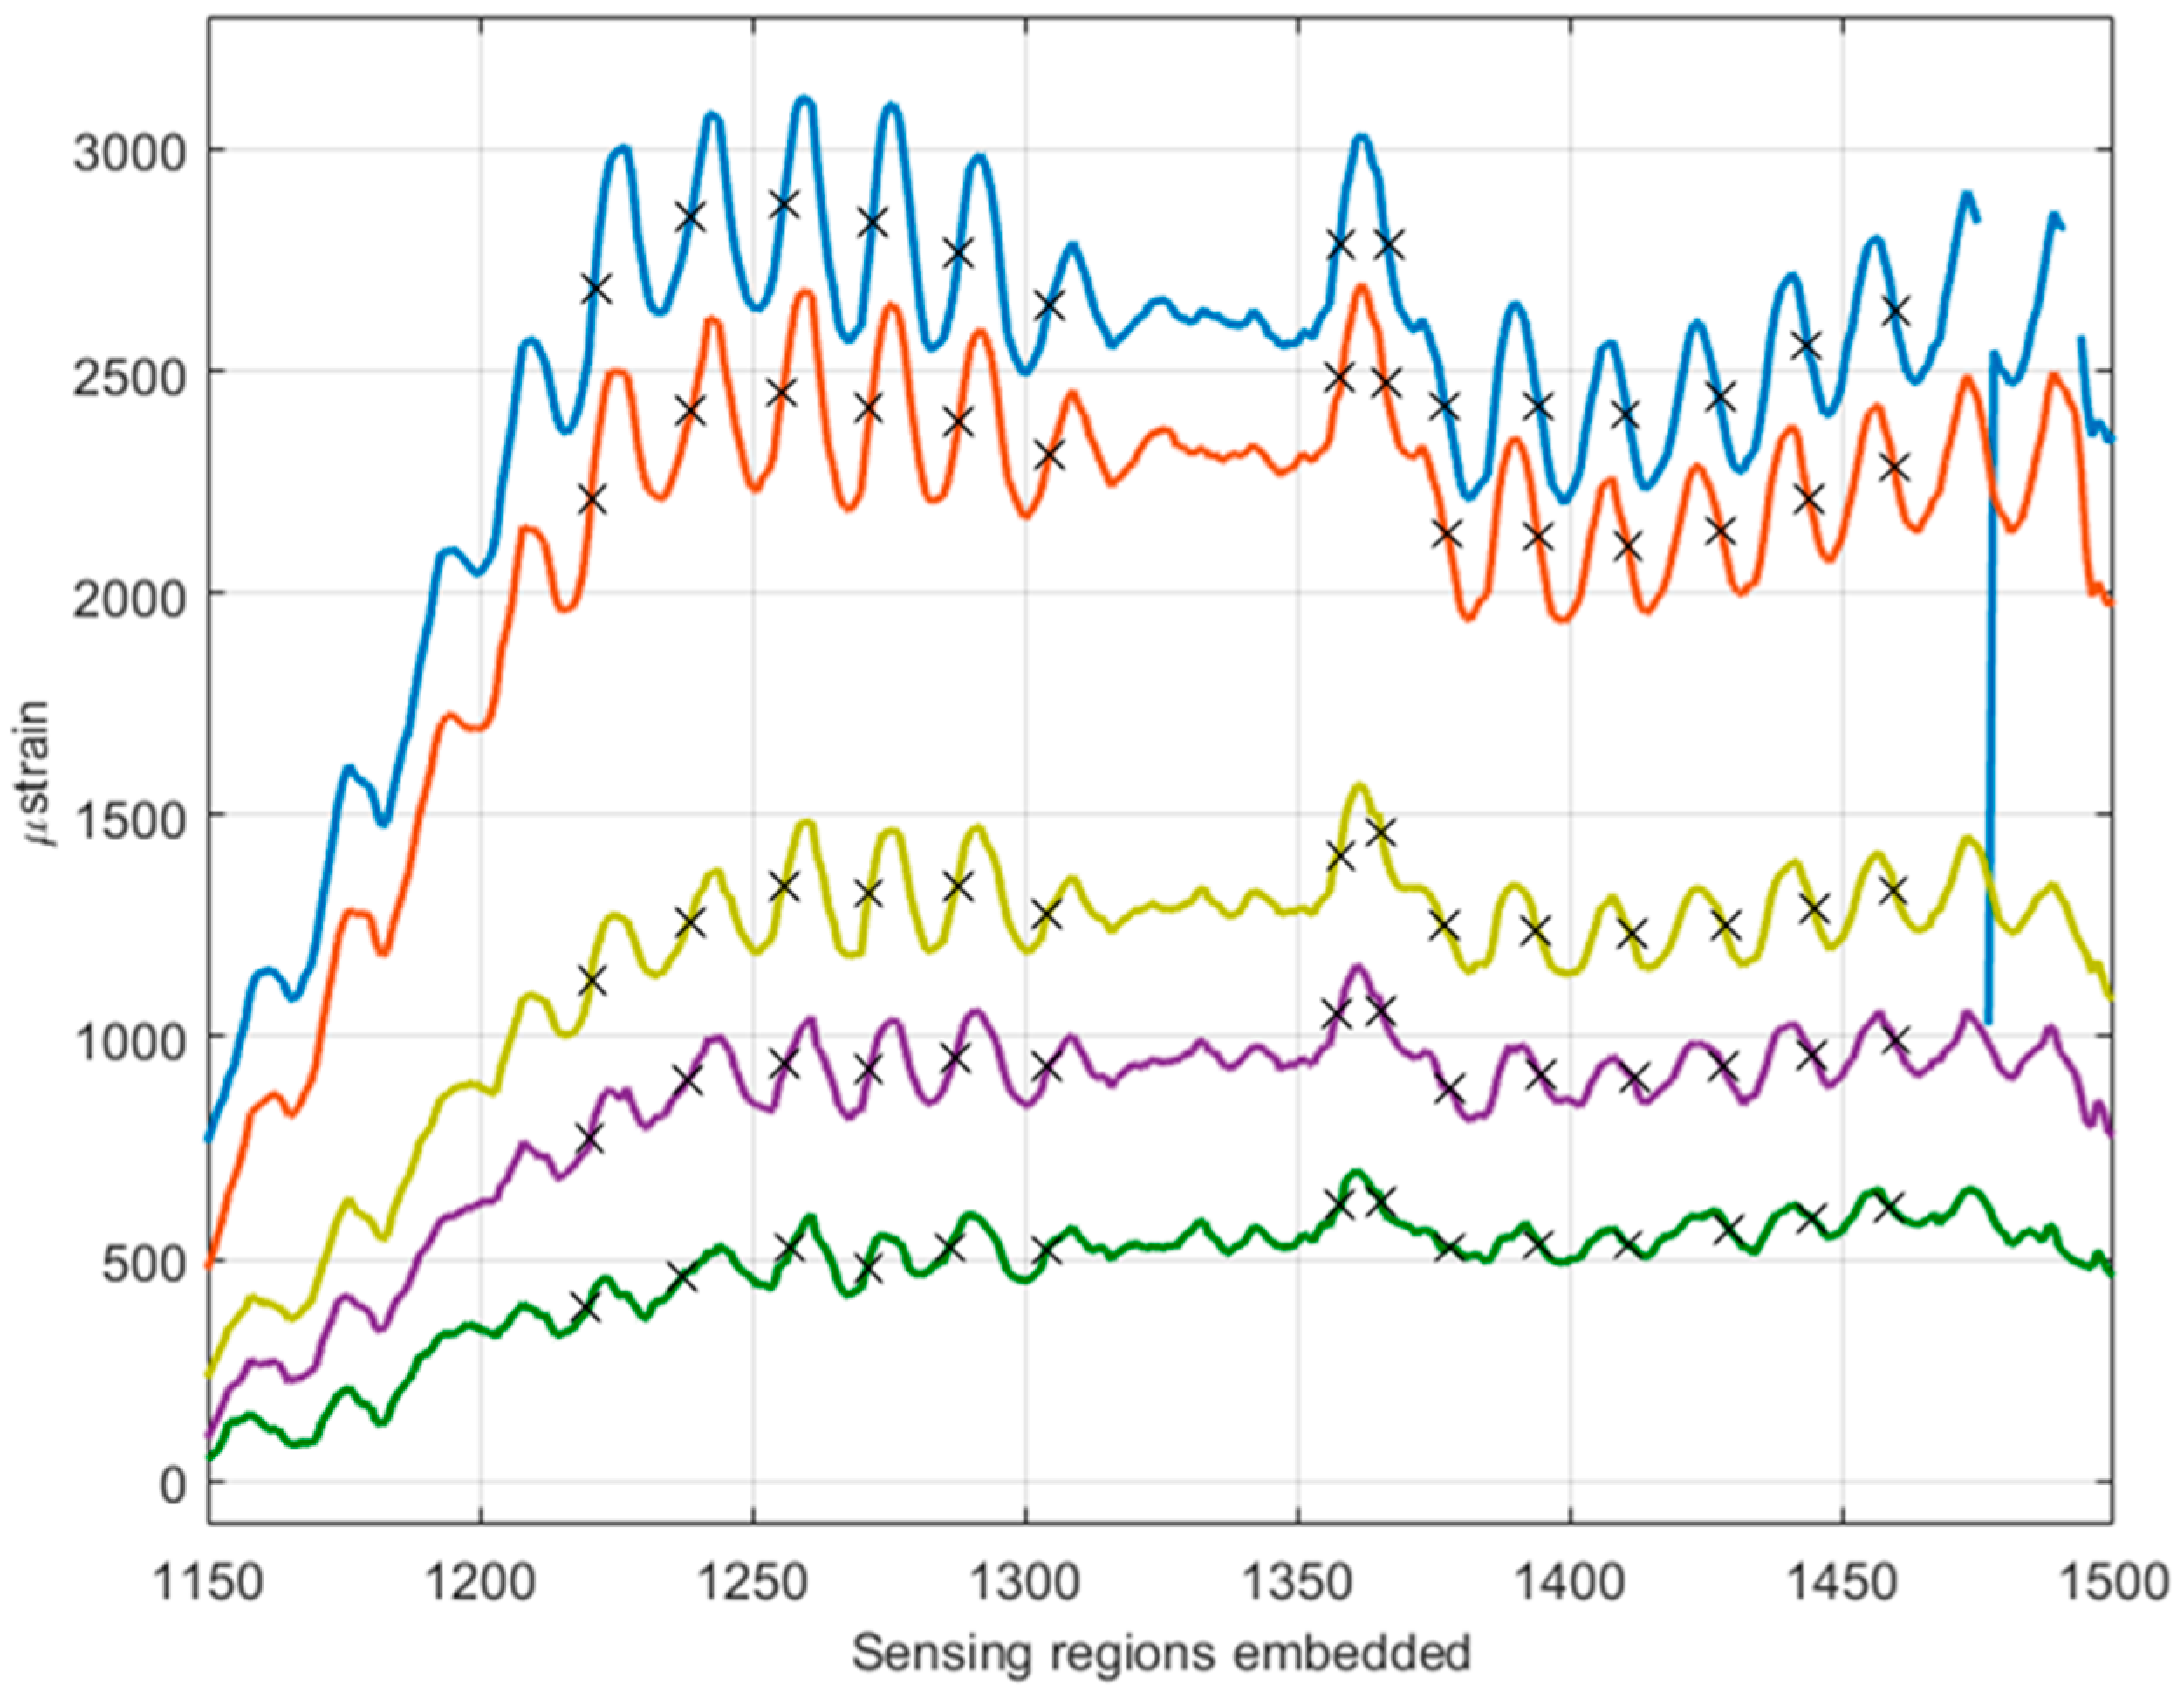
Figure 10.
TexGen model showing the possible nesting of two layers of 5-harness satin fabric: (a) top view; (b) bottom view; (c) view of the cross-section.
Figure 10.
TexGen model showing the possible nesting of two layers of 5-harness satin fabric: (a) top view; (b) bottom view; (c) view of the cross-section.

Figure 11.
Photograph of the laminate showing the 5-harness satin weave. Repeat size ~10.1 mm.

Figure 12.
Maximum amplitude of acoustic emission hits above the threshold gain received by all piezoelectric sensors during cycles 1–5.
Figure 12.
Maximum amplitude of acoustic emission hits above the threshold gain received by all piezoelectric sensors during cycles 1–5.

Figure 13.
Maximum amplitude versus peak frequency of acoustic emission hits received during cycles 1–5.
Figure 13.
Maximum amplitude versus peak frequency of acoustic emission hits received during cycles 1–5.

Figure 14.
Duration of received signals versus maximum amplitude during cycles 1–5.

Figure 15.
Duration of received signals versus maximum amplitude during cycles 6–13.


Table 1.
Amplitude distribution of acoustic emission (AE) signals in composites. (CF = carbon fibre; CFRP = CF reinforced polymer; Cy = cyclic; Ep = epoxy; GF = glass fibre; PET = polyester; PP = polypropylene; Qs = quasi-static; 3PB/4PB = 3/4 point bending; Tens. = tensile).
Table 1.
Amplitude distribution of acoustic emission (AE) signals in composites. (CF = carbon fibre; CFRP = CF reinforced polymer; Cy = cyclic; Ep = epoxy; GF = glass fibre; PET = polyester; PP = polypropylene; Qs = quasi-static; 3PB/4PB = 3/4 point bending; Tens. = tensile).
| Ref. | Material | Test | Sensor | Amplitude Distribution (dB) | |||
|---|---|---|---|---|---|---|---|
| Matrix Cracking | Interfacial Debonding | Fibre/Matrix Friction and Fibre Pull-Out | Fibre Breakage | ||||
| [40] | - | - | - | 30–45 | 45–55 | - | >55 |
| [41] | Graphite/Glass | Tens., 4PB | PAC pico | 60–80 | 70–90 | - | - |
| [42] | CF/Ep | Buckling, 3PB | R15 | 43–65 | 45–75 | 50–85 | - |
| [43] | CFRP | Tens. Cy | Fuji ceramic M204 | 40–70 | - | - | 60–100 |
| [39] | GF/PET | Immersed bending fatigue | PAC U30D03 | 40–60 | 60–80 | - | 80–100 |
| [44] | GF/Ep | Torque | WD AE | 32–72 | 46–68 | 69–86 | 87–100 |
| [45] | GF/Ep | 3PB | PZT disc | 35–82 | 50–95 | - | >65 |
| [33] | GF sandwich | 3PB static/fatigue | PZT disc | 40–76 | 72–100 | - | >94 |
| [46] | GF/PP | Tens., crack propagation | PAC micro 80 | 40–55 | 60–65 | 65–85 | 85–95 |
| [32] | GF/Ep | Tens. | PAC micro 80 | 40–80 | 50–80 | 70–100 | - |
| [47] | CF/Ep | Tens. | PAC pico | <70 | <60 | - | - |
| [34] | CF/Ep | Tens. | Digital wave B1025 | 35–55 | 55–100 | - | 35–80 |
| [35] | CF/Ep notched | Tens. | - | 50–60 | 60–70 | - | 70–100 |
| [16] | GF/Ep | Tens. | Steminc SM412 | 60–100 | - | - | - |
| [48] | GF/Ep | Ring tens. | WD AE | 40–80 | - | 80–90 | 90–94 |
| [49] | GF/Vinyl-ester | Tens. | - | 45–55 | 55–75 | - | ~83 |
Table 2.
Frequency distribution of AE signals in composites. (CF = carbon fibre; CFRP = CF reinforced polymer; Cy = cyclic; Ep = epoxy; GF = glass fibre; PET = polyester; PP = polypropylene; Qs = quasi-static; 3PB/4PB = 3/4 point bending; Tens. = tensile).
Table 2.
Frequency distribution of AE signals in composites. (CF = carbon fibre; CFRP = CF reinforced polymer; Cy = cyclic; Ep = epoxy; GF = glass fibre; PET = polyester; PP = polypropylene; Qs = quasi-static; 3PB/4PB = 3/4 point bending; Tens. = tensile).
| Ref. | Material | Test | Sensor | Frequency Distribution (kHz) | |||
|---|---|---|---|---|---|---|---|
| Matrix Cracking | Interfacial Debonding | Fibre/Matrix Friction and Fibre Pull-Out | Fibre Breakage | ||||
| [50] | Graphite/Ep | Tens. | Panametrics 5070AE | 50–150 | - | - | 140–180 |
| [51] | GF/PET | - | - | 30–150 | 30–100 | 180–290 | 300–400 |
| [52] | GF/PET | - | - | 80–130 | - | 250–410 | 250–410 |
| [47] | CF/Ep | Tens. Qs/Cy | PAC Pico | ~300 | - | 300 | >500 |
| [53] | CF/Ep | Tens., DCB, lap shear | PAC-WD | 50–180 | 220–300 | 180–220 | >300 |
| [36] | GF/PP | Tens. | PAC-WD | 90–110 | - | 200–300 | >420 |
| [37] | CF/Ep | CT, CC, DCB, 4PB | PAC-WD | <50 | 200–300 | 500–600 | 400–500 |
| [38] | Graphite/Ep | Tens. | 9223M3 Mini | ~140 | ~300 | - | ~405 |
| [54] | CF/GF/Ep | Tens. | B1025 | 200–600 | 200–350 | 700–1100 | >1500 |
| [34] | CF/Ep | Tens. | B1025 | 50–80 | 50–150 | - | 150–500 |
| [16] | GF/Ep | Tens. | Steminc SM412 | 80–400 | - | - | - |
Table 3.
Progressive loading cycles of four point bending. Test speed = 1 mm/min. Cycles 6–13 completed at a later date.
Table 3.
Progressive loading cycles of four point bending. Test speed = 1 mm/min. Cycles 6–13 completed at a later date.
| Loading Step | Strain 1 (%) | Loading Step | Strain 1 (%) |
|---|---|---|---|
| 1 | 0.14 | 8 | 0.41 |
| 2 | 0.14 | 9 | 0.41 |
| 3 | 0.2 | 10 | 0.43 |
| 4 | 0.29 | 11 | 0.46 |
| 5 | 0.4 | 12 | 0.5 |
| 6 | 0.42 | 13 | 0.55 |
| 7 | 0.41 |
1 Maximum strain as measured by the central strain gauge (SG6).
Table 4.
Calculated wavelengths of oscillations in distributed strain data from the top and bottom sensing regions.
Table 4.
Calculated wavelengths of oscillations in distributed strain data from the top and bottom sensing regions.
| Time of Plot (s) | Bottom | Top | ||
|---|---|---|---|---|
| Mean Wavelength (mm) | Standard Deviation (mm) | Mean Wavelength (mm) | Standard Deviation (mm) | |
| 400 | 10.51 | 1.28 | 10.18 | 1.34 |
| 600 | 10.45 | 0.74 | 10.09 | 1.11 |
| 800 | 10.45 | 0.57 | 10.63 | 1.86 |
| 1400 | 10.40 | 0.42 | 10.63 | 1.38 |
| 1600 | 10.40 | 0.42 | 10.63 | 1.38 |
Table 5.
Calculated Felicity ratios for four point bending cycles 1–5.
| Loading Step | Strain 1 (%) | Load at Maximum Strain (N) | Felicity Ratio |
|---|---|---|---|
| 1 | 0.14 | 358 | 1 |
| 2 | 0.14 | 349 | 1 |
| 3 | 0.2 | 516 | 0.98 |
| 4 | 0.29 | 741 | 0.78 |
| 5 | 0.4 | 1050 | 0.81 |
1 Maximum strain as measured by the central strain gauge (SG6).
© 2017 by the authors. Licensee MDPI, Basel, Switzerland. This article is an open access article distributed under the terms and conditions of the Creative Commons Attribution (CC BY) license (http://creativecommons.org/licenses/by/4.0/).
Share and Cite
MDPI and ACS Style
Chandarana, N.; Sanchez, D.M.; Soutis, C.; Gresil, M. Early Damage Detection in Composites during Fabrication and Mechanical Testing. Materials 2017, 10, 685. https://doi.org/10.3390/ma10070685
AMA Style
Chandarana N, Sanchez DM, Soutis C, Gresil M. Early Damage Detection in Composites during Fabrication and Mechanical Testing. Materials. 2017; 10(7):685. https://doi.org/10.3390/ma10070685
Chicago/Turabian StyleChandarana, Neha, Daniel Martinez Sanchez, Constantinos Soutis, and Matthieu Gresil. 2017. "Early Damage Detection in Composites during Fabrication and Mechanical Testing" Materials 10, no. 7: 685. https://doi.org/10.3390/ma10070685
Note that from the first issue of 2016, this journal uses article numbers instead of page numbers. See further details here.