Simulations on Monitoring and Evaluation of Plasticity-Driven Material Damage Based on Second Harmonic of S0 Mode Lamb Waves in Metallic Plates

 ,
,  ,
,
Abstract
:1. Introduction
2. Material Nonlinearity and Its Measurement
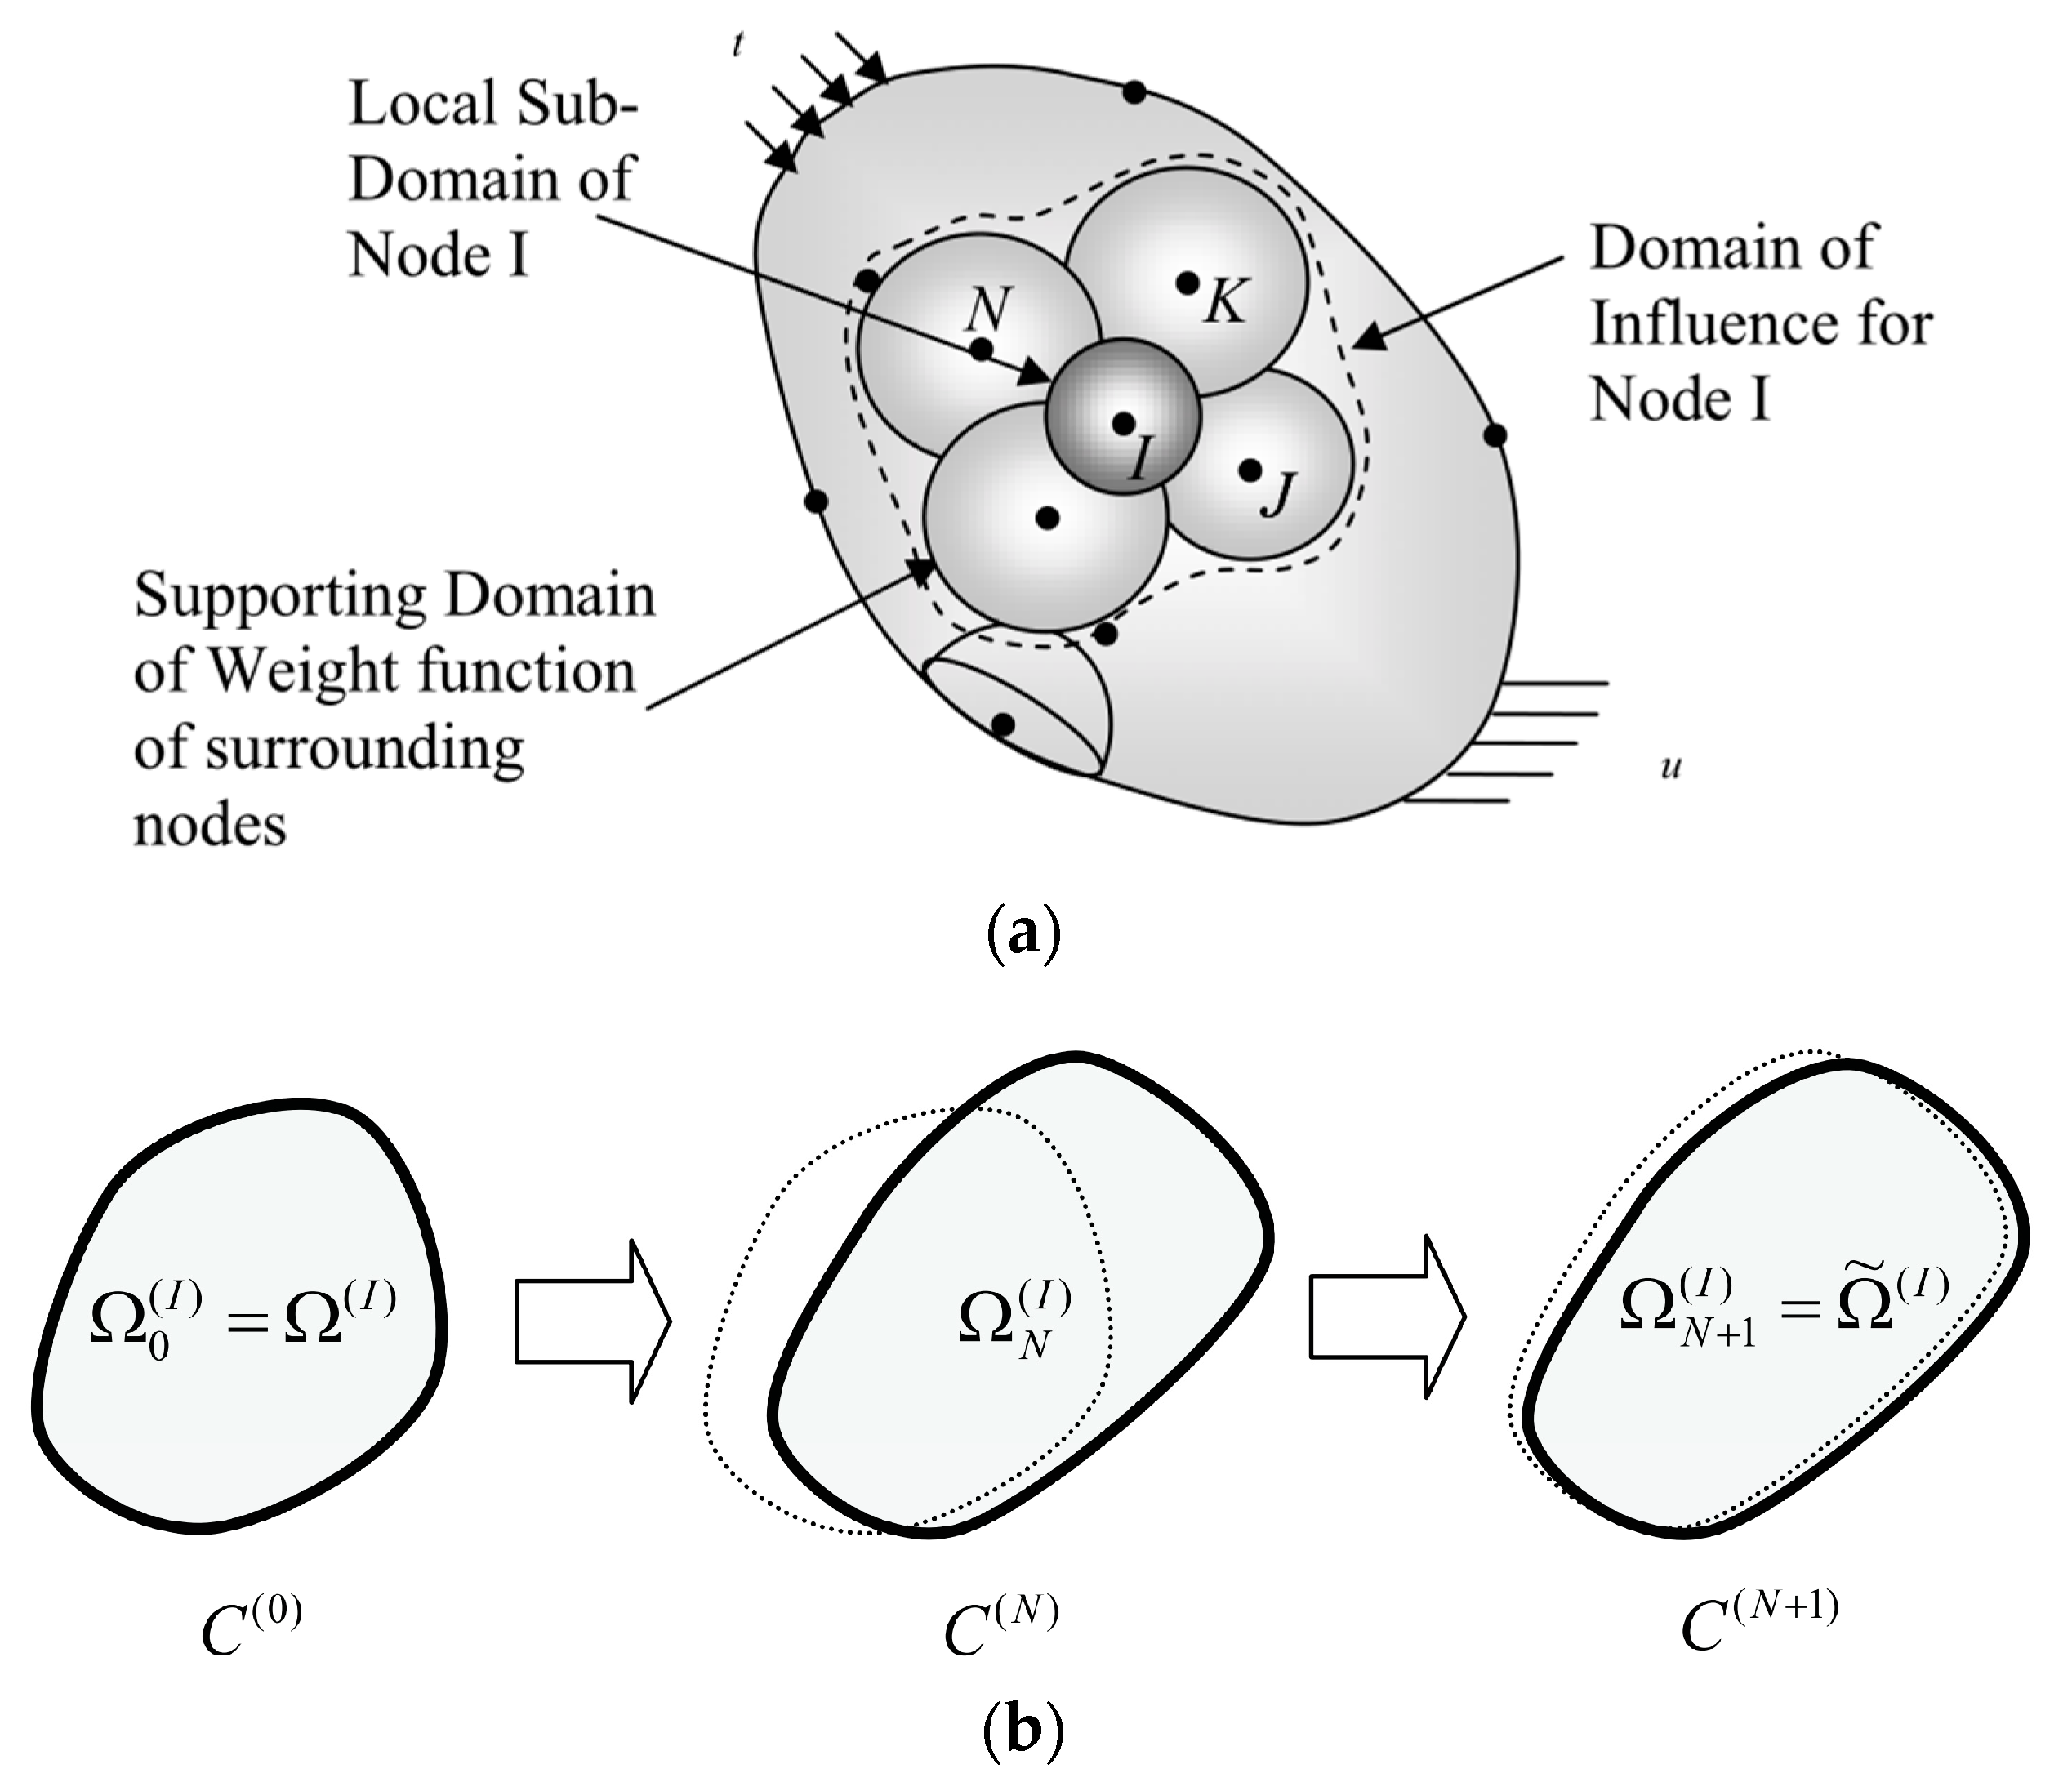
3. Theory and Model of MLPGEM
3.1. Theory
3.2. Model
4. Simulation Results and Discussion
4.1. Effectiveness Validation of MLPGEM
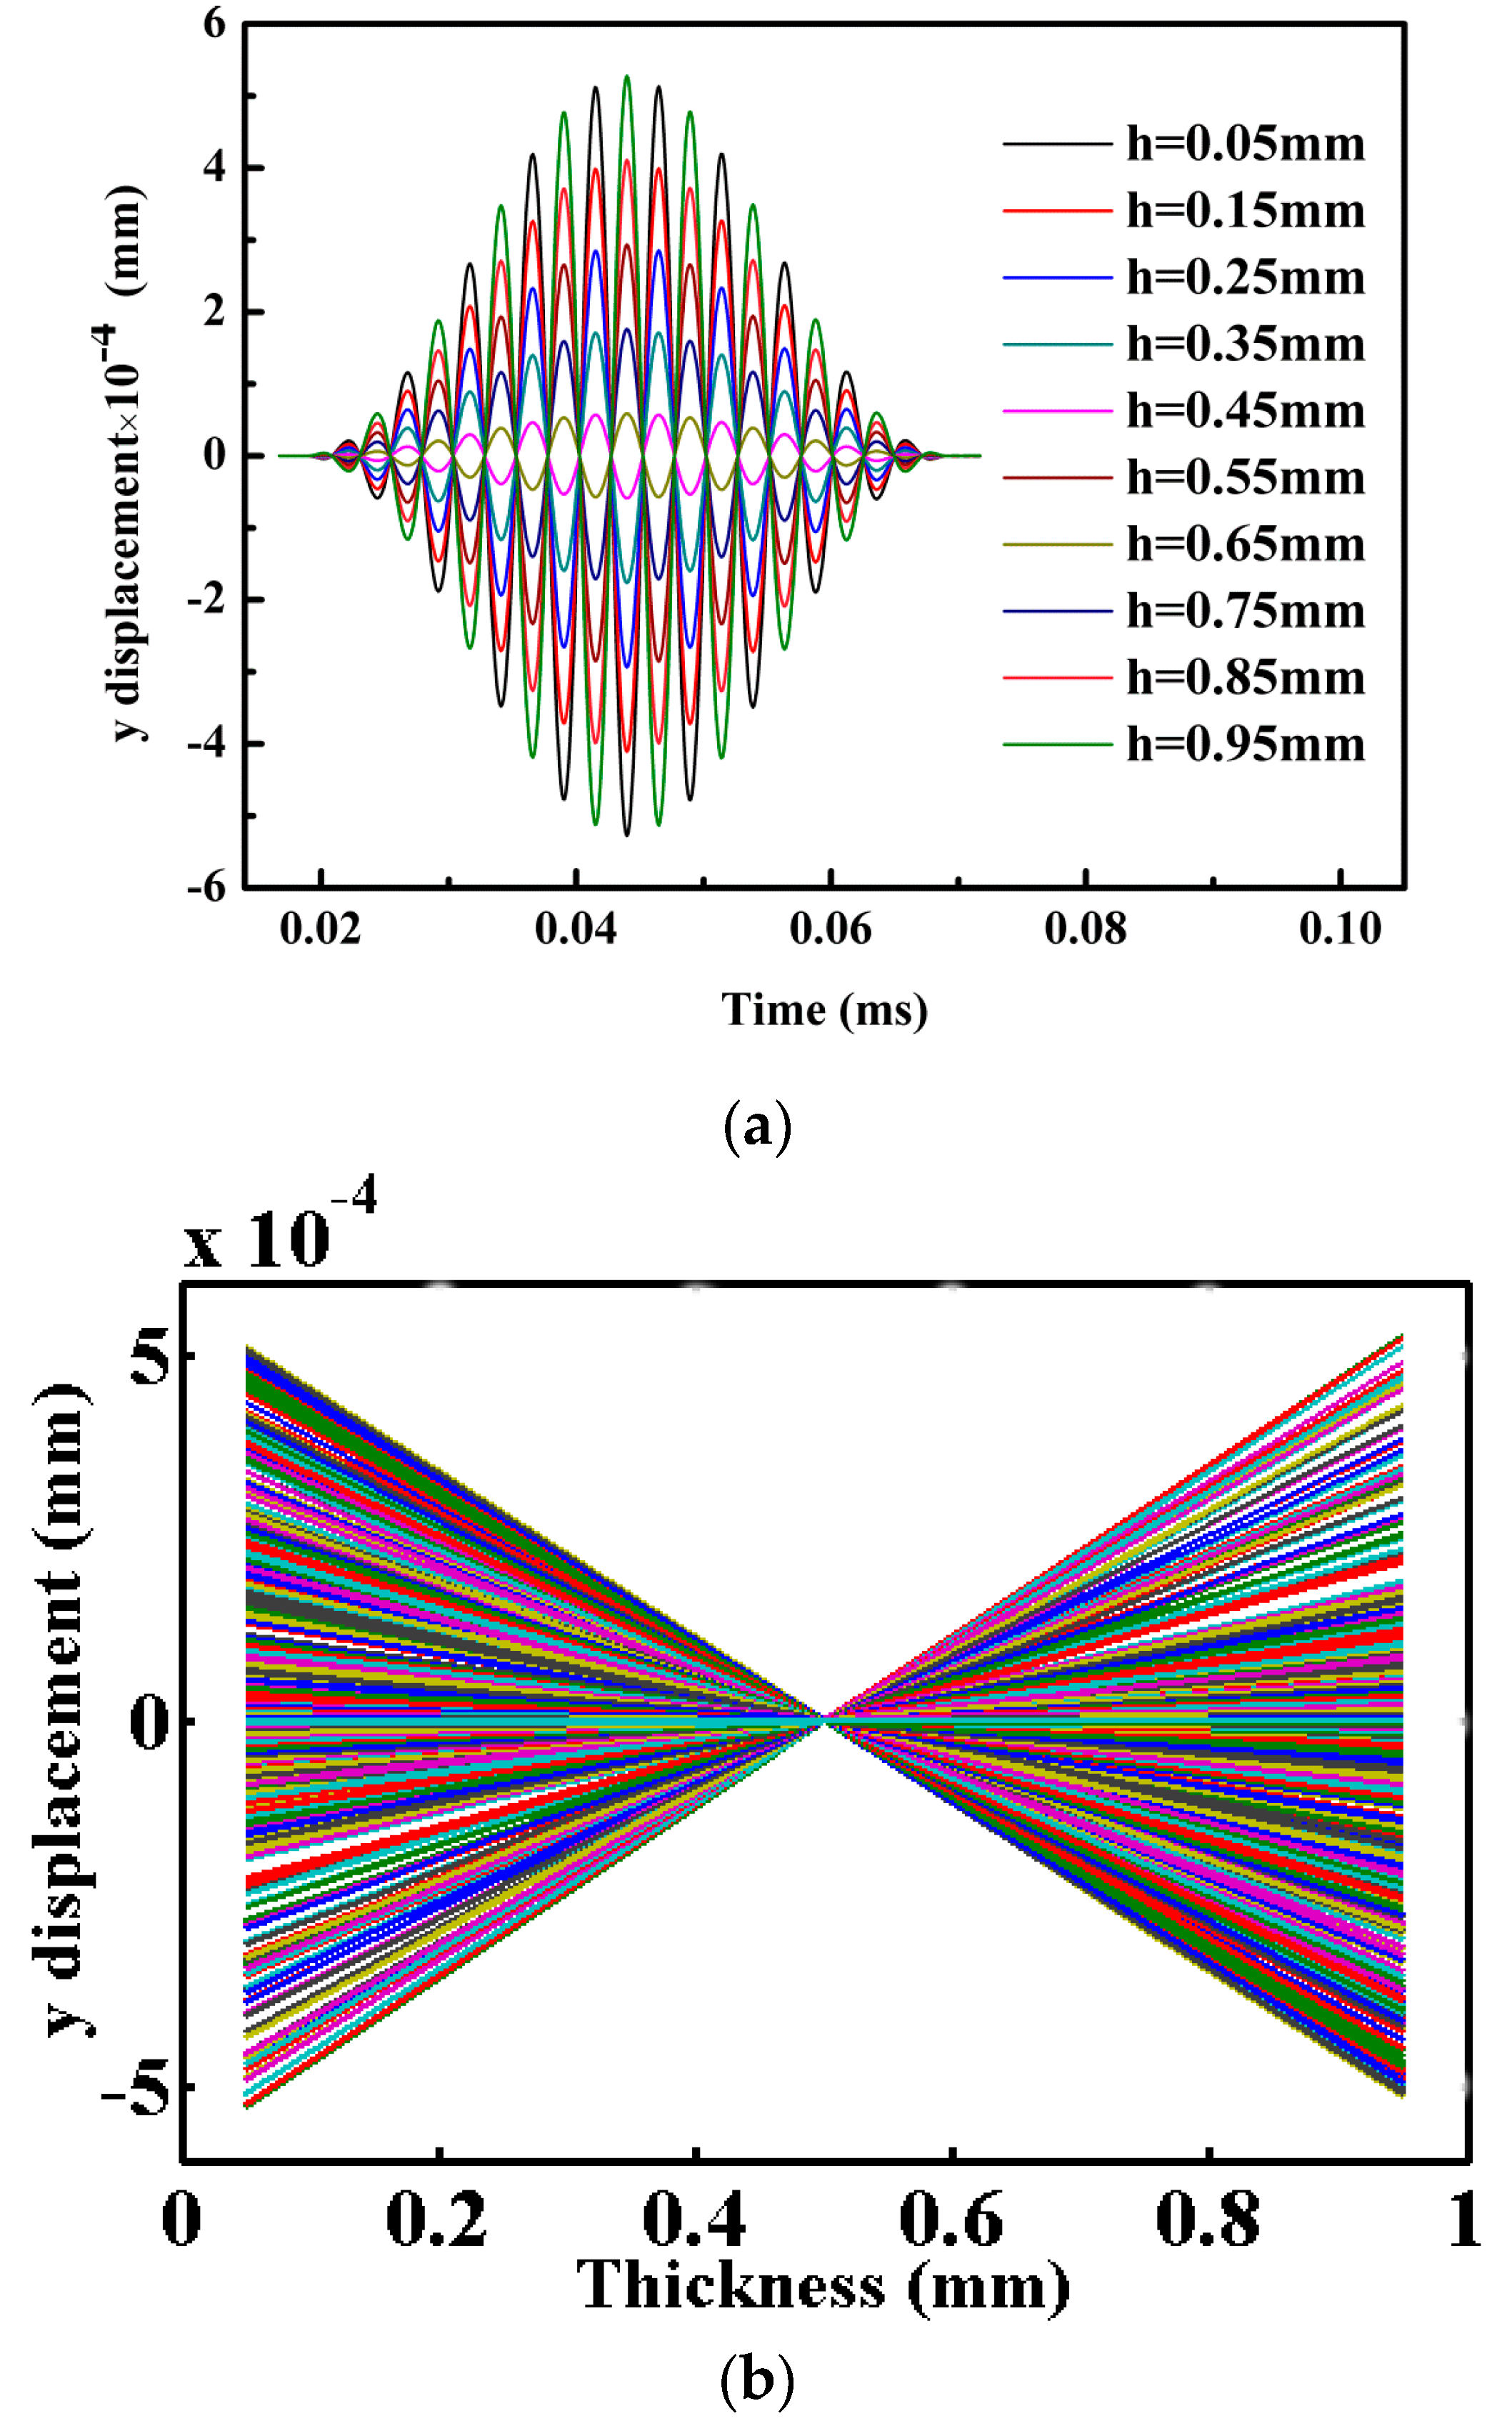
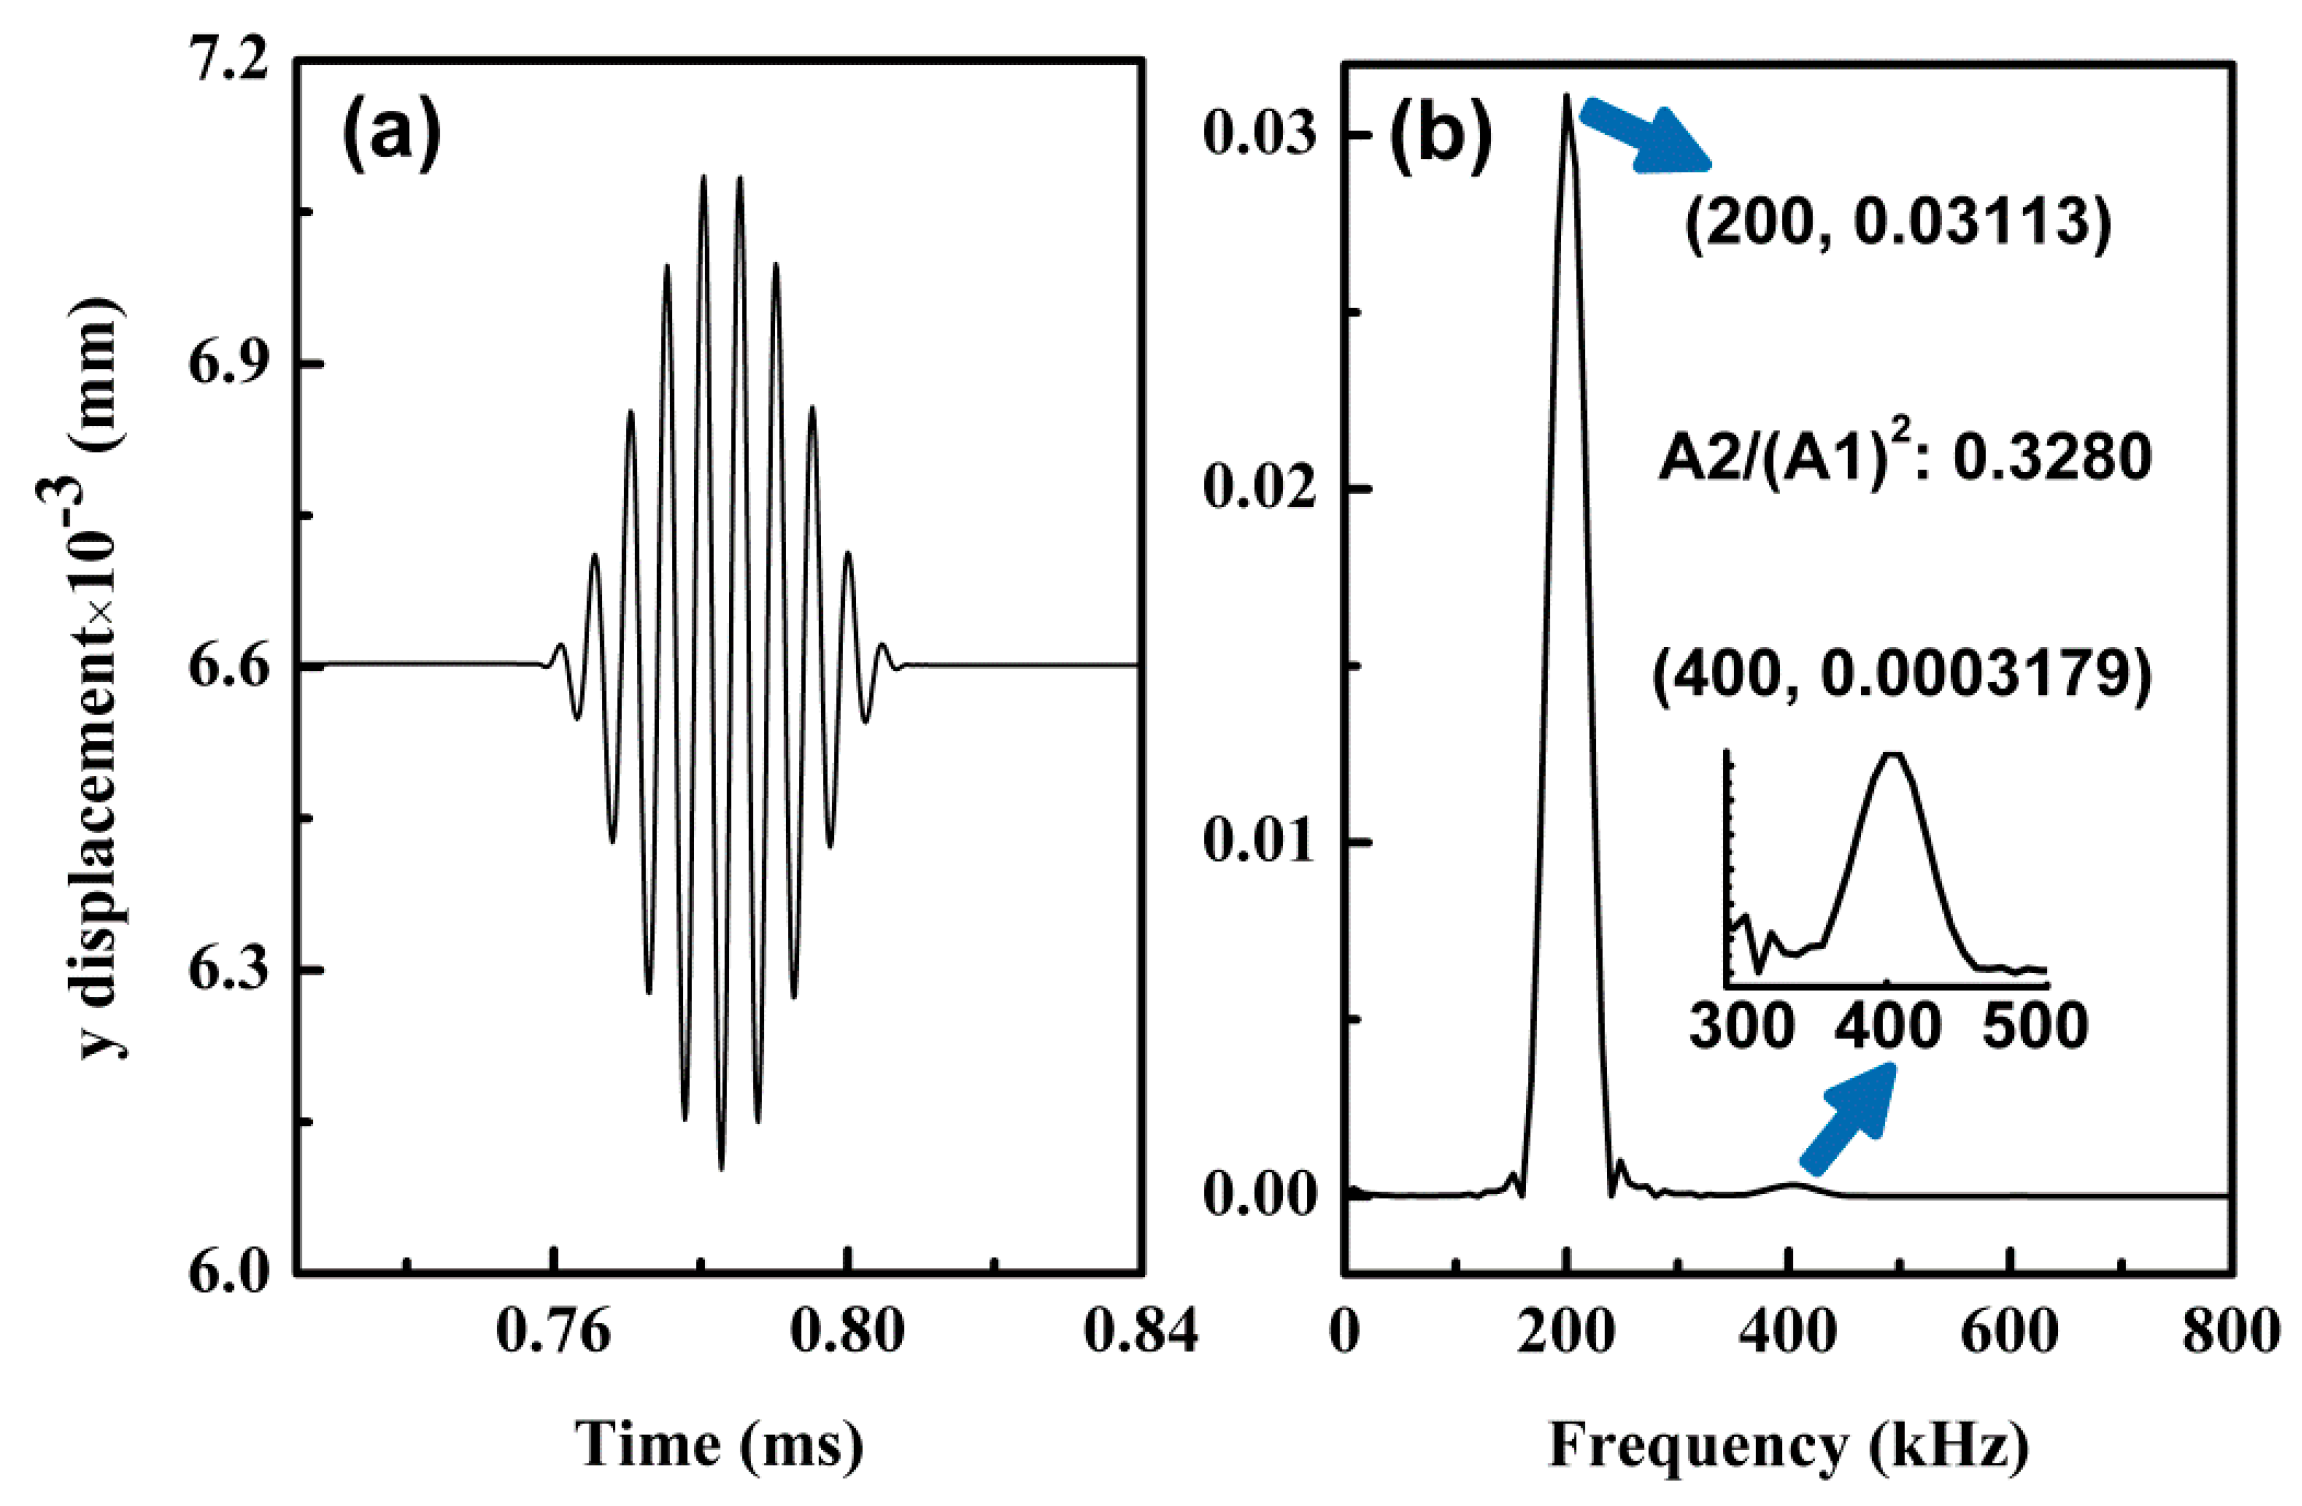
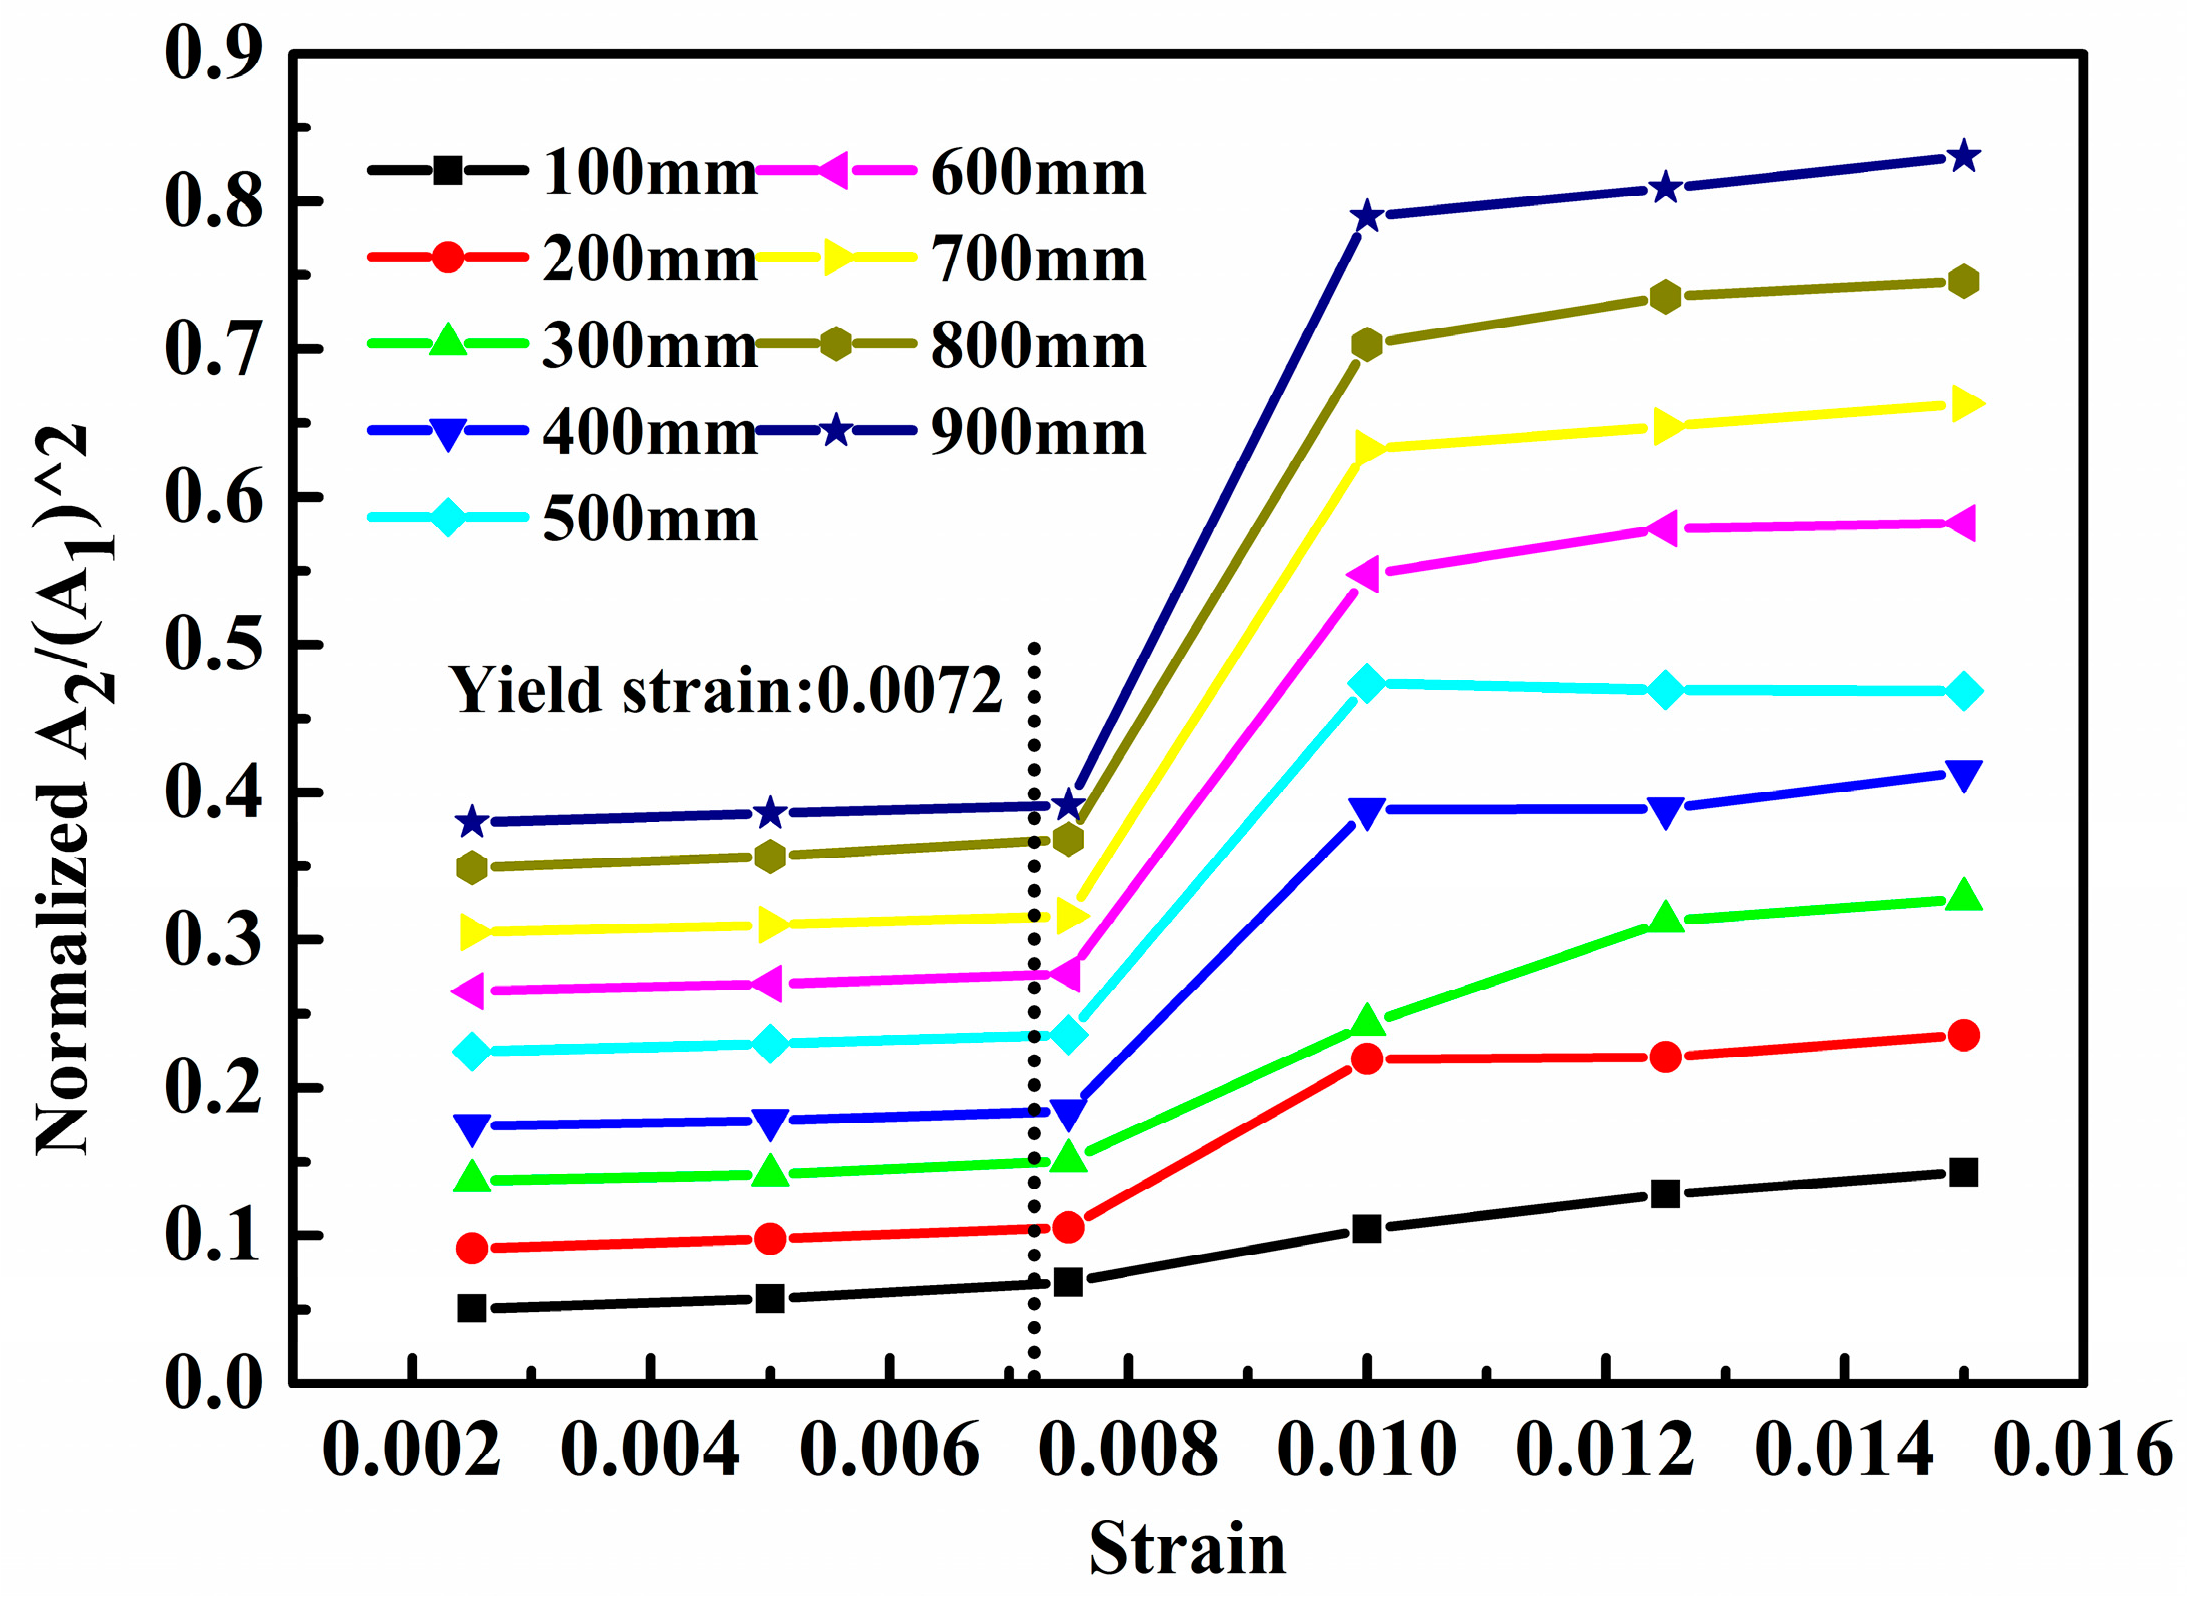
4.2. Simulation Results and Discussion
5. Conclusions
Acknowledgments
Author Contributions
Conflicts of Interest
References
- Rose, J.L. Ultrasonic Waves in Solid Media; Cambridge University Press: Cambridge, UK, 1999. [Google Scholar]
- Rose, J.L. A baseline and vision of ultrasonic guided wave inspection potential. J. Press. Vessel Technol. 2002, 124, 273–282. [Google Scholar] [CrossRef]
- Raghavan, A.C.; Cesnik, C.E.S. Review of guided-wave structural health monitoring. Shock Vibr. Dig. 2007, 39, 91–114. [Google Scholar] [CrossRef]
- Liu, Y.; Li, Y.; Liu, F.; Morii, M.; Hu, N.; Ning, H.M.; Wu, L.K. Monitoring of local plasticity using Lamb waves. Adv. Struct. Mater. Eng. 2015, 18, 339–352. [Google Scholar] [CrossRef]
- Herrmann, J.; Kim, J.Y.; Jacobs, L.J.; Qu, J.; Littles, J.W.; Savage, M.F. Assessment of material damage in a nickel-base superalloy using nonlinear Rayleigh surface waves. J. Appl. Phys. 2006, 99, 124913. [Google Scholar] [CrossRef]
- Sagar, S.P.; Das, S.; Parida, N.; Bhattacharya, D.K. Non-linear ultrasonic technique to assess fatigue damage in structural steel. Scr. Mater. 2006, 55, 199–202. [Google Scholar]
- Wan, X.; Tse, P.W.; Xu, G.H.; Tao, T.F.; Zhang, Q. Analytical and numerical studies of approximate phase velocity matching based nonlinear S0 mode Lamb waves for the detection of evenly distributed microstructural changes. Smart Mater. Struct. 2016, 25, 045023. [Google Scholar] [CrossRef]
- Breazeale, M.A.; Thompson, D.O. Finite amplitude ultrasonic waves in aluminum. Appl. Phys. Lett. 1963, 3, 77–78. [Google Scholar] [CrossRef]
- Kim, J.Y.; Jacobs, L.J.; Qu, J.; Littles, J.W. Experimental characterization of fatigue damage in a nickel-base superalloy using nonlinear ultrasonic waves. J. Acoust. Soc. Am. 2006, 120, 1266–1273. [Google Scholar] [CrossRef]
- Matlack, K.H.; Wall, J.J.; Kim, J.Y.; Qu, J.; Jacobs, L.J.; Viehrig, H.W. Evaluation of radiation damage using nonlinear ultrasound. J. Appl. Phys. 2012, 111, 054911. [Google Scholar] [CrossRef]
- Hurley, D.C.; Balzar, D.; Purtscher, P.T. Nonlinear ultrasonic assessment of precipitation hardening in ASTM A710 steel. J. Mater. Res. 2000, 15, 2036–2042. [Google Scholar] [CrossRef]
- Metya, A.; Ghosh, M.; Parida, N.; Sagar, S.P. Higher harmonic analysis of ultrasonic signal for ageing behaviour study of C-250 grade maraging steel. NDT E Int. 2008, 41, 484–489. [Google Scholar] [CrossRef]
- Xiang, Y.; Deng, M.; Xuan, F.Z. Creep damage characterization using nonlinear ultrasonic guided wave method: A mesoscale model. J. Appl. Phys. 2014, 115, 044914. [Google Scholar] [CrossRef]
- Hikata, I.A.; Elbaum, C. Generation of ultrasonic second and third harmonics due to dislocations. Phys. Rev. 1966, 144, 469–477. [Google Scholar] [CrossRef]
- Cantrell, J.H.; Yost, W.T. Acoustic harmonic generation from fatigue-induced dislocation dipoles. Philos. Mag. A 1994, 69, 315–326. [Google Scholar] [CrossRef]
- Cash, W.D.; Cai, W. Dislocation contribution to acoustic nonlinearity: The effect of orientation-dependent line energy. J. Appl. Phys. 2011, 109, 014915. [Google Scholar] [CrossRef]
- Cantrell, J.H. Substructural organization, dislocation plasticity and harmonic generation in cyclically stressed wavy slip metals. Proc. R. Soc. Lond. A 2004, 460, 757–780. [Google Scholar] [CrossRef]
- Cantrell, J.H.; Yost, W.T. Determination of precipitate nucleation and growth rates from ultrasonic harmonic generation. Appl. Phys. Lett. 2000, 77, 1952–1954. [Google Scholar] [CrossRef]
- Yost, W.T.; Cantrell, J.H., Jr.; Breazeale, M.A. Ultrasonic nonlinearity parameters and third-order elastic constants of copper between 300 and 3 °K. J. Appl. Phys. 1981, 52, 126–128. [Google Scholar] [CrossRef]
- Buck, O.; Morris, W.L.; James, M.R. Remaining fatigue life prediction in the initiation regime using SAW NDE. J. Nondestruct. Eval. 1980, 1, 3–9. [Google Scholar] [CrossRef]
- Bermes, C.; Kim, J.Y.; Qu, J.; Jacobs, L.J. Experimental characterization of material nonlinearity using Lamb waves. Appl. Phys. Lett. 2007, 90, 021901. [Google Scholar] [CrossRef]
- De Lima, W.J.N.; Hamilton, M.F. Finite-amplitude waves in isotropic elastic plates. J. Sound Vib. 2003, 265, 819–839. [Google Scholar] [CrossRef]
- Deng, M. Cumulative second-harmonic generation of Lamb-mode propagation in a solid plate. J. Appl. Phys. 1999, 85, 3051–3058. [Google Scholar] [CrossRef]
- Deng, M. Analysis of second-harmonic generation of Lamb modes using a modal analysis approach. J. Appl. Phys. 2003, 94, 4152–4159. [Google Scholar] [CrossRef]
- Deng, M.; Wang, P.; Lv, X. Experimental observation of cumulative second-harmonic generation of Lamb wave propagation in an elastic plate. J. Phys. D Appl. Phys. 2005, 38, 344–353. [Google Scholar] [CrossRef]
- Srivastava, A.; di Scalea, F.L. On the existence of antisymmetric or symmetric Lamb waves at nonlinear higher harmonics. J. Sound Vib. 2009, 323, 932–943. [Google Scholar] [CrossRef]
- Liu, Y.; Chillara, V.K.; Lissenden, C.J. On selection of primary modes for generation of strong internally resonant second harmonics in plate. J. Sound Vib. 2013, 332, 4517–4528. [Google Scholar] [CrossRef]
- Pruell, C.; Kim, J.Y.; Qu, J.; Jacobs, L.J. A nonlinear-guided wave technique for evaluating plasticity-driven material damage in a metal plate. NDT E Int. 2009, 42, 199–203. [Google Scholar] [CrossRef]
- Bermes, C.; Kim, J.Y.; Qu, J.; Jacobs, L.J. Nonlinear Lamb waves for the detection of material nonlinearity. Mech. Syst. Signal Process. 2008, 22, 638–646. [Google Scholar] [CrossRef]
- Li, W.; Cho, Y.; Achenbach, J.D. Detection of thermal fatigue in composites by second harmonic Lamb waves. Smart Mater. Struct. 2012, 21, 85–93. [Google Scholar] [CrossRef]
- Pruell, C.; Kim, J.Y.; Qu, J.; Jacobs, L.J. Evaluation of fatigue damage using nonlinear guide waves. Smart Mater. Struct. 2009, 18, 035003. [Google Scholar] [CrossRef]
- Nucera, C.; di Scalea, F.L. Monitoring load levels in multi-wire strands by nonlinear ultrasonic waves. Struct. Health Monit. 2011, 10, 617–629. [Google Scholar] [CrossRef]
- Zuo, P.; Zhou, Y.; Fan, Z. Numerical and experimental investigation of nonlinear ultrasonic Lamb waves at low frequency. Appl. Phys. Lett. 2016, 109, 021902. [Google Scholar] [CrossRef]
- Chillara, V.K.; Lissenden, C.J. Review of nonlinear ultrasonic guided wave nondestructive evaluation: Theory, numerics, and experiments. Opt. Eng. 2016, 55, 011002. [Google Scholar] [CrossRef]
- Matsuda, N.; Biwa, S. Frequency dependence of second-harmonic generation in Lamb waves. J. Nondestruct. Eval. 2014, 33, 169–177. [Google Scholar] [CrossRef] [Green Version]
- Shan, S.; Cheng, L.; Li, P. Adhesive nonlinearity in Lamb-wave-based structural health monitoring systems. Smart Mater. Struct. 2016, 26, 025019. [Google Scholar] [CrossRef]
- Broda, D.; Staszewski, W.J.; Martowicz, A.; Uhl, T.; Silberschmidt, V.V. Modelling of nonlinear crack–wave interactions for damage detection based on ultrasound—A review. J. Sound Vib. 2014, 333, 1097–1118. [Google Scholar] [CrossRef]
- Wan, X.; Zhang, Q.; Xu, G.; Tse, P.W. Numerical simulation of nonlinear Lamb waves used in a thin plate for detecting buried micro-cracks. Sensors 2014, 14, 8528–8546. [Google Scholar] [CrossRef] [PubMed]
- Shen, Y.; Giurgiutiu, V. Predictive modelling of nonlinear wave propagation for structural healthmonitoring with piezoelectric wafer active sensors. J. Intell. Mater. Syst. Struct. 2014, 25, 506–520. [Google Scholar] [CrossRef]
- Shen, Y.; Cesnik, C.E.S. Modelling of nonlinear interactions between guided waves and fatigue cracks suing local interaction simulation approach. Ultrasonics 2017, 74, 106–123. [Google Scholar] [CrossRef] [PubMed]
- Soleimanpour, R.; Ng, C.T.; Wang, C.H. Higher harmonic generation of guided waves at delaminations in laminated composite beams. Struct. Health Monit. 2016. [Google Scholar] [CrossRef]
- Soleimanpour, R.; Ng, C.T. Locating delaminations in laminated composite beams using nonlinear guided waves. Eng. Struct. 2017, 131, 207–219. [Google Scholar] [CrossRef]
- Dziedziech, K.; Pieczonka, L.; Kijanko, P.; Staszewski, W.J. Enhanced nonlinear crack-wave interactions for structural damage detection based on guided ultrasonic waves. Struct. Control Health Monit. 2016, 23, 1108–1120. [Google Scholar] [CrossRef]
- Zhao, Y.X.; Li, F.L.; Cao, P.; Hu, N. Generation mechanism of nonlinear ultrasonic Lamb waves in thin plates with randomly distributed micro-cracks. Ultrasonics 2017, 79, 60–67. [Google Scholar] [CrossRef] [PubMed]
- Rauter, N.; Lammering, R. Numerical simulation of elastic wave propagation in isotropic media considering material and geometrical nonlinearities. Smart Mater. Struct. 2015, 24, 045027. [Google Scholar] [CrossRef]
- Hong, M.; Su, Z.; Wang, Q.; Cheng, L.; Qing, X. Modeling nonlinearities of ultrasonic waves for fatigue damage characterization: Theory, simulation, and experimental validation. Ultrasonics 2014, 54, 770–778. [Google Scholar] [CrossRef] [PubMed]
- Liu, K.; Liu, W. Application of discrete element method for continuum dynamic problems. Arch. Appl. Mech. 2006, 76, 229–243. [Google Scholar] [CrossRef]
- Matlack, K.H.; Kim, J.Y.; Jacobs, L.J.; Qu, J. Experimental characterization of efficient second harmonic generation of Lamb wave modes in a nonlinear elastic isotropic plate. J. Appl. Phys. 2011, 109, 014905. [Google Scholar] [CrossRef]
- Deng, M.; Wang, P.; Lv, X. Experimental verification of cumulative growth effect of second harmonics of Lamb wave propagation in an elastic plate. Appl. Phys. Lett. 2005, 86, 124104. [Google Scholar] [CrossRef]
- Shui, G.; Wang, Y.-S.; Gong, F. Evaluation of plastic damage for metallic materials under tensile load using nonlinear longitudinal waves. NDT E Int. 2013, 55, 1–8. [Google Scholar] [CrossRef]
- Xiang, Y.; Deng, M.; Xuan, F.-Z.; Liu, C.-J. Experimental study of thermal degradation in ferritic Cr–Ni alloy steel plates using nonlinear Lamb waves. NDT E Int. 2011, 44, 768–774. [Google Scholar] [CrossRef]
- Cantrell, J.H. Quantitative assessment of fatigue damage accumulation in wavy slip metals from acoustic harmonic generation. Philos. Mag. 2006, 86, 1539–1554. [Google Scholar] [CrossRef]
- Han, Z.D.; Atluri, S.N. On the (Meshless Local Petrov-Galerkin) MLPG-Eshelby Method in computational finite deformation solid mechanics—Part II. Comput. Model. Eng. Sci. 2014, 97, 199–237. [Google Scholar]
- Atluri, S.N.; Kim, H.G.; Cho, J.Y. A critical assessment of the truly meshless local Petrov-Galerkin (MLPG), and local boundary integral equation (LBIE) methods. Comput. Mech. 1999, 24, 348–372. [Google Scholar] [CrossRef]
- Han, Z.D.; Atluri, S.N. Eshelby stress tensor T: A variety of conservation laws for T in finite deformation anisotropic hyperelastic solid & defect mechanics, and the MLPG-eshelby method in computational finite deformation solid mechanics-part I. CMES Comput. Model. Eng. Sci. 2014, 97, 1–34. [Google Scholar]
- Jensen, A.; Fraser, K.; Laird, G. Improving the precision of discrete element simulations through calibration models. In Proceedings of the 13th International LS-DYNA Conference, Dearborn, MI, USA, 8–10 June 2014. [Google Scholar]
- Karajan, N.; Han, Z.D.; Teng, H.; Wang, J. On the parameter estimation for the discrete-element method in LS-DYNA®. In Proceedings of the 13th International LS_DYNA Users Conference, Dearborn, MI, USA, 8–10 June 2014. [Google Scholar]
- Yost, W.T.; Cantrell, J.H. The effects of fatigue on acoustic nonlinearity in aluminum alloys. In Proceedings of the 1992 IEEE Ultrasonics Symposium, Tucson, AZ, USA, 20–23 October 1992; Volume 2, pp. 947–955. [Google Scholar]
- Jhang, K.Y. Evaluation of material degradation using nonlinear acoustic effect. Ultrasonics 1999, 37, 39–44. [Google Scholar] [CrossRef]
- Jhang, K.Y.; Kim, K.C. Application of nonlinear ultrasonics to the NDE of material degradation. IEEE Trans. Ultrason. Ferroelectr. Freq. Control 2000, 47, 540–548. [Google Scholar] [CrossRef] [PubMed]


| Material | E (MPa) | Poisson’s Ratio | Yield Stress (MPa) | |
|---|---|---|---|---|
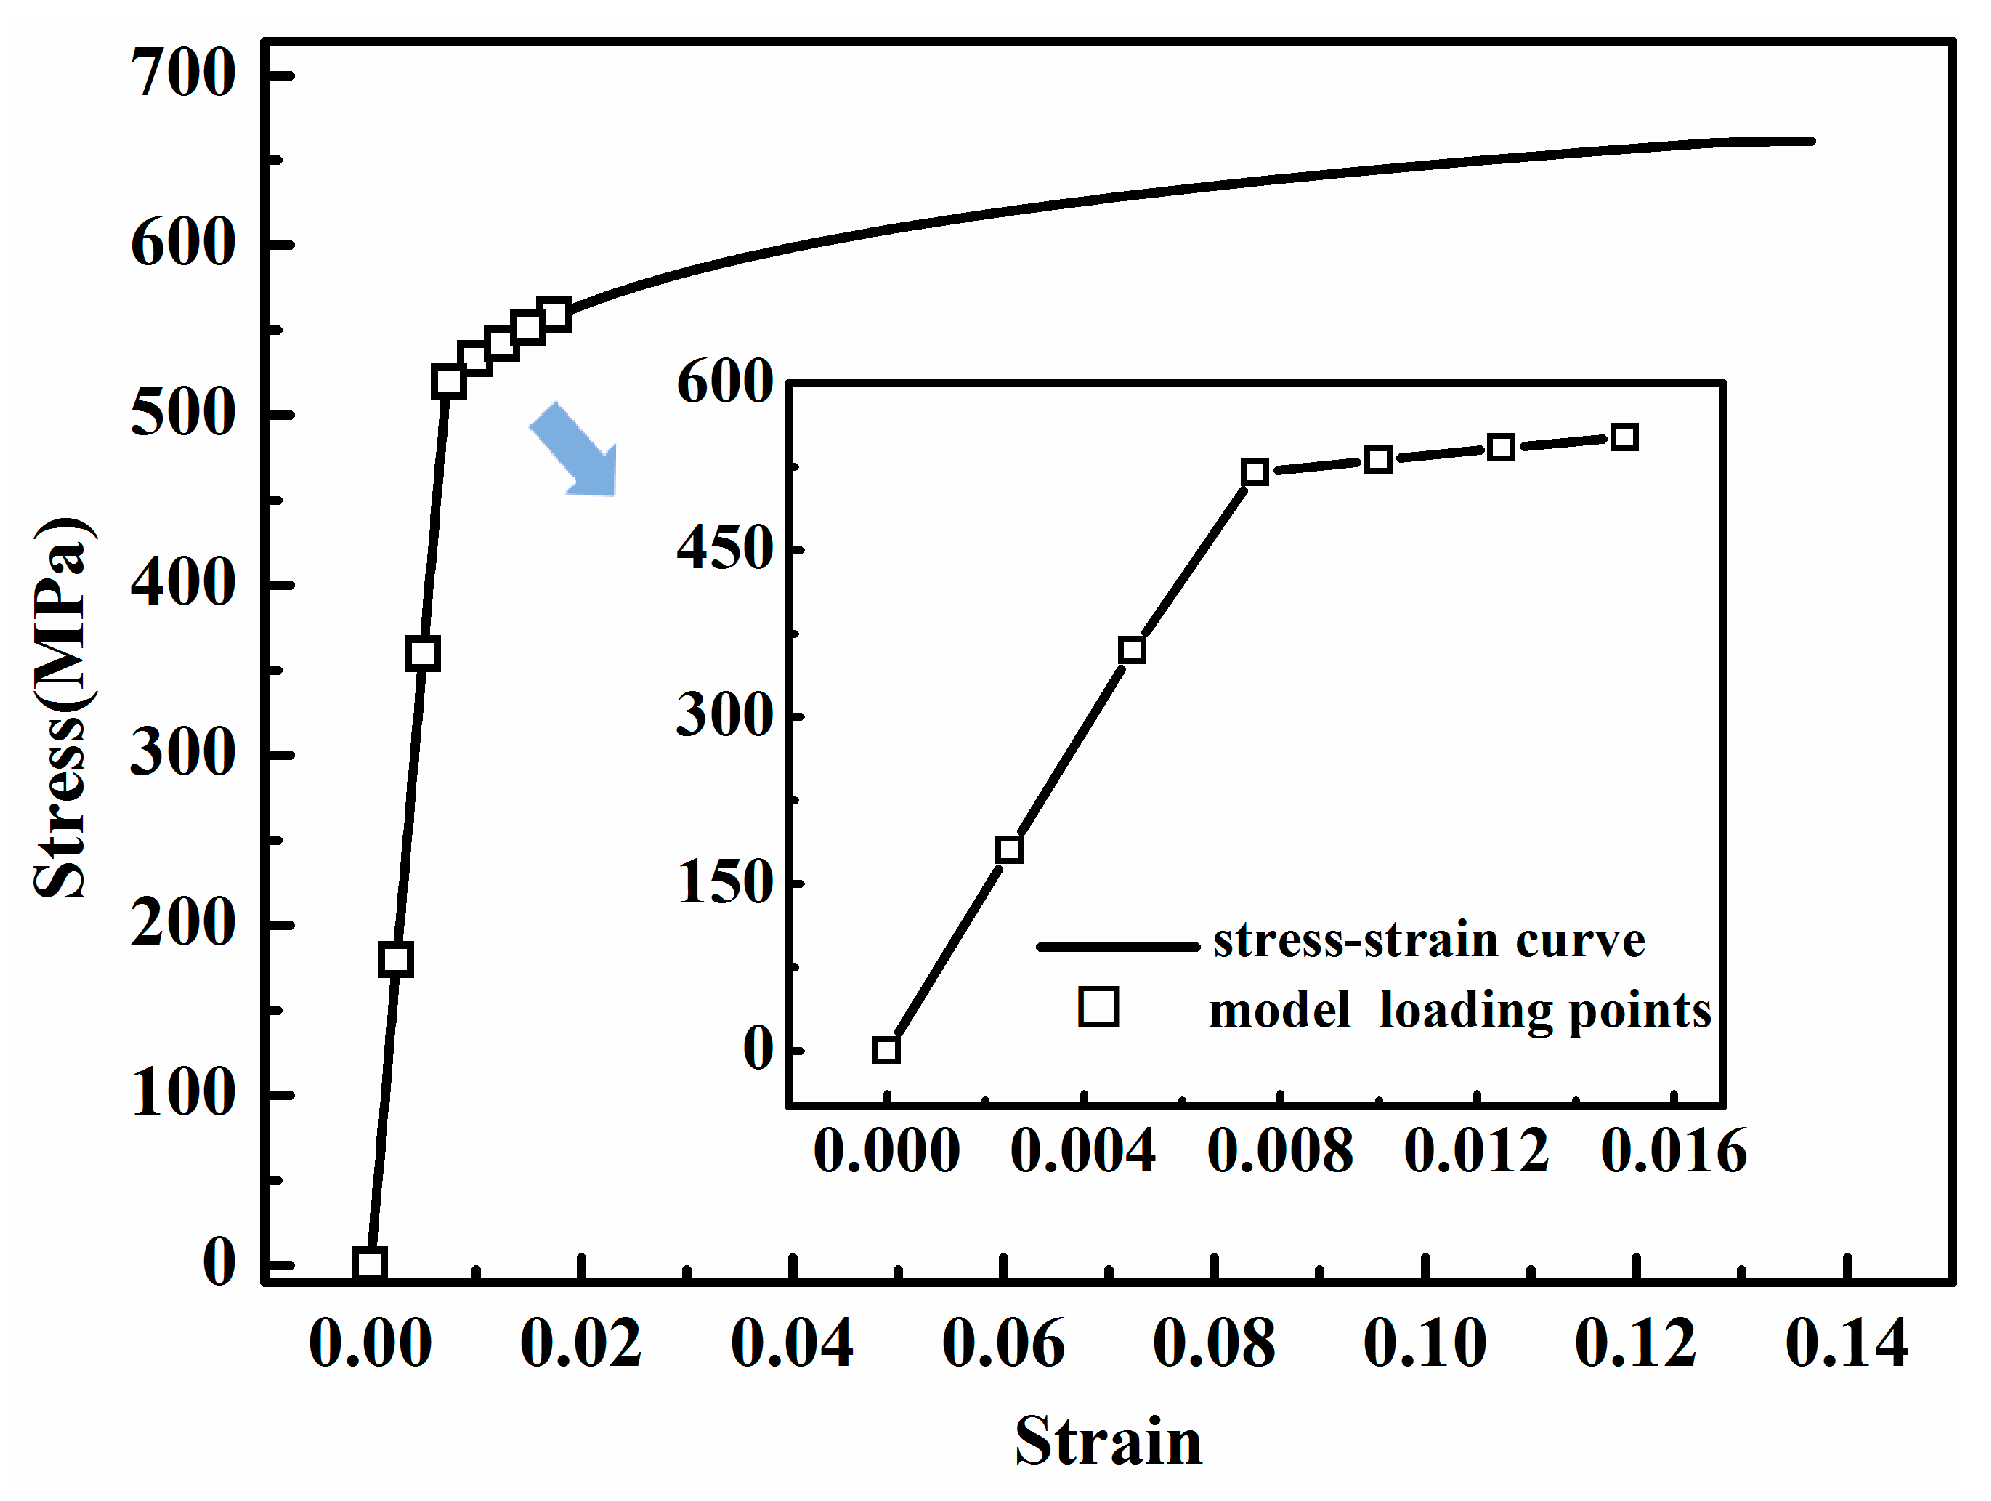
| Al 7075-T651 | 2.7957 × 10⁻³ | 7.1705 × 10⁴ | 0.33 | 517.84 |
| Mode Type and Frequency (kHz) | Theoretical Velocity (m/s) | Simulation Velocity (m/s) | Error (%) |
|---|---|---|---|
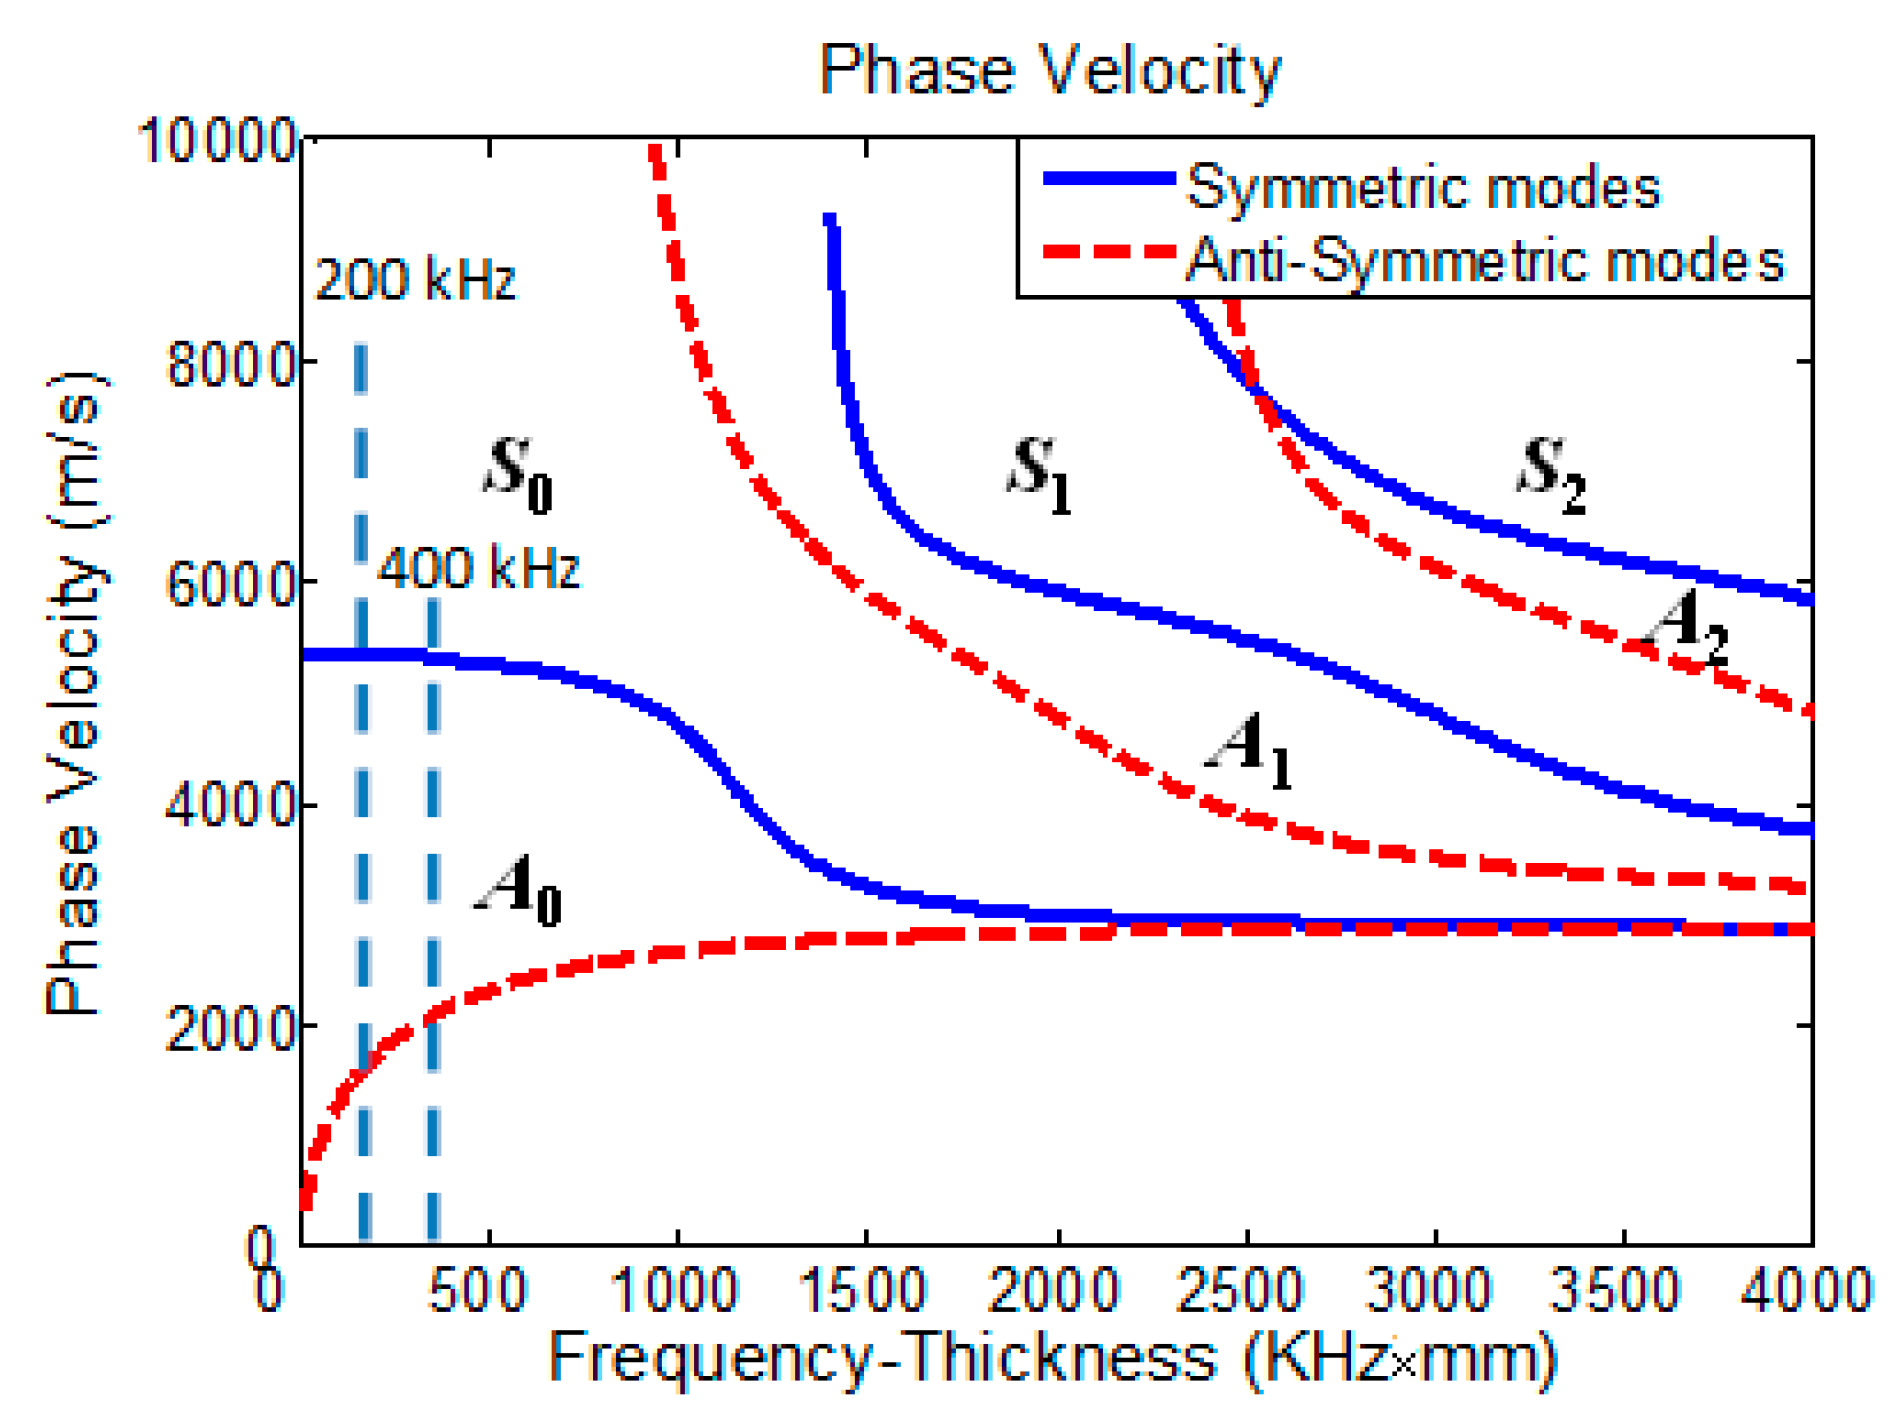
| S0 (100 kHz) | 5444 | 5263 | 3.32 |
| S0 (200 kHz) | 5437 | 5235 | 3.72 |
| A0 (100 kHz) | 1748 | 1707 | 2.35 |
| A0 (200 kHz) | 2283 | 2252 | 1.36 |
© 2017 by the authors. Licensee MDPI, Basel, Switzerland. This article is an open access article distributed under the terms and conditions of the Creative Commons Attribution (CC BY) license (http://creativecommons.org/licenses/by/4.0/).
Share and Cite
Sun, X.; Liu, X.; Liu, Y.; Hu, N.; Zhao, Y.; Ding, X.; Qin, S.; Zhang, J.; Zhang, J.; Liu, F.; et al. Simulations on Monitoring and Evaluation of Plasticity-Driven Material Damage Based on Second Harmonic of S0 Mode Lamb Waves in Metallic Plates. Materials 2017, 10, 827. https://doi.org/10.3390/ma10070827
Sun X, Liu X, Liu Y, Hu N, Zhao Y, Ding X, Qin S, Zhang J, Zhang J, Liu F, et al. Simulations on Monitoring and Evaluation of Plasticity-Driven Material Damage Based on Second Harmonic of S0 Mode Lamb Waves in Metallic Plates. Materials. 2017; 10(7):827. https://doi.org/10.3390/ma10070827
Chicago/Turabian StyleSun, Xiaoqiang, Xuyang Liu, Yaolu Liu, Ning Hu, Youxuan Zhao, Xiangyan Ding, Shiwei Qin, Jianyu Zhang, Jun Zhang, Feng Liu, and et al. 2017. "Simulations on Monitoring and Evaluation of Plasticity-Driven Material Damage Based on Second Harmonic of S0 Mode Lamb Waves in Metallic Plates" Materials 10, no. 7: 827. https://doi.org/10.3390/ma10070827