Performance of Poly(lactic acid) Surface Modified Films for Food Packaging Application


1
Department of Chemical Science, University of Catania, Viale A. Doria 6, 95125 Catania (CT), Italy
2
Interdepartmental Centre for Agri-Food Industrial Research, Alma Mater Studiorum, University of Bologna, Piazza Goidanich 60, 47521 Cesena (FC), Italy
3
Semenov Institute of Chemical Physics, Kosygin str. 4, 119991 Moscow, Russia
*
Author to whom correspondence should be addressed.
Materials 2017, 10(8), 850; https://doi.org/10.3390/ma10080850
Submission received: 30 June 2017
/
Revised: 17 July 2017
/
Accepted: 18 July 2017
/
Published: 25 July 2017
(This article belongs to the Special Issue Biobased Polymers for Packaging Applications)
Abstract
:Five Poly(lactic acid) (PLA) film samples were analyzed to study the gas barrier behavior, thermal stability and mechanical performance for food packaging application. O2, CO2, N2, N2O, and C2H4 pure gases; Air; and Modified Atmosphere (MA, 79% N2O/21% O2) were used to analyze the influence of the chemical structure, storage temperature and crystalline phase on the gas barrier behavior. The kinetic of the permeation process was investigated at different temperatures, ranging from 5 °C to 40 °C. Annealing thermal treatment on the samples led to the crystalline percentage, influencing especially the gas solubility process. Thermal properties such as Tg and χc, and mechanical properties such as tensile strength and modulus were remarkably improved with surface PLA modification. A more pronounced reinforcing effect was noted in the case of metallization, as well as improved gas barrier performance. Tensile testing and tensile cycling tests confirmed the rigidity of the films, with about a 20% loss of elasticity after 25 cycles loading.
1. Introduction
Currently, the high-technology treatments such as low-storage temperature and Modified Atmosphere Packaging (MAP) are commercially used to reduce the food respiration rate, delaying senescence, and, ultimately, increasing in the packaged food shelf-life [1,2] The main objective of this technology applied to the food preservation is the reduction of respiratory activity, delay in softening and ripening, reducing incidence of various psychological disorders and pathogenic infestations. MAP is used to alter, in a controlled way, the gaseous composition inside the package through passive or active kinetic mechanisms. Two processes are responsible for achieving this positive result: the respiration rate control of the food product and the gas transfer through the packaging material. Both phenomena are related to each other and depend on many factors, such as packaging structure, barrier thickness, gas pressure, and temperature. In particular, metabolic processes such as respiration rate, endogenous fermentation, and film permeability increase with the temperature. Therefore, when selecting an appropriate packaging material, among different characteristics (material flexibility, machinability, clarity, durability, resistance to chemical and thermal degradation, etc.), the gas barrier feature is one of the most important for food application.
The main permeates used in MAP technology are O2, CO2 and N2, at different levels. The O2 concentration is responsible for the food respiration rate. The decrease in food respiration rate delays enzymatic degradation, extending the shelf-life of the product. However, if an excessively low O2 level occurs, tissue deterioration could develop, leading to off-flowers and off-odors production [2]. CO2 confers a significant level of antimicrobial influence on the food packaged. The CO2 influence was well explained by Farber [3] in his review. N2 is an inert gas used for mimicking completely the inside package atmosphere, preventing also the film collapse. In his review, Caleb [2] has comprehensively summarized selected review publications on MAP progress applications.
Recently, there has been a great interest in the potential benefits of other non-conventional gases such as the noble gases (Ar, He, and Xe) and nitrous oxide (N2O) [4]. Although these gases have been successfully used to preserve vegetables and fruit, their commercial use requires further coherent research. Several studies have found that they exert an effect on the metabolic activity of various vegetables through unknown mechanisms. As reported by Rocculi [5], inconsistent results have been achieved by Ar inhibition and control of degradation reactions in perishable fruit products. Silveira [4] deals with the inability of this gas to inhibit the microbial growth in fresh products such as broccoli, lettuce and arugula. Ar acts selectively enhancing the diffusion of gases such as CO2 and C2H4 from plant tissue rather than N2. Similarly, He increases the O2 diffusion, reducing the risk of fermentation. N2O, a “new packaging” gas allowed for food use in the EU, seems to perform well by reducing the fruits and vegetables tissue respiration and ripening, inhibiting the ethylene synthesis, prolonging the shelf-life of Modified Packaged (MP) fresh food, and increasing the storage life [4,5]. Regarding the C2H4 gas, until now no data exist in the literature on the barrier behavior of packaging plastics films. However, this gas promotes the enzymatic activities, softening and ripening of fresh food such as cut fruit and vegetables. It is responsible for increased chlorophyllase activity that causes chlorophyll destruction and its conversion to the olive brown pheophorbide, with changes in chromatic characteristics of the vegetable tissue [5]. In order to prevent the accumulation of this gas inside the package, an ethylene absorbent could be used, but knowing the polymer gas barrier performance with C2H4 at different storage temperature could be a good further alternative to maintain the quality of packed food [5].
In the last fifteen years, particular interest and attention have been paid to the polylactic acid polymer (PLA), especially when it is used as packaging materials for products being sensitive to environmental conditions, such as food or pharmaceutical goods [6,7,8,9,10,11]. PLA is the most commercial biodegradable polymer, showing the advantage to easy change and tailoring its physical and mechanical properties by simply changing the chemical composition (amount of d- and l-isomer) and the processing conditions. Hence, different methods have been suggested in order to improve its chemical-physical performance. Concerning the barrier behavior, in respect to the synthetic polymers, it shows a high gas transmission that renders this polymer not suitable for several food packaging applications. To improve the gas barrier characteristics, the surface polymer modification such as coating and metallization could be performed [12,13]. Especially, the barrier properties and the tensile strength can be improved by applying such operations [10]. Generally, metallization is used to enhance the barrier characteristics and, in addition, to provide an essentially total light screen [12]. The transport phenomena background followed in this work is well described in the literature, with a comprehensive description of the mathematical equations and corresponding interpretation [14,15].
The general aim of this investigation is to study the effect of the use of conventional and non-conventional gas and gas mixture on the barrier performance under different storage temperature, for the biodegradable material, PLA. Specifically, we used five modified and unmodified PLA films:
- -
- to evaluate the principal parameters of gas transmission rate (GTR) such as solubility (S), diffusivity (D) and time lag (tL) for several penetrants, namely atmospheric gases (O2, CO2, and N2), unconventional gases (N2O and C2H4), and gaseous mixes (Air and Modified Atmosphere (MA));
- -
- to analyze the correlation between PLA film structure and gas type used in the experiment;
- -
- to assess the temperature dependence of GTR and perm-selectivity coefficients through the determination of the corresponding activation energies; and
- -
- to correlate the PLA barrier behavior with its thermal and mechanical properties including cyclic stress-strain measurements.
2. Results and Discussion
2.1. Barrier Behavior
Gas transmission in polymer materials depends strongly on the polymer structure, on the gas type, as well as on the temperature. The theoretical models that have been proposed and reported in the literature [16,17] describe the transport mechanism of molecular species in polymers by diffusion, involving a temperature-dependent diffusion coefficient. However, it should be observed that it is not easy to identify this dependency exactly and to provide exact information on both the diffusion coefficient and the solubility coefficients, in particular under real condition [18,19,20]. Therefore, in-depth analyses of the relationship between such parameters are needed to get the best market solution and to enable better understanding of the underlying transport phenomenon that occur in real conditions. The primary mechanism for gas flow through a film or coating is an activated diffusion. This means that the permeate dissolves in the film matrix at the higher concentration side, diffuses through the film, driven by a concentration gradient and evaporates from the other surface. Differences in the solubility of specific gases may influence the diffusivity of gases across the film. The second step of the permeability phenomenon, the diffusion, depends on the size, shape and polarity of the penetrating molecule of the permeant and on the crystallinity, degree of cross-linking and polymer chain segmental motion of the polymer matrix. Permeability of polymers to an organic compound or water is presented using the Gas Transmission Rate (GTR), which is in common use as well just reported in literature [12,21,22].
In our work, we correlate the GTR values of five PLA films with the main influencing factors such as temperature, gases and chemical structure. GTR values (cm3/cm2 d bar), together with Solubility S (cm3/cm2 bar), Diffusivity D (cm2/s) and time Lag tL (s), were recorded for pure gases, Air and MA, together with thickness (in micron) and perm-selectivity ratio. In Table 1 are reported all the collected data recorded with O2 gas test, at 23 °C, while in Table 2 are reported the corresponding perm-selectivity data, recorded with all gases used in the experiment and at all temperature investigated (the value recorded at 23 °C is in bold style to be used as standard value).
Perm-selectivity values represent the permeability ratio of different permeants As reported by Schmid et al. [23], for many polymers, this ratio is in the range 1:4:16 (N2:O2:CO2). The calculated perm-selectivity ratios are shown in Table 2. The results are very different from the simplified ratio. These data are useful because they give the possibility to determine the unknown GTR data, knowing the GTR value of another gas. For example, obtaining the CO2 GTR data is enough to multiply the O2 GTR data for the corresponding perm-selectivity ratio, at the desired temperature. It will be an error to use the tabulated values present in the literature because it was scientifically demonstrated that the perm-selectivity ratio are not constant for every type of polymer materials but it changes depending on several factors, first of all the chemical structure and experimental temperature [23,24,25].
As expected, the surface modification effectively retarded the transport of gas molecules through the PLA matrix, resulting in a substantial decrease in GTR value. PLA samples with larger amount of oxygen-containing functional groups were found to yield more prominent improvement in barrier performance, giving rise to better compatibility with PLA resins, ultimately resulting in effective suppression of gas molecule permeation through the films.
CO2 and N2O gases were more permeable through the polymer film, with respect to O2 and N2, despite their different molecular diameters being larger than of for oxygen and nitrogen molecules. The C2H4 gas transmission is quite low, very similar to the N2 gas. GTR behavior in a modified atmosphere (Air and MA) is instead strictly dependent from the superficial treatment of the PLA film. It is well known that the mechanisms that drive the adsorption/desorption permeability, solubility and diffusion phenomena are all closely dependent on the temperature [21,22] so, as expected, temperature has a considerable influence on the transmission of the gas through the material. Considering polymeric film, which performs optimally at a given temperature, may increase/decrease the rate of food respiration or material permeability at a higher/lower temperature, it is important to understand the PLAs gas barrier performance under a range of temperature generally used for food storage. In fact, limited information is still available on most film’s permeability properties at varying storage temperature, as well as on the ability of the polymeric film to withstand mechanical stress during storage and transport. Gas transmission behavior was then described in detail.
In Figure 1 GTR data for PLA30 and PLA40 films obtained at different temperature and for various gases are reported.
Both samples have differences in thickness and crystalline percentage, therefore their barrier characteristics differ each other due to change in the gas diffusion pathway and the amorphous state in the intercrystalline area of PLA films. For the PLA30 specimen, the transport of CO2 and N2O has a similar behavior, however N2O is characterized by higher gas transmission in comparison with CO2. If compare the transfer rates of principal atmospheric gases, such as O2 and N2, the former has essentially higher GTR than the latter. Additionally, it is worth noting that C2H4 exhibits GTR values practically similar to the N2 values. Especially, the difference in transport behavior is noticeable for the modified atmospheric composition of the gases (MA). In this situation, the temperature dependences of GTR for both PLA samples displays the different forms, namely the curve with a sharp inflection point at 30 °C for PLA30 and the monotonic temperature curve for PLA40. Besides, Figure 1 shows that the MA-GTR values are close to the O2 values in whole temperature interval for the PLA40 film but for the PLA30 film the given proximity occurs only by 23 °C. The analogous comparison between MA and N2 permeabilities shows that, for both specimens, while for N2 the analogous behavior is observed at T < 23 °C and only for the PLA40 film. Qualitatively, the analogous domination in MA-GTR is observed for N2O transferring. The next step in estimation of gaseous mix behavior represents the measuring of air permeability. In Figure 1b, the transfer behavior of air is reported as: Air1 (the first 10 minutes of GTR measurement) and Air2 (after 10 minutes of GTR measurement). In other words, there are short and long terms of measurement. In Figure 1b, Air1-GTR values for the PLA40 film are increased until 23 °C. The Air2-GTR values reach constant values similar to N2 and MA, respectively. The quantitative description of MA transport and its comparison with the single gas transport seems to us extremely important because similar modeling brings above results closer to the real conditions when using eco-friendly PLA packaging.
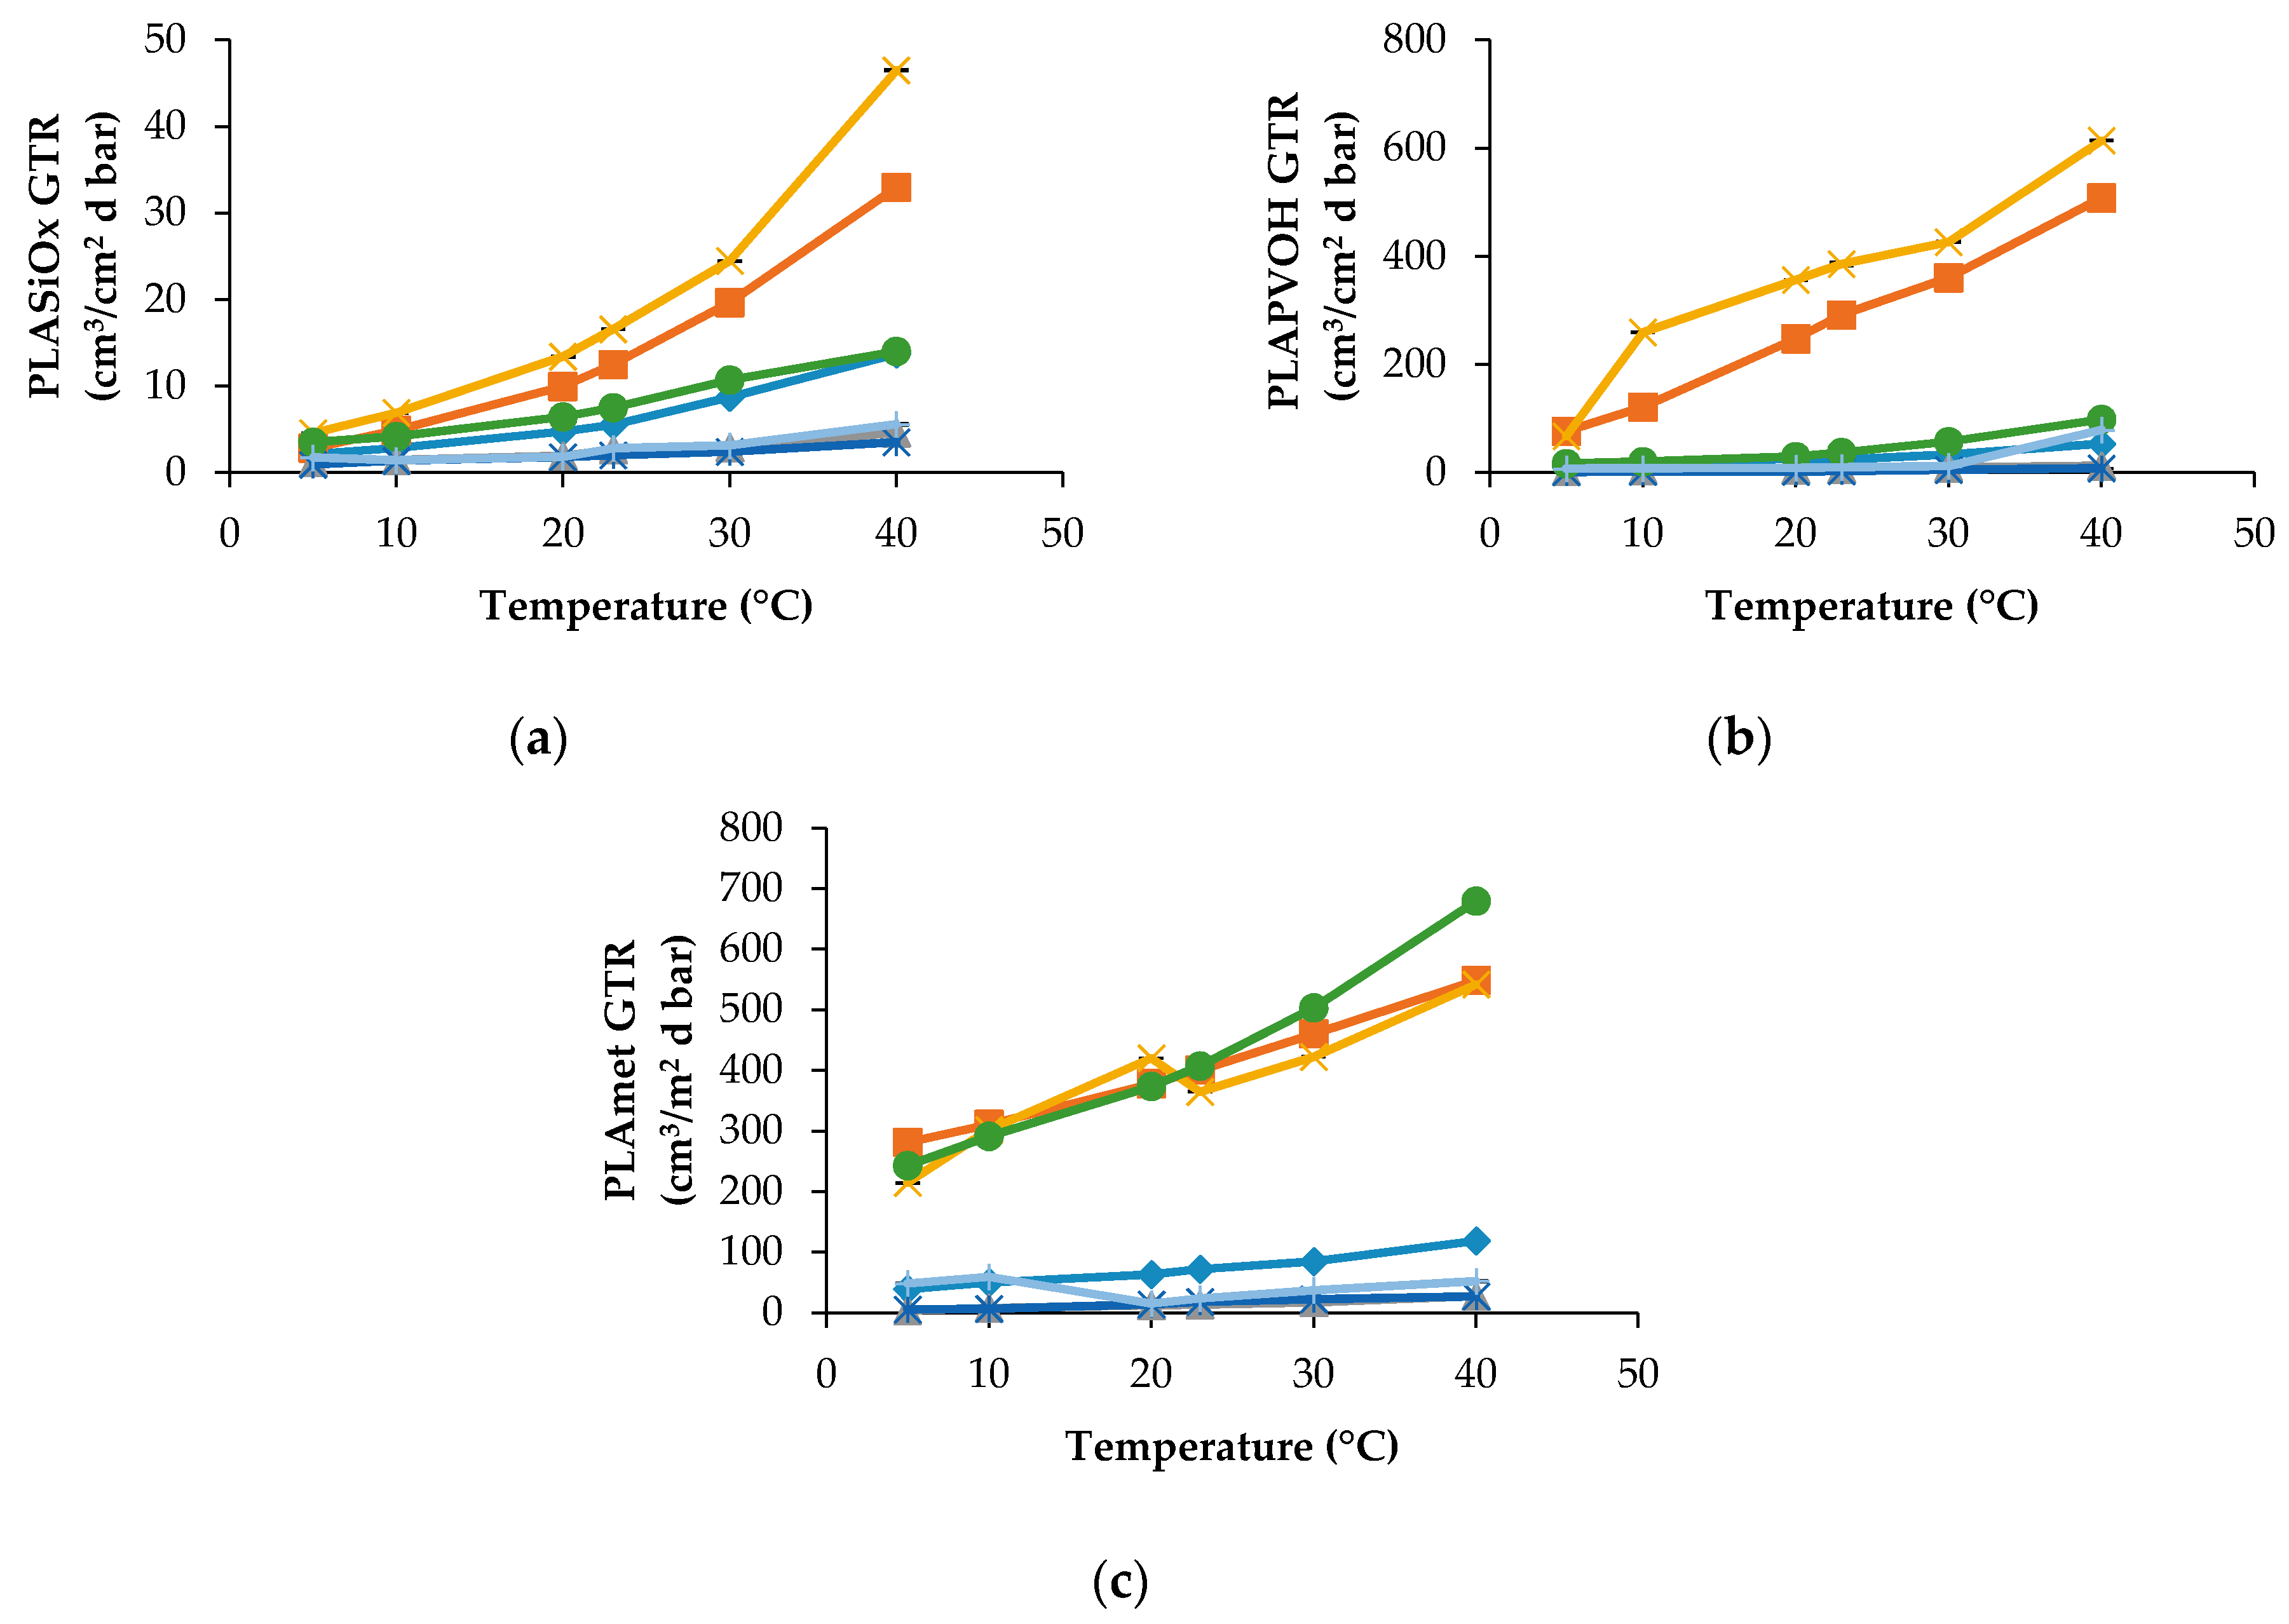
PLA modified films show a very different trend. As can be observed in Figure 2a, the PLASiOx specimen displays the best barrier characteristics for all penetrants including the pure gases and MA.
At all temperatures, the gaseous mixtures, such as MA and Air, have trends and GTR values that are quite close to O2 GTR and N2 GTR, respectively. Even when the multicomponent penetrant is applied, its transport phenomenon could be approximated by a simple gaseous penetrant what facilitates the prognosis of barrier properties of biopolymers.
PLAPVOH film shows a dual behavior, being dependent on the chemical nature of gaseous penetrant. CO2 and N2O show the higher GTR value relatively to the other gases (C2H4, N2 and O2) and modified atmosphere (Air and MA). Analogous results were obtained for N2 gas and Air at all temperatures, while a small GTR difference was observed between O2 gas and MA atmosphere at temperatures up to 20 °C.
PLAmet showed a different behavior. GTR recorded for CO2, N2O and MA demonstrate the same tendency with higher recorded value, while GTR data obtained for C2H4, O2, N2 and Air are characterized by lower GTR value.
In general, superficial treatment lowered the GTR value, especially when SiOx was used as a coating.
The D, S and tL data were recorded for PLA30, PLA40 and PLAmet samples, but not for all gases and temperature employed in the experiment. For PLAPVOH, it was possible only with CO2 and N2O gases, while, for PLASiOx, no data were recorded because it was not possible to fit the slope of the linear portion of the GTR curves [26]. The D, S and tL are reported in Figure 3 and Figure 4 for PLA30 and PLAmet, respectively.
The other data recorded for the other samples were not reported for the sake of simplicity.
The D value, correlated to the kinetic parameters, showed a similar trend for all gases. This means that the diffusion was the same into the film for all tested gases and gas mixture. PLA coated films showed a high barrier behavior because of a very low diffusion coefficient. The surface modification decreased the gas transmission through the films thanks to the reduction of the gas diffusion [13,27].
The effect of temperature on the solubility coefficient differs depending on the chemical structure of penetrant. S values of used gases increased according to the following order: N2 < O2 = Air = MA < CO2 < N2O, in the range of temperature investigated. The oxygen-containing composite molecules of gases (N2O and CO2) have higher thermodynamic affinities to the polymer segments with the ester groups. Simultaneously, the lowest equilibrium solubility and, respectively, the small thermodynamic affinity belongs to N2 and O2 molecules. The intermediate position is occupied by the gas mixtures on the base of molecular oxygen enriched with molecular nitrogen (MA) and Air. Thus, the gas permeability of the PLA films as the product of the diffusion mobility and solubility determined by the size of the diffusing particles (on the kinetic level) and the gas equilibrium sorption in polymer (on the thermodynamic level). The latter is necessary for the determination and recording of the boundary conditions for a correct solution of a Fick diffusion equation and gives its own independent contribution to the overall gas transport.
According to a widely known classical diffusion–solubility model [26,27] of gas permeability through polymer films and membranes, gaseous penetrant solubility determine the mathematical border conditions of the principal diffusivity equation (Fick’s diffusivity) describing the diffusion impact upon gas permeation. Furthermore, the GTR is generally determined by the product of gas diffusivity (D) by its coefficient solubility (S). Therefore, gas solubility evaluation in PLA and PLA modified films with different crystallinity and morphology provides the key information on barrier characteristics so essential for packaging.
The tL values as the basic experimental parameters required for gas diffusivity evaluation correlate with the GTR values: as GTR meanings are increased, tL meanings are decreased in accordance with the relation
where L is the film thickness, k is the numerical coefficient reflecting the dimension of GTR, and S is gas coefficient solubility. For PLA30, the tL values are decreased with temperature increasing from the highest values at 5 °C from ~1350 s to ~750 s for CO2 and N2O, respectively, to the lowest ones at 40 °C for the same gases. The tL values of O2, N2, Air and MA have a sufficiently weak trend of decrement ranging from 85 s to 40 s, from 216 s to 145 s, from 269 s to 154 s and from 33 s to 22 s, respectively. Analogous tendency is observed for the PLA40 specimen where the highest values were recorded at 5 °C for CO2 (780 s), for N2 (700 s) and for N2O (1650 s). For O2, Air, and MA the tL decrease is observed as well, when the corresponding values range from 211 s to 97 s, from 60 s to 29 s, 106 s to 84 s, respectively. For PLAPVOH, the highest value was observed at 5 °C for CO2 (1852 s) and N2O (2629 s). For PLAmet, the highest value was recorded at 5 °C for CO2 (420 s), for N2O (546 s), while, for O2, Air and MA, were quite constant, ranging from 62 s to 26 s, from 77 s to 69 s, from 82 s to 59 s, respectively.
tL = kL2S/6[GTR],
2.2. Activation Energy of Gas Transport Process
In order to describe the permeation dependence to the temperature, the Arrhenius model was utilized to calculate the activation energy for gas transmission (EGTR), heat of solution (HS) and diffusion (ED) processes. The mathematical relations used are well described in the related scientific literature [15,19,23]. The activation energy is obtained by calculating the value of the slope (−Ea/R) of the Arrhenius equation, where R is the gas constant (8.314 J/mol K). Natural logarithmic (ln) of GTR, S and D compared with reciprocal of the absolute temperature (1/T) were reported as an example in Figure 5 for PLA30, together with the indication of the calculated linear regression of the corrected experimental points fittings.
Table 3 and Table 4 contain the corresponding energy characteristics such as activation energies for the gas transmission rate (EGTR), the specific heat of gas solution (HS) and activation energy of gas diffusivities (ED) in the temperature range of 5 °C–40 °C.
As can be observed, the data satisfactory fitted the theoretical relation with the high values of regression coefficient (R2) that indicates a good linear correlation between permeability and reciprocal temperature for all simple gases. Practically all individual gases and mixes, excluding Air-PLAmet system, have the negative slopes of the semilogarithmic temperature function of GTR that correspond to the positive meanings of EGTR for both pristine and modified PLA films (see the respective data in Table 3 and Table 4).
The corresponding EGTR characteristics have the highest values for N2O and CO2 gases containing oxygen in the molecular formula as compared with the permeability characteristics of unpolarized gas molecules such as C2H4, N2 and O2. When the gaseous mixes such as Air and MP are used, different tendencies for GTR, S and D are observed, depending on the way of modification of PLA. For the solution and diffusion coefficients some deviations were observed. According to N2O and CO2 gas test data, the solubility increased with the temperature while N2 and O2 solubilities were almost constant. Simultaneously, for MA and Air, there is not the linear trend that confirms the difficulty in measuring the permeability of modified atmosphere as the multicomponent medium.
Generally speaking, gas solubility is the parameter correlated to the polymer composition so this trend is a confirmation that the gases interact differently with the matrix. From low to high temperature, the lnS value shifts with a scissors trend, and the corresponding HS shows a fluctuating value, positive for N2O and CO2 gas test and negative for the others, comprising Air and MA. LnD shows a standard behavior with all gases and mixture, thus meaning that the diffusion was the same for the tested gas, despite the different solubility. Consequently, ED shows a positive value for all pure gas tests but not for modified atmosphere (Air, MA). Similar results were recorded for the PLA40 and PLAmet samples. For PLASiOx sample, no S and D data were recorded, while, for PLAPVOH sample, only few data with CO2 and N2O gases were recorded (data not reported for the sake of simplicity). As it is well known from the literature [28,29,30], high activation energies imply more sensitivity to temperature variation. The permeation process is very well correlated to the temperature variation, while the sorption/diffusion process shows consistent deviation, more correlated to polymer structure. Further, the corresponding selectivity ratio shows different value depending on the temperature, confirming that also this parameter is not a constant and is correlated not only with the chemical structure of the materials, but depends also from the (analysis) temperature. Values were reported in Table 2. The behavior could be explained with the crystalline percentage calculated after annealing of the sample. As the crystalline phase increased, the EGTR and ED increased while the HS decreased. It means that, if the gas transmission increases (less barrier behavior), the solubility increase (major interaction with the polymer matrix) and the diffusivity decrease (the gas molecules spend less time in moving inside the polymer matrix). Consequently, if EGTR decrease (less energy required for the gas transmission process), HS decrease (the gas solubility is enhanced) and ED increase (more difficult by the gas molecules to move inside the polymer matrix). This trend varies with gas and temperature and underlain the importance to perform the determination of the barrier characteristics at different storage temperature.
2.3. Thermal Behavior
Samples have been stored at ambient temperature for 30 days in order to provide the same heat treatment for all the samples investigated, erasing their previous thermal history. In order to calculate the PLA crystalline degree in percentage, the following formula was used: xc = 100 ((ΔHm − ΔHc)/ΔHm*), where ΔHm is the fusion enthalpy calculated from the experimental DSC curve, ΔHc is the crystallization enthalpy calculated from the experimental curve as well, and ΔHm* = 93 J/g is the fusion enthalpy for the entirely 100% crystalline PLA [13]. The corresponding Differential Scanning Calorimetry (DSC) curves for the neat and surface-modified specimens of PLA are represented in Figure 6. Using these experimental data, the principal thermal transition characteristics are collected in Table 5.
Tg value was not observed from the first heating run due to the presence of the crystalline phase, the corresponding calorimetric traces characterized by a conspicuous melting endotherm. Although PLA is an ideal polymer for environmental application, it has some disadvantages such as high crystallinity and consequently high brittleness, at ambient temperature. This Tg was relatively weak and difficult to determine. Furthermore, it can be seen from the first heating run that the PLA film is a multilayer material, showing a first transition phase, represented by two endothermic peaks, corresponding to the fusion of the polymer substrate material on which PLA is added [13]. The first two Tm values, represented by endothermic phenomena, are so correlated to the substrate polymer film behavior and are recorded in the range where the Tg is detected. In order to detect the Tg, an amorphous polymer was obtained by rapid cooling from the melt. In this case, during the second heating run, a consistent transition was detected, associated to the glass-to-rubber transition, with the corresponding Δcp value, with a small endothermic peak corresponding to a residual crystalline PLA, with a Tm value slightly higher due to more perfect crystallites.
As can be observed, the Tg value varies from 54 °C to 58 °C and the melting temperature is in the range from 145 °C to 150 °C value, in accordance with the results reported in literature [29]. To determine the possible change in PLA crystallinity during the gas transfer measurements, the DSC curves were recorded for the samples being stored for a different time. Under isothermal conditions, the storage time was chosen on the base of GTR measurement duration, namely from 1 h to 4 h (see Table 6). Crystallinity percentage for the uncoated and coated films is weakly dependent on the temperature of gas permeability, while the way of surface modification alters the PLA crystallization by about 30%. After quenching and DSC rescanning, the degree of crystallinity was very small evidencing the low ability of PLA to recrystallize during cooling, except for PLA metallized sample. As reported also from Kim and Choi on its paper on PLA/graphene films [30], modification of neat PLA matrix was found to increase the Tg value. Such a reinforcing effect in the thermal property may be ascribed to the reduced mobility of PLA chain molecules in the modified materials, resulting from the interaction between the surface ester groups of the polymer molecules and the groups of modifying layer. Similar results have likewise been reported for a number of nanocomposites incorporated with various nanofillers such as nanosilica particles, nanoclays, cellulose nanofiber and graphene nanosheets [30,31,32,33,34,35], and PLA blend with other polymers (biodegradable or not) [11]. It should be noted that the metallization led to a more substantial increase in Tg of the PLA composite, compared to neat PLA, because the metallization could yield more interaction between the two phases, leading a more homogeneous composite material. As regards crystallization behavior, the χc of PLA in the modified films was revealed to slightly change with the exception of the metallized PLA. It could be seen that the incorporation of a metallized layer led to a remarkable increase in χc. The aluminum incorporated into the PLA matrix may be considered as extraneous nucleating agents promoting the crystallization rate, and thus yielded the noticeable improvement in the degree of crystallinity for PLA film. Additionally, the PLA metallized exhibited a more pronounced effect on the crystallization behavior compared to the other films, which may be associated with uniform dispersion in the PLA matrix. The crystallization process acceleration caused by the incorporation of fillers has also been reported in a variety of crystalline polymer-based nanocomposites [36,37].
In order to understand if during the gas barrier measurements, performed at different temperature, the crystallinity of the sample changed, influencing consequently the barrier behavior measurements, DSC scans were recorded after 1 h to 4 h of sample maintained in isothermal conditions (annealing treatment) at different temperatures. The isothermally keeping time of the samples was chosen considering the time required to obtain a representative GTR curve in its equilibrium state (steady state), with the different gases and at different temperatures. Data recorded are reported in Table 6.
As can be observed, a different crystalline percentage was recorded, confirming that temperature plays a key role in the final performance of the tested films. The crystallinity changes are different, depending on the PLA film type. The influence of change into the crystalline/amorphous phase was much more evident in the solubility coefficient value (S). Therefore, the influence of the annealing on the thermal properties of the PLA films can be summarized as follows:
- (1)
- Annealing was responsible for an increase or decrease of the crystallinity compared to that of raw material. On the other hand, melting temperature and shape of the melting endothermic signal do not seem to be influenced by the annealing.
- (2)
- After the second heating run, a higher tendency to crystallize was recorded for the samples. Similar conclusion was obtained by Carrasco and collaborators [38] on their thermal and mechanical study on the processed poly(lactic acid). In addition, glass transition temperature was approximately the same for raw and annealed materials (Tg = 54−58 °C; Δcp = 0.5−0.6 J/g °C), determined during the second heating scan. The mid-point Tg value was not affected by an increase of the crystalline fraction, which act as a physical entanglement, limiting the molecular mobility of amorphous zones. A broadening of the melting transition signal was thus recorded.
- (3)
- A visible cold crystallization exothermic signal was recorded only for annealed samples.
- (4)
- Endothermic shoulder located at about 140 °C was recorded for annealed samples, attributed to a lamellar population generated during heat treatment.
- (5)
- No detectable change in opacity of the films was detected after annealing.
2.4. Mechanical Behavior
Food packaging applications put specific demands on the properties of the materials. Besides barrier behavior, the mechanical characteristics such as modulus and elasticity of the material are of decisive importance for the suitability of the materials as packaging. To provide insight into the mechanical properties of the PLA polymer films, tensile measurements and cycling loading tests were performed, to assess the extent of mechanical reinforcement resulting from the surface modification of PLA resin. The results of tensile testing are summarized in Table 7.
In general, the tensile modulus as a measure of stiffness is improved at the expense of elongation representing the degree of ductility when the reinforcing particles are incorporated into the polymer matrix. In this study, the surface modification of PLA film also caused the decrease in elongation at break of the resultant films, but the extent of reduction was revealed to be slight for PLASiOx film, which may be attributed to easily deformable nature of this molecule in polymer matrix. The extent of reduction was instead remarkable when the PLA film was modified by PVOH and metallization. The tensile properties of elongation at break for the PLASiOx and PLAmet films were measured to very low, demonstrating a low level of ductility. Based on sustainability of elongation property after the surface modification of PLA resins, it is believed that the films analyzed in this study may be utilized for the application of practical packaging film where a required proper level of ductility must be well-defined. All PLA films showed anisotropic behavior, with a lower tensile strength and Young modulus in the MD direction than in the CD direction.
In particular, although PLA40 is thicker than PLA30, it shows less mechanical strain due to the less crystallinity percentage, with a consequently higher elasticity. For the three other samples, an increase of E modulus, together with σy and σM was recorded, showing a strain hardening, induced by an increase of the crystalline portion and by the surface treatment. PLAPVOH and PLA metallized showed the highest tensile strength due to their higher crystallinity. In the same samples, σB is lower than σM, showing defect on the chemical microstructure [39].
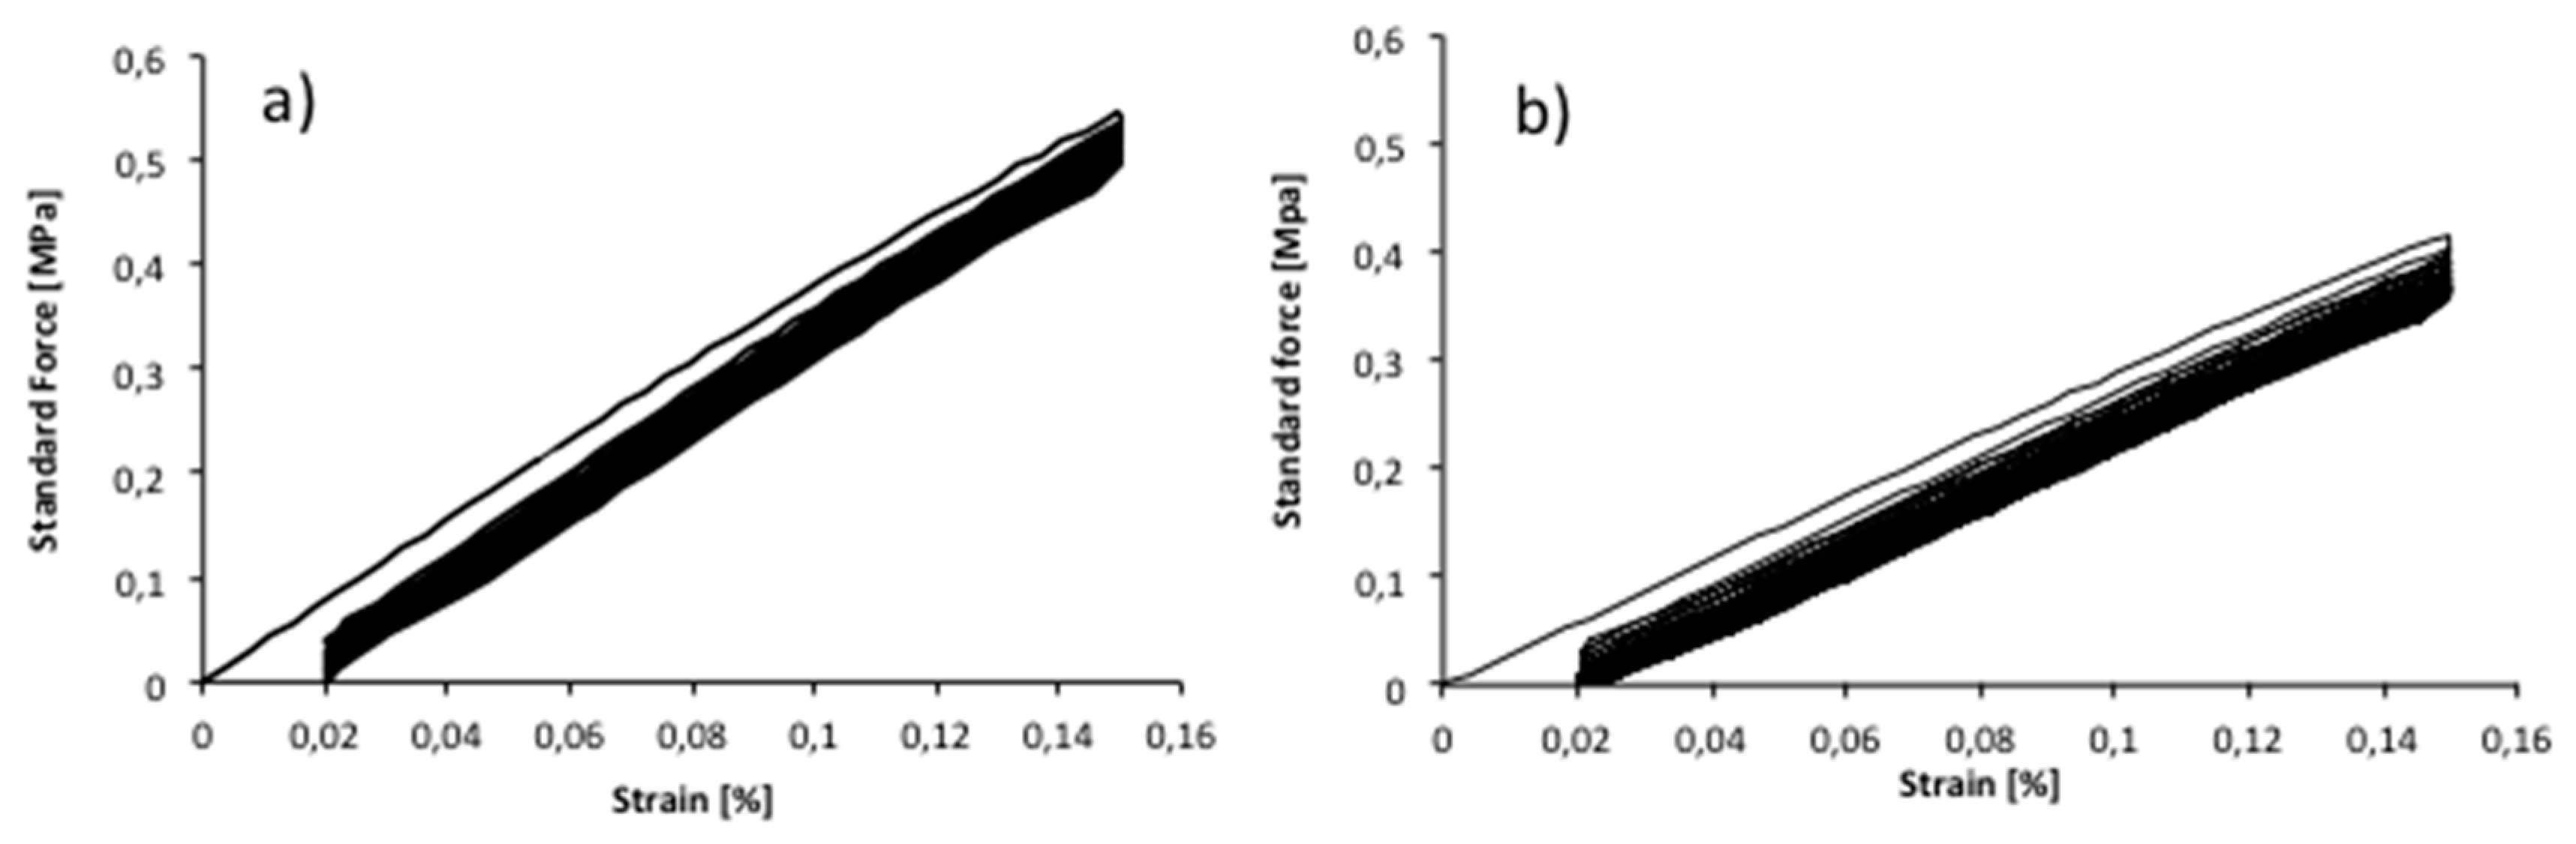
The cycle-loading tests demonstrated that the mechanical properties of the copolymers were affected by the repeated loading, especially after the first recorded cycle. In Figure 7, an example of the cycle stress–strain curves of PLA metallized film, in MD and CD direction, strained upon 0.15% of strain are reported.
This value was chosen in order to perform the test in the elastic region, taking into consideration the εy recorded value (linear elastic field). The same value was used for all PLA films. The sample was very little elastic, showing ca. 77.5% recovery for MD direction and CD direction, after 25 cycles. A mechanical hysteresis was characteristic of the first cycle resulting in a relatively small initial set. As can be observed in Figure 7, during the cycles, the narrowed hysteresis shape was repeated, producing smaller additional set after each cycle, until the 25 cycles. The stress softening in the ascending curve in the 1st cycle can be caused by a rearrangement in the crystalline micro-phase, formed during the film casting [40]. The hysteresis area decreased starting from the 2nd cycle, showing a less additional set area. The difference between the ascending curves can be attributed to a reorganization of the macromolecules during straining. Other PLA films showed a similar cyclic tensile behavior, with about 80% elastic recovery for both MD and CD direction, after 1 and 25 cycles. It must be underlined that the elasticity is very low for all films and that the cyclic stress–strain measurement was done just to have an idea of the elastic recovery of the polymer matrix after repeated cyclic stress.
3. Materials and Methods
3.1. Materials
Five PLA films were studied without any special preliminary treatments (manipulation or film preparation). All compounds are made of PLA: two were unmodified PLA films of different thickness, while the other three were subject to superficial treatments, in order to change their final properties. The metallization with pure Aluminum was performed under vacuum and under low pressure in order to avoid any external contamination. The low pressure was used to allow the small metallic molecules to reach the film plastic surface without run into air and other gases particles, for a homogeneous and uniform distribution. The SiOx coating was applied by vacuum evaporation. Silicon oxide was firstly sublimated by heating with an electron beam and evaporated as glass vapor. Then, the vapor was condensed on the film plastic surface, forming a very thin glass layer, which was well-distributed by a cooling roll. The thin layer was, in its amorphous state, clear and transparent. PVOH coating was formed by evaporation of a PVOH water solution. PVOH resin was dissolved in hot water (80 °C) and then spread on the PLA film surface. Film sample was dried until the water was evaporated. To remove any residual, the surface was washed with isopropanol. Further details on the specific surface treatments of the PLA film sample are present in literature [12,13].
The films were identified as following:
- -
- PLA30: neat PLA film of 30 μm thickness
- -
- PLA40: neat PLA film of 40 μm thickness
- -
- PLASiOx: PLA with SiOx coating
- -
- PLAPVOH: PLA with PVOH coating
- -
- PLAmet: PLA metalized with aluminum coating of less than 1 micron thickness
3.2. Permeability Measurement
The permeability determination was performed by a manometric method using a Permeance Testing Device, type GDP-C (Brugger Feinmechanik GmbH, München, Germany), according to ASTM 1434-82 (Standard test Method for Determining Gas Permeability Characteristics of Plastic Film and Sheeting), DIN 53 536 in accordance with ISO 15105-1 and according to Gas Permeability Testing Manual (Registergericht München HRB 77020, Brugger Feinmechanik GmbH). The equipment consists of two chambers between which the film is placed. The amount of gas flowing through the membrane is determined from the pressure variation due to the gas accumulation in the closed receiving chamber. The top chamber is filled with the dry test gases at ambient pressure. The permeation at the bottom chamber of the test specimen is determined by the evaluation of the increase in pressure in the previously evacuated volume. The increase in pressure during the test period is evaluated and displayed by a PC. Fluctuation of the ambient temperature during the test was controlled by special software, with an automatic temperature compensation, which minimizes Gas Transmission Rate (GTR) deviations. The film sample, of approximately 10 × 10 in size, was placed between the top and the bottom of the permeation cell. A film mask was used to cover the rest of the permeation chamber. The GTR value, that is the Rate of the film Gas Transmission, was determined considering the increase in pressure in relation to the time and the volume of the device. The pressure was given by the instrument in (Bar) unit. To obtain the data in kPa, the primary SI units, it is necessary to use the following correction factor: 1 Bar = 100 kPa, according to NIST special publication 811 (NIST 2008) [41]. Time Lag (tL), Diffusion coefficient (D) and Solubility (S) of the test gases into the film under study were measured in addition to GTR value. The mathematical relations used are well reported in literature [12,13,14,15,27,42]. The operative conditions were: room condition temperature of 23 °C; gas stream of 100 cm3/min; 0% of Gas Relative Humidity (RH); sample area of 78.4 cm2. Method A was employed in the analysis, as just reported in the literature [15,27,42,43,44], with evacuation of top/bottom chambers. The following 100% pure food grade gases commonly used for modified atmosphere packaging (MAP technology) were used: O2, CO2, N2, N2O, C2H4, Air (21%O2, 79%N2), MA (79%N2O/21%O2).
For the determination of the activation energies of the permeation process, films were analyzed at a temperature of 5, 10, 20, 23, 30 and 40 °C, using dry gases with 0% RH.
Chamber and sample temperature were sets by an external thermostat, KAAKE-Circulator DC10-K15 type (Thermoscientific, Selangor Darul Ehsan, Malaysia).
A gas mixing system Witt-Gasetechnik GmBh & Co KG (Witten, Germany) type Km 100-4 was used to obtain the desired gas flow mixture inside the permeability device.
All experiments were taken in triplicate and a good reproducibility was achieved. The mean value is presented.
3.3. Thickness Determination
The film thickness was determined using the Sample Thickness Tester DM-G, consisting of a digital indicator (Digital Dial Indicator) connected to a PC. The reading was made twice per second (the tool automatically performs at least three readings), measuring a minimum, a maximum and an average value. The thickness value is expressed in μm or inches and the measuring range is from 12.5 μm to 100 μm, with a resolution of 0.001 μm. The reported results represent the mean value thickness of three experimental tests run at 10 different points on the polymer film surface at room temperature.
3.4. Differential Scanning Calorimetry (DSC) Measurements
Enthalpies and temperatures of phase changes were determined calorimetrically by using a Perkin-Elmer type Pyris DSC-6 differential scanning calorimeter equipped with a nitrogen liquid sub ambient accessory and calibrated with high purity standards, such as Indium and Tin. Polymer films were cut into small pieces of 2 mm2 and placed in a 50 μL sealed aluminum crucibles. Sample mass of 5–10 mg was used. In order to avoid film contamination, special care was taken during handling, working with gloves and tweezers. After isothermally keeping the system for 3 min at a temperature of at −10 °C, weighed samples were first heated, with a heating scanning rate of 10 °C/min, from −10 to 180 °C (first scan) and then, after a further isothermally keeping the system for 3 min at a temperature of 180 °C, were quenched to −10 °C at a cooling rate of 100 °C/min. Finally, after isothermally keeping the system for 5 min, samples were reheated from −10 °C to the same temperature as the first run, at a heating rate of 10 °C/min (second run).
The same DSC trace experiment was performed after 1 h and 4 h of isothermally keeping the system at 5, 10, 20, 30 and 40 °C (annealing treatment). All experiments were performed under nitrogen flow (20 cm3/min). The melting temperature (Tm) was determined as the peak value of the endothermic phenomena in the DSC curve while the crystallization temperature (Tc) was determined as the peak value of the isothermal phenomena in the DSC curve. The melting enthalpy (ΔHm) of the crystal phase was calculated from the area of the DSC endothermic peak as well as the crystallization enthalpy (ΔHc). Tc and Tm values are well reproducible from the second run, while those relating to the first run are affected by thermal and mechanical history to which the samples were subjected. Tg and Δcp data were obtained from the second run. Calorimetric analysis was performed on film samples in triplicate.
3.5. Tensile Stress–Strain Test and Tensile Cycling Test
Tensile testing of the copolymers was performed using a Zwick Roell Texture machine (Zwick Roell, 2125 Barrett Park Drive, Suite 107, 30144 Kennesaw, GA, USA) mod Z2.5, equipped with a rubber grip and controlled by a computer. A pre-load of 1 MPa was used with a pre-load speed of 5 mm/min. A 500 N load cell was used. Stress–strain and cyclic test measurements were performed on rectangular films of 5 mm wide and 50 mm high, with an initial grip separation of 23 mm. The tensile stress–strain and the cycling loading test measurements were performed with a crosshead speed of 50 mm/min. Twenty-five cycles were recorded at maximum and the film samples were strained up to 0.15%. Five different samples from the same film were tested for each copolymer composition and the results were provided as the average value ± standard deviation. All tests were carried out in accordance with ASTM D638 Standard Test Method for Tensile Properties of Plastics, for film thickness below 100 microns. Films were analyzed in the Cross Direction (CD) and in the Machine Direction (MD), according to literature [13].
4. Conclusions
Transition from conventional barrier materials based on petrochemical biostable polymers to natural biodegradable polymer packages as innovative systems requires intensive scientific and industrial explorations. The above research complex can be exploited not only for PLA and its derivatives, but also for the other biodegradable polyesters such as polyhydroxyalkanoates, and copolymers of poly(butylenesuccinate)s and poly(ε-caprolactone). The subsequent advancement in innovative membrane packaging will be devoted to nanobiocomposites with “smart”, stimuli-responsive characteristics and controlled perm-selectivity.
In the matter of barrier properties, the neat PLA films have shown the GTR values that are lower than the conventional synthetic polymer ones, while the PLA-coated films have a wide variety in gas permeability characterization, changing drastically from a low to a very high barrier material. In the operated range of temperatures, the gas permeability rank mainly corresponds to the following sequence: N2O > CO2 > MA > O2 > N2 > C2H4 ≈ Air.
For the polar gas molecules containing the oxygen group, the GTR values exceed the corresponding values of the nonpolar molecules that can be explained by the predominance of gas solubility contribution into the general process of permeability.
Coating and metallization modify PLA structure especially in the surface layers and hence change such physical chemical characteristics as glass transition temperature, melting temperature, enthalpy relaxation, cold crystallization temperature, etc. An evaluation of its functional properties is essential before its use as alternative material instead of traditional petroleum based packaging materials. This research additionally highlights the importance of gas transmission study in combination with chemical physical polymer behavior to obtain an effective tool for implementation of barrier properties and revealing the packaging critical points.
Acknowledgments
The authors would like to acknowledge financial support from “Charge Transport in Graphene and Low dimensional Structures: modeling and simulation (ChaTGraLowS)” Project, code C10D71, FIR2014, University of Catania. The authors would like to thank Claudio Fornaciari and Veronica Cornini of CoopBox Group Spa (42100 Reggio Emilia–Italy) for kindly supplied the polymer materials used in this work. The authors are grateful for the invitation to contribute the present article free of charge by Materials’ editorial board.
Author Contributions
Valentina Siracusa conceived, designed the experiments, performed the experiments, analyzed the data, contributed to the permeabilimeter analysis tool and wrote the paper; Marco Dalla Rosa contributed for gases, thermal and mechanical analysis tools; and Alexey Iordanskii analyzed the results and wrote the paper.
Conflicts of Interest
The authors declare no conflicts of interest or state. The founding sponsors had no role in the design of the study; in the collection, analyses, or interpretation of data; in the writing of the manuscript, and in the decision to publish the results”.
References
- McMillin, K.W. Where is MAP going? A review and future potential of modified atmosphere packing for meat. Meat Sci. 2008, 80, 43–65. [Google Scholar] [CrossRef] [PubMed]
- Caleb, O.J.; Opara, U.L.; Witthuhn, C.R. Modified Atmosphere Packaging of Pomegranate Fruit and Arils: A Review. Food Bioprocess Technol. 2012, 5, 15–30. [Google Scholar] [CrossRef]
- Farber, J.M. Microbiological aspects of modified-atmosphere packaging technology—A review. J. Food Prot. 1991, 54, 58–70. [Google Scholar] [CrossRef]
- Silveira, A.C.; Araneda, C.; Hinojosa, A.; Escalona, V.H. Effect of non-conventional modified atmosphere packaging on fresh cut watercress (Nasturtium officinale R.Br.) quality. Postharvest Biol. Technol. 2014, 92, 114–120. [Google Scholar] [CrossRef]
- Rocculi, P.; Romani, S.; Dalla Rosa, M. Effect of MAP with Argon and nitrous oxide on quality maintenance of minimally processed kiwi fruit. Postharvest Biol. Technol. 2005, 35, 319–328. [Google Scholar] [CrossRef]
- Darie-Niţə, R.N.; Vasile, C.; Irimia, A.; Lipşs, R.; Râpə, M.J. Evaluation of some eco-friendly plasticizers for PLA films processing. J. Appl. Polym. Sci. 2016, 133, 1–10. [Google Scholar] [CrossRef]
- Page, N.; González-Buesa, J.; Ryser, E.T.; Harte, J.; Almenar, E. Interactions between sanitizers and packaging gas compositions and their effects on the safety and quality of fresh-cut onions (Allium cepa L.). Int. J. Food Microbiol. 2016, 218, 105–113. [Google Scholar] [CrossRef] [PubMed]
- Morgado, C.M.A.; Sallanon, H.; Mattiuz, B.-H.; Nilprapruck, P.; Charles, F. Heat treatment and active packaging to improve the storage of fresh-cut melons (Cucumis melo L.). Fruits 2016, 71, 9–15. [Google Scholar] [CrossRef]
- Zia, K.M.; Noreen, A.; Zuber, M.; Tabasum, S.; Mujahid, M. Recent developments and future prospects on bio-based polyesters derived from renewable resources: A review. Int. J. Biol. Macromol. 2016, 82, 1028–1040. [Google Scholar] [CrossRef] [PubMed]
- Peelman, N.; Ragaert, P.; De Meulenaer, B.; Adons, D.; Peeters, R.; Cardon, L.; van Impe, F.; Devlieghere, F. Application of Bioplastics for food packaging. Trends Food Sci. Technol. 2013, 32, 128–141. [Google Scholar] [CrossRef]
- Müller, P.; Imre, B.; Bere, J.; Móczó, J.; Pukánszky, B. Physical ageing and molecular mobility in PLA blends and composites. J. Therm. Anal. Calorim. 2015, 122, 1423–1433. [Google Scholar] [CrossRef]
- Mangaraj, S.; Goswami, T.K.; Mahajan, P.V. Application of Plastic Films for Modified Atmosphere Packaging of Fruits and Vegetables: A review. Food Eng. Rev. 2009, 1, 133–158. [Google Scholar] [CrossRef]
- Siracusa, V.; Blanco, I.; Romani, S.; Tylewicz, U.; Rocculi, P.; Dalla Rosa, M. Poly (lactic acid)-modified films for food packaging application: Physical, mechanical, and barrier behavior. J. Appl. Polym. Sci. 2012, 125, 390–401. [Google Scholar] [CrossRef]
- Burgess, S.K.; Kriegel, R.M.; Koros, W.J. Carbon Dioxide Sorption in Amorphous Poly (ethylene furanoate). Macromolecules 2015, 48, 2184–2193. [Google Scholar] [CrossRef]
- Siracusa, V.; Ingrao, C. Correlation amongst gas barrier behaviour, temperature and thickness in BOPP films for food packaging usage: A lab-scale testing experience. Polym. Test. 2017, 59, 277–289. [Google Scholar] [CrossRef]
- Scheichl, R.; Klopffer, M.-H.; Benjelloun-Dabaghi, Z.; Flaconnèche, B. Permeation of gases in polymers: Parameter identification and nonlinear regression analysis. J. Membr. Sci. 2005, 254, 275–293. [Google Scholar] [CrossRef]
- Robeson, L.M.; Freeman, B.D.; Paul, D.R.; Rowe, B.W. An empirical correlation of gas permeability and permselectivity in polymers and its theoretical basis. J. Membr. Sci. 2009, 341, 178–185. [Google Scholar] [CrossRef]
- Morillon, V.; Debeaufort, F.; Blond, G.; Voilley, A. Temperature influence on moisture transfer through synthetic films. J. Membr. Sci. 2000, 168, 223–231. [Google Scholar] [CrossRef]
- Siracusa, V. Food Packaging Permeability Behaviour: A report. Int. J. Polym. Sci. 2012, 2012, 302029. [Google Scholar] [CrossRef]
- Gigli, M.; Lotti, N.; Gazzano, M.; Siracusa, V.; Finelli, L.; Munari, A.; Dalla Rosa, M. Fully Aliphatic Copolyesters Based on Poly(butylene 1,4-cyclohexanedicarboxylate) with promising Mechanical and Barrier Properties for Food Packaging Application. Ind. Eng. Chem. Res. 2013, 52, 12876–12886. [Google Scholar] [CrossRef]
- Robertson, G.L. Food Packaging: Principles and Practice, 2nd ed.; Marcel Dekker: New York, NY, USA, 2006. [Google Scholar]
- Siracusa, V.; Lotti, N.; Munari, A.; Dalla Rosa, M. Poly (butylene succinate) and poly (butylene succinate-co-adipate) for food packaging applications: Gas barrier properties after stressed treatments. Polym. Degrad. Stab. 2015, 119, 35–45. [Google Scholar] [CrossRef]
- Schmid, M.; Zillinger, W.; Muller, K.; Sangerlaub, S. Permeation of water vapour, nitrogen, oxygen and carbon dioxide through whey protein isolated based films and coatings—Permselectivity and activation energy. Food Packag. Shelf Life 2015, 6, 21–29. [Google Scholar] [CrossRef]
- Genovese, L.; Gigli, M.; Lotti, N.; Gazzano, M.; Siracusa, V.; Munari, A.; Dalla Rosa, M. Biodegradable Long Chain Aliphatic Polyesters Containing Ether-Linkages: Synthesis, Solid-State, and Barrier Properties. Ind. Eng. Chem. Res. 2014, 53, 10965–10973. [Google Scholar] [CrossRef]
- Gigli, M.; Lotti, N.; Gazzano, M.; Siracusa, V.; Finelli, L.; Munari, A.; Dalla Rosa, M. Biodegradable aliphatic copolyesters containing PEG-like sequences for sustainable food packaging applications. Polym. Degrad. Stab. 2014, 105, 96–106. [Google Scholar] [CrossRef]
- Alavi, S.; Thomas, S.; Sandeep, K.P.; Kalarikkal, N.; Varghese, J.; Yaragalla, S. Polymer for Packaging Application; CRC Press: Boca Raton, FL, USA, 2014; Volume 2, pp. 39–52. [Google Scholar]
- Mrkić, S.; Galić, K.; Ivanković, M.; Hamin, S.; Ciković, N. Gas transport and thermal characterization of mono- and Di-polyethylene films used for food packaging. J. Appl. Polym. Sci. 2006, 99, 1590–1599. [Google Scholar] [CrossRef]
- Atkins, P.; Jones, L. Chemical Principles: The Quest for Insight, 5th ed.; Freeman WH & Co.: New York, NY, USA, 2012. [Google Scholar]
- Auras, R.A.; Harte, B.; Selke, S.; Hernandez, R. Mechanical, Physical, and Barrier Properties of Poly (lactide) Films. J. Plast. Film Sheet. 2003, 19, 123–135. [Google Scholar] [CrossRef]
- Kim, S.W.; Choi, H.M. Morphology, thermal, mechanical, and barrier properties of graphene oxide/poly (lactic acid) nanocomposite films. Korean J. Chem. Eng. 2016, 33, 330–336. [Google Scholar] [CrossRef]
- Mano, J.F.; Go’mez Ribelles, J.L.; Alves, N.M.; Salmeron Sanchez, M. Glass transition dynamics and structural relaxation of PLLA studied by DSC: Influence of crystallinity. Polymer 2005, 46, 8258–8265. [Google Scholar] [CrossRef] [Green Version]
- Pan, P.; Zhu, B.; Inoue, Y. Enthalpy Relaxation and Embrittlement of Poly (l-lactide) during Physical Aging. Macromolecules 2007, 40, 9664–9671. [Google Scholar] [CrossRef]
- Finnigan, B.; Martin, D.; Halley, P.; Truss, R.; Campbell, K. Morphology and properties of thermoplastic polyurethane nanocomposites incorporating hydrophilic layered silicates. Polymer 2004, 45, 2249–2260. [Google Scholar] [CrossRef]
- Shi, X.; Gan, Z. Preparation and characterization of poly (propylene carbonate)/montmorillonite nanocomposites by solution intercalation. Eur. Polym. J. 2007, 43, 4852–4858. [Google Scholar] [CrossRef]
- Wang, D.; Yu, J.; Zhang, J.; He, J.; Zhang, J. Transparent bionanocomposites with improved properties from poly (propylene carbonate)(PPC) and cellulose nanowhiskers (CNWs). Compos. Sci. Technol. 2013, 85, 83–89. [Google Scholar] [CrossRef]
- Bian, J.; Lin, H.L.; He, F.X.; Wang, L.; Wei, X.W.; Chang, I.; Sancaktar, E. Processing and assessment of high-performance poly (butylene terephthalate) nanocomposites reinforced with microwave exfoliated graphite oxide nanosheets. Eur. Polym. J. 2013, 49, 1406–1423. [Google Scholar] [CrossRef]
- Kim, S.W.; Cha, S.H. Thermal, mechanical, and gas barrier properties of ethylene-vinyl alcohol copolymer-based nanocomposites for food packaging films: Effects of nanoclay loading. J. Appl. Polym. Sci. 2014, 131, 40289–40296. [Google Scholar] [CrossRef]
- Garrasco, F.; Pagés, P.; Gámez-Pérez, J.; Santana, O.O.; Maspoch, M.L. Processing of poly (lactic acid): Characterization of chemical structure, thermal stability and mechanical properties. Polym. Degrad. Stab. 2010, 95, 116–125. [Google Scholar] [CrossRef]
- Smith, W.F. Foundation of Materials Science and Engineering, 3rd ed.; McGraw-Hill Companies S.r.l.: Milan, Italy, 2004. [Google Scholar]
- Andronova, N.; Albertsson, A.-C. Resilient bioresorbable copolymers based on trimethylene carbonate, L-lactide, and 1, 5-dioxepan-2-one. Biomacromolecules 2006, 7, 1489–1495. [Google Scholar] [CrossRef] [PubMed]
- Thompson, A.; Taylor, B.N. Guide for the Use of the International System of Units (SI); National Institute of Standards and Technology Special Publication 811, 2008 ed.; National Institute of Standards and Technology: Gaithhersburg, MD, USA, 2008. [Google Scholar]
- Siracusa, V.; Blanco, I.; Romani, S.; Tylewicz, U.; Dalla Rosa, M. Gas Permeability and Thermal Behavior of Polypropylene Films Used for Packaging Minimally Processed Fresh-Cut Potatoes: A Case Study. J. Food Sci. 2012, 77, 264–272. [Google Scholar] [CrossRef] [PubMed]
- Gajdoš, J.; Galić, K.; Kurtanjek, Ž.; Ciković, N. Gas permeability and DSC charactheristics of polymers used in food packaging. Polym. Test. 2001, 20, 49–57. [Google Scholar] [CrossRef]
- Brugger. Gas Permeability Testing Manual Registergericht Munchen HRB 77020; Brugger Feinmechanik GmbH: München, Germany, 2008. [Google Scholar]
Figure 1.
GTR at different temperature, with different gases: (a) PLA30 film (♦ O2, ■ CO2, Δ N2, ✕ N2O, * C2H4, ● MA, + Air) and (b) PLA40 film (♦ O2, ■ CO2, Δ N2, ✕ N2O, * C2H4, ● MA, + Air1, - Air2).
Figure 1.
GTR at different temperature, with different gases: (a) PLA30 film (♦ O2, ■ CO2, Δ N2, ✕ N2O, * C2H4, ● MA, + Air) and (b) PLA40 film (♦ O2, ■ CO2, Δ N2, ✕ N2O, * C2H4, ● MA, + Air1, - Air2).
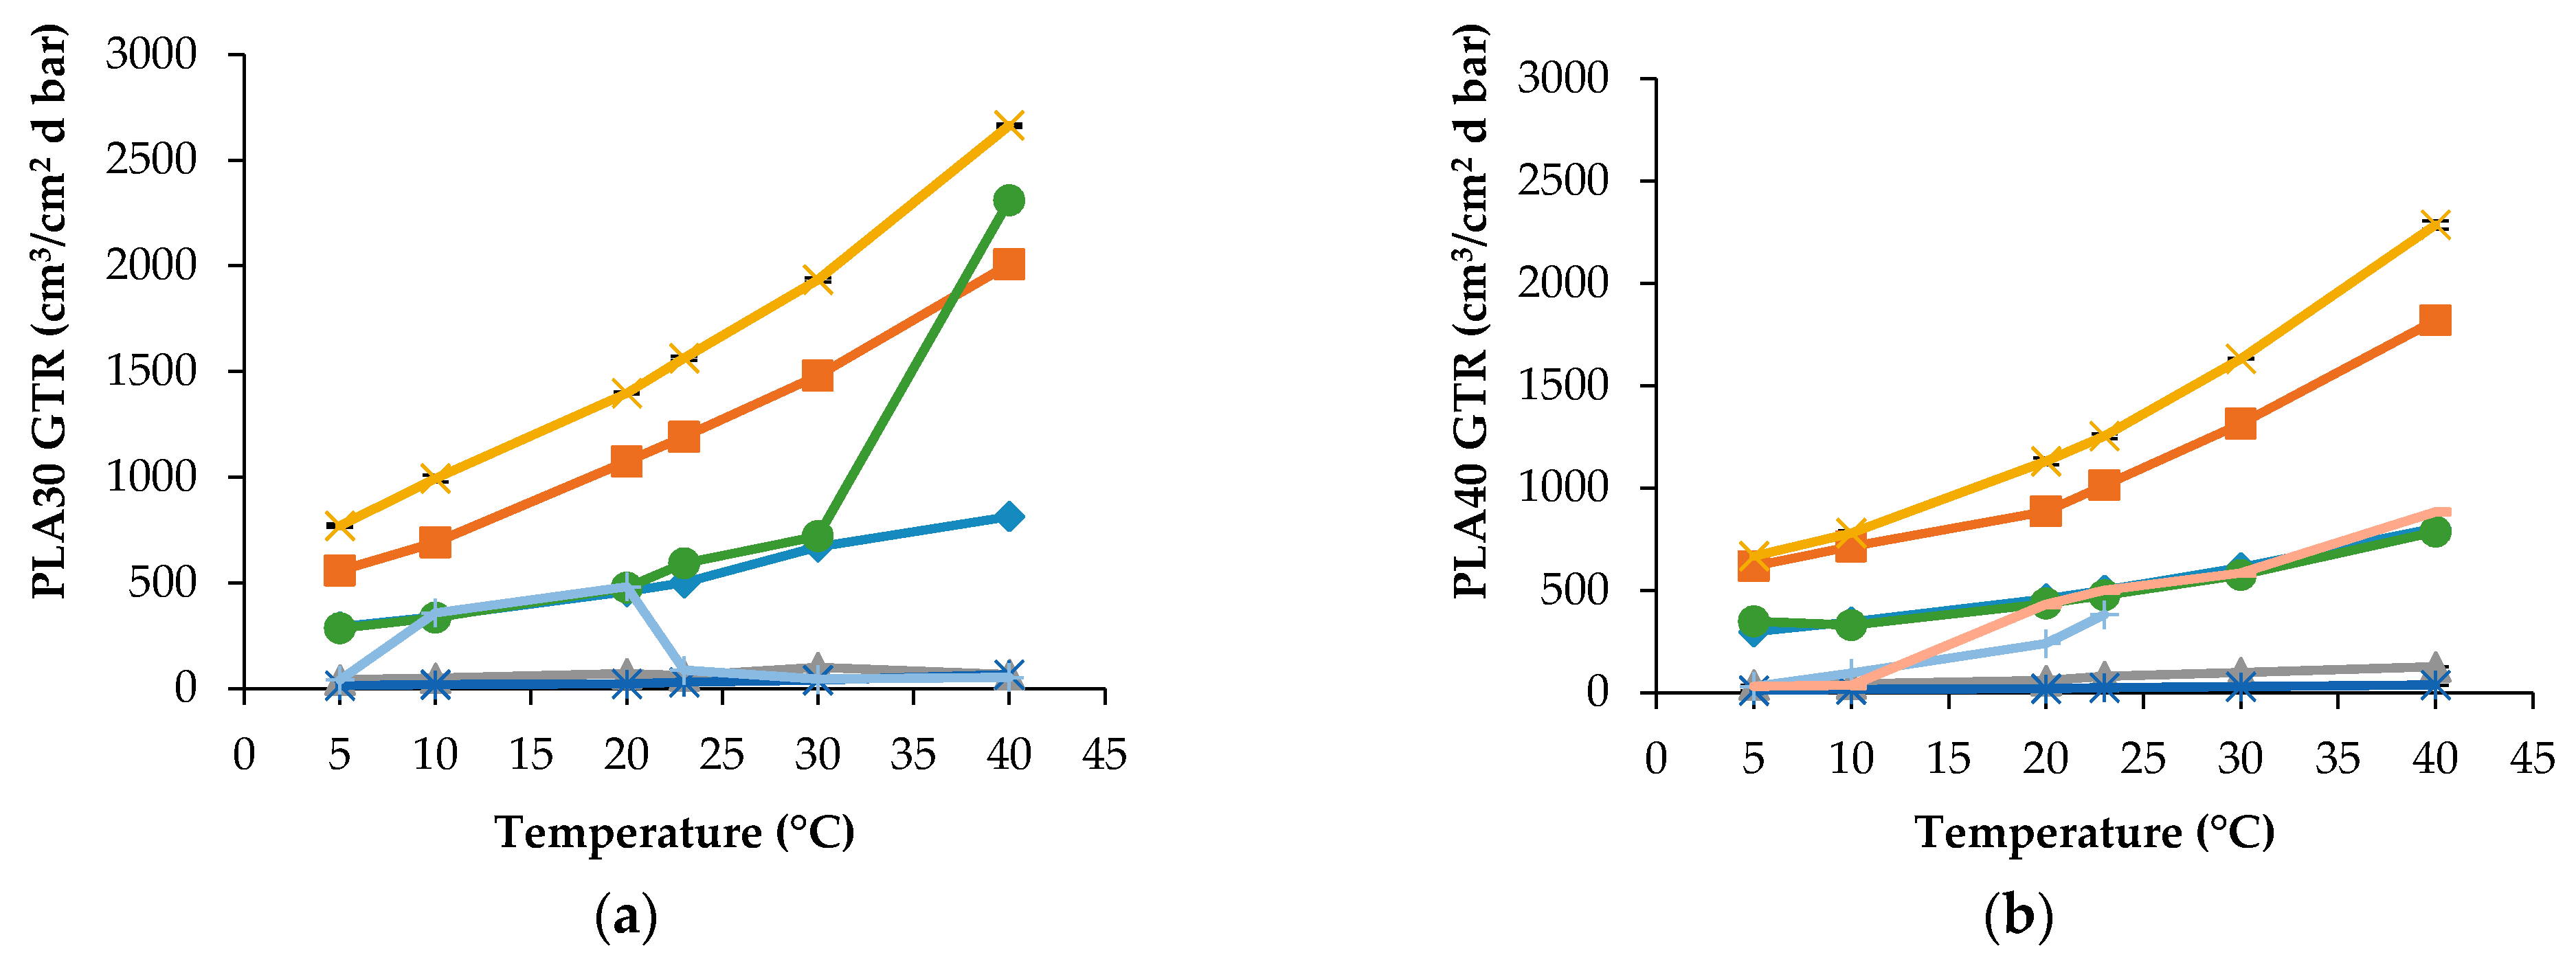
Figure 2.
GTR at different temperature of different gases (◆ O2, ∎ CO2, Δ N2, ✕ N2O, * C2H4, ● MA, + Air) for: (a) PLASiOx; (b) PLAPVOH; and (c) PLAmet.
Figure 2.
GTR at different temperature of different gases (◆ O2, ∎ CO2, Δ N2, ✕ N2O, * C2H4, ● MA, + Air) for: (a) PLASiOx; (b) PLAPVOH; and (c) PLAmet.

Figure 3.
Permeability coefficients (a) D; (b) S; and (c) tL for PLA30 sample (♦ O2, ∎ CO2, Δ N2, ✕ N2O, * Air, ● MA).
Figure 3.
Permeability coefficients (a) D; (b) S; and (c) tL for PLA30 sample (♦ O2, ∎ CO2, Δ N2, ✕ N2O, * Air, ● MA).
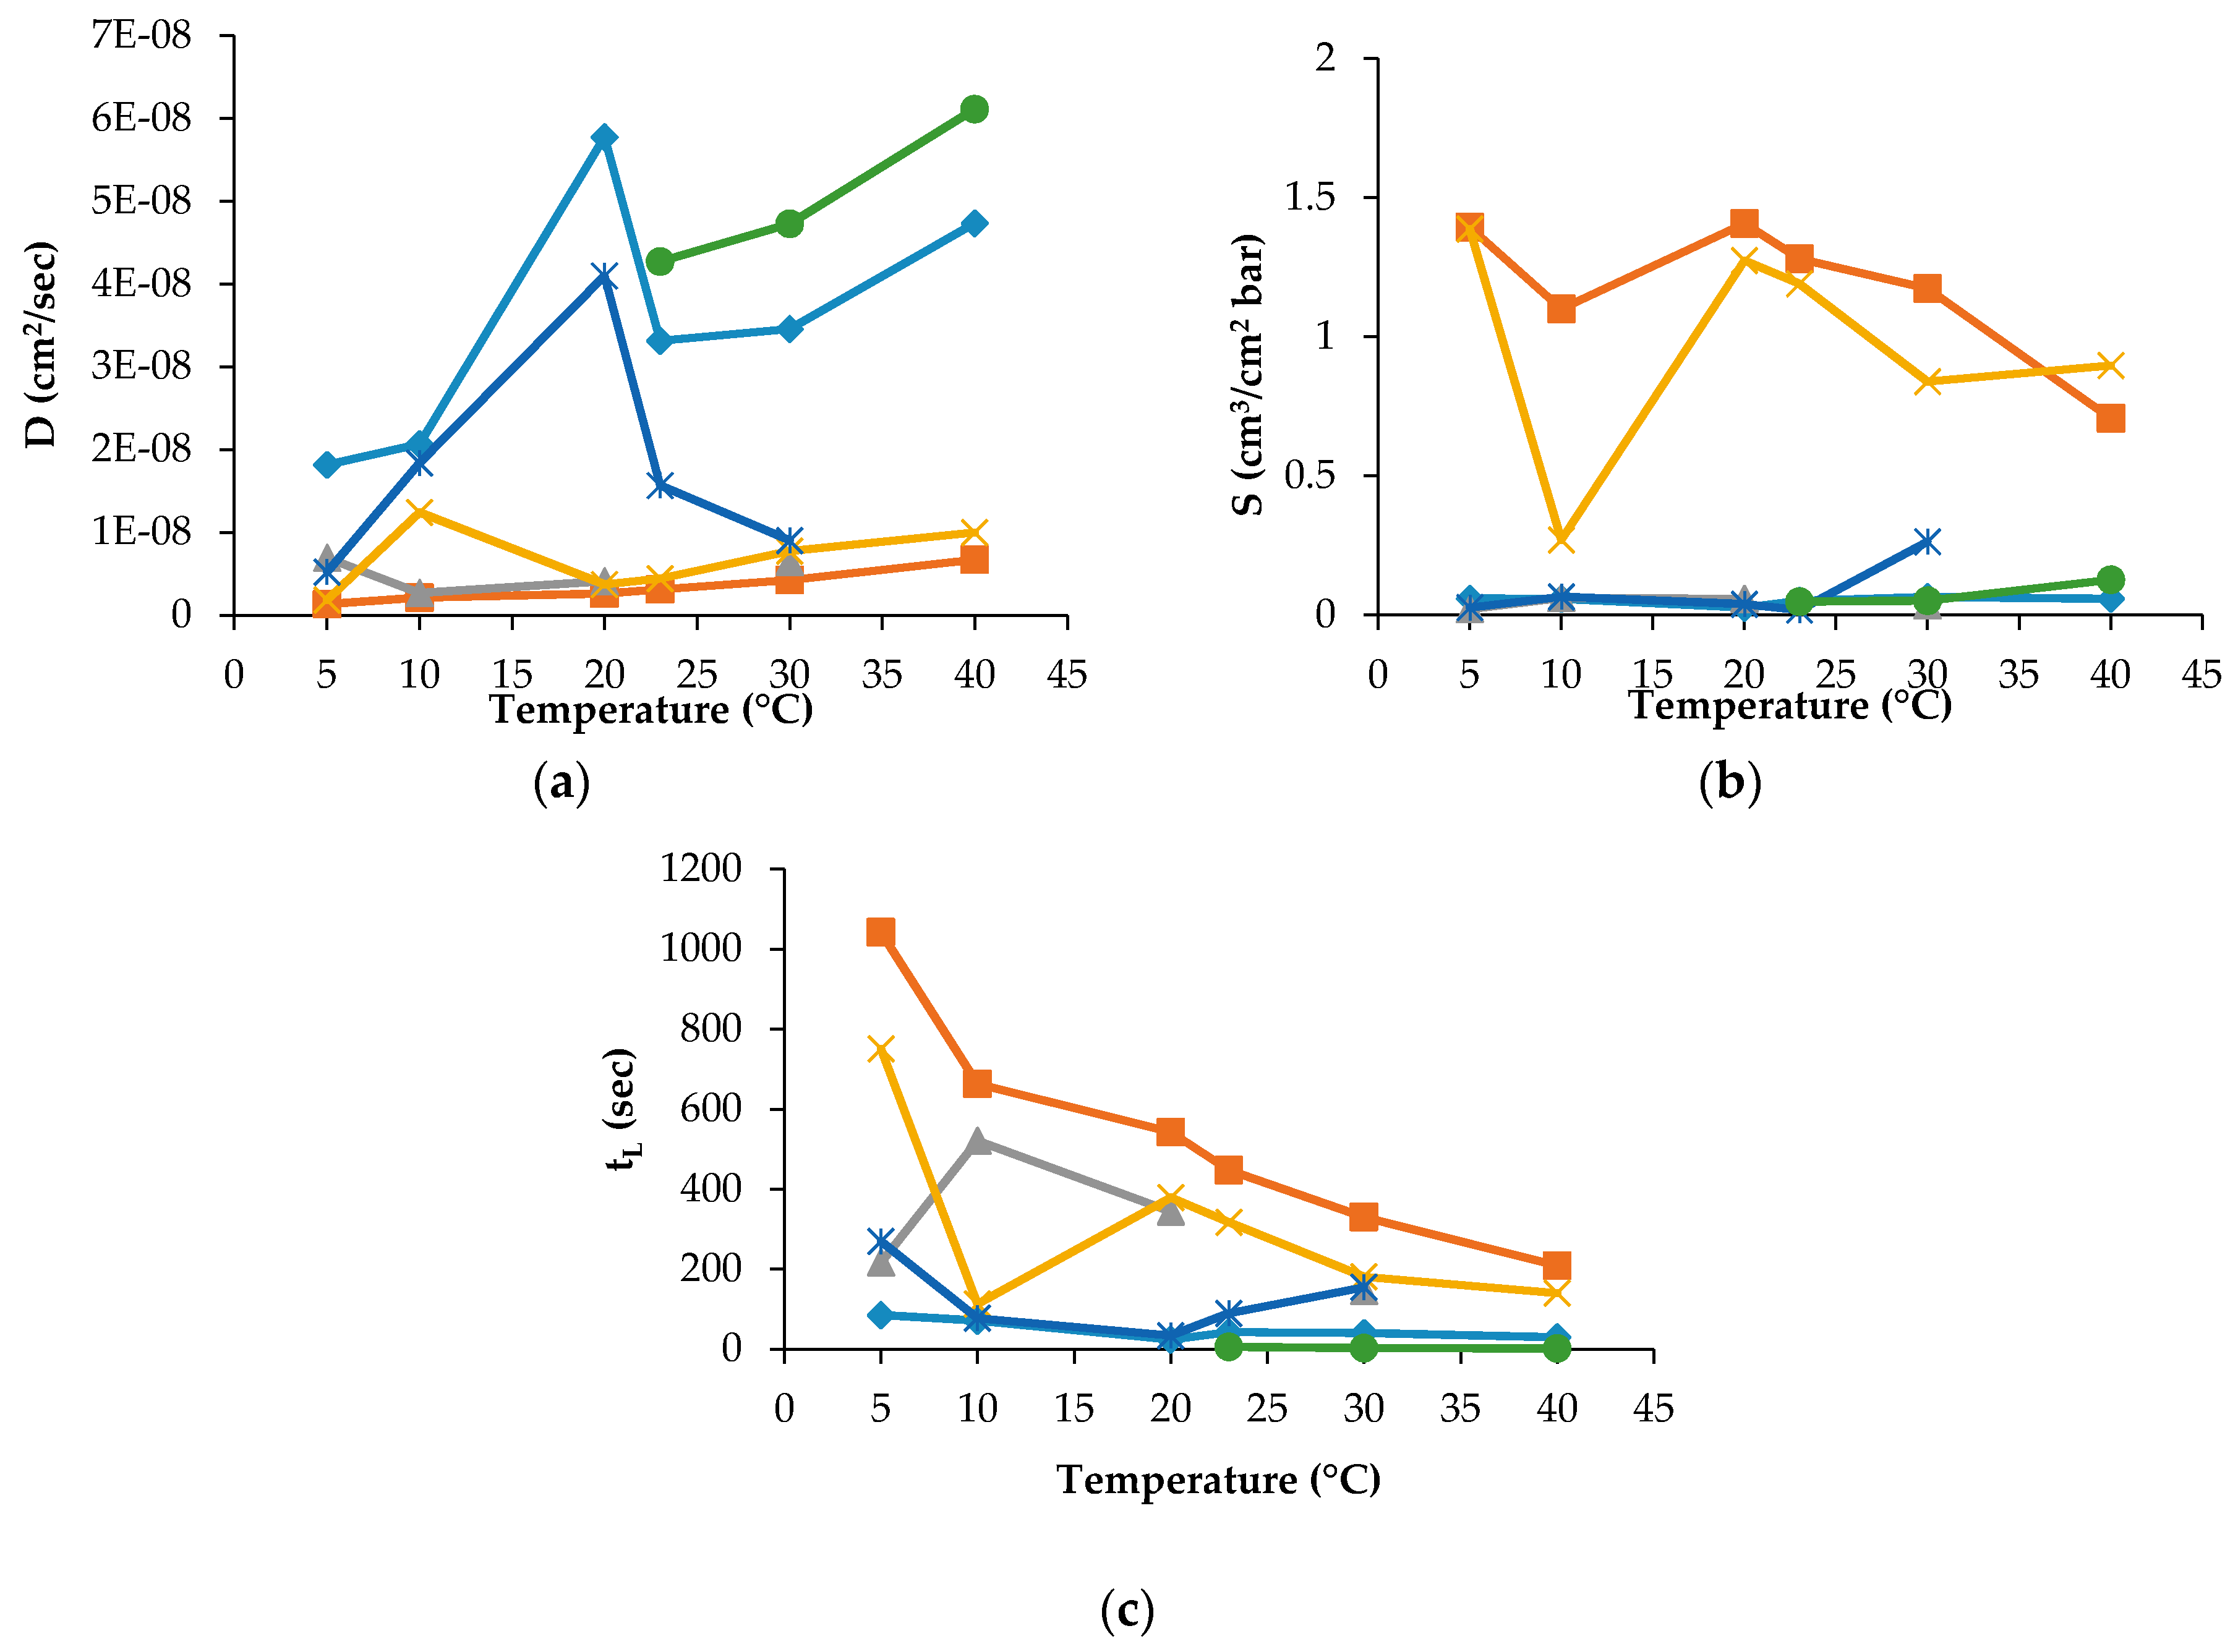
Figure 4.
(a) D; (b) S; and (c) tL for PLAmet sample (♦ O2, ∎ CO2, Δ N2O, - Air, ● MA).
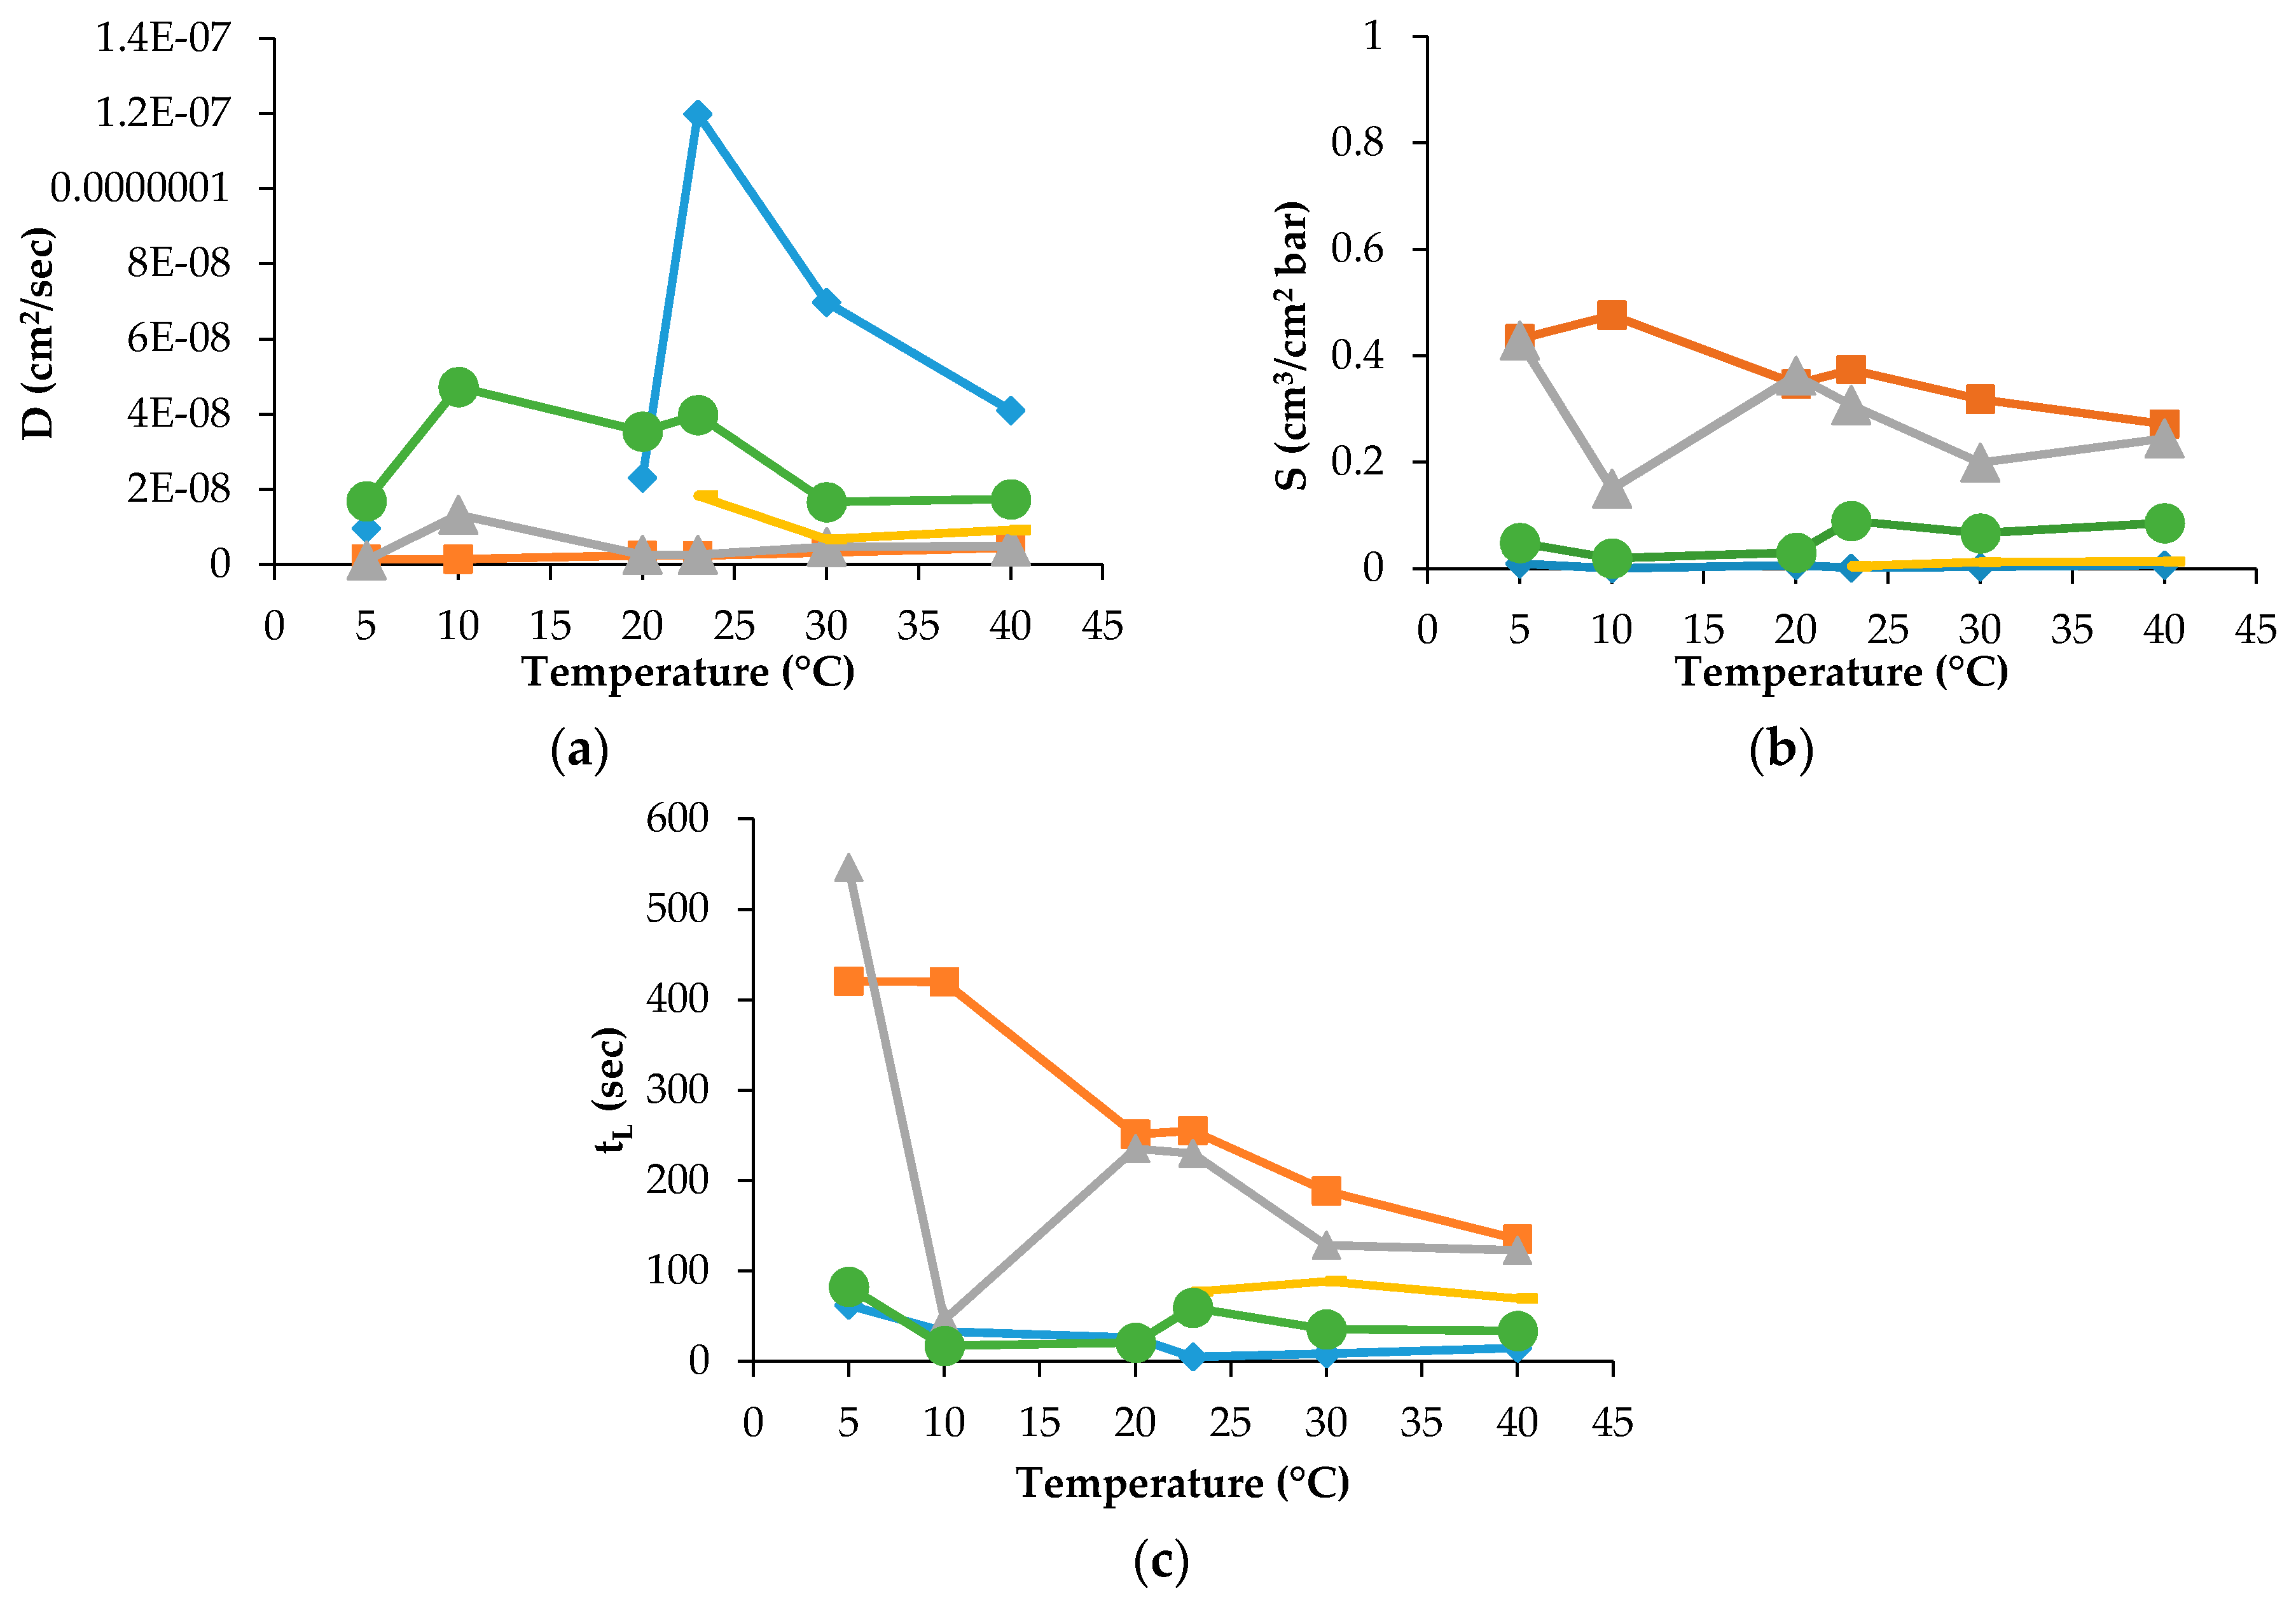
Figure 5.
Arrhenius plot coefficients for: (a) GTR (♦ O2, ∎ CO2, Δ N2, ✕ N2O, * Air, ● MA, + C2H4); (b) S (♦ O2, ∎ CO2, Δ N2, ✕ N2O, * Air, ● MA); and (c) D (◆ O2, ∎ CO2, Δ N2, ✕ N2O, * Air, ● MA), for PLA30 film.
Figure 5.
Arrhenius plot coefficients for: (a) GTR (♦ O2, ∎ CO2, Δ N2, ✕ N2O, * Air, ● MA, + C2H4); (b) S (♦ O2, ∎ CO2, Δ N2, ✕ N2O, * Air, ● MA); and (c) D (◆ O2, ∎ CO2, Δ N2, ✕ N2O, * Air, ● MA), for PLA30 film.
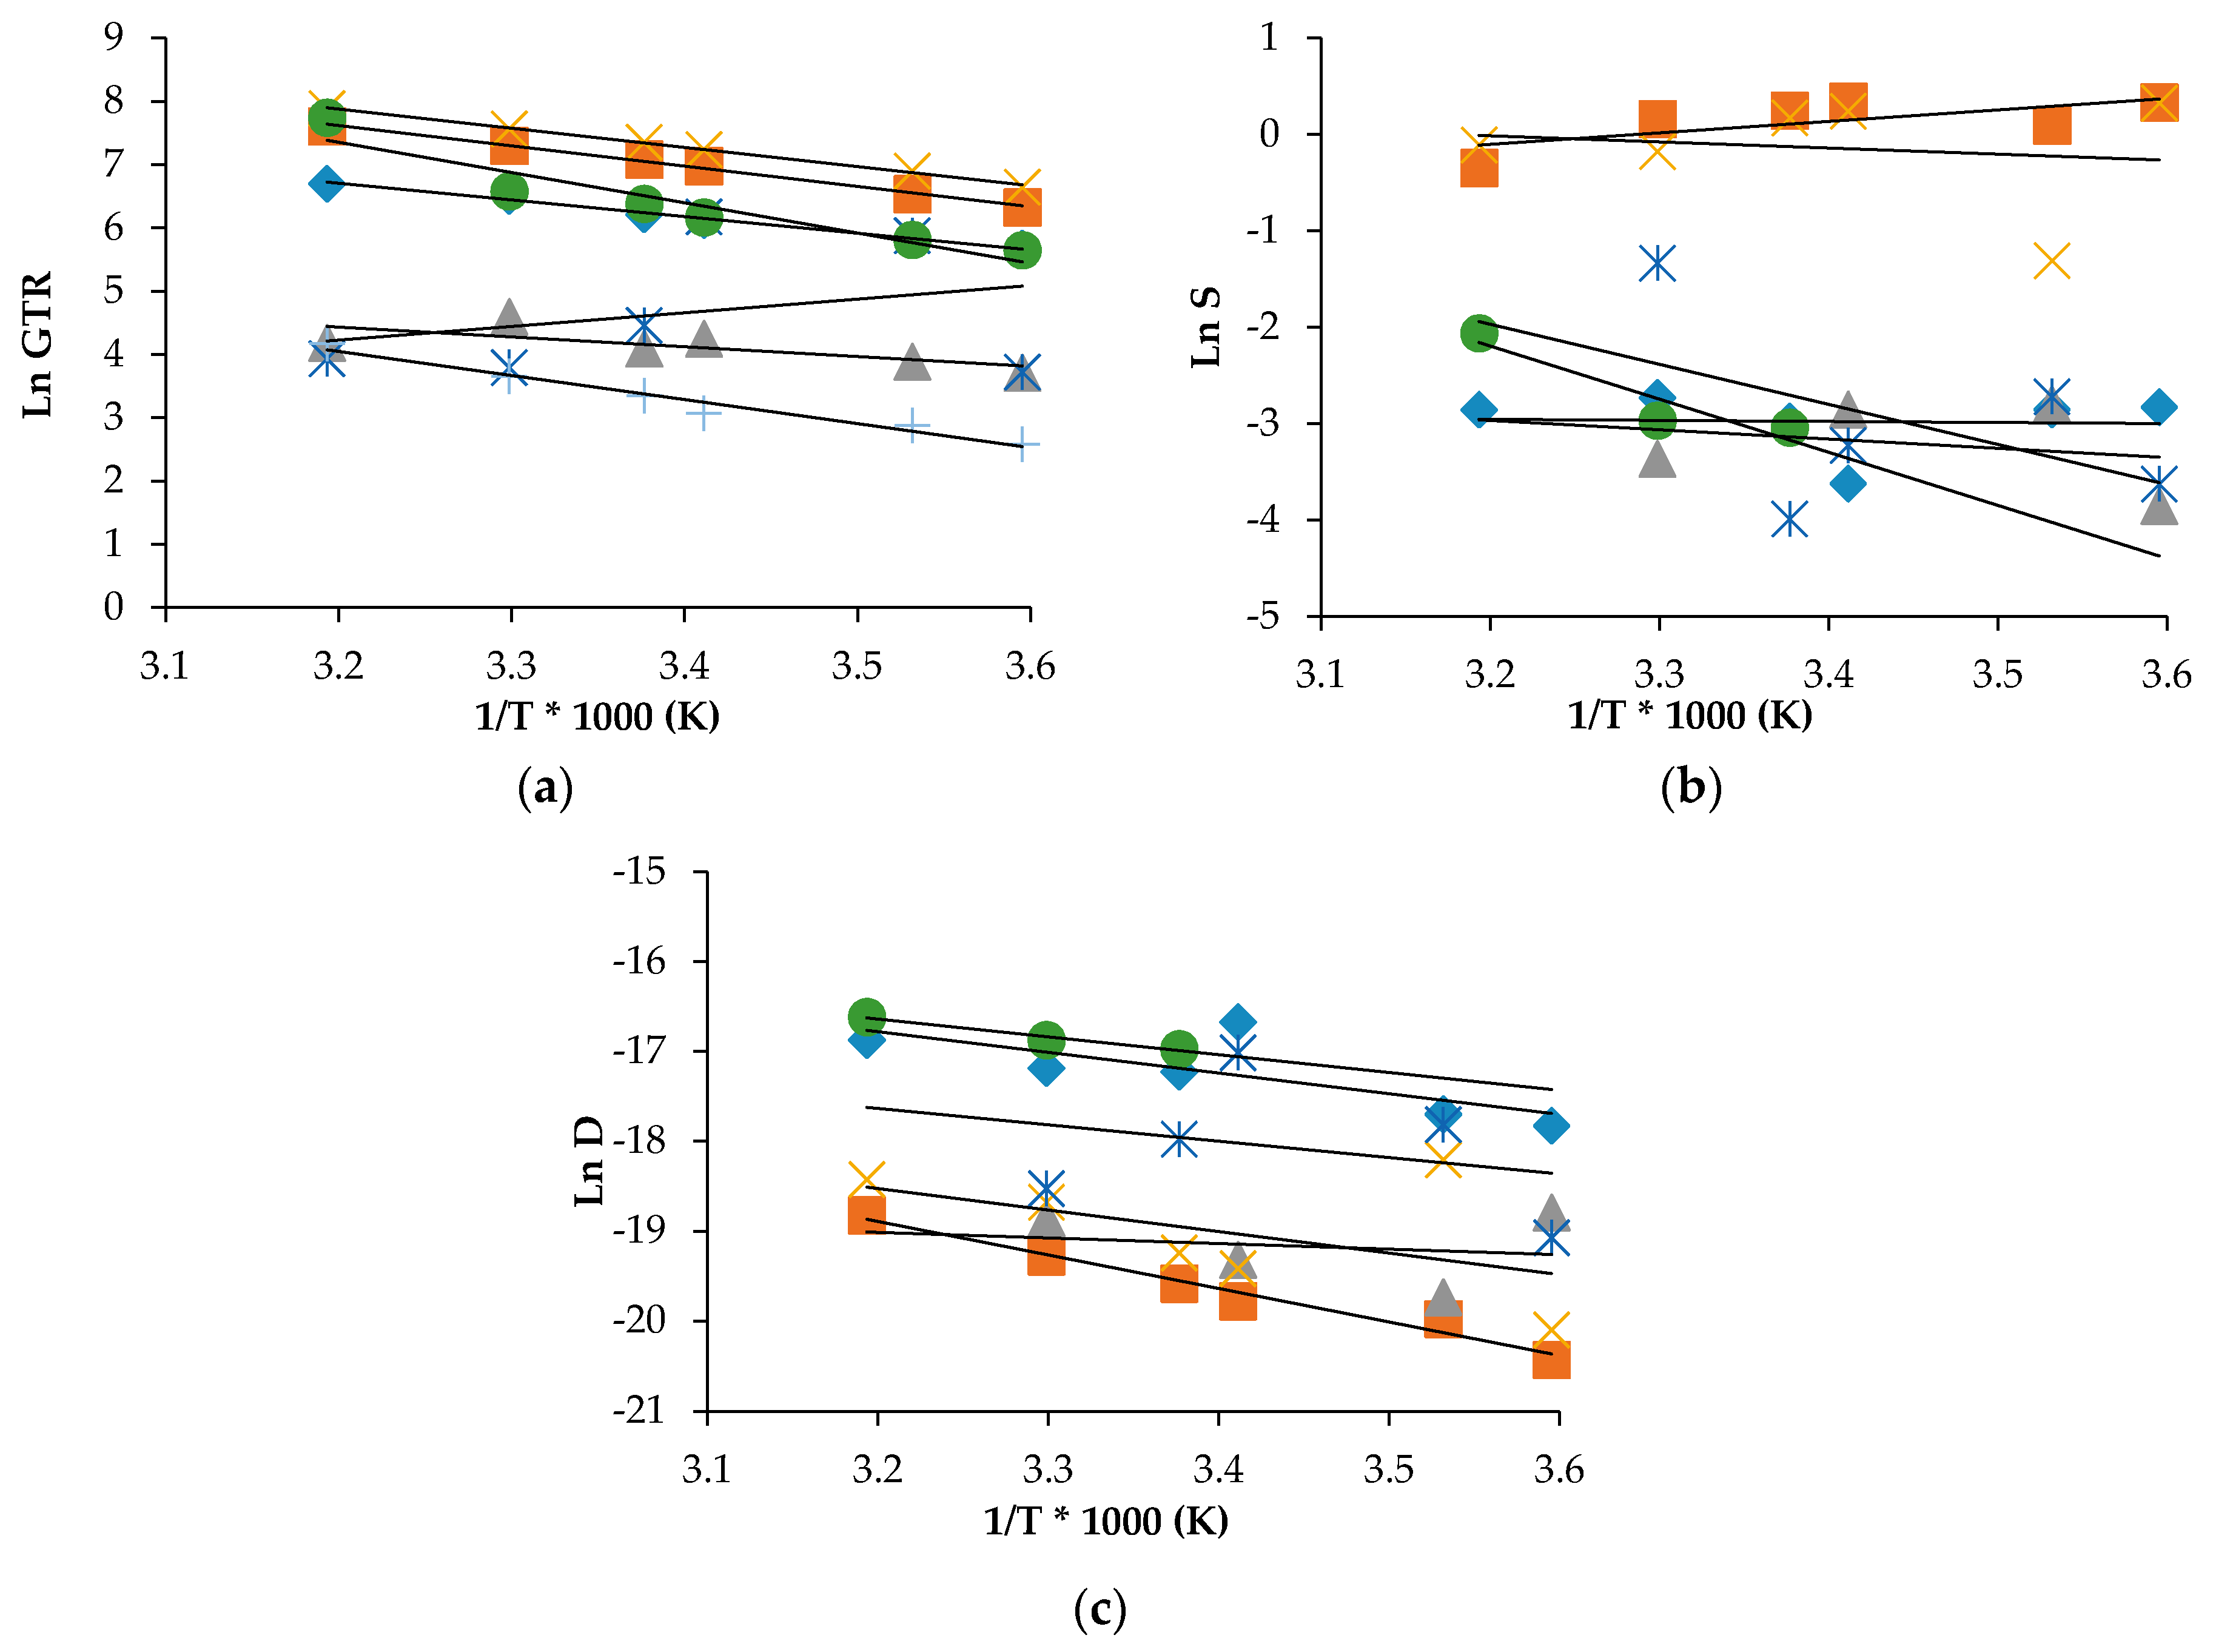
Figure 6.
Calorimetric curves of PLAs films: (a) first scan; and (b) second scan from the melt.
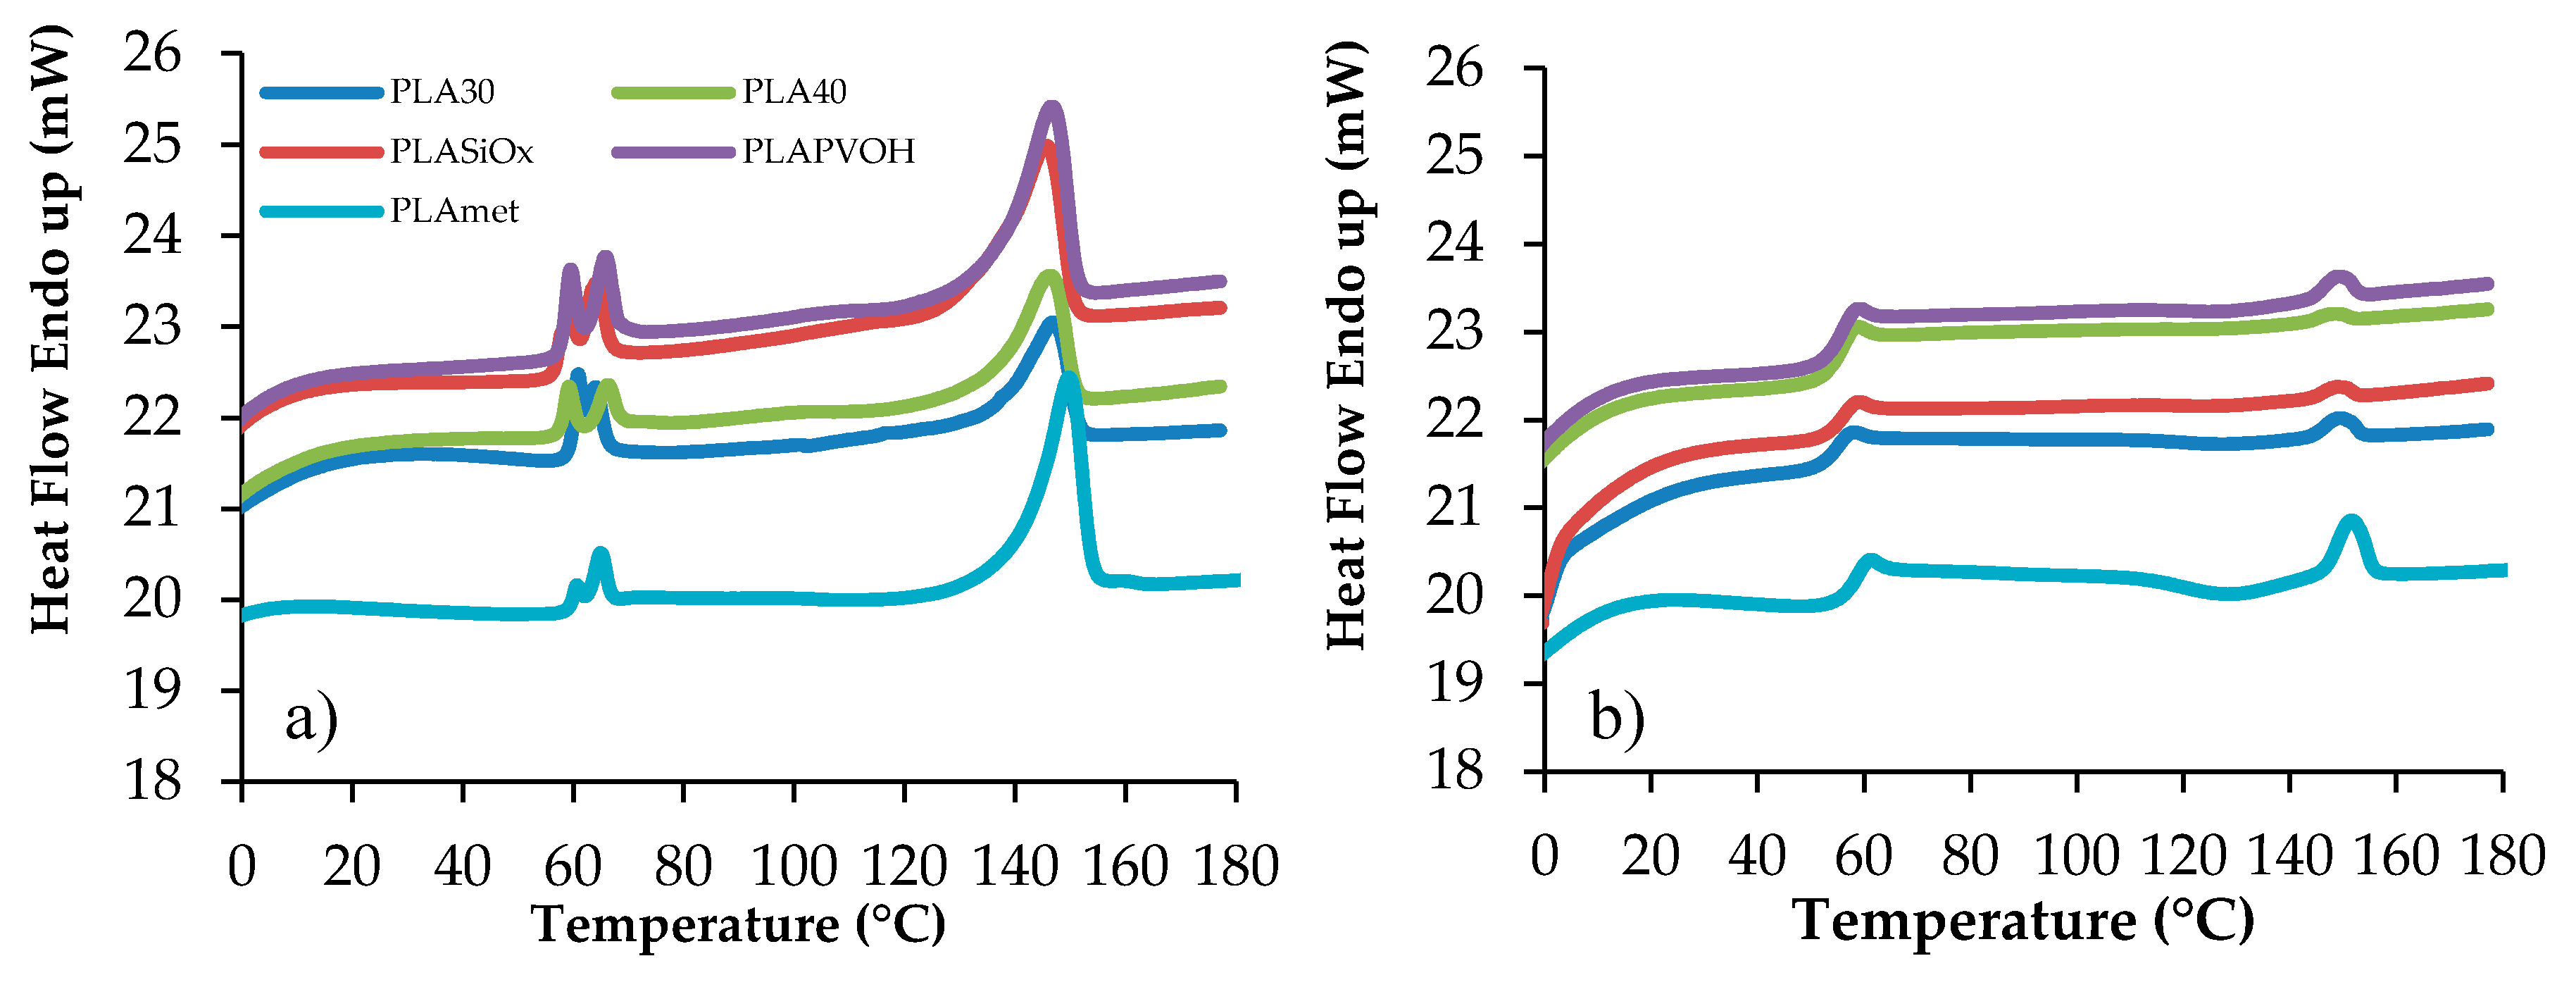
Figure 7.
Stress–strain curves of PLAmet sample, upon cycle loading (overlay of all cycles) for: (a) CD; and (b) MD direction.
Figure 7.
Stress–strain curves of PLAmet sample, upon cycle loading (overlay of all cycles) for: (a) CD; and (b) MD direction.


Table 1.
O2-GTR data at 23 °C for PLA films sample.
| Samples | PLA30 | PLA40 | PLASiOx | PLAPVOH | PLAmet |
|---|---|---|---|---|---|
| GTR | 501 ± 0.47 | 500 ± 0.47 | 5.47 ± 0.05 | 23.2 ± 0.05 | 71.9 ± 0.31 |
| S | 5.10 × 10⁻² ± 3.67 × 10⁻³ | 7.04 × 10⁻² ± 1.44 × 10⁻³ | - | - | 1.42 × 10⁻³ ± 4.11 × 10⁻⁴ |
| D | 3.31 × 10⁻⁸ ± 2.33 × 10⁻⁹ | 3.21 × 10⁻⁸ ± 6.60 × 10⁻¹⁰ | - | - | 1.20 × 10⁻⁷ ± 2.96 × 10⁻⁸ |
| tL | 42.0 ± 2.94 | 78.3 ± 1.70 | - | - | 5.00 ± 1.41 |
| Thickness | 29.5 ± 0.29 | 39.6 ± 0.21 | 44.9 ± 0.50 | 28.7 ± 0.50 | 19.4 ± 0.22 |
GTR, cm3/m2 d bar; S, cm3/cm2 bar; D, cm2/s; tL, s; thickness, μm.
Table 2.
Perm-selectivity ratio at 5, 10, 20, 23, 30 and 40 °C.
| Sample | CO2/O2 | N2/O2 | N2O/O2 | C2H4/O2 | MA/O2 | Air/O2 | Air2/O2 |
|---|---|---|---|---|---|---|---|
| PLA30 | 1.91/2.04/2.34/ | 0.14/0.14/0.15 | 2.63/2.93/3.04 | 0.04/0.05/0.05 | 0.97/0.99/1.04 | 0.14/1.05/1.05 | - |
| 2.37/2.21/2.47 | 0.12/0.15/0.08 | 3.12/2.89/3.28 | 0.06/0.06/0.08 | 1.18/1.08/2.84 | 0.17/0.07/0.06 | - | |
| PLA40 | 2.08/2.06/1.93 | 0.12/0.12/0.13 | 2.24/2.25/2.46 | 0.04/0.05/0.04 | 1.17/0.95/0.95 | 0.10/0.28/0.52 | 0.10/0.10/0.94 |
| 2.03/2.15/2.26 | 0.16/0.16/0.16 | 2.51/2.67/2.84 | 0.05/0.05/0.05 | 0.95/0.94/0.98 | 0.76/-/- | 1.00/0.96/1.10 | |
| PLASiOx | 1.34/1.74/2.10 | 0.55/0.51/0.40 | 2.15/2.46/2.83 | 0.44/0.49/0.37 | 1.66/1.47/1.36 | 0.81/0.49/0.37 | - |
| 2.27/2.26/2.41 | 0.48/0.33/0.34 | 3.01/2.81/3.39 | 0.36/0.28/0.25 | 1.36/1.23/1.02 | 0.51/0.36/0.41 | ||
| PLAPVOH | 8.08/6.97/9.97 | 0.21/0.20/0.18 | 7.14/14.99/14.35 | 0.03/0.04/0.04 | 1.75/1.16/1.19 | 0.76/0.43/0.33 | - |
| 12.59/10.92/9.66 | 0.25/0.26/0.23 | 16.65/12.92/11.67 | 0.08/0.14/0.14 | 1.59/1.73/1.87 | 0.40/0.36/1.50 | ||
| PLAmet | 7.26/6.22/6.02 | 7.26/6.22/6.02/ | 5.54/6.05/6.70 | 0.14/0.13/0.21 | 6.27/5.84/5.96/ | 1.25/1.19/0.24/ | - |
| 5.57/5.44/4.63 | 5.57/5.44/4.63 | 5.07/4.99/4.58 | 0.25/0.26/0.23 | 5.66/5.95/5.74 | 0.33/0.43/0.44 |
Table 3.
EGTR, HS, ED data for pure gases, in the 5 °C to 40 °C temperature range, with the linear regression coefficients R2 (between brackets).
Table 3.
EGTR, HS, ED data for pure gases, in the 5 °C to 40 °C temperature range, with the linear regression coefficients R2 (between brackets).
| Samples | EGTR (kJ/mol) | HS (kJ/mol) | ED (kJ/mol) | EGTR (kJ/mol) | HS (kJ/mol) | ED (kJ/mol) |
|---|---|---|---|---|---|---|
| For O2 | For CO2 | |||||
| PLA30 | 21.8 ± 0.26 (0.99) | 0.91 ± 0.22 (0.00) | 19.1 ± 0.13 (0.57) | 26.7 ± 0.31 (1.00) | −9.90 ± 0.32 (0.47) | 31.0 ± 0.17 (0.97) |
| PLA40 | 20.5 ± 0.12 (1.00) | −11.8 ± 0.10 (0.81) | 32.2 ± 0.18 (0.97) | 22.2 ± 0.15 (0.98) | 0.77 ± 0.05 (0.02) | 21.2 ± 0.18 (0.88) |
| PLASiOx | 39.0 ± 0.31 (1.00) | - | - | 50.5 ± 0.24 (0.99) | 10.2 ± 0.09 (0.05) | 39.6 ± 0.21 (0.51) |
| PLAPVOH | 31.9 ± 0.11 (0.95) | - | - | 39.2 ± 0.23 (0.96) | –15.8 ± 0.11 (0.45) | 55.1 ± 0.18 (0.86) |
| PLAmet | 22.1 ± 0.21 (0.99) | –63.7 ± 0.23 (0.24) | 35.6 ± 0.13 (0.42) | 13.9 ± 0.12 (1.00) | –10.8 ± 0.07 (0.89) | 24.6 ± 0.02 (0.97) |
| For N2 | For N2O | |||||
| PLA30 | 12.9 ± 0.13 (0.56) | 8.01 ± 0.11 (0.07) | 5.14 ± 0.11 (0.03) | 25.2 ± 0.21 (1.00) | 5.24 ± 0.13 (0.02) | 19.9 ± 0.10 (0.25) |
| PLA40 | 27.0 ± 0.21 (0.98) | –14.3 ± 0.21 (0.08) | 40.4 ± 0.13 (0.79) | 25.7 ± 0.22 (1.00) | –24.8 ± 0.21 (0.40) | 41.2 ± 0.18 (0.85) |
| PLASiOx | 28.0 ± 0.22 (0.98) | - | - | 47.4 ± 0.13 (1.00) | - | - |
| PLAPVOH | 36.2 ± 0.14 (0.97) | 22.0 ± 0.01 (1.00) | 66.0 ± 0.21 (1.00) | 38.0 ± 0.05 (0.76) | –14.5 ± 0.11 (0.49) | 82.2 ± 0.12 (0.80) |
| PLAmet | 37.8 ± 0.33 (0.96) | - | - | 17.0 ± 0.12 (0.89) | –4.94 ± 0.05 (0.05) | 11.0 ± 0.22 (0.06) |
| For C2H4 | ||||||
| PLA30 | 31.6 ± 0.11 (0.97) | - | - | |||
| PLA40 | 24.5 ± 0.13 (0.97) | - | - | |||
| PLASiOx | 26.7 ± 0.10 (0.98) | - | - | |||
| PLAPVOH | 66.7 ± 0.11 (0.97) | - | - | |||
| PLAmet | 36.6 ± 0.14 (0.95) | - | - | |||
Table 4.
EGTR, HS, ED data for Air and MA, in the 5 °C to 40 °C temperature range, with the linear regression coefficients (R2).
Table 4.
EGTR, HS, ED data for Air and MA, in the 5 °C to 40 °C temperature range, with the linear regression coefficients (R2).
| Samples | EGTR (kJ/mol) | HS (kJ/mol) | ED (kJ/mol) | EGTR (kJ/mol) | HS (kJ/mol) | ED (kJ/mol) |
|---|---|---|---|---|---|---|
| For Air | For MA | |||||
| PLA30 | –18.0 ± 0.01 (0.10) | 34.6 ± 0.15 (0.23) | 15.2 ± 0.13 (0.10) | 39.8 ± 0.11 (0.89) | 45.8 ± 0.04 (0.87) | 16.5 ± 0.31 (0.97) |
| PLA40 | 89.7 ± 0.15 (0.97) | 131 ± 0.05 (0.75) | 28.9 ± 0.09 (0.25) | 17.8 ± 0.09 (0.95) | 9.73 ± 0.03 (0.15) | –6.40 ± 0.44 (0.01) |
| 78.2 ± 0.21 (0.86) | 77.3 ± 0.08 (1.00) | - | ||||
| PLASiOx | 26.4 ± 0.16 (0.84) | - | - | 30.1 ± 0.21 (0.99) | - | - |
| PLAPVOH | 41.9 ± 0.22 (0.65) | - | - | 37.1 ± 0.13 (0.98) | –176 ± 0.44 (1.00) | 145 ± 0.19 (1.00) |
| PLAmet | –3.62 ± 0.21 (0.01) | 44.8 ± 0.21 (0.67) | –28.4 ± 0.21 (0.38) | 20.8 ± 0.21 (1.00) | 22.3 ± 0.13 (0.41) | –8.86 ± 0.09 (0.10) |
Table 5.
DSC data for the thermal transitions observed on PLA film samples.
| Sample | 1st Scan | 2nd Scan | ||||||||||
|---|---|---|---|---|---|---|---|---|---|---|---|---|
| Tmonset (°C) | Tm (°C) | ΔHm (J/g) | Tgonset (°C) | Tg (°C) | Δcp (J/°C g) | Tconset (°C) | Tc (°C) | ΔHc (J/g) | Tmonset (°C) | Tm (°C) | ΔHm (J/g) | |
| PLA30 | 134 ± 0.3 | 147 ± 0.1 | 19 ± 0.2 | 54 ± 0.2 | 54 ± 0.1 | 0.5 ± 0.1 | 115 ± 0.3 | 128 ± 0.1 | 1.4± | 146 ± 0.3 | 149 ± 0.2 | 1.5 ± 0.0 |
| PLA40 | 139 ± 0.2 | 146 ± 0.1 | 16 ± 0.1 | 54 ± 0.2 | 55 ± 0.1 | 0.5 ± 0.3 | - | - | - | 145 ± 0.2 | 149 ± 0.2 | 0.7 ± 0.2 |
| PLASiOx | 136 ± 0.3 | 146 ± 0.2 | 18 ± 0.1 | 54 ± 0.3 | 55 ± 0.1 | 0.5 ± 0.1 | - | - | - | 145 ± 0.2 | 148 ± 0.1 | 0.4 ± 0.0 |
| PLAPVOH | 139 ± 0.2 | 147 ± 0.1 | 18 ± 0.1 | 54 ± 0.1 | 55 ± 0.1 | 0.6 ± 0.1 | 124 ± 0.2 | 129 ± 0.1 | 0.5± | 146 ± 0.2 | 149 ± 0.2 | 1.2 ± 0.1 |
| PLAmet | 143 ± 0.1 | 150 ± 0.1 | 24 ± 0.3 | 57 ± 0.1 | 58 ± 0.2 | 0.5 ± 0.2 | 116 ± 0.1 | 129 ± 0.1 | 4.5± | 147 ± 0.1 | 152 ± 0.1 | 3.6 ± 0.1 |
Table 6.
Crystallinity percentage calculated on standard sample and after 1 h/4 h of isothermally keeping the samples at different temperatures at different temperature.
Table 6.
Crystallinity percentage calculated on standard sample and after 1 h/4 h of isothermally keeping the samples at different temperatures at different temperature.
| Sample | Xc (%) Standard | Xc (%) iso at 5 °C | Xc (%) iso at 10 °C | Xc (%) iso at 20 °C | Xc (%) iso at 30 °C | Xc (%) iso at 40 °C |
|---|---|---|---|---|---|---|
| 1st scan | ||||||
| PLA30 | 20 ± 0.1 | 15 ± 0.1/19 ± 0.1 | 20 ± 0.1/22 ± 0.3 | 20 ± 0.0/18 ± 0.2 | 21 ± 0.1/21 ± 0.3 | 20 ± 0.3/15 ± 0.0 |
| PLA40 | 17 ± 0.1 | 19 ± 0.2/24 ± 0.1 | 19 ± 0.1/17 ± 0.1 | 22 ± 0.0/27 ± 0.2 | 25 ± 0.3/23 ± 0.2 | 22 ± 0.2/26 ± 0.0 |
| PLASiOx | 19 ± 0.0 | 18 ± 0.1/17 ± 0.2 | 19 ± 0.0/19 ± 0.0 | 19 ± 0.0/20 ± 0.0 | 19 ± 0.3/20 ± 0.4 | 18 ± 0.1/18 ± 0.1 |
| PLAPVOH | 20 ± 0.0 | 20 ± 0.1/20 ± 0.0 | 18 ± 0.0/20 ± 0.2 | 22 ± 0.1/21 ± 0.2 | 20 ± 0.0/22 ± 0.0 | 19 ± 0.2/20 ± 0.2 |
| PLAmet | 26 ± 0.2 | 23 ± 0.2/22 ± 0.3 | 27 ± 0.2/24 ± 0.0 | 26 ± 0.1/22 ± 0.1 | 25 ± 0.3/16 ± 0.4 | 23 ± 0.2/24 ± 0.2 |
| 2nd scan | ||||||
| PLA30 | 0.1 ± 0.1 | 1.0 ± 0.2/1.3 ± 0.1 | 3.0 ± 0.0/2.3 ± 0.0 | 2.8 ± 0.1/1.3 ± 0.0 | 1.6 ± 0.1/0.9 ± 0.0 | -/1.5 ± 0.0 |
| PLA40 | 0.8 ± 0.1 | 0.8 ± 0.1/1.0 ± 0.1 | 0.5 ± 0.0/0.8 ± 0.1 | -/1.1 ± 0.0 | 5.3 ± 0.1/0.8 ± 0.1 | 0.5 ± 0.1/4.6 ± 0.2 |
| PLASiOx | 0.4 ± 0.0 | 0.3 ± 0.1/0.4 ± 0.1 | 0.5 ± 0.1/0.6 ± 0.2 | 0.8 ± 0.1/0.2 ± 0.2 | -/0.5 ± 0.0 | 0.3 ± 0.0/0.4 ± 0.0 |
| PLAPVOH | 0.8 ± 0.0 | 0.8 ± 0.1/0.9 ± 0.0 | 0.2 ± 0.1/0.3 ± 0.0 | 0.5 ± /0.13.8 ± 0.2 | 0.9 ± 0.0/1.9 ± 0.1 | 0.8 ± 0.0/0.6 ± 0.1 |
| PLAmet | - | -/1.5 ± 0.0 | 2.8 ± 0.1/1.6 ± 0.0 | 2.3 ± 0.0/2.4 ± 0.2 | 2.8 ± 0.2/2.8 ±0.1 | -/2.3 ± 0.1 |
Table 7.
Tensile properties of PLA films.
| Polymer | Young’s Modulus (Et) (GPa) | Yield Strength (σy) (MPa) | Yield Strain (εy) (%) | Tensile Strength (σM) (MPa) | Strain at Tensile Strength (εM) (%) | Stress at Break (σB) (MPa) | Strain at Break (εB) (%) | Work up to Break (WB) (Nmm) | Energy Density up to Break (WB/V) (MJ/m2) |
|---|---|---|---|---|---|---|---|---|---|
| PLA30micron | 3.0 ± 0.3/ | 79.5 ± 11.9/ | 0.41 ± 0.01/ | 79.5 ± 11.9/ | 0.41 ± 0.01/ | 67.0 ± 11.2/ | 17.2 ± 3.5/ | 38.2 ± 11.2/ | 114 ± 33.5/ |
| MD/CD | 3.3 ± 0.4 | 80.2 ± 14.2 | 0.3 ± 0.01 | 80.2 ± 14.2 | 0.32 ± 0.02 | 80.2 ± 14.2 | 0.32 ± 0.02 | 4.6 ± 0.9 | 1.7 ± 0.4 |
| PLA40micron | 2.0 ± 0.1/ | 66.7 ± 5.0/ | 0.44 ± 0.04/ | 71.8 ± 3.5/ | 16.7 ± 0.16/ | 71.8 ± 3.5/ | 16.7 ± 0.16/ | 41.9 ± 1.6/ | 93.1 ± 3.6/ |
| MD/CD | 3.0 ± 0.1 | 75.9 ± 3.6 | 0.37 ± 0.02 | 95.8 ± 15.8 | 5.8 ± 1.3 | 95.8 ± 15.8 | 5.8 ± 1.3 | 18.9 ± 6.1 | 42.1 ± 1.5 |
| PLASiOx | 2.5 ± 0.2/ | 80.3 ± 4.8/ | 0.50 ± 0.00/ | 80.3 ± 4.8/ | 0.5 ± 0.00/ | 36.9 ± 2.2/ | 13.0 ± 0.4/ | 27.7 ± 4.5/ | 53.3 ± 8.6/ |
| MD/CD | 3.5 ± 0.2 | 95.9 ± 4.9 | 0.34 ± 0.02 | 117.1 ± 12.9 | 5.2 ± 0.6 | 100.2 ± 32.1 | 5.8 ± 0.3 | 26.0 ± 2.4 | 50.2 ± 4.5 |
| PLAPVOH | 2.9 ± 0.1/ | 90.3 ± 3.9/ | 0.46 ± 0.02/ | 90.3 ± 3.9/ | 0.46 ± 0.02/ | 71.6 ± 3.7/ | 4.1 ± 1.9/ | 9.2 ± 4.8/ | 29.4 ± 14.4/ |
| MD/CD | 3.7 ± 0.3 | 108.1 ± 10.1 | 0.46 ± 0.11 | 108.1 ± 10.1 | 0.46 ± 0.11 | 89.0 ± 9.5 | 2.1 ± 0.8 | 6.0 ± 2.3 | 17.9 ± 6.9 |
| PLAmetallised | 3.0 ± 0.1/ | 85.4 ± 5.3/ | 0.34 ± 0.03/ | 85.4 ± 5.3/ | 0.36 ± 0.03/ | 82.3 ± 3.5/ | 0.39 ± 0.07/ | 0.4 ± 0.1/ | 2.0 ± 0.5/ |
| MD/CD | 4.0 ± 0.1 | 105.8 ± 3.1 | 0.34 ± 0.01 | 141.2 ± 4.7 | 6.6 ± 0.4 | 141.2 ± 4.7 | 6.6 ± 0.4 | 14.9 ± 1.0 | 68.0 ± 4.3 |
© 2017 by the authors. Licensee MDPI, Basel, Switzerland. This article is an open access article distributed under the terms and conditions of the Creative Commons Attribution (CC BY) license (http://creativecommons.org/licenses/by/4.0/).
Share and Cite
MDPI and ACS Style
Siracusa, V.; Dalla Rosa, M.; Iordanskii, A.L. Performance of Poly(lactic acid) Surface Modified Films for Food Packaging Application. Materials 2017, 10, 850. https://doi.org/10.3390/ma10080850
AMA Style
Siracusa V, Dalla Rosa M, Iordanskii AL. Performance of Poly(lactic acid) Surface Modified Films for Food Packaging Application. Materials. 2017; 10(8):850. https://doi.org/10.3390/ma10080850
Chicago/Turabian StyleSiracusa, Valentina, Marco Dalla Rosa, and Alexey L. Iordanskii. 2017. "Performance of Poly(lactic acid) Surface Modified Films for Food Packaging Application" Materials 10, no. 8: 850. https://doi.org/10.3390/ma10080850
Note that from the first issue of 2016, this journal uses article numbers instead of page numbers. See further details here.