Investigations for Thermal and Electrical Conductivity of ABS-Graphene Blended Prototypes


1
Department of Production Engineering, Guru Nanak Dev Engineering College, Ludhiana 141006, India
2
Department of Engineering, University of Salerno, 84084 Fisciano, Italy
3
Department of Engineering, University of Naples Parthenope, 80143 Naples, Italy
*
Author to whom correspondence should be addressed.
Materials 2017, 10(8), 881; https://doi.org/10.3390/ma10080881
Submission received: 2 July 2017
/
Revised: 16 July 2017
/
Accepted: 25 July 2017
/
Published: 31 July 2017
(This article belongs to the Special Issue Recycled Materials, Eco-design and 3D Printing)
Abstract
:The thermoplastic materials such as acrylonitrile-butadiene-styrene (ABS) and Nylon have large applications in three-dimensional printing of functional/non-functional prototypes. Usually these polymer-based prototypes are lacking in thermal and electrical conductivity. Graphene (Gr) has attracted impressive enthusiasm in the recent past due to its natural mechanical, thermal, and electrical properties. This paper presents the step by step procedure (as a case study) for development of an in-house ABS-Gr blended composite feedstock filament for fused deposition modelling (FDM) applications. The feedstock filament has been prepared by two different methods (mechanical and chemical mixing). For mechanical mixing, a twin screw extrusion (TSE) process has been used, and for chemical mixing, the composite of Gr in an ABS matrix has been set by chemical dissolution, followed by mechanical blending through TSE. Finally, the electrical and thermal conductivity of functional prototypes prepared from composite feedstock filaments have been optimized.
1. Introduction
Polymeric conductive composites have been explored because of their innumerable advantages over metals in various applications. Power gadgets, electric engines, generators, and thermal exchangers represent some exemplary applications of conductive composites. These composites are lightweight, have better process-capacity, and are shock resistant. Carbon fillers, which have a high thermal and electrical conductivity, can be used to make such polymer composites [1]. Polymers are also used as insulating materials. However, a lot of effort is exerted in order to improve their properties, especially their thermal conductivity. High thermal conductivity is desirable for heat to be efficiently dissipated. Polymers exhibit a low thermal conductivity because of their relatively low atomic density, weak interactions or chemical bonding, and complex crystal structure in their molecular vibrations [2]. The thermal and electrical conductivity of polymers have been traditionally enhanced by the addition of thermally conductive fillers including graphite, carbon black, carbon fibers, Gr, and ceramic or metal particles [3]. Gr is an allotrope of carbon having single layer sp2 hybridization arranged in a two-dimensional hexagonal lattice. The material has been of intense interest because of its mechanical, thermal, and electrical properties [4].
Fused deposition modelling (FDM) is one of the additive manufacturing (AM) technologies which works on an additive principle where material in the form of layers is extruded from a nozzle tip [5]. The developments of new materials for FDM are needed to develop in order to increase its application domain in various areas [6,7,8,9,10,11]. The use of recycled plastic waste for the manufacturing of sustainable FDM filaments [12,13,14] is receiving special attention. The use of additive manufacturing techniques for the rapid prototyping of unconventional materials and structures with properties mainly derived from their geometric design, such as cutting-edge reinforcing elements of novel composite materials [15,16,17], and mechanical meta-materials [18,19,20,21,22] is also of increasing interest. A key requirement for any material to be used in FDM is the compatibility of the material with an existing FDM setup without changing the functional hardware/software of the machine. Apart from compatibility, the mechanical, electrical, and thermal properties of the material are also important for its industrial applications [5].
Very few reports of in-house development of an ABS–Gr feedstock filament (from low cost graphite material) for FDM [22,23,24] have appeared. The development of feedstock filament using nanoplatelets of Gr and ABS in various proportions with an aim to improving electrical and thermal properties of filament wire has previously been reported. Commercially available Gr platelets are quite expensive for batch production activities. Polymer composites (PCs) have attracted attention due to the possibility of improving the properties of primary matrices with the addition of small amounts of an appropriate filler. Adding materials such as carbon nanotubes, nanowires, nanoparticles, and Gr to matrices such as polymers, metals, and ceramics via AM has the potential to improve the performances of the resulting components [25,26]. In particular, reinforcing materials have been considered in the form of spherical particles such as titanium dioxide [27] or fumed silica [28], microfibers such as jute fibers [27], short glass fibers [29], and carbon fibers [30,31], nanofibers such as vapor-grown carbon fibers [32], carbon nanotubes [33,34,35], and nanoclays [36]. Recently, Gr has been investigated as a probable reinforcing agent for polymer-based composites. This kind of filler has been used as a multifunctional reinforcement because it possesses a 2D lattice structure resulting in stupendous mechanical, electrical, and thermal properties. The generated composite, ABS reinforced with Gr, shows enhancement of its mechanical properties and electrical and thermal stability [35,36,37,38].
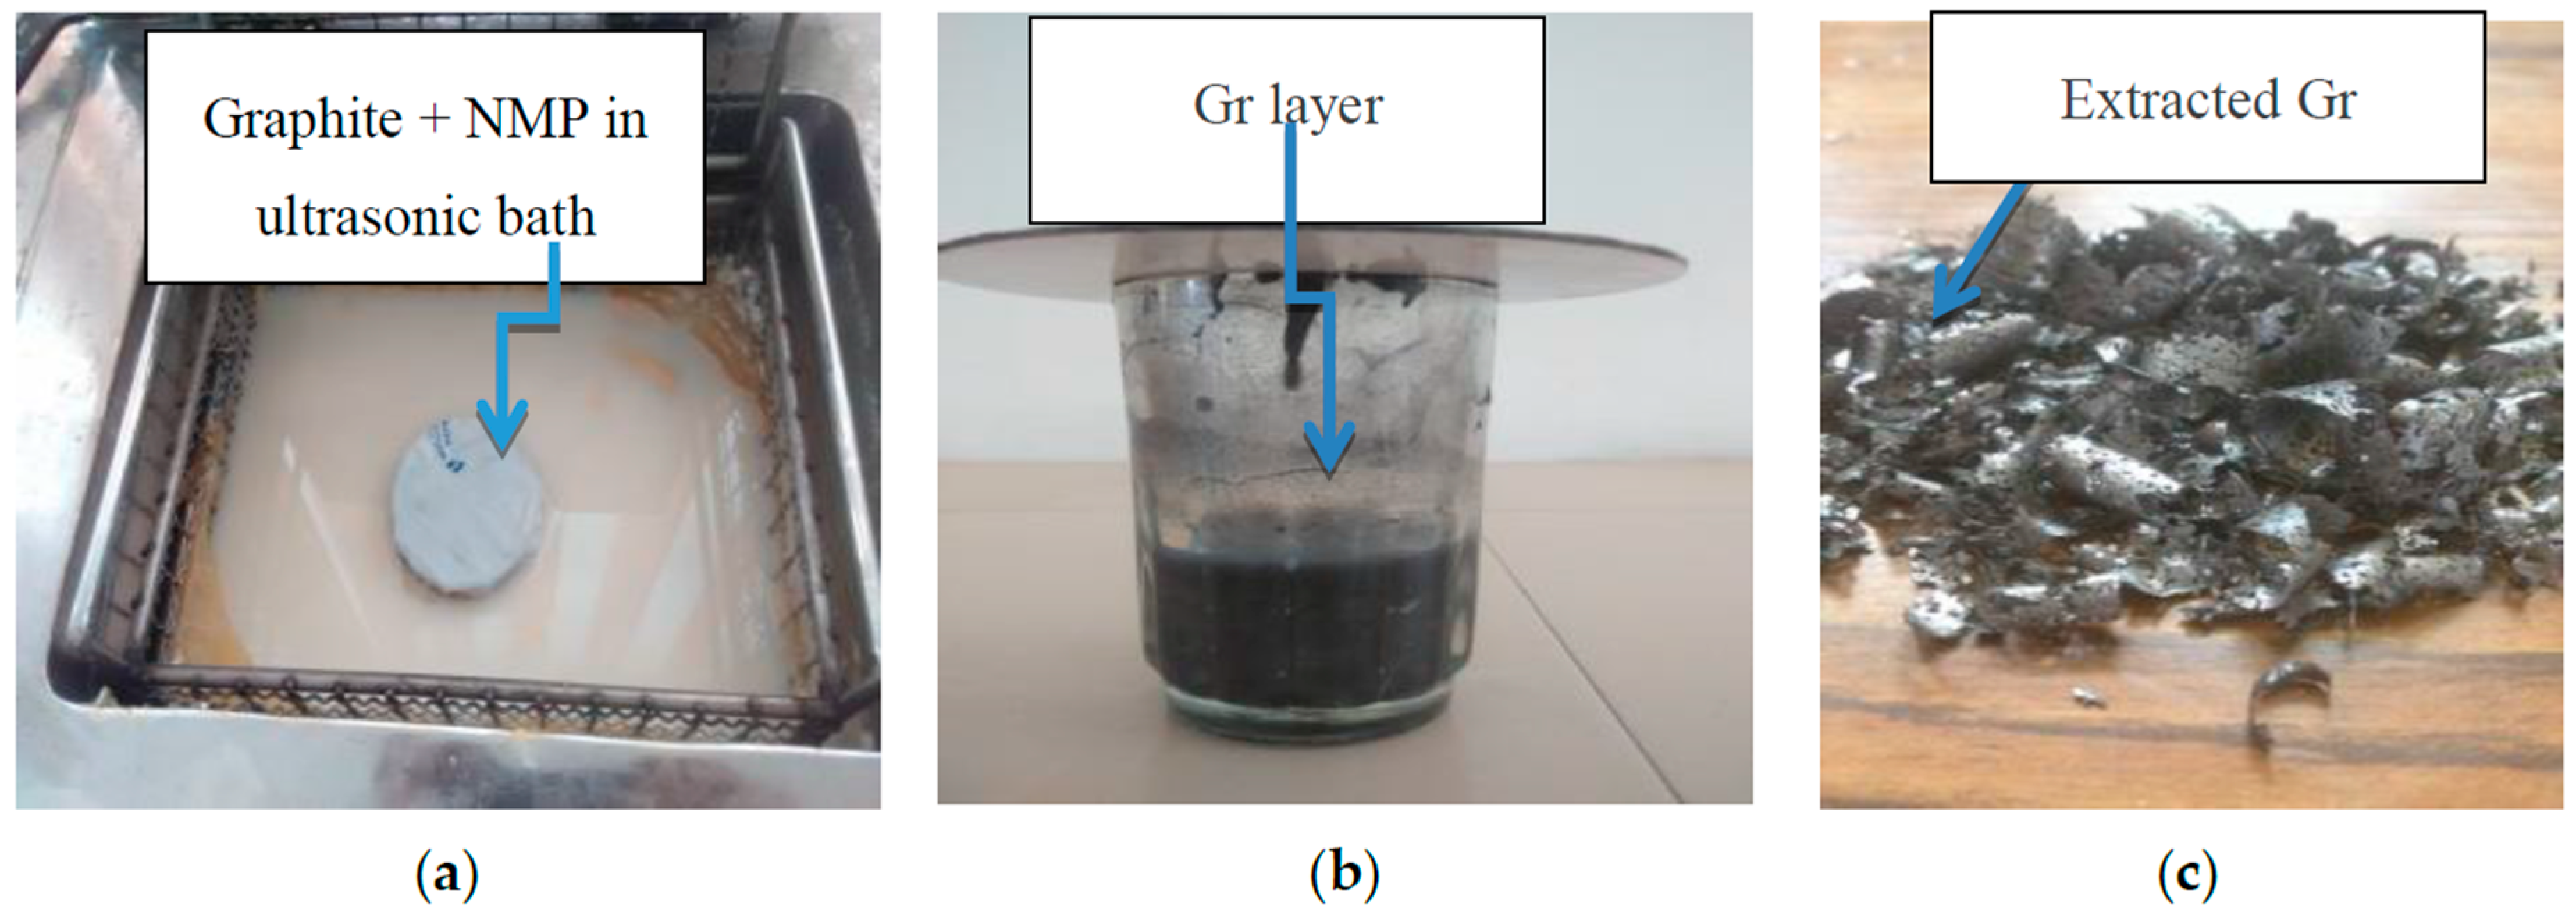
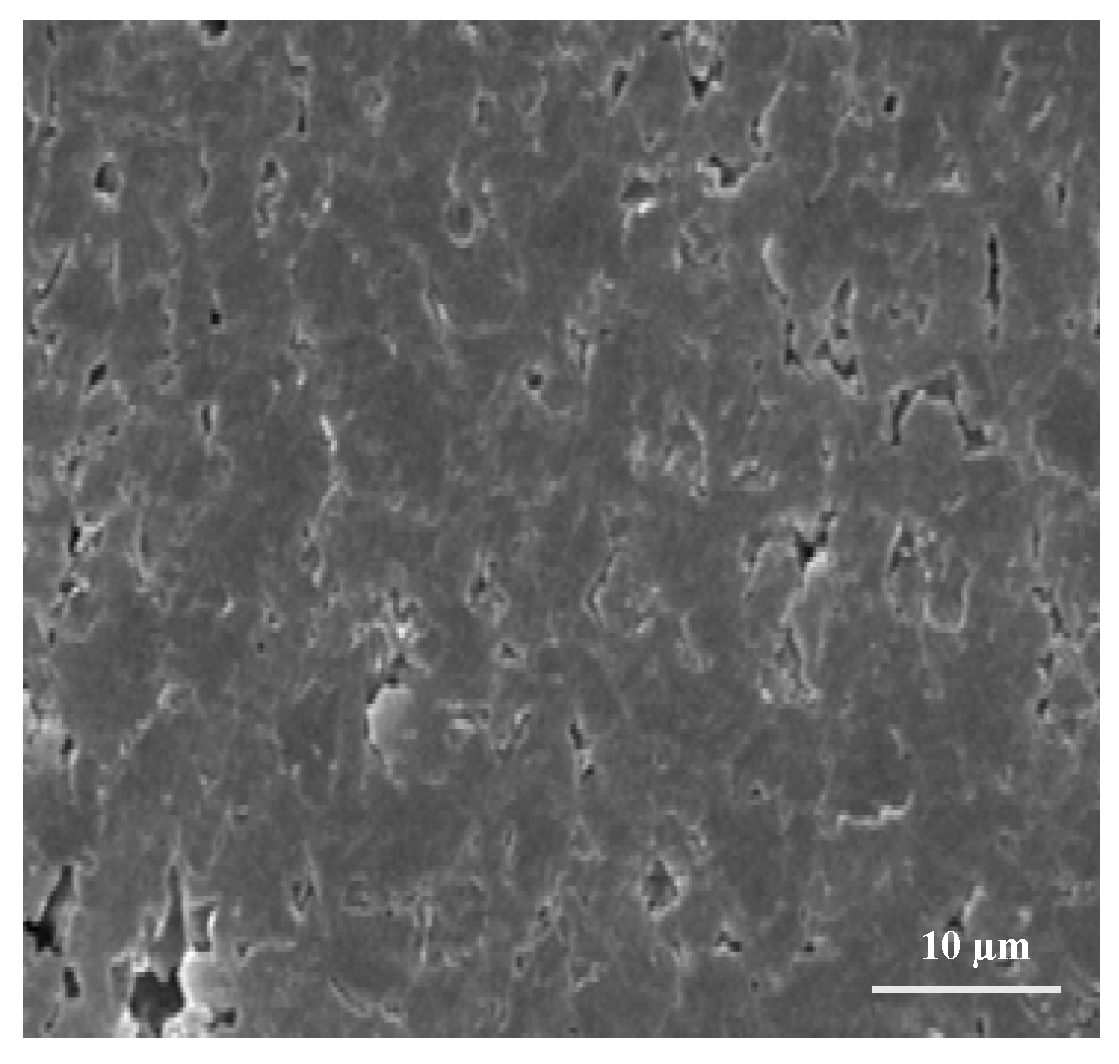
The present study reveals an effective and efficient method for preparation of a Gr-based polymer composite by direct exfoliation of graphite in organic solvents with addition of naphthalene. The Gr concentration of the dispersion in N-methylpyrrolidone (NMP) may be as high as 0.15 mg/mL. Naphthalene serves as a molecular wedge to intercalate into the edge of graphite, which plays a key role during sonication (see Figure 1a) and significantly improves the production yield of Gr (see Figure 1b,c). Figure 2 shows the scanning electron microscope (SEM) image of the extracted Gr.
As observed from Figure 2, uniform 2D structures have been obtained. This means that the functional group of graphene has not been disturbed. The present study highlights the alternative method for exfoliation of graphite at the lab scale. In this work, out of 50 g graphite, around 3.7 g grapheme was finally extracted. Further chemical analysis may be conducted for ascertaining whether the exfoliation is complete or not. This was not conducted in the present study. The Gr dispersions synthesized by this method can be effectively employed in forming conducting plastic polymer composites by chemical dissolution of Gr (by chemical mixing and by mechanical blending). For chemical mixing, Gr was dispersed in an acetone solution of ABS. The composite slurry was dried in hot air oven at 70 °C for 1.5 h. The resulting lump of composite material was crushed mechanically and fed into TSE. The commercially available Thermo Scientific HAAKE Mini CTW (Make: Karlsruhe, Germany) was used for feedstock filament preparation. The screw rotation speed of 200 RPMs with a load of 10 kg at 180 °C was regulated in order to obtain a final diameter of the extruded filament of 1.75 ± 0.10 mm. In case of mechanical blending, the Gr and ABS were directly fed into the hopper of the TSE. Finally, the polymer composite filament was prepared and fed to FDM for fabrication of functional prototypes.
2. Experimentation
The commercially-available ABS was procured from local market (Batra Polymers, Ludhiana, India) having melt flow index (MFI) of 2.9 g/10 min as per the ASTM D 1238-73 standard [39]. The graphite powder (thermal conductivity: 2–90 W/m K) was supplied by Bharat Graphite Pvt. Ltd. (Ludhiana, India). NMP and acetone acted as dissolute and was supplied by Saiteja Chemicals, Hyderabad, India. The acetone acts as a polar aprotic organic solvent that can generally solvate a wide variety of polymers. This solvent can make a dilute ABS solution that can use the intermolecular forces to bond the plastic polymer to Gr. In order to prepare conductive polymer, the Gr was added to the ABS matrix. For addition of Gr in ABS, the MFI values were calculated (see Table 1).
Based upon Table 1, the preliminary experiment was conducted with 25 g Gr blended with 75 g ABS and 40 g acetone (for chemical + mechanical mixing). The resulting weight proportion of Gr has been calculated by using following formula:
Similarly, for another proportion of 90 g ABS and 10 g Gr dispersed in 40 g acetone, the resulting weight proportion of Gr is 7.69%. Finally, these two proportions were taken to conduct the further experimentation.
2.1. Thermal Conductivity Measurement
Figure 3 shows the lab apparatus used to measure thermal conductivity by Lee’s disc method [40]. It consists of two metallic discs and a deep hollow cylinder (steam chamber). The disc has inlet and outlet tubes for steam. In addition, it has radial holes to insert thermometers. The sample is placed within the discs; the upper disc is connected to the hot chamber with the steam inlet. When steam is passed through the cylindrical vessel, a steady state is reached. At the steady state, heat conducted through the bad conductor is equal to heat radiated from the Lees disc. The chamber was set at 70 °C for 2 h.
- k—Thermal conductivity of the sampleA—Cross sectional areat2 − t1—Temperature difference across samplesx—Thickness of the samplem—Mass of the discc—Specific heat capacity of disc
The rate of cooling/temperature gradient (dT/dt) has been calculated by plotting the graph of temperature and time.
2.2. Electrical Conductivity Test
In order to calculate electrical conductivity, Ohm’s law was used. According to the law, at a steady temperature, the current flowing through a settled straight resistance specifically corresponds to the voltage, and, furthermore, is inversely related to the resistance. This relation between the voltage, current, and resistance forms the basis of Ohm’s Law and is demonstrated as follows.
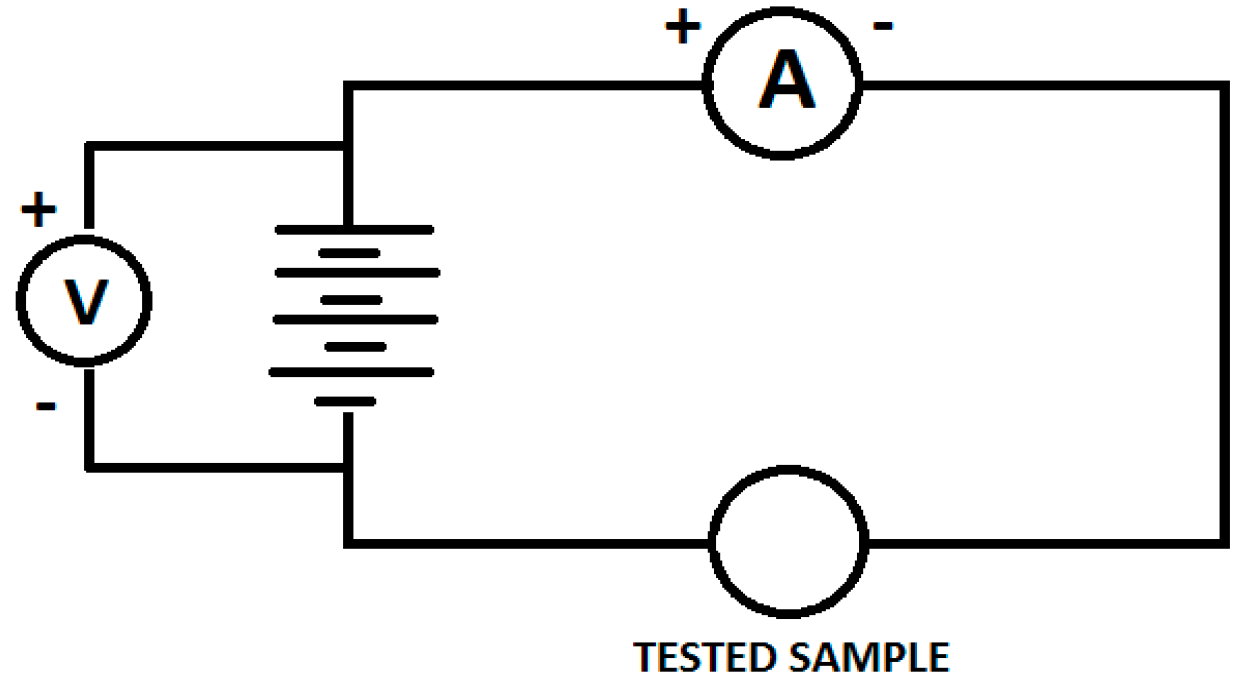
In order to evaluate electrical conductivity, 12 V supply is connected across the ammeter and the sample. When the voltage passes across the sample, the ammeter provides a value in amperes (see Figure 4). The values of voltmeter and ammeter were then used to measure the resistance across the sample using Ohm’s law.
Further, the cross-sectional area and length of the sample was measured using digital Vernier caliper (Make: Mitutoyo, Japan) to measure the resistivity. The Resistivity () of the sample was calculated as:
where R = Resistance, l = length of the sample, A = cross sectional area of sample.
It is assumed that the current is uniform over the cross-range of the wire. The inverse of resistivity is called conductivity.
Electrical conductivity, σ = in S/m (Siemens/meter).
2.3. Printing of Functional Prototypes
3D printed specimens were prepared on Accucraft i250 FDM printer (Make: DivideByZero, Mumbai, India) with the extruded filaments. Figure 5 shows a disc prepared as a functional prototype.
For printing of functional prototypes, commercially available Slic3r software (Slic3r is licensed under the GNU Affero General Public License, version 3, Italy) was used. The fixed parameters were honeycomb pattern, nozzle diameter 0.4 mm, layer height 0.4 mm, nozzle temperature 230 °C, and bed temperature 55 °C. Table 2 shows the variable input parameters.
Based upon Table 2, Taguchi L8, Orthogonal array has been selected. Table 3 shows control log of experiment.
Based upon Table 3, electrical and thermal conductivity has been measured. The experiment was repeated three times in order to reduce the experimentation error.
3. Results and Discussion
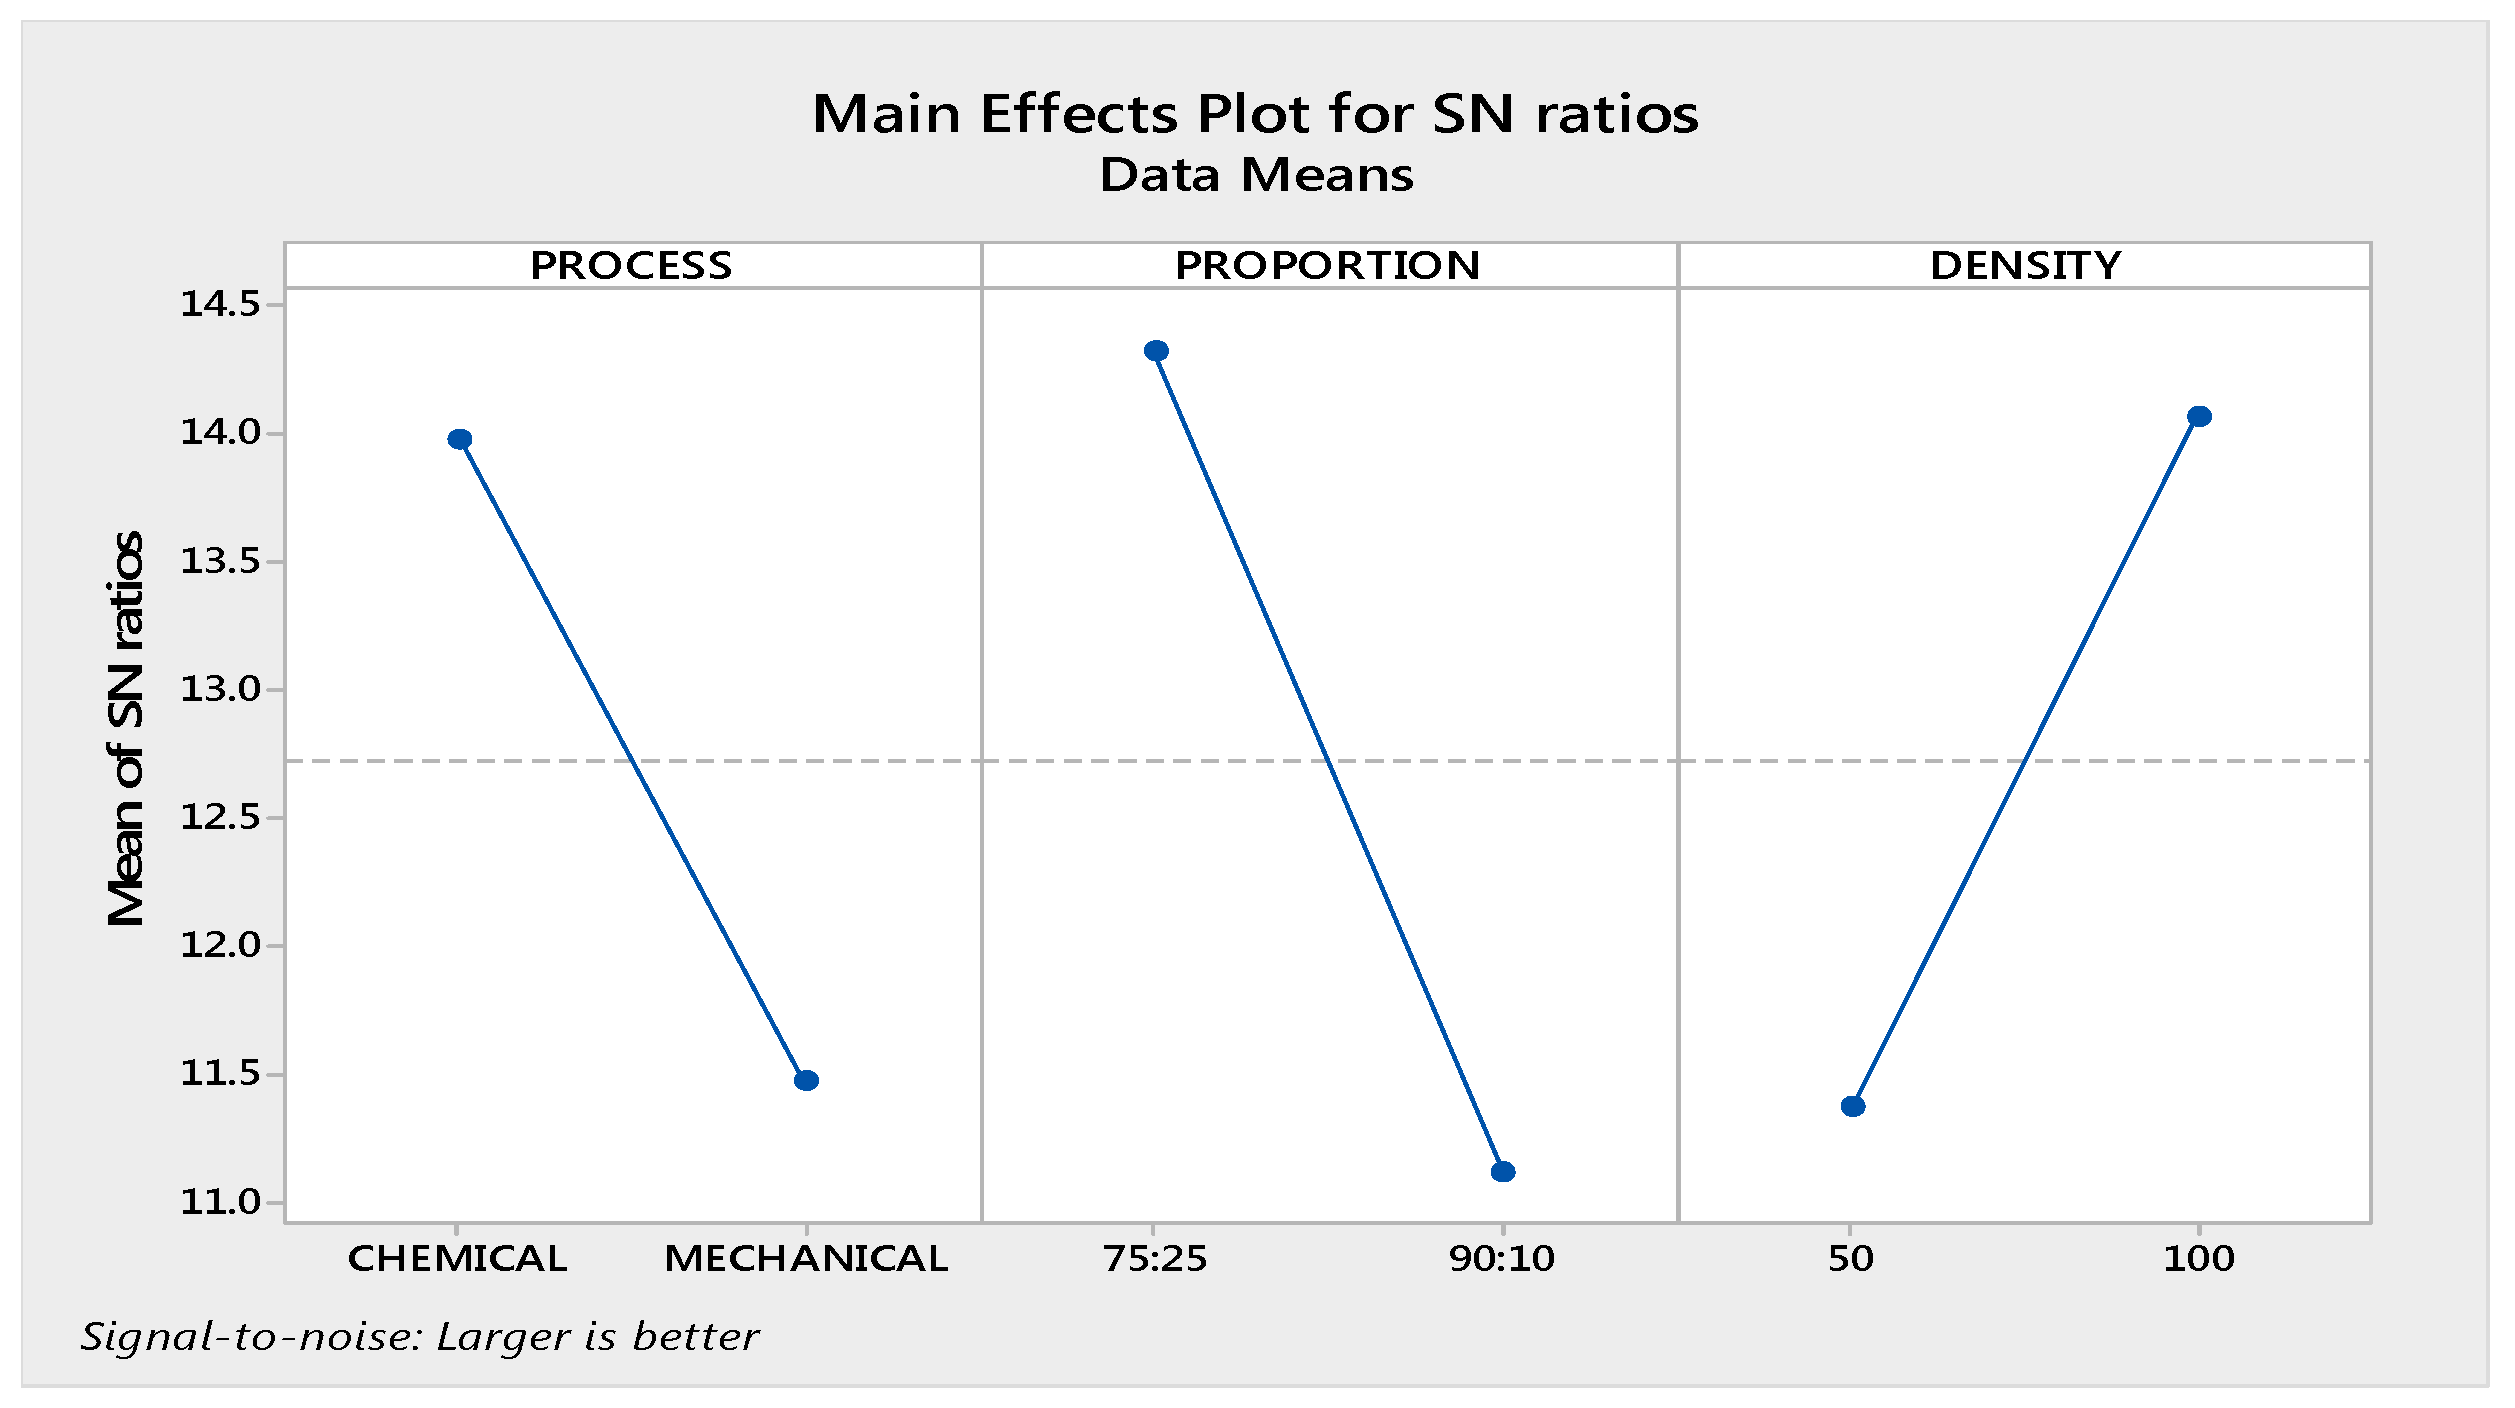
The obtained results for electrical conductivity were calculated for the ‘larger is better’ case by using Minitab17 software (Minitab Ltd., Coventry, UK). Figure 6 shows the main effect plot for the SN ratio for electrical conductivity. As observed from Figure 4, the best setting of input parameters for electrical conductivity is a chemical dissolute sample with proportion 75:25 and in-fill density of 100%.
The results are obvious because chemically blended composites with a high proportion of Gr and high in-fill density must have high electrical conductivity. Further, Table 5 and Table 6 respectively shows the percentage contribution of input parameters based upon analysis of variance (ANOVA) and their rankings.
Residual error was obtained as 4.10% with maximum contribution of proportion, i.e., 41.44% predicts the model for electrical conductivity of a chemically dissolute sample with proportion 75:25 and in-fill density of 100% as having high accuracy. The results are at 95% confidence level.
3.1. Optimization of Electrical Conductivity
The optimum value has been predicted by using following formula:
where,
ηopt = m + (mA1 − m) + (mB1 − m) + (mC2 − m)
- m = overall mean of SN datamA1= mean of SN data for process at level 1mB1 = mean of SN data for proportion at level 1mC2 = mean of SN data for density at level 2yopt2 = (1/10)ηopt/10 for properties, lesser is betteryopt2 = (10)ηopt/10 for properties, Larger is better
Overall mean of SN ratio (m) was taken from Minitab 17.
m = 12.7
Now, from response table of signal to noise ratio, mA1 = 13.97, mB1 = 14.32, mC2 = 14.07.
From here,
ηopt = m + (mA1 − m) + (mB1 − m) + (mC2 − m)
ηopt = 16.96 db
Now,
yopt2 = (10)ηopt/10
yopt2 = (10)16.96/10
yopt = 7.05 S-m
So, the optimum calculated electrical conductivity is 7.05 S-m. The observed value at these setting is 7.29 S-m.
3.2. Optimization of Thermal Conductivity
The optimum value has been predicted by using following formula:
where,
ηopt = m + (mA1 − m) + (mB1 − m) + (mC2 − m)
- m = overall mean of SN datamA1 = mean of SN data for process at level 1mB1 = mean of SN data for proportion at level 1mC2 = mean of SN data for density at level 2yopt2 = (1/10)ηopt/10 for properties, lesser is betteryopt2 = (10)ηopt/10 for properties, Larger is better
Adding up, Overall mean of SN ratio (m) was taken from Minitab17.
m = 15.3
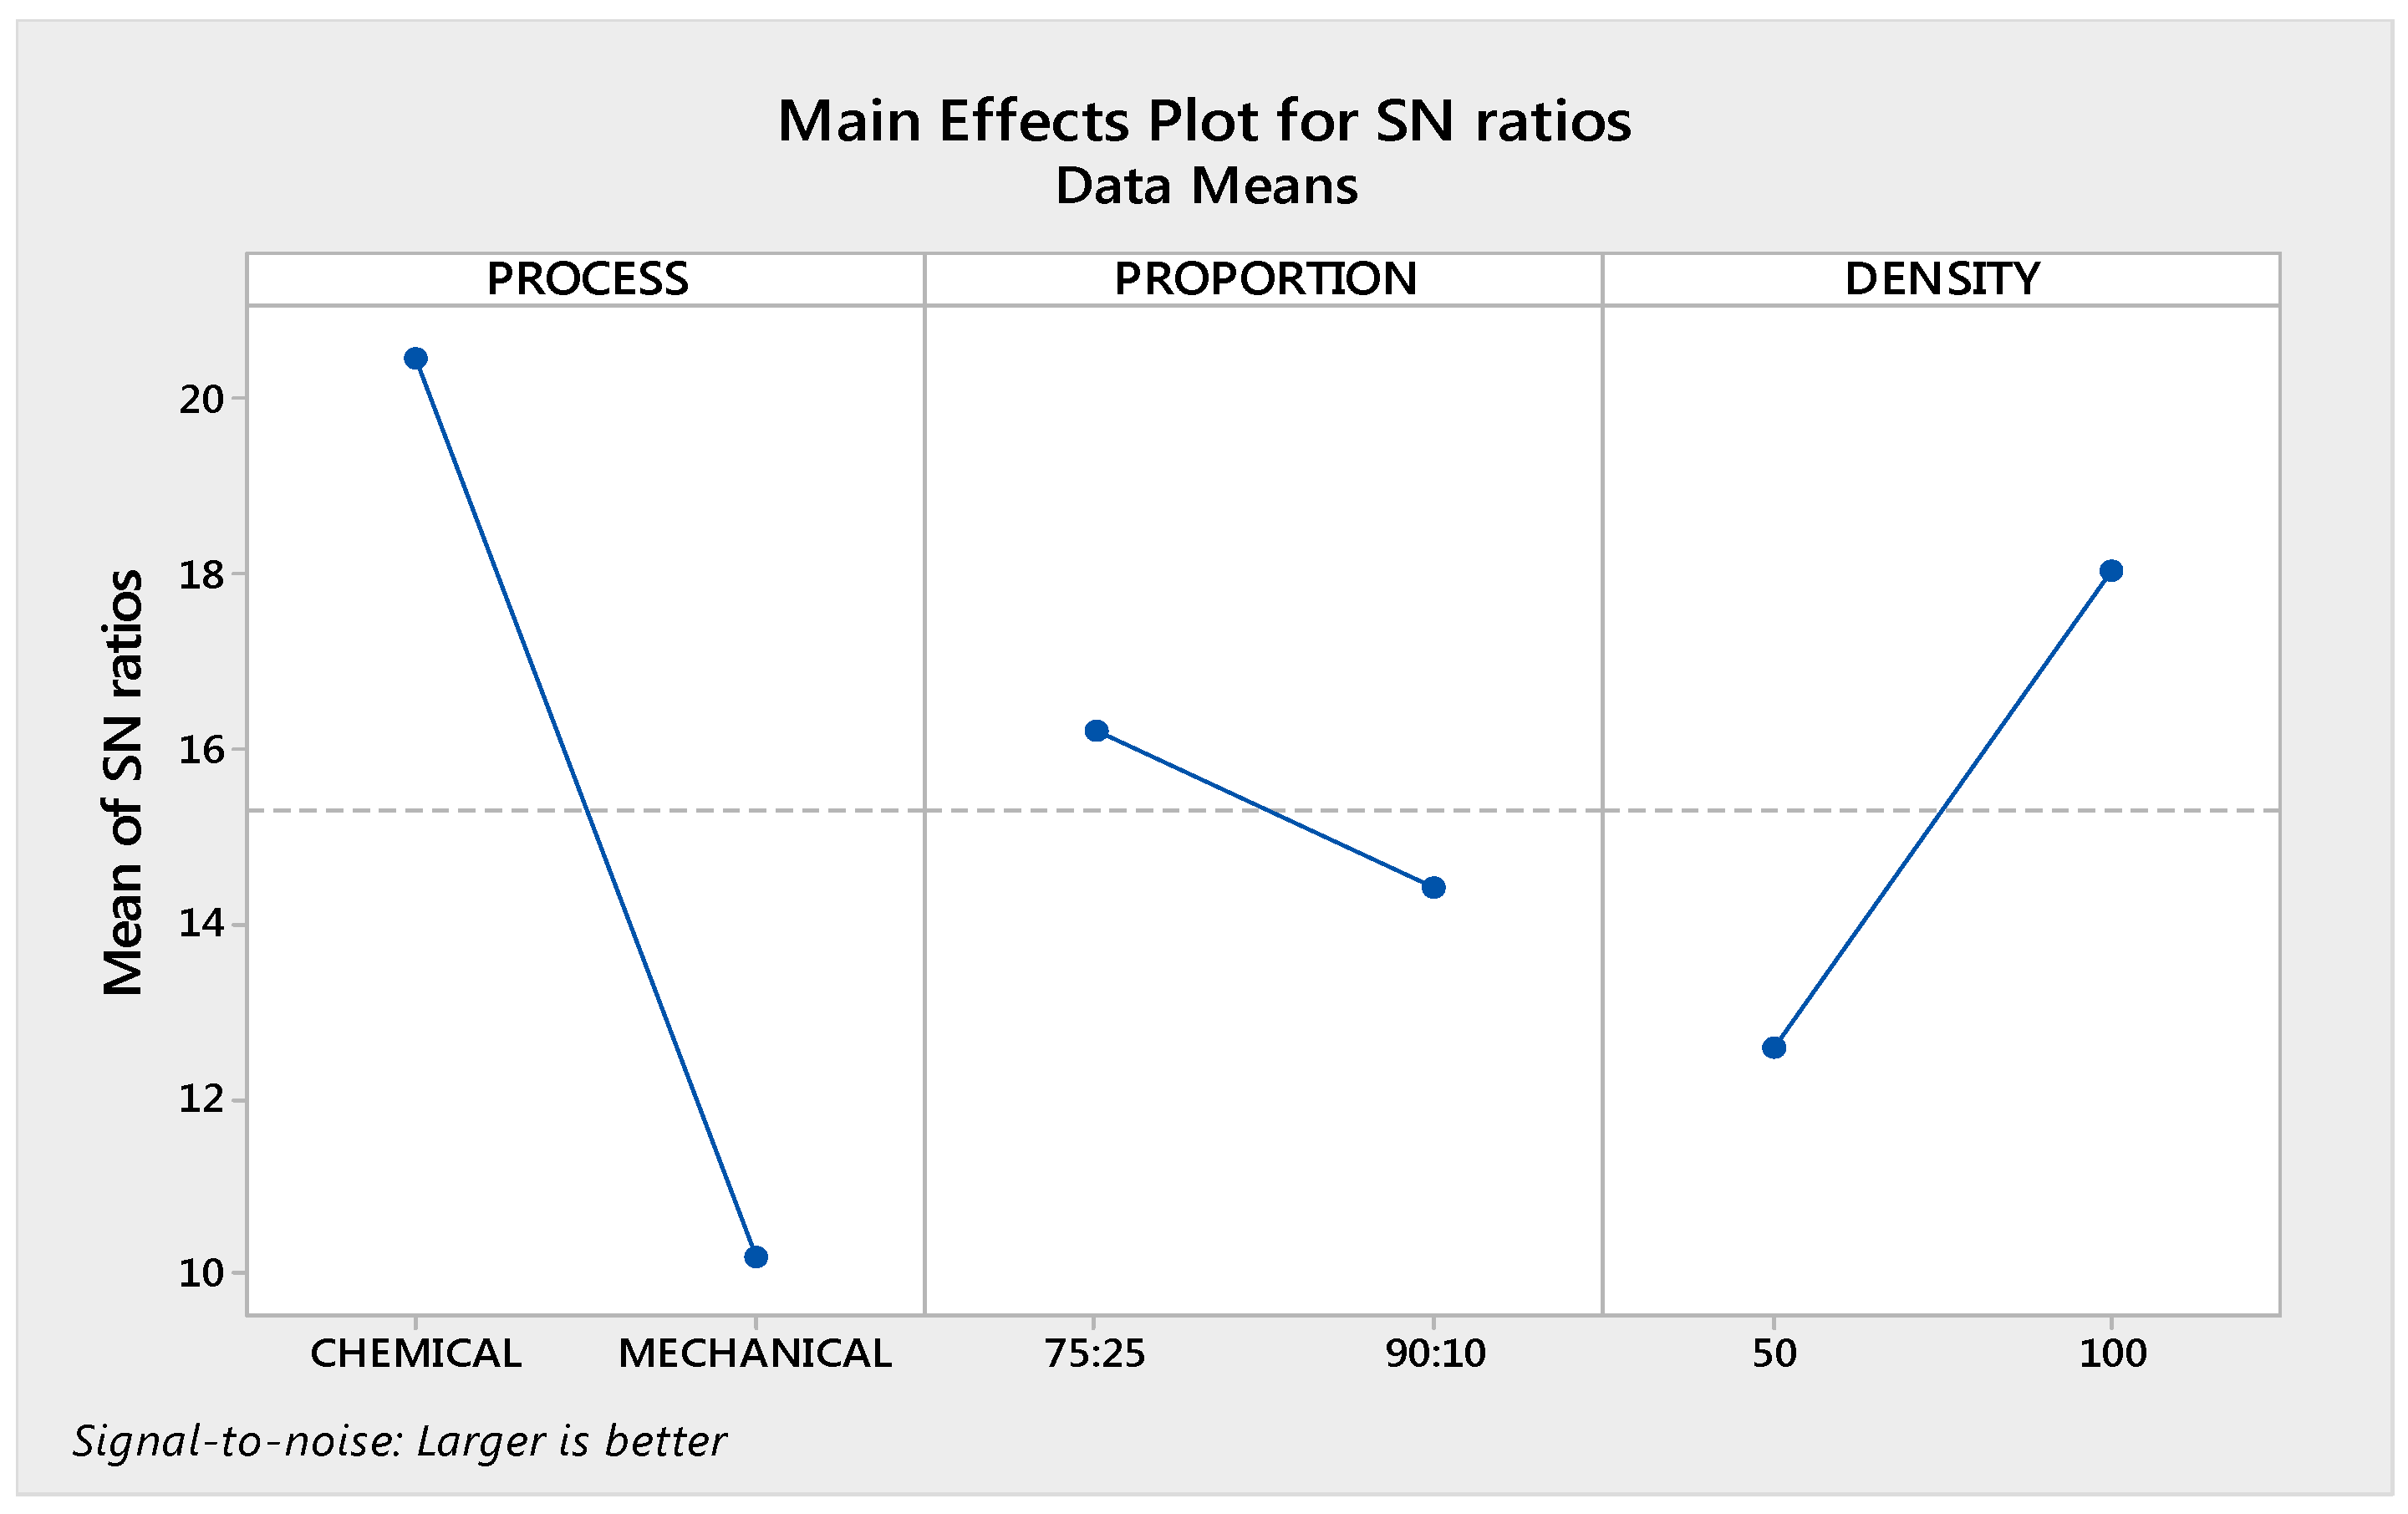
Now, from response table of signal to noise ratio, mA1 = 20.45, mB1 = 16.20, mC2 = 18.04. From here,
ηopt = m + (mA1 − m) + (mB1 − m) + (mC2 − m)
ηopt = 24.09
ηopt = 24.09
Now,
yopt2 = (10)ηopt/10
yopt = 16.01 W/mK
yopt = 16.01 W/mK
The calculated value for thermal conductivity is 16.01 W/mK and observed value is 17.60 W/mK.
3.3. Optical Micrograph Observations for Porosity
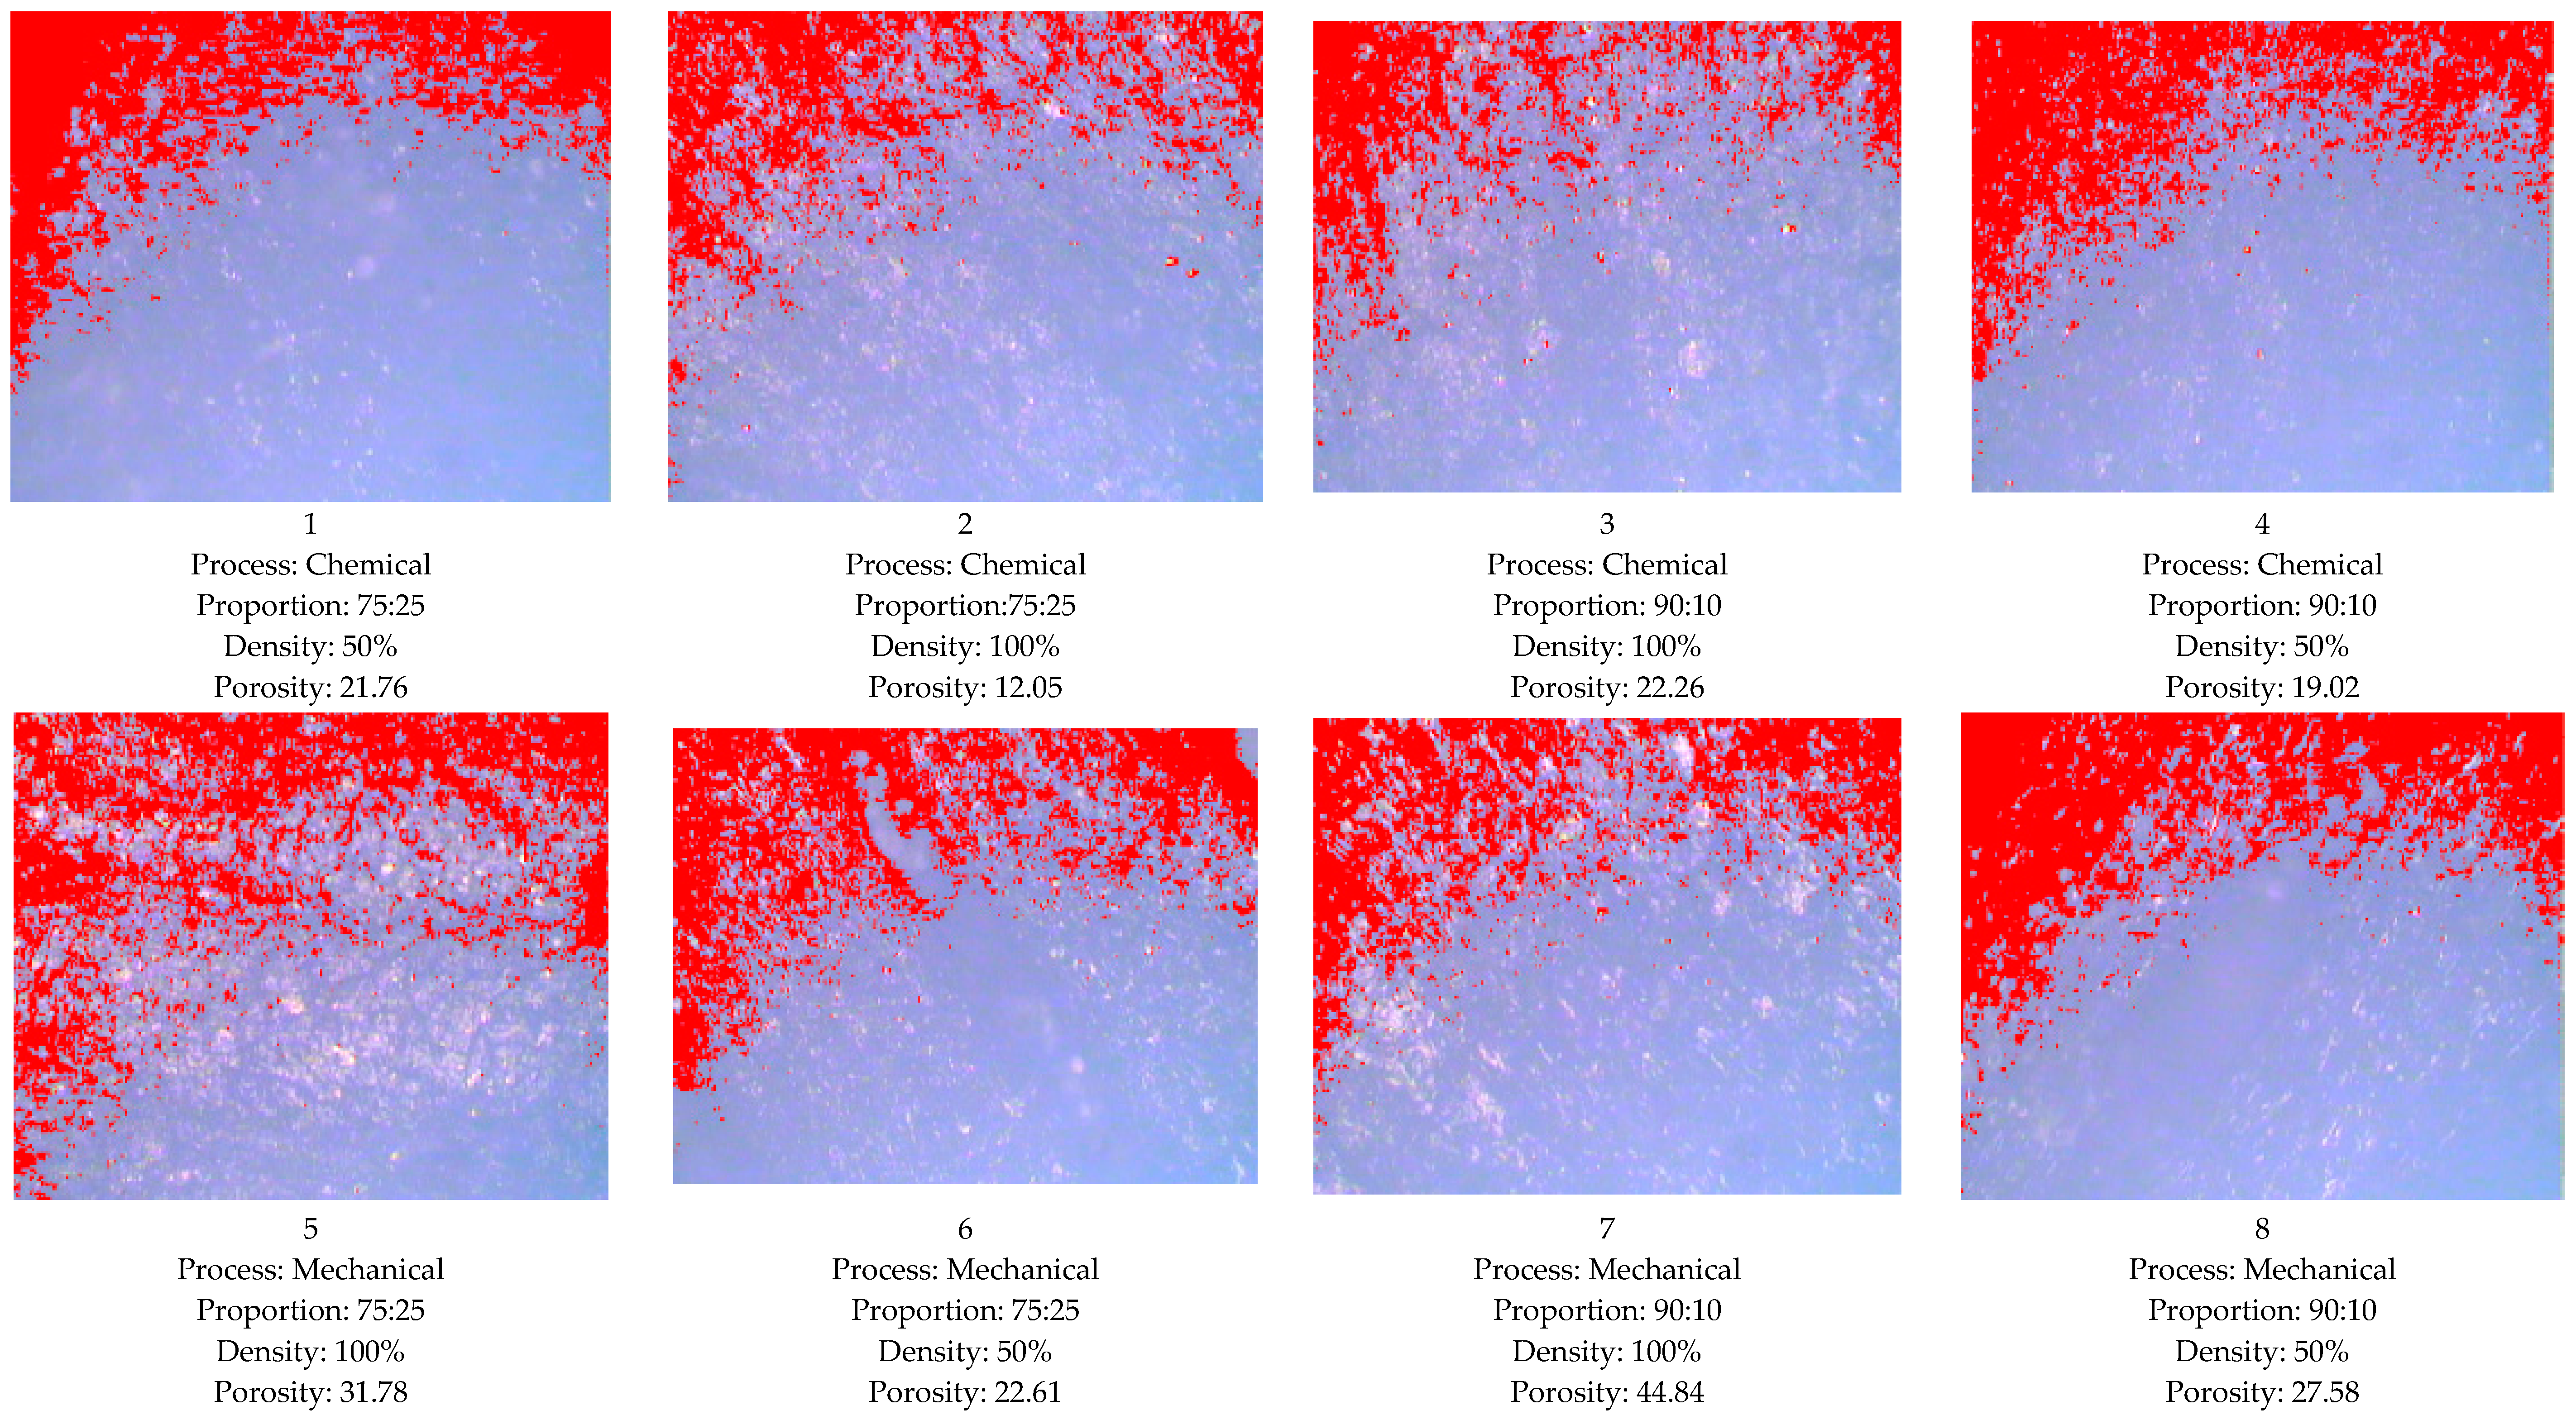
Further based upon Table 3, the samples prepared were examined for porosity by optical microscopy at 100× (see Figure 8). For measurement of porosity, the ASTM E2015-04 and ASTM B276 standards were adopted. The commercial software “MIAS” has been used to provide digital output in the form of porosity by converting the image captured into grey-scale. It should be noted that surface roughness can be calculated by this optical way, but this has not been measured in this study. As observed from Figure 8 for sample 2, minimum porosity was observed, which may have contributed to better thermal and electrical properties. The shore D hardness for sample number 2 was measured, and comes out to be 66.3, and for the highest porosity sample, number 7, it comes out to be 59.6. This is counter-verification of the fact that with the better thermal and electrical properties of sample number 2, mechanical properties were also improved by addition of Gr in ABS matrix.
4. Conclusions
The FDM feedstock filament with an ABS–Gr matrix has been successfully prepared by exfoliation of graphite at the lab scale. The blending of Gr in ABS has been processed by two methods, mechanical mixing and chemical + mechanical mixing. Finally, the feedstock filament has been successfully used for preparing functional prototypes. The results of the present case study suggest that the electrical and thermal conductivity and mechanical properties of the functional prototypes have been improved. The proportion of Gr in the ABS matrix is the significant parameter which influences the electrical conductivity, followed by the in-fill density and the process used for blending. Whereas for thermal conductivity, the process used for blending (chemical and mechanical mixing), followed by in-fill density and proportion of Gr in the ABS matrix are significant parameters. The Gr-blended ABS specimens with improved mechanical, thermal, and electrical properties can be used for a number of engineering applications. Their association with recycled materials for the manufacturing of innovative, sustainable composites awaits attention [41,42].
Supplementary Materials
Supplementary File 1Acknowledgments
The authors are thankful to DST (GoI), File No. TSG/NTS/2014/104 for financial support.
Author Contributions
Rupinder Singh, Gurleen S. Sandhu, Rosa Penna and Ilenia Farina have jointly worked under preliminary studies for exploring Indian-Italian research project. The experimental studies have been conducted by Gurleen Singh Sandhu and Rupinder Singh in India and analysis part have been taken care by Rosa Penna and Ilenia Farina in Italy.
Conflicts of Interest
The authors declare no conflict of interest.
References
- Han, Z.; Fina, A. Thermal conductivity of carbon nanotubes and their polymer nanocomposites: A review. Prog. Polym. Sci. 2011, 36, 914–944. [Google Scholar] [CrossRef]
- Shindé, S.L.; Goela, J. High Thermal Conductivity Materials; Springer: New York, NY, USA, 2006; Volume 91. [Google Scholar]
- Sandhu, S.G. Investigations for Development of ABS-Grephene Blended Feed Stock Filament for FDM Applications. Master’s Thesis, Guru Nanak Dev Engineering College, Ludhiana, India, 2017. [Google Scholar]
- Novoselov, K.S.; Geim, A.K.; Morozov, S.V.; Jiang, D.; Zhang, Y.; Dubonos, S.V.; Grigorieva, I.V.; Firsov, A.A. Electric field effect in atomically thin carbon films. Science 2004, 306, 666–669. [Google Scholar] [CrossRef] [PubMed]
- Singh, R.; Singh, S. Development of nylon based FDM filament for rapid tooling application. J. Inst. Eng. Ser. C 2014, 95, 103–108. [Google Scholar] [CrossRef]
- Mostafa, N.; Syed, H.M.; Igor, S.; Andrew, G. A study of melt flow analysis of an ABS-Iron composite in fused deposition modelling process. Tsinghua Sci. Technol. 2009, 14, 29–37. [Google Scholar] [CrossRef]
- Singh, R.; Singh, S.; Fraternali, F. Development of in-house composite wire based feed stock filaments of fused deposition modelling for wear-resistant materials and structures. Compos. Part B Eng. 2016, 98, 244–249. [Google Scholar] [CrossRef]
- Singh, C.J.; Singh, R.; Boparai, K.S.; Penna, R.; Fraternali, F. Dimensional accuracy analysis of coupled fused deposition modeling and vapour smoothing operations for biomedical applications process. Compos. Part B Eng. 2017, 117, 138–149. [Google Scholar]
- Farina, I.; Fabbrocino, F.; Carpentieri, G.; Modano, M.; Amendola, A.; Goodall, R.; Feo, L.; Fraternali, F. On the reinforcement of cement mortars through 3D printed polymeric and metallic fibers. Compos. Part B Eng. 2016, 90, 76–85. [Google Scholar] [CrossRef]
- Naddeo, F.; Naddeo, A.; Cappetti, N. Novel “load adaptive algorithm based” procedure for 3D printing of lattice-based components showing parametric curved micro-beams. Compos. Part B Eng. 2017, 115, 51–59. [Google Scholar] [CrossRef]
- Naddeo, F.; Naddeo, A.; Cappetti, N. Novel “load adaptive algorithm based” procedure for 3D printing of cancellous bone-inspired structures. Compos. Part B Eng. 2017, 115, 60–69. [Google Scholar] [CrossRef]
- Singh, N.; Hui, D.; Singh, R.; Ahuja, I.P.S.; Feo, L.; Fraternali, F. Recycling of plastic solid waste: A state of art review and future applications. Compos. Part B Eng. 2017, 115, 409–422. [Google Scholar] [CrossRef]
- Singh, R.; Singh, N.; Fabbrocino, F.; Fraternali, F.; Ahuja, I. Waste management by recycling of polymers with reinforcement of metal powder. Compos. Part B Eng. 2016, 105, 23–29. [Google Scholar] [CrossRef]
- Singh, R.; Bedia, P.; Fraternali, F.; Ahuja, I. Effect of single particle size, double particle size and triple particle size Al2O3 in Nylon-6 matrix on mechanical properties of feed stock filament for FDM. Compos. Part B Eng. 2016, 106, 20–27. [Google Scholar] [CrossRef]
- Fraternali, F.; Spadea, S.; Berardi, V.P. Effects of recycled PET fibers on the mechanical properties and seawater curing of Portland cement-based concretes. Constr. Build. Mater. 2014, 61, 293–302. [Google Scholar] [CrossRef]
- Spadea, S.; Farina, I.; Carrafiello, A.; Fraternali, F. Recycled nylon fibers as cement mortar reinforcement. Constr. Build. Mater. 2015, 80, 200–209. [Google Scholar] [CrossRef]
- Farina, I.; Fabbrocino, F.; Colangelo, F.; Feo, L.; Fraternali, F. Surface roughness effects on the reinforcement of cement mortars through 3D printed metallic fibers. Compos. Part B Eng. 2016, 99, 305–311. [Google Scholar] [CrossRef]
- Amendola, A.; Nava, E.H.; Goodall, R.; Todd, I.; Skelton, R.E.; Fraternali, F. On the additive manufacturing, post-tensioning and testing of bi-material tensegrity structures. Compos. Struct. 2015, 131, 66–71. [Google Scholar] [CrossRef]
- Amendola, A.; Smith, C.J.; Goodall, R.; Auricchio, F.; Feo, L.; Benzoni, G.; Fraternali, F. Experimental response of additively manufactured metallic pentamode materials confined between stiffening plates. Compos. Struct. 2016, 142, 254–262. [Google Scholar] [CrossRef]
- Fraternali, F.; Carpentieri, G.; Amendola, A. On the mechanical modeling of the extreme softening/stiffening response of axially loaded tensegrity prisms. J. Mech. Phys. Solids 2015, 74, 136–157. [Google Scholar] [CrossRef]
- Fraternali, F.; Amendola, A. Mechanical modeling of innovative metamaterials alternating pentamode lattices and confinement plates. J. Mech. Phys. Solids 2017, 99, 259–271. [Google Scholar] [CrossRef]
- Amendola, A.; Benzoni, G.; Fraternali, F. Non-linear elastic response of layered structures, alternating pentamode lattices and confinement plates. Compos. Part B Eng. 2017, 115, 117–123. [Google Scholar] [CrossRef]
- Potts, J.R.; Dreyer, D.R.; Bielawski, C.W.; Ruoff, R.S. Graphene-based polymer nanocomposites. Polymer 2011, 25, 5–25. [Google Scholar] [CrossRef]
- Riaz, U.; Ashraf, S.M. Conductive Polymer Composites and Blends. In Nanostructured Polymer Blends; Elsevier Inc.: UK, 2013; Volume 1. [Google Scholar]
- Meng, F.; Huang, F.; Guo, Y.; Chen, J.; Chen, X.; Hui, D.; He, P.; Zhou, X.; Zhou, Z.-W. In situ intercalation polymerization approach to polyamide-6/graphite nanoflakes for enhanced thermal conductivity. Compos. Part B Eng. 2017, 117, 165–173. [Google Scholar] [CrossRef]
- Ivanova, O.; Williams, C.; Campbell, T. Additive manufacturing (AM) and nanotechnology: Promises and challenges. Rapid Prototyp. J. 2013, 19, 353–364. [Google Scholar] [CrossRef]
- Campbell, T.A.; Ivanova, O.S. 3D printing of multifunctional nanocomposites. Nano Today 2013, 8, 119–120. [Google Scholar] [CrossRef]
- Perez, A.R.T.; Roberson, D.A.; Wicker, R.B. Fracture surface analysis of 3D-printed tensile specimens of novel ABS-based materials. J. Fail. Anal. Prev. 2014, 14, 343–353. [Google Scholar] [CrossRef]
- Postiglione, G.; Natale, G.; Griffini, G.; Levi, M.; Turri, S. UV-assisted three-dimensional printing of polymer nanocomposites based on inorganic fillers. Polym. Compos. 2015. [Google Scholar] [CrossRef]
- Llewellyn-Jones, T.M.; Drinkwater, B.W.; Trask, R.S. 3D printed components with ultrasonically arranged microscale structure. Smart Mater. Struct. 2016, 25, 02LT01. [Google Scholar] [CrossRef]
- Love, L.J.; Kunc, V.; Rios, O.; Duty, C.E.; Elliott, A.M.; Post, B.K.; Smith, R.J.; Blue, C. The importance of carbon fiber to polymer additive manufacturing. J. Mater. Res. 2014, 29, 1893–1898. [Google Scholar] [CrossRef]
- Tekinalp, H.L.; Kunc, V.; Velez-Garcia, G.M.; Duty, C.E.; Love, L.J.; Naskar, A.K.; Blue, C.; Ozcan, S. Highly oriented carbon fiber–polymer composites via additive manufacturing. Compos. Sci. Technol. 2014, 105, 144–150. [Google Scholar] [CrossRef]
- Shofner, M.L.; Lozano, K.; Rodríguez-Macías, F.J.; Barrera, E.V. Nanofiber-reinforced polymers prepared by fused deposition modeling. J. Appl. Polym. Sci. 2003, 89, 3081–3090. [Google Scholar] [CrossRef]
- Farahani, R.D.; Dalir, H.; Le Borgne, V.; Gautier, L.A.; El Khakani, M.A.; Lévesque, M.; Therriault, D. Direct-write fabrication of freestanding nanocomposite strain sensors. Nanotechnology 2012, 23, 085502. [Google Scholar] [CrossRef] [PubMed]
- Compton, B.G.; Lewis, J.A. 3D-printing of lightweight cellular composites. Adv. Mater. 2014, 26, 5930–5935. [Google Scholar] [CrossRef] [PubMed]
- Postiglione, G.; Natale, G.; Griffini, G.; Levi, M.; Turri, S. Conductive 3D microstructures by direct 3D printing of polymer/carbon nanotube nanocomposites via liquid deposition modeling. Compos. Part A Appl. Sci. Manufactur. 2015, 76, 110–114. [Google Scholar] [CrossRef]
- Duguay, A.J.; Nader, J.W.; Kiziltas, A.; Gardner, D.J.; Dagher, H.J. Exfoliated graphite nanoplatelet-filled impact modified polypropylene nanocomposites: Influence of particle diameter, filler loading, and coupling agent on the mechanical properties. Appl. Nanosci. 2014, 4, 279–291. [Google Scholar] [CrossRef]
- Thanh, T.D.; Kaprálková, L.; Hromádková, J.; Kelnar, I. Effect of graphite nanoplatelets on the structure and properties of PA6-elastomer nanocomposites. Eur. Polym. J. 2014, 50, 39–45. [Google Scholar] [CrossRef]
- ASTM D1238-13, Standard Test Method for Melt Flow Rates of Thermoplastics by Extrusion Plastometer; ASTM International: West Conshohocken, PA, USA, 2013. Available online: https://www.astm.org/Standards/D1238.htm (accessed on 28 July 2017).
- Sombatsompop, N.; Wood, A.K. Measurement of thermal conductivity of polymers using an improved Lee’s disc apparatus. Polym. Test. 1997, 16, 203–223. [Google Scholar] [CrossRef]
- Colangelo, F.; Messina, F.; Di Palma, L.; Cioffi, R. Recycling of non-metallic automotive shredder residues and coal fly-ash in cold-bonded aggregates for sustainable concrete. Compos. Part B Eng. 2017, 116, 46–52. [Google Scholar] [CrossRef]
- Colangelo, F.; Cioffi, R. Mechanical properties and durability of mortar containing fine fraction of demolition wastes produced by selective demolition in South Italy. Compos. Part B Eng. 2017, 115, 43–50. [Google Scholar] [CrossRef]
Figure 1.
Extraction of Gr. (a) Sonication of graphite and NMP; (b) Formation of Gr layer; and (c) Extracted Gr.
Figure 1.
Extraction of Gr. (a) Sonication of graphite and NMP; (b) Formation of Gr layer; and (c) Extracted Gr.

Figure 2.
Scanning electron microscopy (SEM) image of extracted Gr.

Figure 3.
Lee’s disc apparatus for measurement of thermal conductivity.
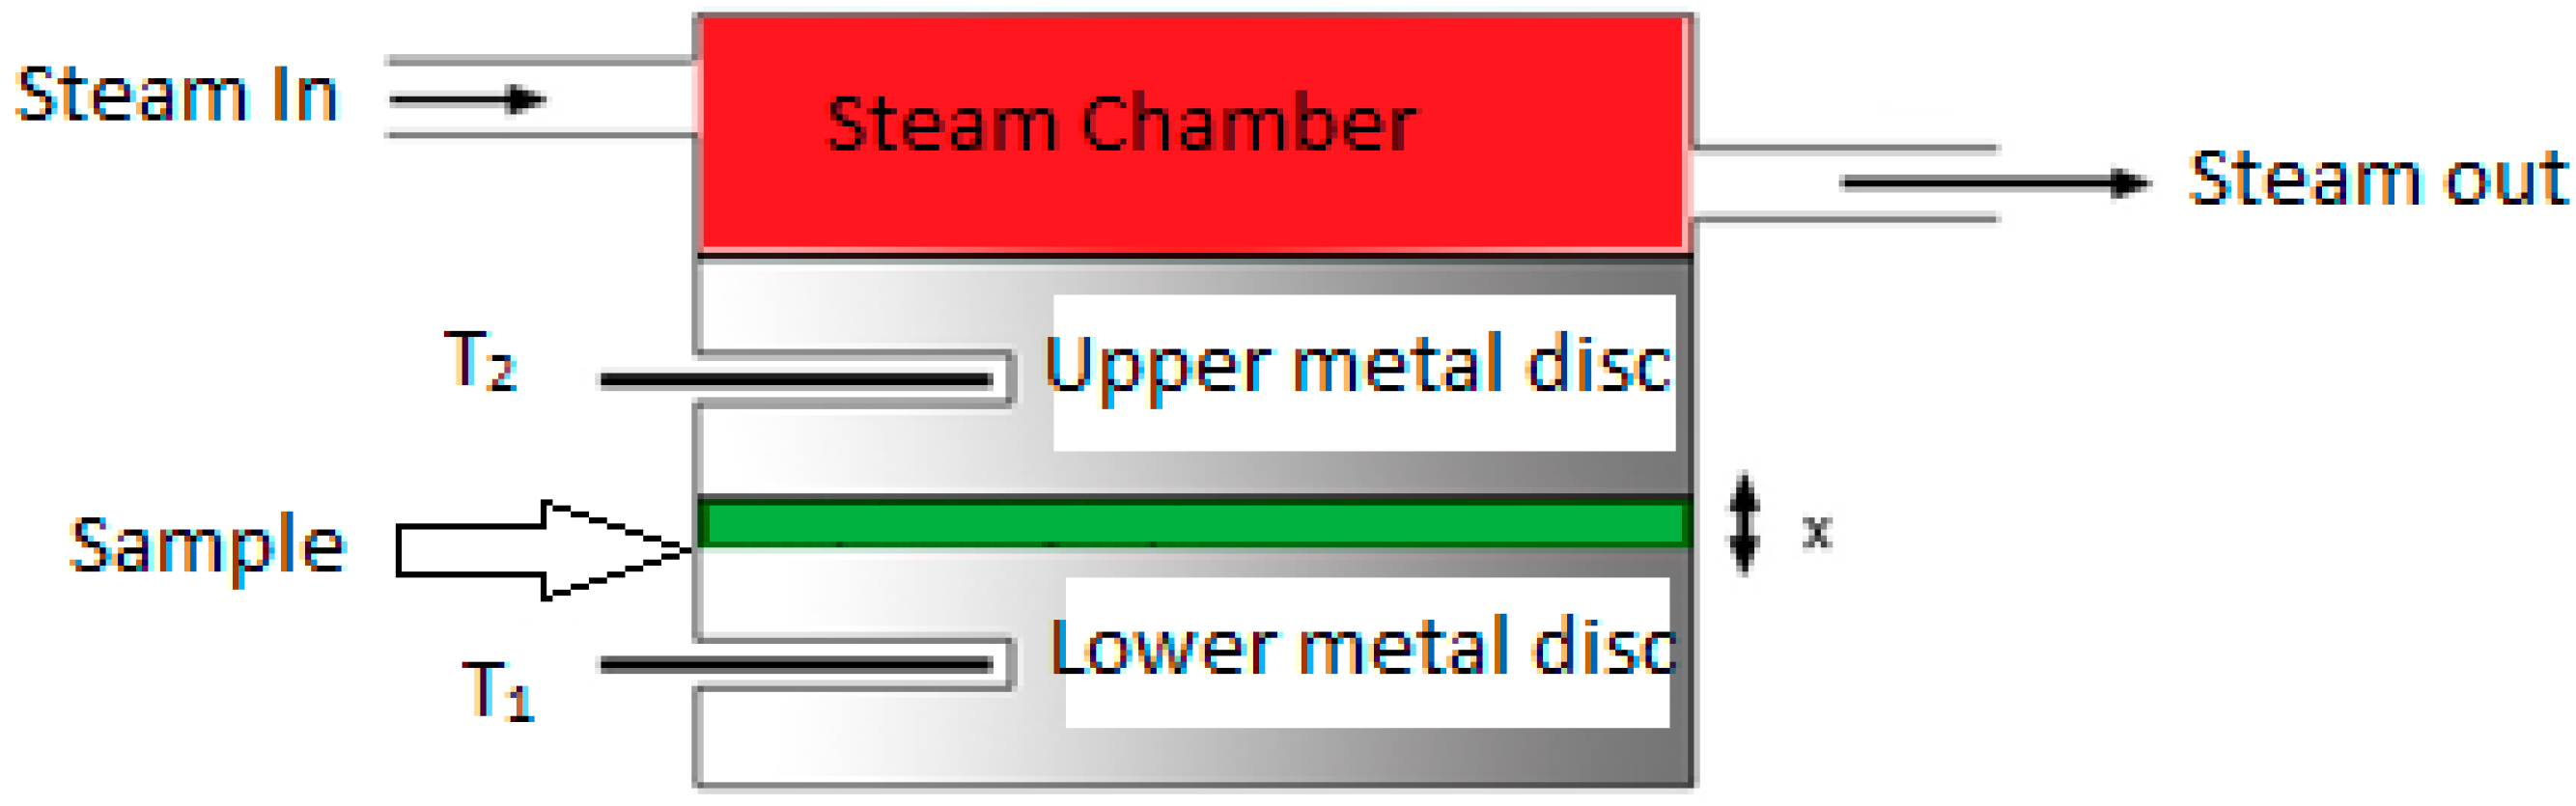
Figure 4.
Schematic for Calculation of Electrical conductivity.

Figure 5.
Preparation of functional prototype on FDM.
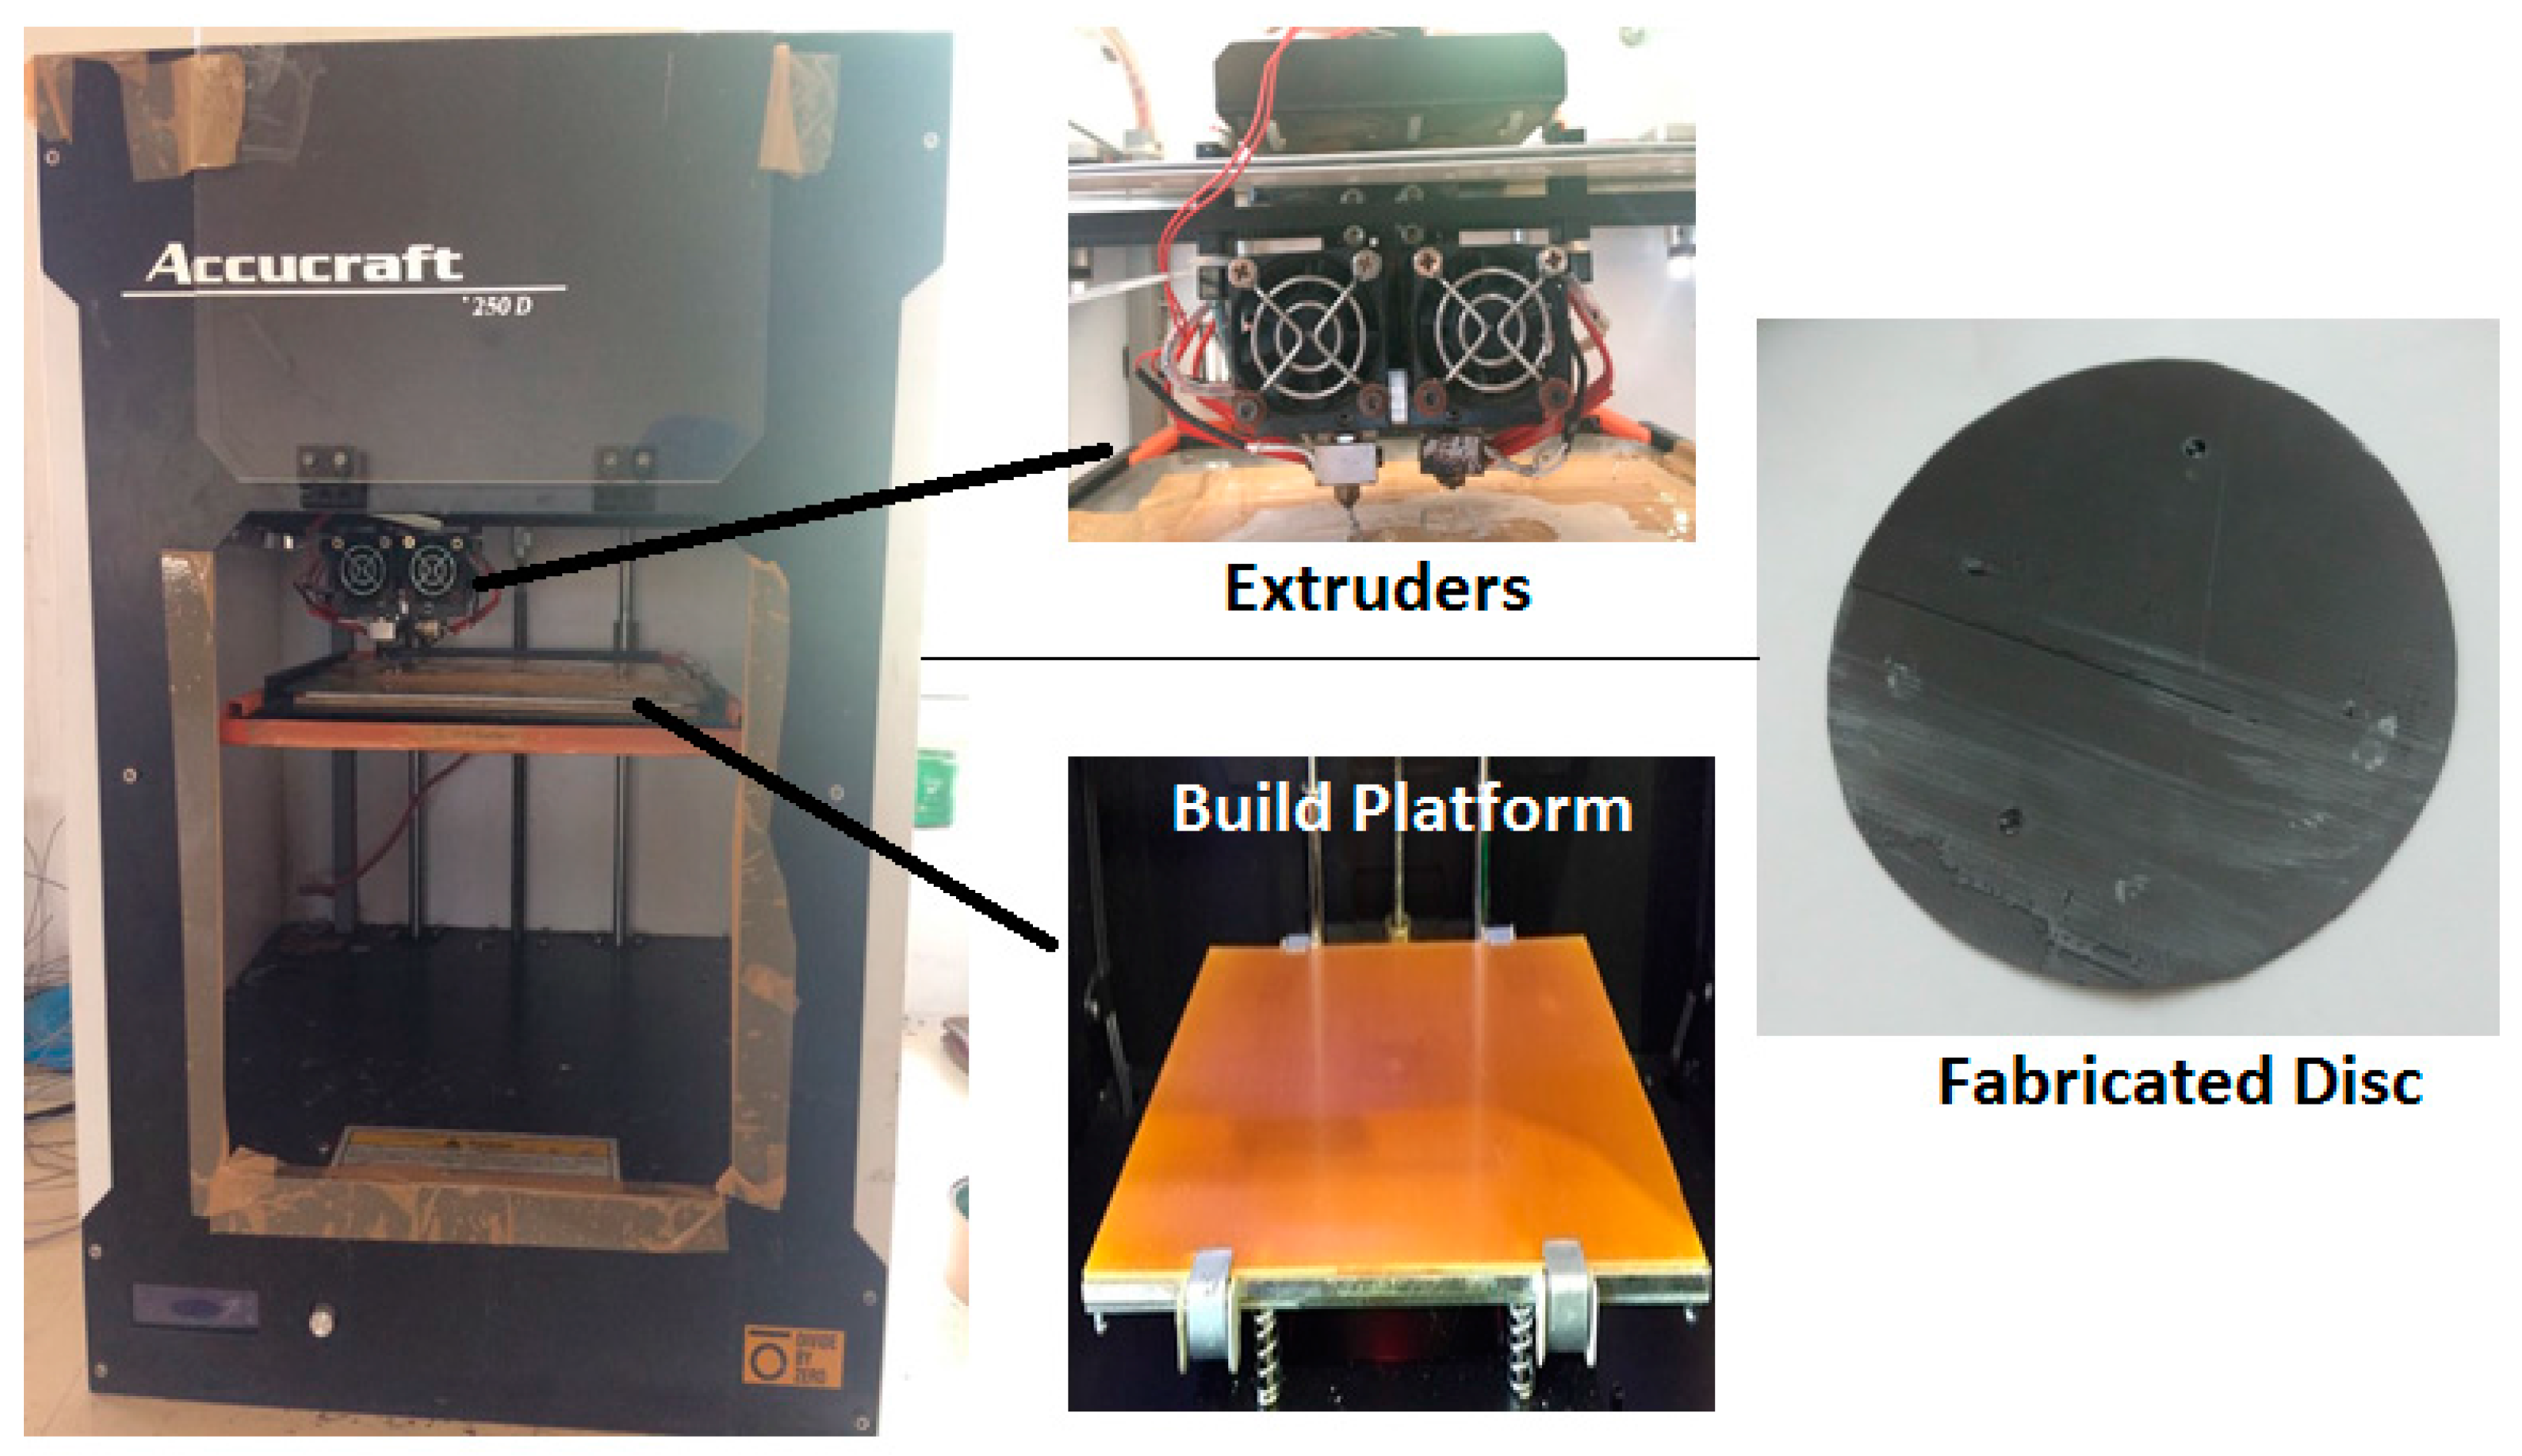
Figure 6.
Main effects for signal-to-noise SN ratios of electrical conductivity.

Figure 7.
Main effects graph for SN ratios of thermal conductivity.

Figure 8.
Optical micrographs for ABS–Gr chemically and mechanically blended samples (100×).


Table 1.
Melt flow index (MFI) of acrylonitrile-butadiene-styrene (ABS) blended with Gr as per ASTM D 1238-73.
Table 1.
Melt flow index (MFI) of acrylonitrile-butadiene-styrene (ABS) blended with Gr as per ASTM D 1238-73.
| ABS:Gr (ByWeight) | Mechanically Blended MFI in g/10 min | Chemically Blended MFI in g/10 min |
|---|---|---|
| 50:50 | 0.82 | 1.63 |
| 60:40 | 1.62 | 2.27 |
| 70:30 | 2.20 | 3.20 |
| 80:20 | 2.46 | 3.94 |
| 90:10 | 2.51 | 4.12 |
Table 2.
Input parameters.
| Serial No. | Input Parameters | Levels |
|---|---|---|
| 1 | Infilldensity | 50%, 100% |
| 2 | Blending process | Mechanical, Chemical + mechanical |
| 3 | Proportion of ABS:Gr (weight %) | 75:25, 90:10 |
Table 3.
Control log of experiment.
| Blending Process | Proportion (by Weight) | Infill Density (Percentage) |
|---|---|---|
| Chemical | 75:25 | 50 |
| Chemical | 75:25 | 100 |
| Chemical | 90:10 | 50 |
| Chemical | 90:10 | 100 |
| Mechanical | 75:25 | 50 |
| Mechanical | 75:25 | 100 |
| Mechanical | 90:10 | 50 |
| Mechanical | 90:10 | 100 |
Table 4.
Electrical conductivity of tested sample with SN Ratios.
| Blending Process | Proportion (by Weight) | Infill Density (Percentage) | Electrical Conductivity (S-m) | SN Ratio |
|---|---|---|---|---|
| Chemical | 75:25 | 50 | 4.82 | 13.6609 |
| Chemical | 75:25 | 100 | 7.29 | 17.2546 |
| Chemical | 90:10 | 50 | 3.50 | 10.8814 |
| Chemical | 90:10 | 100 | 5.07 | 14.1002 |
| Mechanical | 75:25 | 50 | 4.30 | 12.6694 |
| Mechanical | 75:25 | 100 | 4.85 | 13.7148 |
| Mechanical | 90:10 | 50 | 2.60 | 8.2995 |
| Mechanical | 90:10 | 100 | 3.63 | 11.1981 |
Table 5.
ANOVA for SN ratios of electrical conductivity.
| Source | DF | Seq SS | Adj SS | Adj MS | F | P | Percentage Contribution |
|---|---|---|---|---|---|---|---|
| Process | 1 | 12.538 | 12.538 | 12.538 | 24.64 | 0.008 | 25.29 |
| Proportion | 1 | 20.546 | 20.546 | 20.5459 | 40.37 | 0.003 | 41.44 |
| Density | 1 | 14.463 | 14.463 | 14.4629 | 28.42 | 0.006 | 29.17 |
| Residual Error | 4 | 2.036 | 2.036 | 0.5089 | 4.10 | ||
| Total | 7 | 49.582 |
DF: Degree of freedom, Seq SS: Sequential sums of squares, Adj SS: Adjusted sum of squares, Adj MS: Adjusted mean squares.
Table 6.
Ranking of input process parameters for electrical conductivity.
| Level | Process | Proportion | Density |
|---|---|---|---|
| 1 | 13.97 | 14.32 | 11.38 |
| 2 | 11.47 | 11.12 | 14.07 |
| Delta | 2.50 | 3.21 | 2.69 |
| Rank | 3 | 1 | 2 |
Table 7.
Thermal conductivity of tested sample with SN ratios.
| Blending Process | Proportion (by Weight) | Infill Density (Percentage) | Thermal Conductivity (W/mK) | SN Ratio |
|---|---|---|---|---|
| Chemical | 75:25 | 50 | 8.85 | 18.9389 |
| Chemical | 75:25 | 100 | 17.60 | 24.9103 |
| Chemical | 90:10 | 50 | 6.36 | 16.0691 |
| Chemical | 90:10 | 100 | 12.43 | 21.8894 |
| Mechanical | 75:25 | 50 | 2.40 | 7.6042 |
| Mechanical | 75:25 | 100 | 4.65 | 13.3491 |
| Mechanical | 90:10 | 50 | 2.41 | 7.6403 |
| Mechanical | 90:10 | 100 | 3.99 | 12.0195 |
Table 8.
ANOVA for SN ratios of thermal conductivity.
| Source | DF | Seq SS | Adj SS | Adj MS | F | P | Percentage Contribution |
|---|---|---|---|---|---|---|---|
| Process | 1 | 212.124 | 212.124 | 212.124 | 245.14 | 0.000 | 75.20 |
| Proportion | 1 | 6.451 | 6.451 | 6.451 | 7.46 | 0.052 | 2.28 |
| Density | 1 | 60.037 | 60.037 | 60.037 | 69.38 | 0.001 | 21.28 |
| Residual Error | 4 | 3.461 | 3.461 | 0.865 | 1.22 | ||
| Total | 7 | 282.074 |
DF: Degree of freedom, Seq SS: Sequential sums of squares, Adj SS: Adjusted sum of squares, Adj MS: Adjusted mean squares.
Table 9.
Ranking of input process parameters for thermal conductivity.
| Level | Process | Proportion | Density |
|---|---|---|---|
| 1 | 20.45 | 16.20 | 12.56 |
| 2 | 10.15 | 14.40 | 18.04 |
| Delta | 10.30 | 1.80 | 5.48 |
| Rank | 1 | 3 | 2 |
© 2017 by the authors. Licensee MDPI, Basel, Switzerland. This article is an open access article distributed under the terms and conditions of the Creative Commons Attribution (CC BY) license (http://creativecommons.org/licenses/by/4.0/).
Share and Cite
MDPI and ACS Style
Singh, R.; Sandhu, G.S.; Penna, R.; Farina, I. Investigations for Thermal and Electrical Conductivity of ABS-Graphene Blended Prototypes. Materials 2017, 10, 881. https://doi.org/10.3390/ma10080881
AMA Style
Singh R, Sandhu GS, Penna R, Farina I. Investigations for Thermal and Electrical Conductivity of ABS-Graphene Blended Prototypes. Materials. 2017; 10(8):881. https://doi.org/10.3390/ma10080881
Chicago/Turabian StyleSingh, Rupinder, Gurleen S. Sandhu, Rosa Penna, and Ilenia Farina. 2017. "Investigations for Thermal and Electrical Conductivity of ABS-Graphene Blended Prototypes" Materials 10, no. 8: 881. https://doi.org/10.3390/ma10080881
Note that from the first issue of 2016, this journal uses article numbers instead of page numbers. See further details here.