The Effect of Temperature on Moisture Transport in Concrete

1
Department of Civil, Environmental and Architectural Engineering, University of Colorado Boulder, Boulder, CO 80309, USA
2
Department of Civil, Environmental and Architectural Engineering, University of Colorado Boulder, Boulder, CO 80309, USA
*
Author to whom correspondence should be addressed.
Materials 2017, 10(8), 926; https://doi.org/10.3390/ma10080926
Submission received: 20 July 2017
/
Revised: 4 August 2017
/
Accepted: 8 August 2017
/
Published: 9 August 2017
Abstract
:Most concrete structures and buildings are under temperature and moisture variations simultaneously. Thus, the moisture transport in concrete is driven by the moisture gradient as well as the temperature gradient. This paper presents an experimental approach for determining the effect of different temperature gradients on moisture distribution profiles in concrete. The effect of elevated temperatures under isothermal conditions on the moisture transport was also evaluated, and found not to be significant. The non-isothermal tests show that the temperature gradient accelerates the moisture transport in concrete. The part of increased moisture transfer due to the temperature gradient can be quantified by a coupling parameter DHT, which can be determined by the present test data. The test results indicated that DHT is not a constant but increases linearly with the temperature variation. A material model was developed for DHT based on the experimental results obtained in this study.
1. Introduction
Moisture transport plays a main role in predicting the durability and serviceability of cement-based materials. For instance, the high moisture content rapidly increases the freeze-thaw deterioration of concrete [1,2,3]. The moisture curing condition strongly affects the hydration degree and strength development for the cement-based materials, like ordinary Portland cement (OPC) concrete, and mortar with various cement-replacements [4,5,6,7,8,9,10,11,12]. In addition, the high level of internal moisture can help to accelerate the chloride penetration in concrete and trigger corrosion of embedded steel bars, especially in marine structures [13,14,15,16,17,18,19].
In order to improve the durability and serviceability of concrete structures, the mechanisms of moisture transfer must be understood well. Many researchers consider that the moisture transfer in concrete is driven by a moisture concentration gradient, and thus the moisture flux is considered as a function of a moisture concentration gradient, and the material parameter associated with the moisture concentration gradient is the coefficient of moisture diffusivity. For the temperature effect, the coefficient of moisture diffusivity was considered as a function of temperature [20,21]. Under the service condition, however, temperature fluctuation and moisture changes in concrete structures occur simultaneously; both temperature and the temperature gradient must be considered in terms of moisture transfer. In the literature, the effect of the temperature gradient on moisture transfer was treated by using a separating term in the moisture flux equation, and this coupling effect was shown to be significant under non-isothermal conditions [22,23].
When the moisture gradient and the temperature gradient exist at the same time, there are two coupling effects. One is the effect of the temperature gradient on moisture transfer, which is called “Soret effect”. The other one is the effect of moisture gradient on thermal conduction, which is not the focus of this study. “Soret effect” is a general term to explain the effect of the temperature gradient on diffusing species, such as salt solutions. It was first discussed by the Swiss scientist Charles Soret (1879) [24]. He discovered that the salt solution in a tube did not remain at a uniform concentration when the two ends of the tube were kept under two different temperatures. The concentration of salt was higher near the cold end than near the hot end. He concluded that a flux of salt was generated by the temperature gradient and the coupling effect was then named as “Soret effect”. In our case, the moisture flux in concrete is not only generated by the moisture concentration gradient but also by the temperature gradient [25,26,27,28,29].
This paper presents an experimental method for evaluating the moisture transfer in concrete under a given temperature gradient, and an analytical approach to determine the coupling parameter for the “Soret effect” of concrete using the obtained test data. The moisture distributions in concrete specimens under four different temperature conditions were studied, including isothermal and non-isothermal conditions. The isothermal conditions were used to study the thermal effect without the temperature gradient and the non-isothermal conditions were for the gradient effect. Finally, an available theoretical model was used together with the obtained coupling parameter to compare the model prediction with the present test data.
2. Theoretical Background
In this section, the governing equations for moisture transfer in concrete will be introduced first, including both equations for the isothermal condition and the non-isothermal condition. These equations will be used to determine the coupling parameter for the Soret effect based on the test data obtained in the present study.
2.1. Moisture Transport under the Isothermal Condition
Under the isothermal condition, the moisture flux is only related to a single driven force, which is the moisture gradient. According to Fick’s law, the flux of moisture is proportional to the moisture gradient, as shown in Equation (1):
where, J is the flux of moisture (kg∙m−2s−1), H is the pore relative humidity (%), and DH is the diffusion coefficient dependent on the pore relative humidity (kg∙m−2s−1). In this study, the moisture condition is represented by the pore relative humidity H, which is a combination of liquid water and water vapor in the pore of concrete [26,30]. It has been used by many researchers to simplify the governing equation for moisture transfer in non-saturated concrete. The diffusion coefficient depends on the diffusing species (which is moisture in the present study) and the characteristics of the concrete pore structure. This coefficient varies as a function of time and concrete mix design parameters, such as water-cement ratio and aggregate volume fraction.
Moisture content must be reflected in the conservation of mass:
where w represents the water content, t is time, and Sw is the moisture source or sink that is the correction for the water consumed by hydration at early ages or released by dehydration. A larger correction is required to account for the water released by dehydration due to heating. For our case, there is no moisture source or sink in the concrete. Therefore, Sw equals to 0 and the Equation (2) can be simplified:
After combining Equations (1) and (3), the moisture transport equation under the isothermal condition is expressed:
where ∂w/∂H is the moisture capacity, which is the derivative of adsorption isotherm w(H).
In Equation (4), the moisture capacity can be estimated by available material models, which will be discussed later. Then, the moisture diffusion coefficient is the only unknown which can be determined by concentration profiles of moisture in concrete samples in the present study.
Under the isothermal condition, there is another temperature effect that must be considered—that is, the effect of the temperature level (without the temperature gradient) on moisture transfer. For any mass transfer process, higher temperatures can accelerate the mass transfer process. For concrete, there are three temperature ranges that need to be considered: the ambient temperature range that is about the range of room temperature; the high temperature range, in which all liquid water turns into water vapour; and the low temperature range, in which all liquid water turns into solid ice. In this study, our focus is the first one, the range of room temperature. So, in the following sections, the moisture concentration profiles under different levels of isothermal condition will be tested and the test data will be used to determine the dependence of DH on the level of temperature in the range of room temperature.
2.2. Moisture Transport under the Non-Isothermal Condition
Under the non-isothermal condition, moisture transfer is driven by the moisture gradient, as well as by the temperature gradient. Indeed, if a system at an equilibrium state is subjected to a temperature gradient, a mass motion takes place and the system reaches a new equilibrium state [20,24,31]. The flux of moisture under a non-isothermal condition can be expressed:
where T is the temperature (K) and DHT is the coupling coefficient for mass diffusion resulting from the thermal gradient (kg∙m−2s−1K−1).
After combining Equations (3) and (5), the balance equation under the non-isothermal condition can be described as:
In Equation (6), there are three material parameters: the moisture capacity ∂w/∂H, the moisture diffusion coefficient DH, and the coupling coefficient DHT. Among the three material parameters, ∂w/∂H can be determined by a theoretical model, and DH can be determined by the test data in the isothermal condition. DHT is the only unknown that can be determined by the test data obtained under the non-isothermal condition.
Equations (4) and (6) are the two governing equations for the moisture transfer under the isothermal and non-isothermal conditions in concrete. Experimental setups were designed and implemented in the present study so that the test data can be used to determine DH and DHT.
3. Experimental Procedures
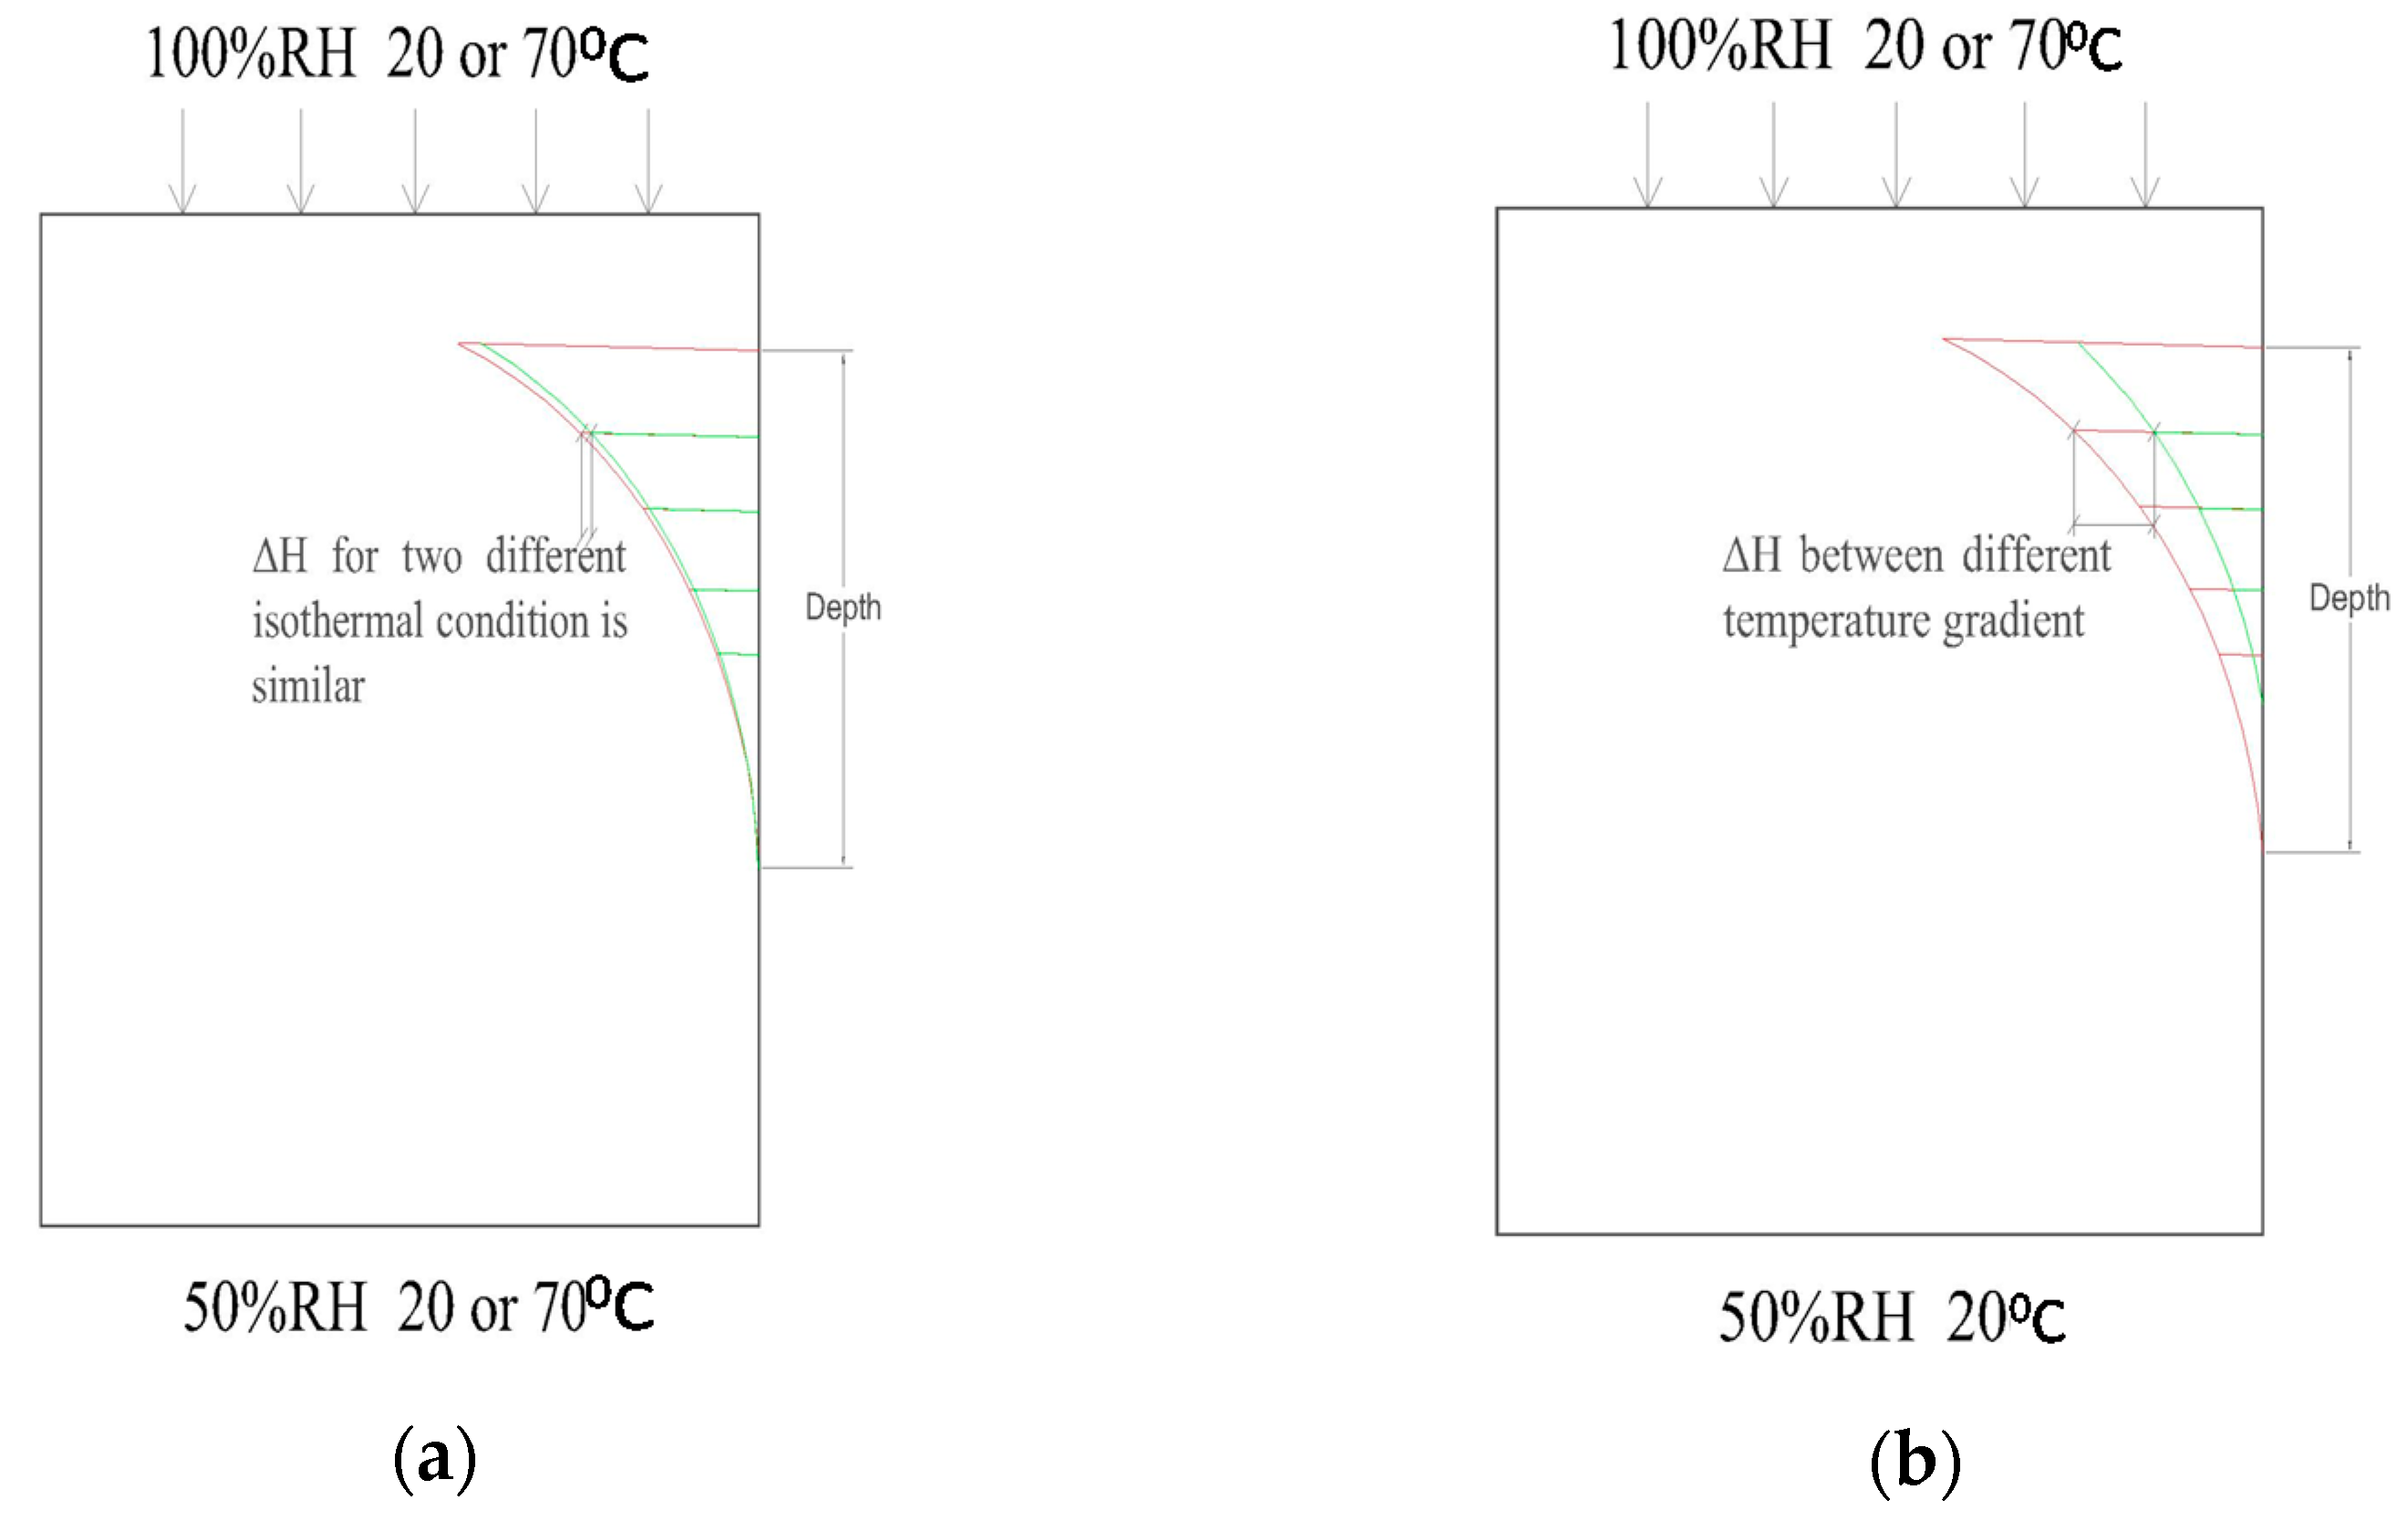
The basic ideas of the experimental study are shown in Figure 1. Figure 1a shows the experimental setup of the isothermal test. With different levels of isothermal temperature conditions, the moisture distributions in concrete samples are measured. If they are almost the same, we can conclude that the temperatures in the range of room temperature without a gradient have little effect on moisture transfer.
Figure 1b shows the experimental setup for the non-isothermal test. In this case, both ends of the specimen have the same moisture concentrations but different levels of temperature, so there are temperature gradients in the specimens. If the moisture profile for the higher temperature gradient is higher than the profile from the lower temperature gradient (with the lowest gradient as zero from the isothermal conditions), the effect of the temperature gradient can be identified. In addition, the moisture profiles measured under different temperatures can be used to determine the coupling coefficient DHT.
3.1. Materials and Specimen Preparation
Mix proportions of concrete specimens are shown in Table 1. The cement was Type I Portland cement. The size of coarse aggregate was 0.5 inch (1.27 cm). Fine aggregate was all-purpose sand.
The dimensions of the concrete cylinder were 6 inch × 12 inch (15.24 cm × 30.48 cm). They were cured at 23 °C and 100% RH for 28 days and then kept in the room environment for 37 days to reach the same initial conditions with the ambient environment (20 °C and 50%). In order to achieve moisture and temperature transport in one dimension, the samples’ lateral surfaces were sealed by silicone and covered by insulated cotton, leaving the top and bottom sides exposed to ambient air (Figure 2).
3.2. Approach to Measure the Internal Relative Humidity and Temperature
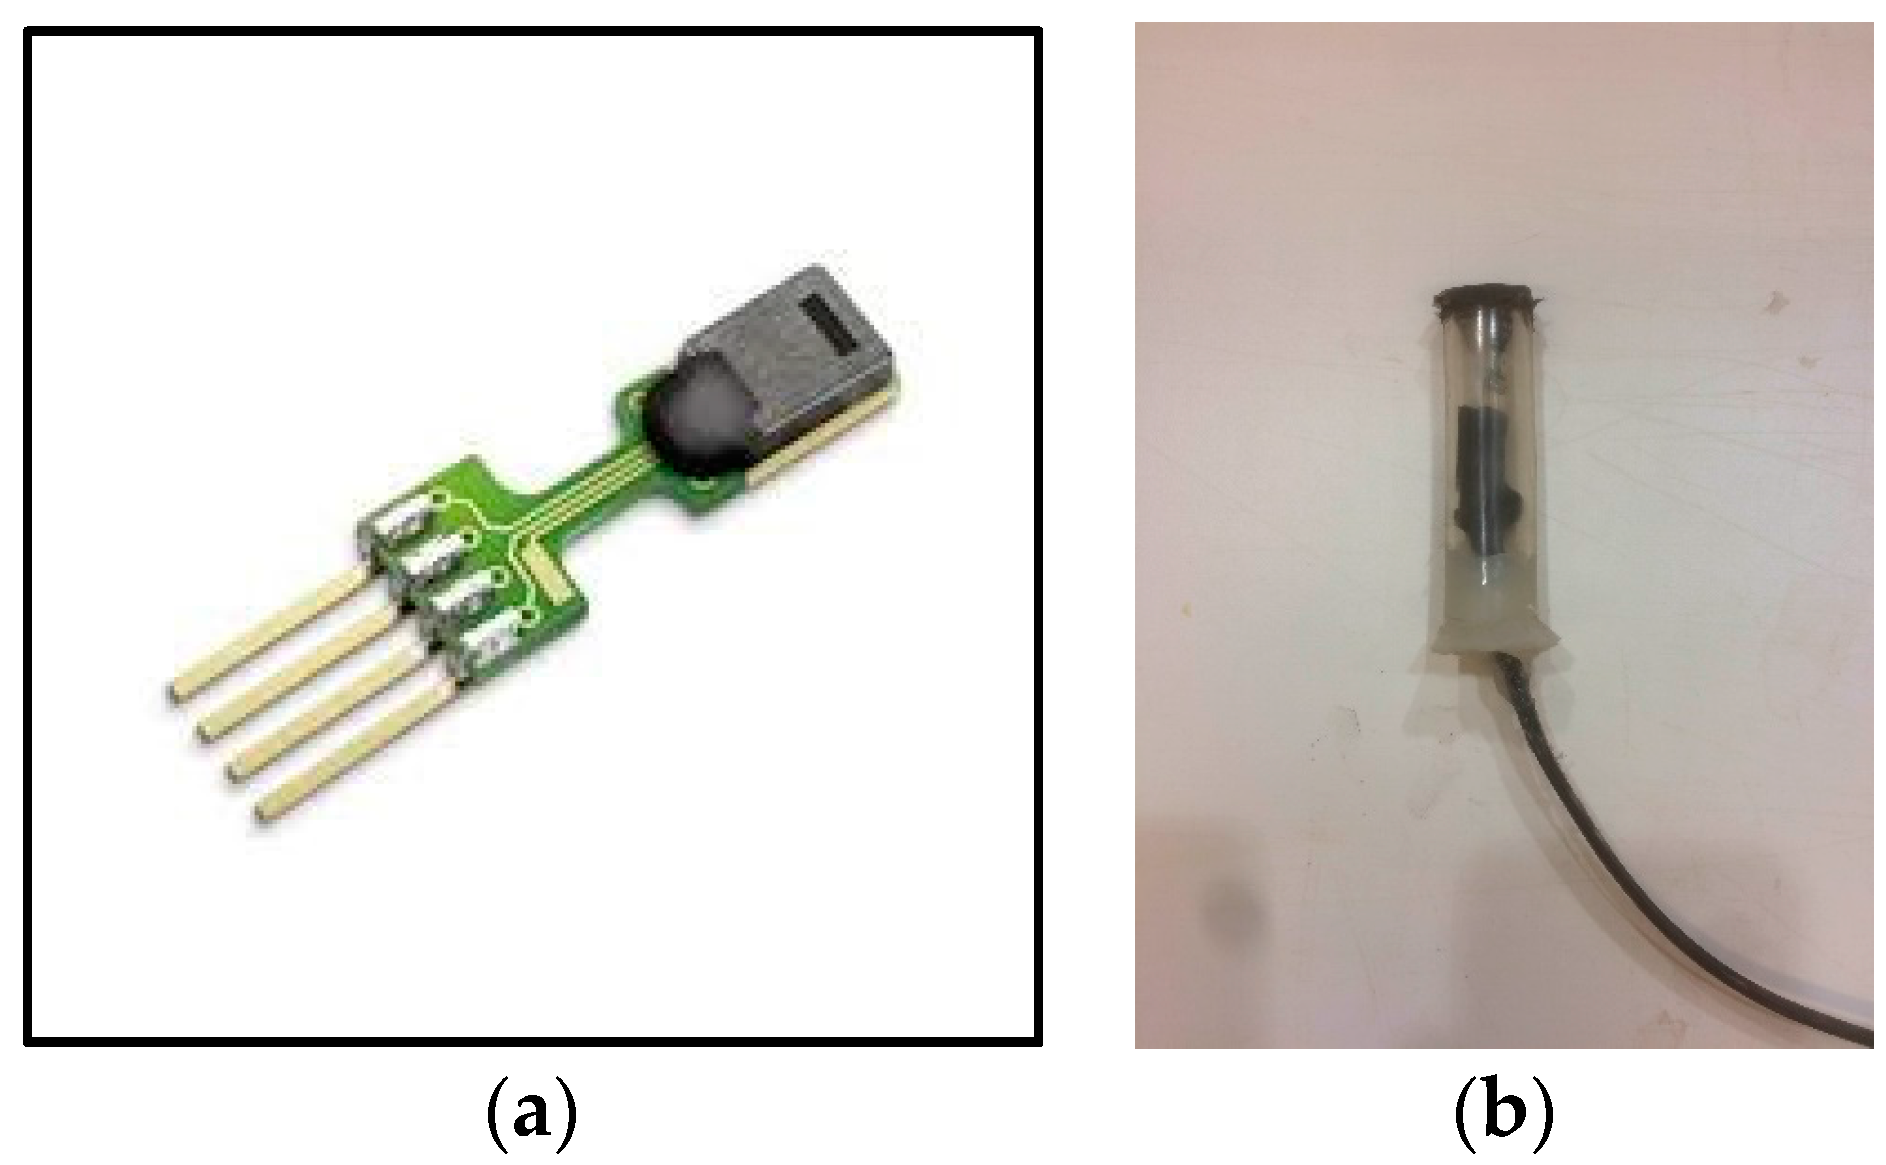
The internal RH and temperature of the specimen was measured by SHT75 Sensirion humidity and the temperature sensor. The accuracy of the sensor was ±1.8% RH in the range of 10–90% RH at 25 °C. Each sensor was plugged into a plastic tube. Both end sides of the tube were wrapped by GoreTex and the bottom side sealed with silicone (Figure 3). Then, the assemblies were embedded into holes that were drilled into the side of the concrete cylinder. The locations were 2.5, 5.5, and 8.5 inch (6.35, 13.97, 21.59 cm) from the high concentration side (Figure 2).
3.3. Experimental Conditions
The environmental condition was around 50% RH and 20 °C. The environmental chamber was used to provide the high isothermal condition, which was set 50% RH and 70 °C. The chamber was controlled by Watlow’s Series F4 1/4 Ramping Temperature Controller (Watlow, St. Louis, MO, USA). The different temperature gradients were generated by the Cole-Parmer EW-03046-20 electric heater (Cole-Parmer, Vernon Hills, IL, USA). The data collection schedule adopted in the study is summarized in Table 2.
4. Experimental Results and Discussions
4.1. Experimental Results
The samples are named by the experimental condition and boundary temperature. For example, I-70 is the sample under the isothermal condition of 70 °C, while N-60 is the one under the non-isothermal condition (and the top side is heated to 60 °C).
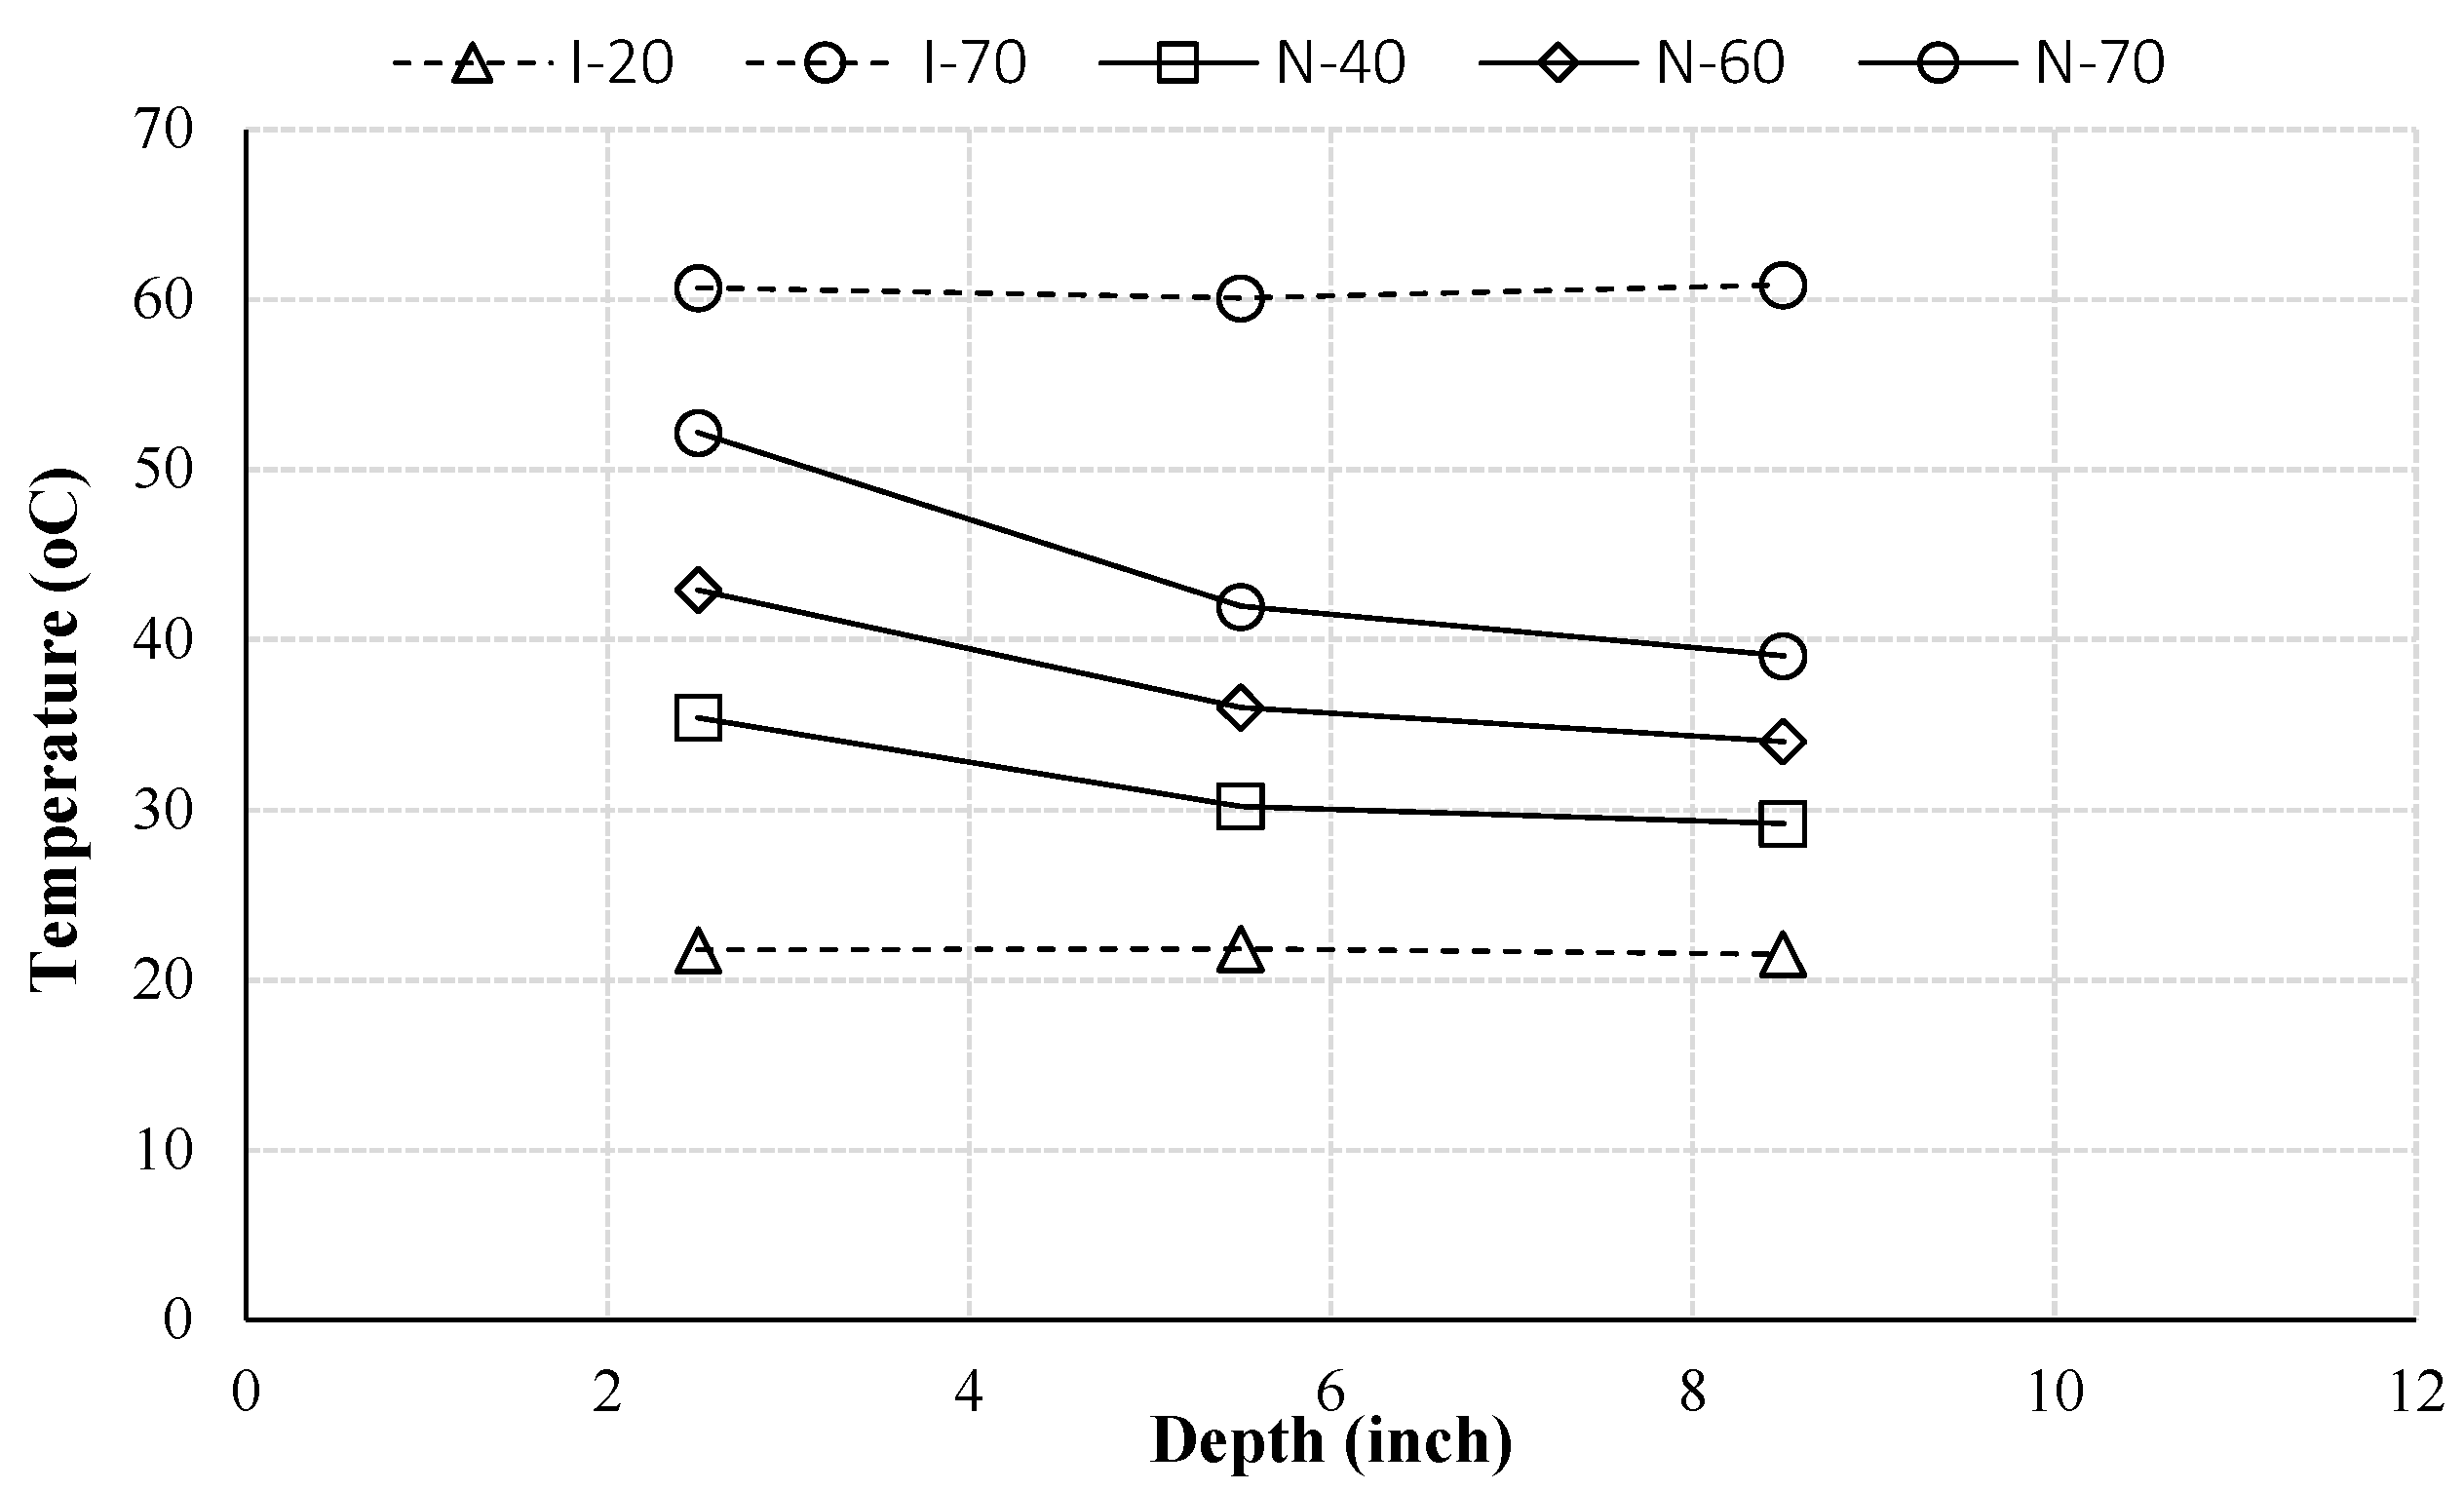
Figure 4 shows the temperature distribution profiles in all samples after 10 days. From this figure, one can see that the internal temperatures of I-20 and I-70 both kept uniform at different depths, while the profile of I-70 was higher than I-20. However, the non-isothermal samples were under the temperature gradients. The temperature gradients depend on the boundary conditions. The gradient is higher with a higher temperature on the boundary.
Figure 5 compares the moisture profiles in all samples at the same depth of 5.5 inch. As one can see, all samples started from the same initial condition. The moisture profiles of I-20 and I-70 were continuously increased, which resulted from the driving force of moisture gradient [20,21]. Moreover, these two profiles varied in a similar way, indicating that the levels of temperature without a temperature gradient do not have a significant effect on moisture transport. Instead, the moisture profiles of the three non-isothermal cases have different increasing rates and moisture values. The sample with a higher temperature boundary condition has a larger value of moisture level. It indicates that the temperature gradient affects the moisture transfer in concrete under the non-isothermal condition. The same trend was observed in previous studies [22,23].
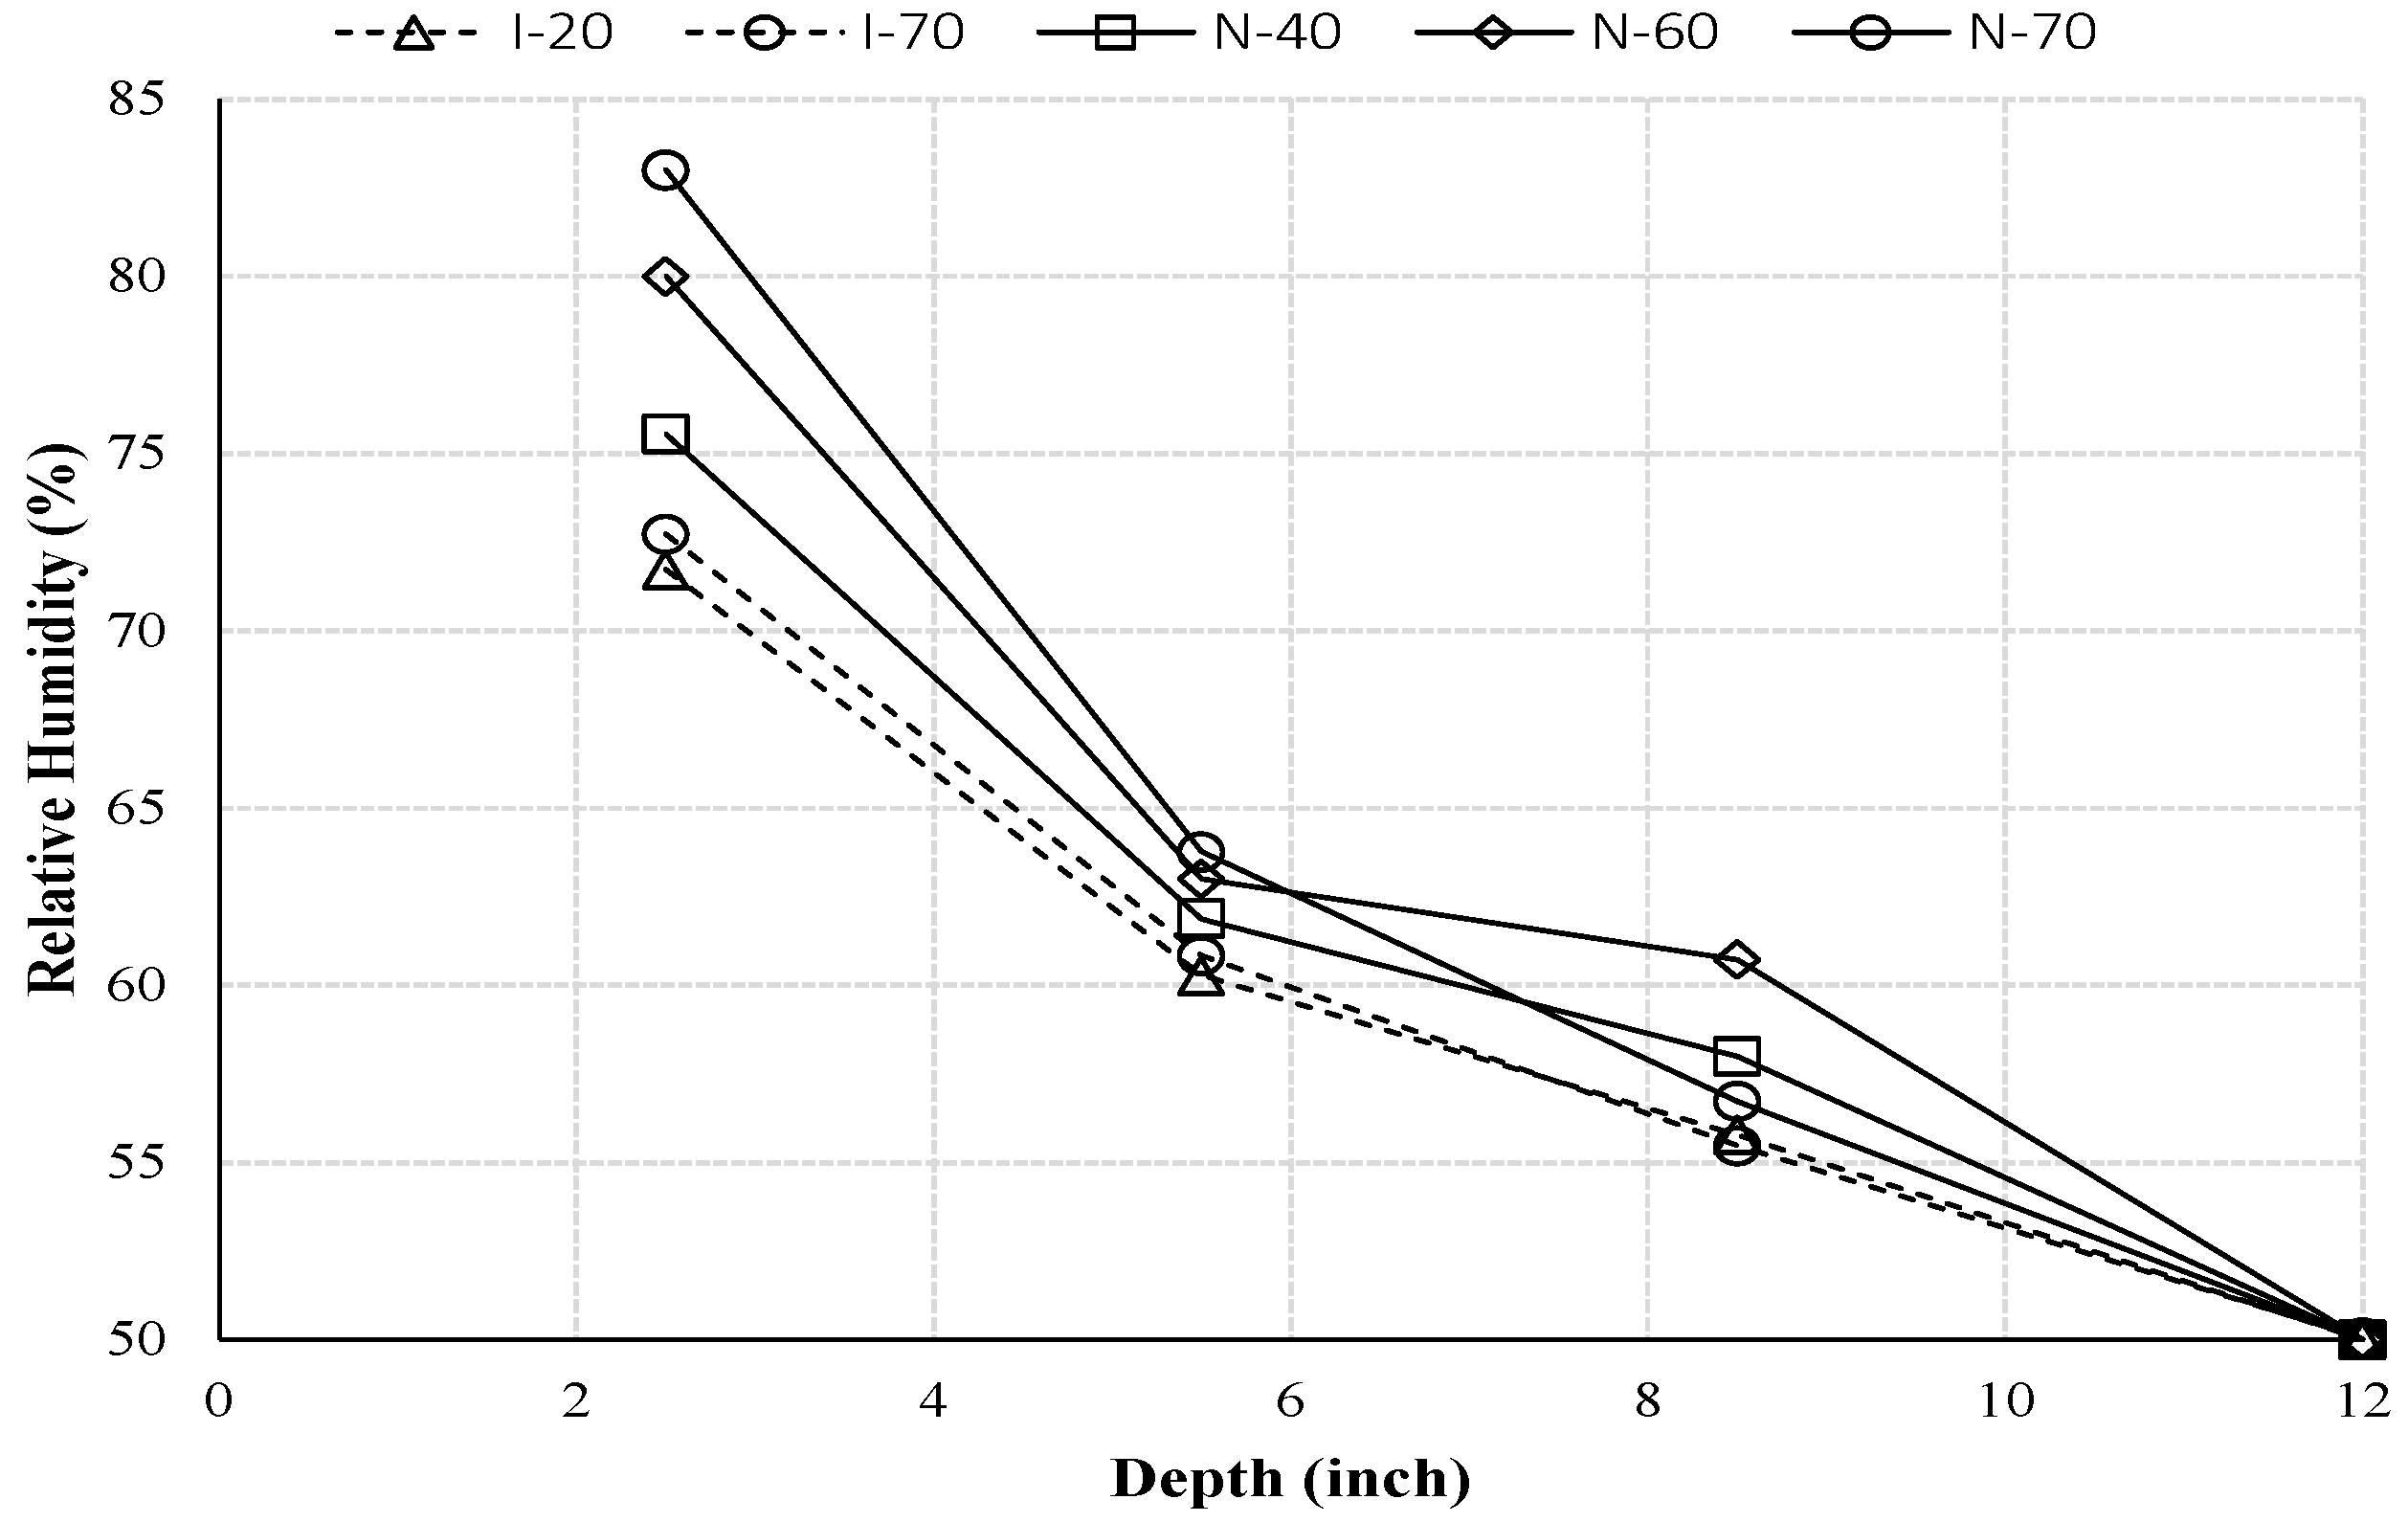
Figure 6 shows the moisture distribution profiles for all samples after 10 days. From this figure, one can see that at a fixed depth, moisture had a larger value with a higher temperature boundary condition. In addition, a higher temperature gradient resulted in a faster increasing slope of moisture distribution. These results indicate clearly that the temperature gradient is a driving force for moisture transfer [22,23].
Since the effect of the temperature gradient on moisture transfer in concrete is significant, there is a need to consider the contribution of the second term on the right hand side of Equation (6) to moisture transport in concrete, specifically the coupling parameter DHT.
4.2. Evaluation of the Coupling Parameter DHT
Equation (6) can be used to evaluate the coupling parameter DHT based on the experimental results. Using the definition of divergence [32]:
In which Δx is the distance between the sensors. Combining Equations (6) and (7), the balance equation can be rewritten as Equation (8a) and then simplified as Equation (8b):
where = ΔH(x)/Δx and = ΔT(x)/Δx were used. It is apparent that the variation of water content is affected by two driving forces: the moisture gradient and the temperature gradient.
Moisture capacity, ∂w/∂H, is the derivative of the equilibrium adsorption isotherm. It is related to the water-cement ratio, specimen age, cement type, temperature, and humidity [33,34]. The three-parameter BET model can be used for the equilibrium adsorption isotherm and the corresponding moisture capacity can be obtained as shown in Equation (9), in which the three parameters C, k and Vm can be characterized by the material models developed by Xi et al., 1994 [33,34].
in which w is the moisture content shown in Equation (10).
Parameters C, k and Vm can be approximately calculated, respectively, as:
Xi et al., 1994 [33,34,35] also established a model for parameter n considering the effects of water-cement ratio, specimen age, cement type, temperature, and humidity:
In Equation (8b), several quantities need to be determined based on the experimental results. Firstly, DHH can be evaluated depending on the test data from the isothermal case in which there is no effect of the temperature gradient. Secondly, the moisture capacity can be calculated through Equations (9) to (18). Then, Equation (8b) can be rearranged as following for the coupling parameters DHT [36].
It is important to point out that, in Equation (19), ΔT(x) and ΔH(x) are the temperature difference and pore relative humidity difference between two sensors at a fixed time, respectively. Furthermore, ΔH(t) is the pore relative humidity difference between Δt at a fixed depth. From Equation (19), one can see that the value of DHT is not a constant.
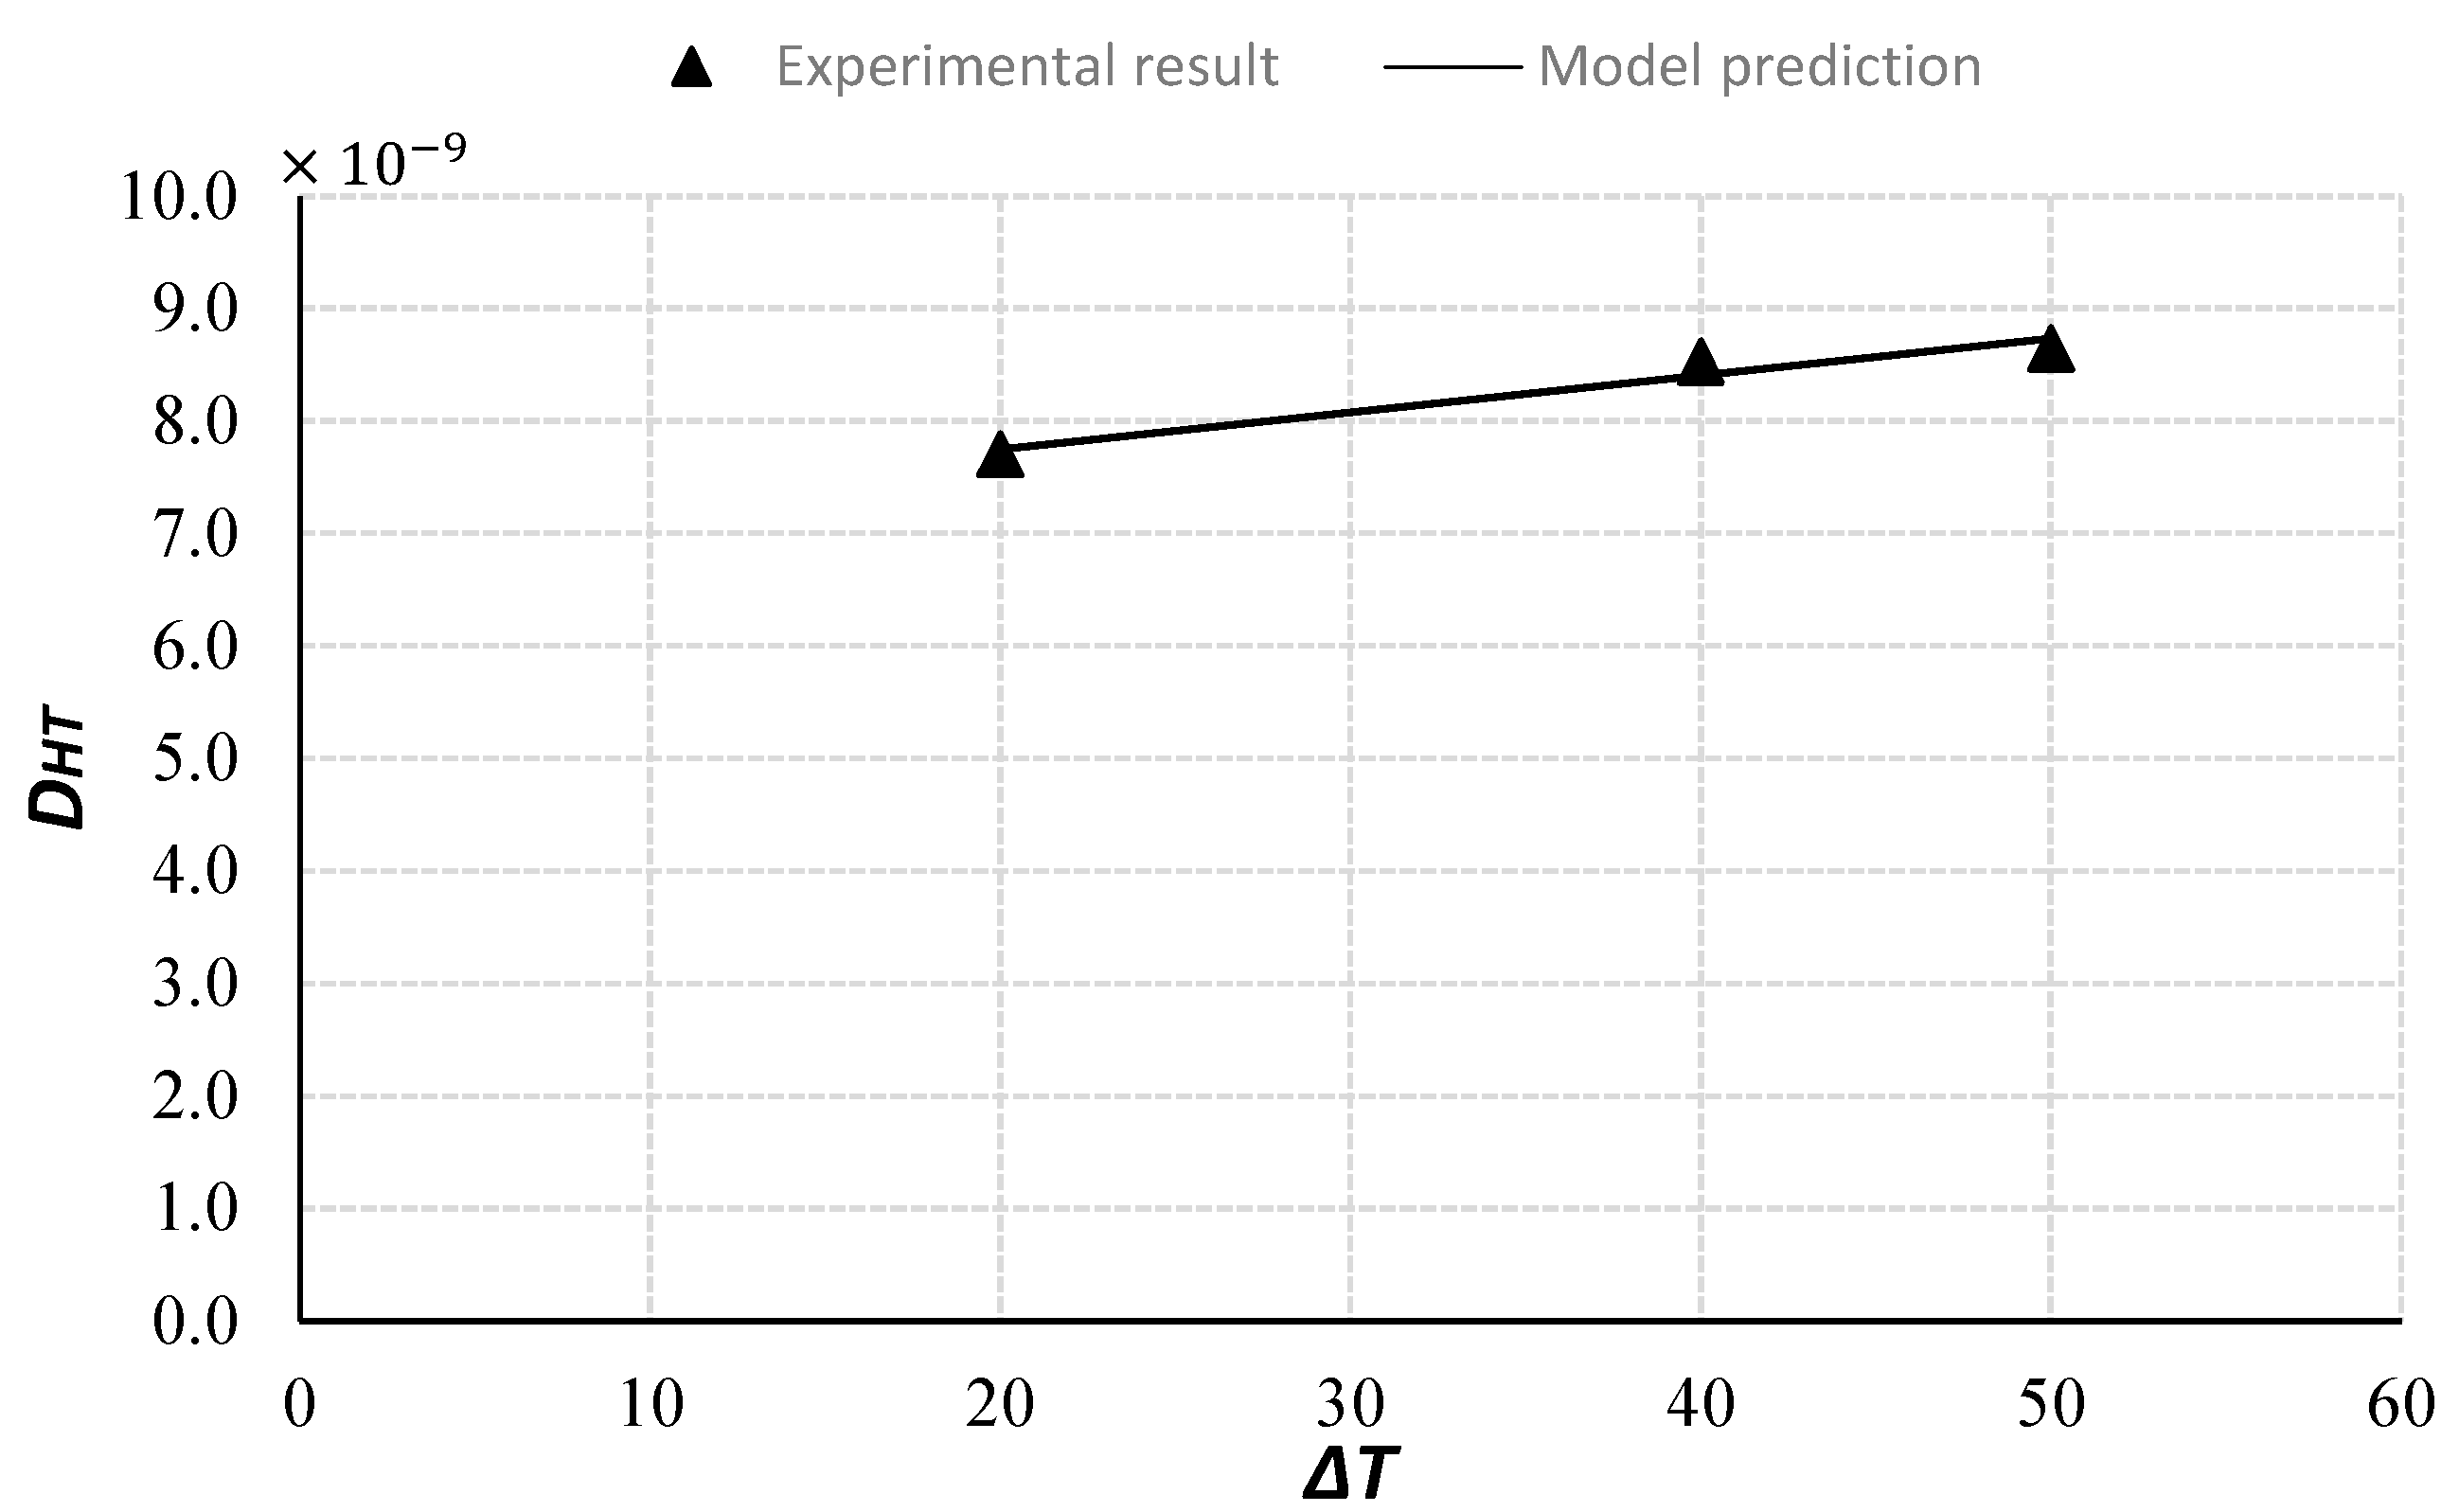
Figure 7 presents the values of DHT for three different temperature gradients. As one can see, the coefficient for the high temperature gradient has a higher value, which means the coupling parameter is temperature dependent. Thus, a simplified model for the coupling parameter DHT can be derived as a linear function depending on the temperature gradient:
The constants a and b can be determined by a proper curve fitting:
Figure 7 compares the experimental results and model prediction of the DHT. They agree reasonably well. It should be mentioned that the proportional constants in Equation (21) depend on concrete mix design parameters, i.e., the water-cement ratio, the aggregate volume fraction, and the ratio of various cement-replacements. A different mix design will result in a different material parameter. Therefore, more systematic studies will need to be conducted to determine the effect of the concrete mix design on the coupling parameter.
4.3. Model Verification
The final equation to determine DHT, Equation (19), was developed based on the governing equation for the coupled moisture heat transfer, Equation (6). In order to verify that Equation (6) can be used to describe the coupled transport processes, Equation (6) ought to be solved with a thermal transfer equation. The coupling parameter DHT obtained in this study can be used in the solution, and the solution can be compared with the test data. To this end, we assumed that the heat conduction equation is independent from the moisture transfer [37], and we have
where c is the heat capacity, is the density, and K is the thermal conductivity. The moisture transfer is governed by Equation (6).
Here we assumed that all material parameters are constants. Some averaged values were taken for the parameters in Equations (6) and (22). The transport processes of heat and moisture are assumed as one dimensional in a very long bar with constant boundary conditions of moisture and temperature, which are consistent with the testing conditions used in this study. By using the Laplace transform and the inverse Laplace transform [38], an analytical solution of the coupled Equation (6) and Equation (22) can be obtained, and the solutions are shown in Equations (23) and (24). The details of the analytical solutions of the two coupled partial differential equations are shown in [39], which will not be described here.
where,
subscript 0 is for the initial conditions of temperature and relative humidity, respectively; and subscript s is for the surface (boundary) conditions.
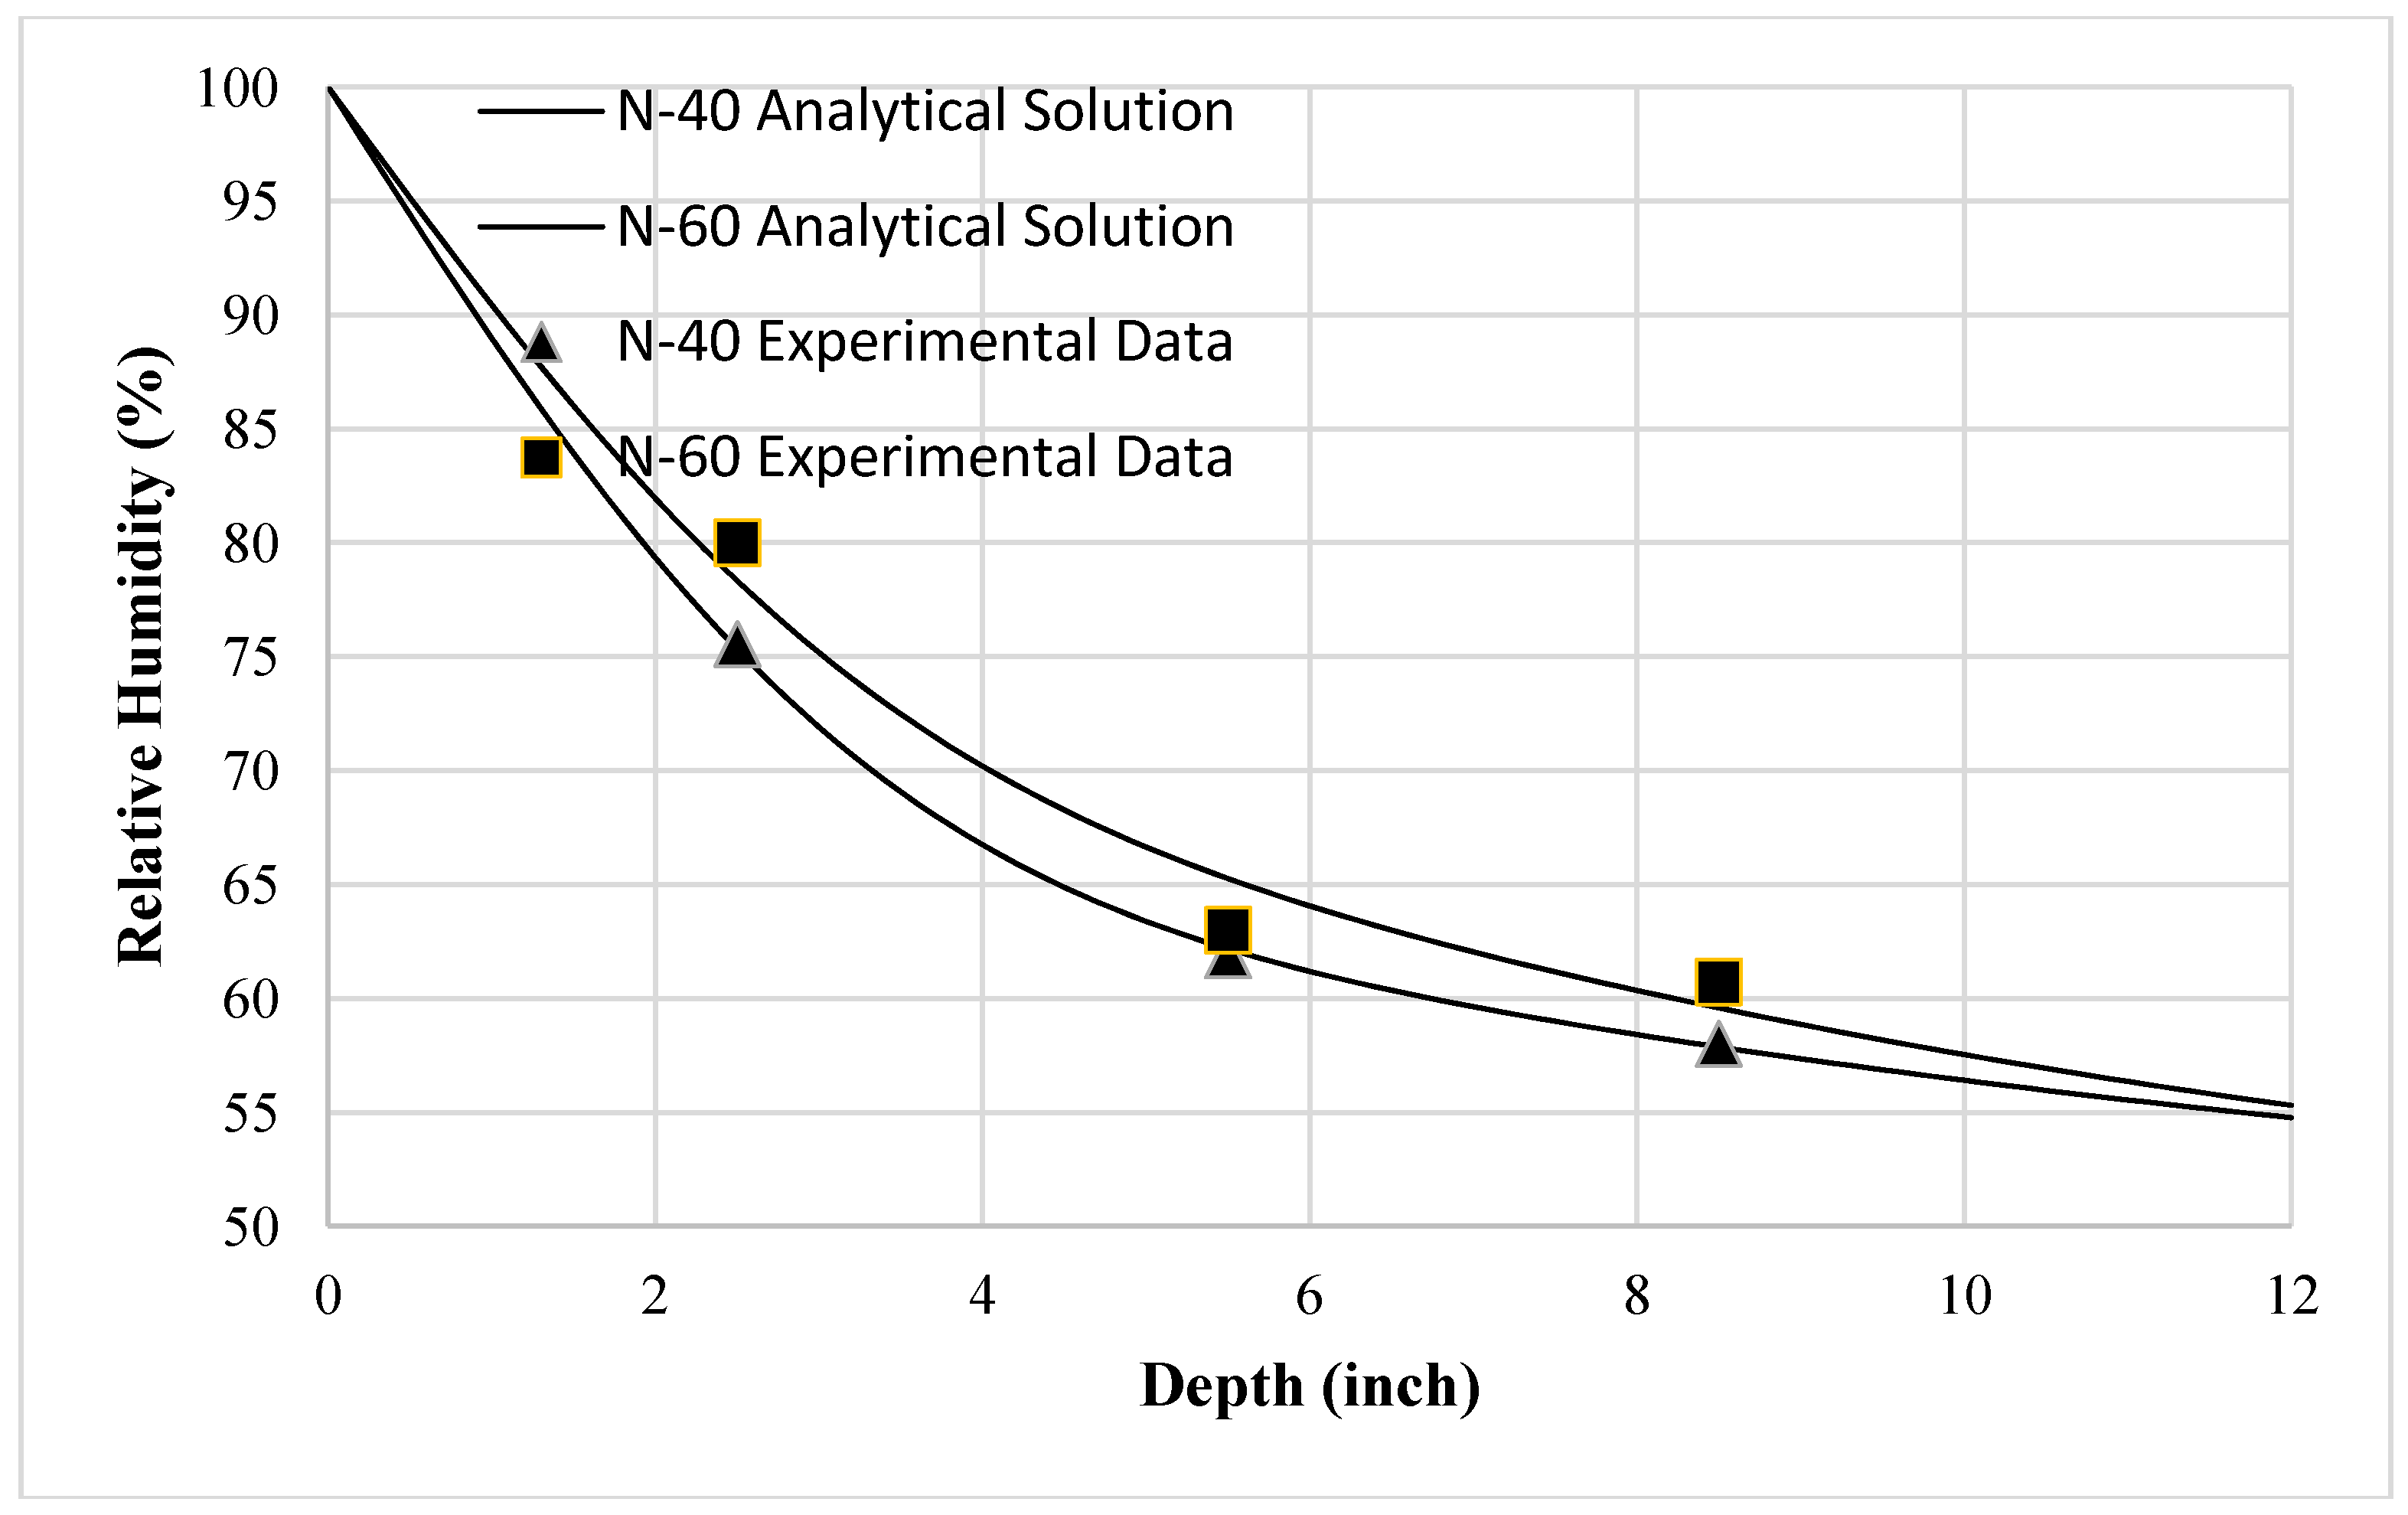
Figure 8 shows the comparisons of the analytical results calculated by Equation (24) and the experimental data of the samples. From this figure, one can see that under the given initial and boundary conditions of temperature and moisture, the model predictions of the internal relative humidity distribution profiles agree quite well with the test data. The general trend is that the moisture transfer is increased by the temperature gradient [23,24,26], and that the higher the temperature gradient, the higher the moisture profiles. It indicates that the coupling parameter DHT obtained in this study can characterize properly the effect of the temperature gradient on moisture transfer.
5. Conclusions
- (1)
- A literature review was performed to examine the effect of heat transfer on moisture transfer, the so-called Soret effect. Although the effect was recognized long time ago and studied for different materials, there has been no systematic study for concrete.
- (2)
- An experimental technique was developed for studying the temperature effect on moisture transfer in concrete. The technique was used with four different temperature conditions to study the effect of temperature on moisture transfer in concrete and the test data can be used to obtain the value of the related material parameter.
- (3)
- The experimental data indicates that the elevated temperature without a temperature gradient (an isothermal condition) does not have a significant effect on moisture transfer in concrete. On the other hand, the effect of the temperature gradient under a non-isothermal condition is significant and becomes more significant as the temperature gradient increases.
- (4)
- The effect of the temperature gradient on moisture transfer can be modelled by using an additional term of the temperature gradient in the moisture flux equation. The coefficient of the temperature gradient is called the coupling parameter DHT (i.e., the coefficient of Soret effect in moisture flux equation).
- (5)
- An analytic approach was developed based on the governing equations for the coupled moisture and heat transfer to calculate the coupling parameter DHT based on the present test dada. The results show that DHT is not a constant but increases linearly with temperature variation. In addition, the parameter DHT depends on the mix design parameters of concrete, such as the water-cement ratio, the aggregate volume fraction, and the ratio of cement-replacement.
- (6)
- An available analytical solution of the coupled moisture and heat transfer equations was used to verify the material parameters obtained in the present study. The predicted moisture distributions under the influence of the temperature gradient were compared with the experimental results. They agreed reasonably well.
Acknowledgments
The authors wish to acknowledge the partial support by the US DOT/NEUP under the M2NU-3-ID-UI to University of Colorado at Boulder. Opinions expressed in this paper are those of the authors and do not necessarily reflect those of the sponsor.
Author Contributions
Yao Wang conducted all of the experimental studies, analyzed the test data, prepared theoretical model, and wrote the manuscript. Yunping Xi directed and advised the theoretical research and experimental work, and revised the manuscript.
Conflicts of Interest
The authors declare no conflict of interest.
References
- Zuber, B.; Marchand, J. Predicting the volume instability if hydrated cement systems upon freezing using poro-mechanics and local phase equilibria. Mater. Struct. 2004, 37, 257–270. [Google Scholar] [CrossRef]
- Bazant, Z.P.; Chern, J.C.; Rosenberg, A.M.; Gaidis, J.M. Mathematical model for freeze-thaw durability of concrete. J. Am. Ceram. Soc. 1998, 71, 776–783. [Google Scholar] [CrossRef]
- Tsongas, G. Case studies of moisture problems in residences. In Proceedings of the 2nd Annual Conference on Durability and Disaster Mitigation in Wood-Frame Housing, Madison, Wisconsin, 6–8 November 2000. [Google Scholar]
- Ganjian, E.; Pouya, H.S. The effect of Persian Gulf tidal zone exposure on durability of mixes containing silica fume and blast furnace slag. Constr. Build. Mater. 2009, 23, 644–652. [Google Scholar] [CrossRef]
- Ortega, J.M.; Sánchez, I.; Climent, M.A. Impedance spectroscopy study of the effect of environmental conditions in the microstructure development of OPC and slag cement mortars. Arch. Civ. Mech. Eng. 2015, 15, 569–583. [Google Scholar] [CrossRef]
- Ortega, J.M.; Sánchez, I.; Climent, M.A. Influence of different curing conditions on the pore structure and the early age properties of mortars with fly ash and blast-furnace slag. Mater. Constr. 2012, 63, 219–234. [Google Scholar]
- Ortega, J.M.; Sánchez, I.; Climent, M.A. Durability related transport properties of OPC and slag cement mortars hardened under different environmental conditions. Constr. Build. Mater. 2012, 27, 176–183. [Google Scholar] [CrossRef]
- Ortega, J.M.; Sánchez, I.; Antón, C.; De Vera, G.; Climent, M.A. Influence of environment on durability of fly ash cement mortars. ACI Mater. J. 2012, 109, 647–656. [Google Scholar]
- Çakir, Ö.; Aköz, F. Effect of curing conditions on the mortars with and without GGBFS. Constr. Build. Mater. 2008, 22, 308–314. [Google Scholar] [CrossRef]
- Ramezanianpour, A.A.; Malhotra, V.M. Effect of curing on the compressive strength, resistance to chloride-ion penetration and porosity of concretes incorporating slag, fly ash or silica fume. Cem. Concr. Compos. 1995, 17, 125–133. [Google Scholar] [CrossRef]
- Barnett, S.J.; Soutsos, M.N.; Millard, S.G.; Bungey, J.H. Strength development of mortars containing ground granulated blast-furnace slag: effect of curing temperature and determination of apparent activation energies. Cem. Concr. Res. 2006, 36, 434–440. [Google Scholar] [CrossRef]
- Geiseler, J.; Kollo, H.; Lang, E. Influence of blast furnace cements on durability of concrete structures. ACI Mater. J. 1995, 92, 252–257. [Google Scholar]
- Chalee, W.; Ausapanit, P.; Jaturapitakkul, C. Utilization of fly ash concrete in marine environment for long term design life analysis. Mater. Des. 2010, 31, 1242–1249. [Google Scholar] [CrossRef]
- Thomas, M.D.; Matthews, J. Performance of pfa concrete in a marine environment—10 year results. Cem. Concr. Compos. 2004, 26, 5–20. [Google Scholar] [CrossRef]
- Thomas, M.D.; Scott, A.; Bremner, T.; Bilodeau, A.; Day, D. Performance of slag concrete in marine environment. ACI Mater. J. 2008, 105, 628–634. [Google Scholar]
- Detwiler, J.; Kjellsen, K.O.; Gjorv, O.E. Resistance to Chloride Intrusion of Concrete Cured at Different Temperatures. ACI Mater. J. 1991, 88, 19–24. [Google Scholar]
- Costa, A.; Appleton, J. Chloride penetration into concrete in marine environment—Part I: Main parameters affecting chloride penetration. Mater. Struct. 1999, 32, 252–259. [Google Scholar] [CrossRef]
- Sedlbauer, K.; Krus, M.; Zillig, W.; Kunzel, H.M. Mold Growth Prediction by Computational Simulation. In Proceedings of the ASHRAE Conference, San Francisco, CA, USA, November 2001. [Google Scholar]
- Bertolini, L.; Elsener, B.; Pedeferri, P.; Plder, R. Corrosion of Steel in Concrete; Wiley-VCH Verlag Gmbh & Co., KGaA: Weinheim, Germany, 2013. [Google Scholar]
- Anold, J.R.; Garrabrants, A.C.; Samson, E.; Flach, G.P.; Langton, C.A. Moisture Transport Review; CBP-TR-2009-002 Cementitous Barriers Partnership: Phoenix, AZ, USA, 2009. [Google Scholar]
- Bazant, Z.P.; Chern, J.; Thonguthai, W. Finite element program for moisture and heat transfer in heated concrete. Nucl. Eng. Des. 1982, 68, 61–70. [Google Scholar] [CrossRef]
- Szekeres, A. Cross-coupled heat and moisture transport. J. Therm. Stresses 2012, 35, 248–268. [Google Scholar] [CrossRef]
- Zhang, W.; Min, H.; Gu, X. Temperature response and moisture transport in damaged concrete under an atmospheric environment. Constr. Build. Mater. 2016, 123, 290–299. [Google Scholar] [CrossRef]
- Platten, J.K. The Soret effect: A review of recent experimental results. J. Appl. Mech. 2005, 73, 5–15. [Google Scholar] [CrossRef]
- Haupl, J.; Fechner, H. Coupled heat air and moisture transfer in building structures. Int. J. Heat Mass Transf. 1997, 40, 1633–1642. [Google Scholar] [CrossRef]
- Bazant, Z.P.; Thonguthai, W. Pore pressure in heated concrete walls: theoretical prediction. Mag. Concr. Res. 1979, 31, 67–76. [Google Scholar] [CrossRef]
- Eastman, E.D. Theory of the Soret effect. J. Am. Chem. Soc. 1928, 50, 283–291. [Google Scholar] [CrossRef]
- Xi, Y.; Jennings, H. Shrinkage of cement paste and concrete modelled by a multiscale effective homogeneous theory. Mater. Struct. 1997, 30, 329–339. [Google Scholar] [CrossRef]
- Trabelsi, A.; Belarbi, R.; Abahri, K.; Qin, M. Assessment of temperature gradient effects on moisture transfer through thermogradient coefficient. Build. Simul. 2012, 5, 107–115. [Google Scholar] [CrossRef]
- Bazant, Z.P.; Najjar, L.J. Nonlinear water diffusion of nonsaturated concrete. Mater. Struct. 1972, 5, 3–20. [Google Scholar]
- Harstad, K. Modeling the Soret effect in dense media mixtures. Ind. Eng. Chem. Res. 2009, 48, 6907–6915. [Google Scholar] [CrossRef]
- Brunauer, S.; Emmett, P.H.; Teller, E. Adsorption of gases in multimolecular layers. J. Am. Ceram. Soc. 1938, 60, 309–319. [Google Scholar] [CrossRef]
- Xi, Y.; Bazant, Z.P.; Molina, L.; Jennings, H.M. Moisture diffusion in cementitious materials: Adsorption Isotherm. Adv. Cem. Based Mater. 1994, 1, 248–257. [Google Scholar] [CrossRef]
- Xi, Y.; Bazant, Z.P.; Molina, L.; Jennings, H.M. Moisture diffusion in cementitious materials: Moisture Capactiy and Diffusivity. Adv. Cem. Based Mater. 1994, 1, 258–266. [Google Scholar] [CrossRef]
- Brunauer, S.; Skalny, J.; Bodor, E.E. Adsorption on nonporous solids. J. Coll. Inter. Sci. 1969, 30, 546–552. [Google Scholar] [CrossRef]
- Homan, L.; Ababneh, A.; Xi, Y. The effect of moisture transport on chloride penetration in concrete. Constr. Build. Mater. 2016, 125, 1189–1195. [Google Scholar] [CrossRef]
- Carslaw, H.S.; Jaeger, J.C. Conduction of Heat in Solids; Oxford at the Clarendon Press: Oxford, UK, 1965. [Google Scholar]
- Murray, R.S. Theory and Problems of Laplace Transforms; McGraw-Hill. Inc.: New York, NY, USA, 1965. [Google Scholar]
- Bai, Y.; Wang, Y.; Xi, Y. An Analytical Solution for the Effect of Thermal Gradient on Moisture Transfer in Concrete. Comput. Concr. 2017. submitted. [Google Scholar]
Figure 1.
Theoretical model for the study topic: (a) isothermal condition test and (b) non-isothermal condition test.
Figure 1.
Theoretical model for the study topic: (a) isothermal condition test and (b) non-isothermal condition test.

Figure 2.
Schematic illustration of the experimental set-up (unit: inch).
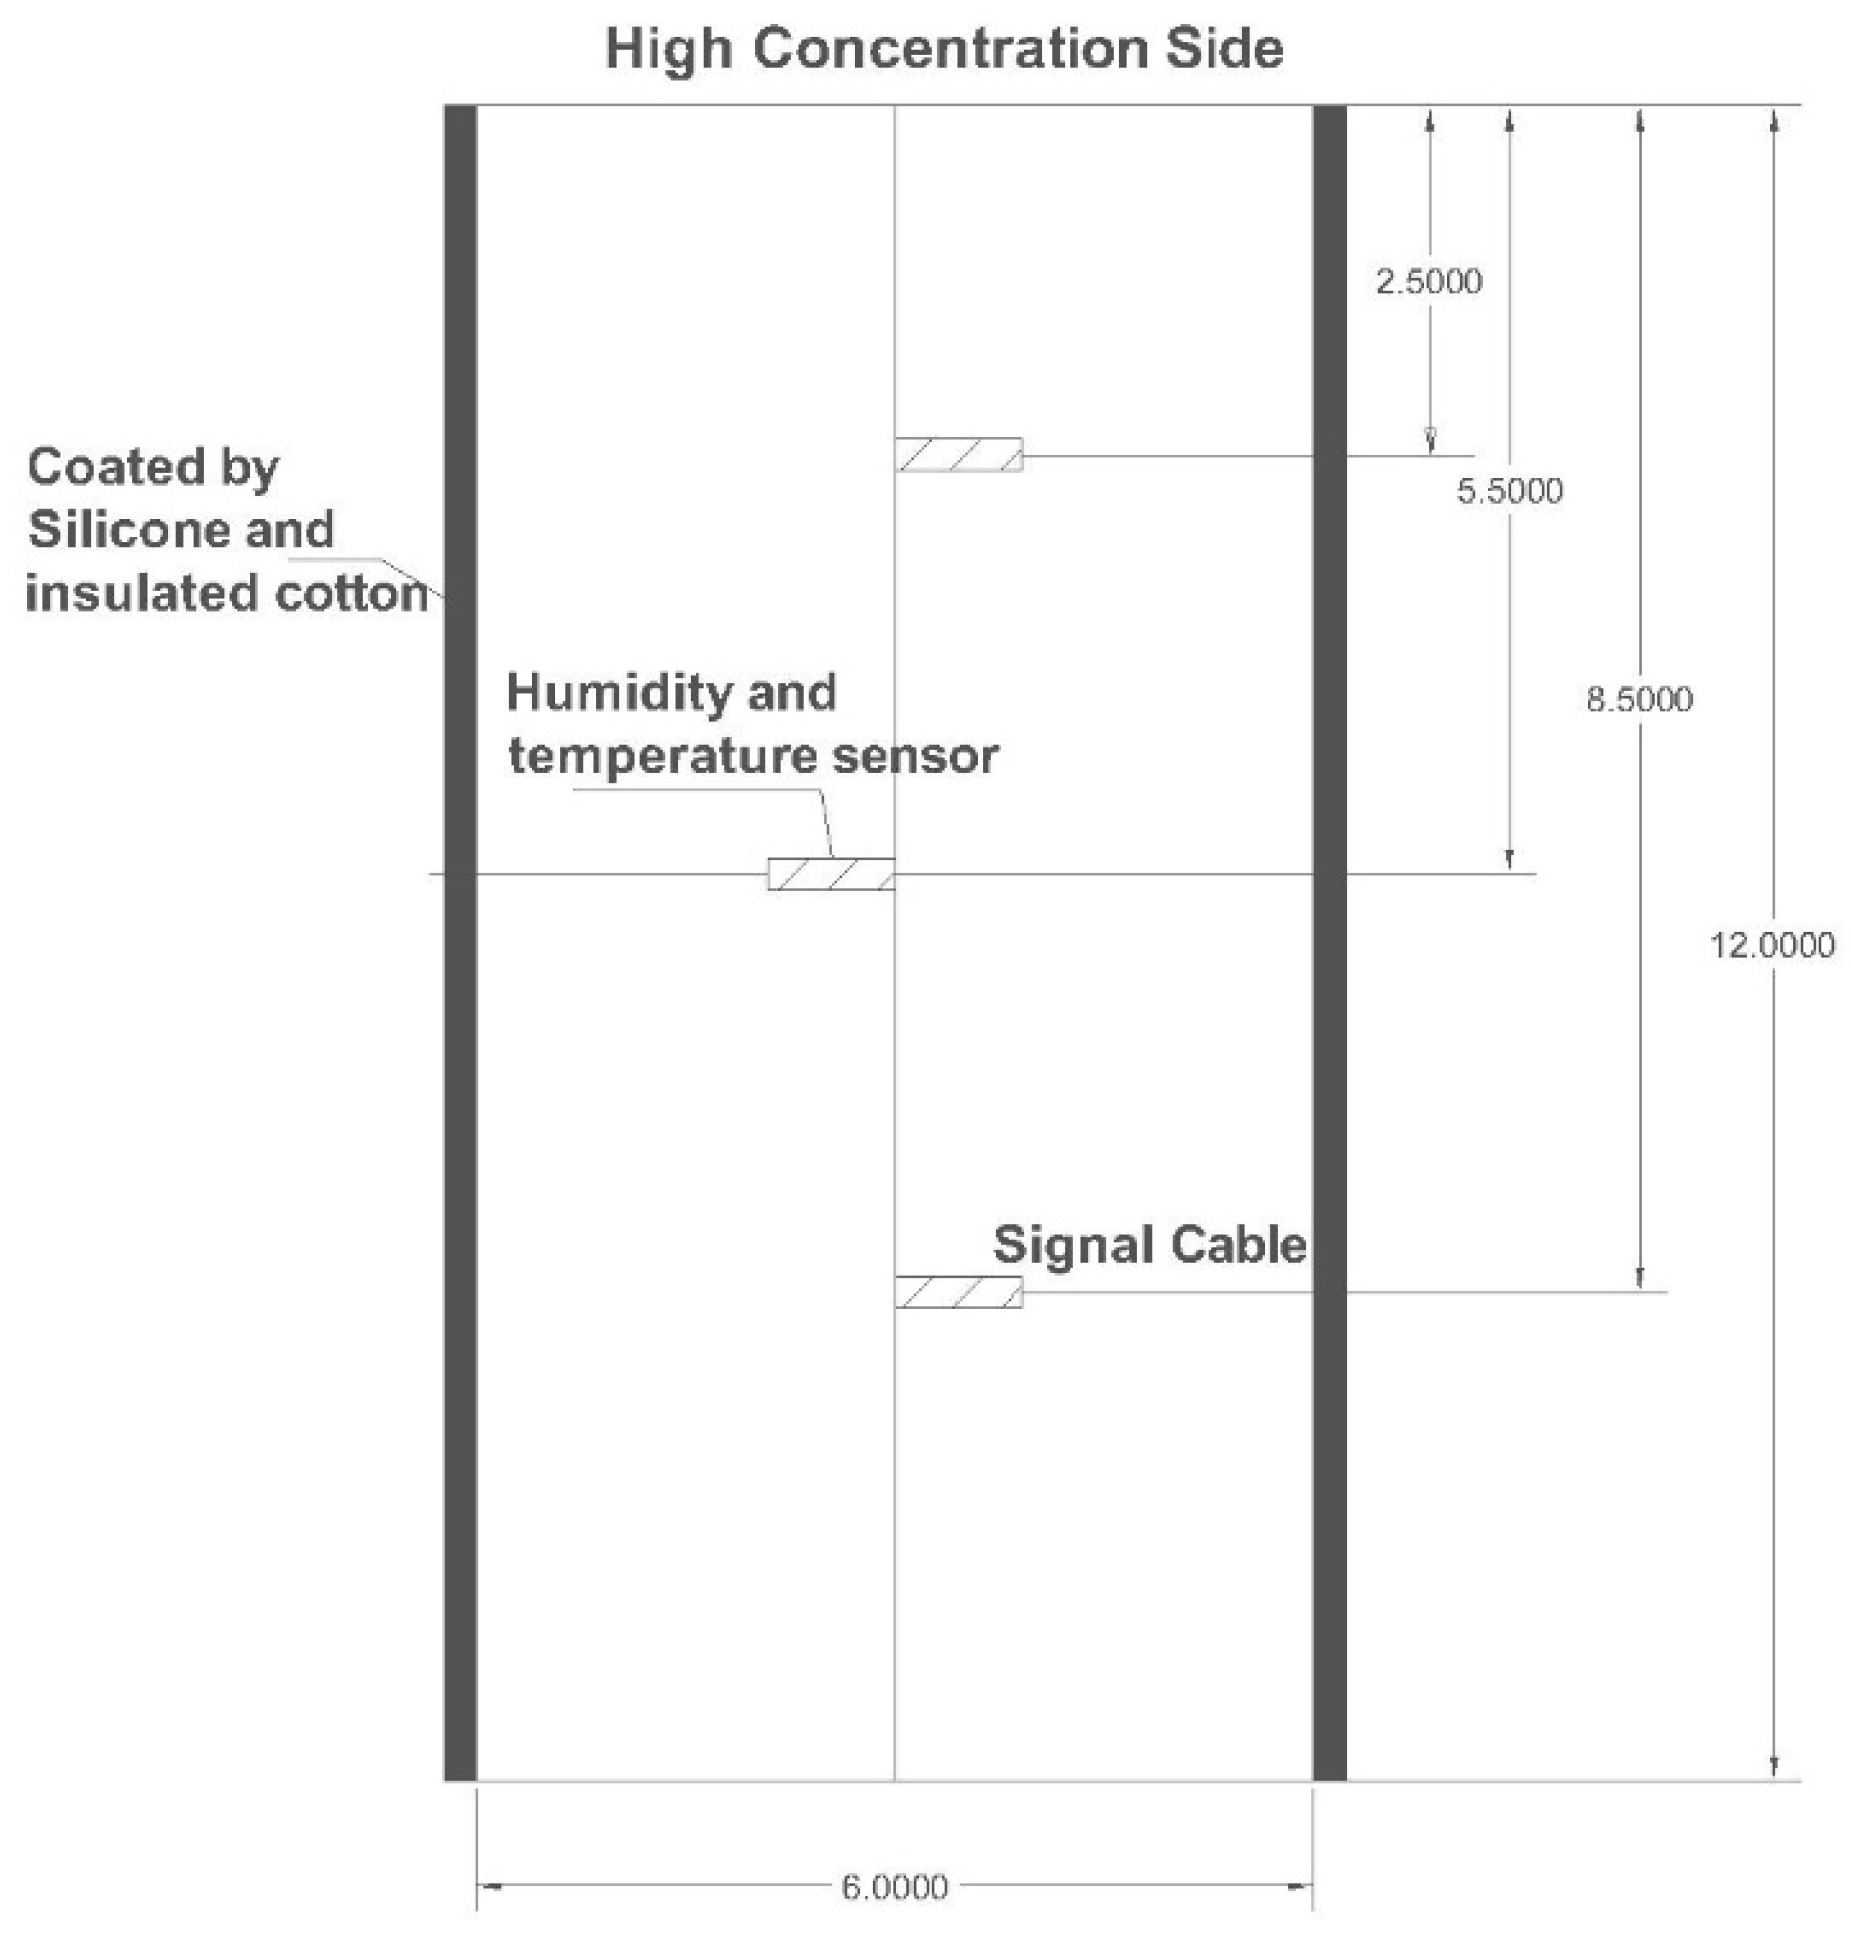
Figure 3.
SHT75 Sensirion humidity and temperature sensor after treatment.

Figure 4.
Temperature distribution profiles for all samples at the same time (t = 10 day).

Figure 5.
Relative humidity profiles for all samples varies with time increasing at same depth (x = 5.5 inch).
Figure 5.
Relative humidity profiles for all samples varies with time increasing at same depth (x = 5.5 inch).
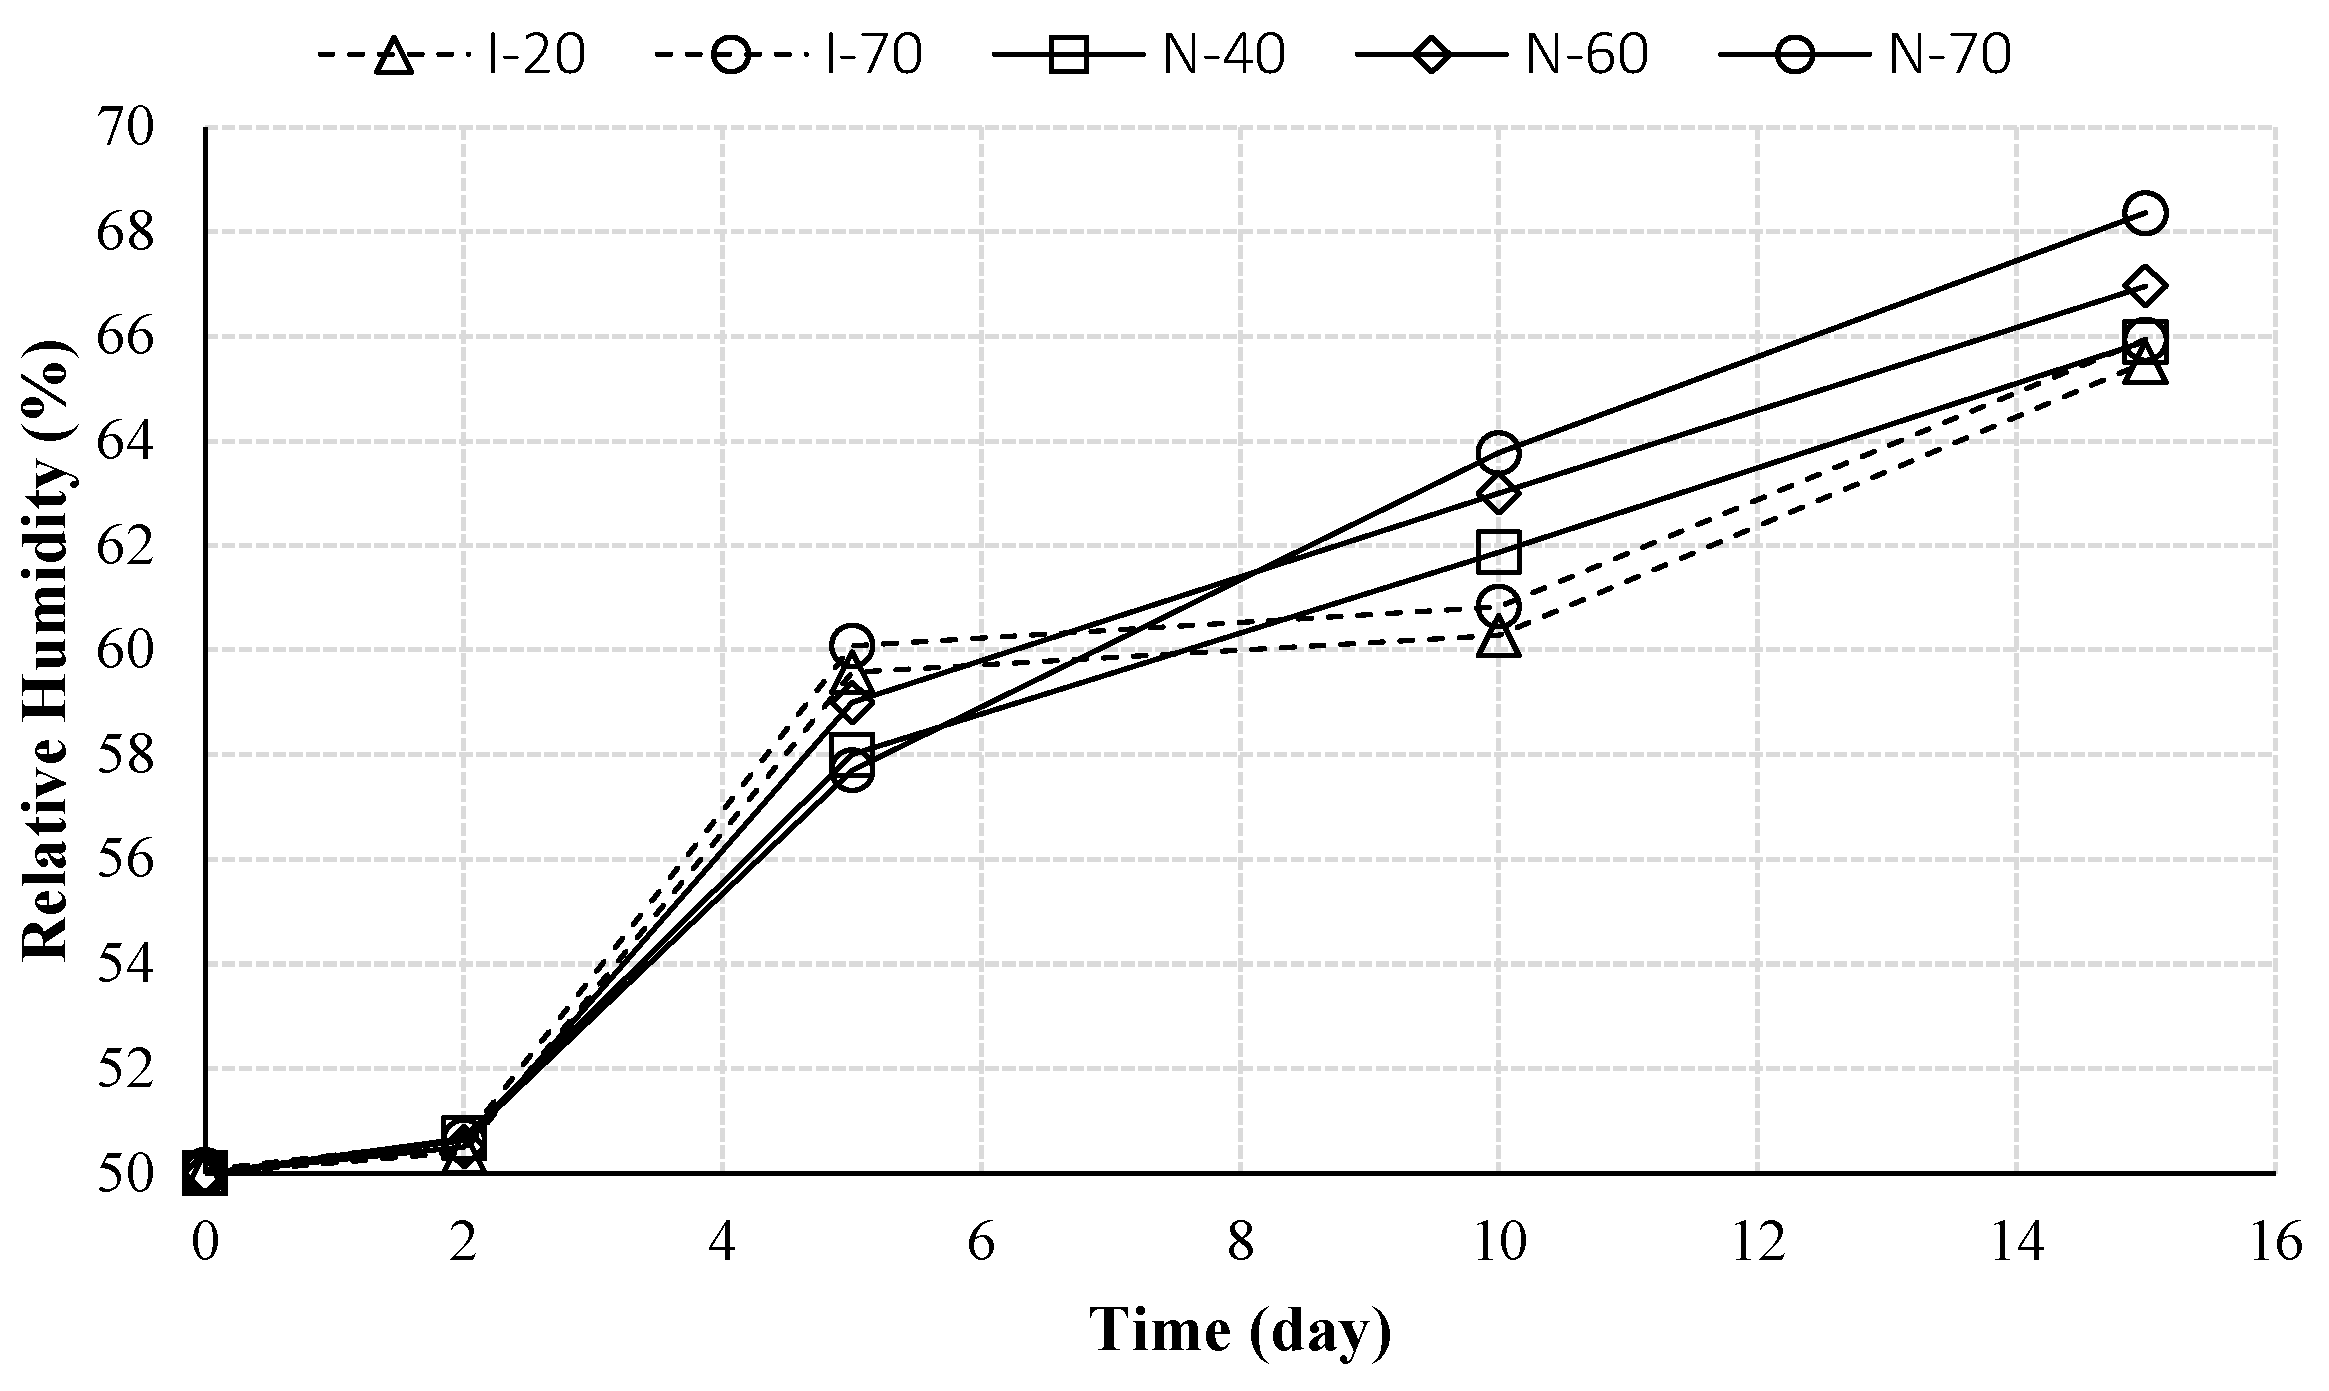
Figure 6.
Relative humidity distribution profiles for all samples at the same time (t = 10 day).

Figure 7.
Comparison of experimental results and model predictions of DHT (%·m2·sec−1·Celsius−1).

Figure 8.
Comparisons of analytical results and experimental data.

Table 1.
Mix proportions of concrete specimens.
| Water–Cement Ratio | Sand-Cement Ratio | Gravel-Cement Ratio |
|---|---|---|
| 0.6 | 2.4 | 2.9 |
Table 2.
Experimental strategy adopted.
| Specimen | Top Side | Bottom Side | ||
|---|---|---|---|---|
| RH | T (°C) | RH | T (°C) | |
| I-20 | 100% | 20 | 50% | 20 |
| I-70 | 100% | 70 | 50% | 70 |
| N-40 | 100% | 40 | 50% | 20 |
| N-60 | 100% | 60 | 50% | 20 |
| N-70 | 100% | 70 | 50% | 20 |
Note: I stands for isothermal and N stands for non-isothermal.
© 2017 by the authors. Licensee MDPI, Basel, Switzerland. This article is an open access article distributed under the terms and conditions of the Creative Commons Attribution (CC BY) license (http://creativecommons.org/licenses/by/4.0/).
Share and Cite
MDPI and ACS Style
Wang, Y.; Xi, Y. The Effect of Temperature on Moisture Transport in Concrete. Materials 2017, 10, 926. https://doi.org/10.3390/ma10080926
AMA Style
Wang Y, Xi Y. The Effect of Temperature on Moisture Transport in Concrete. Materials. 2017; 10(8):926. https://doi.org/10.3390/ma10080926
Chicago/Turabian StyleWang, Yao, and Yunping Xi. 2017. "The Effect of Temperature on Moisture Transport in Concrete" Materials 10, no. 8: 926. https://doi.org/10.3390/ma10080926
Note that from the first issue of 2016, this journal uses article numbers instead of page numbers. See further details here.