Effect of Aspect Ratio on the Permittivity of Graphite Fiber in Microwave Heating

 , ,
, , 
Abstract
:1. Introduction
2. Results
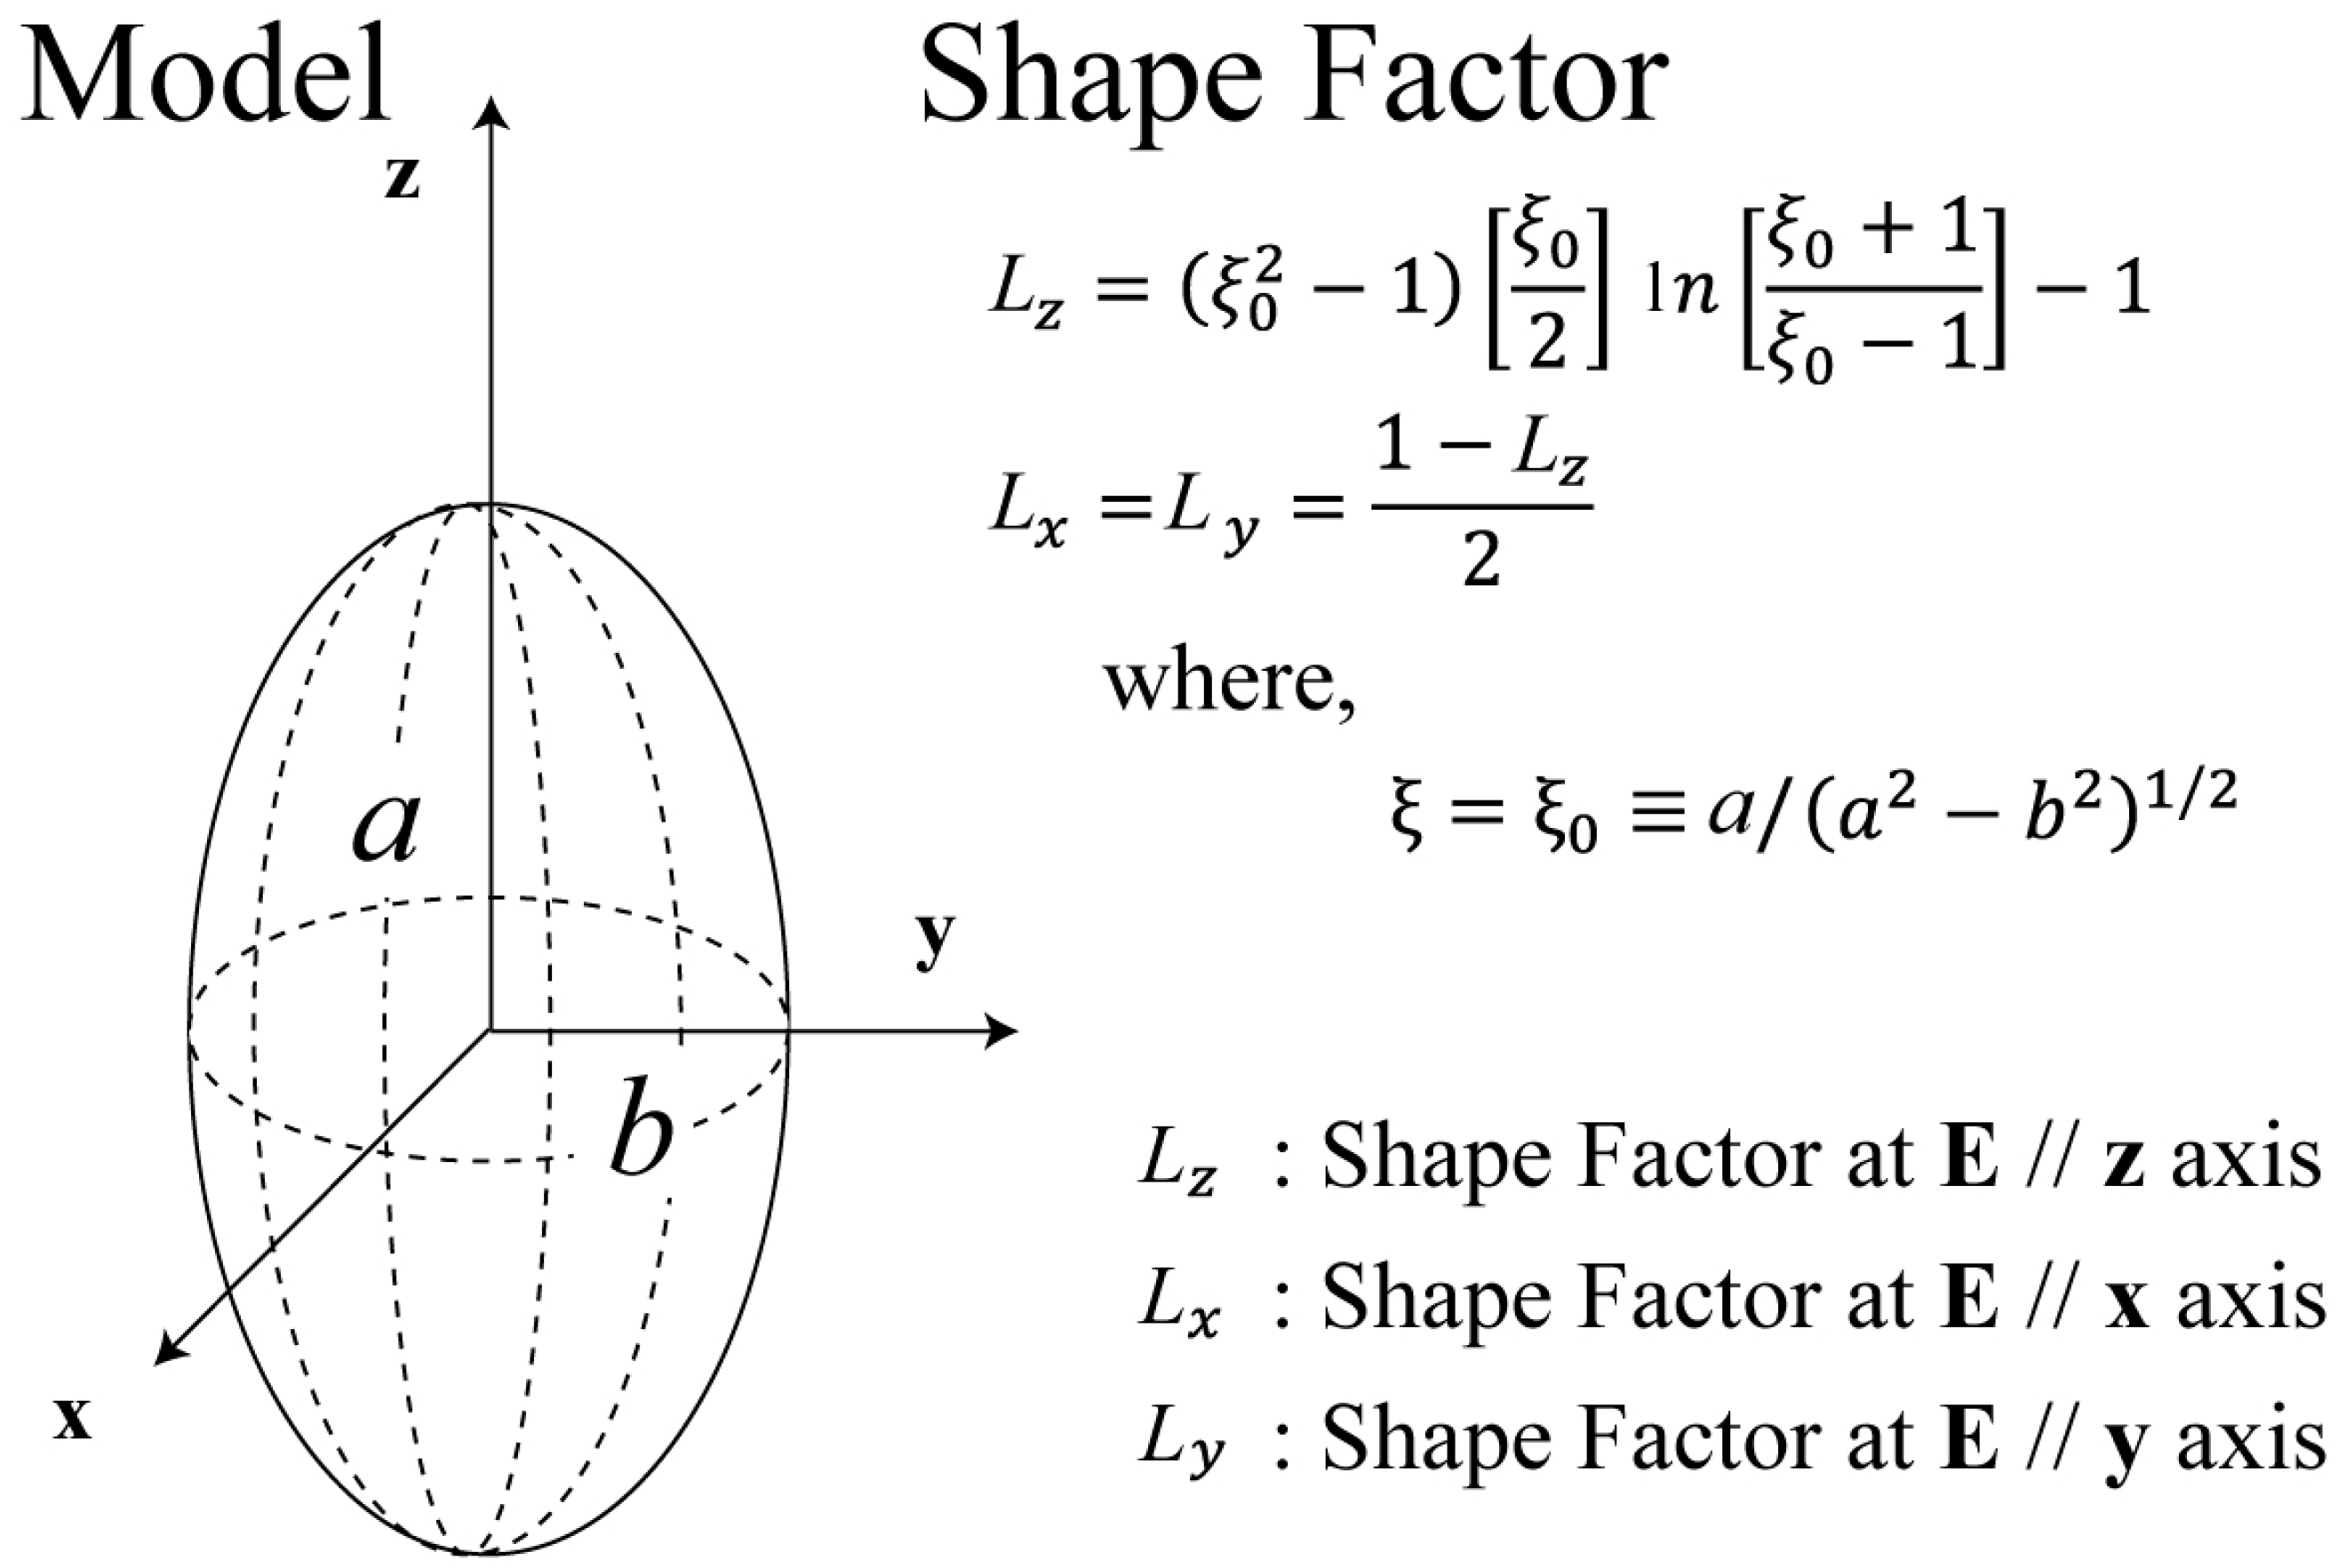
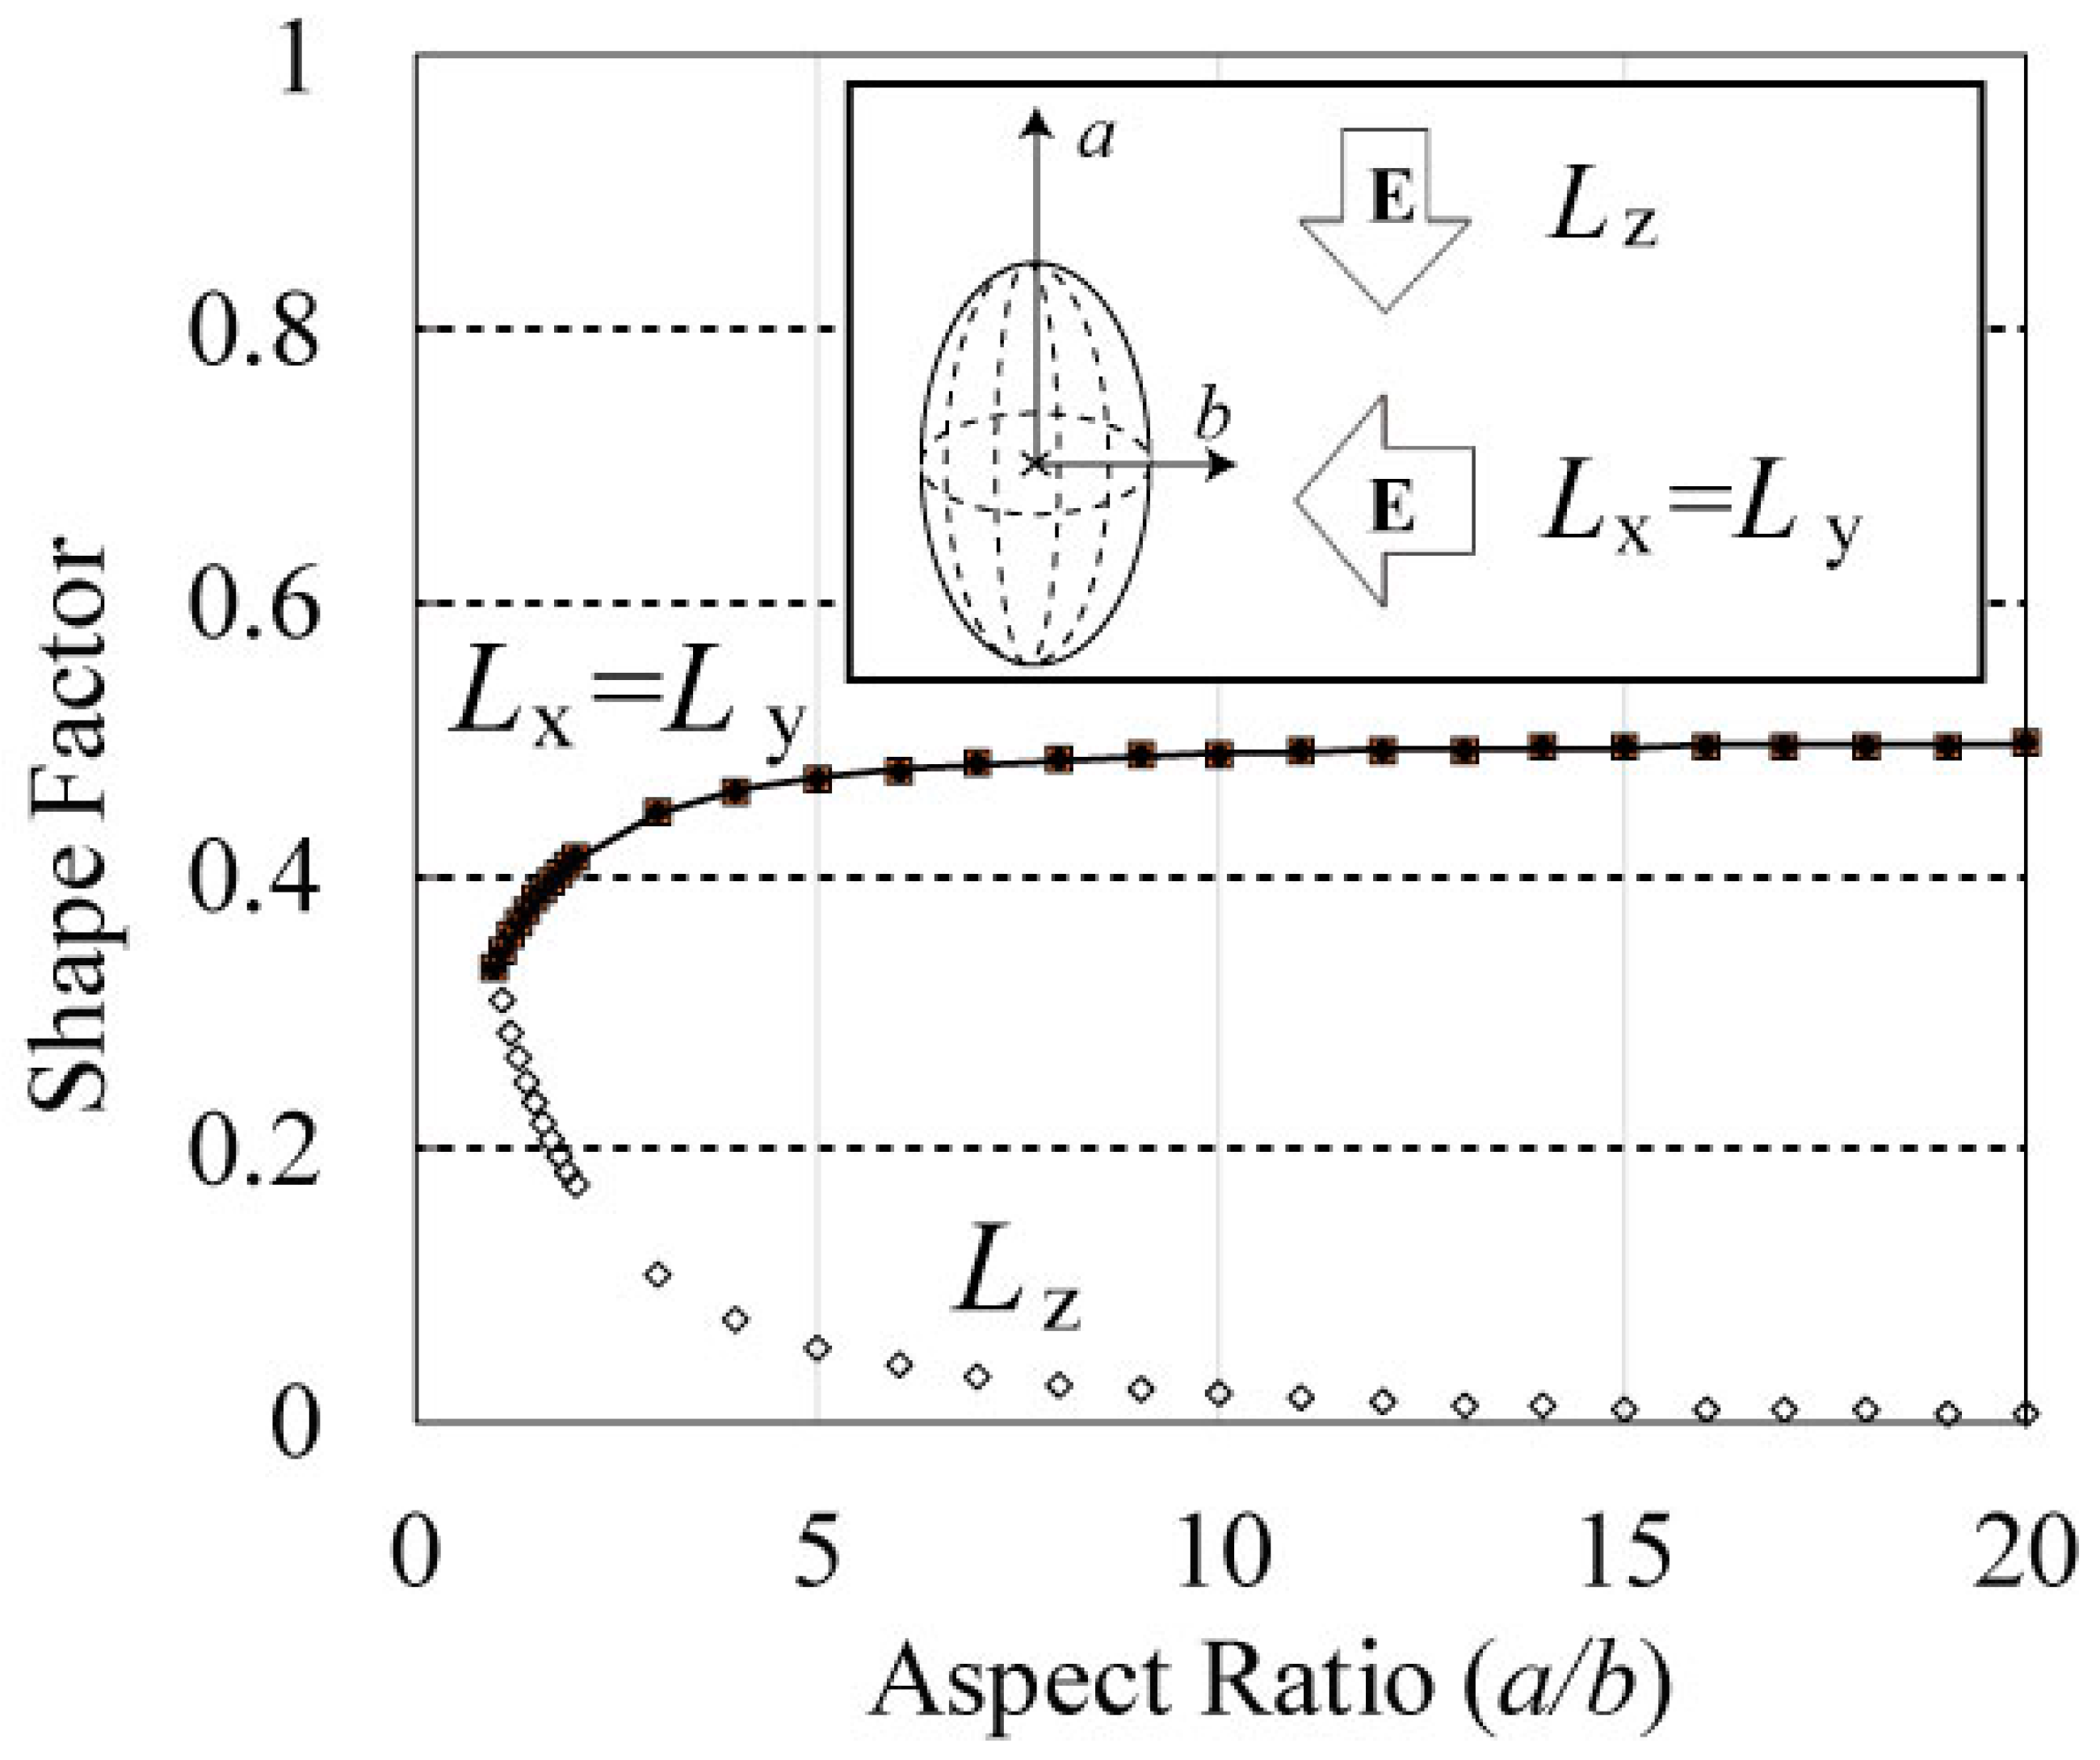
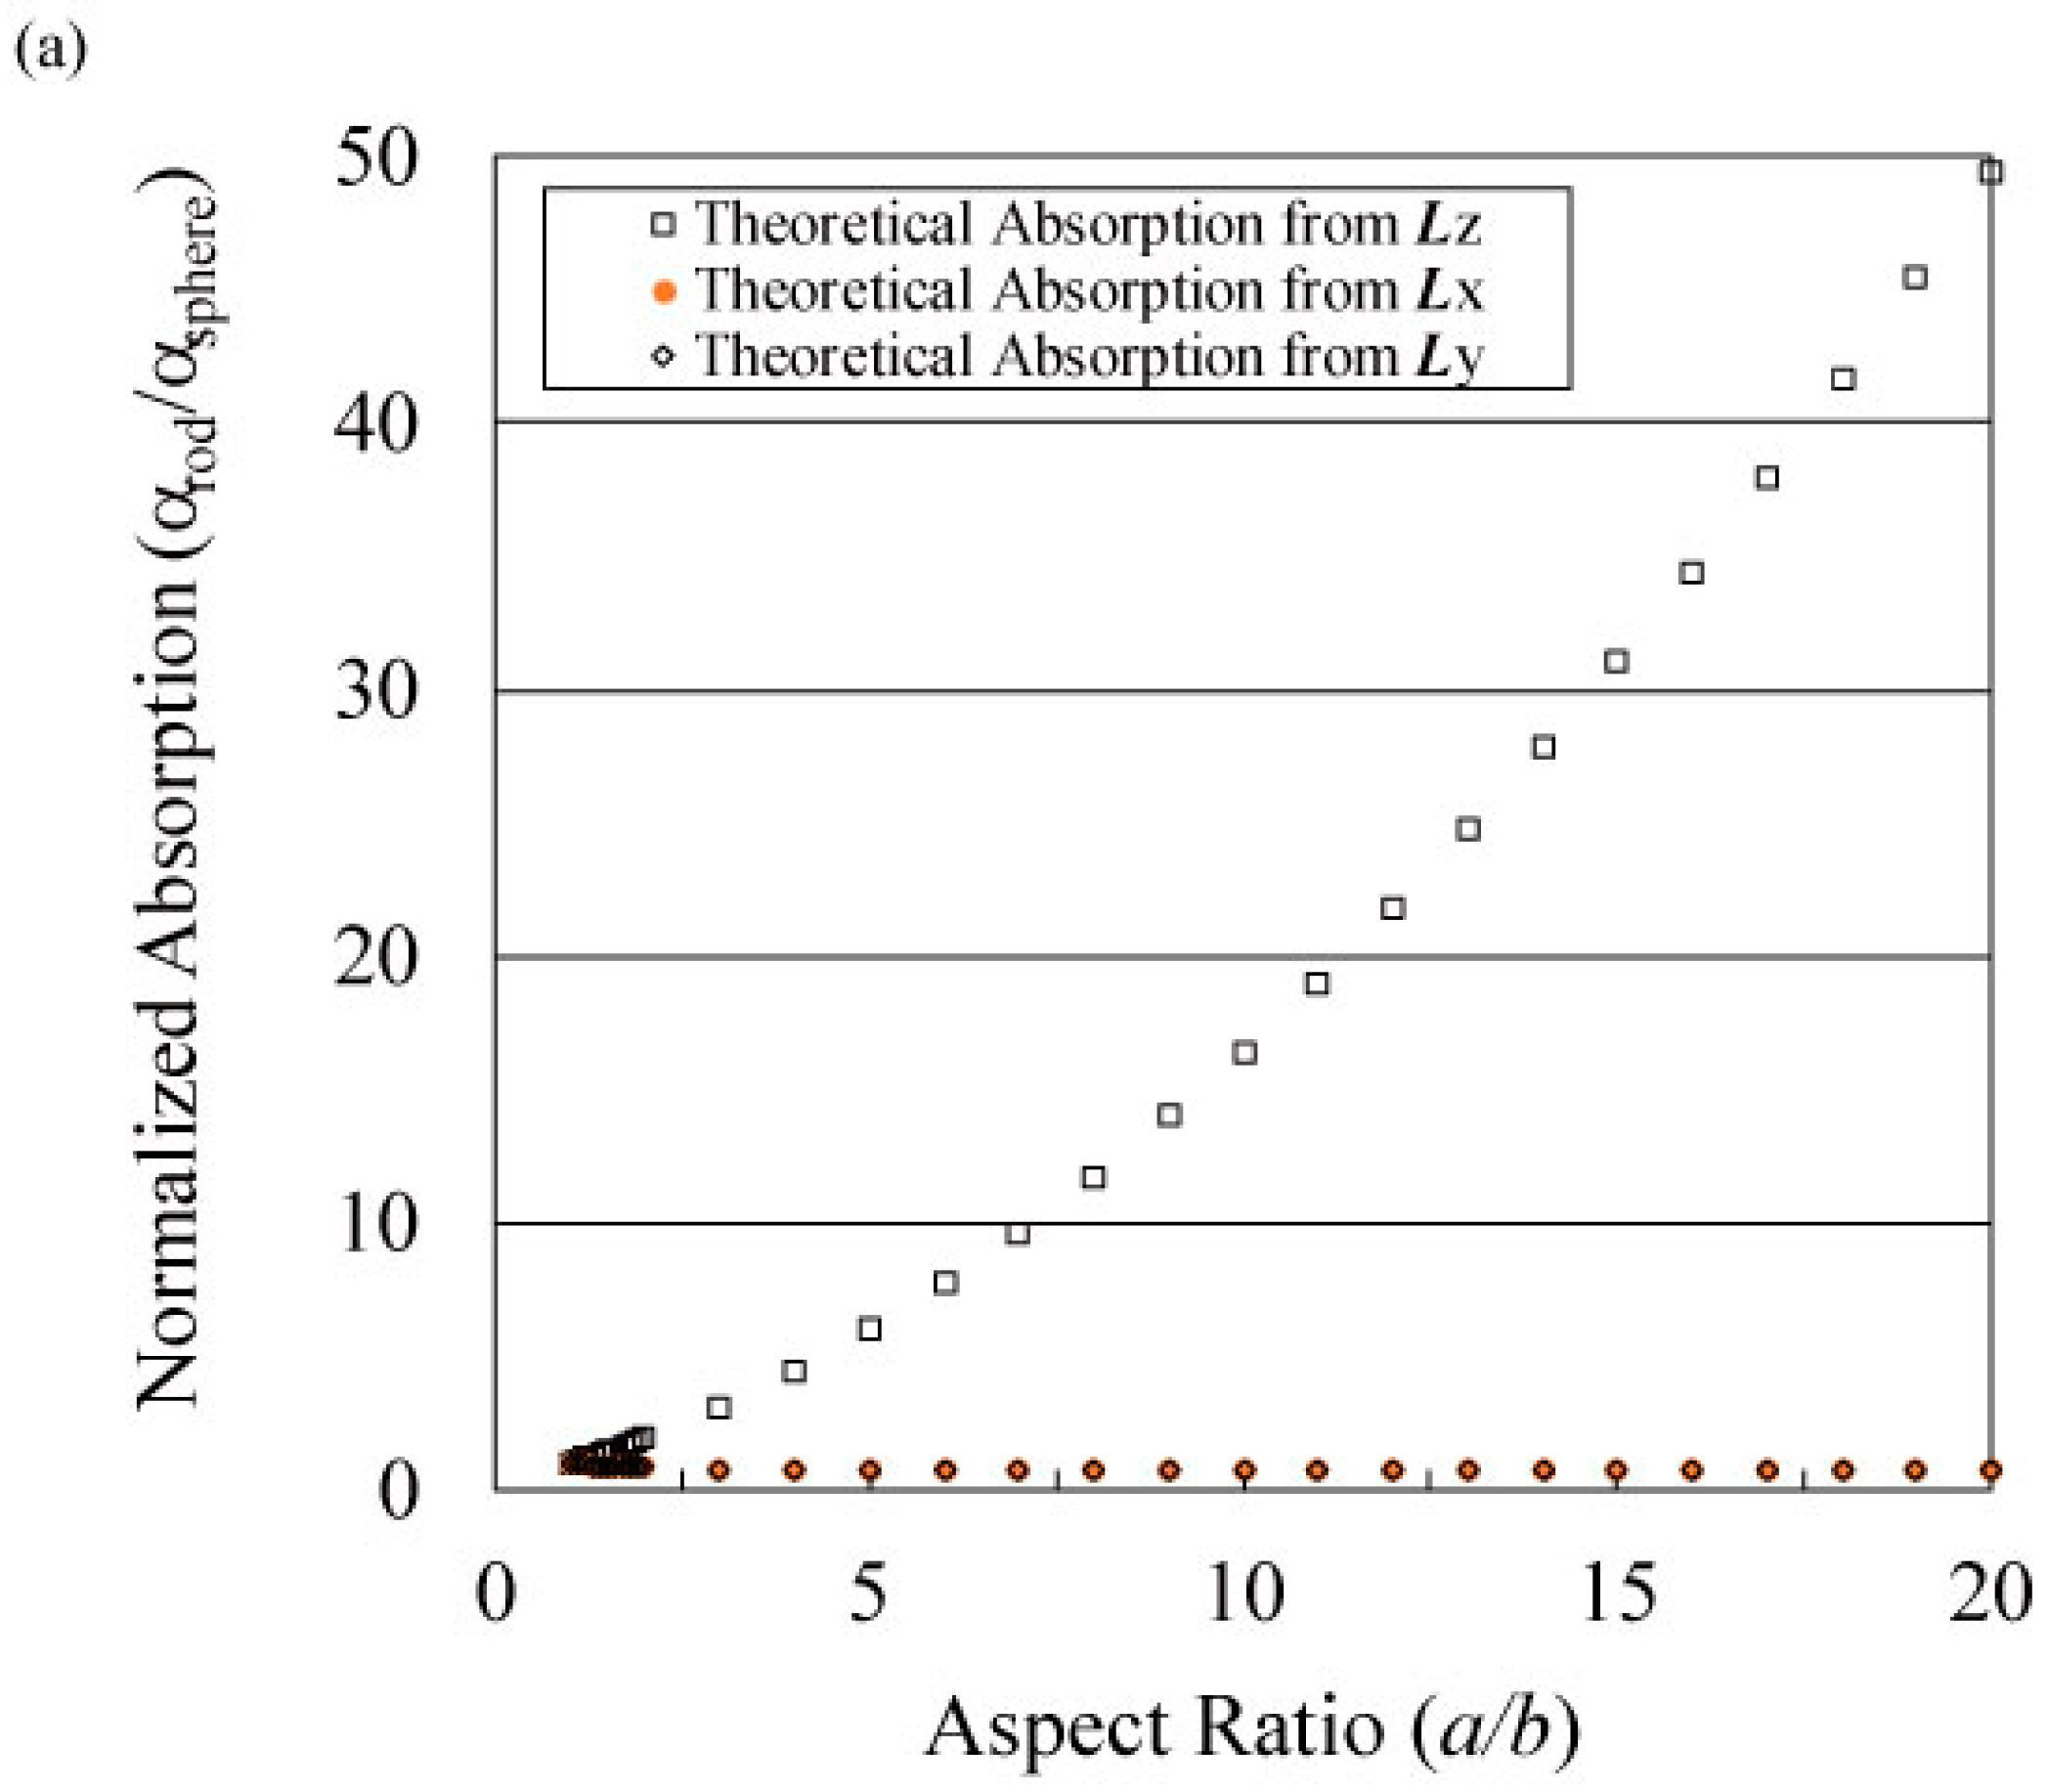
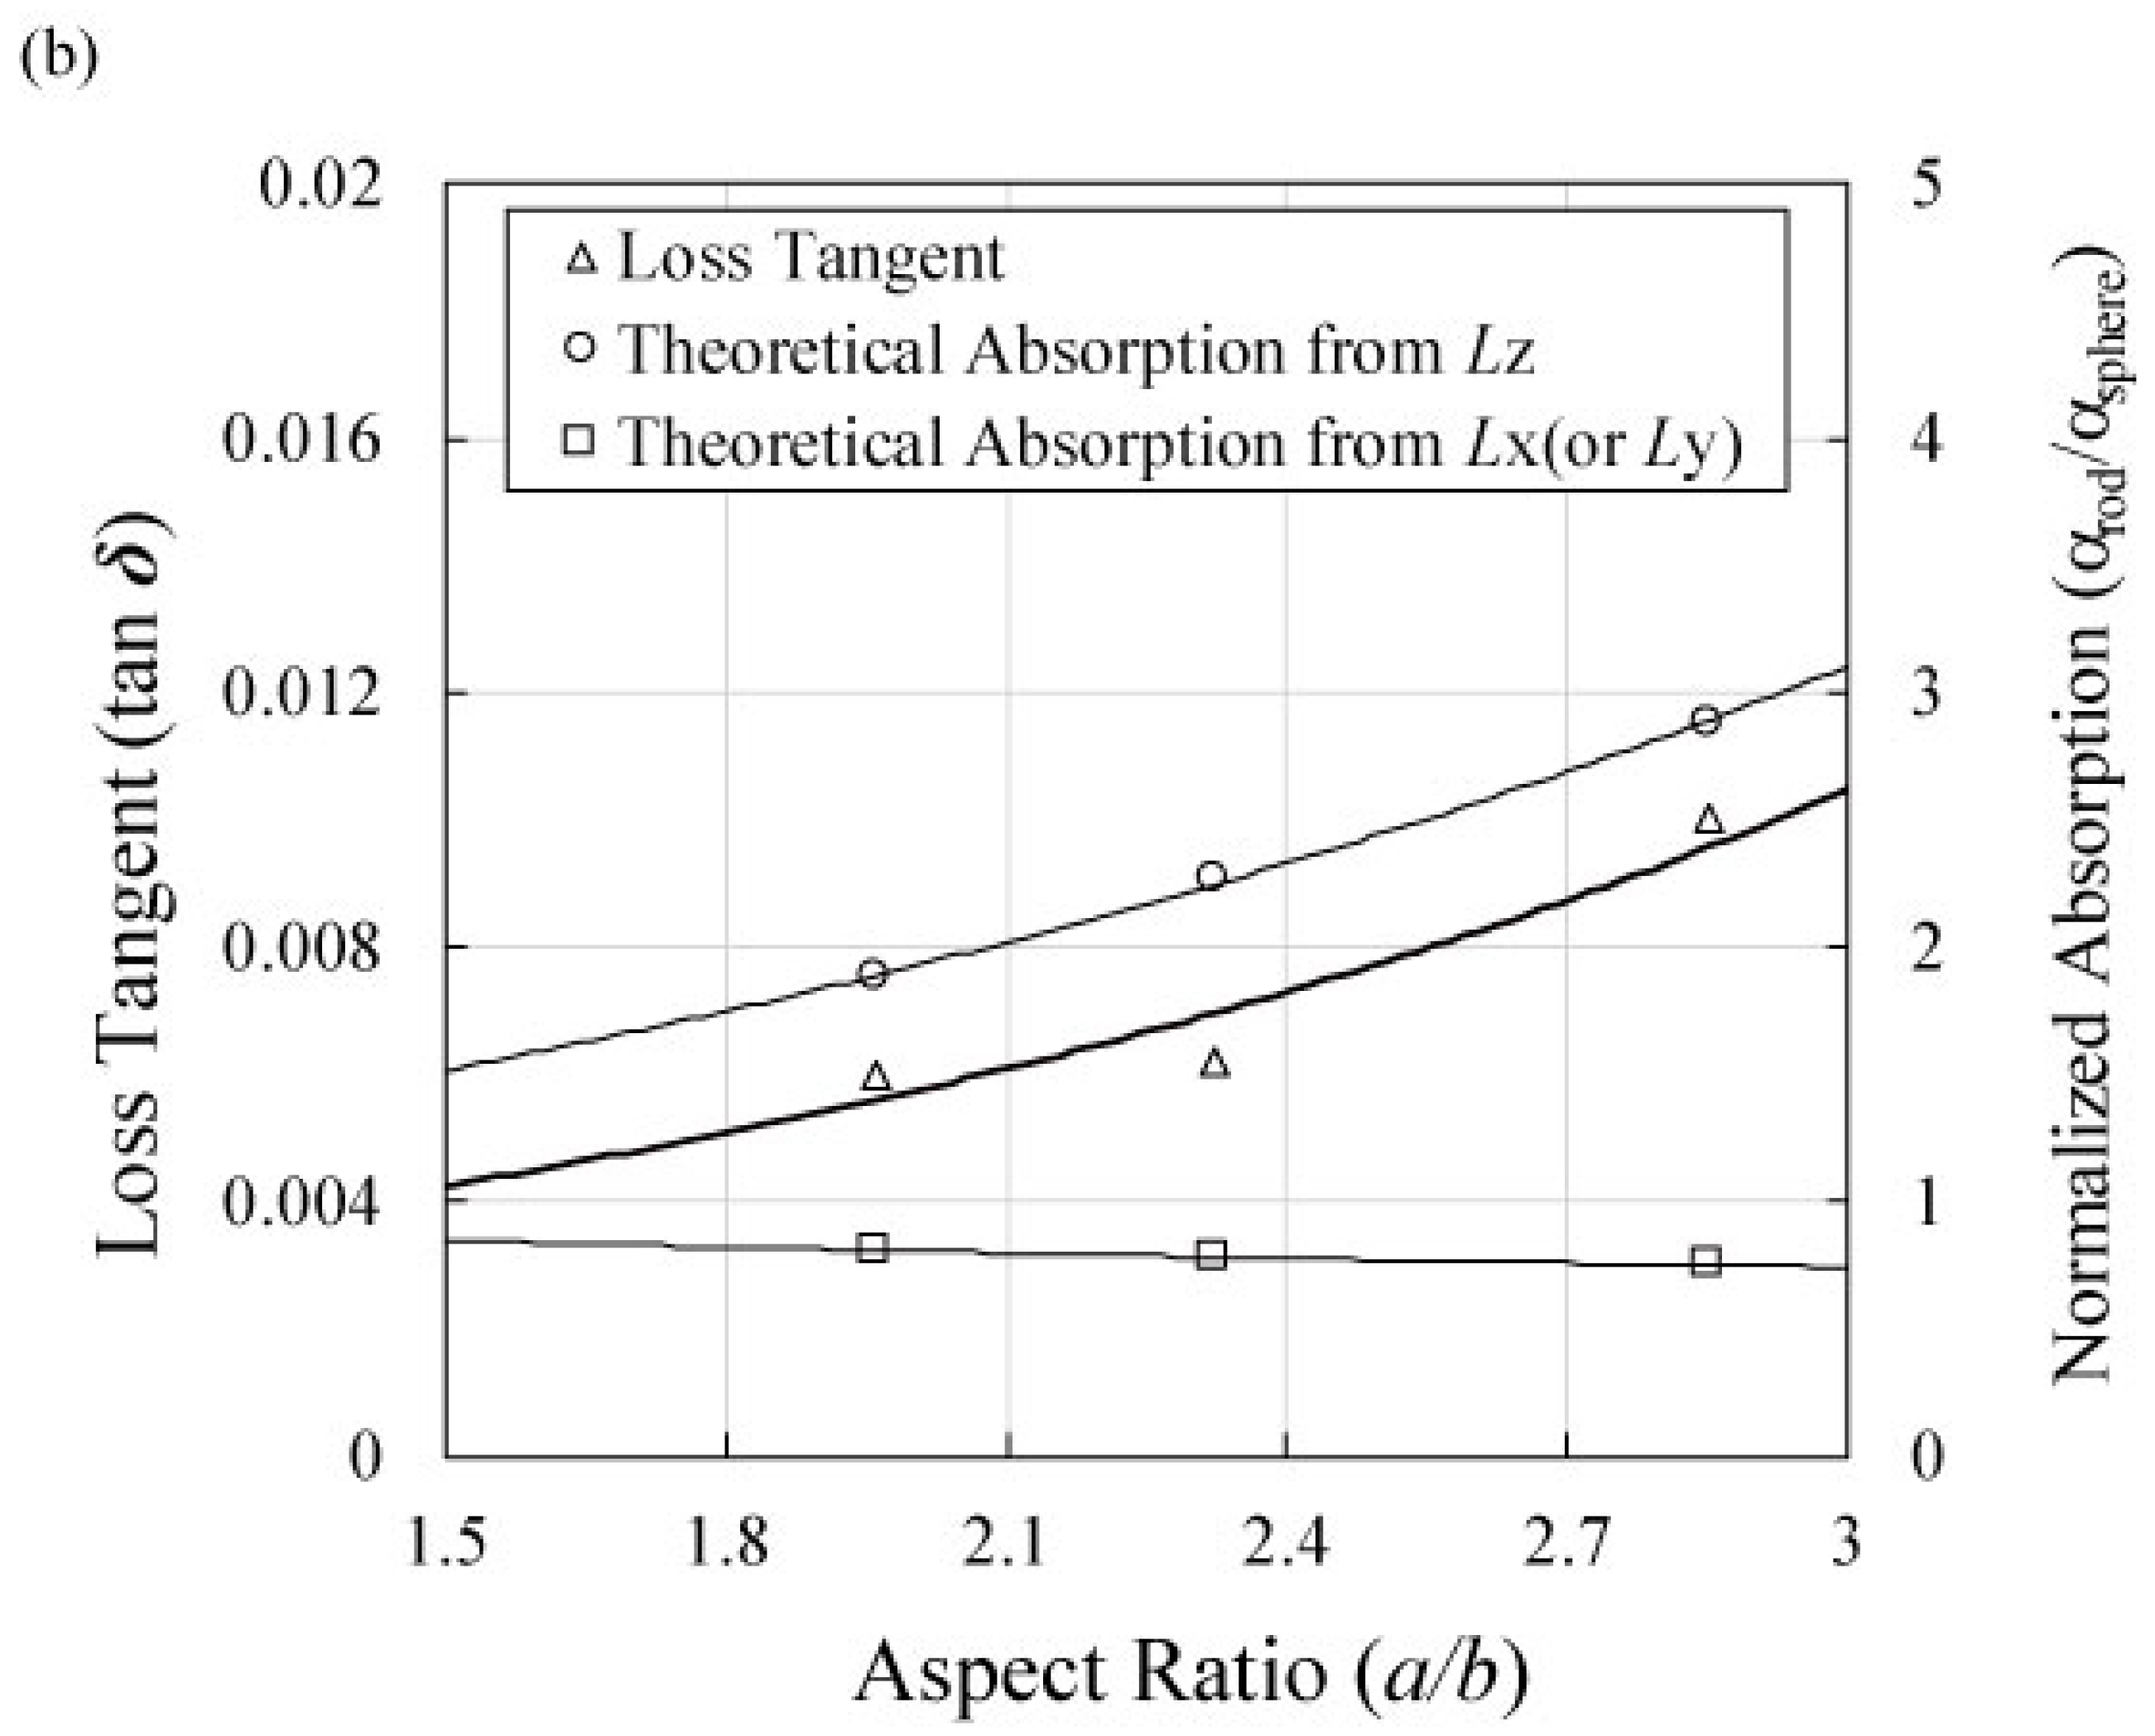
2.1. Theoretical Analysis
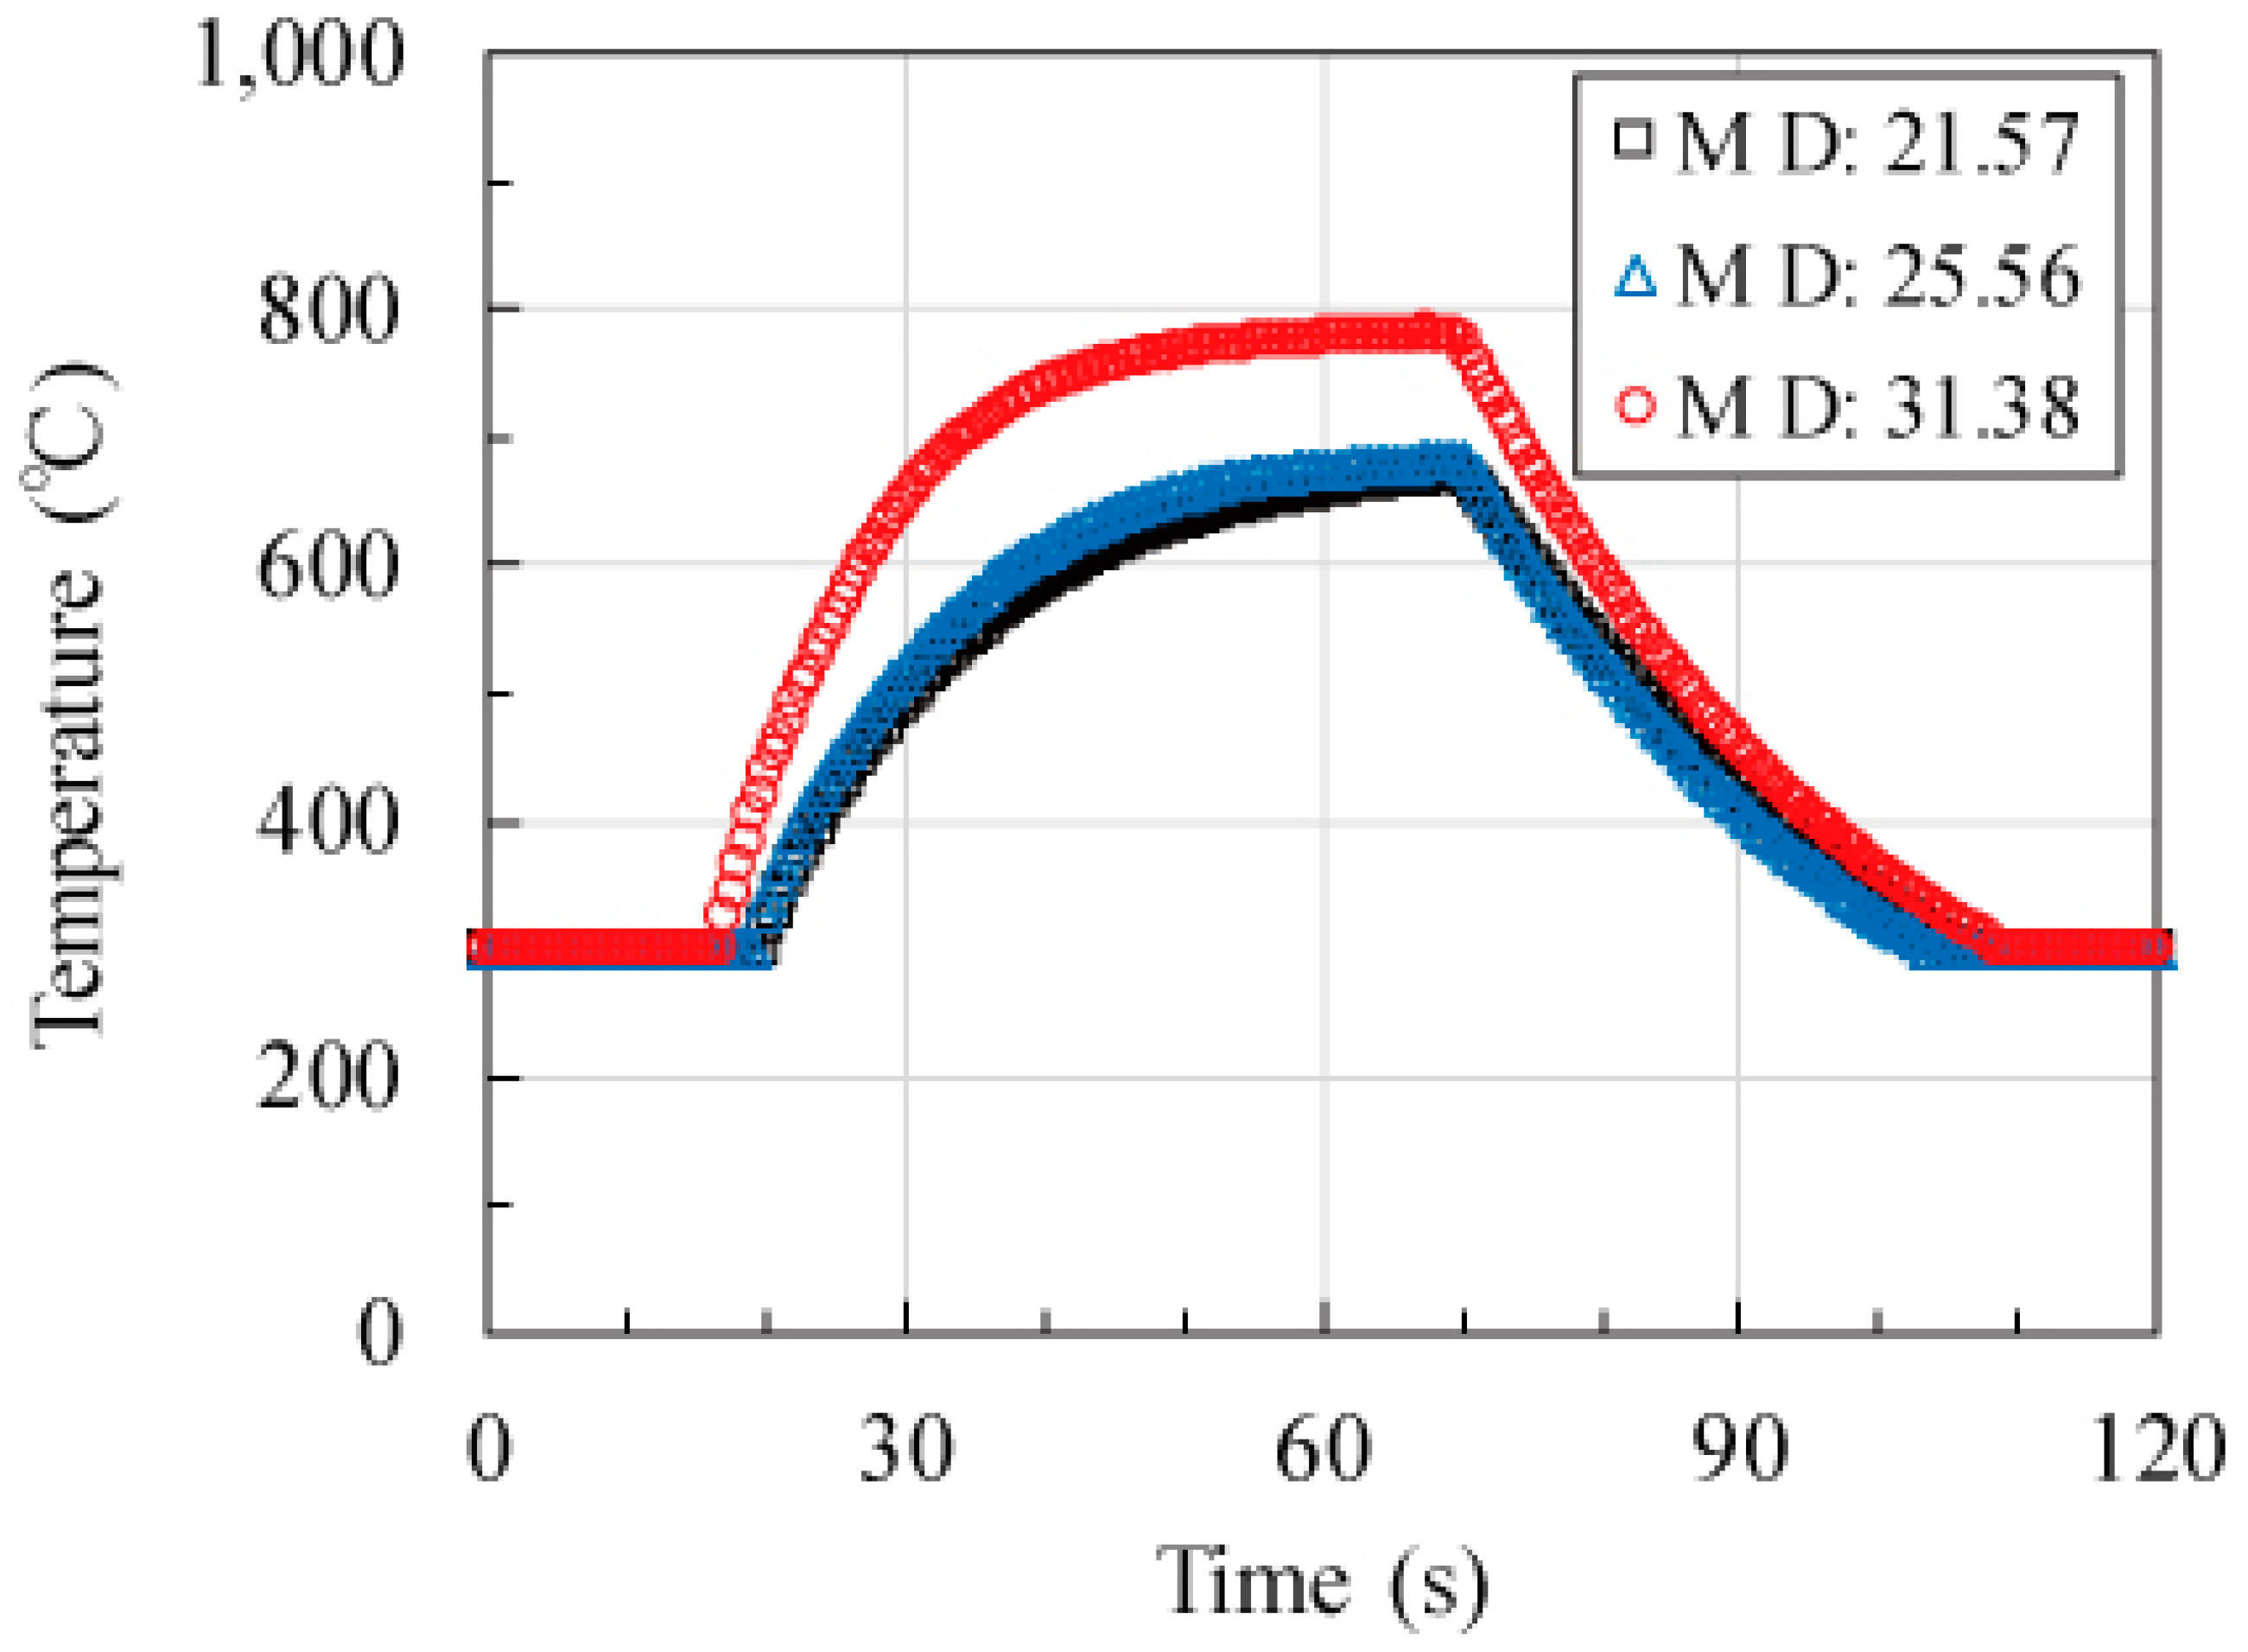
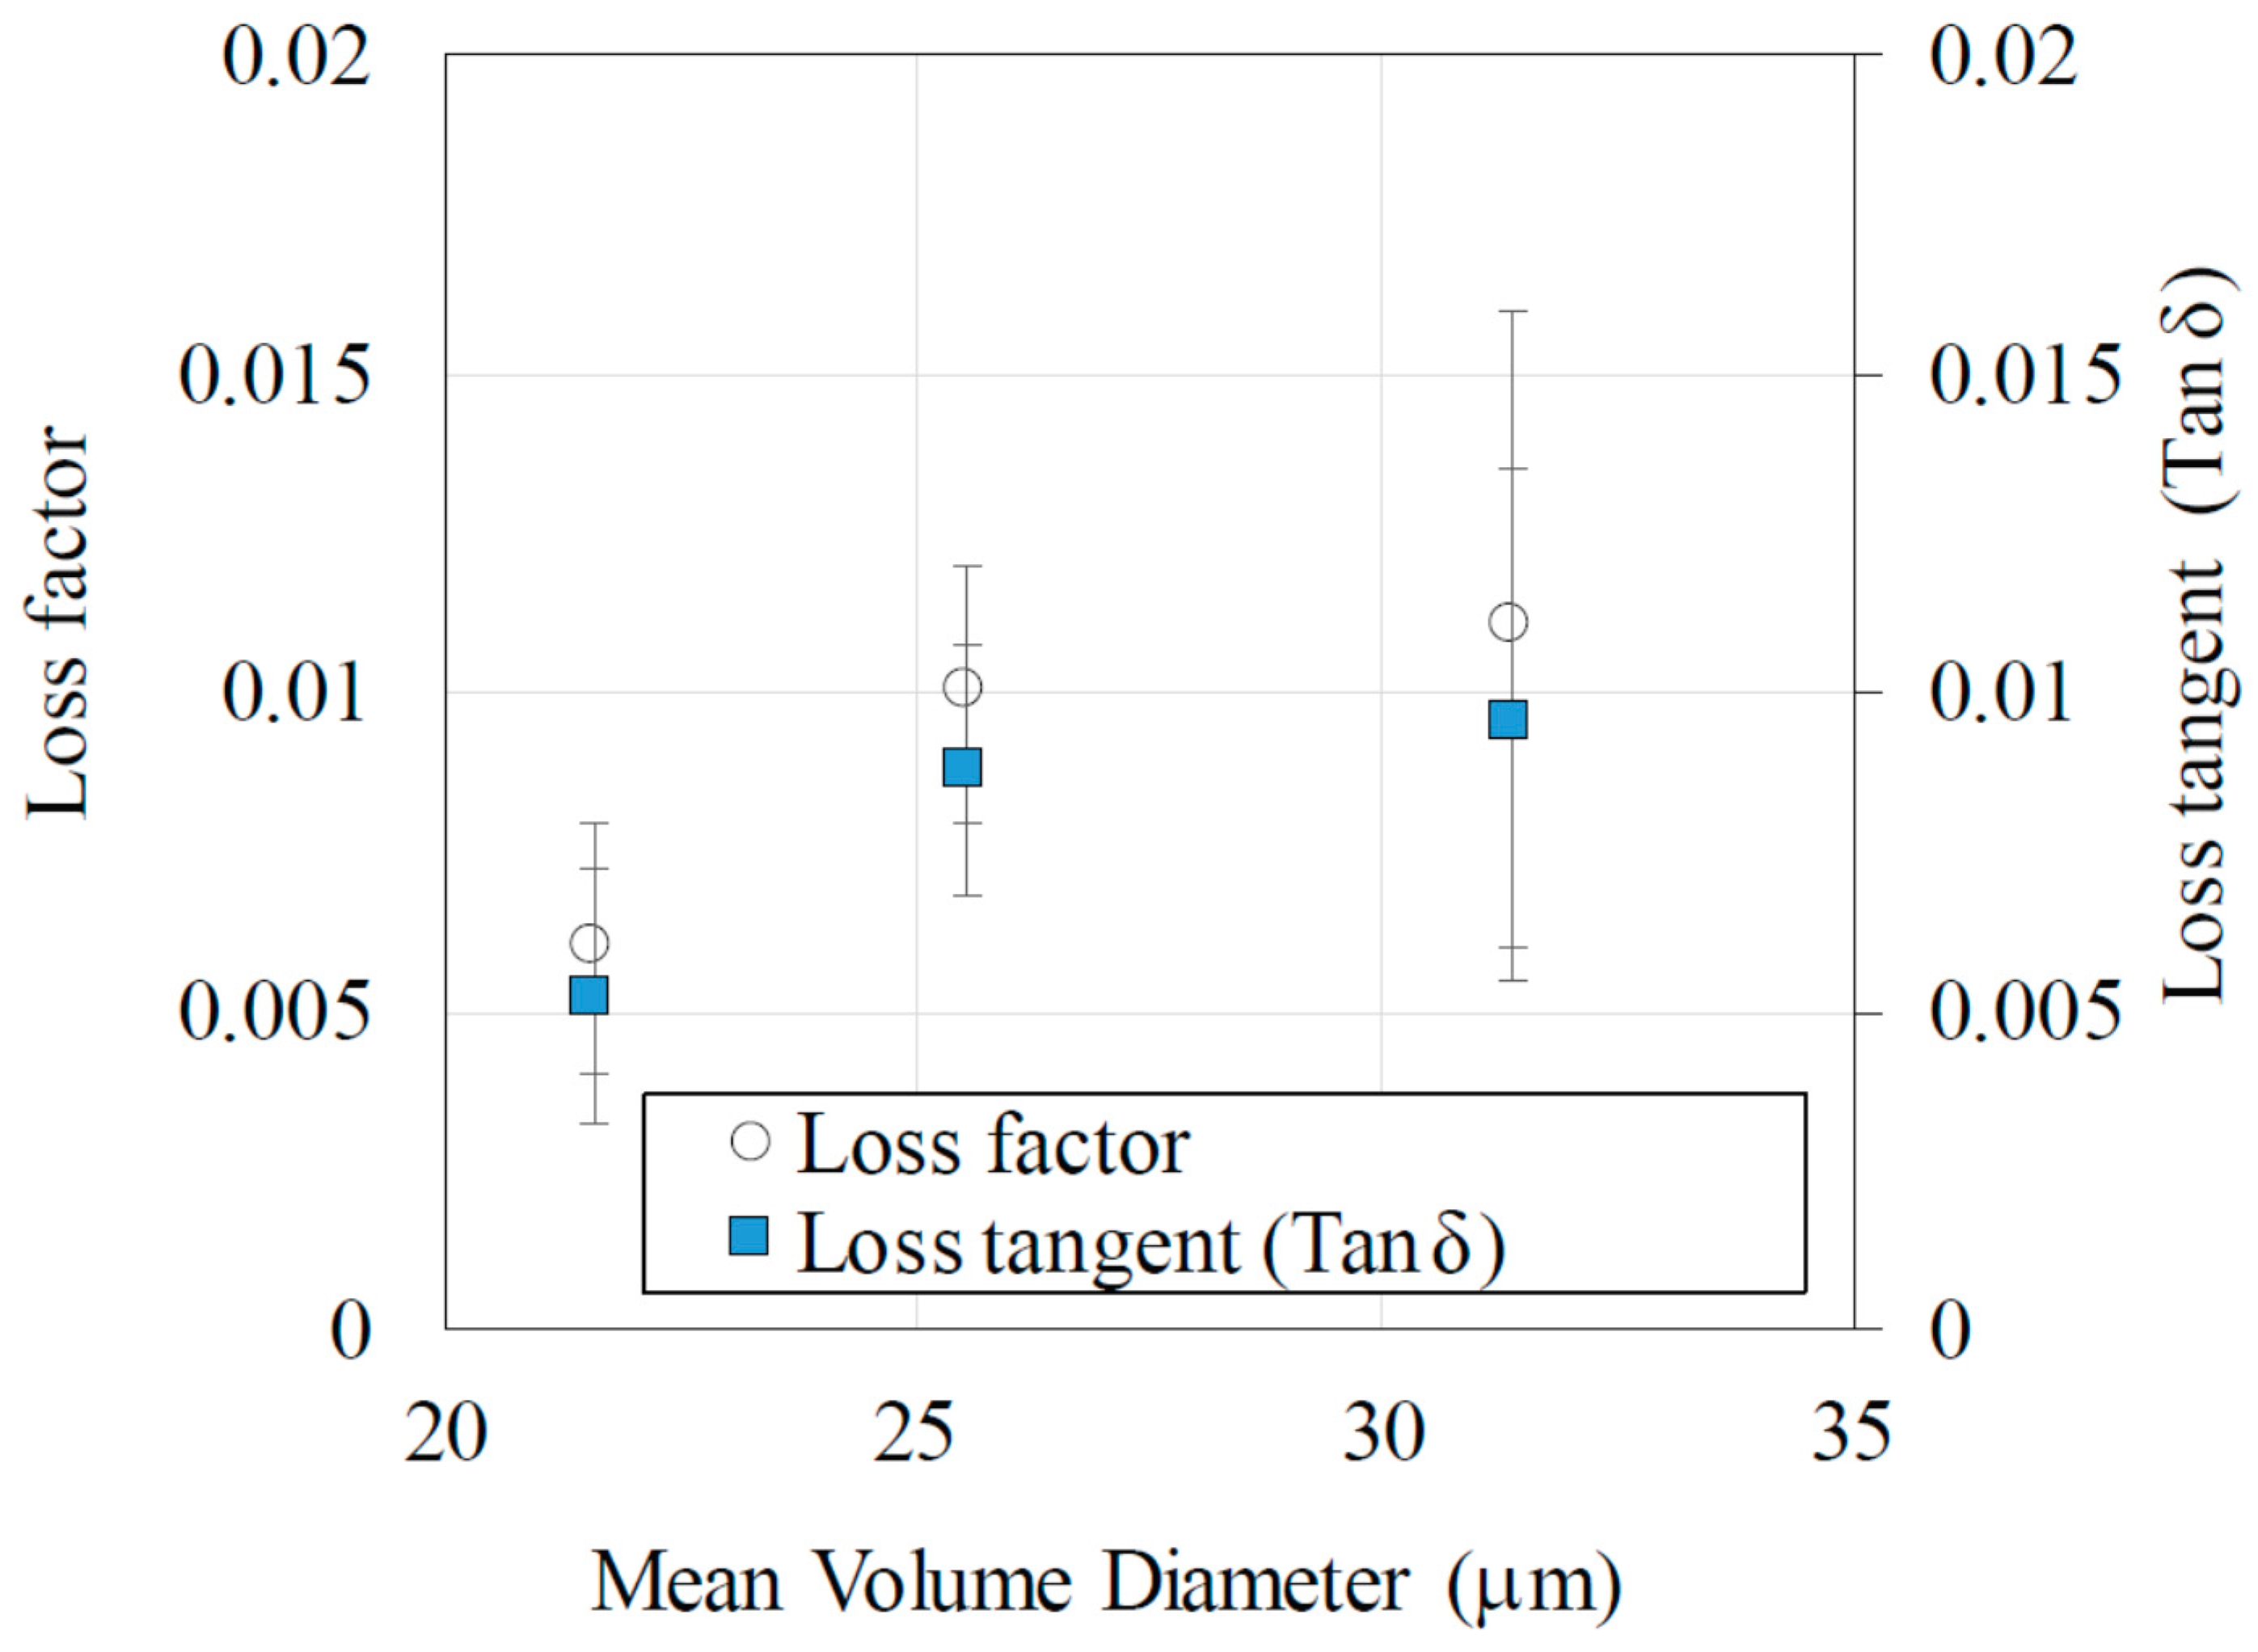
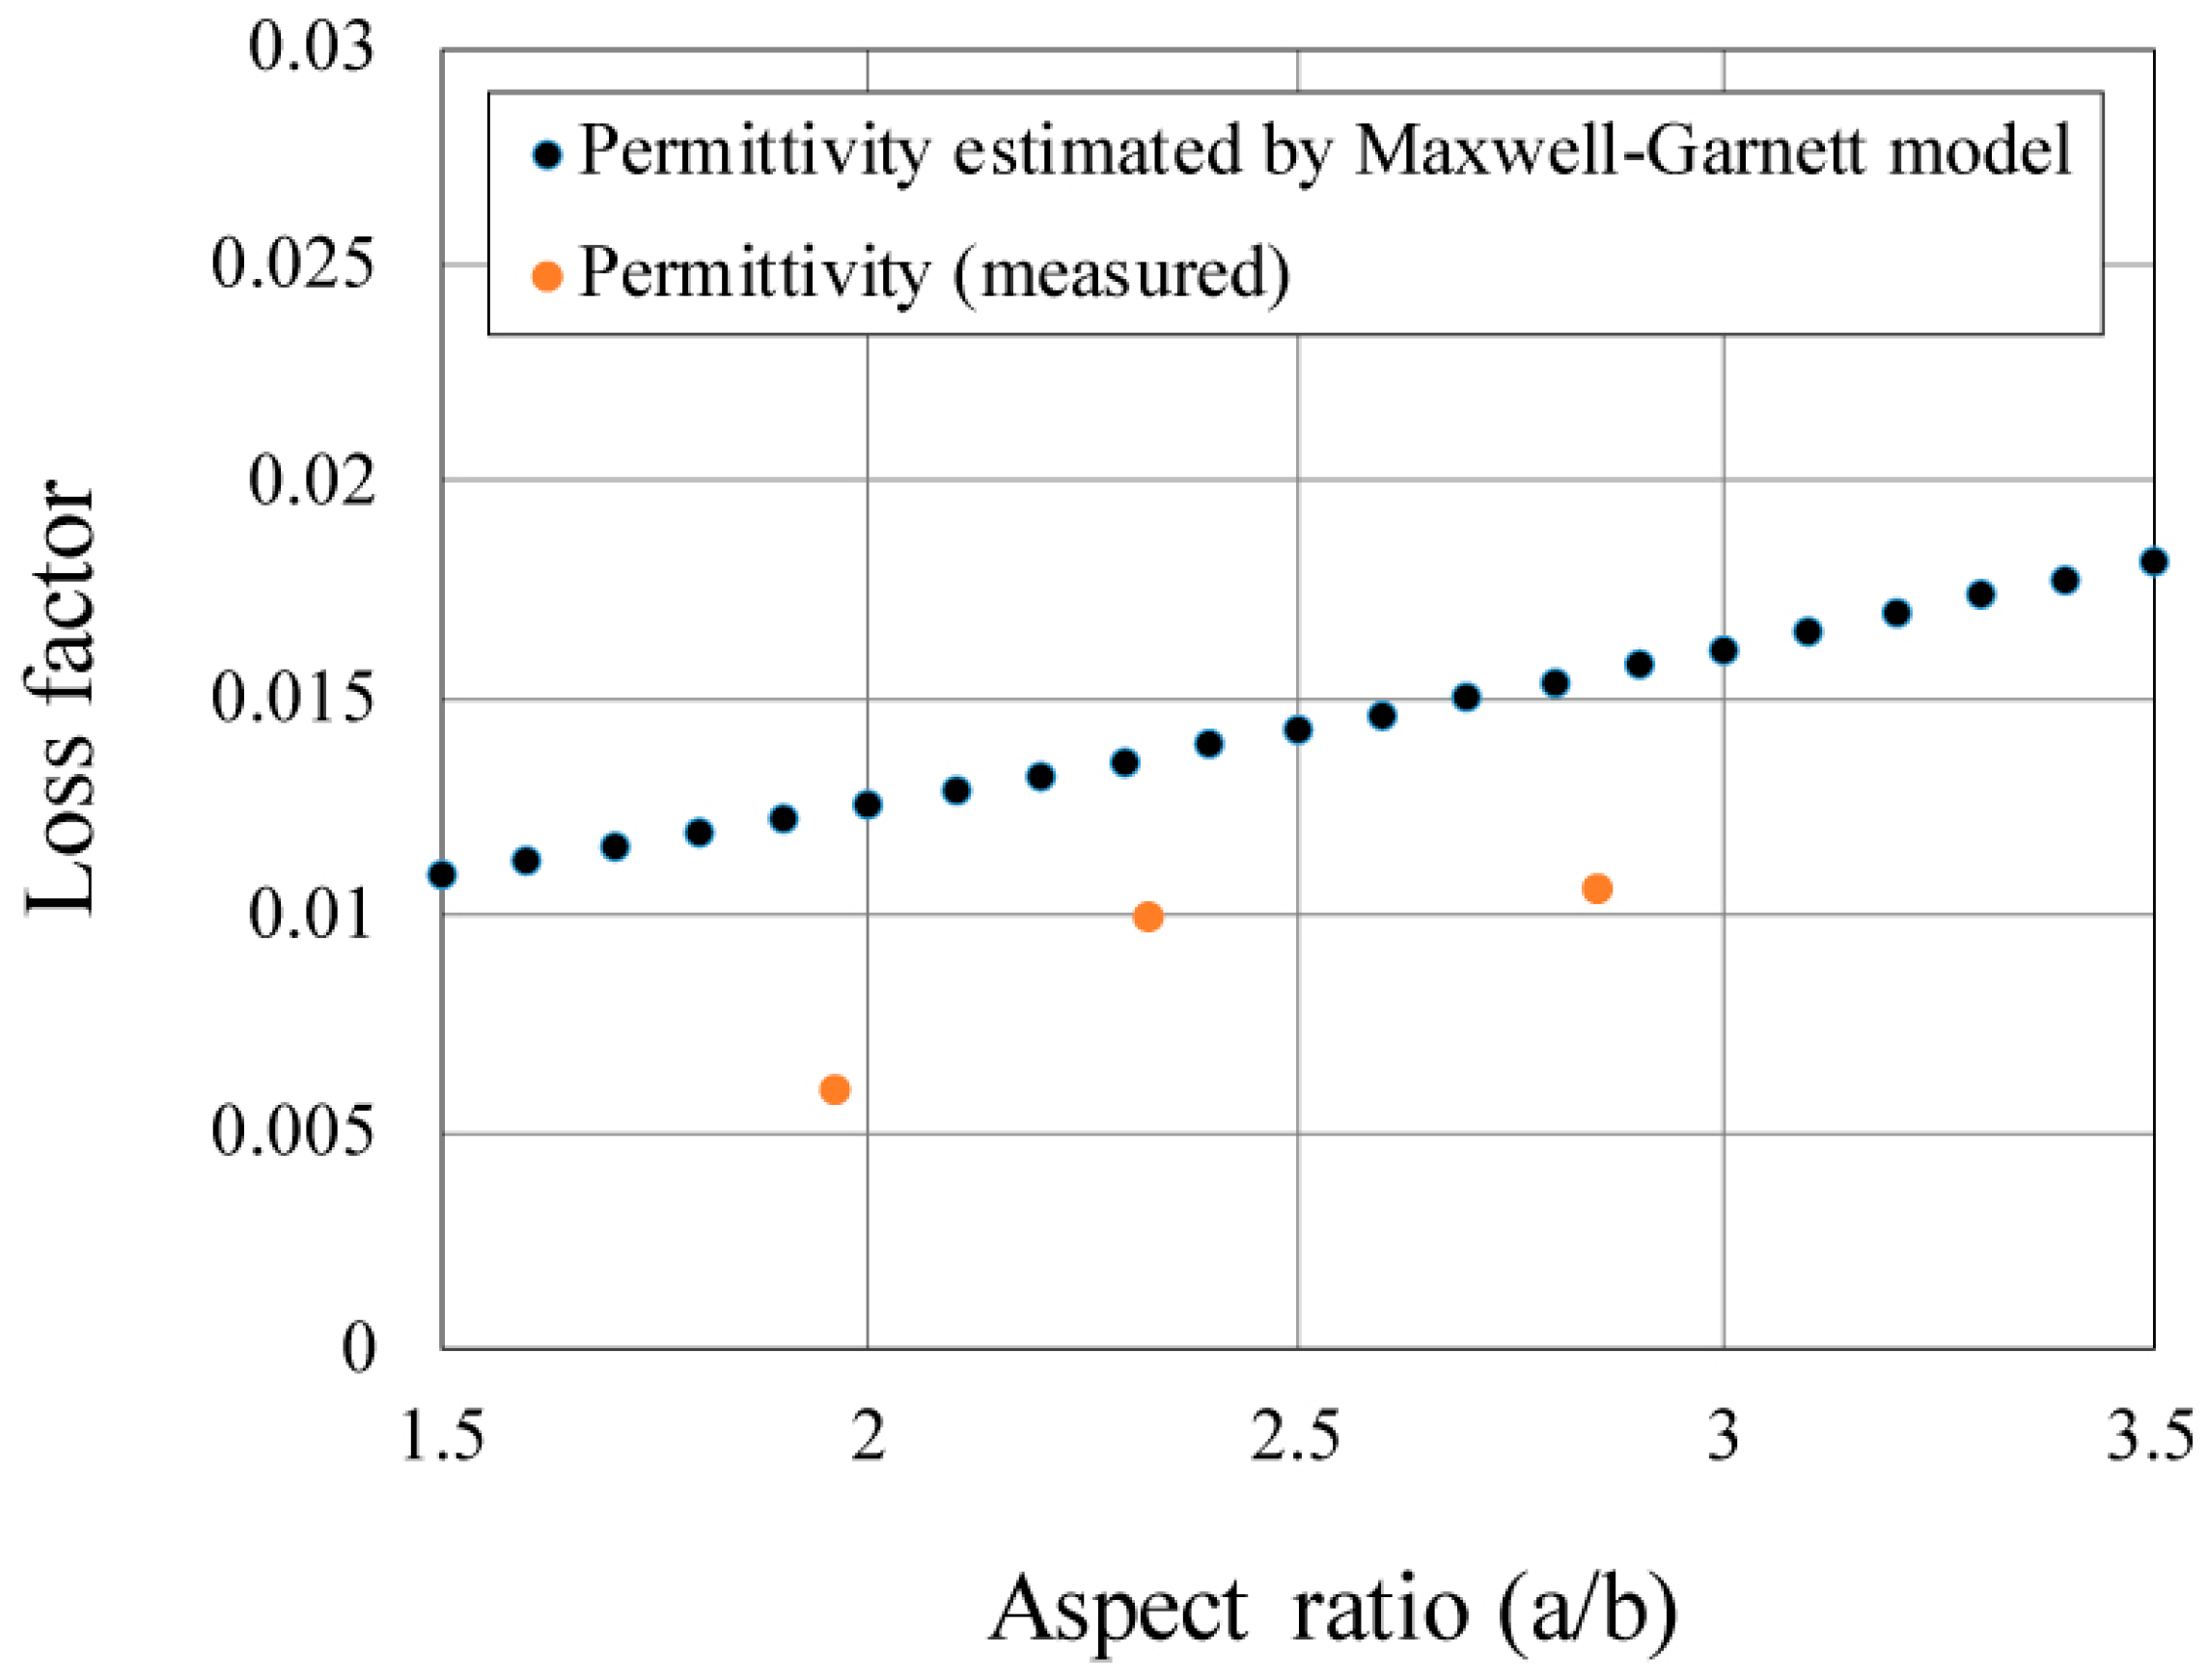
2.2. Experiments
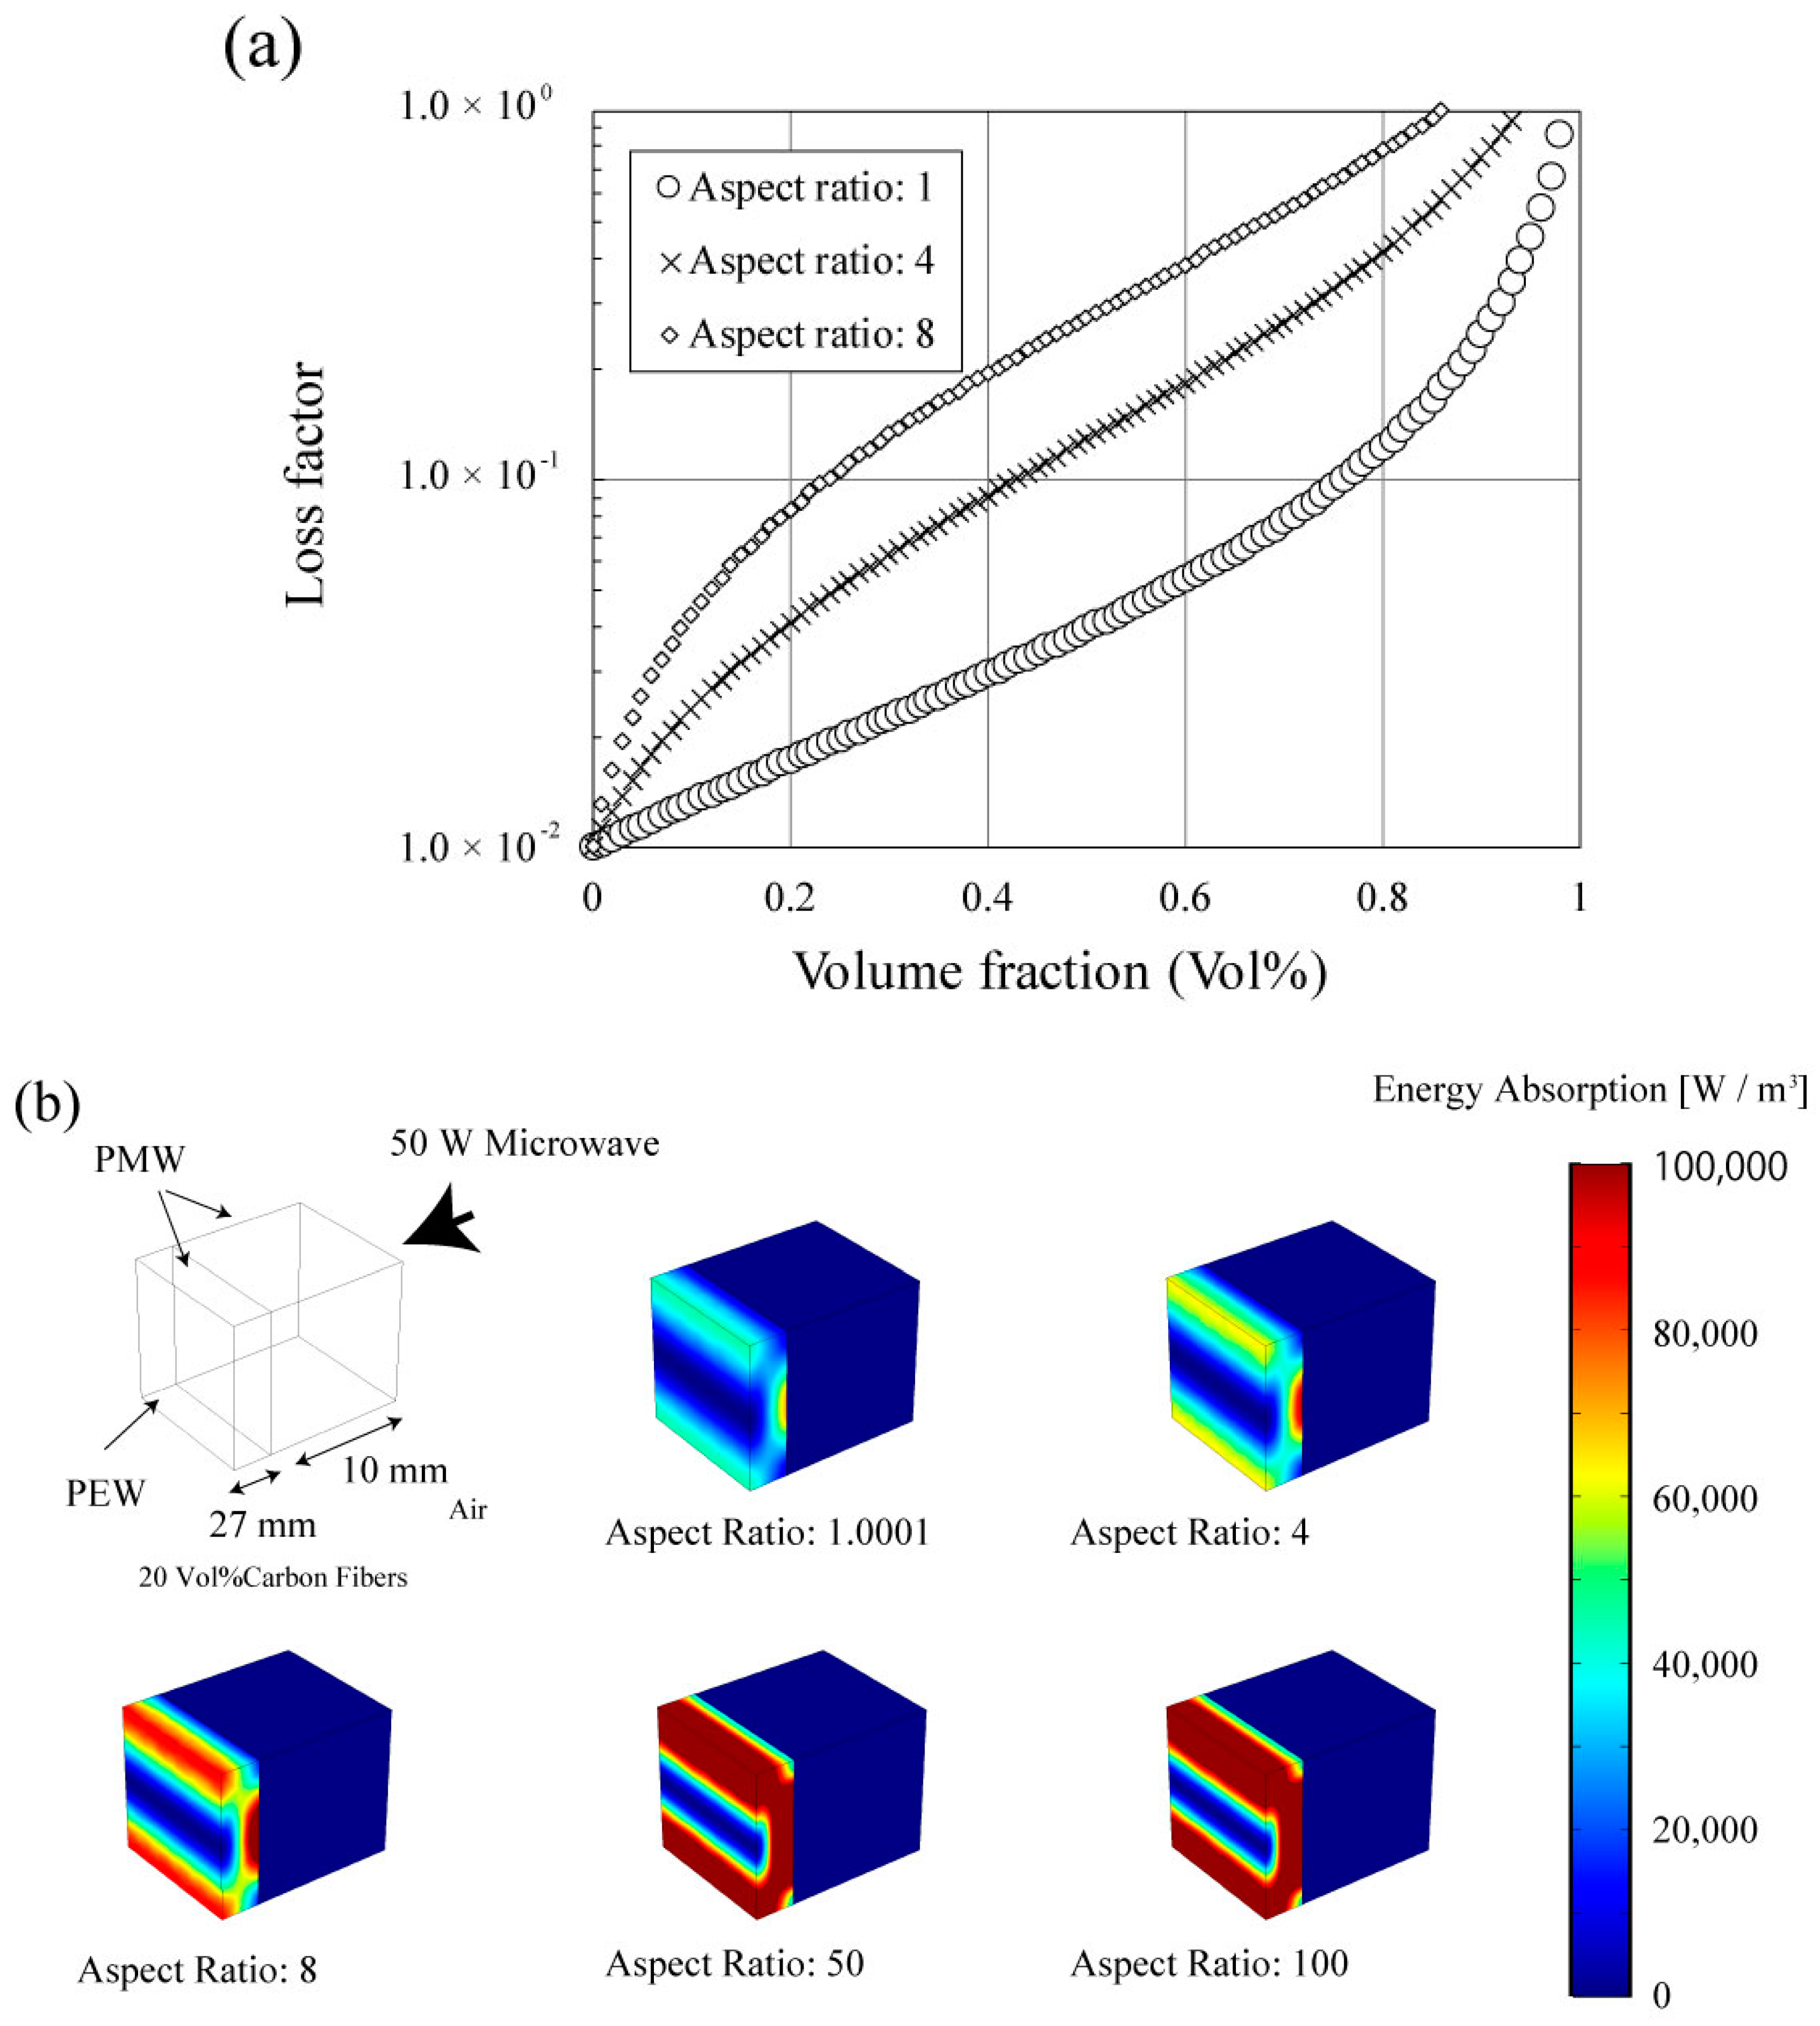
3. Discussion
4. Materials and Methods
Acknowledgments
Author Contributions
Conflicts of Interest
References
- Roy, R.; Agrawal, D.K.; Cheng, J.; Gedevanishvili, S. Unexpected sintering of powdered metals parts in microwaves. Nature 1999, 399, 664. [Google Scholar] [CrossRef]
- Ishizaki, K.; Nagata, K. Selectivity of microwave energy consumption in the reduction of Fe3O4 with carbon black in mixed powder. ISIJ Int. 2007, 47, 811–816. [Google Scholar] [CrossRef]
- Peng, Z.; Hwang, J.Y.; Andriese, M.; Bell, W.; Huang, X.; Wang, X. Numerical simulation of heat transfer during microwave heating of magnetite. ISIJ Int. 2011, 51, 884–888. [Google Scholar] [CrossRef]
- Wang, J.; Binner, J.; Vaidhyanathan, B.; Joomun, N.; Kilner, J.; Dimitrakis, G.; Cross, T.E. Evidence for the microwave effect during hybrid sintering. J. Am. Ceram. Soc. 2006, 89, 1977–1984. [Google Scholar] [CrossRef]
- Harutyunyan, A.R.; Pradhan, B.K.; Chang, J.; Chen, G.; Eklund, P.C.A. Purification of single-wall carbon nanotubes by selective microwave heating of catalyst particles. J. Phys. Chem. B 2002, 106, 8671–8675. [Google Scholar] [CrossRef]
- Yoshikawa, N.; Ishizuka, E.; Mashiko, K.; Taniguchi, S. Carbon reduction kinetics of NiO by microwave heating of the separated electric and magnetic fields. Metall. Mater. Trans. B 2007, 38, 863–868. [Google Scholar] [CrossRef]
- Fukushima, J.; Kashimura, K.; Sato, M. Chemical bond cleavage induced by electron heating: Gas emission behavior of titanium-metalloid compounds (titanium nitride and oxide) in a microwave field. Mater. Chem. Phys. 2011, 131, 178–183. [Google Scholar] [CrossRef]
- Yoshikawa, N.; Tokuyama, Y. Numerical Simulation of Temperature Distribution in Multi-Phase Materials as a Result of Selective Heating by Microwave Energy. J. Microwave Power 2009, 43, 27–33. [Google Scholar]
- Rybakov, K.I.; Semenov, V.E.; Egorov, S.V.; Eremeev, A.G.; Plotnikov, I.V.; Bykov, Y.V. Microwave heating of conductive powder materials. J. Appl. Phys. 2006, 99, 023506. [Google Scholar] [CrossRef]
- Cheng, J.; Roy, R.; Agrawal, D. Experimental proof of major role of magnetic field losses in microwave heating of metal and metallic composites. J. Mater. Sci. Lett. 2001, 20, 1561–1563. [Google Scholar] [CrossRef]
- Ma, J.; Diehl, J.F.; Johnson, E.J.; Martin, K.R.; Miskovsky, N.M.; Smith, C.T.; Weisel, G.J.; Weiss, B.L.; Zimmerman, D.T. Systematic study of microwave absorption, heating, and microstructure evolution of porous copper powder metal compacts. J. Appl. Phys. 2007, 101, 074906. [Google Scholar] [CrossRef]
- Yoshikawa, N.; Kawahira, K.; Saito, Y.; Todoroki, H.; Taniguchi, S. Estimation of microwave penetration distance and complex permittivity of graphite by measurement of permittivity and direct current conductivity of graphite powder mixtures. J. Appl. Phys. 2015, 117, 084105. [Google Scholar] [CrossRef]
- Levine, H.B.; McQuarrie, D.A. Dielectric constant of simple gases. J. Chem. Phys. 1968, 49, 4181–4187. [Google Scholar] [CrossRef]
- Jayasundere, N.; Smith, B.V. Dielectric constant for binary piezoelectric 0–3 composites. J. Appl. Phys. 1993, 73, 2462–2466. [Google Scholar] [CrossRef]
- Okamoto, T.; Kajiwara, K. Plasmonics; Koudansya: Tokyo, Japan, 2010; pp. 78–83. ISBN 978-4-06-153270-0. (In Japanese) [Google Scholar]
- Asano, S.; Yamamoto, G. Light scattering by a spheroidal particle. Appl. Opt. 1975, 14, 29–49. [Google Scholar] [CrossRef] [PubMed]
- Sihvola, A.H.; Alanen, E. Studies of mixing formulae in the complex plane. IEEE Trans. Geosci. Remote Sens. 1991, 29, 679–687. [Google Scholar] [CrossRef]
- Wang, Z.; Nelson, J.K.; Miao, J.; Linhardt, R.J.; Schadler, L.S.; Hillborg, H.; Zhao, S. Effect of high aspect ratio filler on dielectric properties of polymer composites: A study on barium titanate fibers and graphene platelets. IEEE Trans. Dielectr. Electr. Insul. 2012, 19, 3. [Google Scholar]
- Tang, H.; Zhou, Z.; Sodano, H.A. Relationship between BaTiO3 nanowire aspect ratio and the dielectric permittivity of nanocomposites. ACS Appl. Mater. Interfaces 2014, 6, 5450–5455. [Google Scholar] [CrossRef] [PubMed]
- Von Hippel, A.R. Dielectric Materials and Application; Artech House: Norwood, MA, USA, 1995; p. 311. [Google Scholar]
- Hotta, M.; Hayashi, M.; Lanagan, M.T.; Agrawal, D.K.; Nagata, K. Complex permittivity of graphite, carbon black and coal powders in the ranges of X-band frequencies (8.2 to 12.4 GHz) and between 1 and 10 GHz. ISIJ Int. 2011, 51, 1766–1772. [Google Scholar] [CrossRef]
- Kashimura, K.; Hasegawa, N.; Suzuki, S.; Hayashi, M.; Mitani, T.; Shinohara, N.; Nagata, K. Effects of relative density on microwave heating of various carbon powder compacts microwave-metallic multi-particle coupling using spatially separated magnetic fields. J. Appl. Phys. 2013, 113, 024902. [Google Scholar] [CrossRef]
- Roy, R.; Peelamedu, R.; Hurtt, L.; Cheng, J.; Agrawal, D. Definitive experimental evidence for microwave effects: Radically new effects of separated E and H fields, such as decrystallization of oxides in seconds. Mater. Res. Innov. 2002, 6, 128–140. [Google Scholar] [CrossRef]
- Pickles, C.A.; Mouris, J.; Hutcheon, R.M. High-temperature dielectric properties of goethite from 400 to 3000 MHz. J. Mater. Res. 2005, 20, 18–29. [Google Scholar] [CrossRef]
- Peng, Z.; Hwang, J.Y.; Mouris, J.; Hutcheon, R.; Huang, X. Microwave penetration depth in materials with non-zero magnetic susceptibility. ISIJ Int. 2010, 50, 1590–1596. [Google Scholar] [CrossRef]


© 2018 by the authors. Licensee MDPI, Basel, Switzerland. This article is an open access article distributed under the terms and conditions of the Creative Commons Attribution (CC BY) license (http://creativecommons.org/licenses/by/4.0/).
Share and Cite
Fukushima, J.; Tsubaki, S.; Matsuzawa, T.; Kashimura, K.; Mitani, T.; Namioka, T.; Fujii, S.; Shinohara, N.; Takizawa, H.; Wada, Y. Effect of Aspect Ratio on the Permittivity of Graphite Fiber in Microwave Heating. Materials 2018, 11, 169. https://doi.org/10.3390/ma11010169
Fukushima J, Tsubaki S, Matsuzawa T, Kashimura K, Mitani T, Namioka T, Fujii S, Shinohara N, Takizawa H, Wada Y. Effect of Aspect Ratio on the Permittivity of Graphite Fiber in Microwave Heating. Materials. 2018; 11(1):169. https://doi.org/10.3390/ma11010169
Chicago/Turabian StyleFukushima, Jun, Shuntaro Tsubaki, Tomoki Matsuzawa, Keiichiro Kashimura, Tomohiko Mitani, Tomoaki Namioka, Satoshi Fujii, Naoki Shinohara, Hirotsugu Takizawa, and Yuji Wada. 2018. "Effect of Aspect Ratio on the Permittivity of Graphite Fiber in Microwave Heating" Materials 11, no. 1: 169. https://doi.org/10.3390/ma11010169