On the Alloying and Properties of Tetragonal Nb5Si3 in Nb-Silicide Based Alloys


Department of Materials Science and Engineering, University of Sheffield, Sheffield S1 3JD, UK
Materials 2018, 11(1), 69; https://doi.org/10.3390/ma11010069
Submission received: 1 December 2017
/
Revised: 21 December 2017
/
Accepted: 22 December 2017
/
Published: 4 January 2018
Abstract
:The alloying of Nb5Si3 modifies its properties. Actual compositions of (Nb,TM)5X3 silicides in developmental alloys, where X = Al + B + Ge + Si + Sn and TM is a transition and/or refractory metal, were used to calculate the composition weighted differences in electronegativity (Δχ) and an average valence electron concentration (VEC) and the solubility range of X to study the alloying and properties of the silicide. The calculations gave 4.11 < VEC < 4.45, 0.103 < Δχ < 0.415 and 33.6 < X < 41.6 at.%. In the silicide in Nb-24Ti-18Si-5Al-5Cr alloys with single addition of 5 at.% B, Ge, Hf, Mo, Sn and Ta, the solubility range of X decreased compared with the unalloyed Nb5Si3 or exceeded 40.5 at.% when B was with Hf or Mo or Sn and the Δχ decreased with increasing X. The Ge concentration increased with increasing Ti and the Hf concentration increased and decreased with increasing Ti or Nb respectively. The B and Sn concentrations respectively decreased and increased with increasing Ti and also depended on other additions in the silicide. The concentration of Sn was related to VEC and the concentrations of B and Ge were related to Δχ. The alloying of Nb5Si3 was demonstrated in Δχ versus VEC maps. Effects of alloying on the coefficient of thermal expansion (CTE) anisotropy, Young’s modulus, hardness and creep data were discussed. Compared with the hardness of binary Nb5Si3 (1360 HV), the hardness increased in silicides with Ge and dropped below 1360 HV when Al, B and Sn were present without Ge. The Al effect on hardness depended on other elements substituting Si. Sn reduced the hardness. Ti or Hf reduced the hardness more than Cr in Nb5Si3 without Ge. The (Nb,Hf)5(Si,Al)3 had the lowest hardness. VEC differentiated the effects of additions on the hardness of Nb5Si3 alloyed with Ge. Deterioration of the creep of alloyed Nb5Si3 was accompanied by decrease of VEC and increase or decrease of Δχ depending on alloying addition(s).
1. Introduction
Performance and environmental targets for future aero-engines could be met with changes in the propulsive and thermal efficiency of the engines and new materials that have capabilities beyond those of Ni-based superalloys. Industry has set the following property goals for new ultra-high temperature alloys with capabilities beyond those of Ni-based superalloys: the room temperature fracture toughness must be above 20 MPa(m)1/2, there must be less than 1% creep in 125 h at 1473 K and σ > 170 MPa (alloy density ρ = 7 g/cm3) and the oxidation life at 1588 K must be equal to that of second generation single crystal Ni-based superalloys at 1423 K, with a short term oxidation goal to have sufficient oxidation resistance in the uncoated condition to survive under typical engine conditions, which requires a loss of material less than 200 μm thickness in 10 h at 1643 K and a long term oxidation goal that requires a loss of material less than 25 μm thickness in 100 h at 1588 K [1].
Refractory metal intermetallic composites (RMICs) have the potential to offer a balance of properties required in critical applications in future aero-engines. RMICs can be in situ composites. Composite microstructures can be formed in situ with TM5Si3 (TM = transition and refractory metal) silicides. Interest in the TM5Si3 silicides for structural materials is justified because of their high temperature strength and creep properties, their high melting points, which are in excess of 2273 K and their solubility ranges [2], which make alloying with different elements possible. The 5-3 silicides of the transition metals of groups IV to VI have the D88 (hP16, Mn5Si3 prototype), D8l (tI32, Cr5B3 prototype), or D8m (tI32, W5Si3 prototype) structure types. These three structures have different numbers of non-equivalent sites (three for D88 and four for D8l and D8m). The 5-3 silicides of the group IV elements (Ti, Zr, Hf) have the D88 structure. Those of the group V elements Nb and Ta have the D8m structure at high temperature and the D8l structure at low temperature. Vanadium and the group VI elements Cr, Mo and W have the D8m structure.
The motivation for pursuing in situ compositing is the poor toughness of the 5-3 silicide(s) at room temperature and the fact that with 5-3 silicides there are broad alloying opportunities that can lead to suppression of other silicide(s) and the formation of eutectics between 5-3 silicides and refractory metal solid solution(s) [3,4,5,6]. The properties of 5-3 silicides depend on alloying. For example, the coefficient of thermal expansion (CTE) of 5-3 silicides, including Nb5Si3, can be anisotropic and the CTE anisotropy is changed by alloying. Control of the CTE anisotropy of TM5Si3 silicides via alloying is important because CTE anisotropy is expected to have a negative effect on the processing of the alloys and a negative effect on the life of components, owing to the residual micro-stresses at grain boundaries at temperatures below the ductile to brittle transition temperature [7].
The ratio (CTEc)/(CTEa) of the coefficients of thermal expansion along the c and a axes of different 5-3 silicides is used to show their CTE anisotropy. This ratio is given in the Table 1 for different 5-3 silicides. The different experimental data for the CTE anisotropy of Ti5Si3, Mo5Si3, Zr5Si3 and αNb5Si3 could be attributed to the difficulties in making arc melted alloys with homogeneous microstructures [20]. Alloying the Ti5Si3 with Nb or Ta or Ge did not change the CTE anisotropy but additions of B, Cr, Hf, V and Zr changed it to about 2 [9,10]. Alloying with B had a strong effect on the CTE anisotropy of W5Si3 (T2 phase) which was reduced to about 1.1 [13]. The data in Table 1 shows that the alloying of Nb5Si3 with Ti also changed its CTE anisotropy and that these changes are not as dramatic as those for alloyed Ti5Si3. Contamination of the 5-3 silicides by interstitials also can change their CTE anisotropy. For example, in the case of Ti5Si3 contamination by C or N changed the anisotropy ratio to about 2 but contamination by O had no effect on the CTE anisotropy [9].
Nb-silicide based alloys, which are also known as Nb-silicide in situ composites, are RMICs that can surpass the fracture toughness and creep property goals and their oxidation can be close to the oxidation goal [1,3,21]. Reductions in rotor weight of more than 20% could be realized through the substitution of Nb-silicide based aerofoils for Ni-base superalloys aerofoils in present and advanced turbine designs [1,21]. The most important phases in the microstructure of Nb-silicide based alloys are the bcc Nb solid solution(s), Nbss and the Nb5Si3 silicide. The latter can be present as the tetragonal high temperature βNb5Si3, or the tetragonal low temperature αNb5Si3 [2], or as the hexagonal γNb5Si3 silicide. The γNb5Si3 is not desirable owing to its creep properties [1]. The Nbss can be rich in Ti [4] or free of Si [22]. Other phases also can be stable in Nb-silicide based alloys, for example the C14-NbCr2 Laves and A15-Nb3X (X = Al, Ge, Si, Sn) phases and the tetragonal Nb3Si [1,3,21]. The Laves phase can be stable in Cr rich alloys and is considered to improve oxidation resistance. The A15 Nb3X phase(s) also can be stable in the microstructure depending on concentration(s) of element(s) X and can form during oxidation. The tetragonal Nb3Si can be stable or transform to the low temperature αNb5Si3 via the eutectoid reaction Nb3Si → Nb + αNb5Si3 [2,4,5,23,24,25,26,27,28,29,30].
The Nbss is the key phase for meeting the fracture toughness property goal but has a negative effect on creep and oxidation when present at a high volume fraction. The toughness of the Nb-0.8Si and (Nb,Ti,Cr,Hf,Si,Ge) solid solutions was reported as 17.7 MPa(m)1/2 and ≥28.7 MPa(m)1/2 respectively [31,32], more than five and nine times the toughness of unalloyed Nb5Si3, which is about 3 MPa(m)1/2 [21]. The Nb5Si3 is the key phase for meeting the creep goal but high volume fractions of the silicide decrease the toughness of the in situ composites. The creep exponent of Nb (≈6) [21] is six times that of Nb5Si3 (≈1) [33]. The low fracture toughness of tetragonal Nb5Si3 is similar to that of Mo5Si3 (2–2.5 MPa(m)1/2, [34]) and Ti5Si3 (2.1 MPa(m)1/2 [35] and 2.6 MPa(m)1/2 [36]). Alloying improved the toughness of Nb5Si3, which was reported to be 7 MPa(m)1/2 and 13 MPa(m)1/2 respectively for the (Nb,Ti,Hf,Cr,Fe)5(Si,Ge,Al,Sn)3 and (Nb,Ti,Hf,Cr)5(Si,Ge)3 silicides [32]. The compressive fracture strength of Nb5Si3 was reported to be 670 MPa at 1773 K [31]. The compressive creep rate of arc melted αNb5Si3 at 1473 K and 69 MPa was 2.23 × 10⁻⁹ s−1 [33] compared with 4 × 10⁻⁸ s−1 of arc melted tetragonal D8m (tI32, W5Si3-type) Mo5Si3 [37] and 2 × 10⁻⁵ s−1 of hexagonal D88 (hP16, Mn5Si3-type) Ti5Si3 [38].
Table 1 gives available data for the CTE anisotropy of binary (unalloyed) and ternary 5-3 silicides. Data for creep and toughness of binary 5-3 silicides was given above. Developmental Nb-silicide based alloys can have as many as twelve alloying additions, some of which substitute Nb and others Si in Nb5Si3. For example, refractory metals provide solid solution strengthening to the Nbss and improve its high temperature strength and simple metal and metalloid element additions improve oxidation. The following composition (at.%) [40.7Nb-12.8Ti-4.7Mo-1.3W-1.5Hf-2.7Cr]-(20.8Si-5.9Ge-4.6Al-5Sn) is an example of a real tetragonal Nb5Si3 silicide in a developmental Nb-silicide based alloy, where in parentheses are the elements that substitute Si and in square brackets the elements that substitute Nb. There are four sub-lattices in αNb5Si3 (tI32 (D8l), Cr5B3-type) and it is not known which lattice positions are occupied by the different elements.
Data about the alloying and properties of Nb5Si3 is missing in the literature, yet it is crucial for the design of new Nb-silicide based alloys. The motivation for the research presented in this paper was to study the alloying behaviour and properties of Nb5Si3. The alloying and properties of C14-NbCr2 and A15-Nb3X phases that are stable in Nb-silicide based alloys will be the subject of another paper.
Recently, it was shown that the alloying of the Nbss in Nb-silicide based alloys depends on composition weighted differences in electronegativity (Δχ) and an average valence electron concentration (VEC) [22]. Phase stability can be considered in terms of e/a (an averaged valence of alloying elements in an alloy) and VEC (number of valence electrons per atom filled into the valence band). The former is the parameter in the Hume-Rothery rules and the latter is key to determining the Fermi level in the valence band. The choice between e/a and VEC depends on the stability mechanism involved [39]. According to Mizutani et al. [39,40], the e/a is difficult to use as a universal parameter in alloy design because its value cannot be uniquely assigned to a transition metal as it depends on the surrounding environment (the alloying elements in synergy). Instead, VEC is a more important parameter in transition metal alloys.
In this work, the silicide parameters VEC and Δχ were used to study the alloying and properties of tetragonal Nb5Si3. One objective was to find out if there are relationships between solvent and solute additions and between the latter and the silicide parameters VEC and Δχ. Another objective was to find out whether changes in properties of tetragonal Nb5Si3 are related to changes of the silicide parameters VEC and Δχ.
The structure of the paper is as follows. The effects of alloying on the solubility range of X in (Nb,TM)5X3 where X = Al + B + Ge + Si + Sn and TM is a transition and/or refractory metal are discussed first, followed by relationships between solutes and their concentrations in Nb5Si3 and the silicide parameters VEC and Δχ and how alloying influences the hardness of tetragonal Nb5Si3. The latter is discussed further with the help of the silicide parameter VEC using silicides alloyed with Ge as an example. Finally, the alloying and creep of Nb5Si3 is discussed with the help of Δχ versus VEC maps.
2. Methodology, Results and Discussion
Available experimental data for tetragonal Nb5Si3 silicides in developmental Nb-silicide based alloys was used to seek out relationships between the silicide parameters Δχ and VEC, the hardness of tetragonal Nb5Si3 and changes of the creep of Nb5Si3 with alloying. For these tasks, it is necessary to know the actual compositions of the Nb5Si3 silicides in studied alloys [4,5,6,30,41,42,43,44,45,46,47,48] in order to calculate the silicide parameters VEC and Δχ. All the tetragonal Nb5Si3 silicides studied in this paper were in developmental Nb-silicide based alloys that had been prepared using the same method of arc melting with non-consumable tungsten electrode in an inert atmosphere with water cooled copper crucibles. The phases (Nbss, Nb5Si3 and others, see introduction) in the cast and heat treated microstructures were identified using XRD (Hiltonbrooks Ltd., Crewe, UK) and JCPDS data (International centre for diffraction data) and quantitative microanalysis [4,5,6,30,41,42,43,44,45,46,47,48]. For the latter, electron probe micro-analysis (EPMA) was used in a JEOL 8600 EPMA (JEOL Ltd., Tokyo, Japan) equipped with energy-dispersive and wavelength-dispersive spectrometers. Standards of high purity elements of Nb, Si and other alloying additions (Al, B, Cr, Ge, Hf, Mo, Si, Sn, Ta, Ti), which had been polished to a finish of 1μm, were used. The operational software was the Oxford Link INCA software (Oxford Instruments plc, Abingdon, UK) that includes the XPP corrections method (matrix correction algorithm to convert k-ratios to element concentrations), which is based on the Rhi-Rho-Z approach. At least 10 analyses for each phase or area of the ingot were performed. The hardness of Nb5Si3 in the alloys was measured using a Mitutoyo micro-hardness testing machine (Mitutoyo America, Aurora, IL, USA). The load used was 0.1 kg and was applied for 20 s. At least 10 measurements were taken for each phase. The hardness measurements were taken from silicides in bulk microstructures free of contamination by interstitials and with similar grain sizes. The data for the compressive creep of Nb5Si3 was from the references [33,49], where the experimental details for the creep experiments were given. No new experimental data were created during the course of this study.
The parameter VEC was calculated using [VEC]intermetallic = ∑inCi(VEC)i, where Ci and (VEC)i respectively are the concentration (at.%) and VEC of element i in the silicide. For the Nb5Si3 silicide [Δχ]silicide = ∑imci(χ<Nb>i) − ∑iz < κi(χ<Si>i), where ci and χ<Nb>i respectively are the concentration (at.%) and Pauling electronegativity of Nb and element i substituting Nb in the silicide and κi and χ<Si>i respectively are the concentration (at.%) and Pauling electronegativity of Si and element i substituting Si in the silicide. Data for electronegativity and VEC was from the same sources as in [22].
The unalloyed (binary) tetragonal αNb5Si3 and the B containing tetragonal Nb5Si3 are also known as the T1 and T2 silicides respectively and both have the Cr5B3 as their prototype. In Nb-silicide based alloys, the Nb in Nb5Si3 can be substituted by other transition and/or refractory metals, e.g., Cr, Hf, Mo, Ta, Ti, W and the Si by other simple metals and metalloids, e.g., Al, B, Ge and Sn [4,5,6,30,41,42,43,44,45,46,47,48]. The solubilities of most of these elements depend on other alloying additions, in particular Ti. An objective of this work was to find out if solvent and solute concentrations in the Nb5Si3 are related and whether the concentrations of solute additions in the silicide depend on the parameters VEC and Δχ. The alloying of Nb5Si3 can stabilise the high temperature tetragonal βNb5Si3 and/or the low temperature tetragonal αNb5Si3 and/or the hexagonal γNb5Si3 in the microstructure of Nb-silicide based alloys and can change the mechanical properties and oxidation of these silicides. Another objective of this work was to find out how properties of tetragonal Nb5Si3 are associated with changes of the parameters VEC and Δχ.
In Ti containing Nb-silicide based alloys, Ti rich Nb5Si3 can form in the cast microstructure owing to the partitioning behaviour of Ti [4,22]. The Ti rich Nb5Si3 tends to persist in the microstructure after heat treatment. In the SEM and EPMA the Ti rich Nb5Si3 is recognised by its different contrast in the microstructure under back scatter electron imaging conditions [4].
First it will be shown that the available microanalysis data can be used to find out how the solubilities of elements that substitute Nb and Si in Nb5Si3 are related. The actual chemical composition data for Nb5Si3 in Nb-silicide based alloys [4,5,23,24,25,26,27,28,29,30,41,42,43,44,45,46,47,48] showed that the solubilities of the elements that substitute Nb in tetragonal Nb5Si3 are Cr ≤ 2.9 at.%, Hf ≤ 10.6 at.%, Mo ≤ 1.9 at.%, Ta ≤ 6.3 at.%, Ti ≤ 32.8 at.% and W ≤ 1.9 at.% and that the solubility range of Ti in Nb5Si3 depends on the concentration of Ti in the alloy. For KZ5 type alloys [4], i.e., for alloys where other transition metals and simple metals and metalloid elements are added to the nominal composition Nb-24Ti-18Si-5Al-5Cr (at.%), which is the composition of the alloy KZ5, the Ti solubility range is 17.1 < Ti < 24.2 at.% and 22.2 < Ti < 32.8 at.% for normal and Ti rich Nb5Si3 respectively.
The actual chemical composition data for Nb5Si3 in Nb-silicide based alloys [4,5,23,24,25,26,27,28,29,30,41,42,43,44,45,46,47,48] showed that the solubilities of the elements that substitute Si in Nb5Si3 in Nb-silicide based alloys are Al ≤ 5.2 at.%, B ≤ 10.4 at.%, Ge ≤ 8.4 at.% and Sn ≤ 3.8 at.% with 33.6 < X < 41.6 at.% (X = Al + B + Ge + Si + Sn), compared with 37.5 < Si < 40.5 at.% for unalloyed (binary) Nb5Si3 [2]. The value of X does not differ significantly between the normal silicide and Ti rich Nb5Si3 and is 33.9 < X < 40.9 at.% and 33.6 < X < 41.6 at.% respectively. However, the range of X values would suggest that the solubility range of tetragonal Nb5Si3 opens up, or closes down and/or shifts upon alloying, primarily towards the Nb side. These changes are accompanied by changes in the values of the parameters VEC and Δχ.
The values of the parameters VEC and Δχ of the Nb5Si3 silicide that were calculated as described above are in the ranges 4.11 < VEC < 4.45 and 0.103 < Δχ < 0.415 respectively. The silicide parameter VEC falls outside the range of VEC values of the Nbss [22]. The range of the values of the silicide parameter Δχ is wider that those of the Nbss [22] and there is a gap in silicide Δχ values in the range 0.13 < Δχ < 0.15, which falls within the 0.13 < Δχ < 0.18 gap for the Δχ of the Nbss [22]. However, in the case of the tetragonal Nb5Si3 silicide, the aforementioned gap is observed only for B containing Nb5Si3 (i.e., for alloyed T2).
Table 2 shows the solubility range of Si for binary Nb5Si3 [2] and the solubility range of X in (Nb,TM)5X3 silicides in KZ5 type alloys, where X = Al + B + Ge + Si + Sn and transition and refractory metals are represented by TM. Data for chemical compositions of alloys in Table 2 can be found in the references [4,6,41,50,51]. For each alloy in Table 2, the corresponding values of the parameters VEC and Δχ of Nb5Si3 were calculated as described above and are given for the cast and heat treated conditions. In the binary (unalloyed) Nb5Si3, the Si concentration varies from 37.5 at.%, for which Δχ = 0.288 and VEC = 4.63, to 40.5 at.% (Δχ = 0.183, VEC = 4.6). In the alloy KZ5 [4] the (Nb,Ti,Cr)5(Si,Al)3 has Al + Si in the range 35.3 < X < 36.4 at.% (X = Al + Si) and the values of the parameters change from Δχ = 0.363, VEC = 4.41 (cast) to Δχ = 0.322 and VEC = 4.42 (heat treated). With the addition of 6Ta in the alloy KZ6 [6], the (Nb,Ti,Cr,Ta)5(Si,Al)3 has Al + Si in the range 36.7 < X < 38.7 at.% and the values of the parameters change from Δχ = 0.309, VEC = 4.38 (cast) to Δχ = 0.236 and VEC = 4.41 (heat treated). With the addition of 5B the (Nb,Ti,Cr)5(Si,Al,B)3 has X = Al + B + Si in the range 36.7 < X < 39 at.% and the values of the parameters change from Δχ = 0.303, VEC = 4.27 (cast) to Δχ = 0.224 and VEC = 4.31 (heat treated).
The data in Table 2 shows that individually the transition metals Hf, Mo and Ta and the elements B, Ge and Sn (when added to the alloy KZ5) shift the solubility range X of the (Nb,TM)5X3 silicide towards Nb, with Hf and Ge having the strongest effect. Boron in synergy with Hf or Mo or Sn opens up the solubility range beyond 40.5 at.%. It should be noted that for each alloy a shift towards higher X concentrations is accompanied by a decrease in the value of Δχ. However, the change of the parameter VEC (meaning increase or decrease) depends on the alloying addition(s), for example when 5 at.% Hf is added to the alloy KZ5 the parameter VEC decreases but when 6 at.% Ta is added the parameter VEC increases.
The availability of data about the actual chemical composition of alloyed Nb5Si3 makes it possible to study the alloying of tetragonal Nb5Si3. The Si concentration in the silicide decreases with increasing Ti concentration in the silicide and the Cr and Al concentrations increase with increasing Ti concentration. Figure 1a shows that the Hf concentration in Nb5Si3 decreases linearly with increasing Nb concentration in the silicide. The linear fit of the data is better in the Hf versus Nb plot (R2 = 0.9235) compared with the Ti versus Nb plot (not shown, R2 = 0.8095) that indicates that the Hf concentration in the Nb5Si3 increases with its Ti concentration. This would suggest that the Hf concentration in the Nb5Si3 depends on both Nb and Ti in the Nb5Si3. Figure 1b shows that the concentration of Ge in Nb5Si3 increases with that of Ti. Note that in Figure 1b the data for Ge and Sn containing Nb5Si3 (darker diamonds) falls on the same line as that for Nb5Si3 in Ge containing alloys with no B and Sn. The dependence of the concentration of Sn and B on that of Ti in Nb5Si3 is shown in Figure 1c,d respectively. The different sets of data in each part are not for normal Nb5Si3 and Ti rich Nb5Si3 but for different solutes in the silicide as indicated in the figure caption. The Figure 1c,d would suggest that the solubilities of B and Sn in Nb5Si3 depend strongly on the other elements that are present in the alloy. In all parts of Figure 1 the linear fit of data, shown by the R2 values, is very good.
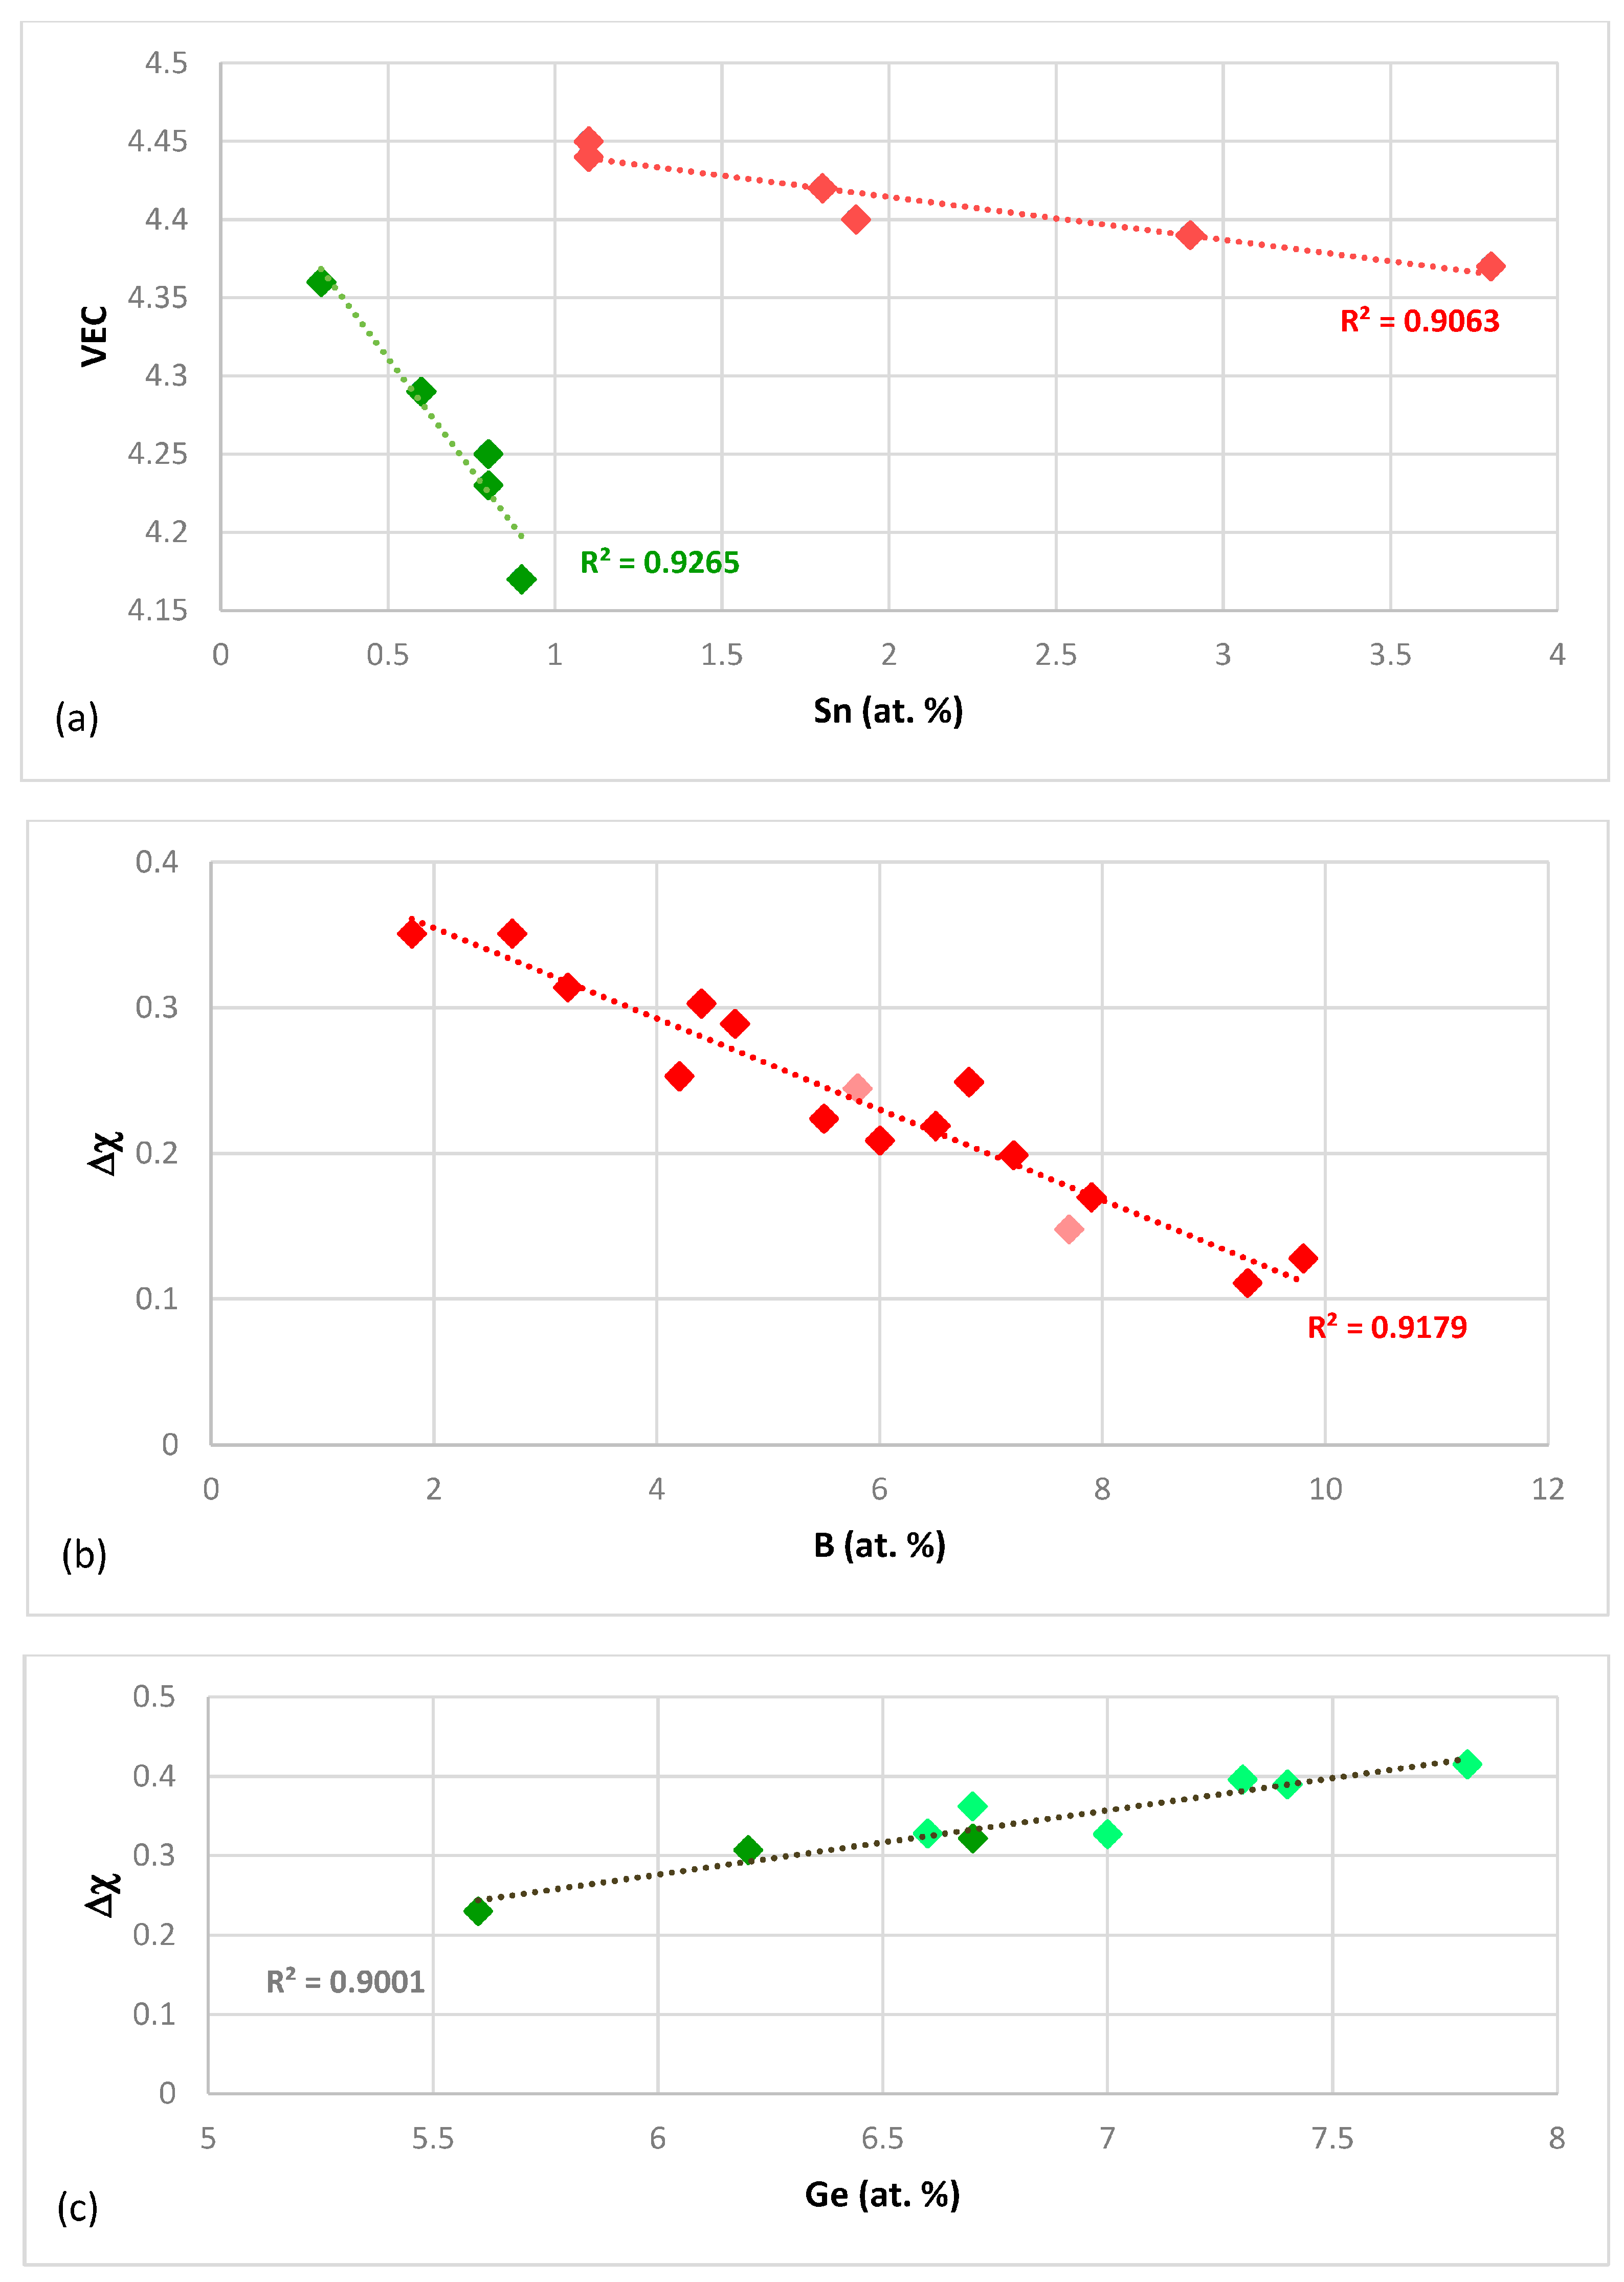
What can be learned about the alloying of Nb5Si3 from the silicide parameters VEC and Δχ? The silicide parameter VEC can separate the alloying behaviour of Hf in the normal and Ti rich Nb5Si3. The value of the silicide parameter VEC decreases with increasing Hf concentration in Nb5Si3 but there is no strong relationship (the R2 value is low). However, the silicide parameter VEC can better describe the alloying behaviour of Sn in Nb5Si3 (Figure 2a), which is shown to depend strongly on the elements that are present in the alloy (as was the case in Figure 1c), with B having a strong effect on the change of VEC with Sn concentration in the silicide, compared with that of Ge.
The silicide parameter Δχ also can separate the alloying behaviour of Hf in the normal Nb5Si3 and Ti rich Nb5Si3 but the data falls in two distinct parts with no strong relationship (the R2 value is low). When the data for Sn is considered, the silicide parameter Δχ can separate the data into two groups for B and Sn and Ge and Sn containing alloys but there is no good linear fit of the data compared with the silicide parameter VEC (Figure 2a). The silicide parameter Δχ also can describe the alloying behaviour of B in Nb5Si3 (Figure 2b) well but cannot separate the effect of transition metal addition in the alloy, which was demonstrated in Figure 1d. The parameter Δχ decreases with increasing B concentration in Nb5Si3 (Figure 2b). The alloying of Nb5Si3 with Ge also can be described well by Δχ, which increases with Ge concentration in the alloy (Figure 2c). Note that the trends in Figure 2b,c regarding the changes of the silicide parameter Δχ with B and Ge concentration in Nb5Si3 are the same with the trends in the change of the concentrations of these elements with Ti in Nb5Si3, shown in Figure 1c,d respectively. This is not the case for the silicide parameter VEC and the concentration of Sn in Nb5Si3 (Figure 1c and Figure 2a).
Links between alloying and properties will now be considered. The effects of alloying on the hardness of tetragonal Nb5Si3 are shown in Figure 3, which shows the data for the average Vickers hardness (HV) of tetragonal Nb5Si3 silicide, where Nb and Si are substituted by different elements. The data in Figure 3 shows that Ge increases significantly the hardness of Nb5Si3 compared with Sn, which hardly changes the hardness (see Figure 3a). The effect of Al on the hardness of Nb5Si3 depends on the other element that substitute Si in the silicide. Aluminium has a strong negative and positive effect when it is in synergy with Sn or Ge respectively (see Figure 3a). Comparison of the data for Nb5(Si,Ge,Al)3 with that for (Nb,Ti)5(Si,Ge,Al)3 in Figure 3a suggests that the substitution of Nb by Ti decreases the hardness of the 5-3 silicide. This cannot be confirmed for the ternary silicide, because, to the author’s knowledge, there is no experimental data available for the hardness of (Nb,Ti)5Si3.
The effect of alloying with Ti on the Young’s modulus is shown in Table 3, where data for unalloyed αNb5Si3, βNb5Si3 and alloyed α(Nb,Ti)5Si3 and β(Nb,Ti)5Si3 with 12.5 at.% Ti is given together with the Young’s moduli of other TM tetragonal 5-3 silicides. In [19,42] it was shown that (i) the βNb5Si3 has lower Young’s modulus E, shear modulus G and G/B ratio (B is the bulk modulus) compared with the αNb5Si3 and; (ii) that substitution of Nb by Ti increases and decreases the E, G and G/B respectively for the αNb5Si3 and βNb5Si3.
The effect of Ti on the hardness of (Nb,Ti)5Si3 can be deduced using data for E, G, the G/B ratio and Poisson’s ratio ν for unalloyed and Ti alloyed tetragonal Nb5Si3 silicides from [19,42] (see Table 4). The calculations showed that the hardness of βNb5Si3 is lower than that of αNb5Si3 and alloying with Ti respectively decreases and increases the hardness of these silicides. The hardness of βNb5Si3 (HV = 1286) that was calculated using data for the calculated G/B ratio is closer to the experimental value for unalloyed Nb5Si3 (HV = 1360). Table 4 also gives data for the calculated hardness of the unalloyed hexagonal Ti5Si3, which is higher than the measured hardness of unalloyed Ti5Si3 (1154 ± 55 HV [56]). The calculations indicate that alloying Nb5Si3 with Ti decreases the hardness of β(Nb,Ti)5Si3 only.
The hardness values of Nb5Si3 where Nb is substituted by Ti only and Si by Al or B or Ge or Sn are compared in Figure 3b. The data provides further support that Ti has a negative effect on the hardness and also shows that the synergy of Si, Sn and Ti has the strongest negative effect while that of Ge, Si and Ti has the weakest negative effect, compared with the data in Figure 3a, with the hardness gradually increasing as the Si is substituted by Sn, Al, B and Ge. The hardness of (Nb,Ti)5(Si,Ge)3 is slightly higher than that of the binary (unalloyed) Nb5Si3.
When Hf substitutes Nb and Al or Sn substitutes Si, the synergy of Al and Hf and Hf and Sn respectively has a stronger negative and positive effect on the hardness compared with that of Al and Ti and Sn and Ti (Figure 3b,c). When both Ti and Hf substitute Nb and Sn substitutes Si the hardness decreases slightly, compared with (Nb,Hf)5(Si,Sn)3 and there is a further small decrease in hardness when both Al and Sn substitute Si (Figure 3c). Notice that all the 5-3 silicides in Figure 3c have lower hardness than that of the binary (unalloyed) Nb5Si3.
The effect of the substitution of Nb by Cr and Ti on the hardness of Nb5Si3 is shown in Figure 3d. When only Nb is substituted in Nb5Si3 the hardness decreased (compared with the unalloyed Nb5Si3) and there is further decrease when Si is substituted by Al and Sn and the effect of Al or Sn is essentially the same (compared with (Nb,Ti,Cr)5Si3). The hardness increases as Si is substituted by Al and B and increases significantly when Si is substituted by Ge (compared with (Nb,Ti,Cr)5(Si,Sn)3). In Figure 3d, only the (Nb,Ti,Cr)5(Si,Ge)3 has hardness higher than that of the unalloyed Nb5Si3 and its hardness is the highest of all the 5-3 silicides shown in Figure 3.
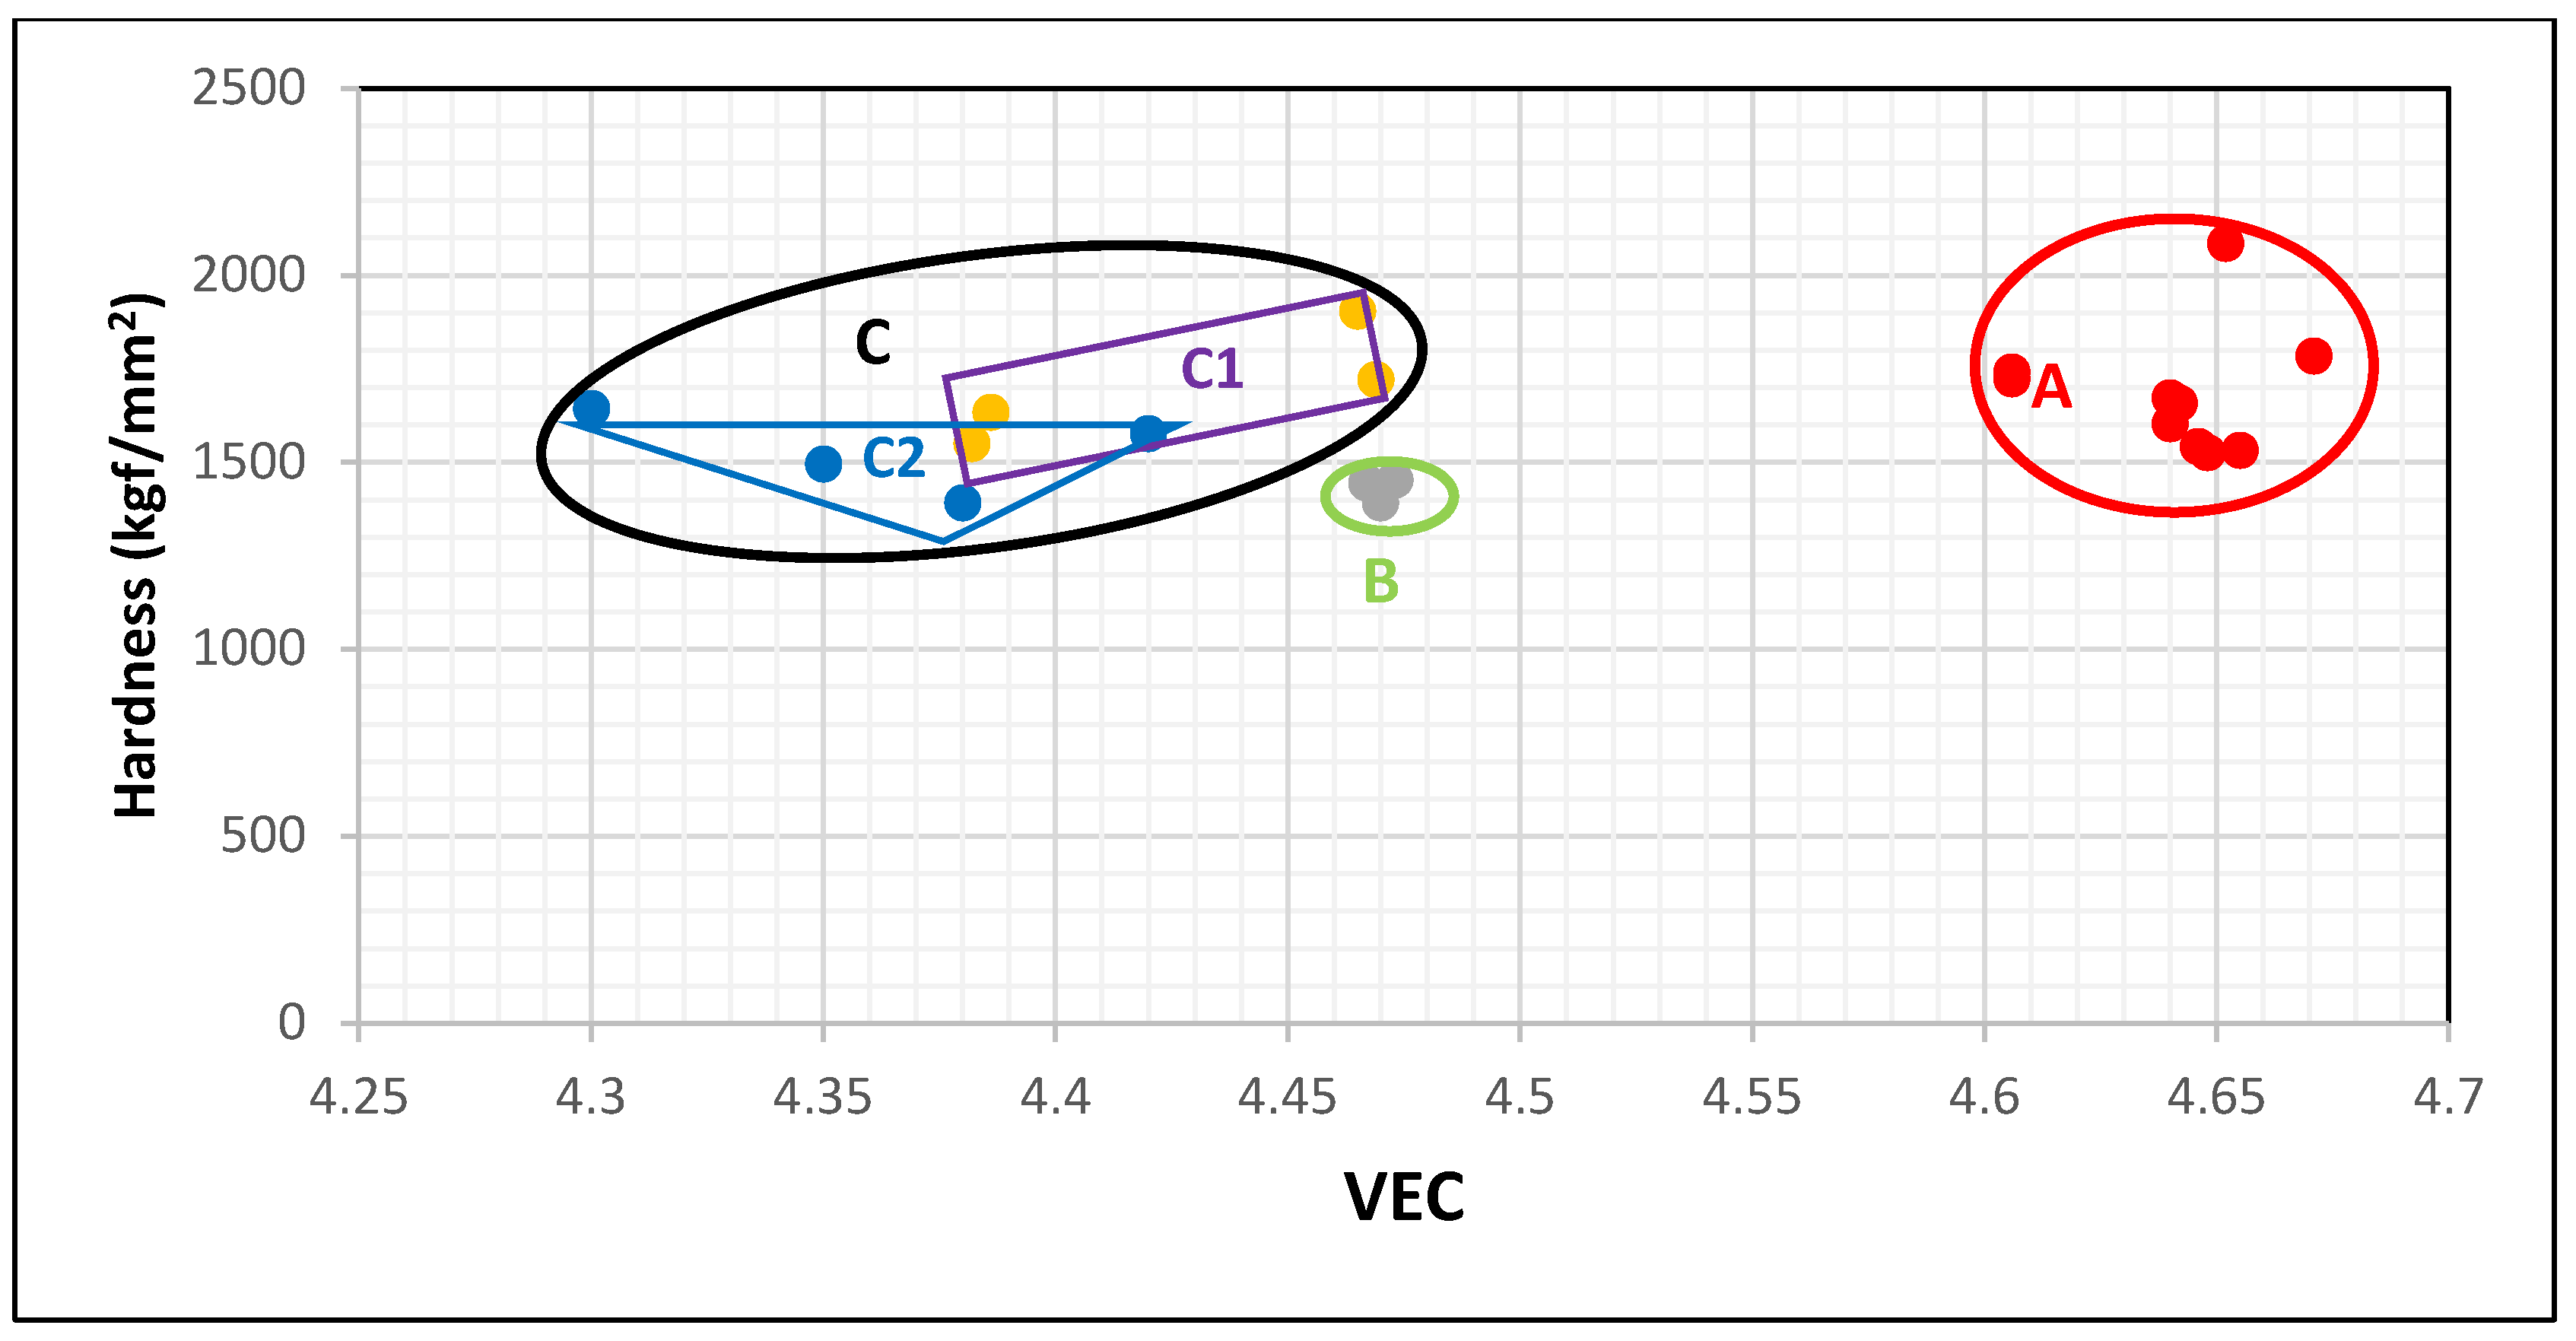
In this paper, the data for Nb5Si3 alloyed with Ge was chosen in order to demonstrate how alloying changes the hardness of Nb5Si3 and how the change of hardness can be understood using the silicide parameter VEC. The data in Figure 4 falls in three groups represented by the red, green and black areas that are labelled A, B and C. The data for the silicides Nb5(SiGe)3, (Nb,Cr)5(Si,Ge)3 and Nb5(Si,Ge,Al)3 is in area A. When Nb is substituted only by Ti and Si only by Ge the data shifts towards lower VEC and hardness values to area B, which contains the data for (Nb,Ti)5(Si,Ge)3. The individual addition of Al or Cr to the silicide shifts the data upwards (higher hardness but lower VEC) to the rectangular C1 in area C (black ellipse), which has the data for (Nb,Ti,Cr)5(Si,Ge)3 and (Nb,Ti)5(Si,Ge,Al)3. The substitution of Si by Al shifts VEC and hardness to lower values compared with Cr. The simultaneous presence of Al and Cr in the silicide shifts the data towards lower VEC to the triangle C2 in area C. Thus, the map of silicide hardness versus silicide parameter VEC clearly differentiates the role played by Ti in the hardness of Nb5Si3 alloyed with Ge and with no B, Sn, Mo, Ta, or W additions. When no Ti is present in the silicide the hardness exceeds 1500 HV and the silicide parameter VEC is higher than 4.6. The addition of Ti causes VEC to decrease to values below 4.48 and this is accompanied by a shift of the hardness to lower values. There is a gap in VEC values between 4.6 and 4.48 for Nb5Si3 alloyed with Ge.
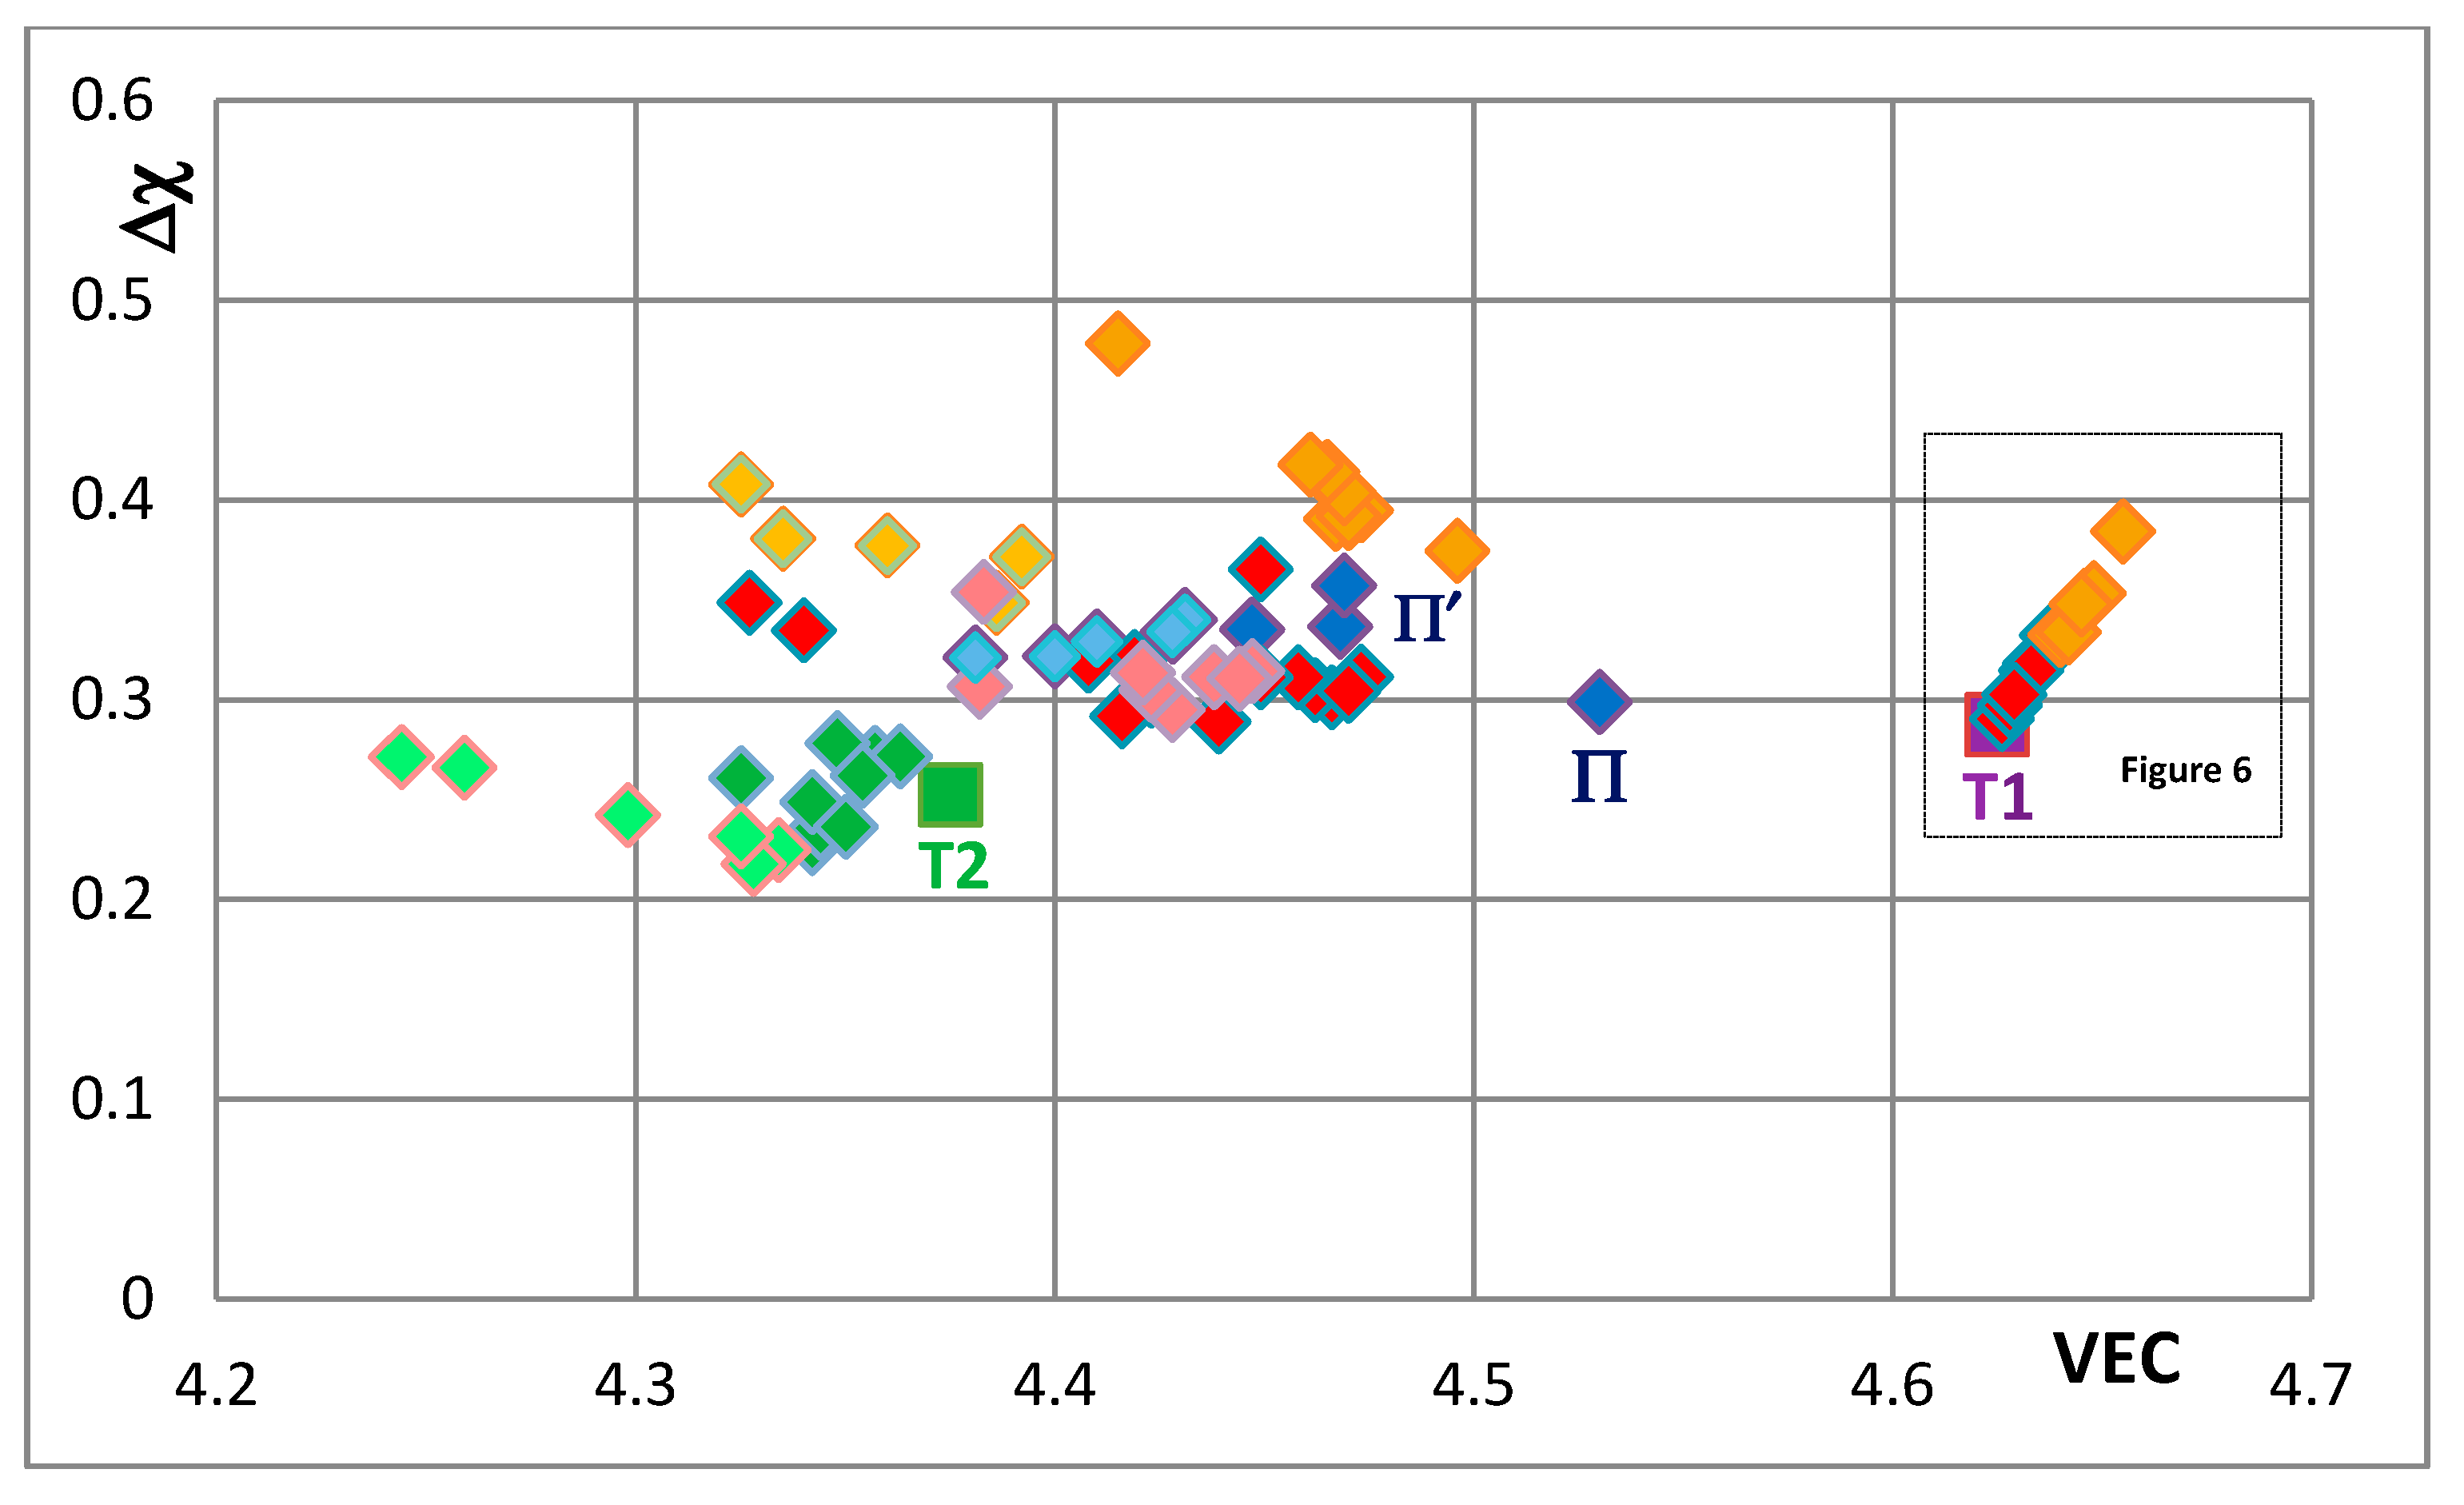
The effects of alloying on properties of Nb5Si3 also can be demonstrated using maps of the silicide parameters VEC and Δχ and the available data for the creep of unalloyed and alloyed Nb5Si3. Silicide maps are shown in the Figure 5, Figure 6, Figure 7, Figure 8, Figure 9, Figure 10 and Figure 11. Note that the data in the Figure 7, Figure 8, Figure 9, Figure 10 and Figure 11 is for different alloys. Figure 5 is the map for all the tetragonal Nb5Si3 silicides in the studied developmental alloys. When Si is substituted by Ge or Sn, the values of the silicide parameters VEC and Δχ increase but the opposite is the case when B substitutes Si (see Figure 5 and Figure 6 and compare the positions of T1 and T2—the composition of the silicide shown by T2 in Figure 5 is 62.5Nb-12.5Si-25B) or Ti substitutes Nb (see Π in Figure 5, which corresponds to the silicide 53Nb-10Ti-37Si [49]) and the concentration of Ti in the silicide is increased (see Π’ in Figure 5 that corresponds to the silicide 46.8Nb-17.4Ti-35.8Si). When both Nb and Si are substituted the values of the silicide parameter VEC decrease further (all data shifts to the left of Π) and Ge and B have the strongest effect on the silicide parameter Δχ with the former increasing and the latter decreasing Δχ (compared with T1) while the effect of Sn depends on alloying additions. When Si is substituted only by Al the silicide parameter VEC decreases further and there is a slight reduction of the value of the silicide parameter Δχ. When Al is substituting Si, the shift towards lower VEC values is increased only for the silicides where Al is simultaneously present with B or Ge but this is not the case when Al and Sn are simultaneously present in the silicide.
Figure 7, Figure 8, Figure 9, Figure 10 and Figure 11 show how the position of Nb5Si3 changes with alloying additions in the VEC versus Δχ silicide maps. Note differences in the VEC and Δχ axes compared with Figure 5 and Figure 6 and differences in the VEC axes between Figure 7, Figure 8, Figure 9, Figure 10 and Figure 11. The data used in these maps is for normal and Ti rich Nb5Si3 in cast and heat treated alloys. In Figure 7, Figure 8, Figure 9, Figure 10 and Figure 11 the unalloyed Nb5Si3 is shown as T1. The alloying additions in Nb5Si3 are Cr, Hf, Mo, Ta, which substitute Nb and Al, B, Ge and Sn, which substitute Si. Substituting Nb with Ti and Cr and Si with Al shifts the silicide in area B, meaning that the normal Nb5Si3 and Ti rich Nb5Si3 in the cast and heat treated alloy “moves” in this area as the concentrations of Al, Cr and Ti in the Nb5Si3 change. Area B is included in Figure 7, Figure 8, Figure 9, Figure 10 and Figure 11 to show how alloying changes the position of the Nb5Si3 in the maps.
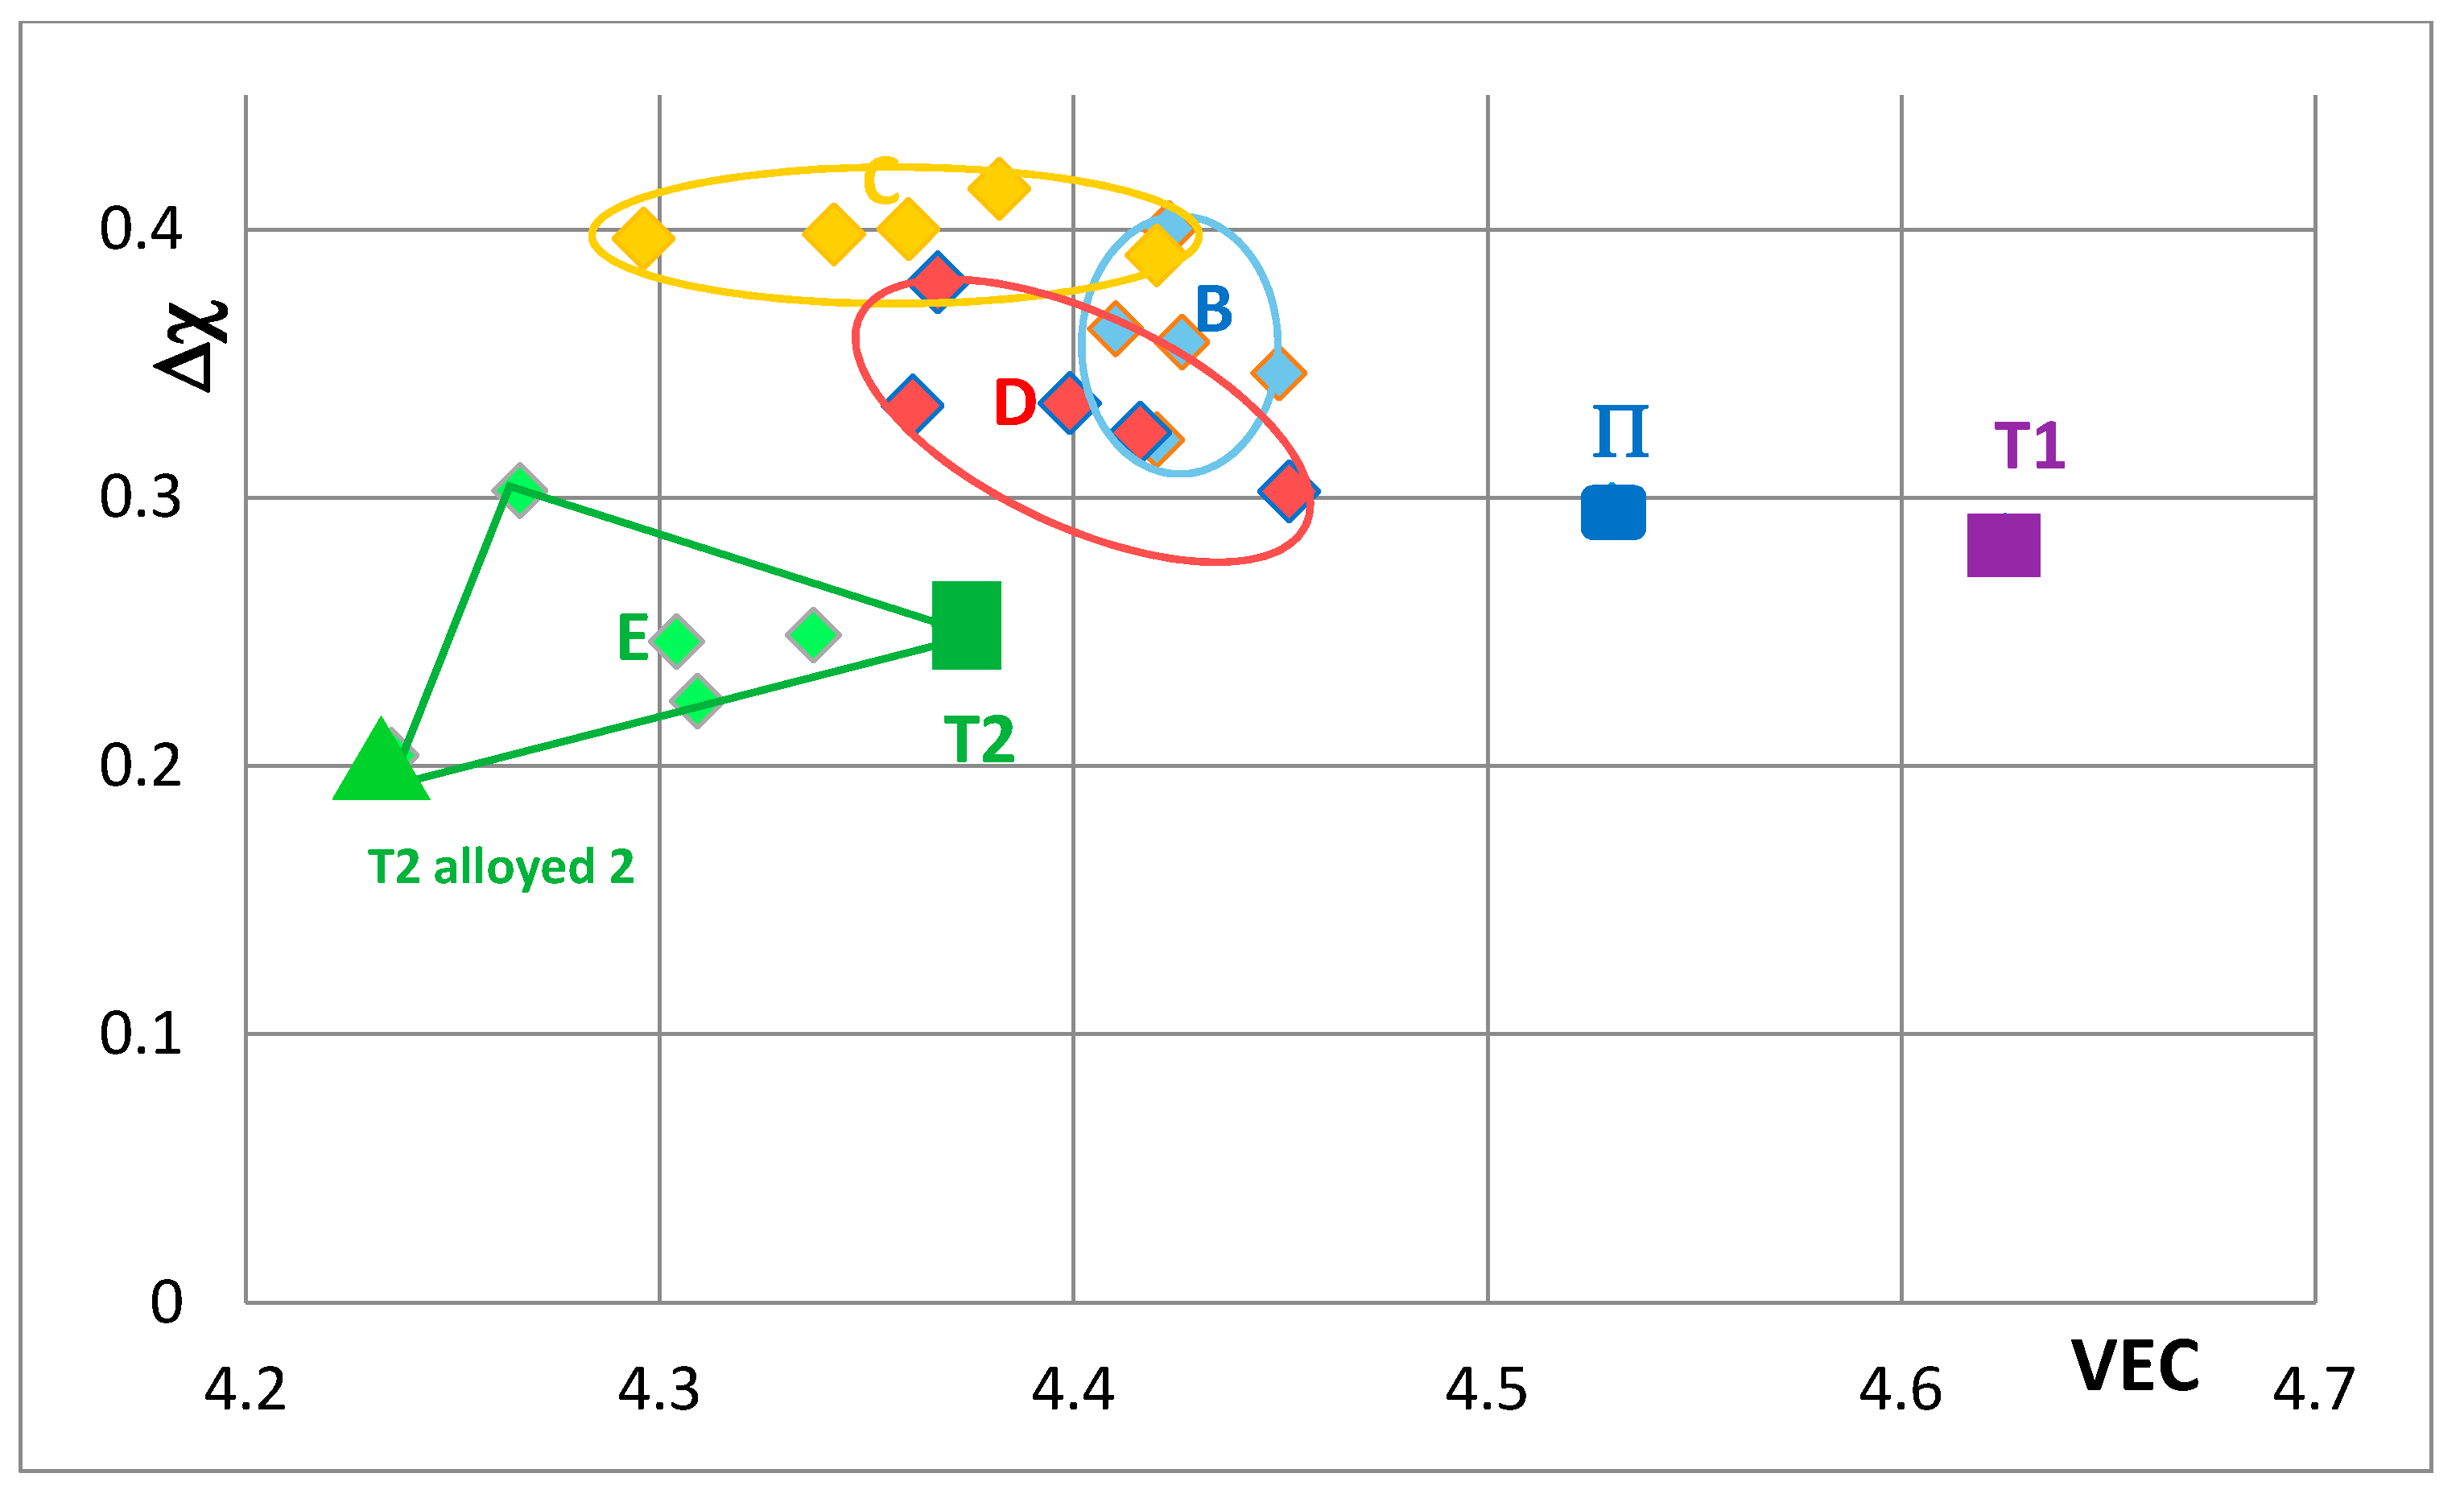
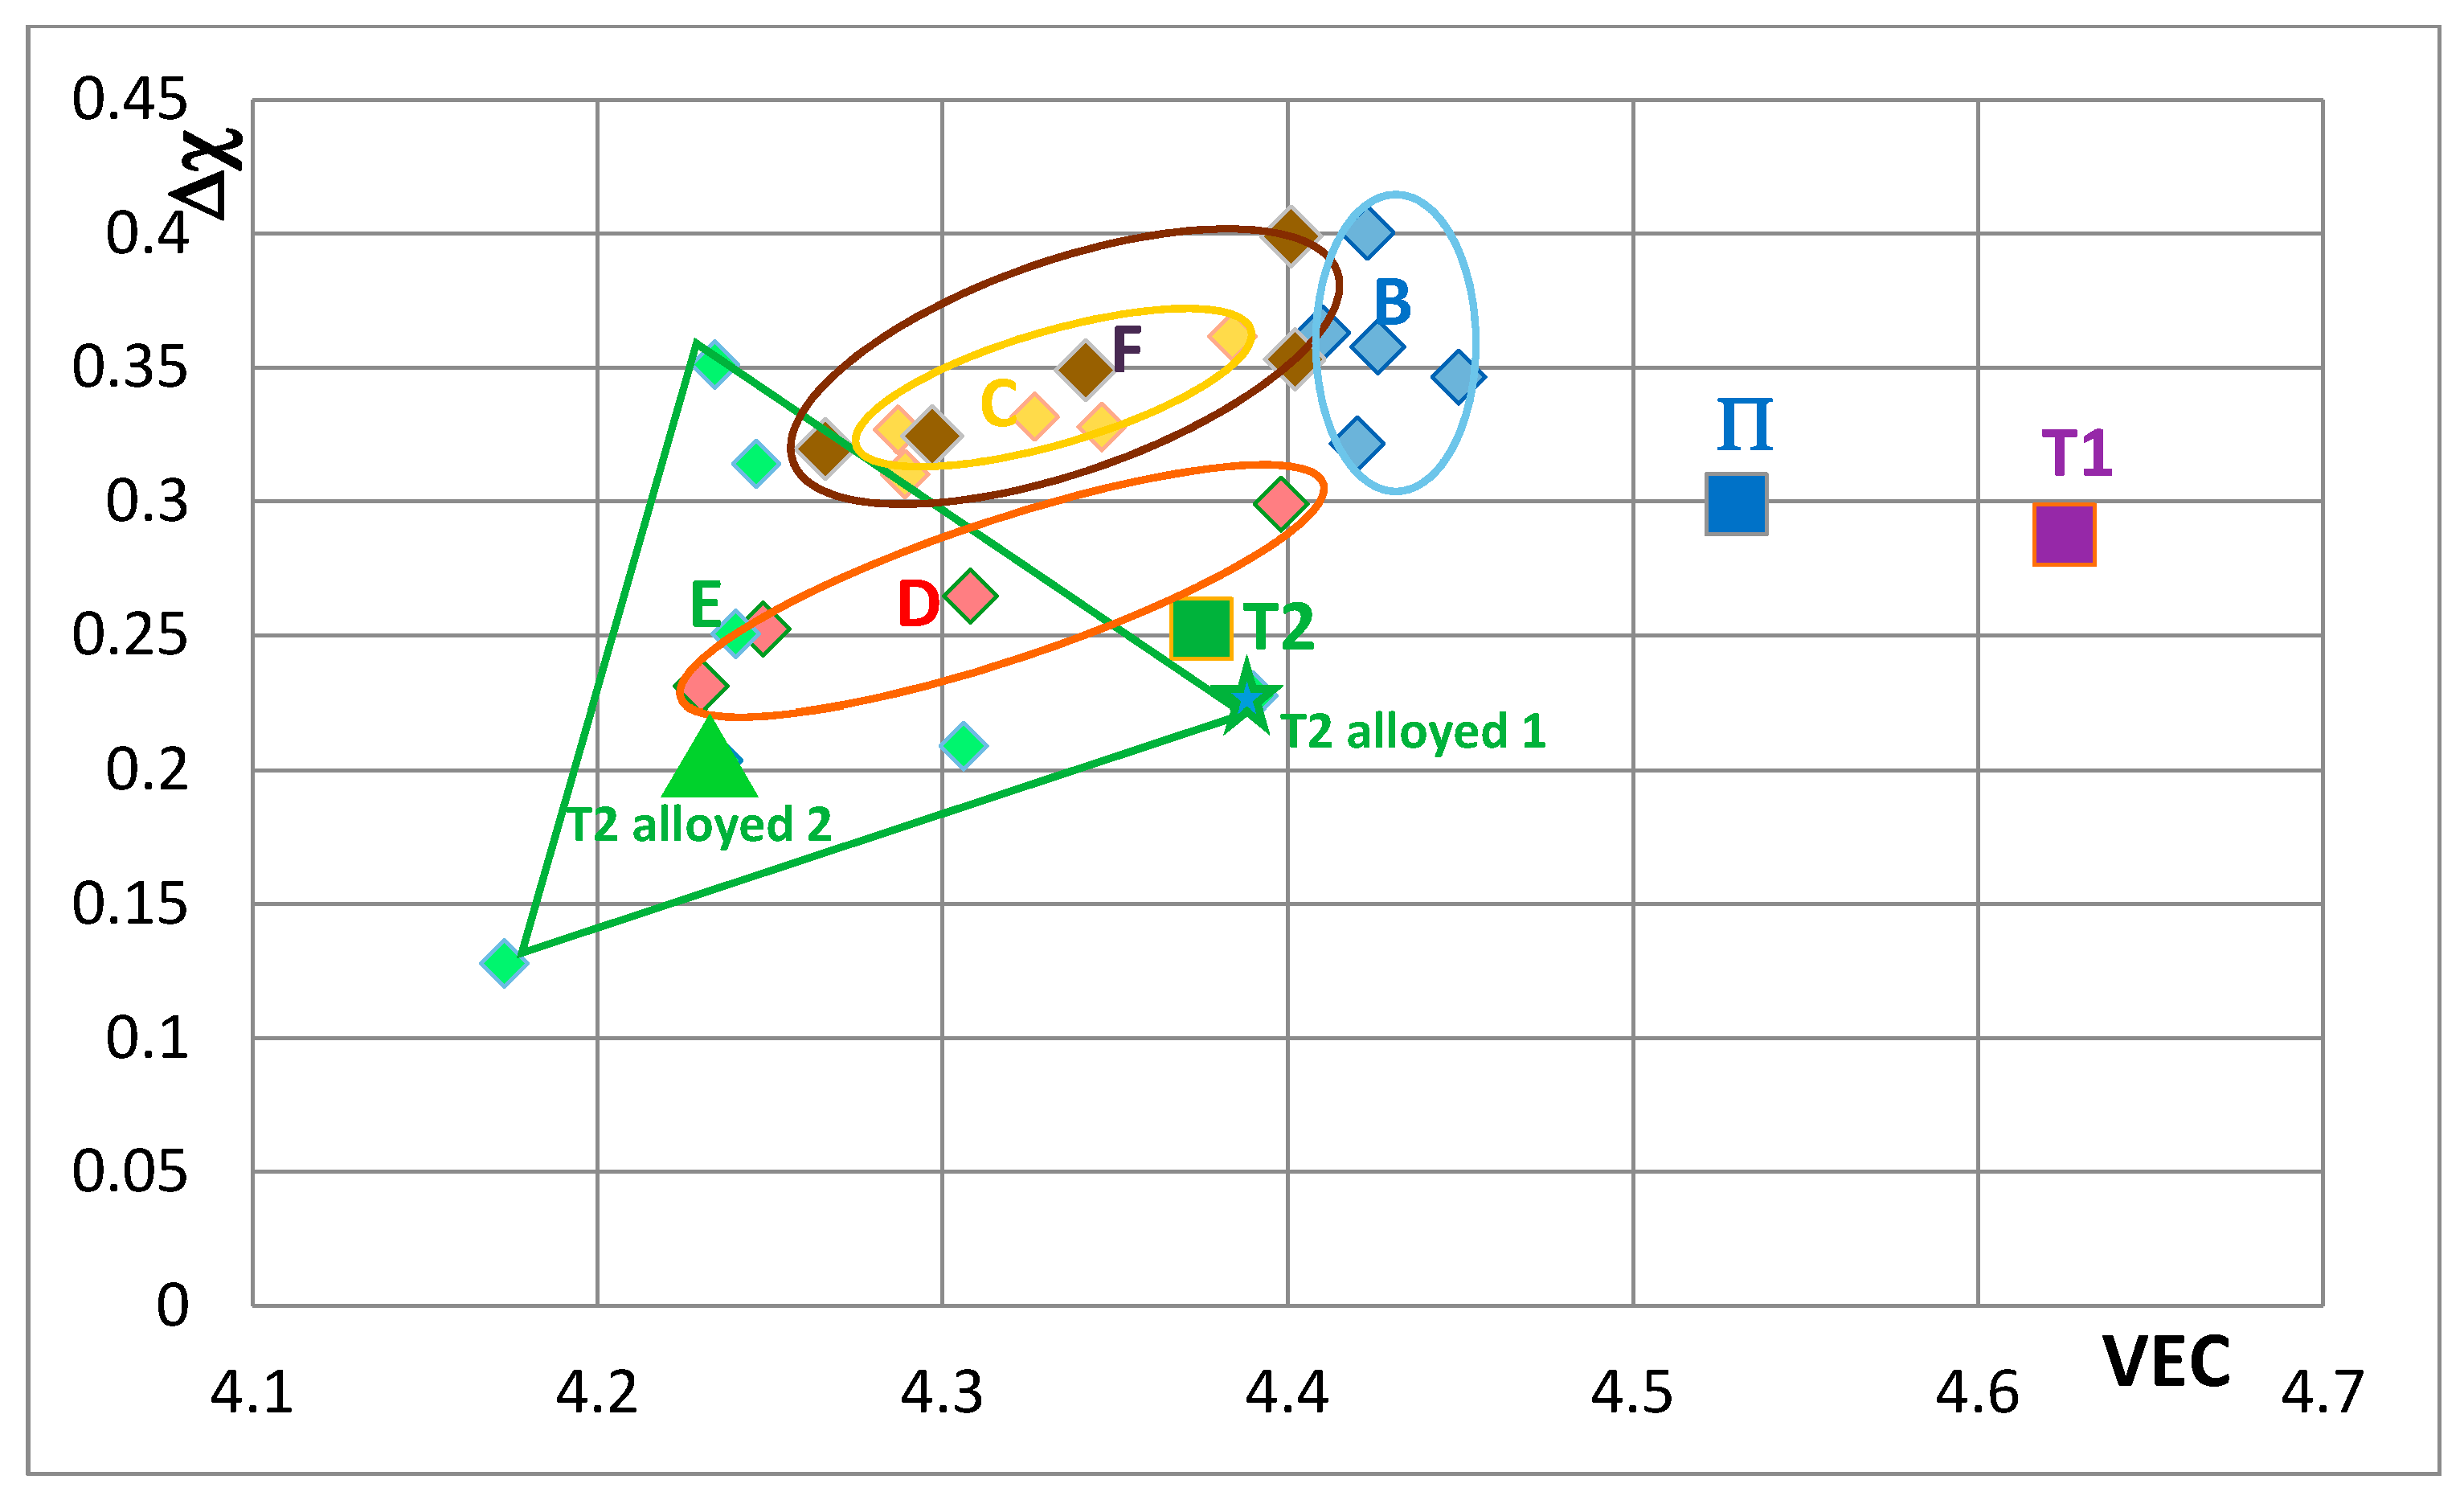
Figure 7 shows changes caused by the substitution of Si with B, Ge and Sn. In this figure, the Nb in the silicide is substituted by Ti and Cr. The Nb5Si3 “shifts” from area B to areas C, D and E in Figure 7, when Ge or Sn or B is present in the alloy. Note that the Nb5Si3 alloyed with B occupies the distinctly different area E. In Figure 8 the effect of substituting Nb with Hf (and Ti and Cr) and Si with B, Ge and Sn in Nb5Si3 is shown. The silicide shifts from area B to areas C to F. The substitution of Nb by Cr, Hf and Ti shifts the silicide from area B to area F. When Si in the silicide is substituted by Ge, area C (silicide with Ge and Hf) is entirely within the area F. This however is not the case when Si in the silicide is substituted by Sn in area D, which is for silicides with Hf and Sn. Area D spreads into area E (silicides with B and Hf). Note that with the addition of Hf area E expands towards higher Δχ and lower VEC values. The compositions of the alloyed silicides indicated as T2 alloyed1 and T2 alloyed2 respectively were 38.5Nb-16Ti-6Hf-1Cr-37Si-1Al-0.5B and 41.5Nb-13Ti-3Hf-4Cr-12.5Si-25.5B-0.5Al [49].
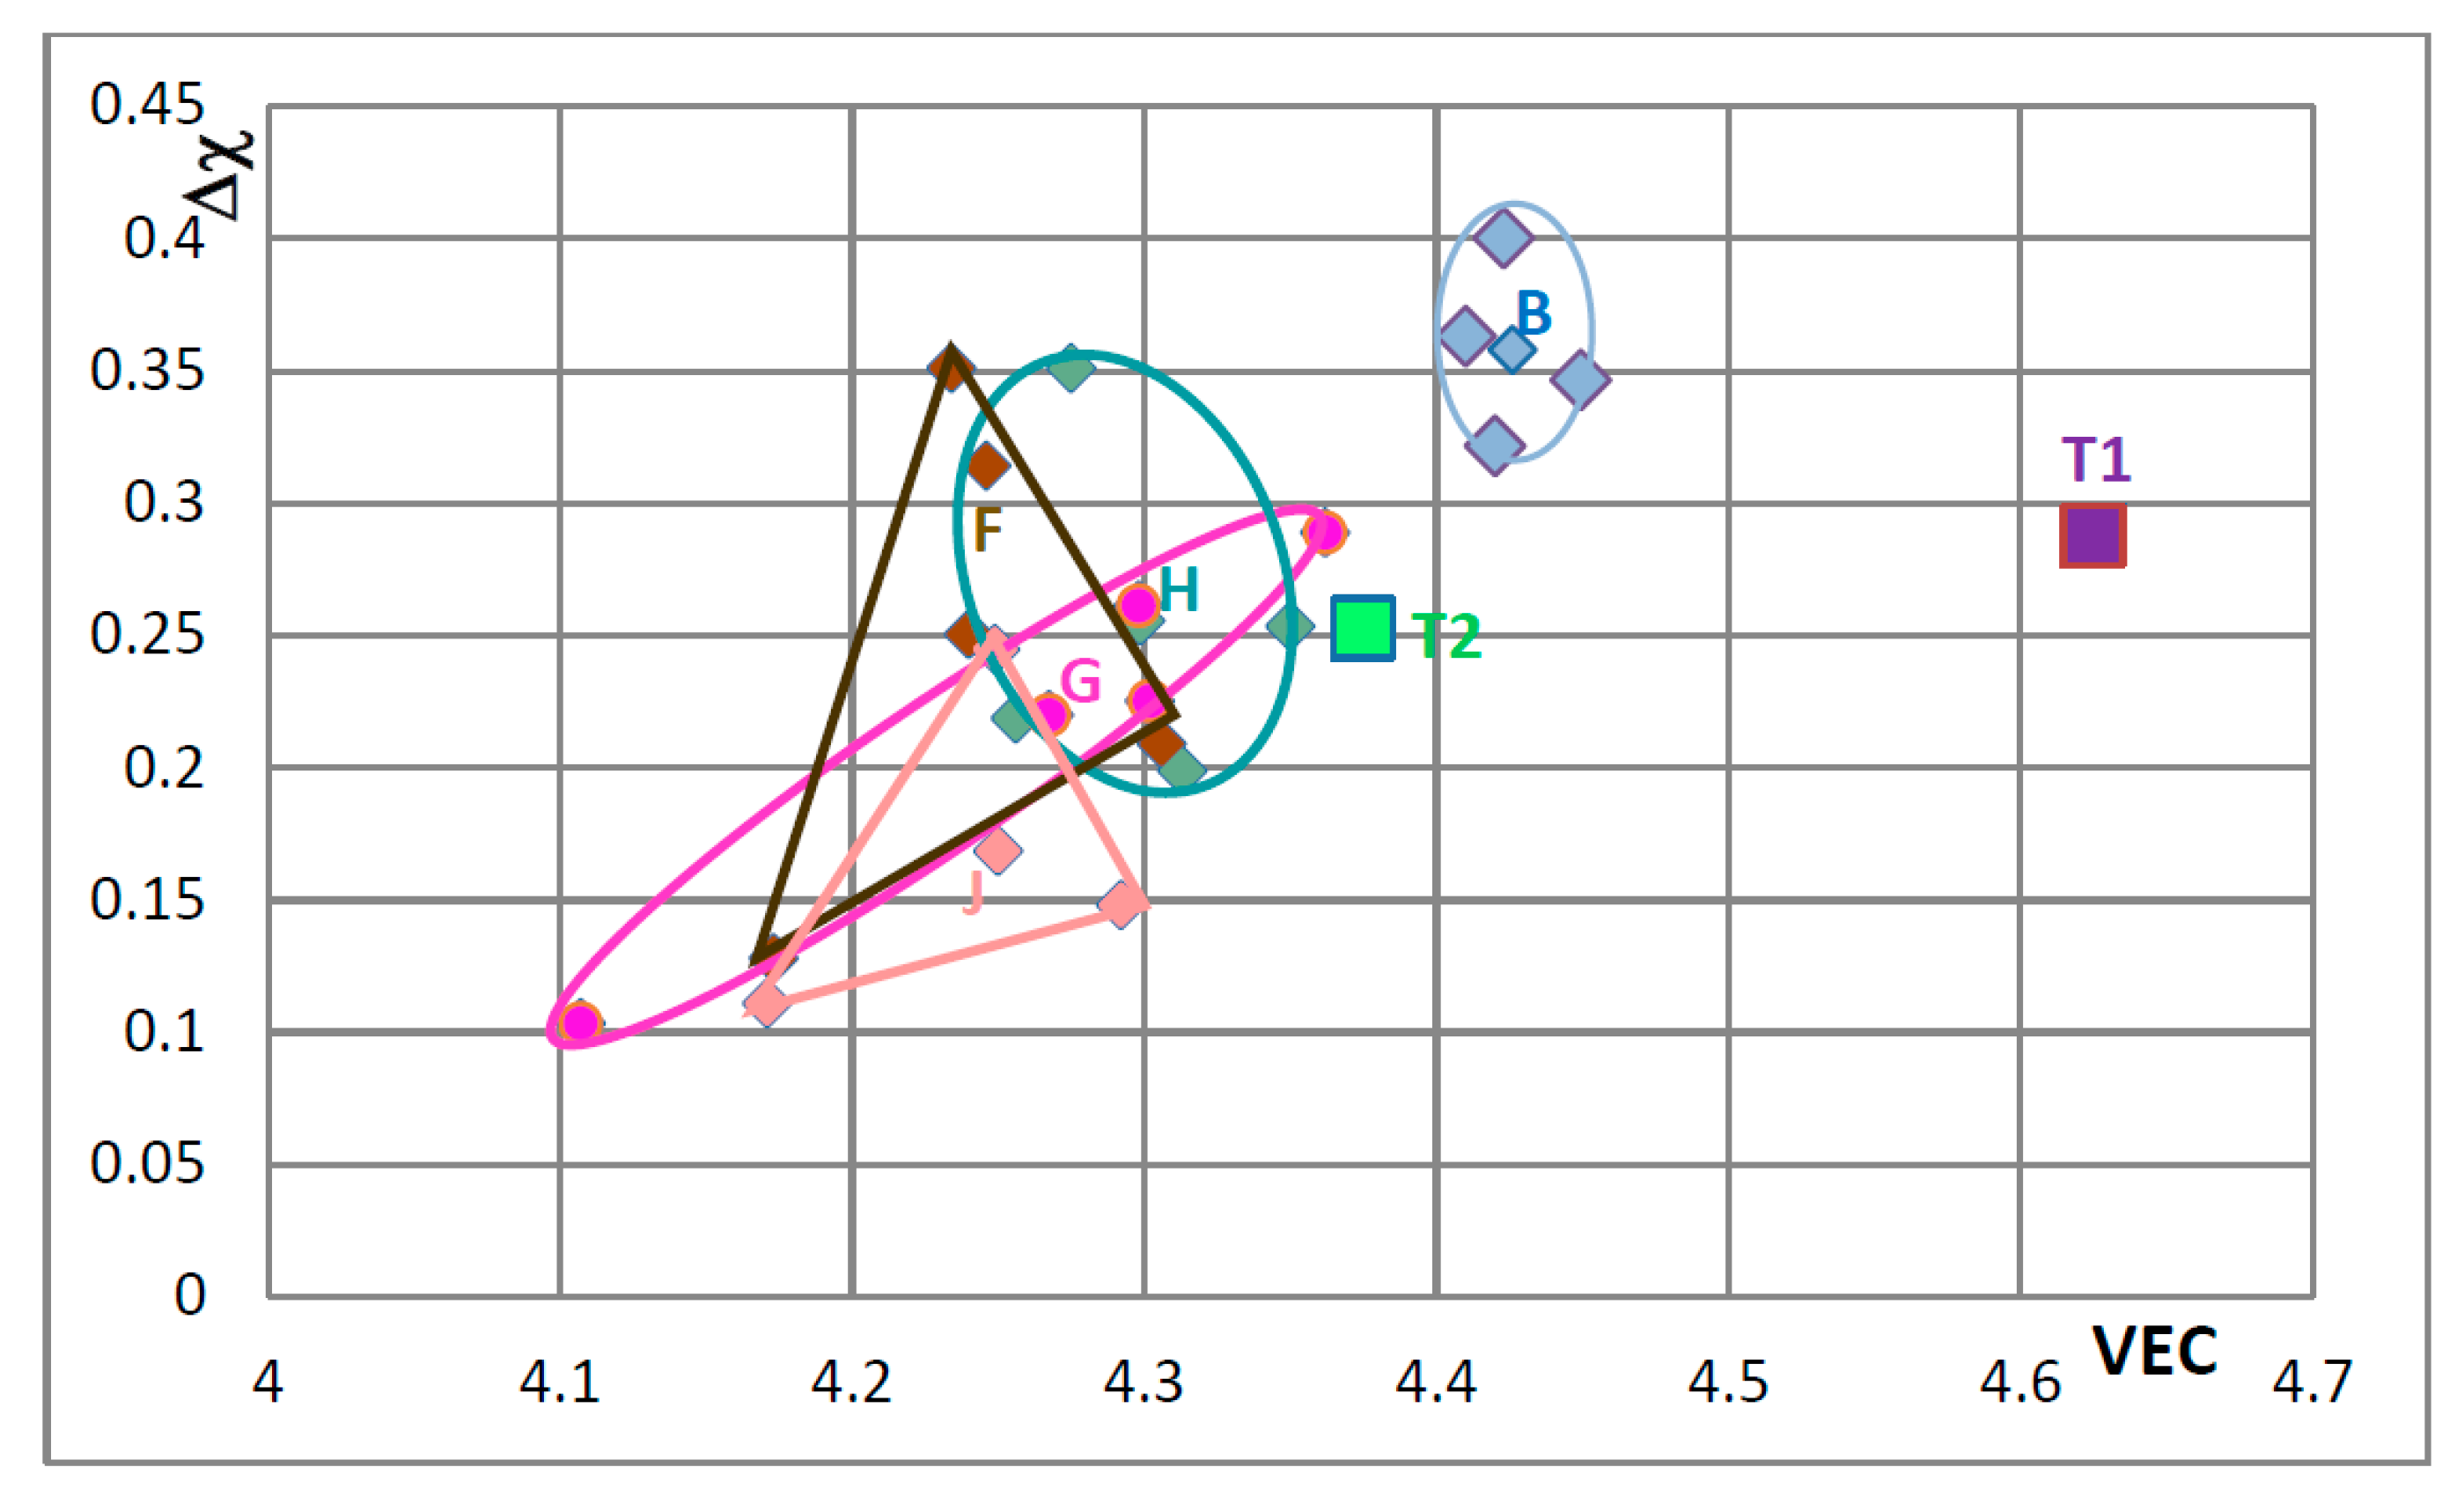
In Figure 9 the effect of substituting Nb with other transition metals such as Hf and Mo and Ta and Si only with Al is considered in order to show and compare the effects of Mo and Ta in comparison with the effect of Hf. The Nb5Si3 alloyed with Ta occupies its own area (H), which is separate from area B. The silicide alloyed with Mo falls almost entirely in area F, which is the same as area F in Figure 8. In Figure 10 the substitutions Si with B and Sn and Nb with Hf or Mo or Ta are considered to show the effect of the simultaneous presence of B with each of the other elements. The addition of B causes a significant change in area F (compare Figure 8, Figure 9 and Figure 10), area H expands (compare Figure 9 and Figure 10) and area G shifts to lower VEC and Δχ values (compare Figure 9 and Figure 10). In Figure 10 the silicides that contain B occupy the area of the map defined by Δχ and VEC with values less than about 0.35 and 4.362 respectively. The higher value of Δχ should also be noted in Figure 8. The simultaneous presence of B and Sn has the strongest effect (compare positions of areas B and J in the map). Figure 11 shows that when Ge and Sn are simultaneously present in the alloy area B shifts to area I, which in the map occupies a position similar to but larger than area D in the Figure 8, that parts of areas B and I overlap and that Δχ is below 0.35.
In Figure 7, Figure 8, Figure 9, Figure 10 and Figure 11 the “average” positions of the Nb5Si3 in the areas B to I are indicated by the data point that is closest to the letter of the area. One could use an arrow to link the T1 with the average in each area to show “the direction of change” in the map with specific alloying addition(s). To avoid crowding the maps with extra lines, the “direction of change” is demonstrated only in Figure 11, where T1 is connected with the average positions in areas B and I. It is noted that the average Δχ value of the Nb5Si3 changed very little compared with that of the unalloyed silicide (T1) when Ge and Sn were simultaneously present in the silicide.
The shift of the position of the Nb5Si3 in the VEC versus Δχ maps in Figure 5, Figure 6, Figure 7, Figure 8, Figure 9, Figure 10 and Figure 11—when Nb and Si of the silicide were substituted by alloying additions in Nb-silicide based alloys and the change of the composition of the silicide as the alloy microstructure evolved following exposure to high temperature—should be accompanied with changes of the properties of the 5-3 silicide. These changes affect creep and oxidation of the alloys. This will be discussed in a separate paper.
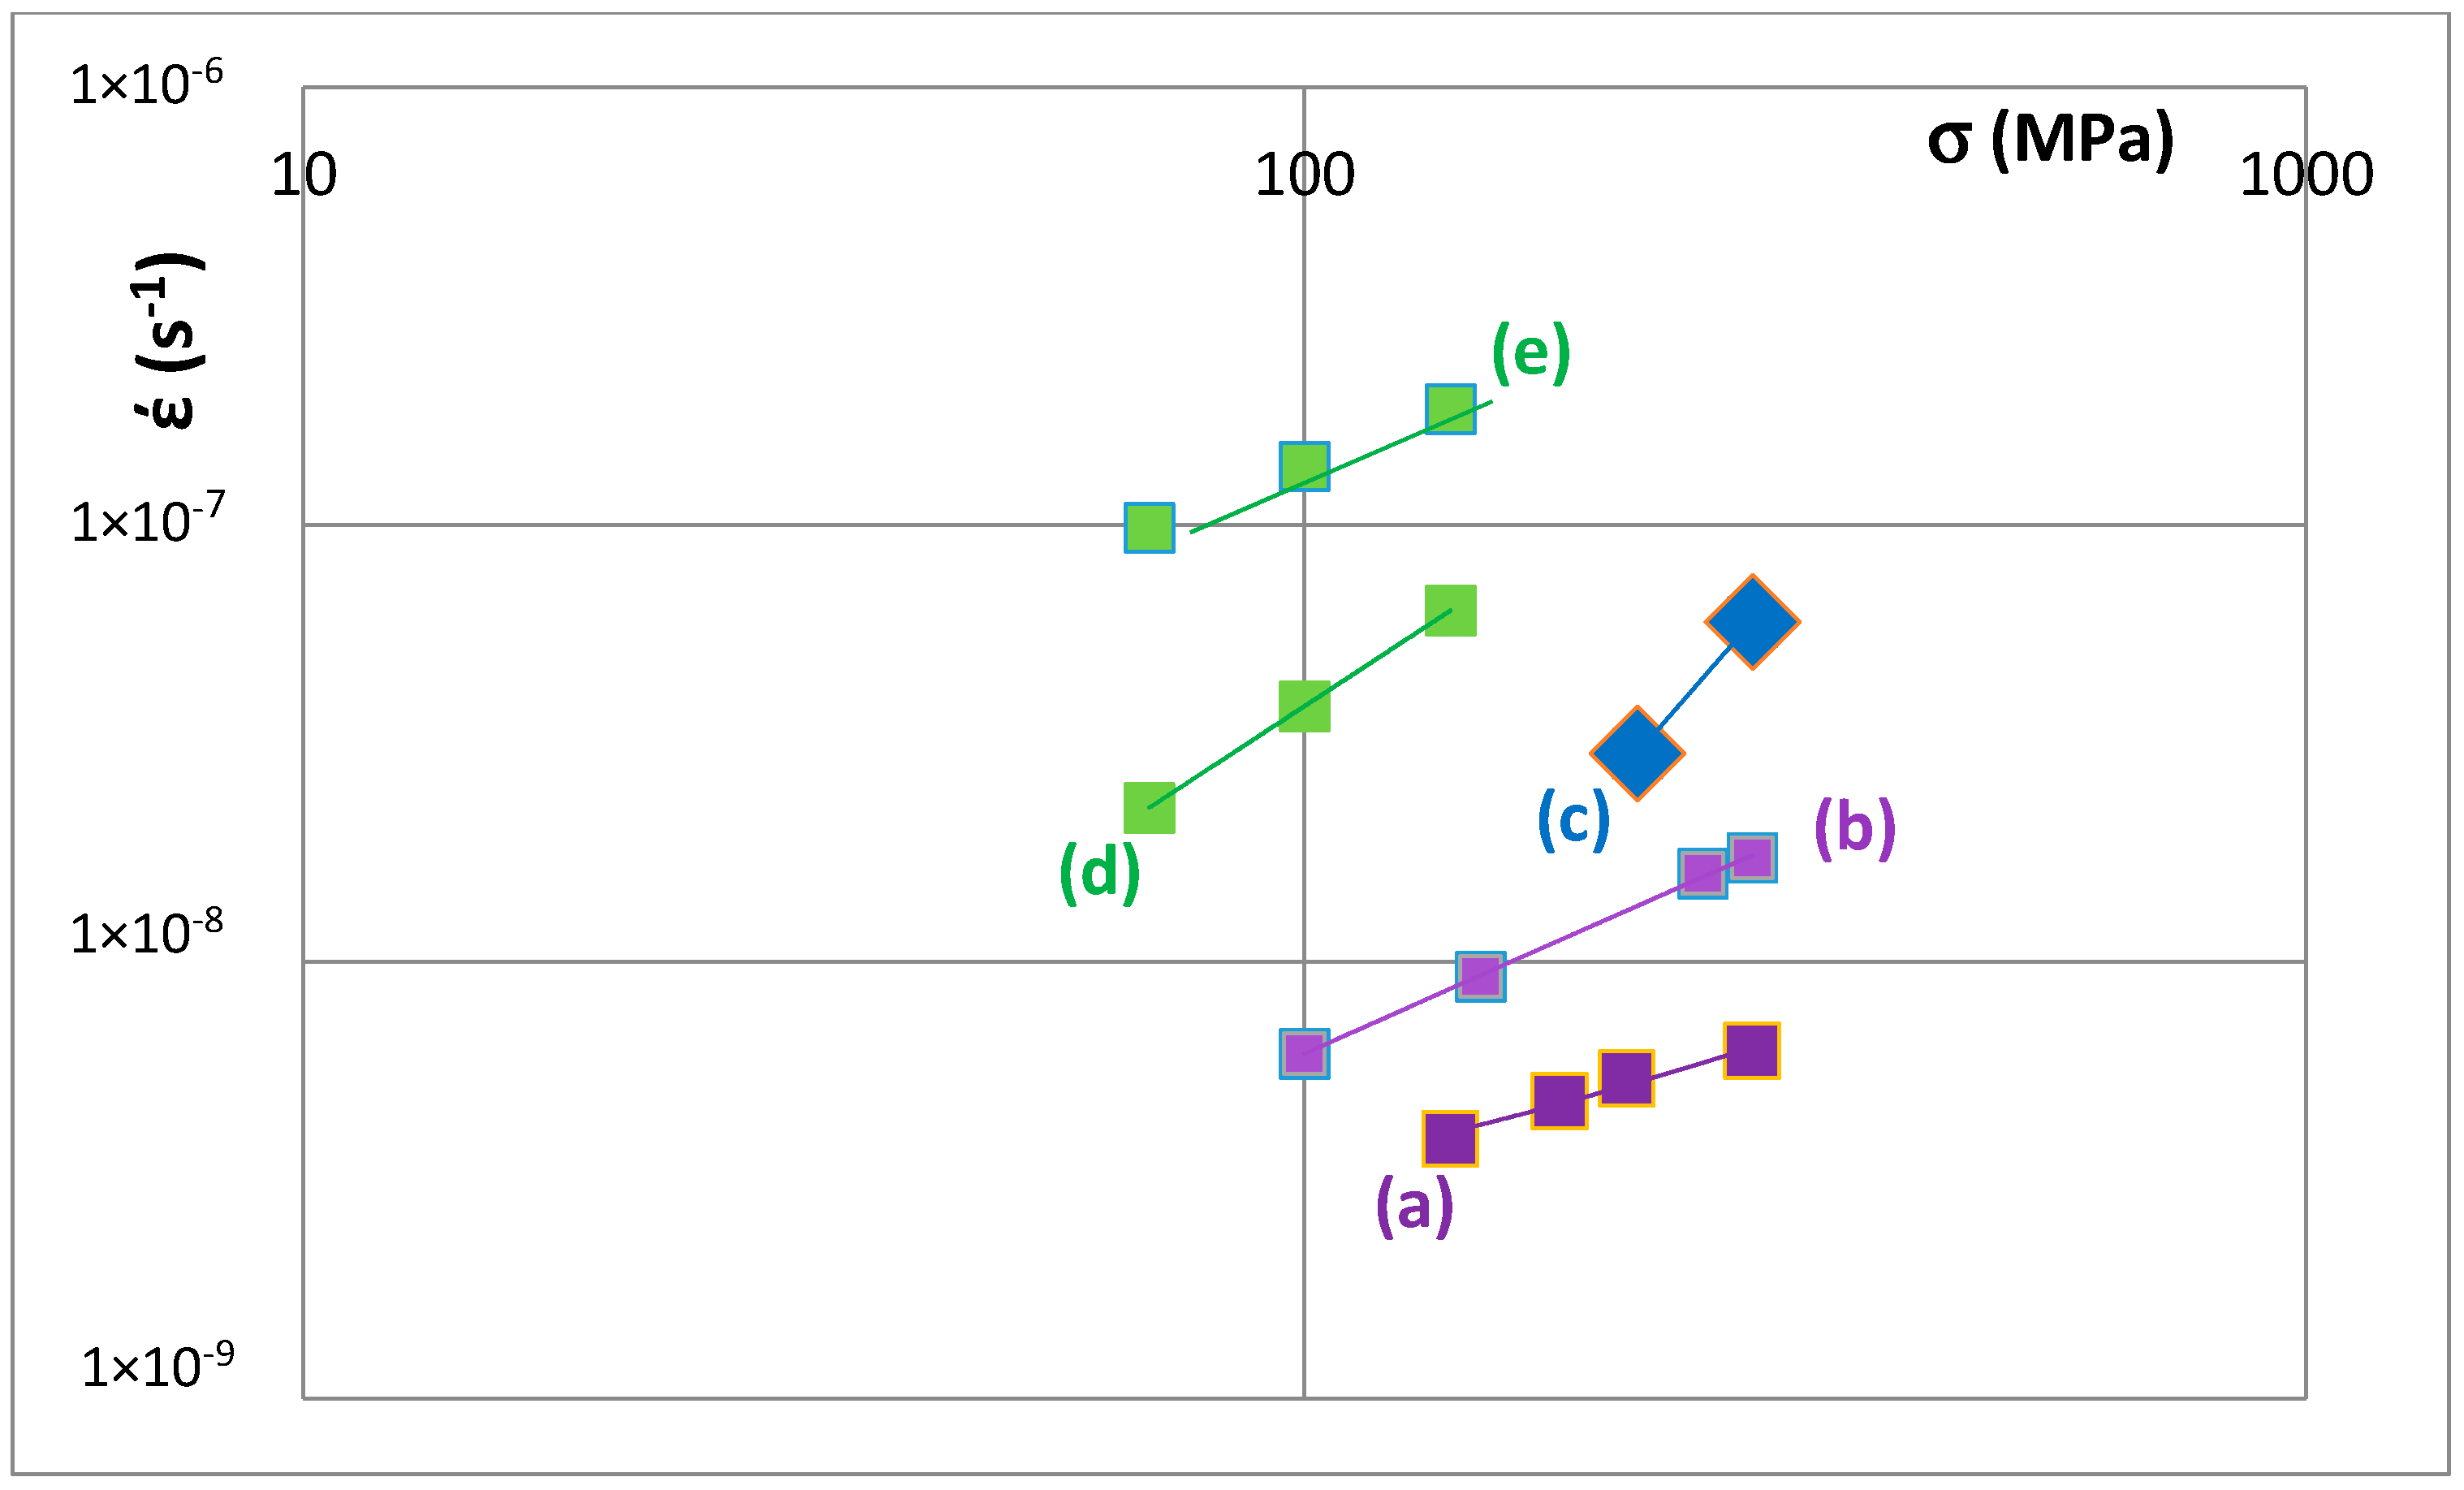
Creep data for unalloyed and alloyed tetragonal Nb5Si3 is shown in the Norton σn plots for 1473 K in Figure 12. The data sets (a) and (b) are for unalloyed αNb5Si3 prepared using (a) powder metallurgy processing (PM) and heat treatment (HT) with powders from crashed arc melted material and (b) arc melting + HT. The data shows that the creep rate increases as Nb is substituted by Cr, Hf and Ti and Si by Al and B. The positions of the unalloyed and alloyed silicides in Figure 12 are indicated in the VEC versus Δχ maps, for example see Figure 8. Increase in creep rate of Nb5Si3 results from alloying with Ti (compare T1 and Π) and with Cr, Hf and Ti and Al and B (compare T1 with T2 alloyed1 and T2 alloyed2) and these increases in creep rate are associated with decrease in the VEC and increase and decrease in the Δχ values (Figure 8).
3. Conclusions
This paper studied alloying behaviour and properties of Nb5Si3. The study used data for the silicide parameters VEC and Δχ and for the silicide solubility range, which was studied using the concentration X = Al + B + Ge + Si + Sn in (Nb,TM)5X3. Actual chemical compositions of tetragonal Nb5Si3 in developmental Nb-silicide based alloys, where in the silicide the Nb is substituted by Cr, Hf, Mo, Ta and Ti and the Si by Al, B, Ge and Sn individually or simultaneously, were used to calculate VEC, Δχ and X. Relationships between solvent and solute additions in Nb5Si3 and its parameters VEC and Δχ were found. Changes in the hardness and creep of tetragonal Nb5Si3 were related to the parameters VEC and Δχ. The conclusions of the research are as follows:
The concentration X was in the range 33.6 < X < 41.6 at.% and depended on the alloying addition(s). In Nb-24Ti-18Si-5Al-5Cr + 5Z alloys the single addition of element Z, where Z = Hf, Mo and Ta, or B, Ge and Sn, shifted the solubility range of X towards Nb (decreased X compared with the binary Nb5Si3) and Hf and Ge had the strongest effect. When B was in synergy with Hf or Mo or Sn the solubility exceeded 40.5 at.%. A shift towards higher X values was accompanied by a decrease of the values of the Δχ parameter of the Nb5Si3.
The Ge concentration in Nb5Si3 increased with its Ti concentration. The Hf concentration in Nb5Si3 increased and decreased with its Ti or Nb concentration respectively and its dependence on the latter was stronger. The B and Sn concentrations in the Nb5Si3 respectively decreased and increased with its Ti concentration and also depended on the concentrations of other alloying elements in the silicide.
The values of the parameters VEC and Δχ were in the ranges 4.11 < VEC < 4.45 and 0.103 < Δχ < 0.415. The parameter VEC described the alloying behaviour of Sn and the parameter Δχ described the alloying behaviour of B and Ge in Nb5Si3. The alloying behaviour of Nb5Si3 also was demonstrated in Δχ versus VEC maps.
Depending on alloying addition(s) the hardness of Nb5Si3 increased or decreased. Compared with the binary Nb5Si3, the hardness was increased when Ge was present in the silicide and decreased when Al, B and Sn were present in the silicide without Ge. The effect of Al depended on other elements substituting Si in the silicide. Sn reduced the hardness. The addition of Ti or Hf had a stronger negative effect on the hardness of Nb5Si3 than that of Cr in silicides without Ge.
Deterioration of the creep of alloyed Nb5Si3 was linked with changes in the position of the Nb5Si3 in Δχ versus VEC maps.
Acknowledgments
The author gratefully acknowledges the support of the University of Sheffield, EU (FP6—ULTMAT project), EPSRC (GR/R09367, GR/S81759, EP/H500405/1, EP/L026678/1) and Rolls Royce plc and discussions with all the members (current and past) of the research group.
Conflicts of Interest
The author declares no conflict of interest.
References
- Bewlay, B.P.; Jackson, M.R.; Gigliotti, M.F.X. Intermetallic Compounds: Principles and Practice; Fleischer, R.L., Westbrook, J.H., Eds.; John Wiley: New York, NY, USA, 2001; Volume 3, p. 541. [Google Scholar]
- Okamoto, H. Phase Diagrams for Binary Alloys: Desk Handbook; ASM International: Metals Park, OH, USA, 2000. [Google Scholar]
- Tsakiropoulos, P. Beyond Nickel Based Superalloys. In Encyclopedia of Aerospace Engineering; Blockley, R., Shyy, W., Eds.; John Wiley & Sons, Ltd.: Hoboken, NJ, USA, 2010. [Google Scholar]
- Zelenitsas, K.; Tsakiropoulos, P. Study of the role of Al and Cr additions in the microstructure of Nb-Ti-Si in situ composites. Intermetallics 2005, 13, 1079–1095. [Google Scholar] [CrossRef]
- Geng, J.; Shao, G.; Tsakiropoulos, P. Study of three-phase equilibrium in the Nb-rich corner of Nb-Si-Cr system. Intermetallics 2006, 14, 832–837. [Google Scholar] [CrossRef]
- Zelenitsas, K.; Tsakiropoulos, P. Study of the role of Ta and Cr additions in the microstructure of Nb-Ti-Si-Al in situ composites. Intermetallics 2006, 14, 639–659. [Google Scholar] [CrossRef]
- Shah, D.M. Superalloys 1992; Antolovich, S.D., Stusrud, R.W., MacKay, R.A., Anton, D.L., Khan, T., Kissinger, R.D., Klarstrom, D.L., Eds.; TMS: Warrendale, PA, USA, 1992; pp. 409–422. [Google Scholar]
- Zhang, L.; Wu, J. Thermal expansion and elastic moduli of the silicide based intermetallic alloys Ti5Si3(X) and Nb5Si3. Scr. Mater. 1998, 38, 307–313. [Google Scholar] [CrossRef]
- Williams, J.J.; Kramer, M.J.; Akinc, M. Thermal expansion of Ti5Si3 with Ge, B, C, N or O additions. J. Mater. Res. 2000, 15, 1780–1785. [Google Scholar] [CrossRef]
- Schneibel, J.H.; Rawn, C.J. Thermal expansion anisotropy of ternary titanium silicides based on Ti5Si3. Acta Mater. 2004, 52, 3843–3848. [Google Scholar] [CrossRef]
- Rodriges, G.; Nunes, C.A.; Suzuki, P.A.; Coelho, G.C. Thermal expansion of the Ti5Si3 and Ti6Si2B phases investigated by high temperature X-ray diffraction. Intermetallics 2006, 14, 236–240. [Google Scholar] [CrossRef]
- Ikarashi, Y.; Ishizaki, K.; Nagai, T.; Hashizuka, Y.; Kondo, Y. Reduction of thermal expansion anisotropy for intermetallic silicides of 16H crystal structure. Intermetallics 1996, 4, S141–S145. [Google Scholar] [CrossRef]
- Rodriges, G.; Chad, V.M.; Nunes, C.A.; Suzuki, P.A.; Coelho, I.C. Thermal expansion of the W5Si3 and T2 phases in the W-Si-B system investigated by high-temperature X-ray diffraction. Intermetallics 2007, 15, 241–244. [Google Scholar] [CrossRef]
- Chu, F.; Thoma, D.J.; McClellan, K.; Peralta, P.; He, Y. Synthesis and properties of Mo5Si3 single crystals. Intermetallics 1999, 7, 611–620. [Google Scholar] [CrossRef]
- Schneibel, J.H.; Rawn, C.J.; Watkins, T.R.; Payzant, E.A. Thermal expansion anisotropy of ternary molybdenum silicides based on Mo5Si3. Phys. Rev. B 2002, 65, 134112-1–134112-5. [Google Scholar] [CrossRef]
- Rodrigues, G.; Nunes, C.A.; Suzuki, P.A.; Coelho, G.C. Thermal expansion of the V5Si3 and T2 phases in the V-Si-B system investigated by high-temperature X-ray diffraction. Intermetallics 2009, 17, 792–795. [Google Scholar] [CrossRef]
- Rodriges, G.; Nunes, C.A.; Suzuki, P.A.; Coelho, G.C. Lattice parameters and thermal expansion of the T2 phase of the Nb-Si-B system investigated by high-temperature X-ray diffraction. Intermetallics 2004, 12, 181–188. [Google Scholar] [CrossRef]
- Xu, W.; Han, J.; Wang, C.; Zhou, Y.; Wang, Y.; Kang, Y.; Wen, B.; Liu, X.; Liu, Z.K. Temperature-dependent mechanical properties of alpha/beta Nb5Si3 phases from first-principles calculations. Intermetallics 2014, 46, 72–79. [Google Scholar] [CrossRef]
- Papadimitriou, I.; Utton, C.; Tsakiropoulos, P. The impact of Ti and temperature on the stability of Nb5Si3 phases: A first-principles study. Sci. Technol. Adv. Mater. 2017, 18, 467–479. [Google Scholar] [CrossRef] [PubMed]
- Tsakiropoulos, P. On the macrosegregation of silicon in niobium silicide based alloys. Intermetallics 2014, 55, 95–101. [Google Scholar] [CrossRef]
- Bewlay, B.P.; Jackson, M.R. Comprehensive Composite Materials; Kelly, A., Zweben, C., Eds.; Elsevier: Amsterdam, The Netherlands, 2003; Chapter 3.22; pp. 579–615. [Google Scholar]
- Tsakiropoulos, P. On the Nb-silicide based alloys: Part I—The bcc Nb solid solution. J. Alloys Compd. 2017, 708, 961–971. [Google Scholar] [CrossRef]
- Geng, J.; Tsakiropoulos, P.; Shao, G. Oxidation of Nb-Si-Cr-Al in situ composites with Mo, Ti and Hf additions. Mater. Sci. Eng. A 2006, 441, 26–38. [Google Scholar] [CrossRef]
- Geng, J.; Tsakiropoulos, P. A study of the microstructure and oxidation of Nb-Si-Cr-Al-Mo in situ composites alloyed with Ti, Hf and Sn. Intermetallics 2007, 15, 382–395. [Google Scholar] [CrossRef]
- Tewari, R.; Song, H.; Dey, G.K.; Chatterjee, A.; Vasudevan, V.K. Microstructural evolution in niobium—Based alloys. Metall. Mater. Trans. A 2008, 39, 1506–1518. [Google Scholar] [CrossRef]
- Grammenos, I.; Tsakiropoulos, P. Study of the role of Mo and Ta additions in the microstructure of Nb-18Si-5Hf silicide based alloys. Intermetallics 2010, 18, 1524–1530. [Google Scholar] [CrossRef]
- Thandorn, T.; Tsakiropoulos, P. Study of the role of B addition on the microstructure of the Nb-24Ti-18Si-8B alloy. Intermetallics 2010, 18, 1033–1038. [Google Scholar] [CrossRef]
- Vellios, N.; Tsakiropoulos, P. Study of the role of Fe and Sn additions in the microstructure of Nb-24Ti-18Si-5Cr silicide based alloys. Intermetallics 2010, 18, 1729–1736. [Google Scholar] [CrossRef]
- Li, Z.; Tsakiropoulos, P. Study of the effect of Ti and Ge in the microstructure of Nb-24Ti-18Si-5Ge in situ composite. Intermetallics 2011, 19, 1291–1297. [Google Scholar] [CrossRef]
- Grammenos, I.; Tsakiropoulos, P. Study of the role of Hf, Mo and W additions in the microstructure of Nb-20Si silicide based alloys. Intermetallics 2011, 19, 1612–1621. [Google Scholar] [CrossRef]
- Nekkanti, R.M.; Dimiduk, D.M. Intermetallic Matrix Composites; Anton, D.L., McMeeking, R., Miracle, D., Martin, P., Eds.; Elsevier: Amsterdam, The Netherlands, 1990; Volume 194, pp. 175–192. [Google Scholar]
- Chan, K.S.; Davidson, D.L. Improving the fracture toughness of constituent phases and Nb-based in situ composites by a computational alloy design approach. Metall. Mater. Trans. A 2003, 34, 1833–1849. [Google Scholar] [CrossRef]
- Subramanian, P.R.; Parthasarathy, T.A.; Mendiratta, M.G.; Dimiduk, D.M. Compressive creep behaviour of Nb5Si3. Scr. Metall. Mater. 1995, 32, 1227–1232. [Google Scholar] [CrossRef]
- Chu, F.; Thoma, D.J.; McClellan, K.J.; Peralta, P. Mo5Si3 single crystals: Physical properties and mechanical behaviour. Mater. Sci. Eng. A 1999, 261, 44–52. [Google Scholar] [CrossRef]
- Rosenkranz, R.; Frommeyer, G.; Smarsly, W. Microstructure and properties of high melting point intermetallic Ti5Si3 and TiSi2 compounds. Mater. Sci. Eng. A 1992, 152, 288–292. [Google Scholar] [CrossRef]
- Min, K.S.; Ardell, A.J.; Eck, S.J.; Chen, F.C. A small specimen investigation of the fracture toughness of Ti5Si3. J. Mater. Sci. 1995, 30, 5479–5483. [Google Scholar] [CrossRef]
- Anton, D.L.; Shah, D.M. High temperature properties of refractory intermetallics. Mater Res. Soc. Symp. Proc. 1991, 213, 733–738. [Google Scholar] [CrossRef]
- Sadananda, K.; Feng, C.R.; Mitra, R.; Deevi, S.C. Creep and fatigue properties of high temperature silicides and their composites. Mater. Sci. Eng. 1999, A261, 223–238. [Google Scholar] [CrossRef]
- Mizutani, U. Hume-Rothery Rules for Structurally Complex Alloy Phases; CRS Press: Boca Raton, FL, USA, 2011. [Google Scholar]
- Mizutani, U.; Asahi, R.; Sato, H.; Noritake, T.; Takeuchi, T. Failure of the Hume-Rothery stabilization mechanism in the Ag5Li8 gamma-brass studied by first-principles FLAPW electronic structure calculations. J. Phys. Condens. Matter 2008, 20, 275228. [Google Scholar] [CrossRef] [PubMed]
- Geng, J.; Tsakiropoulos, P.; Shao, G. The effects of Ti and Mo additions on the microstructure of Nb-silicide based in situ composites. Intermetallics 2006, 14, 227–235. [Google Scholar] [CrossRef]
- Papadimitriou, I.; Utton, C.; Scott, A.; Tsakiropoulos, P. Ab initio study of the intermetallics in Nb-Si binary system. Intermetallics 2014, 54, 125–132. [Google Scholar] [CrossRef]
- Geng, J.; Tsakiropoulos, P.; Shao, G. A thermo-gravimetric and microstructural study of the oxidation of Nbss/Nb5Si3 - based in situ composites with Sn addition. Intermetallics 2007, 15, 270–281. [Google Scholar] [CrossRef]
- Vellios, N.; Tsakiropoulos, P. The role of Sn and Ti additions in the microstructure of Nb-18Si base alloys. Intermetallics 2007, 15, 1518–1528. [Google Scholar] [CrossRef]
- Li, Z.; Tsakiropoulos, P. Study of the effects of Ge addition on the microstructure of Nb-18Si in situ composites. Intermetallics 2010, 18, 1072–1078. [Google Scholar]
- Li, Z.; Tsakiropoulos, P. The microstructures of Nb-18Si-5Ge-5Al and Nb-24Ti-18Si-5Ge-5Al in situ composites. J. Alloys Compd. 2013, 550, 553–560. [Google Scholar] [CrossRef]
- Grammenos, I.; Tsakiropoulos, P. Study of the role of Al, Cr and Ti additions in the microstructure of Nb-18Si-5Hf base alloys. Intermetallics 2010, 18, 242–253. [Google Scholar] [CrossRef]
- Li, Z.; Tsakiropoulos, P. Study of the effect of Cr and Ti additions in the microstructure of Nb-18Si-5Ge based in situ composites. Intermetallics 2012, 26, 18–25. [Google Scholar] [CrossRef]
- Bewlay, B.P.; Braint, C.L.; Sylven, E.T.; Jackson, M.R.; Xiao, G. Creep Studies of Monolithic Phases in Nb-Silicide Based In-Situ Composites. Mater. Res. Soc. Symp. Proc. 2001, 646. [Google Scholar] [CrossRef]
- Zacharis, E.; Tsakiropoulos, P. University of Sheffield: Sheffield, UK, Unpublished Research. 2013.
- Thandorn, T.; Tsakiropoulos, P. University of Sheffield: Sheffield, UK, Unpublished Research. 2009.
- Tao, X.; Jund, P.; Colinet, C.; Tedenac, J. Phase stability and physical properties of Ta5Si3 compounds from first-principles calculations. Phys. Rev. B 2009, 80, 104103-1–104103-10. [Google Scholar] [CrossRef]
- Chen, Y.; Hammerschmidt, T.; Pettifor, D.G.; Shang, J.; Zhang, Y. Influence of vibrational entropy on structural stability of Nb-Si and Mo-Si systems at elevated temperatures. Acta Mater. 2009, 57, 2657–2664. [Google Scholar] [CrossRef]
- Shi, S.; Zhu, L.; Jia, L.; Zhang, H.; Sun, Z. Ab initio study of alloying effects on structure stability and mechanical properties of αNb5Si3. Comput. Mater. Sci. 2015, 108, 121–127. [Google Scholar] [CrossRef]
- Chen, X.; Niu, H.; Li, D.; Li, Y. Modelling hardness of polycrystalline materials and bulk metallic glasses. Intermetallics 2011, 19, 1275–1281. [Google Scholar] [CrossRef]
- Zhang, L.; Wu, J. Ti5Si3 and Ti5Si3 based alloys: Alloying behaviour, microstructure and mechanical property evaluation. Acta Mater. 1998, 46, 3535–3546. [Google Scholar] [CrossRef]
Figure 1.
Relationships between alloying elements in Nb5Si3. (a) Shows the relationship between Hf (at.%) and Nb (at.%) in Nb5Si3. (b–d) show the relationships respectively between Ge, Sn and B (at.%) and Ti (at.%) in Nb5Si3. In (b) the dark green diamonds are for alloys with Ge and Sn. In (c) and (d) the green diamonds are for alloys with B and with no Mo, respectively.
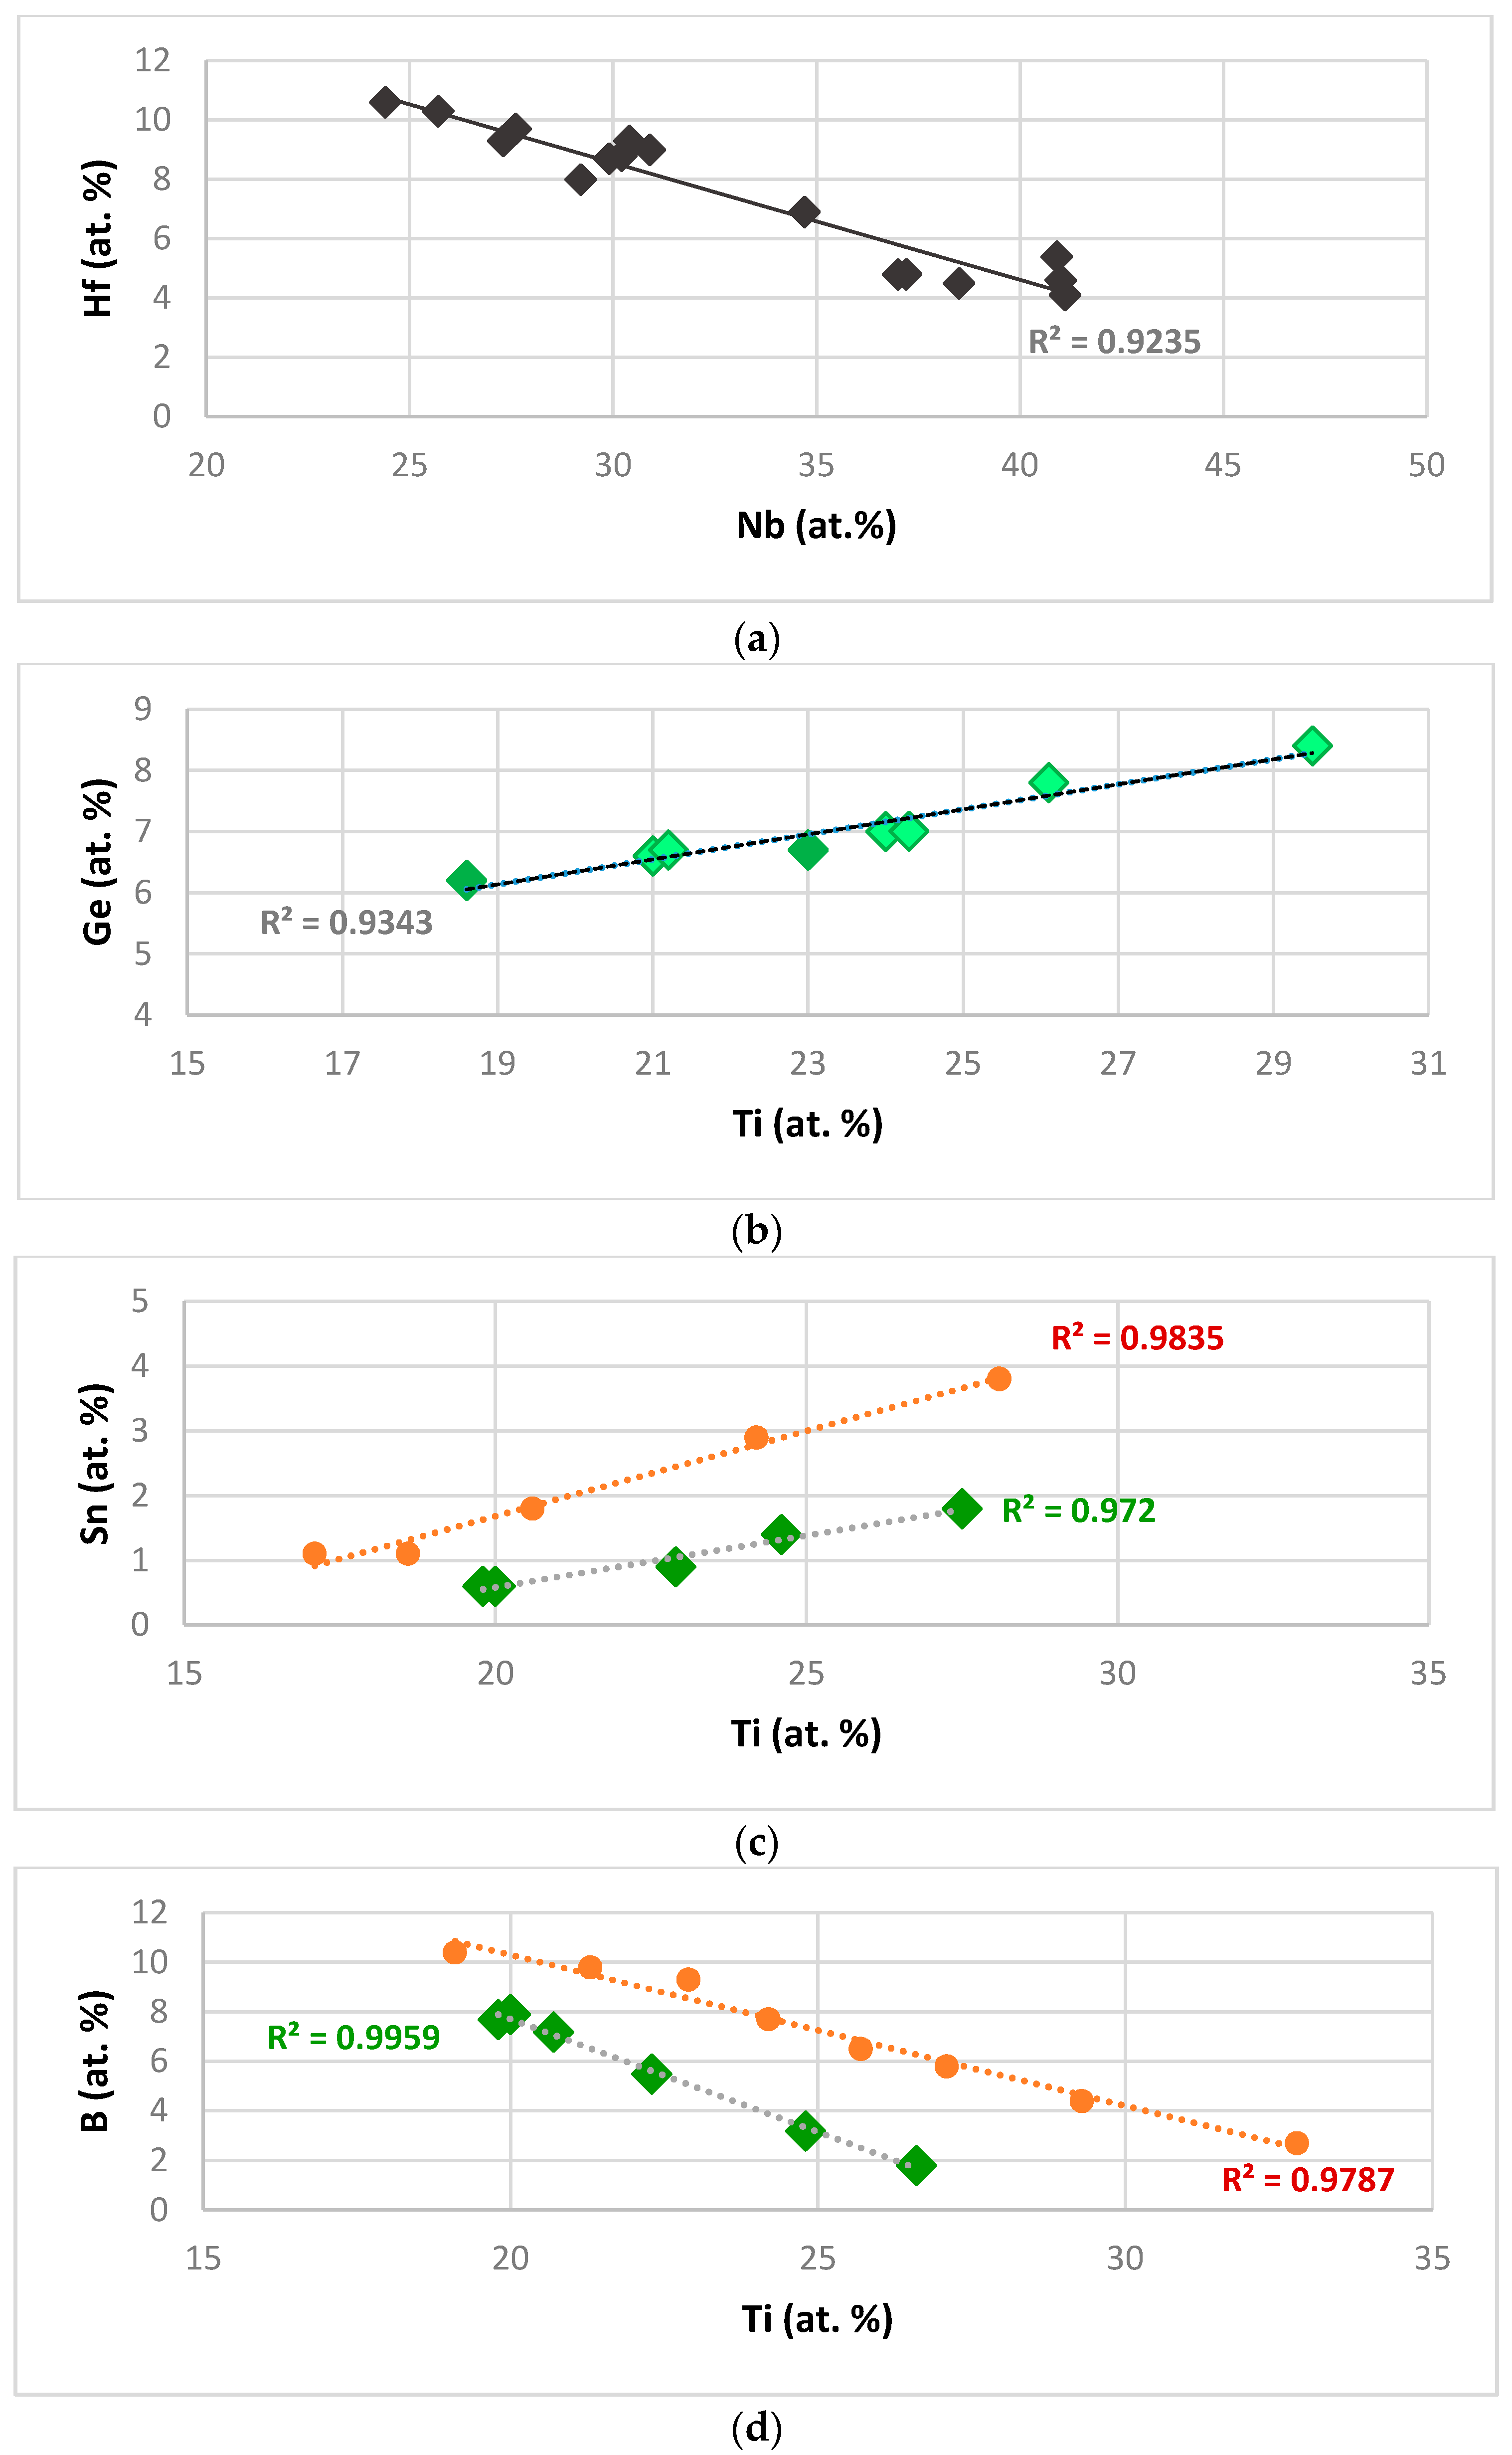
Figure 2.
Relationships between the silicide parameters VEC and Δχ and solute additions that substitute Si in Nb5Si3. (a) Shows the relationship between VEC and Sn (at.%) in Nb5Si3. The red diamonds are for alloys that contain Ge and the green diamonds for alloys that contain B—(b,c) show the relationships between Δχ and B (at.%) (b) or Ge (at.%) (c) in Nb5Si3. In (b) the light red diamonds are for alloys with B and Sn and in (c) the dark green diamonds are for alloys with Ge and Sn.

Figure 3.
Bar charts showing the average Vickers hardness (HV) of tetragonal Nb5Si3. The vertical dashed lines indicate the hardness of binary (unalloyed) Nb5Si3. In the parts (a), (b), (c) and (d) the data is from [44,45,50], [29,46], [45,51], [46,47], respectively.
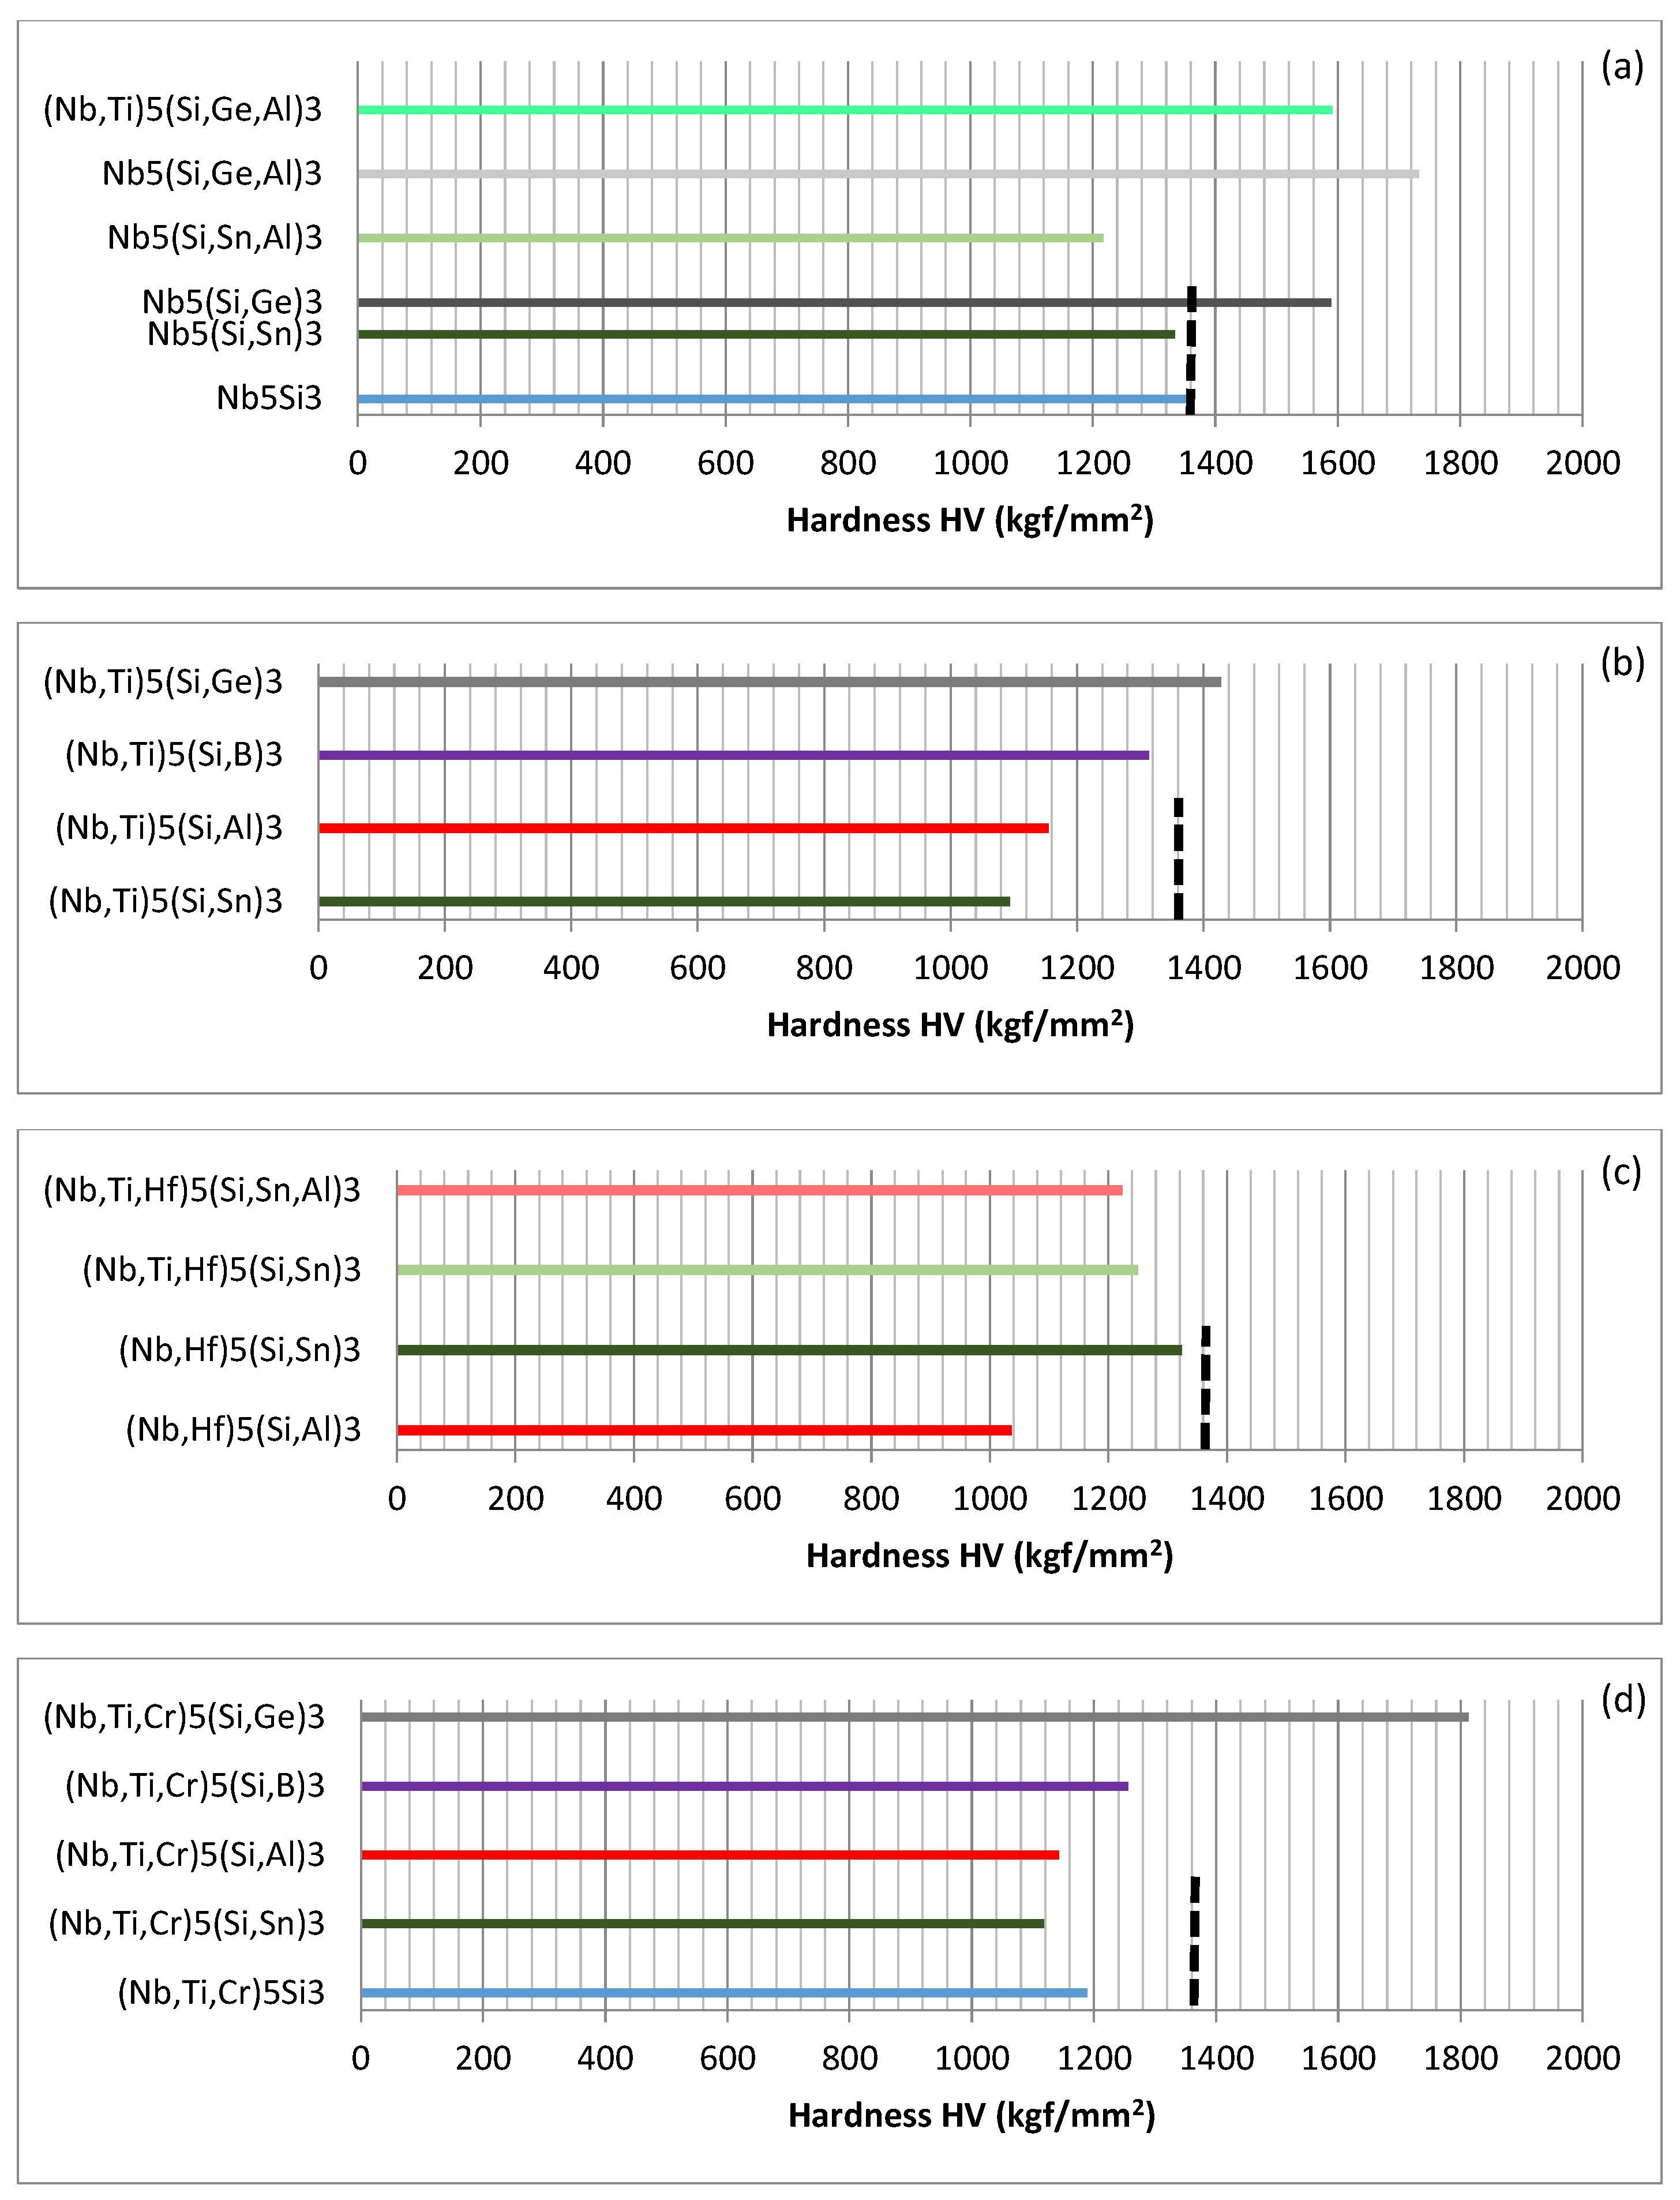
Figure 4.
Vickers hardness of tetragonal Nb5Si3 versus silicide parameter VEC in alloyed Nb5Si3 with Ge but with no B, Sn, Mo, Ta or W. The data is represented by filled circles. The data shown in red colour is for Nb5(Si,Ge)3, (Nb,Cr)5(Si,Ge)3, Nb5(Si,Ge,Al)3, the data shown in green colour is for (Nb,Ti)5(Si,Ge)3, the data shown in purple colour is for Nb5Si3 alloyed with Ge and with Ti + Cr (i.e., (Nb,Ti,Cr)5(Si,Ge)3) or with Ti + Al and the data shown in blue colour is for Nb5Si3 alloyed with Ge and with Ti + Al + Cr or with Ti + Hf + Al + Cr. For areas A, B, C, the rectangle C1 and the triangle C2 see text.

Figure 5.
Δχ versus VEC map of all studied Nb5Si3 that shows the effect of the substitution of Nb by Ti and Cr and Si by Al, B, Sn or Ge on the position of the silicide in the map. The unalloyed Nb5Si3 (T1) and the Nb5(Si,B)3 (T2) silicides are shown respectively by the purple and green squares. The symbol Π is for the (Nb,Ti)5Si3. Silicides where Si is substituted by B, Ge and Sn are shown by dark green, dark gold and dark red diamonds, respectively. Silicides where Si is substituted by Al and B or Ge or Sn are shown by lighter green, lighter gold and lighter red diamonds, respectively. Silicides that do not contain B or Ge or Sn are shown by dark blue diamonds. Silicides where Si is substituted by Al but not B, Ge or Sn are shown by lighter blue diamonds. For inset see Figure 6. For the data represented by Π and Π’ see text.

Figure 6.
Δχ versus VEC map of Nb5Si3 that shows the effect of the substitution of Si by Sn or Ge on the position of the silicide in the map. The Nb5Si3 (T1), Nb5(Si,Sn)3 and Nb5(Si,Ge)3 are shown respectively by purple square and by red and gold diamonds.
Figure 6.
Δχ versus VEC map of Nb5Si3 that shows the effect of the substitution of Si by Sn or Ge on the position of the silicide in the map. The Nb5Si3 (T1), Nb5(Si,Sn)3 and Nb5(Si,Ge)3 are shown respectively by purple square and by red and gold diamonds.
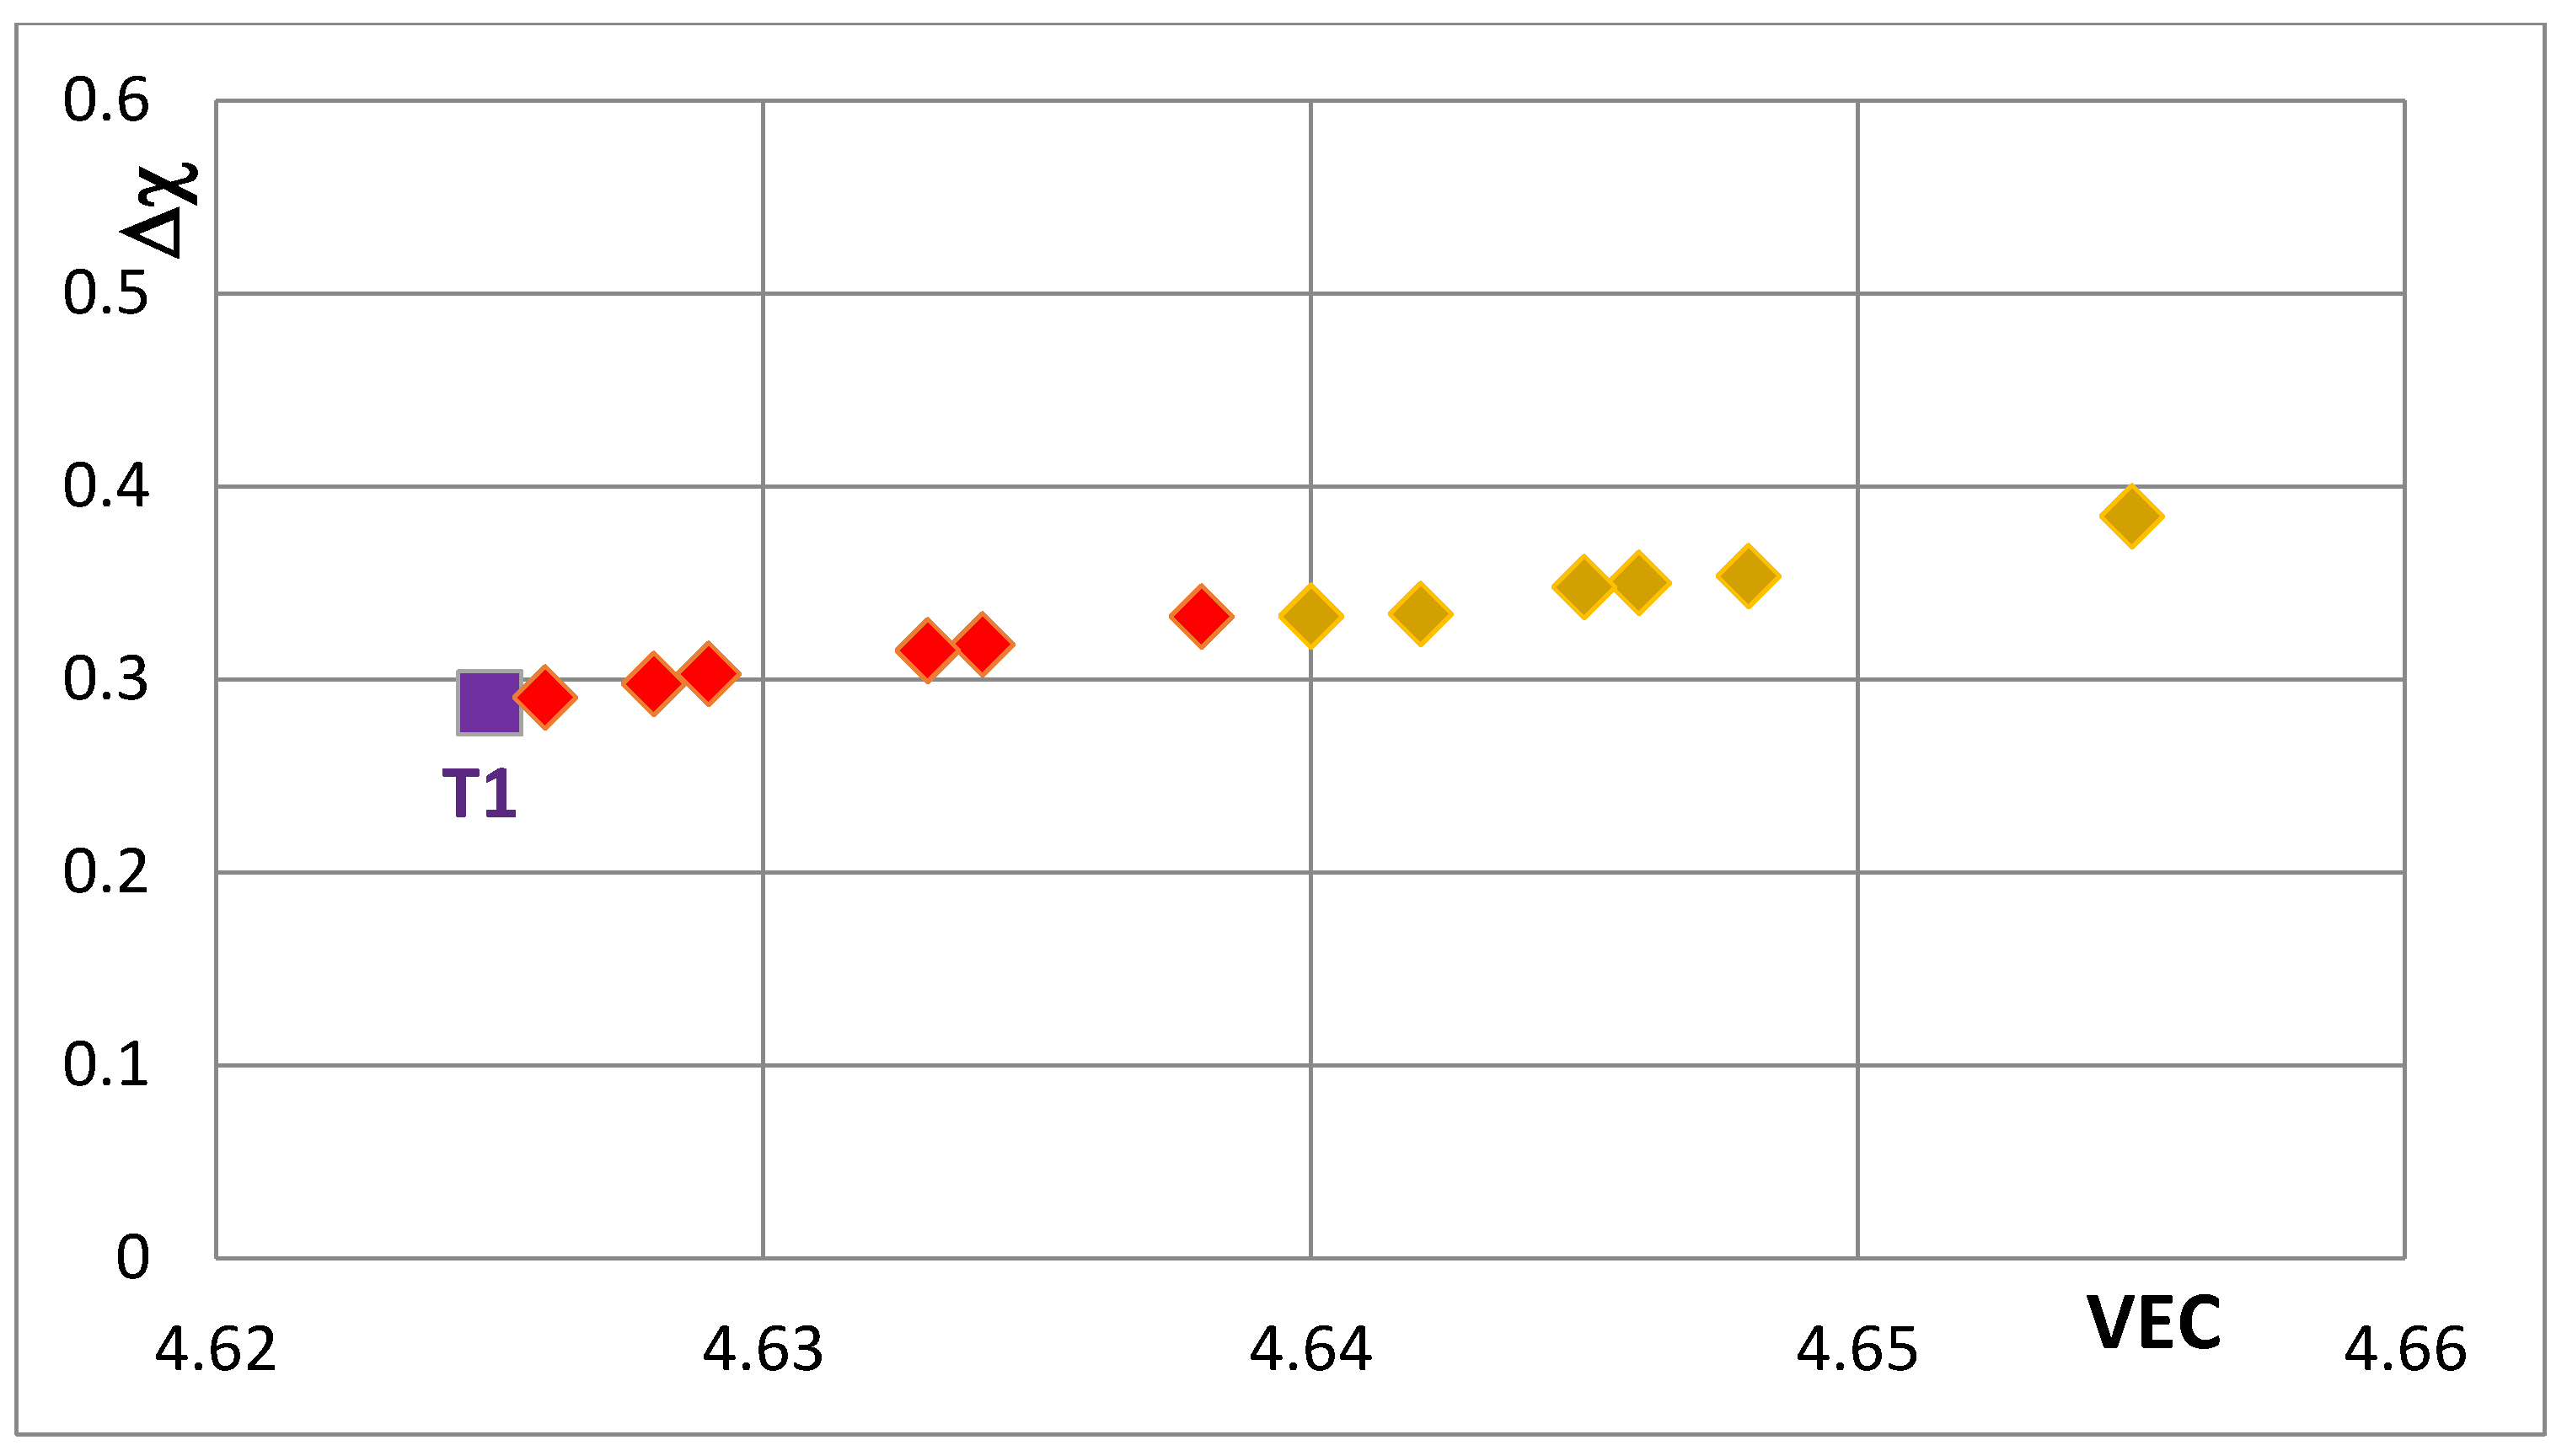
Figure 7.
Δχ versus VEC map of unalloyed and alloyed Nb5Si3, where T1 = Nb5Si3, Π = (Nb,Ti)5Si3, T2 = Nb5(Si,B)3, T2 alloyed2 = (Nb,Ti,Cr,Hf)5(Si,Al,B)3, area B = (Nb,Ti,Cr)5(Si,Al)3, area C = (Nb,Ti,Cr)5(Si,Al,Ge)3, area D = (Nb,Ti,Cr)5(Si,Al,Sn)3 and area E = (Nb,Ti,Cr)5(Si,Al,B)3. The data is from KZ5 type alloys with nominal compositions Nb-24Ti-18Si-5Al-5Cr + 5X, where X = B, Ge, Sn. Average positions in areas B to E are indicated by data point closest to letter (see text). For the compositions of Π, T2 and T2 alloyed2 see text.

Figure 8.
Δχ versus VEC map of unalloyed and alloyed Nb5Si3 that shows the effect of the substitution of Nb by Hf (and Ti and Cr), where T1 = Nb5Si3, Π = (Nb,Ti)5Si3, T2 = Nb5(Si,B)3, area B = (Nb,Ti,Cr)5(Si,Al)3, area C = (Nb,Ti,Cr,Hf)5(Si,Al,Ge)3, area D = (Nb,Ti,Cr,Hf)5(Si,Al,Sn)3, area E = (Nb,Ti,Cr,Hf)5(Si,Al,B)3 and area F = (Nb,Ti,Cr,Hf)5(Si,Al)3. The data is from KZ5 type alloys with nominal compositions Nb-24Ti-18Si-5Al-5Cr + 5Hf + 5X, where X = B, Ge, Sn. Average positions in areas B to F are indicated by data point closest to letter (see text). For compositions of Π, T2 and T2 alloyed1 andT2 alloyed2 see text.

Figure 9.
Δχ versus VEC map of unalloyed and alloyed Nb5Si3 that shows the effect of the substitution of Nb by a transition metal or refractory metal addition, where T1 = Nb5Si3, area B = (Nb,Ti,Cr)5(Si,Al)3, area F = (Nb,Ti,Cr,Hf)5(Si,Al)3, area G = (Nb,Ti,Cr,Mo)5(Si,Al)3 and area H = (Nb,Ti,Cr,Ta)5(Si,Al)3. The data is from KZ5 type alloys with nominal compositions Nb-24Ti-18Si-5Al-5Cr + 5X, where X = Hf, Mo, Ta. Average positions in areas B and F to H are indicated by data point closest to letter (see text).
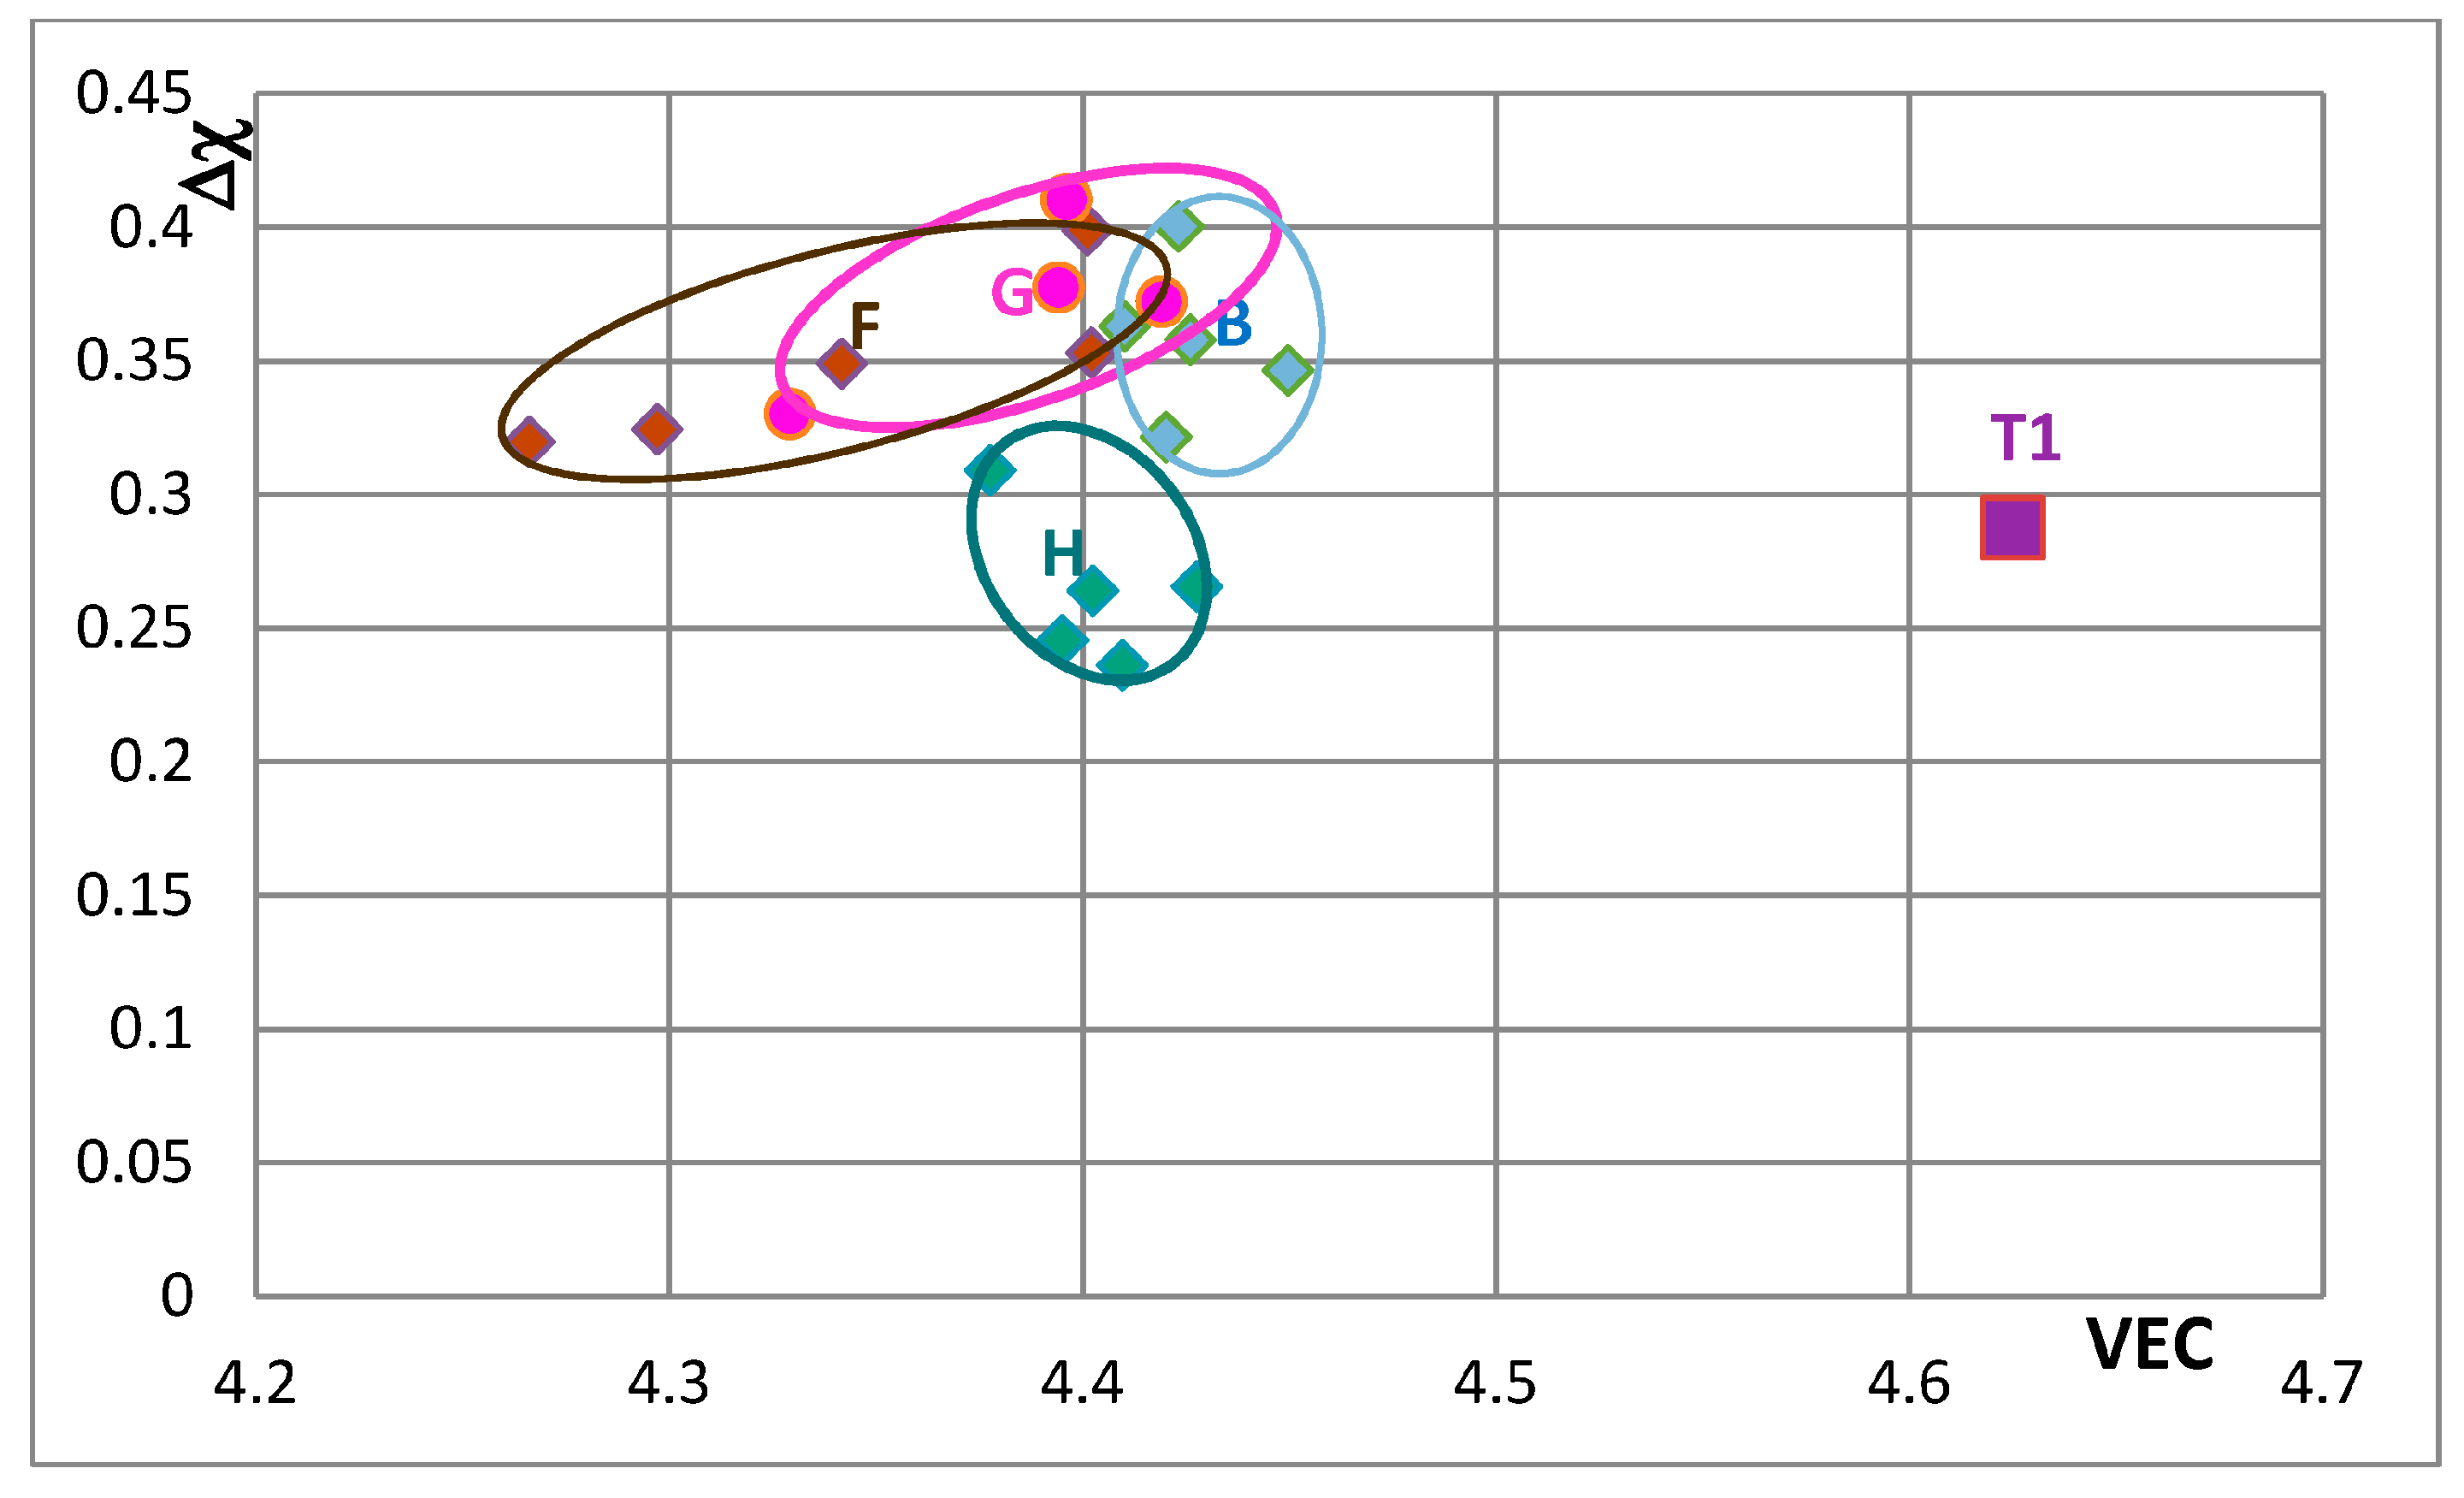
Figure 10.
Δχ versus VEC map of unalloyed and alloyed Nb5Si3 that shows the effect of the substitution of Nb by a transition metal or refractory metal addition, where T1 = Nb5Si3, T2 = Nb5(Si,B)3, area B = (Nb,Ti,Cr)5(Si,Al)3, area F = (Nb,Ti,Cr,Hf)5(Si,Al,B)3, area G = (Nb,Ti,Cr,Mo)5(Si,Al,B)3, area H = (Nb,Ti,Cr,Ta)5(Si,Al,B)3 and area J = (Nb,Ti,Cr)5(Si,Al,B,Sn)3. The data is from KZ5 type alloys with nominal compositions Nb-24Ti-18Si-5Al-5Cr + 5X, where X = Hf, Mo, Ta, Sn. Average positions in areas B and F to J are indicated by data point closest to letter (see text).

Figure 11.
Δχ versus VEC map of unalloyed and alloyed Nb5Si3 to show the “direction of change” of the position of the silicide in the map with alloying. T1 is Nb5Si3 and the areas B and I have data for (Nb,Ti,Cr)5(Si,Al)3 and (Nb,Ti,Cr)5(Si,Al,Ge,Sn)3, respectively. The data is from KZ5 type alloys with nominal compositions Nb-24Ti-18Si-5Al-5Cr + X, where X = 5Ge + 5Sn. Average positions in areas B and F to H are indicated by data point closest to letter (see text). For arrows see text.
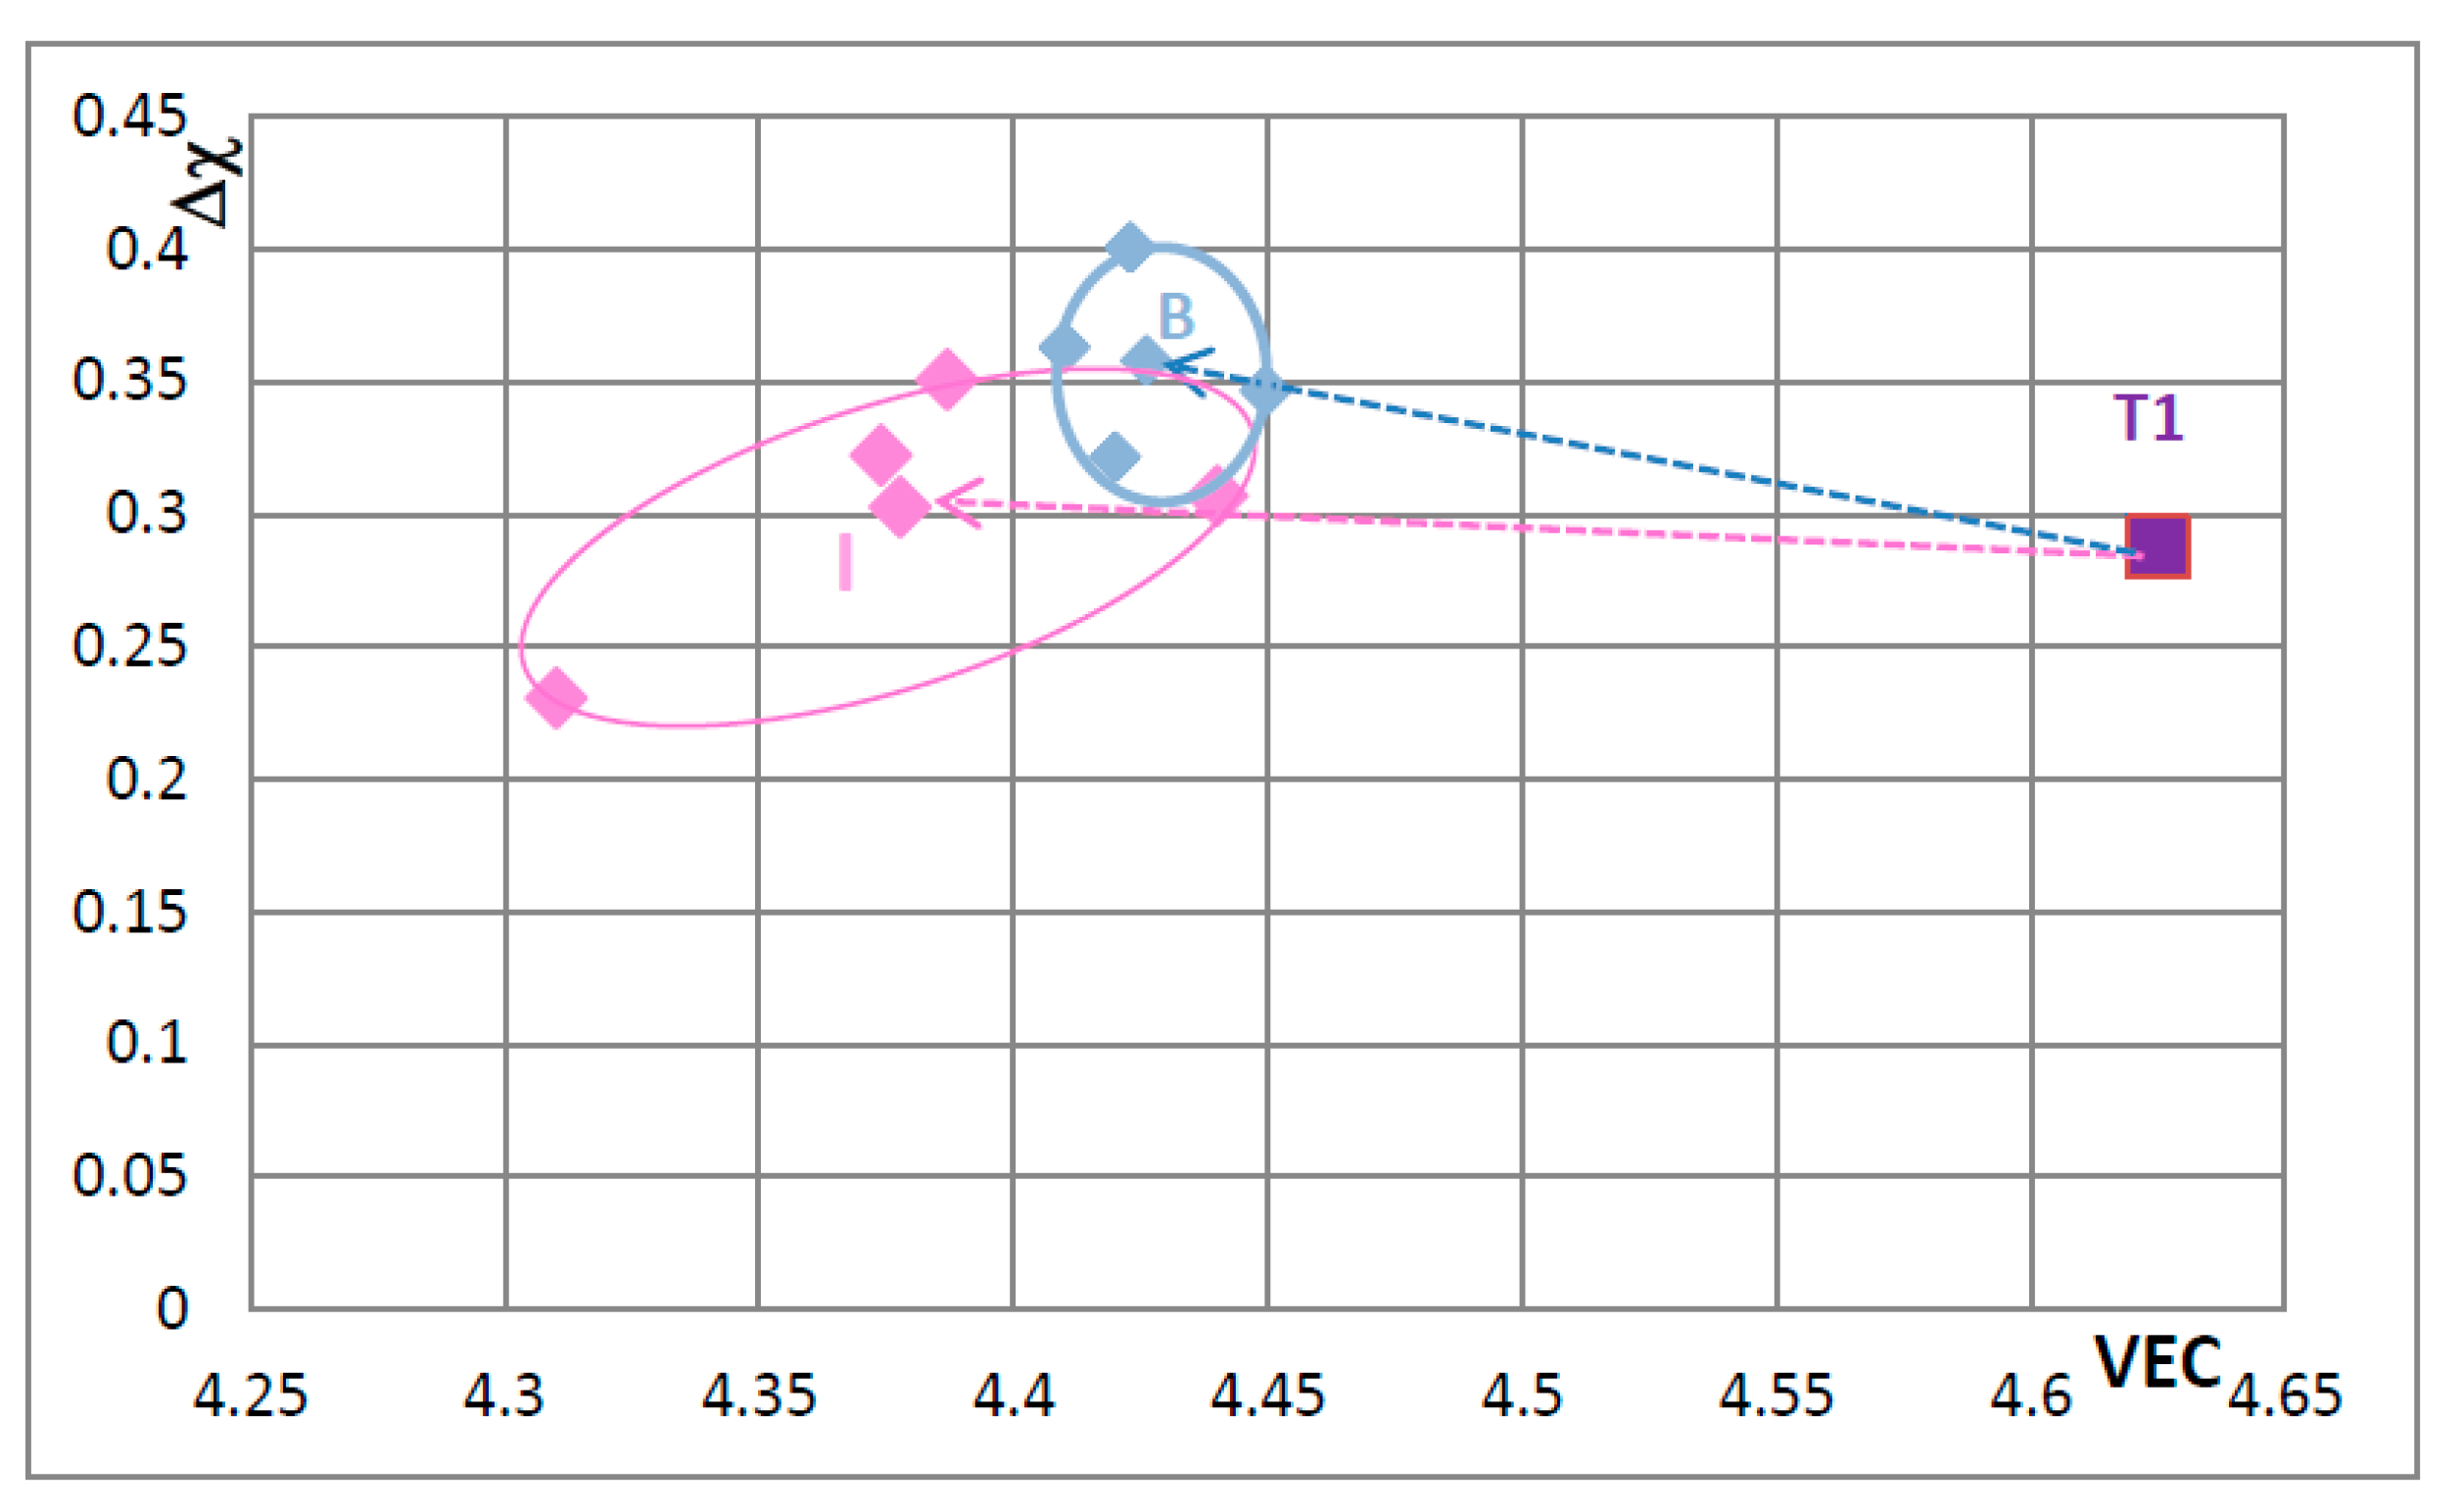
Figure 12.
Norton plot for 1473 K to show creep rate (s−1) versus stress σ (MPa) for tetragonal (a) αNb5Si3 [34]; (b) αNb5Si3 [50] and (c–e) alloyed Nb5Si3. (c) is for Π = (Nb,Ti)5Si3 (see text) (d) is for T2 alloyed1 = (Nb,Ti,Cr,Hf)5(Si,Al,B)3 (see text) and (e) is for T2 alloyed2 = (Nb,Ti,Cr,Hf)5(Si,Al,B)3 (see text) [50]. The alloyed T2 is indicated in the maps in Figure 7 and Figure 8. The Π = (Nb,Ti)5Si3 is indicated in the maps in Figure 5, Figure 7 and Figure 8. The unalloyed Nb5Si3 in (a,b) corresponds to T1 in Figure 5, Figure 6, Figure 7, Figure 8, Figure 9, Figure 10 and Figure 11.

Table 1.
Experimental and calculated data for the CTE anisotropy [(CTE)c/(CTE)a] of binary and alloyed TM5Si3 silicides.
Table 1.
Experimental and calculated data for the CTE anisotropy [(CTE)c/(CTE)a] of binary and alloyed TM5Si3 silicides.
| Silicide | Experimental | Calculated | Reference |
|---|---|---|---|
| Ti5Si3 | 4.39 | - | [8] |
| 3.51 | - | [7] | |
| 3 | - | [9] | |
| 2.7 | - | [10,11] | |
| 1.68 | - | [12] | |
| W5Si3 | 3.3 | - | [13] |
| Mo5Si3 | 2.21 | - | [14] |
| 2 | - | [15] | |
| Zr5Si3 | 3.18 | - | [10] |
| 2.79 | - | [10] | |
| 1.91 | - | [12] | |
| Ta5Si3 | 1.45 | - | [7] |
| V5Si3 | 1.3 | - | [16] |
| αNb5Si3 | 1.43 | - | [8] |
| 1.25 | - | [15] | |
| 1.19 | - | [17] | |
| - | 1.12 | [18] | |
| - | 1.28 | [19] | |
| βNb5Si3 | - | 2.07 | [18] |
| - | 1.52 | [19] | |
| α(Nb50Ti12.5)Si37.5 | - | 1.25 | [19] |
| β(Nb50Ti12.5)Si37.5 | - | 1.64 | [19] |
| (Ti,Zr)5Si3 | 1.22 | - | [15] |
| (Mo,Nb)5Si3 | 1.25 | - | [15] |
Table 2.
Solubility range of X (=Al + B + Ge + Si + Sn) in unalloyed and alloyed tetragonal Nb5Si3 in Nb-38Si binary and KZ5 type alloys * (see text and corresponding Δχ and VEC values of the silicide).
Table 2.
Solubility range of X (=Al + B + Ge + Si + Sn) in unalloyed and alloyed tetragonal Nb5Si3 in Nb-38Si binary and KZ5 type alloys * (see text and corresponding Δχ and VEC values of the silicide).
| Alloy * | Solubility Range of X in Nb5Si3 (at.%) | Δχ | VEC | ||
|---|---|---|---|---|---|
| AC+ | HT+ | AC | HT | ||
| Nb-38Si | 37.5–40.5 | 0.288 | 0.183 | 4.63 | 4.6 |
| KZ5 | 35.3–36.4 | 0.363 | 0.322 | 4.41 | 4.42 |
| KZ5 + 6Ta (=KZ6) | 36.7–38.7 | 0.309 | 0.236 | 4.38 | 4.41 |
| KZ5 + 5B (=TT4) | 36.7–39.0 | 0.303 | 0.224 | 4.27 | 4.31 |
| KZ5 + 6Ta + 5B (=TT5) | 35.3–39.4 | 0.351 | 0.199 | 4.28 | 4.31 |
| KZ5 + 5Hf (=JN1) | 33.9–35.6 | 0.339 | 0.32 | 4.40 | 4.27 |
| KZ5 + 5Ge (=ZF6) | 33.6–34.3 | 0.415 | 0.39 | 4.38 | 4.42 |
| KZ5 + 5Hf + 5Ge (=ZF9) | 34.7–35.8 | 0.362 | 0.328 | 4.38 | 4.35 |
| KZ5 + 5Hf + 5B (=TT7) | 34.6–40.9 | 0.351 | 0.128 | 4.23 | 4.17 |
| KZ5 + 5Sn (=ZX8) | 34.7–36.9 | 0.38 | 0.302 | 4.37 | 4.45 |
| KZ5 + 5Sn + 5Hf (=EZ8) | 36.7–38.1 | 0.299 | 0.231 | 4.4 | 4.23 |
| KZ5 + 5Sn + 5B (=TT6) | 38.3–41.6 | 0.245 | 0.111 | 4.25 | 4.17 |
| KZ5 + 5Sn + 5Ge (=OHS1) | 35.5–38.8 | 0.351 | 0.23 | 4.39 | 4.31 |
| KZ5 + 5Mo (=JG2) | 34.1–36.2 | 0.410 | 0.330 | 4.40 | 4.33 |
| KZ5 + 5Mo + 5B (=TT8) | 37.3–41.4 | 0.289 | 0.103 | 4.36 | 4.11 |
AC+ = as cast, HT = heat treated. * Nominal alloy compositions (at.%): KZ5 = Nb-24Ti-18Si-5Al-Cr. ZF9 = Nb-24Ti-18Si-5Al-Cr-5Hf-5Ge; KZ6 = Nb-24Ti-18Si-5Al-Cr-6Ta. TT8 = Nb-24Ti-18Si-5Al-Cr-5Mo-5B; JN1 = Nb-24Ti-18Si-5Al-Cr-5Hf. TT6 = Nb-24Ti-18Si-5Al-Cr-5Sn-5B; ZF6 = Nb-24Ti-18Si-5Al-Cr-5Ge. TT7 = Nb-24Ti-18Si-5Al-Cr-5Hf-5B; TT4 = Nb-24Ti-18Si-5Al-Cr-5B. TT5 = Nb-24Ti-18Si-5Al-Cr-6Ta-5B; JG2 = Nb-24Ti-18Si-5Al-Cr-5Mo. OHS1= Nb-24Ti-18Si-5Al-Cr-5Ge-5Sn; ZX8 = Nb-24Ti-18Si-5Al-Cr-5Sn. EZ8 = Nb-24Ti-18Si-5Al-Cr-5Hf-5Sn.
Table 3.
Calculated elastic moduli of TM5Si3 silicides and Nb5Si3 alloyed with Ti.
| 5-3 Silicide | E (GPa) | Reference |
|---|---|---|
| W5Si3 | 312 | [52] |
| Mo5Si3 | 323 | [52] |
| αTa5Si3 | 327.5 | [52] |
| βTa5Si3 | 288.6 | [52] |
| αNb5Si3 | 291 | [42] |
| 314.3 | [53] | |
| 325 | [54] | |
| βNb5Si3 | 268.9 | [42] |
| 276.9 | [53] | |
| Alloyed Nb5Si3 | - | - |
| α(Nb50Ti12.5)Si37.5 | 313.8 | [19] |
| β(Nb50Ti12.5)Si37.5 | 238.5 | [19] |
Table 4.
Vickers hardness HV (kgf/mm2) of unalloyed Nb5Si3 and alloyed (Nb,Ti)5Si3 (Ti = 12.5 at.%) and unalloyed Ti5Si3. The HV *, HV+ and HVC were calculated in GPa using HV* = (1 − 2ν)E/[6(1 + ν)], HV+ = 2[(G/B)2 G]0.585 − 3 and HVC = 0.151 G [55] and the data for B, E, G and ν from [19,42] and were converted to Vickers hardness *.
| 5-3 Silicide | HV * | HV+ | HVC | HVmeasured |
|---|---|---|---|---|
| αNb5Si3 | 2018 | 1558 | 1800 | - |
| α(Nb,Ti)5Si3 | 2460 | 1964 | 1983 | - |
| βNb5Si3 | 1708 | 1286 | 1640 | 1360 |
| β(Nb,Ti)5Si3 | 1386 | 1023 | 1435 | - |
| Ti5Si3 | 1590 | 1368 | 1365 | 1154 |
* To convert HV to GPa multiply by 0.009807.
© 2018 by the author. Licensee MDPI, Basel, Switzerland. This article is an open access article distributed under the terms and conditions of the Creative Commons Attribution (CC BY) license (http://creativecommons.org/licenses/by/4.0/).
Share and Cite
MDPI and ACS Style
Tsakiropoulos, P. On the Alloying and Properties of Tetragonal Nb5Si3 in Nb-Silicide Based Alloys. Materials 2018, 11, 69. https://doi.org/10.3390/ma11010069
AMA Style
Tsakiropoulos P. On the Alloying and Properties of Tetragonal Nb5Si3 in Nb-Silicide Based Alloys. Materials. 2018; 11(1):69. https://doi.org/10.3390/ma11010069
Chicago/Turabian StyleTsakiropoulos, Panos. 2018. "On the Alloying and Properties of Tetragonal Nb5Si3 in Nb-Silicide Based Alloys" Materials 11, no. 1: 69. https://doi.org/10.3390/ma11010069
Note that from the first issue of 2016, this journal uses article numbers instead of page numbers. See further details here.