Article

Influence of PEG Stoichiometry on Structure-Tuned Formation of Self-Assembled Submicron Nickel Particles

1
State Key Laboratory of Electronic Thin Film and Integrated Devices, School of Materials and Energy, University of Electronic Science and Technology of China, Chengdu 610054, China
2
School of Architecture and Urban Planning, Shandong Jianzhu University, Jinan 250101, China
*
Authors to whom correspondence should be addressed.
Materials 2018, 11(2), 222; https://doi.org/10.3390/ma11020222
Submission received: 2 January 2018 / Revised: 29 January 2018 / Accepted: 29 January 2018 / Published: 31 January 2018
(This article belongs to the Special Issue Advanced Functional Nanomaterials and Their Applications)

Abstract

:
Self-assembled submicron nickel particles were successfully synthesized via the one-step surfactant-assisted solvothermal method. The impact of surfactant and reducing agent stoichiometry is investigated in this manuscript. Different morphologies and structures of Ni particles, including flower-like nanoflakes, hydrangea-like structures, chain structures, sphere-like structures, and hollow structures were prepared through different processing conditions with two parameters such as temperature and time. Based on scanning electron microscopy (SEM), X-ray diffraction (XRD), thermal gravimetric analysis (TGA) and vibrating sample magnetometry (VSM), the submicron nickel particles show good saturation magnetization and excellent thermal stabilities with a possible growth mechanism for the variety of the structure-tuned formation. Importantly, the microwave absorption properties of the submicron nickel particles were studied. The lowest reflection loss of Ni-P9/T200/H15 with a thin layer thickness of 1.7 mm can reach −42.6 dB at 17.3 GHz.

1. Introduction

Over the past few decades, the development of nanostructured materials has attracted substantial attention for many technological applications on account of their unique magnetic, optical, electrical, and catalytic properties [1,2,3]. Among them, metal nanomaterials are extremely attractive due to the possibility of controlling their multifunctionality and novel properties during synthesis [4]. Specifically, many research hotspots have been focused on the morphology-controlled synthesis of nickel (Ni) nanomaterials, since it is a necessary condition for achieving the objectives of nanoscience and nanotechnology [5]. As one of the nanostructured magnetic materials, Ni nanomaterials have been the focus of significant interests for researchers and display many characteristics such as chemical stability, large surface energy, and high surface area [6,7,8]. They are widely applied in a great many technological fields such as super capacitors, information storage, biotechnology and environmental protection [9,10,11]. Furthermore, Ni nanoparticles have attracted wide interests for their intriguing magnetic, catalytic, and microwave-absorbing properties under magnetic fields because of the abundance of Ni compared to other metals, which inspires researches on size and shape control of tunable nanostructures for many applications.
It is well known that the properties of nanoparticles are affected by their surface morphologies, crystal structures and dimensions. Different applications require different performances. Thus, it is important to study the properties of Ni nanoparticles using different process routes [12,13]. However, numerous successful chemical and physical methods have been used to fabricate the desired Ni architectures such as sonochemical synthesis, electrodeposition, electrochemical corrosion, and thermal decomposition [14,15,16,17]. These techniques usually involve the addition of various reducing agents, solvents, surfactants under complicated reaction conditions [18]. Therefore, many efforts have been directed toward using a facile and well-reproducible route to synthesize size- and shape-controlled Ni nanoparticles.
In previous work [19], we have reported a simple but effective one-step solvothermal method for the synthesis of pure nickel with different structures, such as flower-like Ni nanoflakes, hollow micrometer-sized Ni spheres/tubes. In this work, in order to further investigate the influence of poly (ethylene glycol) (PEG) stoichiometry on structure-tuned formation of Ni hierarchical architectures, we investigate the activity and selectivity of single PEG agent in the same one-step solvothermal method. At the same time, the structures and morphologies of the resultant Ni nanoparticles were characterized. We also find that their thermal and magnetic properties could be tuned by adjusting the main reaction parameters. The possible formation mechanism of Ni hierarchical architectures was also discussed. More importantly, we synthesized Ni metal nanoparticles with excellent microwave absorption properties in a simple, green and low-cost way, which performed superior microwave absorption with the lowest reflection loss of −42.6 dB at 17.3 GHz.

2. Experiment

2.1. Materials

Nickel chloride hexahydrate (NiCl2·6H2O, 99%), poly (ethylene glycol) (PEG, Mn  =  600, 99%), ethylene glycol (HOCH2CH2OH, EG, 99%), and anhydrous sodium acetate (CH3COONa, 99%) were supplied by Chengdu Kelong Chemicals Co. Ltd., Chengdu, China. All the chemicals were analytical purity and used without any further purification.

2.2. Synthesis of Nickel Submicron Particles

A series of nickel nanoparticles were synthesized via a solvothermal method according to the previous work with slightly modification [19]. Typically, NiCl2·6H2O (2.97 g) and NaAc (9.0 g) were placed into 80 mL of EG solution in a three-neck flask, then adding a designed stoichiometry of PEG (e.g., 1.5 g). The mixtures were then stirred vigorously in an ultrasonic bath for 1 h at 60 °C that formed a light green solution. Then, the 80 mL above-mentioned solutions were sealed in a 100 mL Teflon-lined stainless-steel high-pressure autoclave, and maintained at 200 °C for 15 h. After natural cooling to room temperature, the products were washed several times with deionized water and alcohol, successively, and finally dried in a vacuum at 60 °C for 24 h. At last, the prepared Ni nanoparticles was termed as Ni-P1.5/T200/H15. Meanwhile, other Ni nanoparticles were prepared by adjusting the stoichiometry of PEG, solvothermal reaction temperatures and reaction times, which mark Ni-Px/Ty/Hz (x means the weight of PEG, y is the reaction temperature and z represents reaction time). The detailed reaction parameters of the nickel nanoparticles are described in Table 1.

2.3. Characterization

The sizes and morphologies of the samples were observed by a JSM-6490LV scanning electron microscopy (SEM, JEOL, Tokyo, Japan). A Rigaku RINT2400 X-ray diffractometer used to analyze the phases of the samples (XRD, Rigaku, Tokyo, Japan). Thermal gravimetric analysis was performed in a TA Instruments Q50 (TGA, TA Instruments, New Castle, DE, USA). The magnetic properties of the nickel nanoparticles were measured by an IBHV-525 vibrating sample magnetometer (VSM, Riken Denshi, Tokyo, Japan). The microwave electromagnetic properties were investigated using a vector network analyzer (Agilent 8720ET, Agilent Technologies Inc., Santa Clara, CA, USA) in the frequency range of 0.5–18.0 GHz.

3. Results and Discussion

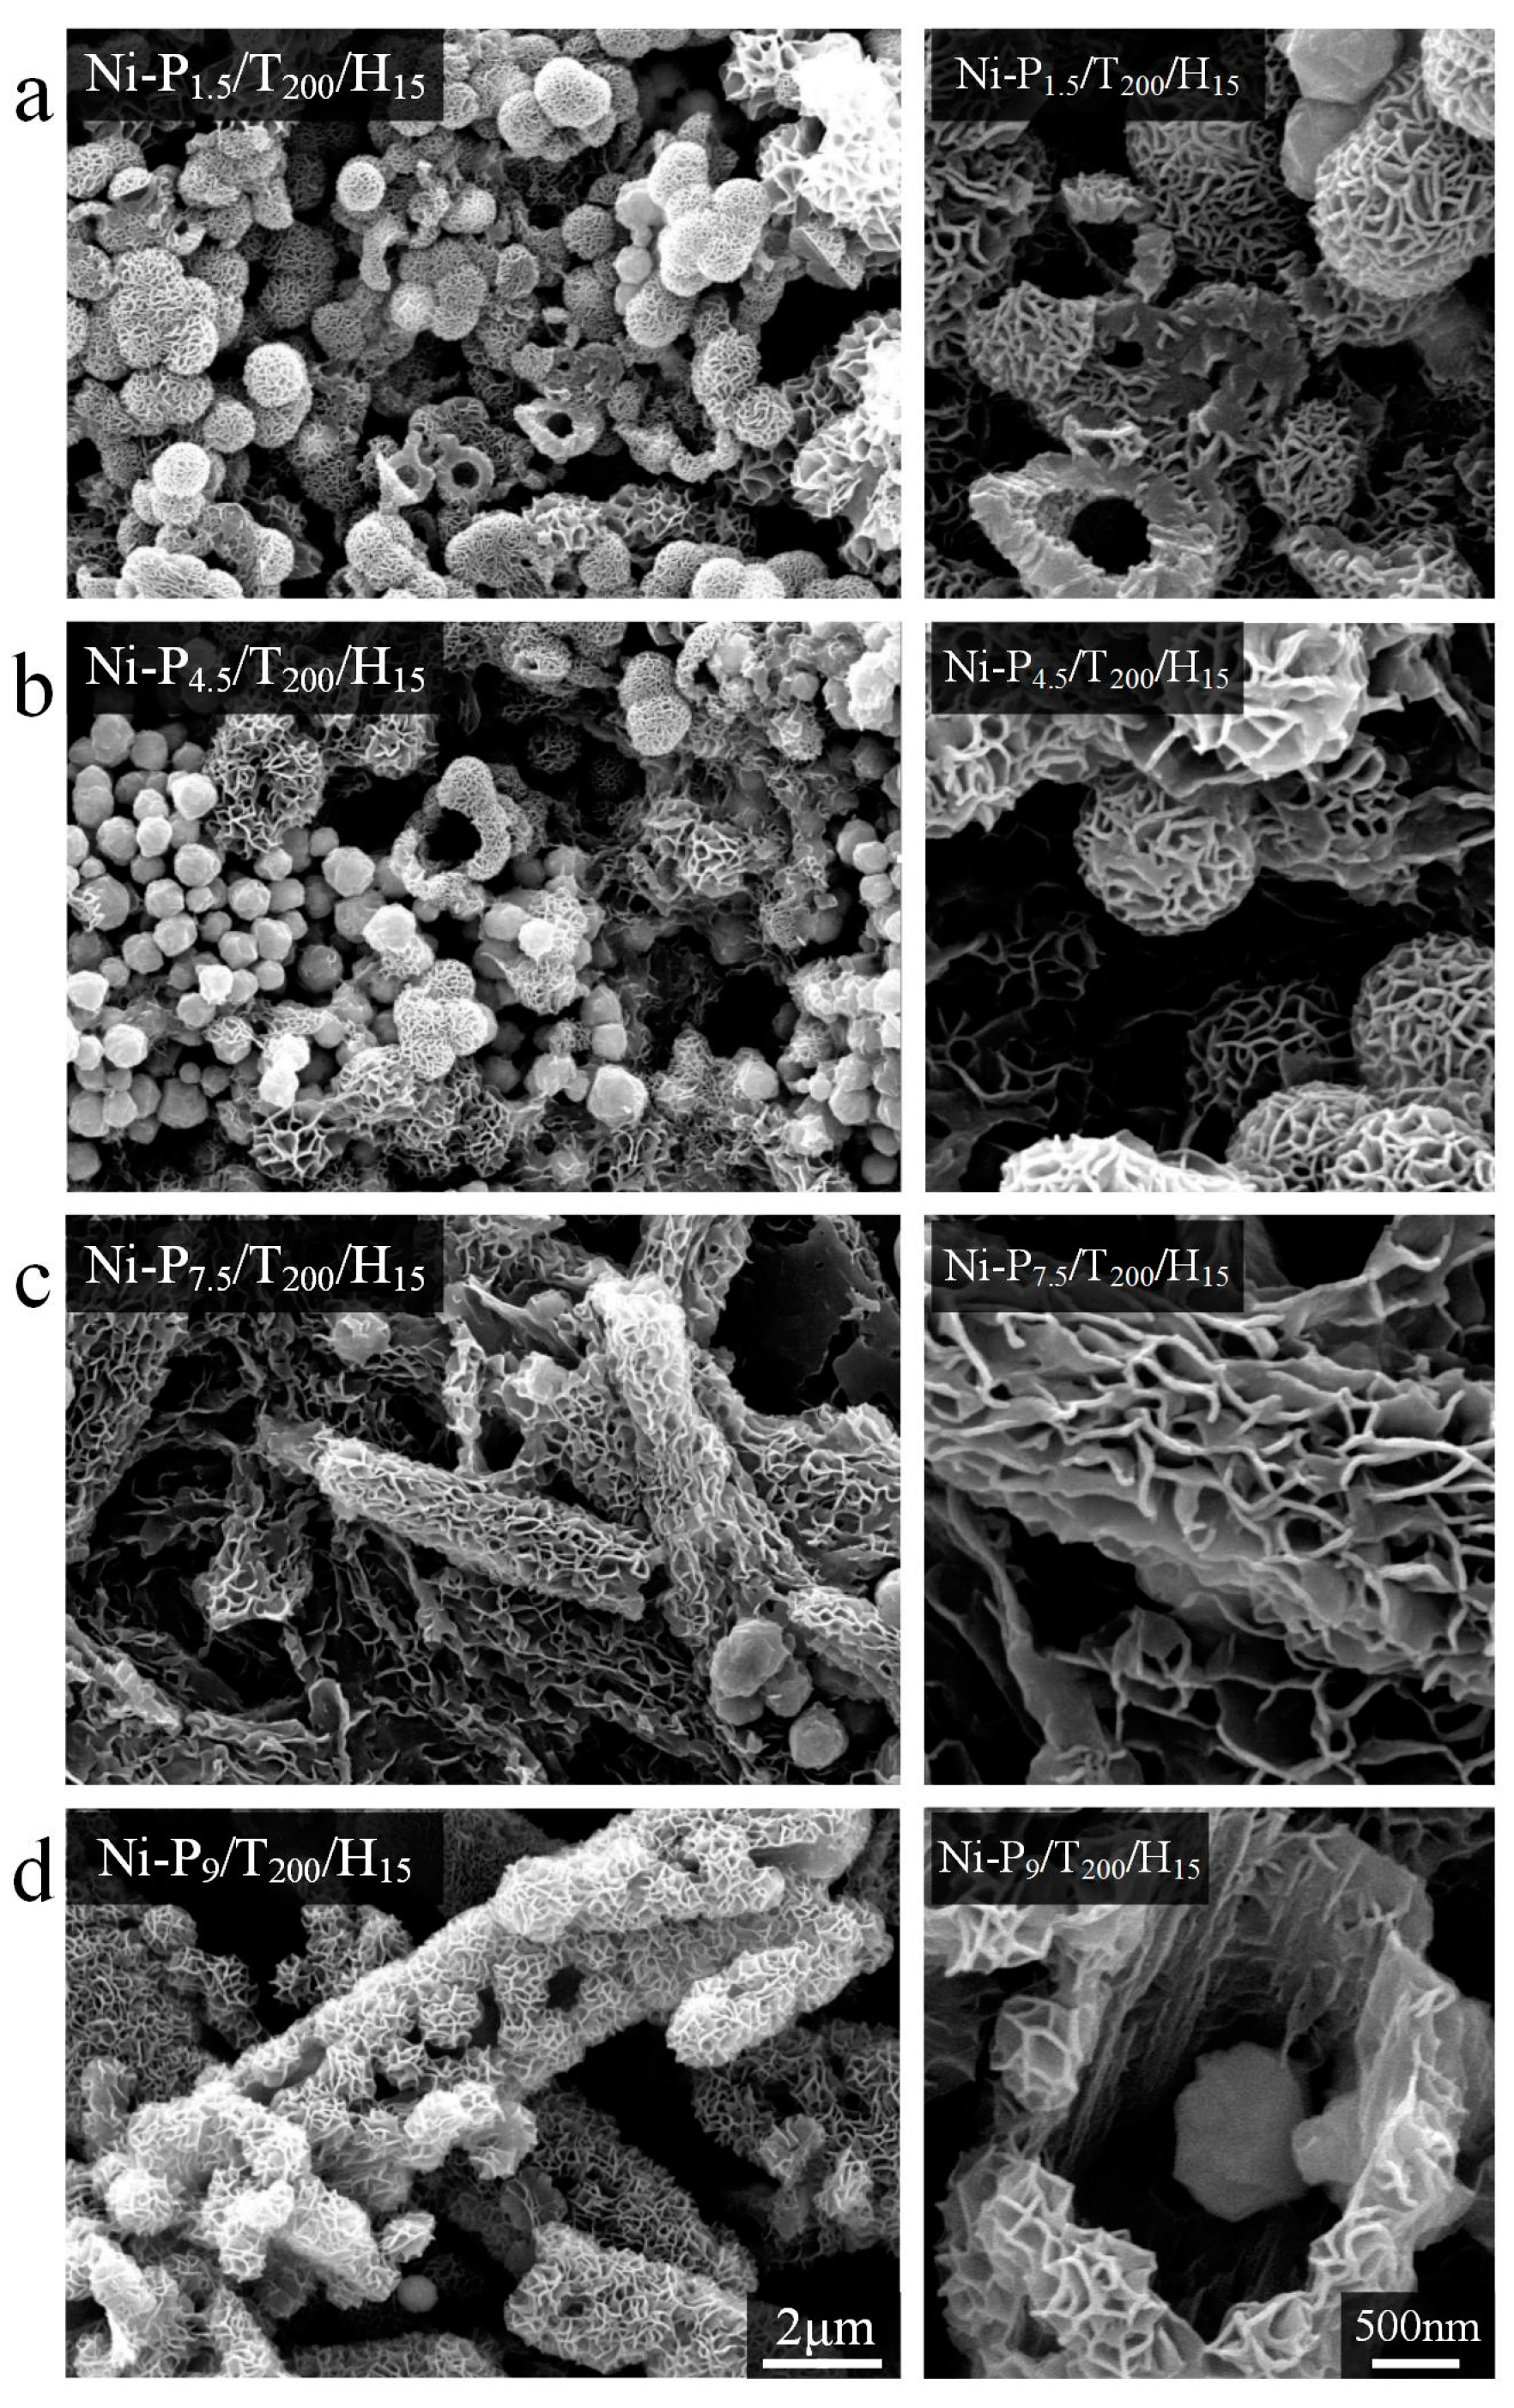
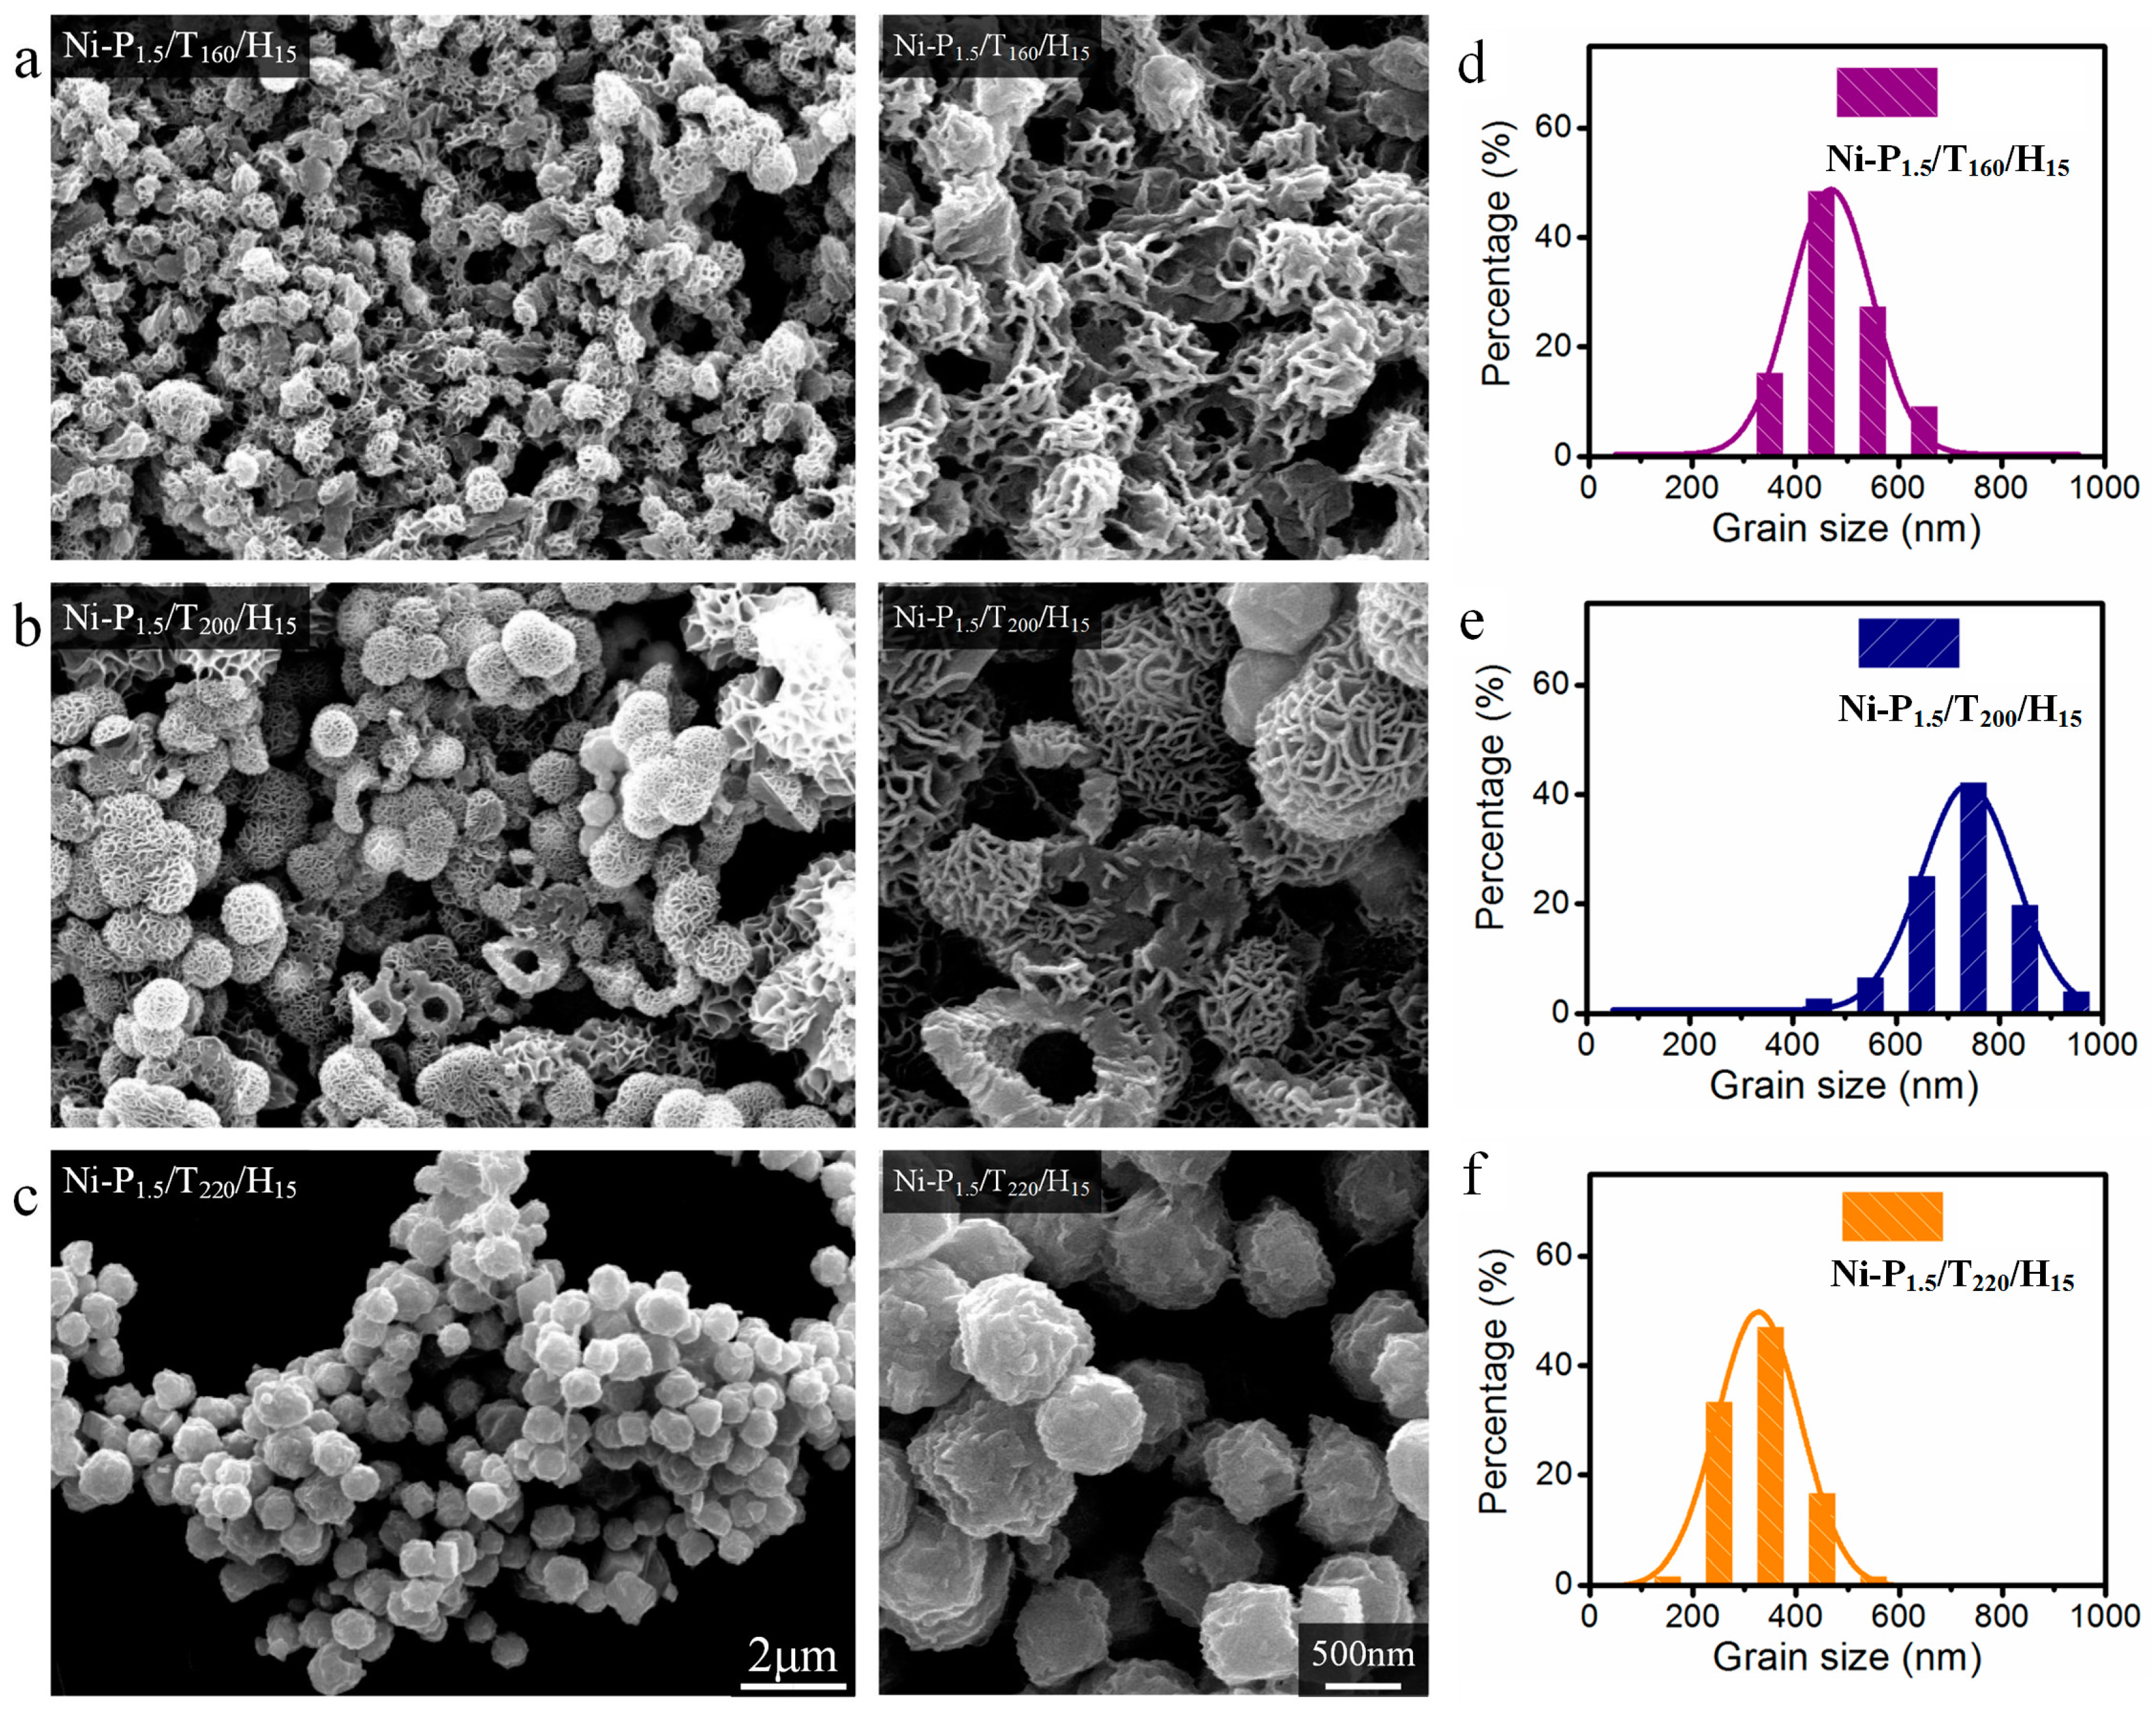
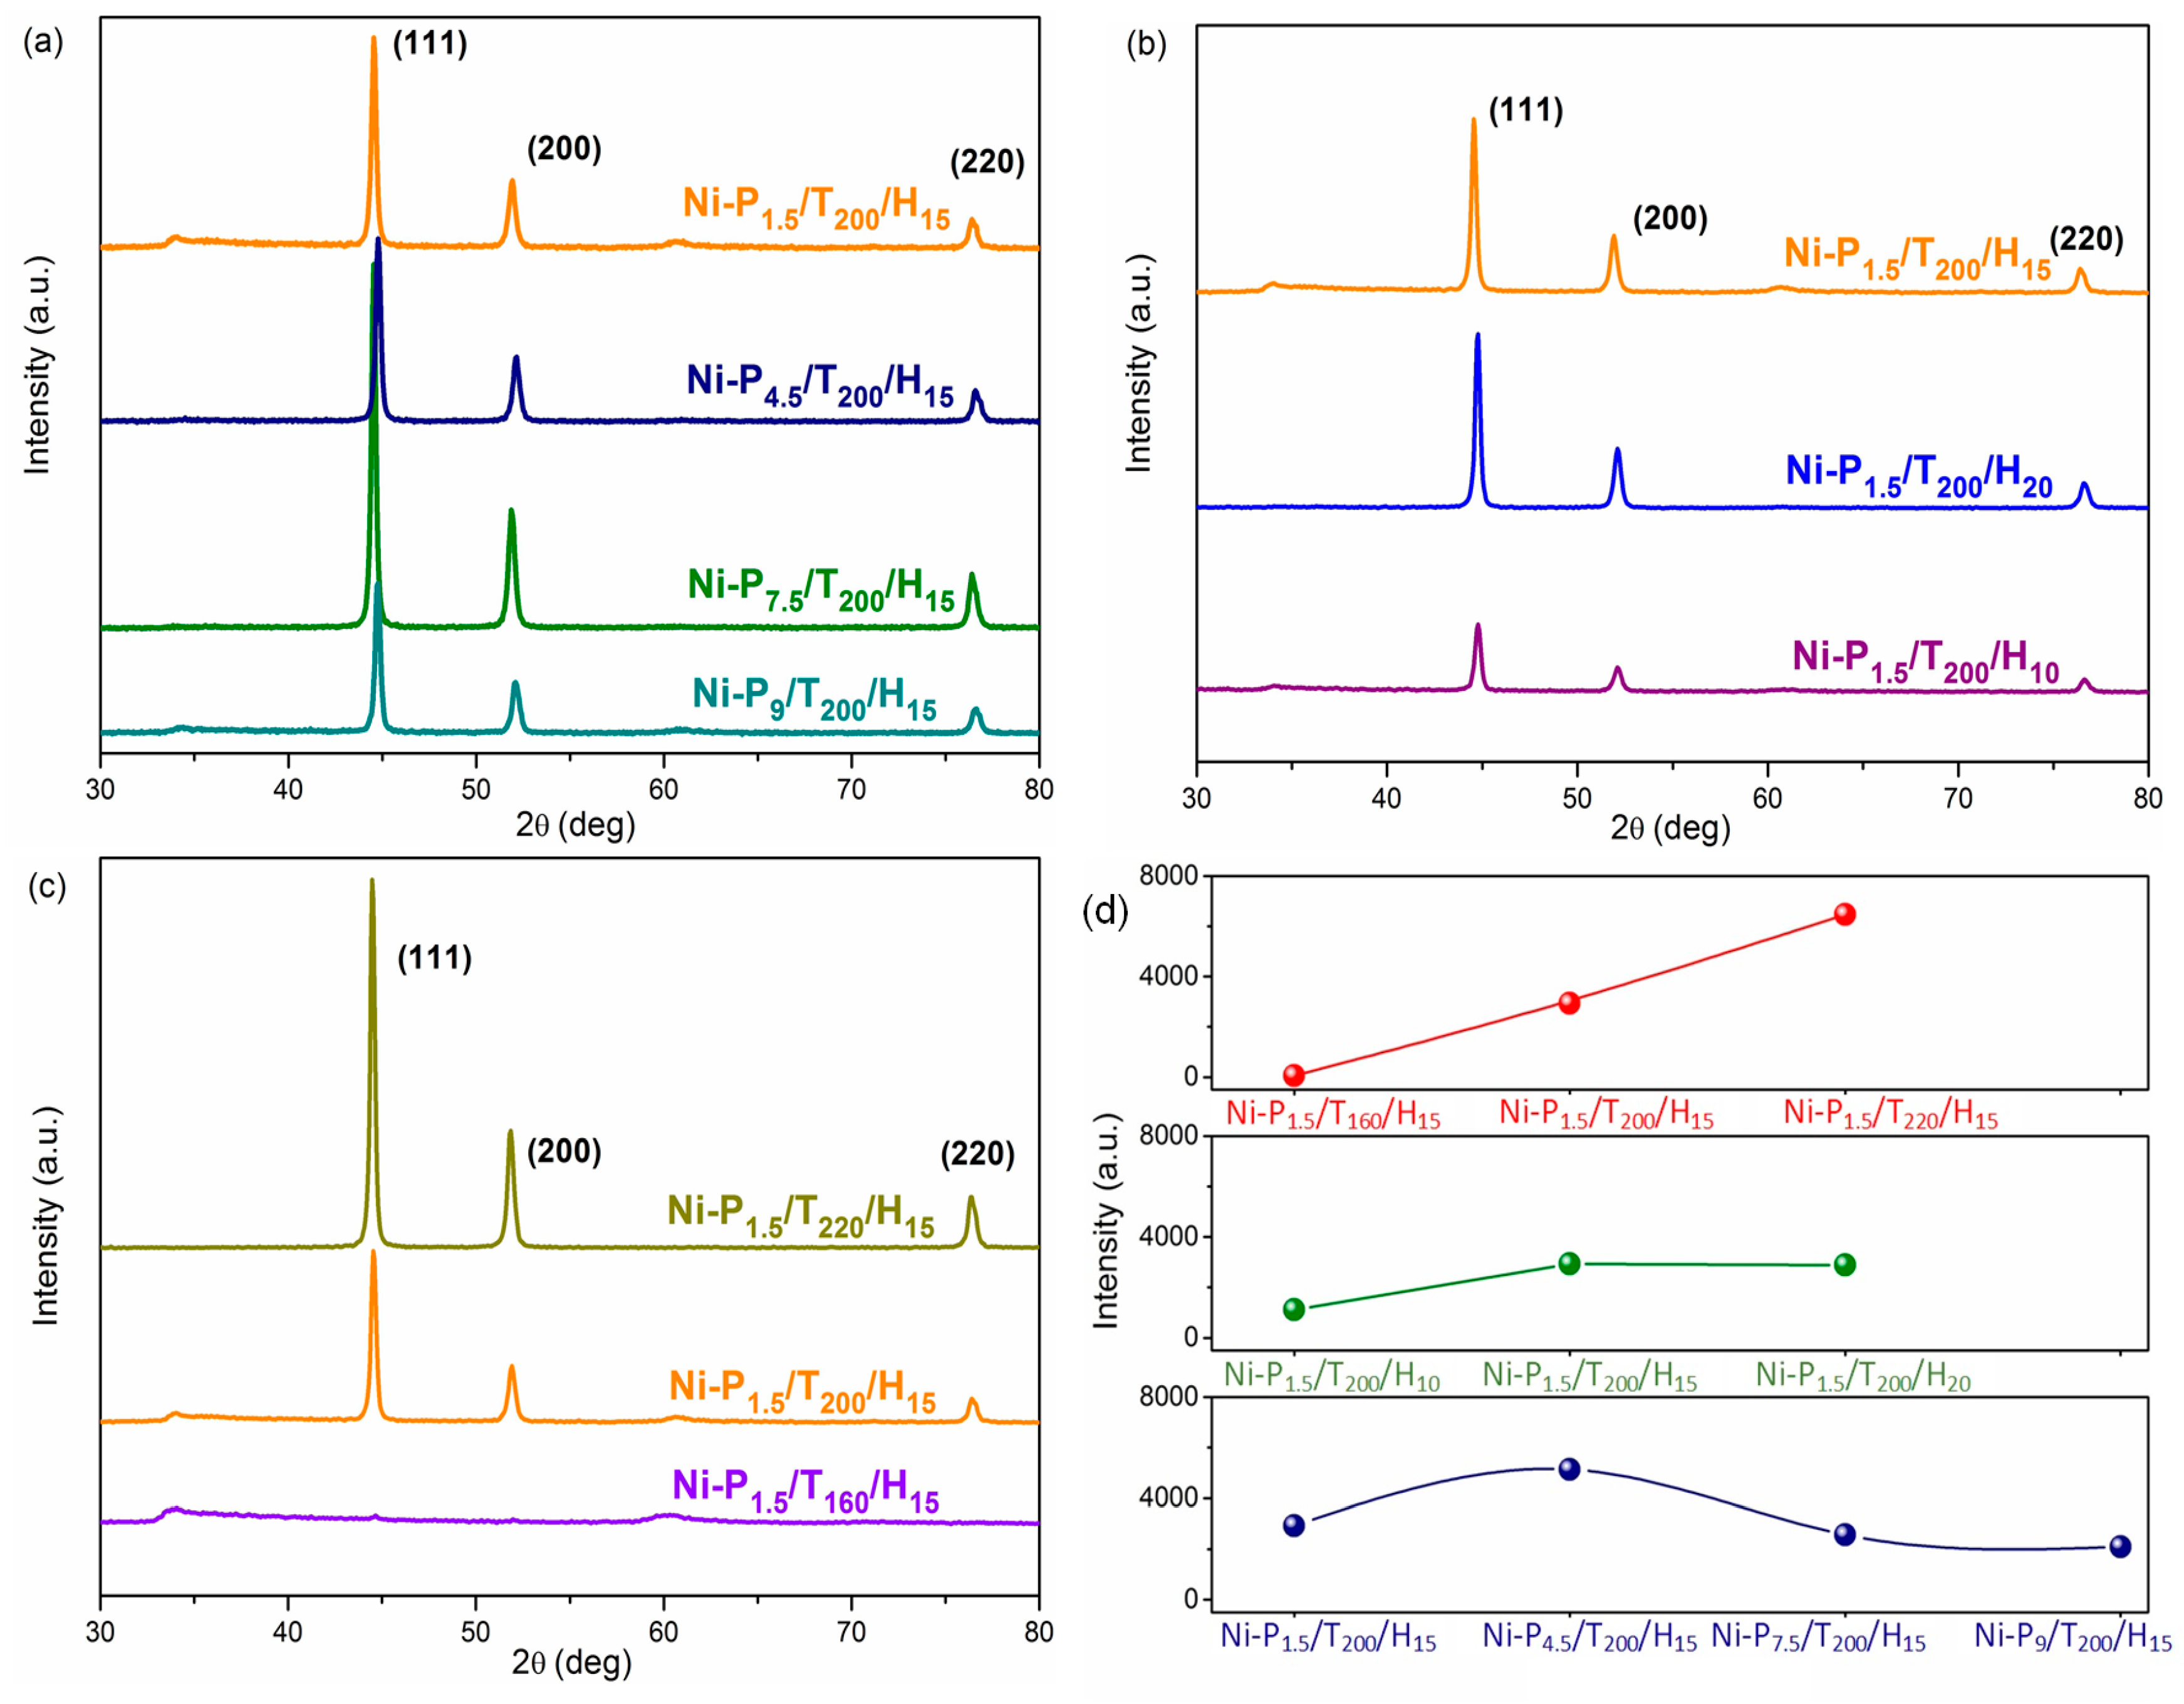
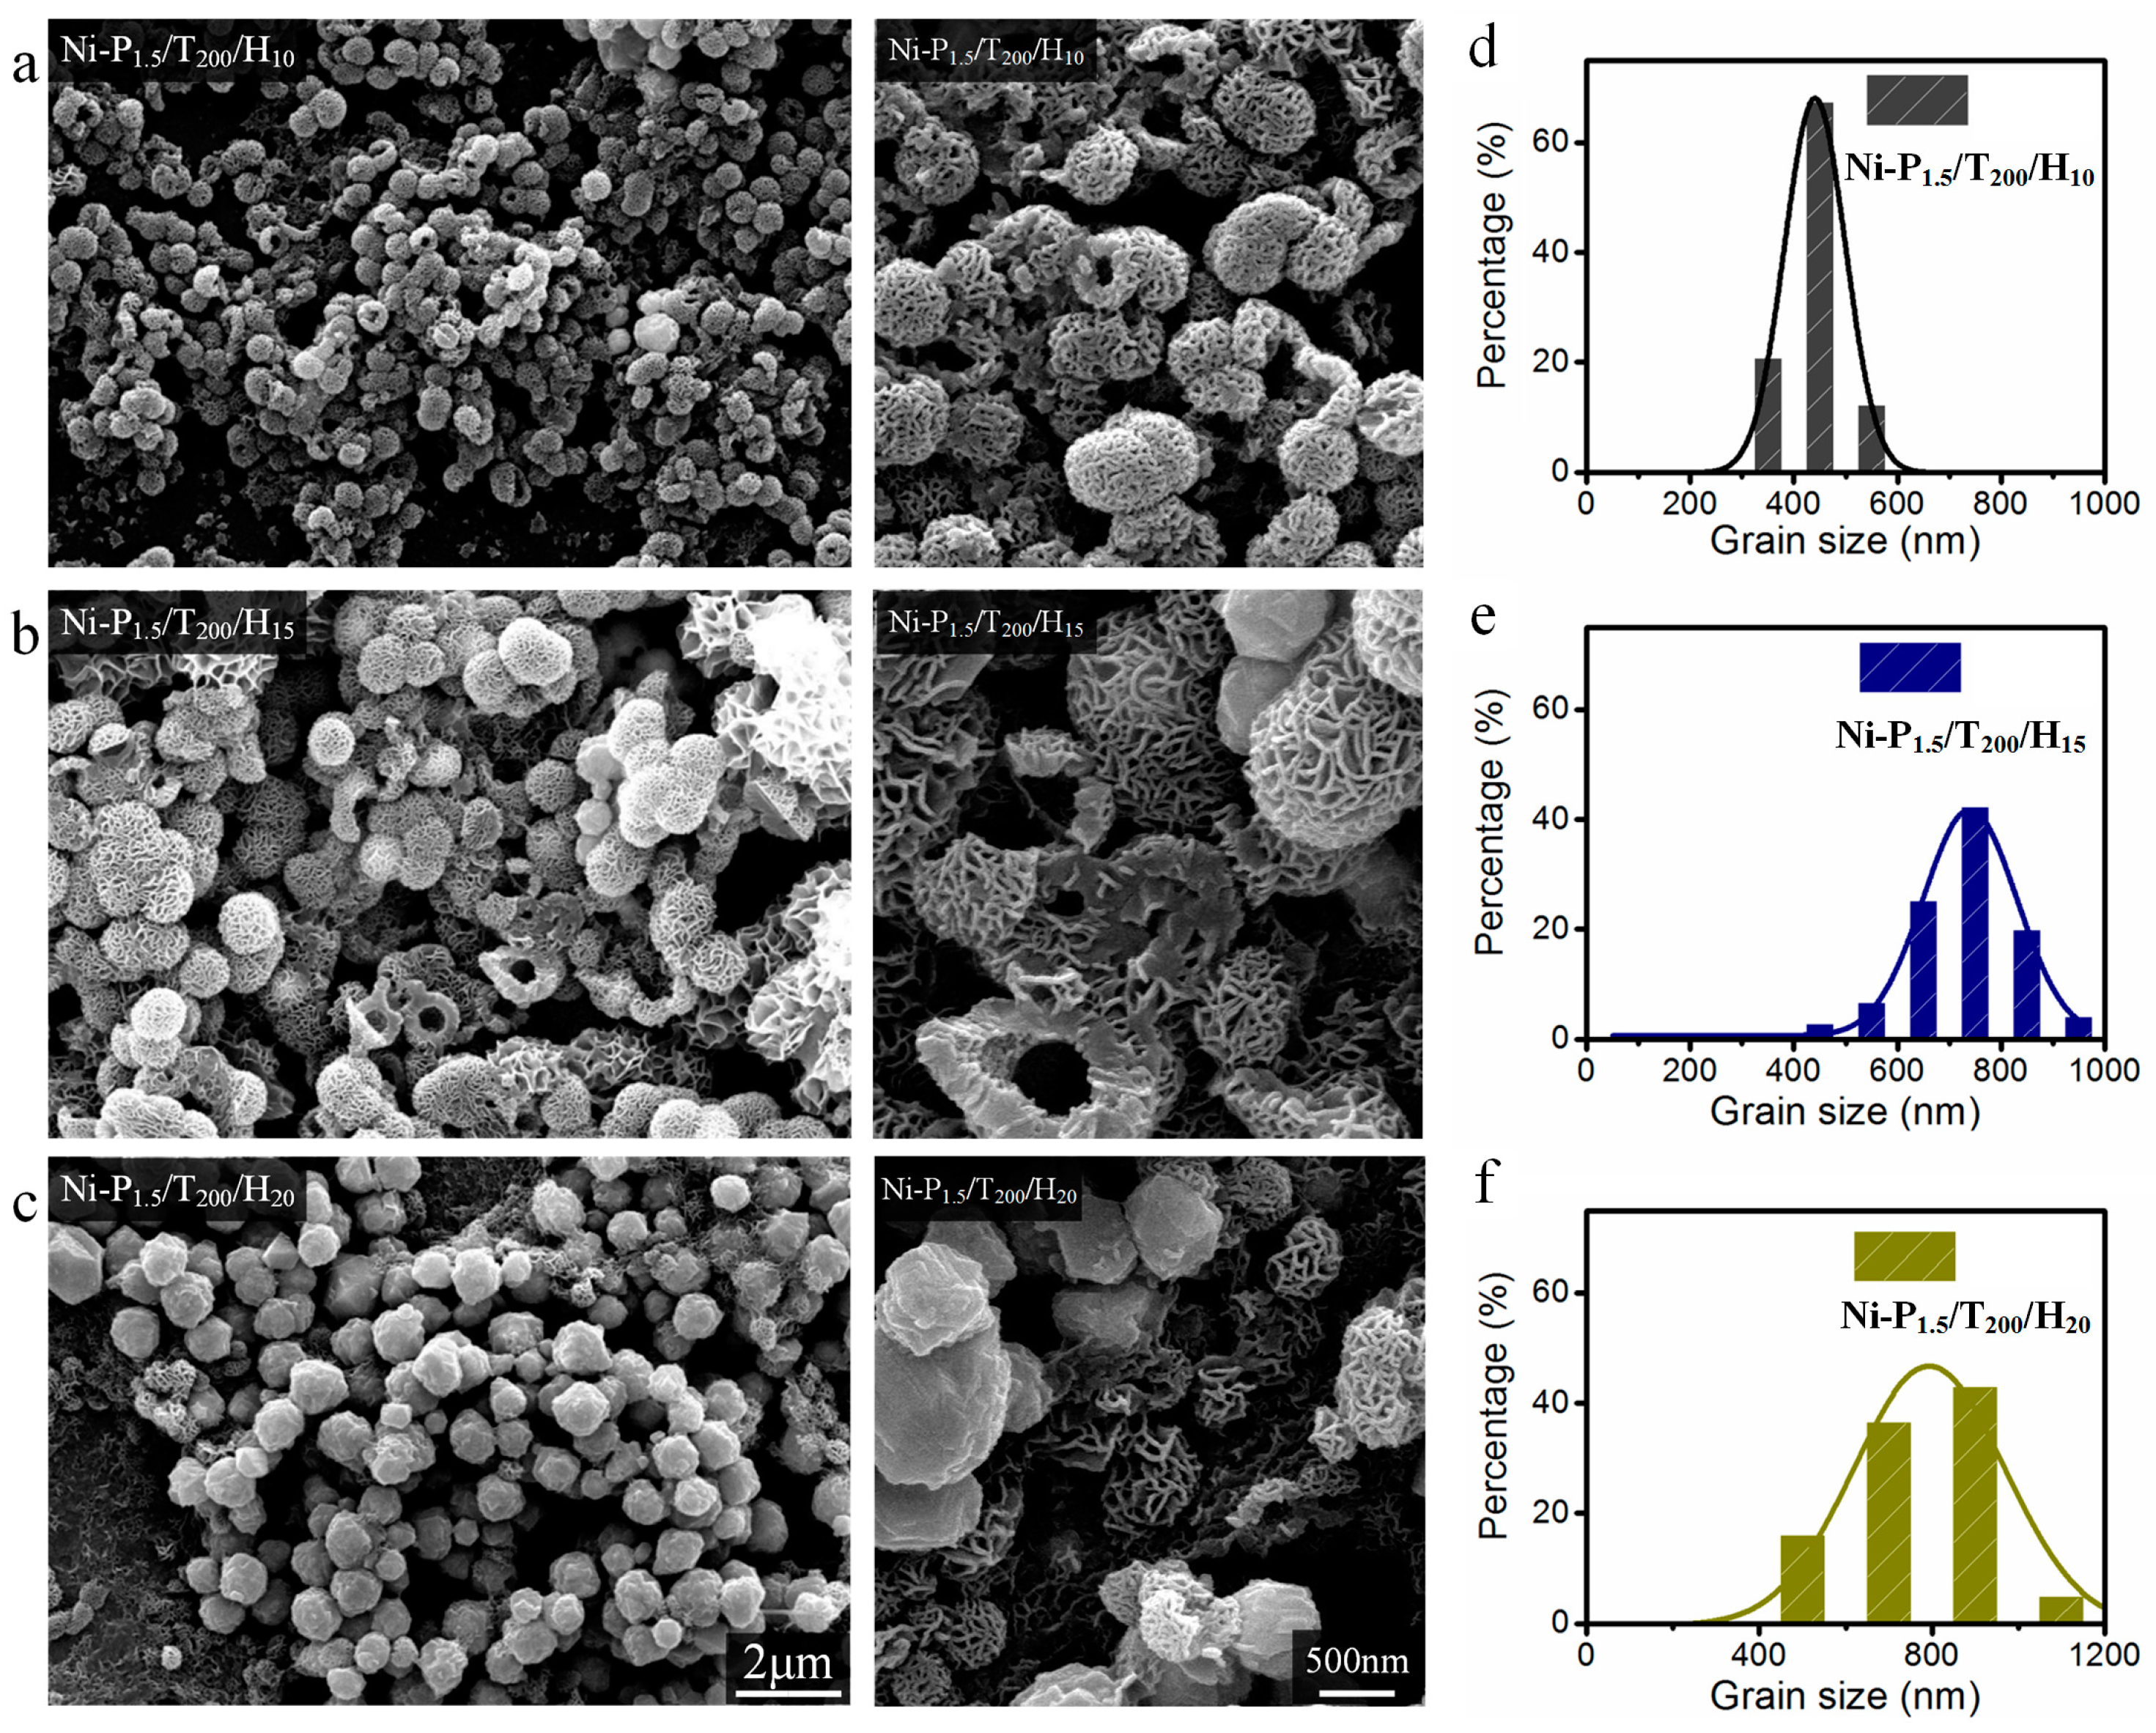
3.1. Morphological Properties

In this solvothermal reaction system, PEG was used as reductant and template in the synthesis of Ni nanoparticles. Therefore, the influence of PEG stoichiometry on morphology of Ni nanoparticles was investigated by SEM. As can be seen from Figure 1a that sample (Ni-P1.5/T200/H15) is mainly composed of curly nanoflakes with hollow structures. With increasing of PEG, hydrangea-like submicron spheres (Ni-P4.5/T200/H15) are observed in Figure 1b. In Figure 1c, well-defined rod-like structures (Ni-P7.5/T200/H15) were formed. Magnified image shows that these rod-like structures are probably due to self-assembled with dense nanoflakes. In Figure 1d, there are massive hydrangea-like submicron hemispheres (Ni-P9/T200/H15) with a diameter of ca. 670 nm, formed tubular structures with a diameter ca. 3 μm. It can be observed that the structure of nanoparticles changes from hydrangea-like submicron spheres to tubular as the weight of PEG increases. It seems that the hydrophilic groups in PEG polymeric chain are adsorbed on the surface of nanoparticles to prevent the aggregation, and promote the 3D growth of Ni nanoparticles with reduced surface energy [20,21]. Moreover, the morphologies and structures of Ni nanoparticles are investigated by altering the reaction temperature and reaction time while keeping the other conditions constant. Figure 2 shows the morphologies of Ni-P1.5/T200/H10, Ni-P1.5/T200/H15 and Ni-P1.5/T200/H20 samples synthesized at 200 °C for 10, 15 and 20 h respectively. In addition, based on SEM images, the corresponding particle-size analysis obeys normal Gaussian distributions. In Figure 2a, we can see that the Ni-P1.5/T200/H10 spheres with hollow structures have some similarities with Ni-P1.5/T200/H15, but the average diameter of Ni-P1.5/T200/H10 (440 nm) is obviously smaller than that of Ni-P1.5/T200/H15 (730 nm). It can be deemed that with the increase of reaction time, the diameter of the nickel spheres becomes larger. While the reaction time extends to 20 h, almost all the nanoparticles (Ni-P1.5/T200/H20) have irregular sphere-like shape with an average diameter of ca. 770 nm, there are still a few flower-like nanospheres can be found in Figure 2c. With a closer inspection, the nanospheres have irregular radius. According to the mechanisms of aggregative growth [22], in the initial induction period, the size of the nanoparticles increase corresponds to the classical nucleation and growth rate. This regime may be followed with aggregative nucleation and growth. Small nanoparticles have higher mobility and collision frequency than large nanoparticles, owing to their large surface fractions and high energies. Therefore, the small nanoparticles are found to be more prone to merge than large nanoparticles [23]. We thus infer that as the reaction time increases the small nanoparticles tends to form large particles through mutual integration and thus have irregular radius.
The effect of reaction temperature on morphology was also discussed in this work. Figure 3a shows the representative SEM images of the Ni-P1.5/T160/H15 fabricated at 160 °C for 15 h. It is observed that most Ni-P1.5/T160/H15 nanoparticles are similar in shape with Ni-P1.5/T200/H15 with an average diameter of 470 nm. Meanwhile, it is seen that the Ni-P1.5/T160/H15 nanoparticles consist of interconnected and conglutinated petals. However, as the reaction temperature increases to 220 °C, the Ni-P1.5/T220/H15 nanoparticles aggregate together and possess the sphere-like structures. It is found that the Ni-P1.5/T220/H15 nanoparticles are close to regular submicron spheres with rough surface and with an average diameter of 660 nm (Figure 3c). Compared with Ni-P1.5/T200/H15, the increase of reaction temperature obviously leads to the reduction of the crystal size of Ni nanoparticles. As a result, the reaction temperature and time play a role in the particle size and morphology of Ni nanoparticles.
In order to investigate the crystal structure crystal and phase of these samples, XRD patterns of the as-prepared Ni nanoparticles were conducted. As shown in Figure 4, most of the samples present characteristic diffraction peaks at 44.5°, 51.8° and 76.4°, corresponding to Ni (111), (200), and (220), which belong to the face centered cubic (FCC) structure in good consistent with the database of JCPDS Card (No. 04-0850) [24]. However, as for Ni-P1.5/T160/H15, the intensity of the characteristic diffractions peaks is weak, indicating that the lower temperature is adverse to reduce Ni2+ to Ni and form Ni crystals completely. According to the reported data (JCPDS card No. 04-0850), it can be identified that the Ni-P1.5/T160/H15 is nickel hydroxide [Ni(OH)2·0.75H2O]. This result indicates that Ni(OH)2·0.75H2O formed at above low reaction temperature is the precursor of Ni crystals, thus explains the reason that the morphology of Ni-P1.5/T160/H15 is similar to that of Ni-P1.5/T200/H15 [25,26,27]. The XRD patterns for Ni-P1.5/T160/H15, Ni-P1.5/T200/H10 and Ni-P1.5/T200/H15 are further exhibited in Figure S1 and S2 (Supplementary Materials). As shown in Figure 4d, it is revealed that the intensity of diffraction peaks significantly increases as the reaction temperature increases, which indicates that the samples have higher crystallinity and better purity [19]. In addition, as the reaction time increases, the intensity of diffractions peaks increases. Interestingly, the peaks are observably enhanced with increasing of the PEG weight first, and then the intensity of the peaks is found to be decreasing with the weight of PEG increases. The variation in intensity of the peaks reveals that the PEG surfactant plays an important role in the fabrication of Ni particles, which is consistent with the SEM results.

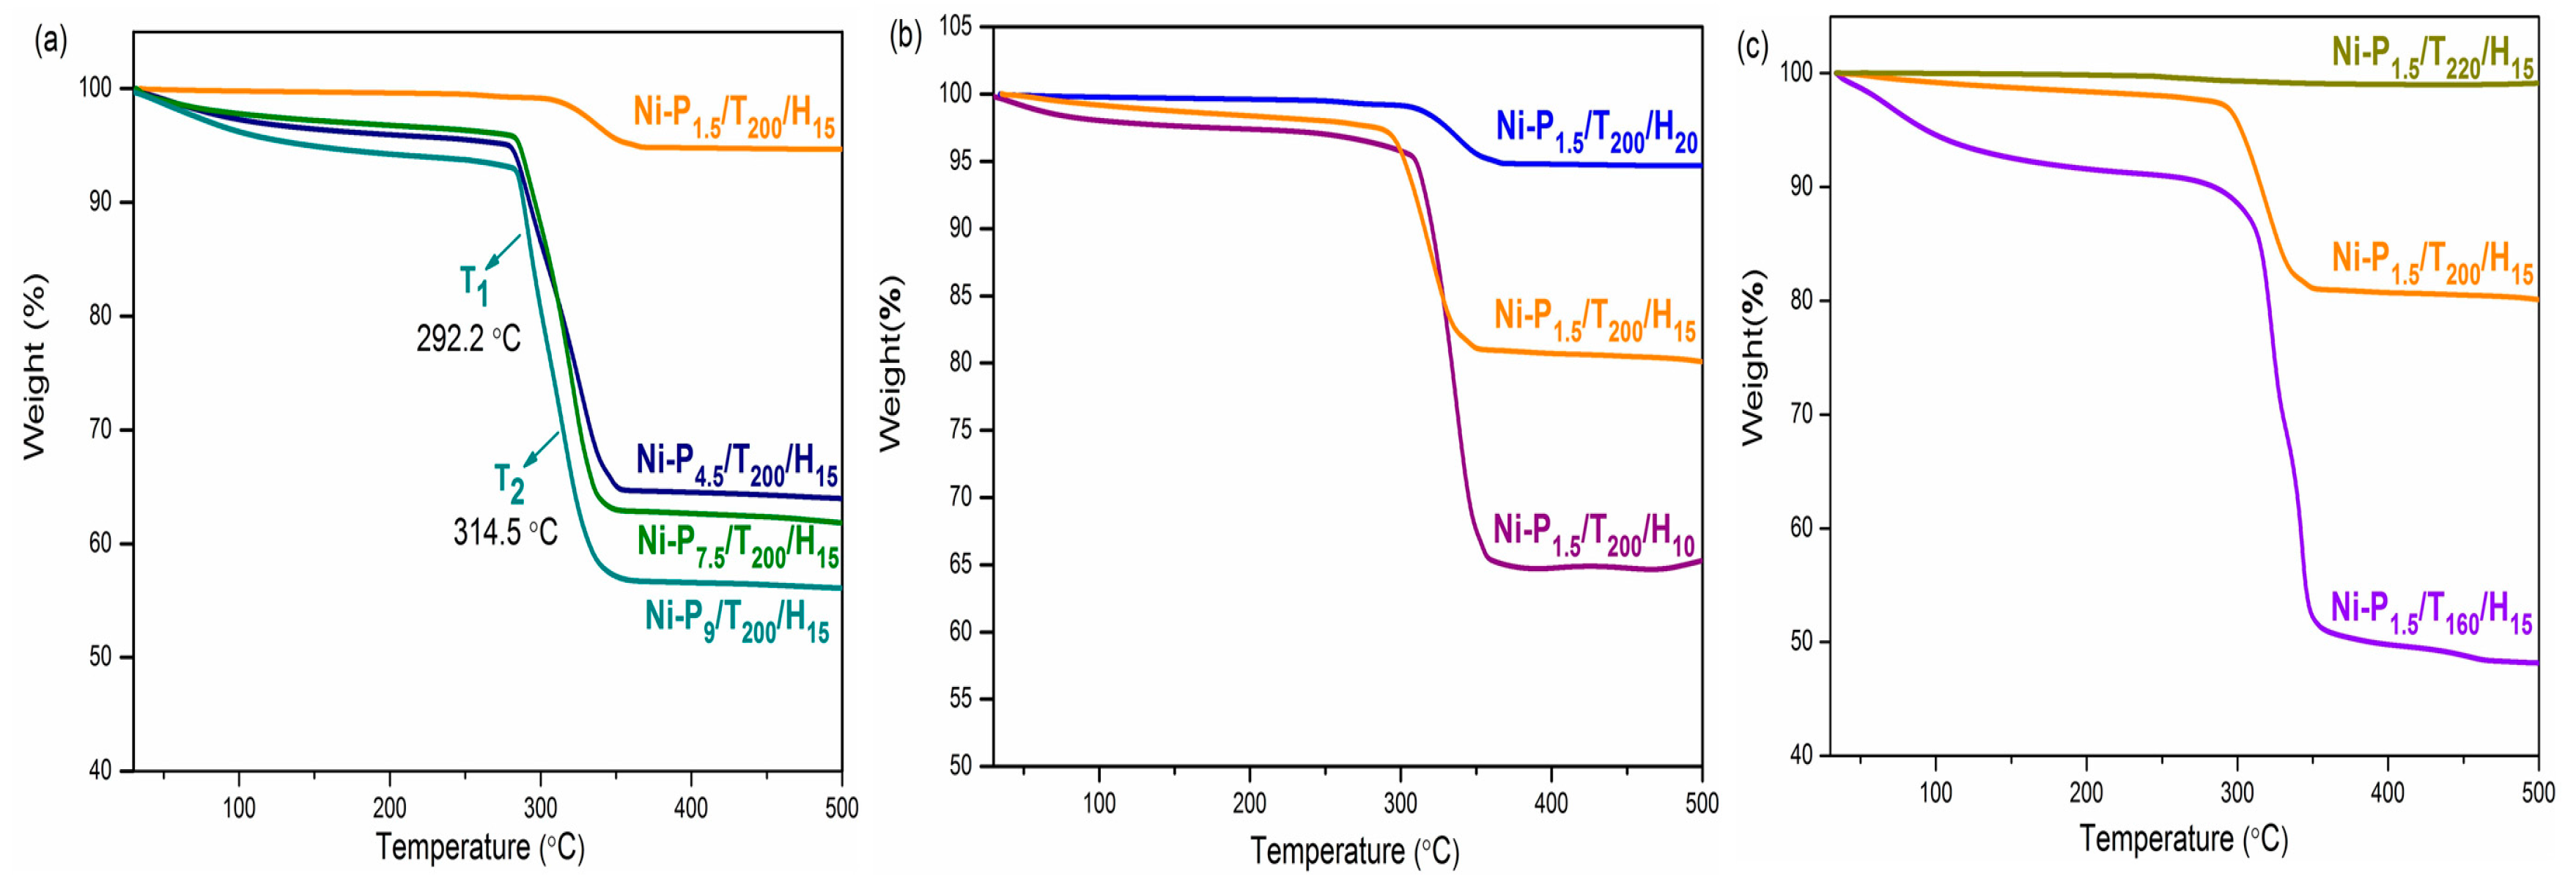
3.2. Thermal Properties

The TGA spectra of various samples are performed and the results are shown in Figure 5 and Table 2. Almost all samples indicate that weight losses have two phases decomposition process with the maximum-rate decomposition temperatures of the first (T1) and second (T2) phases. Figure 5a shows the TGA curves of the Ni-P1.5/T200/H15, Ni-P4.5/T200/H15, Ni-P7.5/T200/H15 and Ni-P9/T200/H15 samples. At the first phase (below 300 °C) there is a slow decomposition rate due to the thermal decomposition of organic components in the samples [28]. The maximum decomposition temperatures of the second phase were at 319.2, 326.5, 320.1 and 314.5 °C respectively. In addition, the total weight losses at 500 °C were 19.9%, 36.1%, 38.2% and 43.9% respectively for the first group of samples. The second phase of decomposition process is due to the decomposition reaction of nickel. This decomposition process may be related to the crystallinity and structure of nickel [29]. These results indicate that the thermal stability of the samples decreases with the increasing addition of PEG. Additionally, the samples exhibit good thermal stabilities owing to the increasing of the reaction time and temperature, shown in Figure 5b,c. As is known to all, the magnetic properties of the nanomaterials are widely claimed to be highly dependent on the crystallinity, morphology, size and composition [30]. Therefore, these data reveal that thermal stability of the nickel particles was determined corresponding to the structures and appeared to be related to the PEG content.

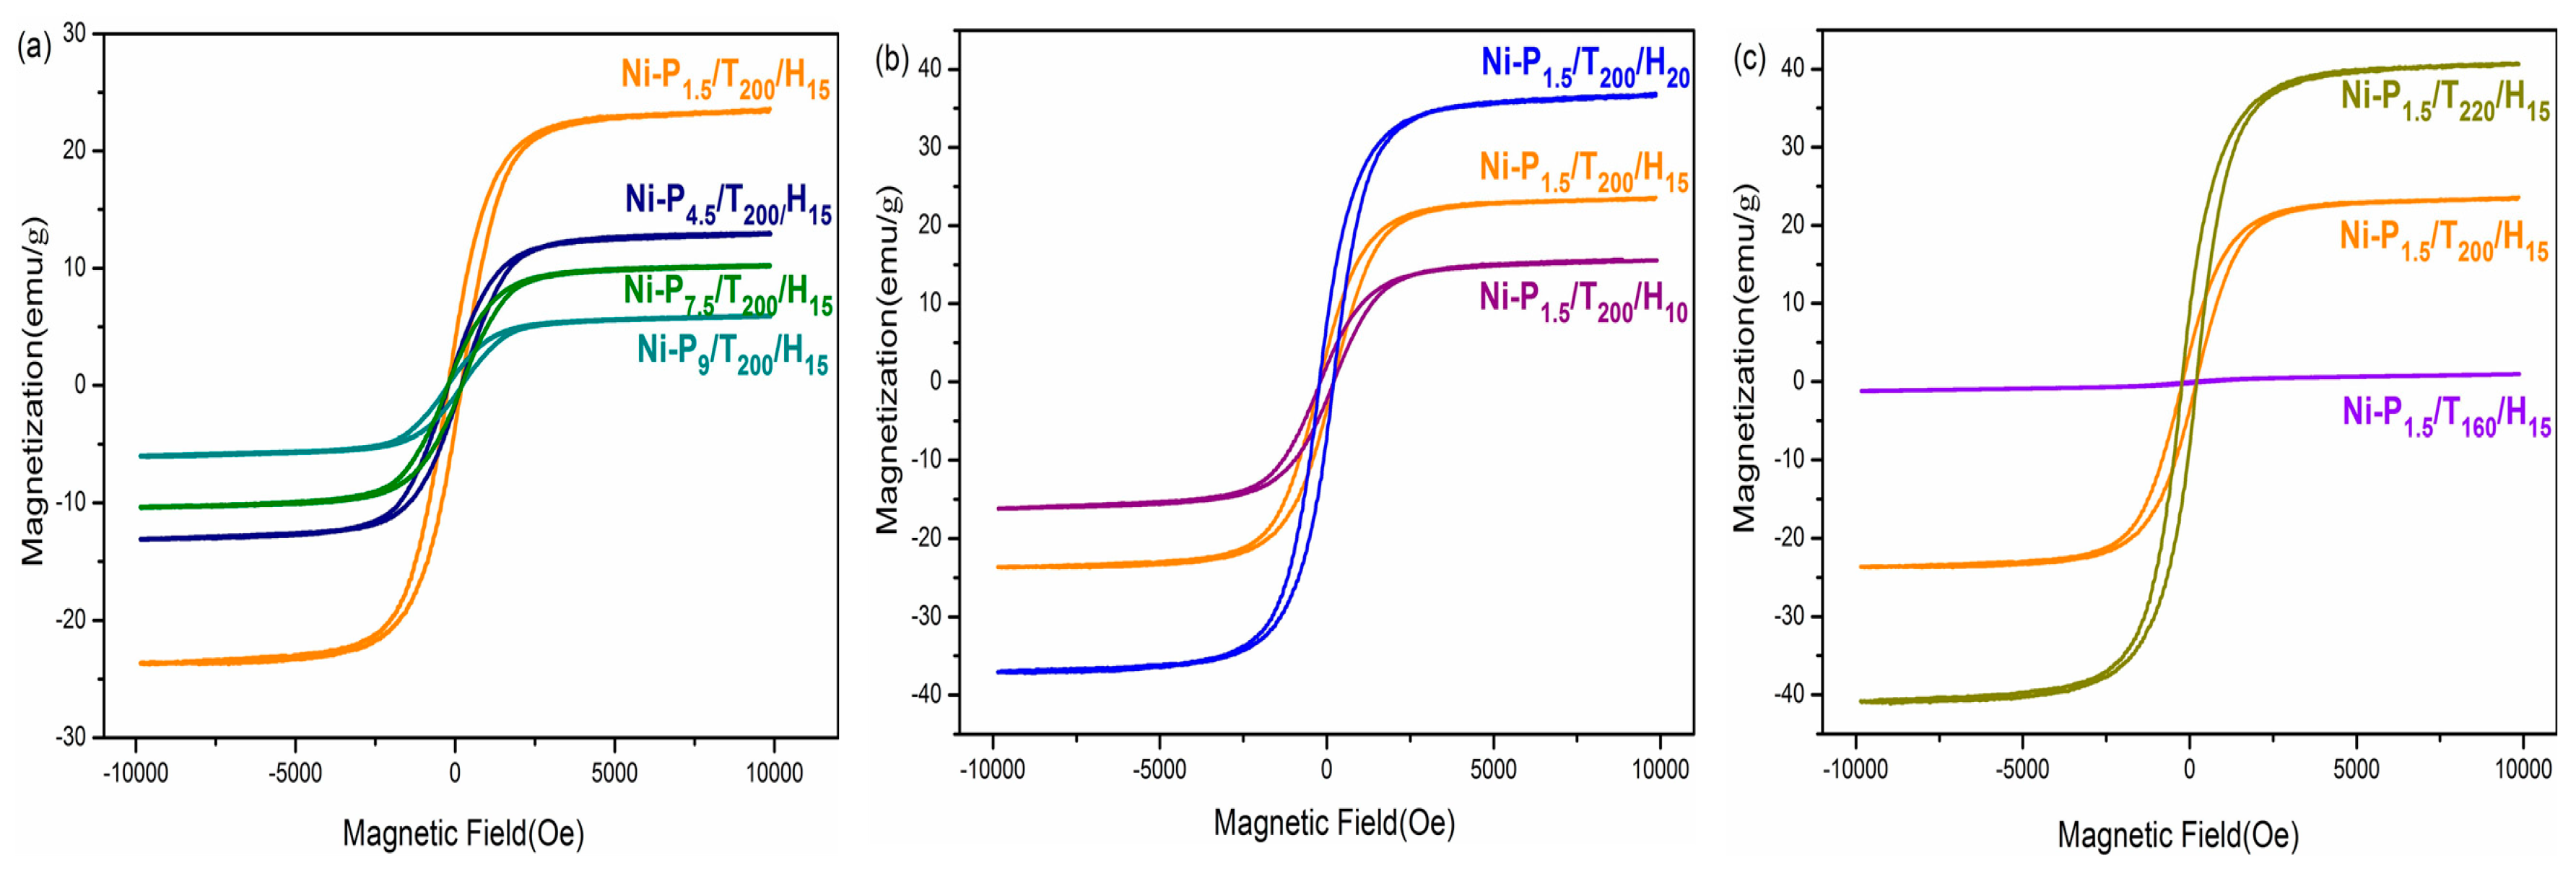
3.3. Magnetic Properties

The magnetic properties of the different samples (the magnetic value were referred to the content of only the metallic part) are measured in an applied magnetic field sweeping from −10,000 to 10,000 Oe, and shown in Table 2. The hysteresis loops in Figure 6a shows that the saturation magnetization (Ms) and coercive force (Hc) of Ni-P1.5/T200/H15, Ni-P4.5/T200/H15, Ni-P7.5/T200/H15, and Ni-P9/T200/H15 samples with different PEG content are 23.5, 13.0, 10.0, 5.9 eum·g−1 and 205.7, 200.8, 218.0, 222.2 Oe respectively. It is found that the Hc value was significantly improved relative to the bulk nickel (100 Oe), possibly due to its nanosized structure [31]. Interestingly, the Ms of Ni particles decreases along with the increasing content of PEG. It can be inferred that the surfactant affects the particle size, crystallinity and morphology of the nanoparticles, and thus affects the magnetic properties of the nanoparticles, which has a special structure and high order of shape anisotropy [32]. As shown in Figure 6b, the Ms values of Ni-P1.5/T160/H15, Ni-P1.5/T200/H15 and Ni-P1.5/T220/H15 samples are 15.9, 23.5 and 36.8 eum g−1, respectively, and the Hc values are 197.8, 205.7 and 206.8 Oe respectively. Clearly, the saturation magnetization and coercivity increase with the increase of reaction time. In similarity, it can be seen from Figure 6c that with the increase of the reaction temperature, the saturation magnetization and coercivity are also enhanced. It can be inferred that the reaction of temperature and time have a big impact on the crystallinity of the nanoparticles, which is corresponding to results of the SEM, XRD and TGA investigation.

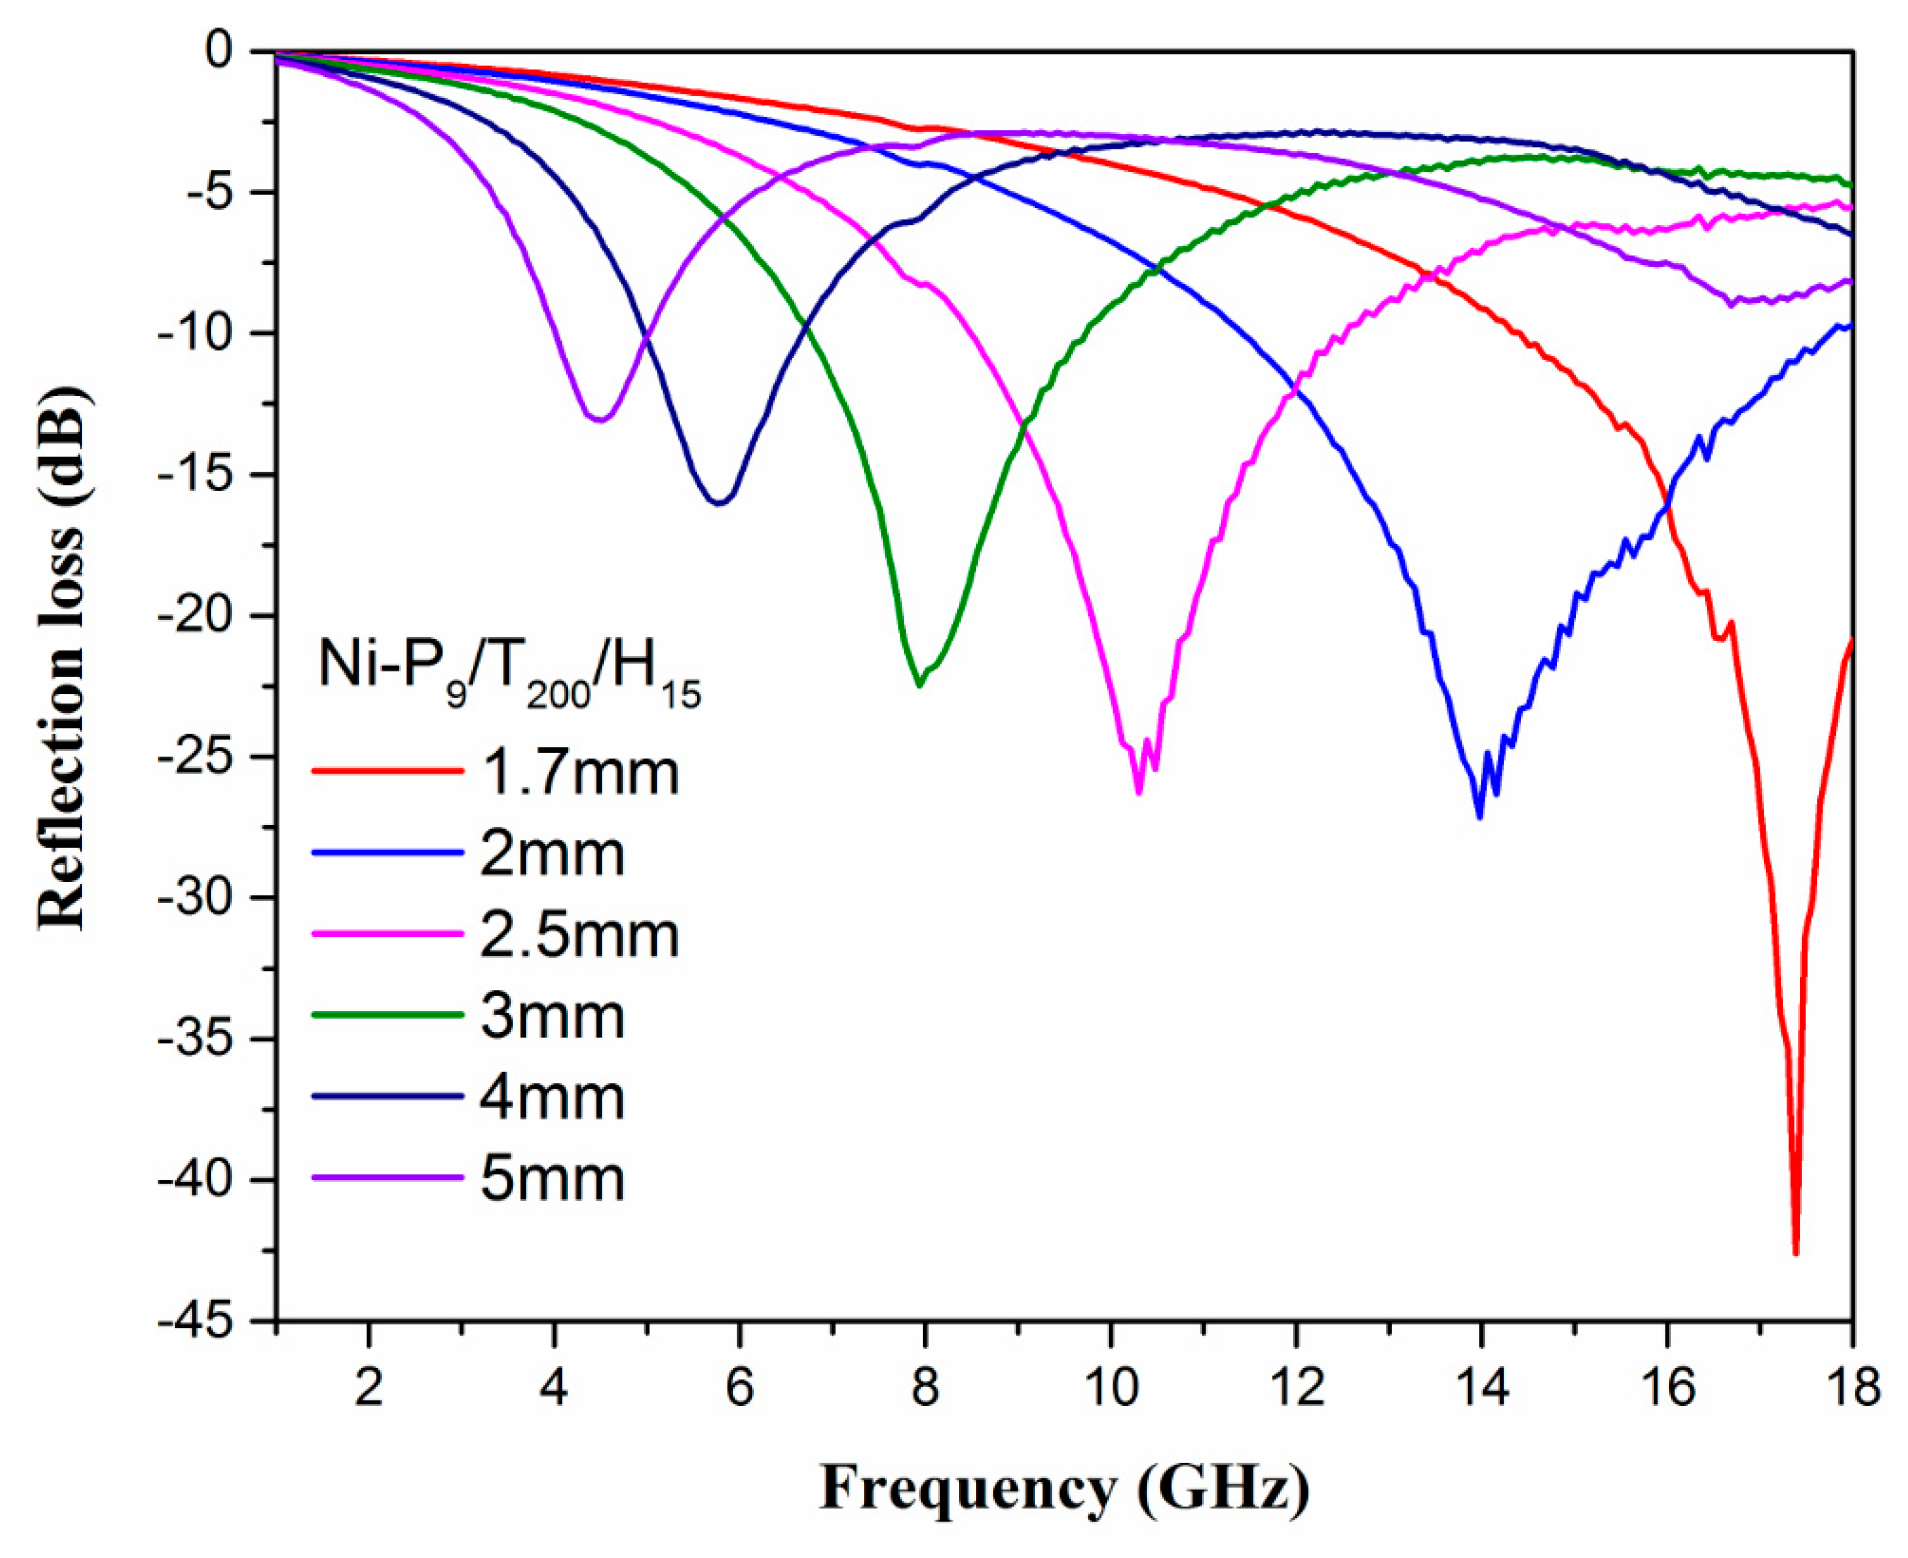
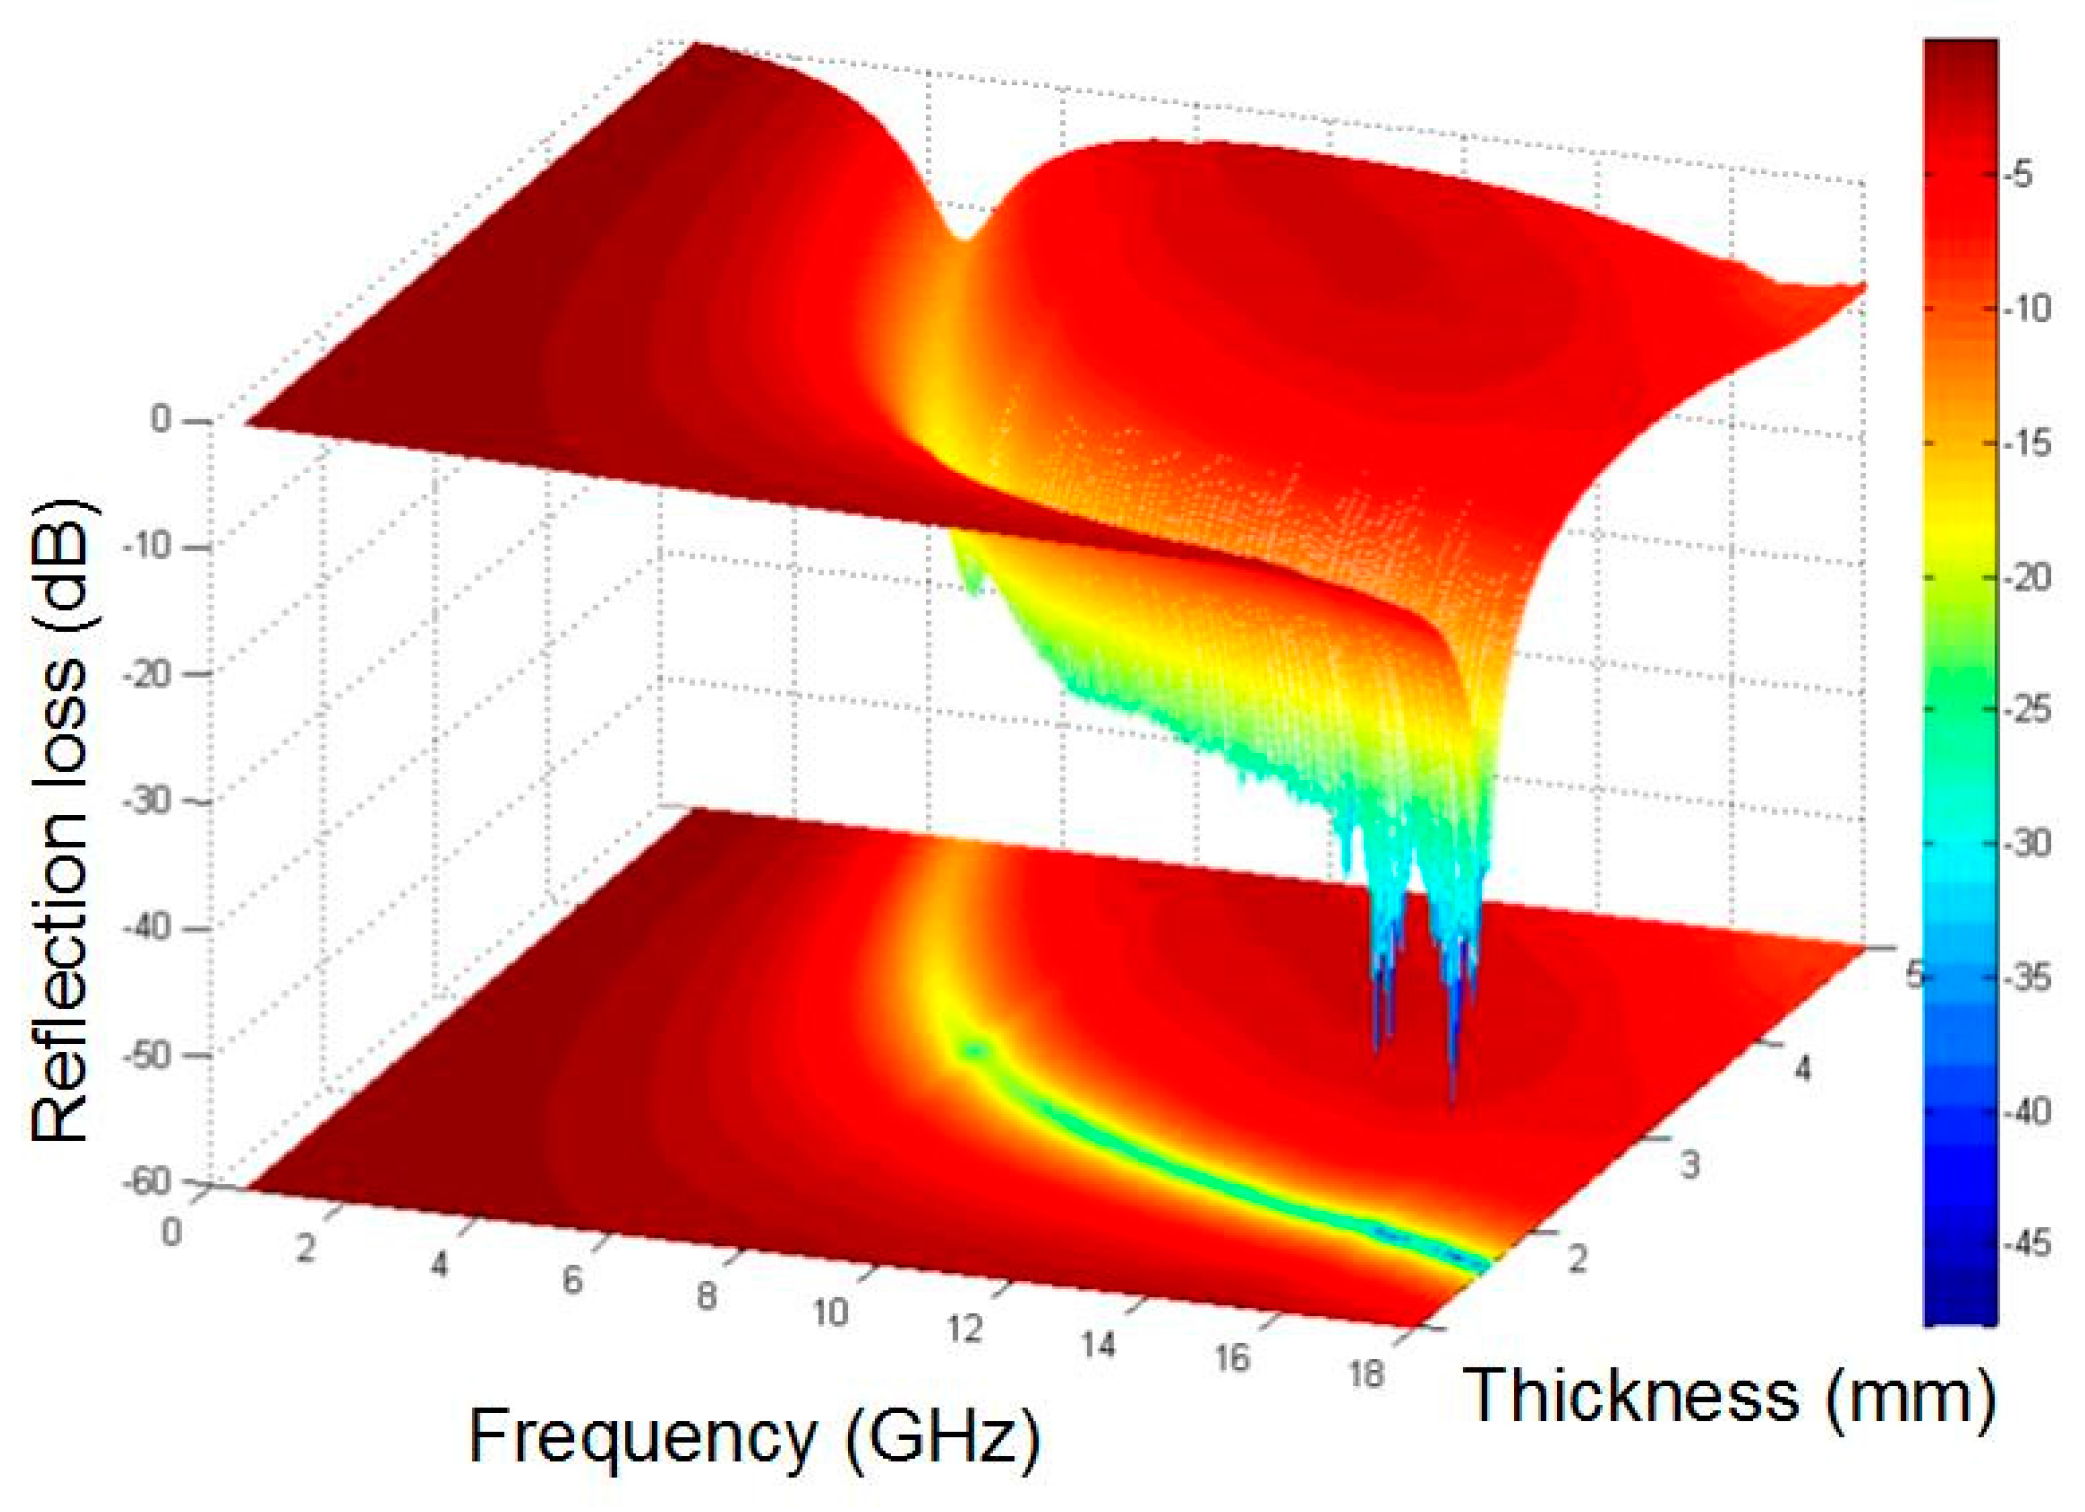
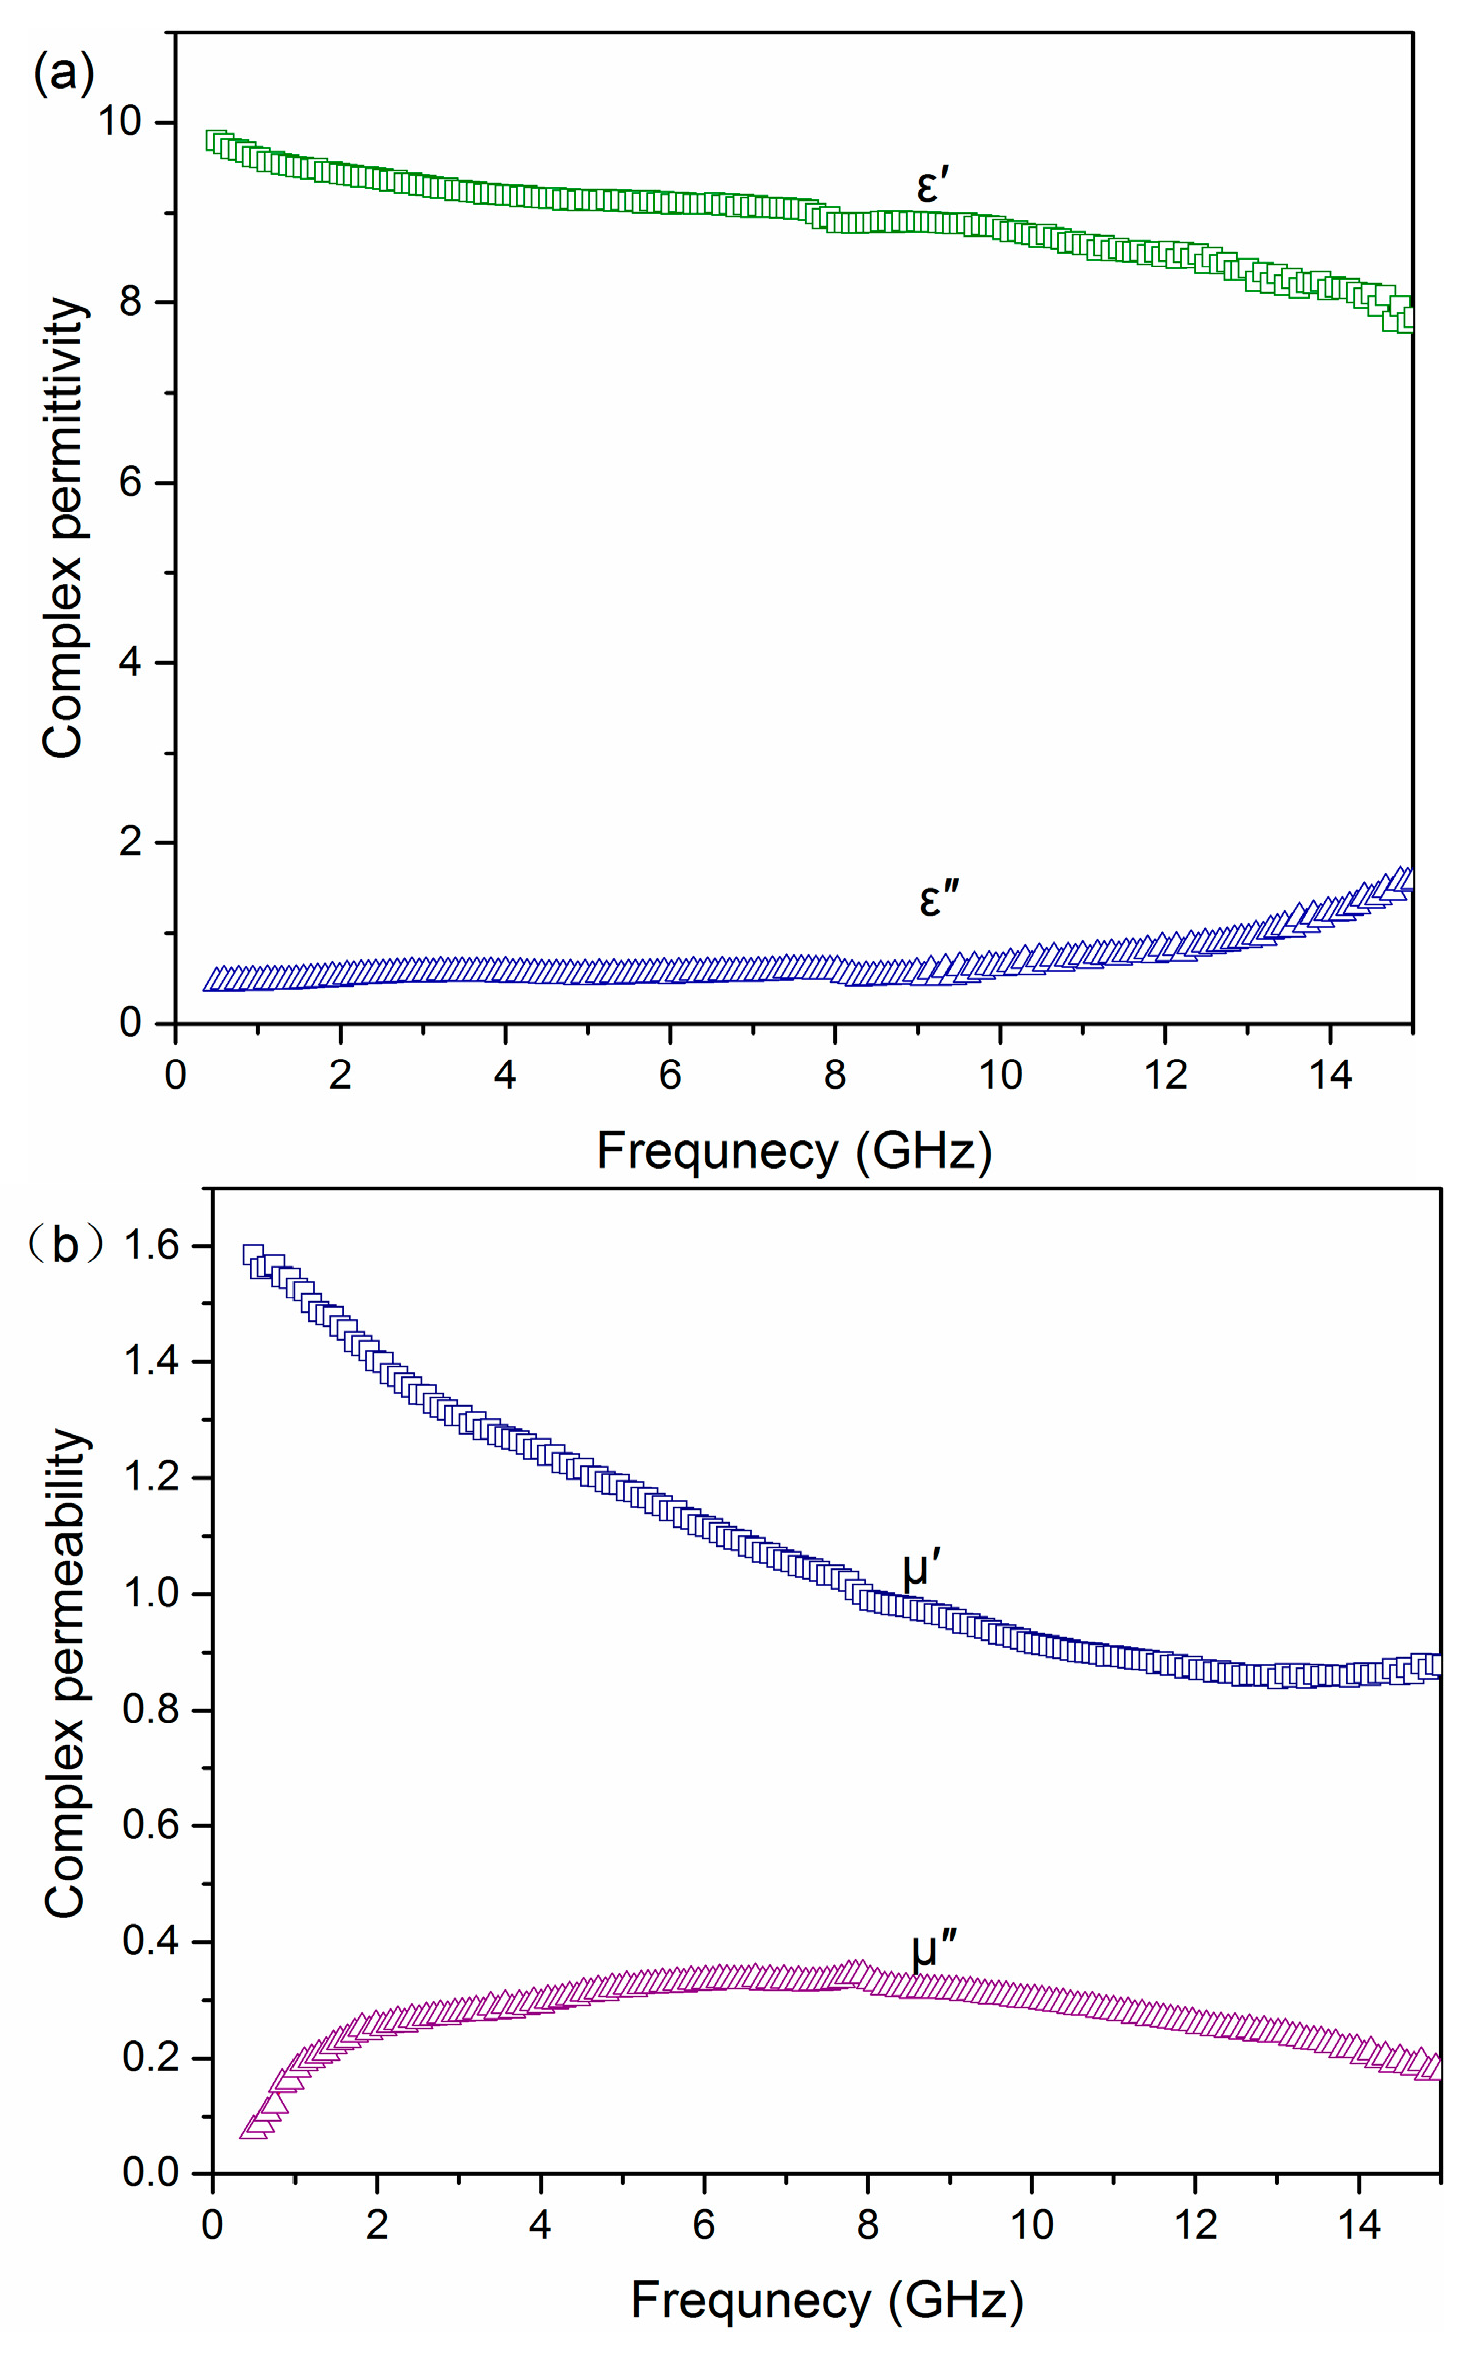
3.4. Microwave Absorption Properties

It is generally known that the microwave absorption properties of materials are reflected by the value of the reflection loss (RL), which is closely related to the complex permittivity (ε′, ε′′), permeability (μ′, μ′′) as well as the thickness of absorber layer. The complex permittivity (ε′, ε′′) and permeability (μ′, μ′′) of the Ni-P9/T200/H15 with 25 wt % paraffin are shown in Figure 7a, respectively. With the increase of frequency, the ε′ value of Ni-P9/T200/H15 gradually decreases from 9.8 to 7.0, then stabilized. Meanwhile, ε′′ increases slowly from 0.5 to 1.6. When the frequency is relatively low, interfacial polarization can be induced, but with the increase of frequency, it cannot keep up with the pace of the alternating electric field [33]. Thus, as the frequency increases, relaxation polarization loss and electric conductance loss increase, which determines the increase of dielectric loss [34]. This explains why ε′′ increases while ε′ decreases as the frequency increases. In Figure 7b, it is clearly that the real permeability µ′ first decreases in the frequency range of 0.5–14 GHz, and then followed by a slight increase. The decline of µ′ is ascribed to the hysteresis of domain-wall motion and rotation as the frequency increases [35]. In contrast, the imaginary permeability µ′′ displays a wide peak in the frequency range of 2.5–15 GHz due to the domain-wall resonance and relaxation loss [36].
According to established model for single-layer plane-wave from the transmission line theory [37], the reflection loss (RL) can be calculated by the following equations:
RL ( dB ) = 20 log | Z in Z 0 Z in + Z 0 |
z in = z 0 μ r ε r tan h ( j 2 π fd c μ r ε r )
where Zin is the normalized input characteristic impendence, Z0 is the free space impendence, f is the frequency of microwaves, d is the thickness of absorber layer, and c is the speed of light. εr and μr can be obtained by following equations εr = ε′ − jε′′ and μr = μ′ − jμ′′. The calculated results of RL of the Ni-P9/T200/H15 are shown in Figure 8. Moreover, the calculated reflection losses of pure paraffin is presented in Figure S3 (Supplementary Materials). When the thickness of absorber layer is 2, 2.5, 3, 4 and 5 mm, the corresponding minimum RL peak value is −27 dB at 13 GHz, −26 dB at 10.3 GHz, −22.5 dB at 7.9 GHz, −16 dB at 5.7 GHz and −9 dB at 16.8 GHz, respectively. It can be observed that the absorption frequency region shifts from low frequency to high frequency and its corresponding peak intensity increases as the absorber layer thickness increases. Particularly, the minimal RL of Ni-P9/T200/H15 is −42.6 dB at 17.3 GHz with 1.7 mm thickness of absorber layer, demonstrating superior electromagnetic microwave absorption properties in the Ku-band (12.0–18.0 GHz). In addition, Figure 9 shows the calculated three-dimensional representations of the RL for Ni-9 sample. It is clear that the value of the RL of Ni-P9/T200/H15 in the frequency range of 6–18 GHz is less than −20 dB, and the value of the reflection loss at 1.7 mm absorber layer is less than −40 dB. Although the RL peak value decreases as the absorber layer thickness increases, it has a wide absorption band. It is worth noting that if the value of the reflection loss is less than −20 dB, the equivalent of 99% of the electromagnetic wave will be absorbed [38,39]. More importantly, each absorber layer thickness of Ni-P9/T200/H15 corresponds to distinctly different absorption peak. This allows potential application in the notch filter [40], which is a sort of special electromagnetic shielding device that can rapidly attenuate the input signal at a certain frequency. The above results indicate that the Ni-P9/T200/H15 sample is an ideal microwave absorbing material with multi-band and strong absorption performance, which has extensive application.

4. Conclusions

In conclusion, self-assembled submicron Ni particles with different morphologies and structures were successfully prepared through a simple one-step surfactant-assisted solvothermal method. The morphologies of Ni particles were studied, indicating that the PEG as a surfactant plays an important part in the fabrication of Ni particles with the impact of stoichiometry. Meanwhile, different morphologies and structures of Ni particles including flower-like nanoflakes, chain structures, sphere-like structures, and hollow structures were obtained through altering reaction temperature and time. Importantly, these Ni particles exhibit excellent thermal stabilities with a possible growth mechanism for the variety of the structure-tuned formation. Additionally, the as-obtained Ni particles exhibit good saturation magnetization and high coercivity values as a result of the unique structures. Furthermore, the Ni-P9/T200/H15 sample exhibits excellent microwave electromagnetic properties. The absorbing layer with thickness of 1.7 mm possesses the minimum RL of −42.6 dB at 17.3 GHz. This one-pot synthesize method offers a practical, facile and economical way for preparations of Ni particles uniformly, and it is expected to have potential applications in commercial and industrial production of Ni particles.

Supplementary Materials

The following are available online at https://www.mdpi.com/1996-1944/11/2/222/s1, Figure S1: XRD patterns of Ni-P1.5/T160/H15, Figure S2: XRD patterns of Ni-P1.5/T200/H10 (a) and Ni-P1.5/T200/H15 (b). Figure S3: The calculated reflection losses of pure paraffin with thicknesses of 5 mm.

Acknowledgments

This work was supported by the National Natural Science Foundation of China (Grant Nos. 11104010 and 61474014).

Author Contributions

Xiaobin Niu and Bin Zhao designed the experiments, guided the study, and revised the manuscript; Bingxue Pu performed all the experiments, analyzed the data, and wrote the manuscript; Liping Wang, Heng Guo, Jian Yang, Haiyuan Chen, Yajun Zhou, and Jin Yang assisted in analyzing the data and assisted with manuscript preparation.

Conflicts of Interest

The authors declare no conflict of interest.

References

  1. Murray, C.B.; Sun, S.; Doyle, H.; Betley, T. Monodisperse 3D transition-metal (Co,Ni,Fe) nanoparticles and their assembly into nanoparticle superlattices. MRS Bull. 2001, 26, 985–991. [Google Scholar] [CrossRef]
  2. Miao, F.; Tao, B.; Sun, L.; Liu, T.; You, J.; Wang, L.; Chu, P.K. Preparation and characterization of novel nickel–palladium electrodes supported by silicon microchannel plates for direct methanol fuel cells. J. Power Sources 2010, 195, 146–150. [Google Scholar] [CrossRef]
  3. Yan, Y.; Cheng, G.; Wang, P.; He, D.; Chen, R. Facile hydrothermal selective fabrication of Ni(OH)2 and Ni(HCO3)2 nanoparticulates and their electrochemical performances. RSC Adv. 2014, 4, 49303–49307. [Google Scholar] [CrossRef]
  4. Maringa, A.; Mugadza, T.; Antunes, E.; Nyokong, T. Characterization and electrocatalytic behaviour of glassy carbon electrode modified with nickel nanoparticles towards amitrole detection. J. Electroanal. Chem. 2013, 700, 86–92. [Google Scholar] [CrossRef]
  5. Bao, J.; Tie, C.; Xu, Z.; Zhou, Q.; Shen, D.; Ma, Q. Template synthesis of an array of nickel nanotubules and its magnetic behavior. Adv. Mater. 2001, 13, 1631–1633. [Google Scholar] [CrossRef]
  6. Toneguzzo, P.; Viau, G.; Acher, O.; Fiévet-Vincent, F.; Fiévet, F. Monodisperse ferromagnetic particles for microwave applications. Adv. Mater. 1998, 98, 1032–1035. [Google Scholar] [CrossRef]
  7. Liu, J.; Itoh, M.; Terada, M.; Horikawa, T.; Machida, K. Enhanced electromagnetic wave absorption properties of Fe nanowires in gigaherz range. Appl. Phys. Lett. 2007, 91, 093101. [Google Scholar] [CrossRef]
  8. Li, N.; Cao, M.; Hu, C. A simple approach to spherical nickel-carbon monoliths as light-weight microwave absorbers. J. Mater. Chem. 2012, 22, 18426–18432. [Google Scholar] [CrossRef]
  9. Tao, M.; Xin, Z.; Meng, X.; Lv, Y.; Bian, Z. Impact of double-solvent impregnation on the Ni dispersion of Ni/SBA-15 catalysts and catalytic performance for the syngas methanation reaction. RSC Adv. 2016, 6, 35875–35883. [Google Scholar] [CrossRef]
  10. Roca, A.G.; Costo, R.; Rebolledo, A.F.; Veintemillas-Verdaguer, S.; Tartaj, P.; Gonzalez-Carreno, T.; Morales, M.P.; Serna, C.J. Progress in the preparation of magnetic nanoparticles for applications in biomedicine. J. Phys. D Appl. Phys. 2009, 42, 224002–224012. [Google Scholar] [CrossRef]
  11. Cao, L.; Ni, Y.; Wang, M.; Ma, X. Magnetic Ni/α-Ni(OH)2 porous superstructures: Synthesis, influencing factors and applications in the removal of heavy metals. RSC Adv. 2013, 3, 3585–3591. [Google Scholar] [CrossRef]
  12. Hu, H.; Sugawara, K. Selective synthesis of metallic nickel particles with control of shape via wet chemical process. Mater. Lett. 2008, 62, 4339–4342. [Google Scholar] [CrossRef]
  13. Qiao, L.; Han, X.; Gao, B.; Wang, J.; Wen, F.; Li, F. Microwave absorption properties of the hierarchically branched Ni nanowire composites. J. Appl. Phys. 2009, 105, 053911. [Google Scholar] [CrossRef]
  14. Xu, S.; Fei, G.; Ouyang, H.; Zhang, Y.; Huo, P.; Zhang, L. Controllable fabrication of nickel nanoparticle chains based on electrochemical corrosion. J. Mater. Chem. C 2015, 3, 2072–2079. [Google Scholar] [CrossRef]
  15. Brosseau, C.; Talbot, P. Effective magnetic permeability of Ni and Co micro- and nanoparticles embedded in a ZnO matrix. J. Appl. Phys. 2005, 97, 104325. [Google Scholar] [CrossRef]
  16. Sun, Y.; Xia, Y. Shape-controlled synthesis of gold and silver nanoparticles. Science 2002, 298, 2176–2179. [Google Scholar] [CrossRef] [PubMed]
  17. Zhang, G.; Zhao, L. Study on the morphologies of nickel crystals and their magnetic properties. Mater. Lett. 2012, 79, 142–144. [Google Scholar] [CrossRef]
  18. Tokarev, A.; Yatvin, J.; Trotsenko, O.; Locklin, J.; Minko, S. Nanostructured soft matter with magnetic nanoparticles. Adv. Funct. Mater. 2016, 26, 3761. [Google Scholar] [CrossRef]
  19. Guo, H.; Pu, B.; Chen, H.; Yang, J.; Zhou, Y.; Yang, J.; Bismark, B.; Li, H.; Niu, X. Surfactant-assisted solvothermal synthesis of pure nickel submicron spheres with microwave-absorbing properties. Nanoscale Res. Lett. 2016, 11, 352. [Google Scholar] [CrossRef] [PubMed]
  20. Chen, H.; Zhao, G.; Liu, Y. Low-temperature solution synthesis of CuO nanorods with thin diameter. Mater. Lett. 2013, 93, 60–63. [Google Scholar] [CrossRef]
  21. Cao, J.; Lü, X.; Zhao, L.; Qu, S.; Gao, W. Influence of initial growth conditions and Mg-surfactant on the quality of GaN film grown by MOVPE. J. Semicond. 2015, 36, 023005. [Google Scholar] [CrossRef]
  22. Wang, F.; Richards, V.N.; Shields, S.P.; Buhro, W.E. Kinetics and mechanisms of aggregative nanocrystal growth. Chem. Mater. 2014, 26, 5–21. [Google Scholar] [CrossRef]
  23. Zheng, H.; Smith, R.K.; Jun, Y.; Kisielowski, C.; Dahmen, U.; Alivisatos, A.P. Observation of single colloidal platinum nanocrystal growth trajectories. Science 2009, 324, 1309–1312. [Google Scholar] [CrossRef] [PubMed]
  24. Li, P.; Deng, G.; Guo, X.; Liu, H.; Jiang, W.; Li, F. Preparation of nickel and Ni3Sn nanoparticles via extension of conventional citric acid and ethylene diamine tetraacetic acid mediated solegel method. J. Alloys Compd. 2016, 668, 159–168. [Google Scholar] [CrossRef]
  25. Song, H.J.; Jia, X.H.; Yang, X.F.; Tang, H.; Li, Y.; Su, Y.T. Controllable synthesis of monodisperse polyhedral nickel nanocrystals. CrystEngComm 2012, 14, 405–410. [Google Scholar] [CrossRef]
  26. Liu, J.; Hu, R.; Liu, H.; Ma, J. Chips assembled cuboid-like nickel hydroxide/rGO composite material for high performance supercapacitors. J. Alloys Compd. 2017, 718, 349–355. [Google Scholar] [CrossRef]
  27. Patnaik, P.; Biswal, A.; Tripathy, B.; Pradhan, S.; Das, B.; Sakthivel, R.; Subbaiah, T. Synthesis and characterization of fibrous nickel hydroxide obtained from spent nickel catalyst. Trans. Nonferrous Met. Soc. China 2013, 23, 2977–2983. [Google Scholar] [CrossRef]
  28. Koltypin, Y.; Katabi, G.; Cao, X.; Prozorov, R.; Gedanken, A. Sonochemical preparation of amorphous nickel. J. Non-Cryst. Solids 1996, 201, 159–162. [Google Scholar] [CrossRef]
  29. Yoon, S.; Dornseiffer, J.; Schneller, T.; Hennings, D.; Iwaya, S.; Pithan, C.; Waser, R. Percolative BaTiO3–Ni composite nanopowders from alkoxide-mediated synthesis. J. Eur. Ceram. Soc. 2010, 30, 561–567. [Google Scholar] [CrossRef]
  30. Liu, Z.P.; Li, S.; Yang, Y.; Peng, S.; Hu, Z.K.; Qian, Y.T. Complex-surfactant-assisted hydrothermal route to ferromagnetic nickel nanobelts. Adv. Mater. 2003, 15, 1946–1948. [Google Scholar] [CrossRef]
  31. Ni, X.; Zhao, Q.; Zhang, D.; Zhang, X.; Zheng, H. Novel Hierarchical nanostructures of nickel: Self-assembly of hexagonal nanoplatelets. J. Phys. Chem. C 2007, 111, 601–605. [Google Scholar] [CrossRef]
  32. Mathew, A.; Munichandraiah, N.; Rao, G.M. Synthesis and magnetic studies of flower-like nickel nanocones. Mater. Sci. Eng. B 2009, 158, 7–12. [Google Scholar] [CrossRef]
  33. Feng, Y.; Qiu, T. Preparation, characterization and microwave absorbing properties of FeNi alloy prepared by gas atomization method. J. Alloys Compd. 2012, 513, 455–459. [Google Scholar] [CrossRef]
  34. Feng, Y.B.; Qiu, T.; Shen, C.Y. Absorbing properties and structural design of microwave absorbers based on carbonyl iron and barium ferrite. J. Magn. Magn. Mater. 2007, 318, 8–13. [Google Scholar] [CrossRef]
  35. Zhang, C.; Yao, Y.; Zhan, J.; Wu, J.; Li, C. Template-free synthesis of Ni microfibres and their electromagnetic wave absorbing properties. J. Phys. D Appl. Phys. 2013, 46, 495308. [Google Scholar] [CrossRef]
  36. Liu, J.; Feng, Y.; Qiu, T. Synthesis, characterization, and microwave absorption properties of Fe–40 wt %Ni alloy prepared by mechanical alloying and annealing. J. Magn. Magn. Mater. 2011, 323, 3071–3076. [Google Scholar] [CrossRef]
  37. Naito, Y.; Suetake, K. Application of ferrite to electromagnetic wave absorber and its characteristics. IEEE Trans. Microw. Theory Tech. 1971, 19, 65–72. [Google Scholar] [CrossRef]
  38. Michielssen, E.; Sajer, J.; Ranjithan, S.; Mittra, R. Design of lightweight, broad-band microwave absorbers using genetic algorithms. IEEE Trans. Microw. Theory Tech. 1993, 41, 0018–9480. [Google Scholar] [CrossRef]
  39. Dong, S.; Xu, M.; Wei, J.; Yang, X.; Liu, X. The preparation and wide frequency microwave absorbing properties of tri-substituted-bisphthalonitrile/Fe3O4 magnetic hybrid microspheres. J. Magn. Magn. Mater. 2014, 349, 15–20. [Google Scholar] [CrossRef]
  40. Wei, J.; Zhao, R.; Liu, X. Only Ku-band microwave absorption by Fe3O4/ferrocenyl-CuPc hybrid nanospheres. J. Magn. Magn. Mater. 2012, 324, 3323–3327. [Google Scholar] [CrossRef]
Figure 1. SEM images of Ni-P1.5/T200/H15 (a); Ni-P4.5/T200/H15 (b); Ni-P7.5/T200/H15 (c); and Ni-P9/T200/H15 (d) powders. The scale bars apply to all images in a column.
Materials 11 00222 g001
Figure 2. SEM images and corresponding particle size distributions of Ni-P1.5/T200/H10 (a,d), Ni-P1.5/T200/H15 (b,e), and Ni-P1.5/T200/H20 (c,f) powders. The scale bars apply to all images in a column.
Materials 11 00222 g002
Figure 3. SEM images and corresponding particle size distributions of Ni-P1.5/T160/H15 (a,d), Ni-P1.5/T200/H15 (b,e) and Ni-P1.5/T220/H15 (c,f) powders. The scale bars apply to all images in a column.
Materials 11 00222 g003
Figure 4. (a) XRD patterns of Ni-P1.5/T200/H15, Ni-P4.5/T200/H15, Ni-P7.5/T200/H15, and Ni-P9/T200/H15; (b) Ni-P1.5/T200/H10, Ni-P1.5/T200/H15, and Ni-P1.5/T200/H20; (c) Ni-P1.5/T220/H15, Ni-P1.5/T200/H15, and Ni-P1.5/T160/H15; (d) The intensity of XRD peaks of all samples.
Materials 11 00222 g004
Figure 5. (a) TGA curves of Ni-P1.5/T200/H15, Ni-P4.5/T200/H15, Ni-P7.5/T200/H15, and Ni-P9/T200/H15; (b) Ni-P1.5/T200/H10, Ni-P1.5/T200/H15, and Ni-P1.5/T200/H20; (c) Ni-P1.5/T220/H15, Ni-P1.5/T200/H15, and Ni-P1.5/T160/H15.
Materials 11 00222 g005
Figure 6. (a) Magnetization curves of Ni-P1.5/T200/H15, Ni-P4.5/T200/H15, Ni-P7.5/T200/H15, and Ni-P9/T200/H15; (b) Ni-P1.5/T200/H10, Ni-P1.5/T200/H15, and Ni-P1.5/T200/H20; (c) Ni-P1.5/T220/H15, Ni-P1.5/T200/H15, and Ni-P1.5/T160/H15.
Materials 11 00222 g006
Figure 7. Electromagnetic parameters of 25 wt % paraffin Ni-P9/T200/H15 sample. (a) Complex permittivity and (b) Complex permeability.
Materials 11 00222 g007
Figure 8. The calculated reflection losses of Ni-P9/T200/H15 with thicknesses of 1.7–5 mm.
Materials 11 00222 g008
Figure 9. The calculated three-dimensional representations of reflection losses of Ni-P9/T200/H15 sample.
Materials 11 00222 g009
Table 1. The detailed reaction parameters of the nickel nanoparticles.
SamplesMass of PEG (g)Temperature (°C)Time (h)Crystal Size (nm)
Ni-P1.5/T200/H151.520015730
Ni-P4.5/T200/H154.520015640
Ni-P7.5/T200/H157.520015-
Ni-P9/T200/H159.020015670
Ni-P1.5/T200/H101.520010440
Ni-P1.5/T200/H201.520020770
Ni-P1.5/T160/H151.516015470
Ni-P1.5/T220/H151.522015660
Table 2. The thermal and magnetic properties of the as-prepared samples.
SamplesMs (eum/g)Mr (eum/g)Hc (Oe)T1 (°C)T2 (°C)
Ni-P1.5/T200/H1523.53.7205.7319.24-
Ni-P4.5/T200/H1513.01.8200.8291.4326.5
Ni-P7.5/T200/H1510.21.6218.0292.2320.1
Ni-P9/T200/H155.90.87222.2292.2314.5
Ni-P1.5/T200/H1015.92.1197.8336.0-
Ni-P1.5/T200/H2036.87.4206.8337.6-
Ni-P1.5/T160/H151.10.08185.6252.5280.3
Ni-P1.5/T220/H1540.78.5216.6322.5341.6

