Synthesis of Magnesium Nickel Boride Aggregates via Borohydride Autogenous Pressure


Institute for Future Environments and Science and Engineering Faculty, Queensland University of Technology (QUT), Brisbane, QLD 4001, Australia
*
Author to whom correspondence should be addressed.
Materials 2018, 11(4), 480; https://doi.org/10.3390/ma11040480
Submission received: 2 March 2018
/
Revised: 16 March 2018
/
Accepted: 21 March 2018
/
Published: 23 March 2018
(This article belongs to the Special Issue Materials: 10th Anniversary)
Abstract
:We demonstrate synthesis of the ternary intermetallic MgNi3B2 using autogenous pressure from the reaction of NaBH4 with Mg and Ni metal powder. The decomposition of NaBH4 to H2 and B2H6 commences at low temperatures in the presence of Mg and/or Ni and promotes formation of Ni-borides and MgNi3B2 with the increase in temperature. MgNi3B2 aggregates with Ni-boride cores are formed when the reaction temperature is >670 °C and autogenous pressure is >1.7 MPa. Morphologies and microstructures suggest that solid–gas and liquid–gas reactions are dominant mechanisms and that Ni-borides form at a lower temperature than MgNi3B2. Magnetic measurements of the core-shell MgNi3B2 aggregates are consistent with ferromagnetic behaviour in contrast to stoichiometric MgNi3B2 which is diamagnetic at room temperature.
1. Introduction
Metal hydrides and metal borides, in particular, Mg-based compounds such as MgH2, MgB2, and ternary metal varieties that include Ni, are attractive materials for a range of applications including hydrogen storage [1,2,3] as well as electron transport [4,5] and/or electron storage [6]. Metal borides are commonly produced using solid-state reactions with mixed elemental components in a reducing environment at relatively high temperatures [7,8]. Liquid phase methods have been explored for production of nano-scale borides [9,10] but with increased complexity of processing due to the absence of a reactive elemental boron species that can decompose under conditions typical for nano-syntheses. In general, the intrinsic and strong covalent B–B and M–B bonding in boron-based solids [10] requires high temperature conditions to effect syntheses of metal borides.
Typical methods to produce Mg-Ni-B compounds include reacting borides or boron with metals under reducing conditions. For example, mechanical milling of MgB2 and Ni precursors followed by sintering at 975 °C with an inert atmosphere [11]; ball milling of Mg, Ni, and B powders with sintering at 800 °C [12]; or heating the elements in a sealed Ta container at 950 °C for seven days [5] results in formation of Mg-Ni-B compounds. In addition, a Mg-Ni-B compound occurs as a reaction layer (ranging from 10 µm to 20 µm thick) on MgB2 wires when fabricated with a Ni sheath [13]. The reaction layer forms by migration of Ni into the MgB2 core with heat treatments between 800 °C and 960 °C [12].
Prior to the definitive study by Manfrinetti et al. [5], reports on the composition and structure of the Mg-Ni-B phase synthesized under these conditions were inconsistent [14,15]. Proposed compositions ranged from Mg2Ni5B4 to MgNi3B2 and MgNiB [5]. Use of powder and single crystal diffraction techniques enabled clarification of the stoichiometry as MgNi3B2 with the structure shown in Figure 1. For MgNi3B2, atoms are ordered on specific sites with B arranged around Mg in a distorted hexagon as shown in Figure 1a looking down the c axis. Ni octahedral units are linked to B at both apical and equatorial sites of the Ni octahedra as shown in a perspective view in Figure 1b. In this structure, average B–B bond distances are 1.88 Å [5], consistent with typical bond lengths observed in diborides [16].
Production of boron compounds at lower temperatures than currently used in solid state synthesis is motivated by the potential for facile production at sample sizes that may scale to industrial use. This strategy has been demonstrated for MgB2 and includes the use of metal borohydrides to generate reactive gaseous boron species [17,18]. In this work, we utilise a useful attribute of NaBH4 powder when subjected to heating in the presence of specific metals [19]. This attribute is low temperature decomposition to form H2 and higher borohydride analogues catalysed by the presence of Mg and Ni [17,18]. Using an instrumented Parr-type reactor, we delineate the conditions for formation of MgNi3B2 and describe a possible mechanism for synthesis at temperatures above 670 °C.
2. Materials and Methods
2.1. Boride Synthesis
Molar ratios of Mg powder (<50 mesh size; 99.9% purity), Ni (<150 μm; 99.99% purity), and NaBH4 powder (99.99% purity) supplied by Sigma-Aldrich (Saint Louis, MO, USA) are weighed, ground in an agate mortar and placed into a 50 mL Parr reactor within a controlled atmosphere glove box containing Argon (99.99% purity). The reactor is designed with an internal fixed head and cylinder of Inconel 601 steel with a graphite seal to accommodate a maximum pressure of 20 MPa and a maximum average temperature of 725 °C at the base of the reactor. Prior to use, the reactor is thoroughly washed with water and dried in a vacuum oven up to 120 °C overnight. For some experiments, a boron nitride sleeve is introduced into the reactor to minimise reaction with the Ni-rich side-walls of the reactor.
The starting materials are added to the reactor, sealed tightly, and removed from the glove box. The reaction chamber is heated according to a standard protocol via thermocouple controller. The change in pressure is monitored during the reaction using a dial pressure gauge and an Ashcroft transducer mounted atop the reaction chamber. The temperature sensor is centred within the reactor and both temperature and pressure are recorded every minute. The temperature sensor is not embedded within the precursor materials which, at the start of synthesis, are located at the bottom of the chamber.
The reactor design results in a thermal gradient between the bottom and top of the reactor during ramp up to the equilibration temperature. This gradient depends on the operating temperature recorded at the thermocouple and location within the reactor. For example, at a thermocouple reading of 500 °C at the centre of the reactor, the difference in temperature at the top or bottom of the reactor could be up to ±225 °C. The thermocouple measurements record average temperatures within the reactor and, as shown in Figure 2a, indicate progress of the reaction over time. This record provides an indirect measure of reaction stability (e.g., at equilibria; endothermic, exothermic) within a closed environment. An advantage of this reactor design is that gaseous phases such as sodium and sodium hydride condense at the cooler top of the reactor [18]. On cooling the reaction chamber to room temperature, the reactor is opened in the argon-filled glove box via slow pressure equilibration using a gas release valve.
A consistent heating rate of 10 °C/min is used in all reactions albeit at different temperatures, the heating rate is held constant for varying periods of time. In general, the reactor heating rate is held constant at selected base temperatures of: (i) ~140 °C; (ii) 420 °C; and (iii) 670 °C or 725 °C for variable periods of time. These specific heating rates and constant temperature periods are identified in Table 1, noting that Tmax values are estimated for the base of the reactor.
2.2. Characterisation
Polycrystalline samples are characterized using X-ray powder diffraction and electron microscopy equipped with microanalysis. X-ray powder diffraction patterns are obtained using either Cu Kα1 or Co Kα1 radiation in Bragg Brentano geometry with 0.02° 2θ steps and a counting time of 10 s per step using PANalytical X-ray diffractometers. Diffraction patterns are refined and indexed using the software program Topas (Florence, KY, USA) [20]. X-ray diffraction patterns and electron microscopy indicate that all synthesised samples are multiphase with MgNi3B2 as a predominant phase. Samples with high proportions of MgNi3B2 (i.e., >80%) were selected for additional data collection using a PANalytical X-ray diffractometer (Almelo, The Netherlands) for subsequent Rietveld refinement using Topas. Schematic models of crystal structures shown in Figure 1 are built using data from Manfrinetti et al. [5] as input to the program VESTA [21].
Gases generated during reactions are collected for analysis at selected thermocouple temperatures of 65 °C and 120 °C using a Hamilton gas-tight syringe. These temperatures are correlated to base temperature of 120 °C and 200 °C, respectively. These gases are characterised using a Sercon 20–22 isotope mass spectrometer coupled with a GSL elemental analyser unit standardised to Ar and He. Additional gas analyses standardised for CO2, CH4 and N2O are undertaken with a Maestro MPS Headspace (Linthicum, MD, USA) and Agilent 7890A Gas Chromatograph (Santa Clara, CA, USA).
A Zeiss Sigma Field Emission SEM (Carl Zeiss Pty Ltd., North Ryde, Australia) equipped with an Oxford Instruments SDD detector (Abington, UK) is used for microscopy observations and energy dispersive spectroscopy (EDS) analysis. Samples are prepared for SEM/EDS by placing a thin layer of powder onto aluminium stubs with double-sided carbon tape. In general, samples are not coated with a conductive coating to avoid analytical interference(s). Elemental analysis is carried out at an accelerating voltage of 15 kV at 8.5 mm working distance. Excessively charging samples are imaged at lower accelerating voltages of 5 kV or 10 kV.
Quantitative elemental analyses are performed using a JEOL JXA 8530F field emission electron probe microanalyzer (FE-EPMA, JEOL, Tokyo, Japan) equipped with five wavelength-dispersive spectrometers (WDS) and using Probe for EPMA software (Eugene, OR, USA). For these analyses, powder samples are mixed with conductive resin and placed in a 30 mm diameter mould inside a hot mounting press. The sample mount is polished with a series of diamond pads and cloths to a mirror finish suited to electron microprobe analysis. Spot analyses on borides are performed using the following combined conditions: B and Mg Kα X-ray intensities are measured simultaneously at 7 kV accelerating voltage, followed immediately by intensity measurement of the Ni Kα X-ray line at 15 kV accelerating voltage. A focused beam is utilized and beam current maintained at 40 nA under both conditions.
For EPMA data reduction, the PROZA φ(ρz) matrix correction method of Bastin [22,23] is employed along with the MACJTA database of mass absorption coefficients. B Kα radiation is measured using an LDEB analyzing crystal (2d ~ 15nm) and an open detector slit (GFPC), while TAP and LIF analyzing crystals are used for Mg and Ni, respectively. An anti-contamination cold finger cooled by liquid nitrogen is used during all acquisitions. Standards include MgO, Ni90Fe10 alloy, and in-house MgB2. To avoid analytical errors associated with peak shift and peak shape changes for boron, the integrated intensity method for acquisition of full peak intensity is used in the Probe for EPMA software. The scan length for the boron peak corresponds to an energy range from ~160 eV to 270 eV with a counting time of 180 s for the integrated intensity measurement, followed by 60 s for background positions either side of the peak. An exponential fit to the background positions is used to model the background intensity under the peak. On and off-peak count times are 10 s for Ni and 20 s for Mg. Accompanying elemental X-ray maps of individual powder particles by WDS on the electron microprobe are conducted at 7 kV accelerating voltage, 40 nA beam current, and 20 ms dwell time in beam scanning mode.
In this study, the beam produced by a 7 kV and fully focused 40 nA source is chosen to reduce the electron beam-specimen interaction volume to <1 µm for boron and magnesium. The detection limits under the combined conditions are 0.16 wt % for B, 0.02 wt % for Mg, and 0.04 wt % for Ni. The average analytical error for boron for individual spot analyses is 8.7%. A statistical program is used to determine the envelope for production of characteristic X-rays using the EPMA under these operating conditions. At 7 kV the lateral and vertical spatial resolution for excitation of the Kα X-ray lines of B and Mg is <1 µm, as is that of the Ni Kα X-ray line at 15 kV as calculated using the CASINO Monte Carlo modeling program [24] for electron trajectories (Figure 3).
DC magnetization measurements are performed using a Cryogenics Ltd. Mini cryogen-free 5 T system (London, UK). Magnetization field isothermal loop is determined within ±5 T at 290 K.
3. Results
In general, data presented in this work are a summary of more than twenty-five separate experiments, including repeat syntheses, across a range of temperature and pressure conditions. Previous syntheses using metal borohydrides [17,18] have been used to guide the synthesis strategy for optimum production of MgNi3B2.
3.1. Synthesis
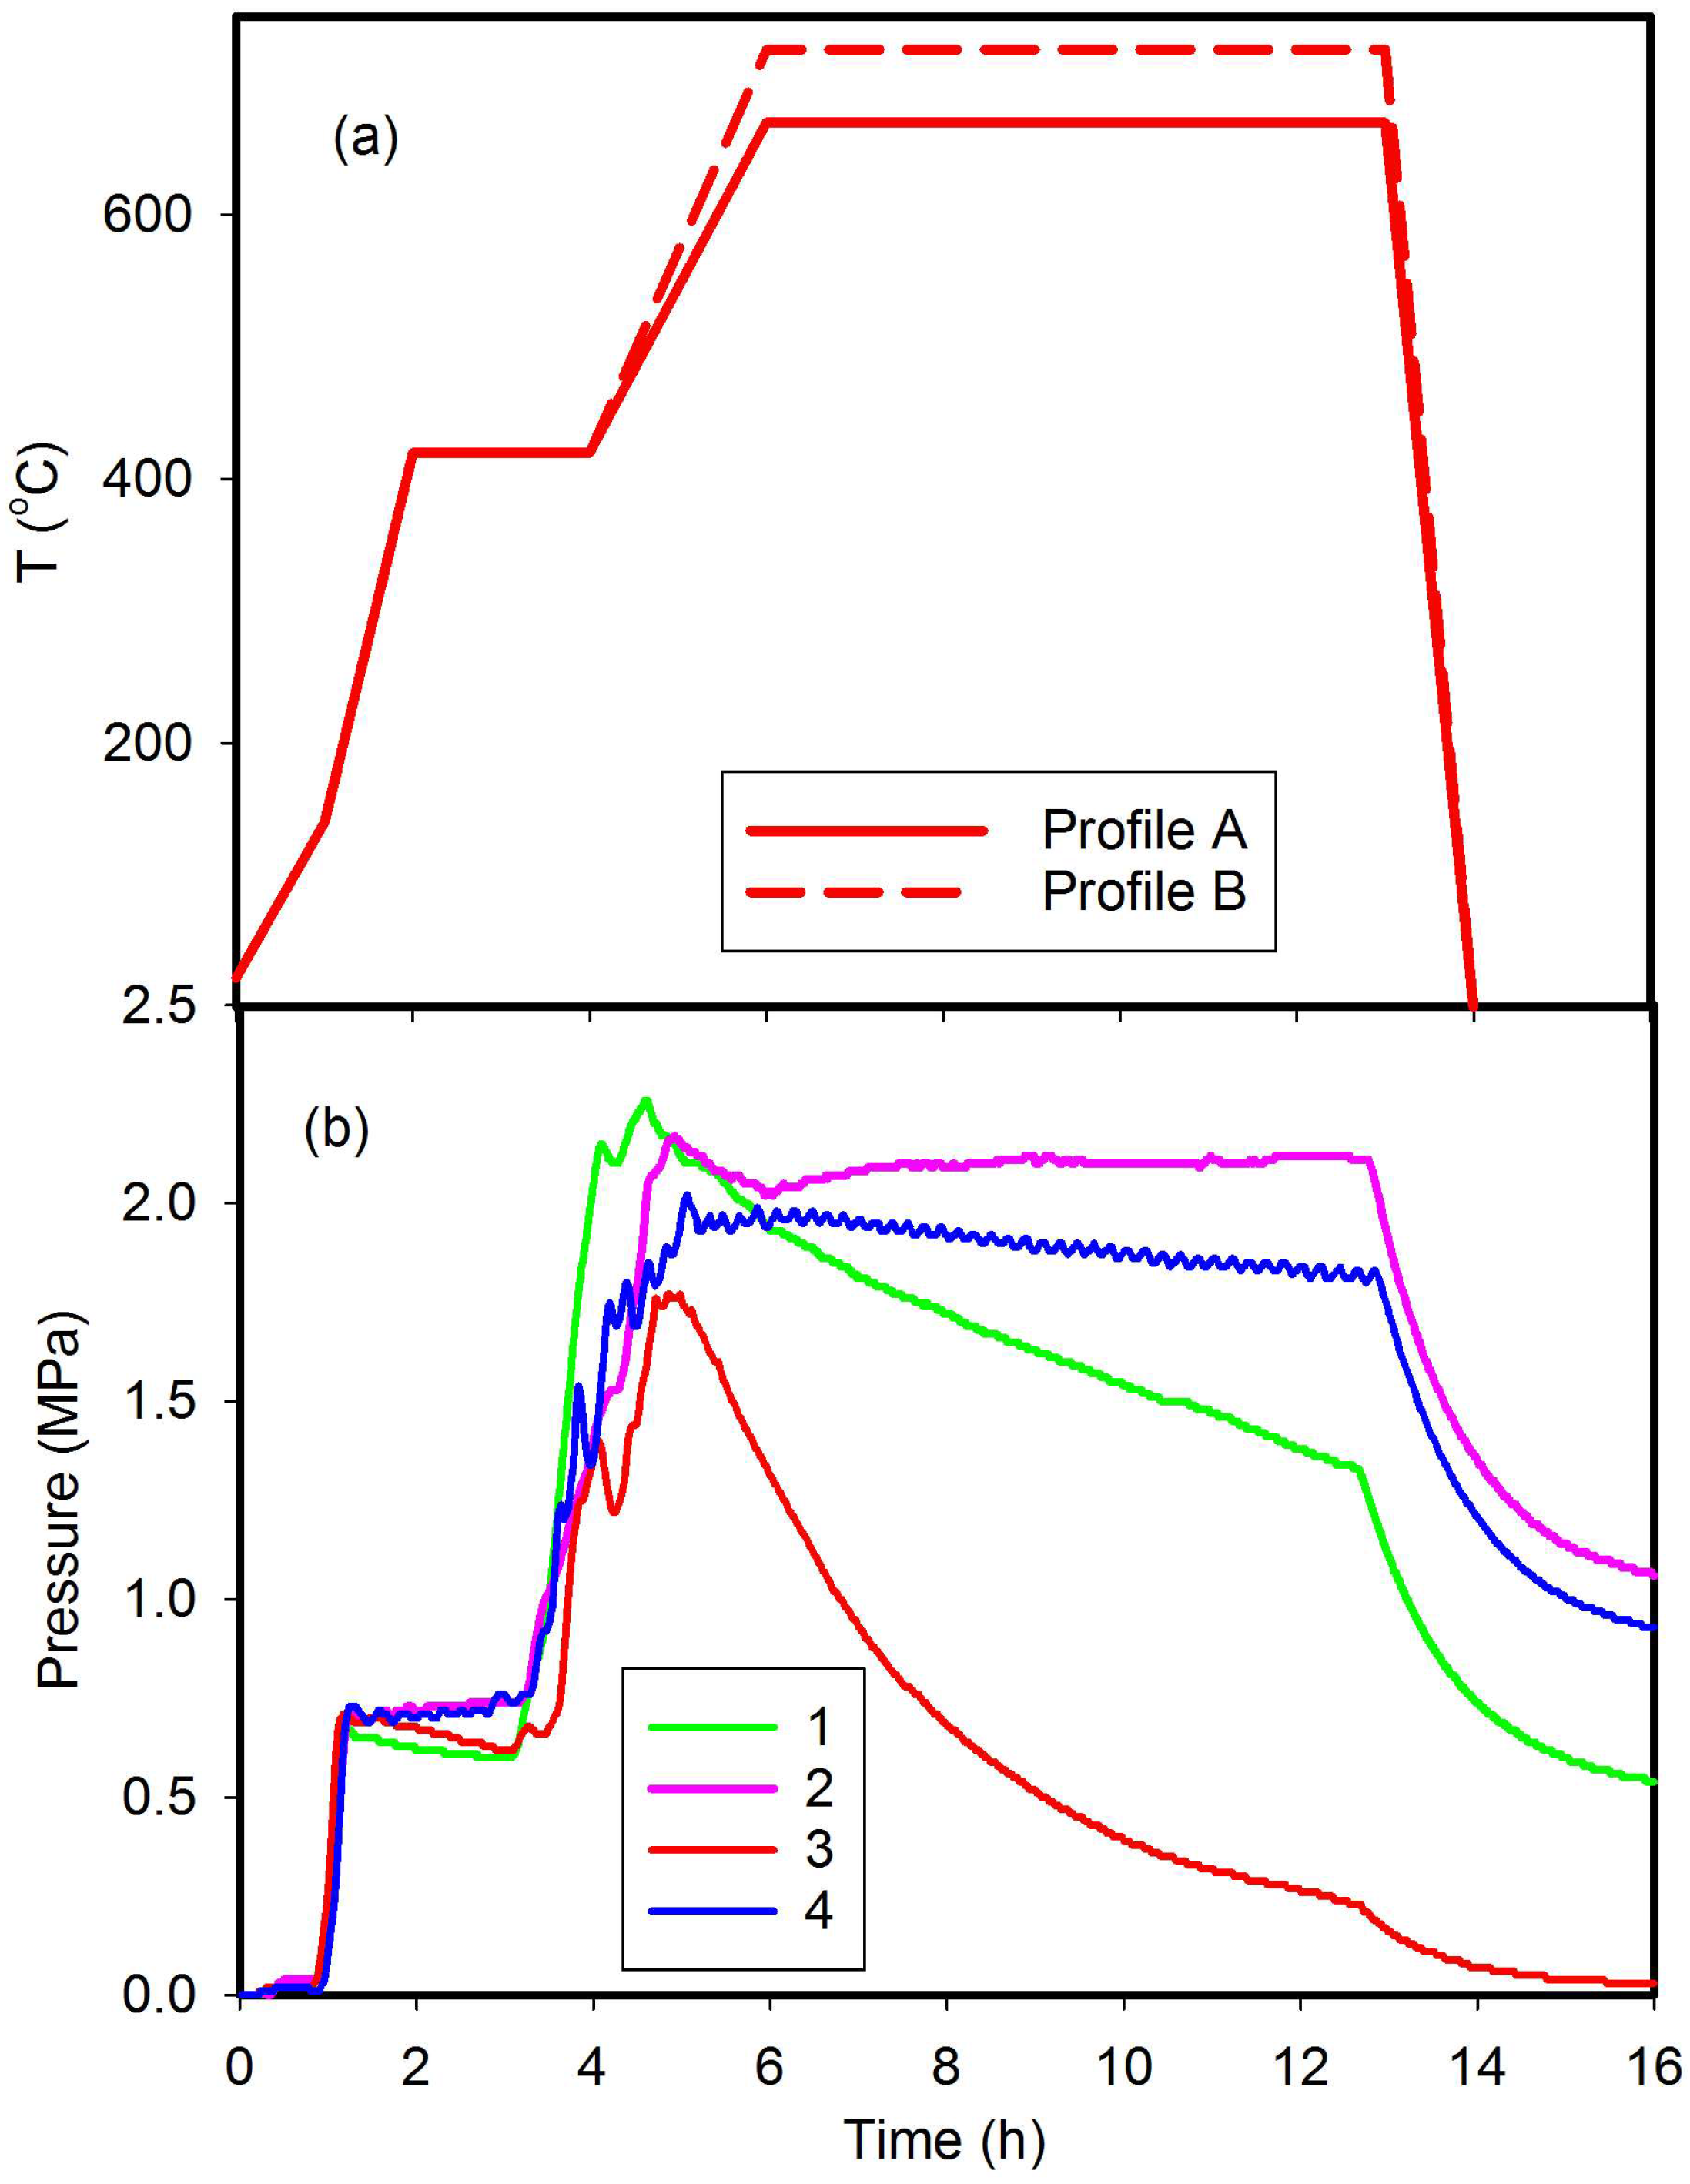
Figure 2a shows typical heating profiles that result in synthesis of MgNi3B2 using the 50 mL reactor including a heating profile for Run 1 listed in Table 1. The pressure profiles for reactions in Runs 1–4, which are most representative of this compositional suite, are shown in Figure 2b. In all reactions, pressure increases to a maximum value (Pmax) ranging between 1.7 MPa and 2.5 MPa when the reactor is at the maximum temperature (Tmax). The rate of pressure decrease after Pmax is achieved varies for each reaction listed in Table 1, and is dependent on a number of variables including the ratio of starting materials within the reactor.
In all cases, MgNi3B2 is the major phase based on X-ray diffraction data and Rietveld refinement using Topas software. An excess of NaBH4 in the starting mixture results in a higher percentage of Ni-B phases and a lower percentage of MgNi3B2 (see Table 1). Table 1 describes generic variables that affect the relative proportions of MgNi3B2 product. For example, a higher Tmax value of 725 °C at the base results in a higher yield of MgNi3B2 for the same molar ratio of starting materials and similar levels of autogenous pressure (i.e., Run numbers 1 and 2). Similarly, for Tmax = 670 °C, a higher autogenous pressure may also result in a higher yield of MgNi3B2 (i.e., Runs 3 and 4). In general, the optimum base temperature and pressure range for highest yield of MgNi3B2 is between 670 °C–725 °C and 2.0 MPa–2.2 MPa.
3.2. Structure Determination
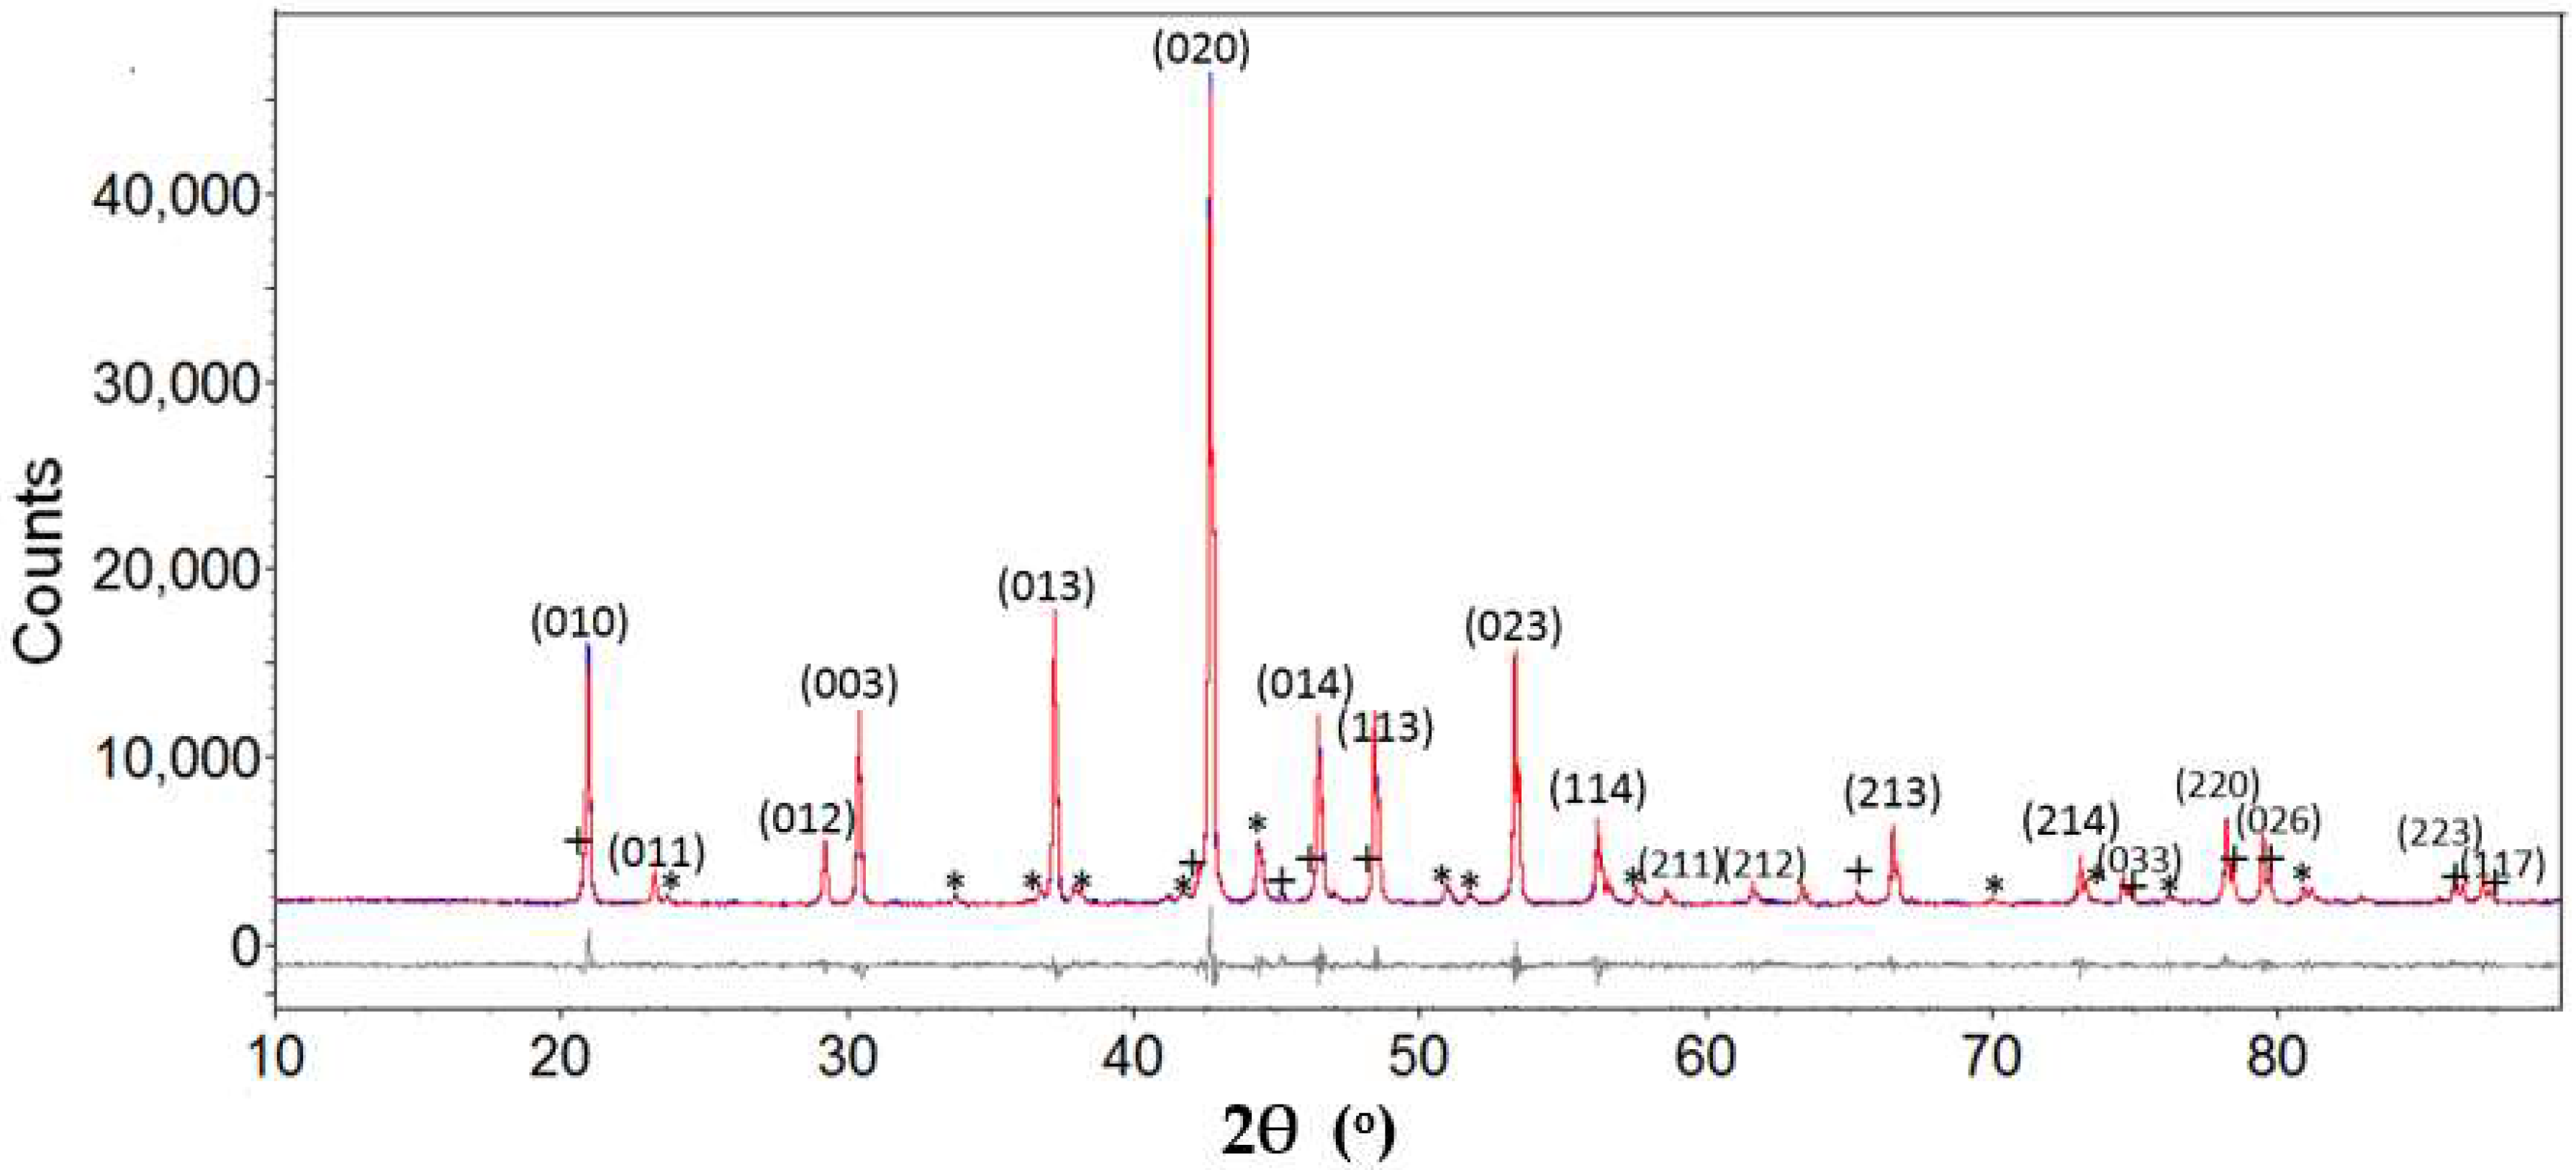
Powder diffraction patterns from selected samples listed in Table 1 are re-collected at a higher resolution using Cu Kα radiation for counting times suited to Rietveld refinement using TOPAS. Structural data from Manfrinetti et al. [5] are used as input to refinement of XRD data for these samples. Table 2 shows refined data for MgNi3B2 from this study compared with that by Manfrinetti et al. [5] based on data collected from a single crystal. Refined lattice parameters on the MgNi3B2 phase from this study are in good agreement with results reported by Manfrinetti et al. [5]. The resulting diffraction profile after Rietveld refinement of the Run 1 sample is shown in Figure 4. Phase analysis of this diffraction data also shows minor presence of other compounds including MgNi6.7B2 (7%) and MgNi7B3, (2%) with lower amounts of Ni-B phases.
3.3. Morphology and Microstructure
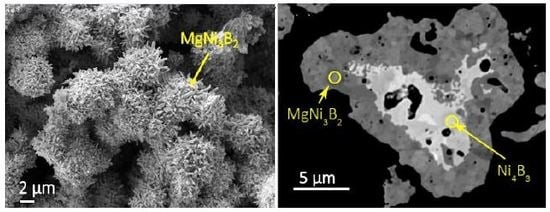
Representative SEM images of MgNi3B2 powder obtained from Run 1 are shown in Figure 5. Two different morphologies—one resembling a flower and the other a cauliflower—are common forms in all samples examined from these syntheses. Close observation of individual morphologies in Figure 5 reveals that a single flower comprises hexagonal rod-like crystals <200 nm diameter with lengths ranging between 1 μm and 2 μm. The inset shows a higher magnification image of the cauliflower-shaped MgNi3B2 morphology. Smooth, rounded particles with sizes varying from 50 nm up to several hundred nm form micron-sized agglomerates as shown in Figure 5a (inset). Figure 5c,d are SEM images of as-prepared powder from Run 5 with aggregates of nanometre sized particles arranged as hollow Mg-Ni-B shells or as remnant broken outlines of partially spherical shells without Ni-B cores.
A polished section of MgNi3B2 grains produced from Run 3 is shown in Figure 6. The SEM image shows a ~15 μm × ~10 μm aggregate with different image contrast between the core and outer regions (Figure 6a). Figure 6b,c show the distribution of Ni and Mg within this aggregate using X-ray mapping. Ni is evenly distributed within the aggregate but it is clear that Mg is concentrated in the outer rim (Figure 6c). For this particular analysis using the FeSEM, the total collection time to acquire a boron signal with sufficient statistical certainty is >10 h which, with stage drift, precludes superposition of the boron distribution on these images.
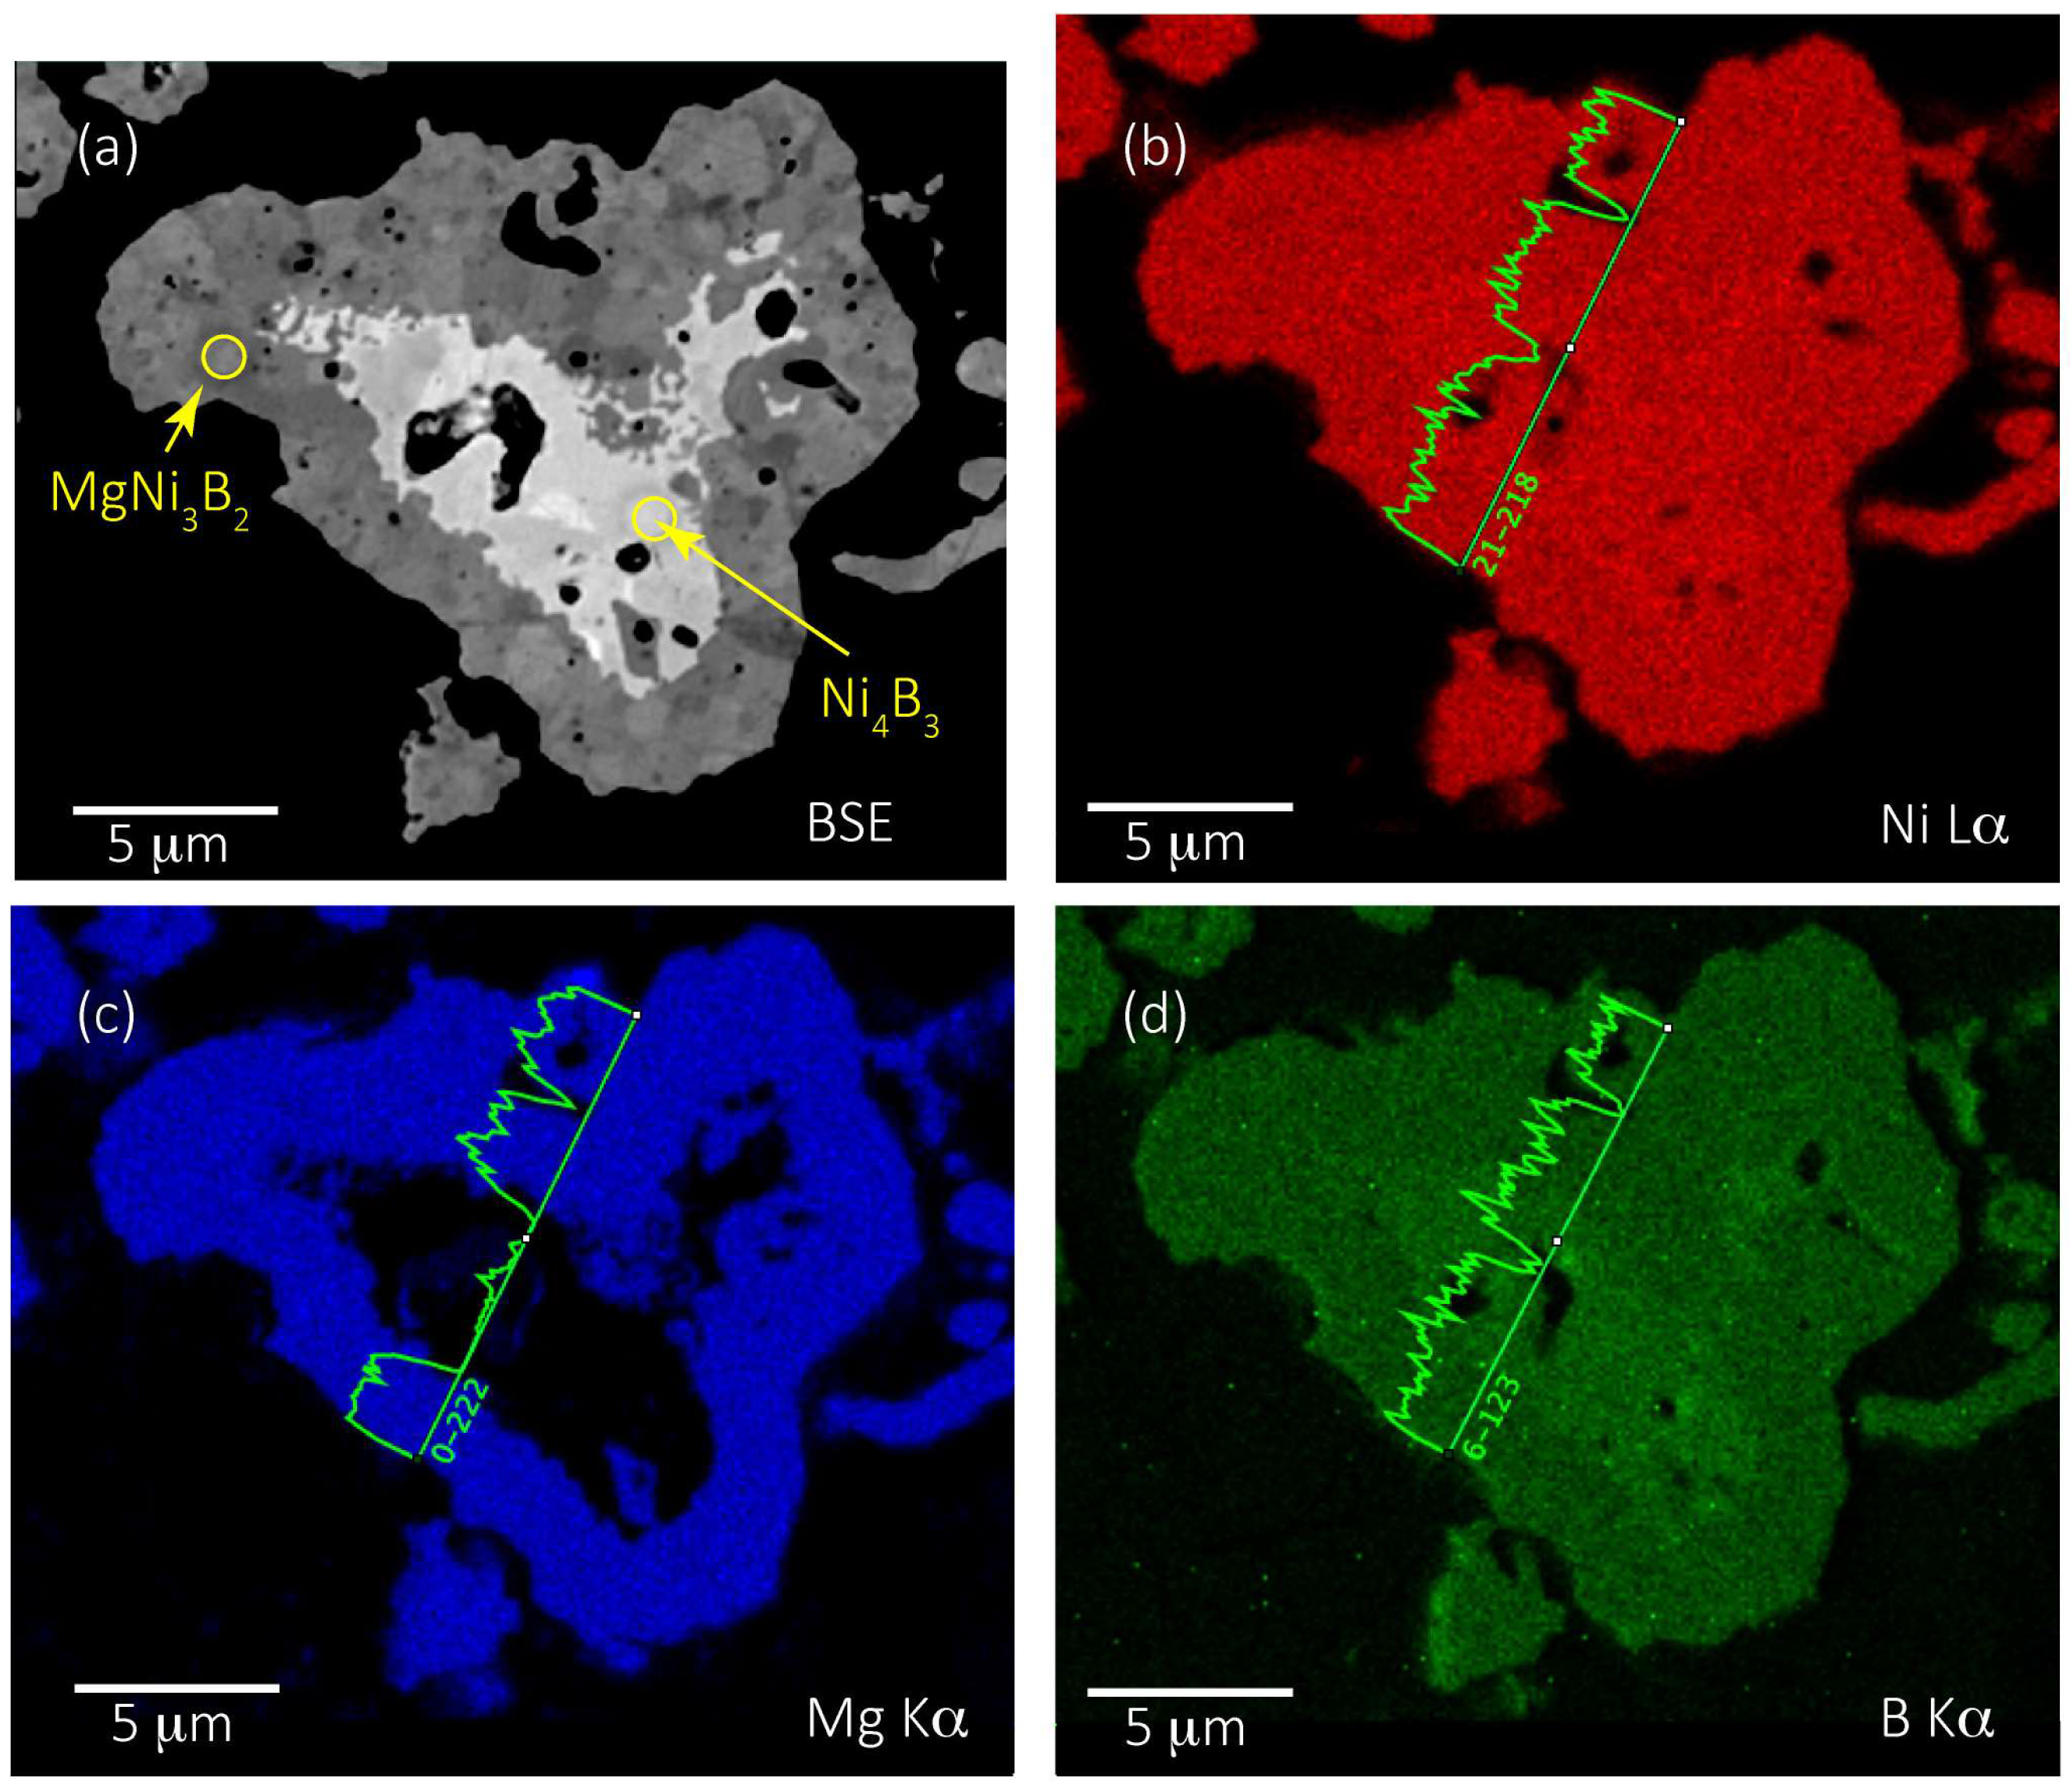
A more precise method that also allows a high signal to noise ratio for low atomic number elemental X-ray mapping is EPMA. This method also enables quantitative spot analyses with a spatial resolution of 1 µm or less (see Section 2.2) of polished samples. In this work, we selected Mg, Ni, and B for analysis using WDS. An example of X-ray mapping by WDS for an aggregate from Run 5 is shown in Figure 7. Figure 7a is a backscattered electron image of the aggregate with accompanying element distributions for Mg, Ni, and B in Figure 7b–d. The backscattered electron image shows a wide variation in image contrast typically ascribed to variations in relative mean atomic number. In general, lighter regions in a backscattered electron image are higher in atomic number than darker regions [25].
The X-ray maps and detailed line scans in Figure 7b–d show that Ni and B are concentrated in the centre, or core, of the aggregate while all three elements are present in the outer margins. Mg is absent in the core of this aggregate. The map and line scan in Figure 7d show an increase in relative B concentration in the Ni-rich core region. This microstructure, that is, a core of Ni-B and an outer margin of Mg-Ni-B, is a common attribute of grains analysed from each of the syntheses listed in Table 1. Close inspection of Figure 7a also indicates a nuanced variation in image contrast within the outer margin of the aggregate. This characteristic is due to variations in orientation of the individual MgNi3B2 crystals that comprise the aggregate.
Figure 8 is a backscattered electron image of an aggregate from Run 3 (Table 1) showing a lighter core region and an outer, darker margin as well as locations of spot analyses using the EPMA. Again, the lighter region shows high levels of Ni and B and minimal or no Mg. Variations in crystal orientation are discernible in the Mg-rich outer margins of this aggregate from Run 3.
Table 3 provides average compositions measured by electron microprobe of selected spots in different aggregates from Runs 3 and 5. The number of point analyses for designated regions of the aggregates are listed in Table 3. These data show that the concentration of Mg in many core regions of aggregates is below detection under the given conditions. Nevertheless, the concentration of boron ranges between 5.53 wt % and 12.2 wt %, and the concentration of nickel between 87.2 wt % and 93.5 wt % in the cores of aggregates.
As shown in Table 3, the stoichiometry of Ni-B phases within the core regions includes Ni2B, Ni3B, and less commonly Ni4B3. In the outer margin, or shell regions of these aggregates, the concentration of magnesium, nickel, and boron is ~11.5 wt %, ~79 wt %, and 9 wt %, respectively. The stoichiometry of this outer margin is MgNi3B2, consistent with X-ray diffraction data. In Run 5, aggregates show a core region with some Mg content (Table 3; Run 5, “core 1”). The consistency of analyses, judged not only by the total element weight percent but also by the low standard deviations per element, suggests that this composition, MgNi10.5B3, may be an additional phase within the Mg-Ni-B compositional suite.
Figure 9a,b show secondary electron images of polished reaction product from Run 5. In these examples, the core region appears as an elevated mound which in one case is intact, while in the other (Figure 9b), part of the core region is removed. Figure 9c,d are backscattered electron images of the sample from Run 5. The Mg-Ni-B shell with Ni-B core structure is evident for this sample after a reaction time of 40 h. The backscattered electron image in Figure 9d again shows a core region that is removed from the Mg-Ni-B aggregate, presumably via the sample polishing step.
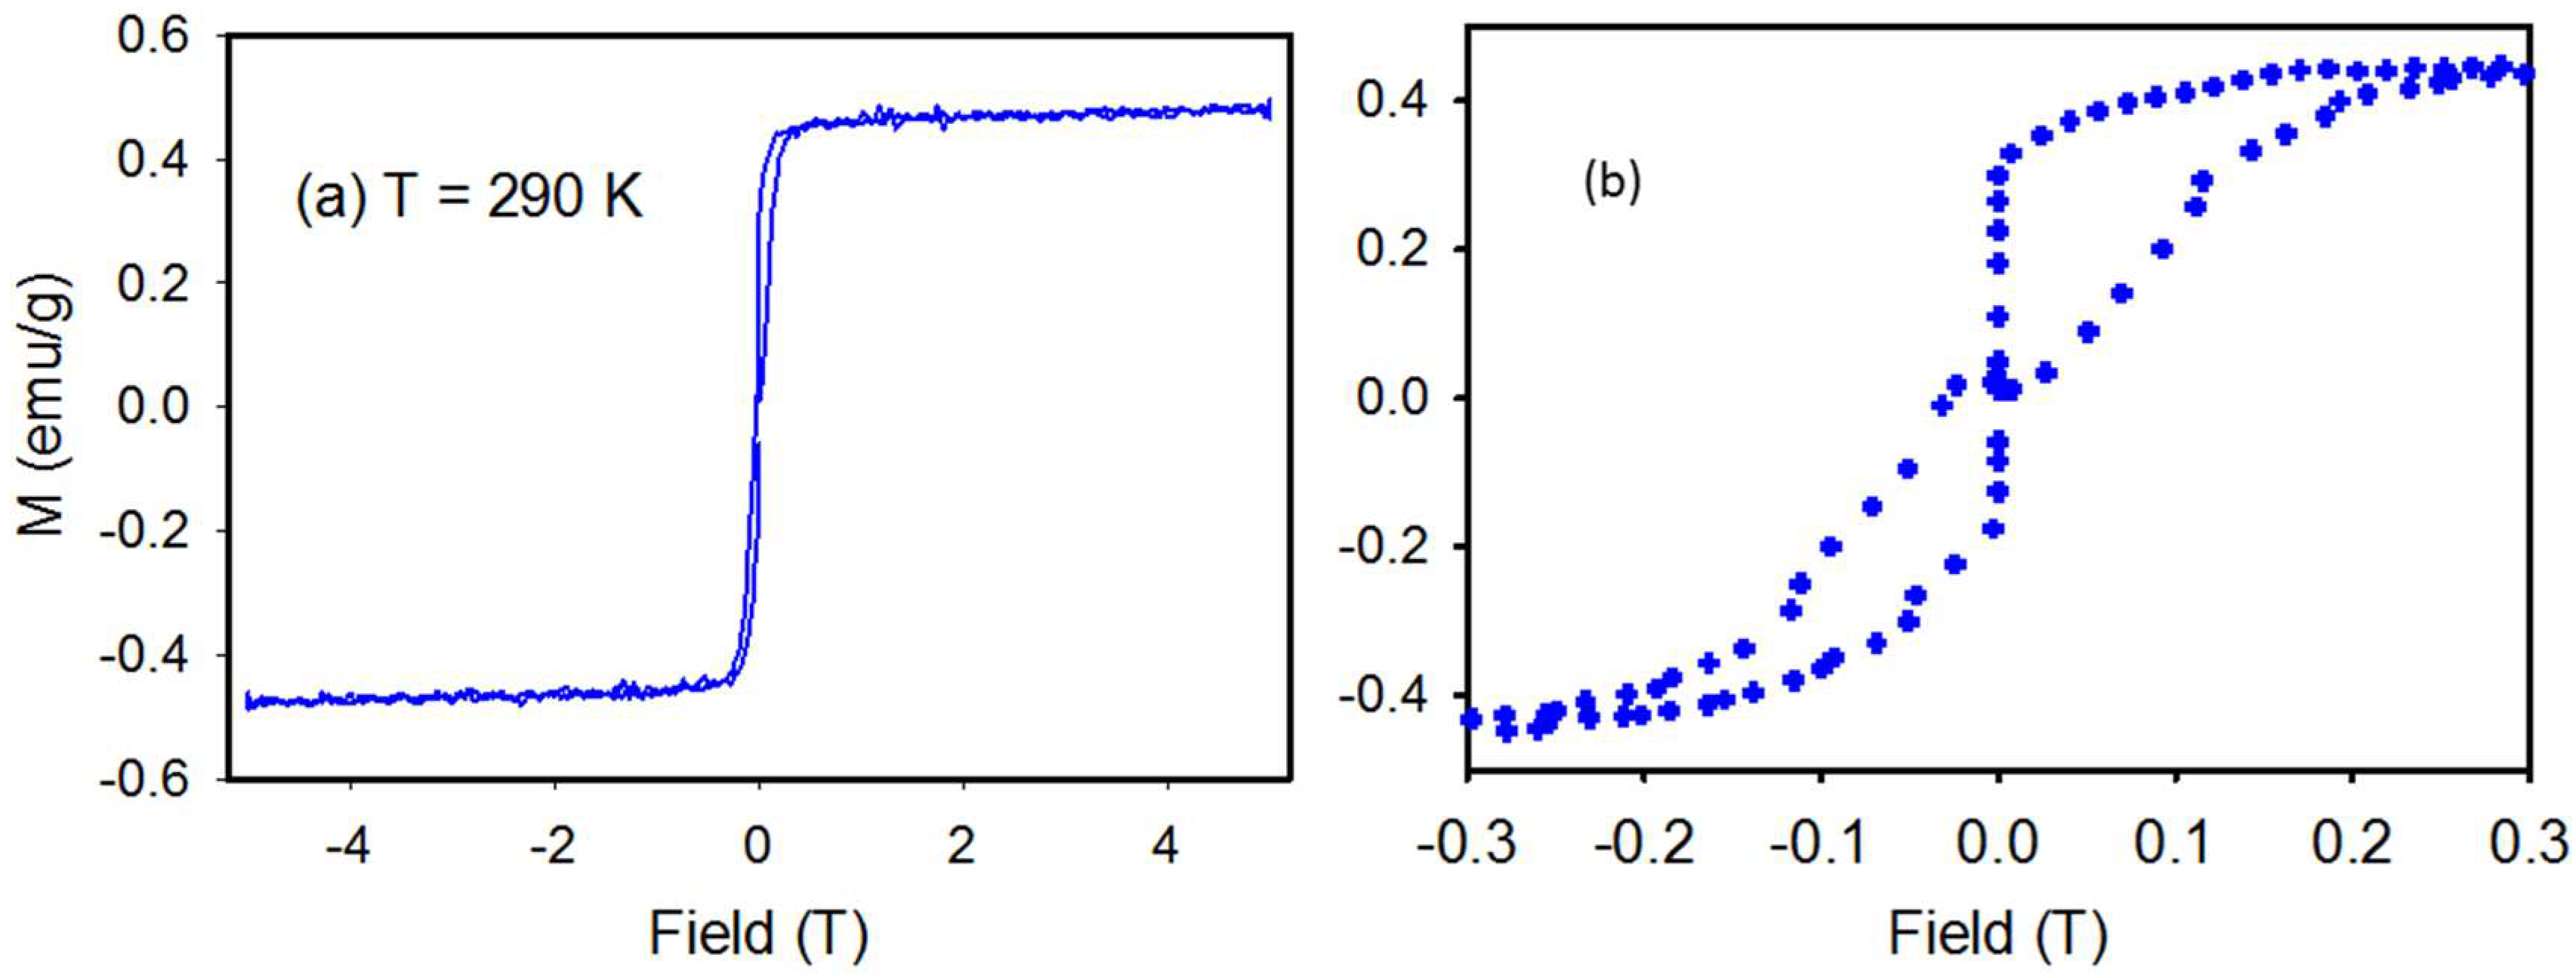
Figure 10a shows a magnetic hysteresis loop at 290 K measured over a ±5 T field for product from Run 4. The magnetization increases with increasing magnetic field and then saturates at 0.2 T with a saturation value of 0.45 emu/g. Figure 10b shows the relatively narrow hysteresis loop with a coercivity field of 250 Oe.
4. Discussion
Interest in Mg-Ni and Mg-Ni-B compounds is predominantly associated with their potential for use in Ni-metal hydride batteries [26,27] and for hydrogen storage [28,29]. In this latter instance, addition of MgNi3B2 to a metal hydride system (e.g., LiBH4-MgH2) provides a catalytic effect that increases hydrogen storage by ~9% [28]. Further work [29,30] shows that addition of Ni-B to the same system also enables growth of MgNi3B2 in the dehydriding process. Thus, while MgNi3B2 appears to be an ineffective material for hydrogen storage per se [14], the phase may be important in the evolution of effective hydrogen storage technology. Other compositions within the Mg-Ni-B phase space are also of interest, in particular MgNi7B3 [4] and a new ternary diboride suite with compositions Mg3+xNi7-xB2 [31]. This new diboride suite is also amenable to metal doping with consequent influence on magnetic properties [31]. In this discussion, we focus on MgNi3B2 and other compounds formed under autogenous pressure conditions.
4.1. Synthesis of MgNi3B2
In earlier work, we described an approach to synthesise MgB2 using autogenous pressure generated by the decomposition of NaBH4 or KBH4 [17,18] in the same type of reactor as in this study. In this earlier work we inferred, on the basis of pressure–temperature data [18], that in the presence of Mg, NaBH4 begins to decompose at ~80 °C–120 °C resulting in the formation of H2 (g) and B2H6 (g) and higher order borohydrides as noted by earlier researchers [19,32]. We also inferred higher temperature gas–solid reactions in this type of reactor under a range of conditions [17,18]. In these earlier studies, we used the thermocouple reading at the centre of the reactor to estimate the temperatures of these reactions. In this work, we have recalibrated the reactor to provide an estimate of the temperature experienced by the starting materials at the base of the reactor, in particular, at the hold temperatures used in all experiments and using the same ramp rates.
Puszkiel and Gennari note that alkali metal borohydrides do not desorb hydrogen below ~400 °C [30]. However, our earlier work [17,18] and analyses of gases produced during the reactions shown in Table 1 suggest otherwise. Accordingly, our analyses of gases sampled when the reactor thermocouple readings are 65 °C and 120 °C show the presence of H2 at 5% and 15% content, respectively. Our calibration of the thermocouple reading with the measured temperature at the base of the reactor suggests that NaBH4 experiences maximum temperatures between 120 °C and 200 °C, respectively, at each of these gas sampling points. Thus, with no other source for H2 gas, we conclude that this is derived from the initial production of B2H6 via catalytic decomposition of NaBH4 [19,32].
As a further check on gas composition, NO2 gas concentrations are measured at 0.03 ppm and 0.05 ppm while CO2 is 83 ppm and 127 ppm for the 120 °C and 200 °C samples, respectively. Methane is measured at 3.83% and 1.97% for the 120 °C and 200 °C samples, respectively. For gas analyses in this work, an additional signal shows a mass number equivalent to B2H6 is also present. This mass number may be equivalent to O2 albeit under all conditions the opportunity for gas leakage into or out of the sample container is minimal, as indicated by the NO2 and CO2 gas concentrations. Nevertheless, our analytical tools are not explicitly benchmarked against a standard B2H6 aliquot. Hence, we infer that B2H6 is also present in the reactor due to the catalytic decomposition of NaBH4.
The increase in pressure up to and including T ∼ 420 °C as shown in Figure 2 is primarily due to the evolution of H2 and B2H6 and the formation of higher borohydrides [17]. Figure 3 shows an increase in reactor pressure as the thermocouple reading increases up to 420 °C at which the ramp rate is held for 20 min. With continued heating, the pressure decreases slightly due to the formation of higher order diborane species [33] or hydrides such as MgH2 [4,34]. MgH2 nanofibres form via reaction with Mg and H2 gas at a pressure of 1 MPa to 2.5 MPa in the range 420 °C < T < 725 °C [34] and also form under similar autogenous pressure conditions with the reaction between Mg and NaBH4 [18]. Decomposition of NaBH4 is accelerated in the presence of Ni and Mg as well as by intermediate phases such as MgH2 [18,35]. The hydride, Mg2NiH4, also forms via the mechanical milling reaction of MgH2 with Ni at temperatures >400 °C and pressures >8 MPa [36,37]. As noted in earlier work, formation of MgH2 is a likely intermediate step during heating of the reactor to >420 °C [18]. This intermediate phase enables formation of other Mg-Ni, Mg-B, Ni-B, and Mg-Ni-B compounds at higher temperatures [17].
In this process, a range of competing reactions—both solid–liquid, solid–gas, and liquid–gas—occur as the temperature is increased to Tmax. At ~420 °C, the formation of MgH2 and further decomposition of NaBH4 and higher order diboranes occurs [18]. In addition, as T > 500 °C other intermediate phases such as Mg(BH4)2, NaMgH3, and MgB2 are likely to form [17]. We have also explored the reactions of Ni metal with NaBH4 under similar conditions and note that Ni-B compounds form at autogenous pressures ranging between 1 MPa and 2 MPa and thermocouple temperatures of 500 °C < T < 725 °C (unpublished data). At these higher temperatures in the presence of H2 and borohydride gasses, we suggest that Mg-Ni hydrides and Mg-Ni borides form. Other likely phases include alkali metal composites similar to that described by Shao et al. [29] which include LiH-MgB2 with Ni-B particles. The work by Shao et al. [29] shows that MgNi3B2 forms as hydrogen is removed from the composite at 400 °C. For the reactions described here, we suggest that a NaH-MgB2 composite with Ni-B forms, and enhances the production of MgNi3B2.
With the increase in temperature to Tmax, and a hold for specific periods of time, vapour phase transfer of elements and compounds is accelerated and also results in condensation of some compounds and elements at the cooler top of the reactor [18]. For example, loss of H2 from the immediate vicinity of the reactants can occur through volatilisation of NaH and/or Na as well as residual MgH2 that subsequently condenses at the top of the reaction chamber [17,18]. At these higher reactor temperatures (i.e., >500 °C), the presence of Na as a liquid or as a gas is likely [18]. In addition, the decomposition of NaBH4 is accelerated in the presence of MgH2 [38]. Further complexity arises because, between 500 °C and 600 °C, Mg(BH4)2 decomposes to form MgH2 [17,39]. Our analysis of MgB2 formation using an autogenous pressure reaction between Mg and NaBH4 shows that Na is poorly soluble in the diboride structure and thus, is not detected in the final product [17]. Under these reactor conditions where the base may reach up to 650 °C [18], Na is most commonly observed in phases at the cooler top of the reactor. EPMA data for MgNi3B2 produced in this work suggests that Na is also not soluble in the predominant product.
Thus, reactions involving solid–gas and liquid–gas interactions compete at higher temperatures as illustrated by the change in reactor pressure(s) shown in Figure 2b. As new stable phases form, the autogenous pressure in the reactor changes over time (Figure 2b). In general, we interpret that gas phase reactions are near complete if the autogenous pressure is low (i.e., < 0.1 MPa) when the reactor is cooled from Tmax (e.g., Run 3 of Figure 2b). Given the complexity of these intermediate reactions, the formation of MgNi3B2 is nevertheless governed by generic conditions such as availability of elements (e.g., Mg, Ni and B) in appropriate ratios (or compounds) and the temperature and pressure of reactions. We suggest that the overall reaction for formation of MgNi3B2 in this system is:
Mg + 3Ni + 2NaBH4 = MgNi3B2 + 2NaH + 3H2
The additional products in Equation (1)—NaH and H2—are both gas phase at Tmax. Hence, it is reasonable to assume that microstructures for MgNi3B2 are moderated by solid–gas, liquid–gas, and possibly, vapour–liquid–solid mechanisms.
As noted in Table 1 and shown in Figure 4, other Mg-Ni phases occur in minor amounts as part of this synthesis method. For example, MgNi7B3 and MgNi6.7B2 occur as minor products in all experiments shown in Table 1. We also explored this method to produce, for example, MgNi7B3 in higher yields under similar conditions with appropriate adjustment for molar ratios of starting materials. A maximum yield of ~40% for MgNi7B3 is obtained at Tmax = 450 °C at the thermocouple and ~4 MPa pressure for 8 h. Optimum yields occur when Mg is in excess by 20–30%, consistent with the practice noted by Liao et al. [4].
4.2. Microstructures
SEM images of powders formed by this process show aggregates containing many nanometre-scale grains with a range of morphologies (Figure 5). A first impression from Figure 5 and the XRD data suggests that the aggregates are comprised of a single phase Mg-Ni-B compound with grains of varying size and shape. However, the microstructures revealed by polished sections provide observations that hint at a different interpretation and at key steps in the formation of MgNi3B2 aggregates by this synthesis method.
For example, the centres of most aggregates contain a Ni-boride phase such as Ni2B or Ni3B as shown in Table 3 and Figure 7, Figure 8 and Figure 9. The higher boron content Ni4B3 is also present and usually a phase that lies between the Ni-rich core and the MgNi3B2 outer regions of an aggregate. This morphology suggests that Ni-rich phases formed first in this process presumably via the interaction of H2 (g) and B2H6 (g) with Ni metal at T ≤ 420 °C. The autogenous pressure at low temperatures in the reactor is insufficient to ensure H2 diffusion into bulk Ni albeit H2 may penetrate surface layers of individual grains to ~30 µm [40]. Thus, it is likely that Ni-borides form at lower temperatures through reaction with B2H6 and the higher order analogues as shown in Reactions (2) and (3)
4Ni + B2H6 = 2Ni2B + 3H2
6Ni + B2H6 = 2Ni3B + 3H2
Above 420 °C, with formation of MgH2 and Mg(BH4)2, their subsequent decomposition [17,40], and the continued decomposition of NaBH4 [38], reactive Mg and B species may result that enhance formation of Mg-Ni and Mg-Ni-B phases. MgB2 also forms above 350 °C under these autogenous pressure conditions [18] but is not evident in the final product due to formation of MgNi3B2 [29,30].
For the experiments listed in Table 1, the evidence from XRD data does not correlate well with the notional abundance of the Ni-boride phases shown via polished section microscopy. We attribute the low estimated values for Ni-boride phases using XRD Rietveld refinement to the modest signal/noise ratio, few reflections due to symmetry and overlap of key reflections for MgNi3B2 and MgNi6.7B2 [4,5] as well as with Ni2B and Ni3B. This suggestion also implies that the relative proportions of phases in the products shown in Table 1 are not accurate and, we estimate, may be in error by as much as 10% relative. An intense X-ray beam (e.g., rotating anode; synchrotron) is required to provide higher accuracy of calculations for relative proportions of phases in these aggregates.
The relationships between the inner and outer parts of an aggregate are varied in detail. In general, the core region is a boron-poor Ni-boride with transition to boron-rich phases (e.g., Ni4B3; MgNi3B2) towards the outer margin, or shell, of an aggregate. This general trend also supports the suggestion that Mg-rich phase(s) form after the Ni-borides through solid–gas and/or liquid–gas reactions. While we have no definitive evidence, the formation of MgNi3B2 rods or needles (Figure 5b) may occur via a vapour-–liquid–solid mechanism in this type of environment. The presence of “vacant” cores—or an empty shell morphology—suggests that in some cases, gases such as H2 are trapped within the aggregate. Through a change in reactor pressure (with change in temperature), the trapped gas exits the core of the aggregate. The gas is likely to be trapped during a rapid growth stage when the reactor temperature is increased to Tmax.
The consistent composition of the aggregate shell region as demonstrated by EPMA analyses in Table 3 is noteworthy. Nevertheless, two sets of spot analyses in Table 3 show that other Mg-Ni-B phases may co-exist and deserve further attention. These analyses are for aggregates from Run 5 for which the Tmax hold time is 40 h. The inner region of one aggregate shows an average composition of Mg0.34Ni3.49B (or ~MgNi10B3) which has not been observed previously [4,5,31]. The outer regions of an aggregate also from Run 5 shows a composition—at one location only—of MgNi4B2. These compositions are significantly different to the notional stoichiometry of the starting materials. With different reactor conditions (e.g., longer reaction times, higher proportion of Ni and B in starting materials), new forms of Mg-Ni-B phases such as those implied by the EPMA data in Table 3 may be obtained.
4.3. Magnetic Properties
Manfrinetti et al. [5] present magnetic properties of polycrystalline MgNi3B2 with an applied field of 0.7 Tesla. At room temperature, MgNi3B2 is diamagnetic [5] consistent with filled Ni-3d bands and MgNi3B2 becomes positive at ~165 K. In contrast, the sample from Run 4 of this study shows substantially different magnetic behaviour. Figure 10a shows a magnetic hysteresis loop at 290 K for Run 4 where magnetization increases with increasing magnetic field and then saturates at 0.2 T with a saturation value of 0.45 emu/g. The relatively narrow hysteresis loop with a coercivity field of 250 Oe may be due to the presence of a ferromagnetic impurity such as elemental nickel. This distinctly different magnetic signature of multi-phase MgNi3B2 aggregates produced by autogenous pressure synthesis is clearly influenced by the core-shell nature of the product in which a Ni-boride core is encompassed by nano-scale MgNi3B2 rods or particles.
5. Conclusions
In summary, the ternary intermetallic MgNi3B2 as aggregates in conjunction with Ni-boride phases have been synthesized using autogenous pressure by the reaction of NaBH4, Mg, and Ni powder. XRD analysis of the primary product is consistent with previous single crystal and powder diffraction studies of MgNi3B2 by Manfrinetti et al [5]. However, microanalyses of polished sections show that these micrometer scale aggregates contain inner cores of Ni-boride phases such as Ni2B and Ni3B surrounded by successively more boron-rich phases such as Ni4B3 and MgNi3B2. In this synthesis method, solid–gas and liquid–gas reactions are dominant formation mechanisms for intermediate phases and final products. The microstructures also indicate that Ni-borides form at lower temperature than MgNi3B2 in this process. EPMA data provide circumstantial evidence for other Mg-Ni-B phases such as MgNi10.5B3, and possibly, MgNi4B2. These core-shell structures of Ni-boride/MgNi3B2 aggregates demonstrate substantially different magnetic properties to stoichiometric MgNi3B2 that is synthesized only at higher temperatures and longer time intervals [5].
Acknowledgments
This research did not receive any specific grant from funding agencies in the public, commercial, or not-for-profit sectors. Access to, and ongoing assistance from, QUT’s Central Analytical Research Facility (CARF) administered by the Institute for Future Environments is gratefully acknowledged. In particular, advice on techniques and support from Jamie Riches, Henry Spratt, Natalia Danilova, Rene Diocares, and Pamela Limpin, as well as polished samples preparation by Chris West and Don McAuley are especially appreciated.
Author Contributions
Ian D. R. Mackinnon, Mahboobeh Shahbazi and Henrietta E. Cathey conceived and designed the experiments; Mahboobeh Shahbazi and Henrietta E. Cathey performed the experiments; Ian D. R. Mackinnon, Mahboobeh Shahbazi and Henrietta E. Cathey analyzed the data; Ian D. R. Mackinnon, Shahbazi and Henrietta E. Cathey wrote the paper.
Conflicts of Interest
The authors declare no conflict of interest.
References
- Zhang, J.; Zhu, Y.; Wang, Y.; Pu, Z.; Li, L. Electrochemical hydrogen storage properties of Mg2−xAlx Ni (x = 0, 0.3, 0.5, 0.7) prepared by hydriding combustion synthesis and mechanical milling. International. Int. J. Hydrog. Energy 2012, 37, 18140–18147. [Google Scholar] [CrossRef]
- Cova, F.; Larochette, P.A.; Gennari, F. Hydrogen sorption in MgH2-based composites: The role of Ni and LiBH4 additives. Int. J. Hydrog. Energy 2012, 37, 15210–15219. [Google Scholar] [CrossRef]
- Shao, H.; Asano, K.; Enoki, H.; Akiba, E. Fabrication and hydrogen storage property study of nanostructured Mg-Ni-B ternary alloys. J. Alloys Compd. 2009, 479, 409–413. [Google Scholar] [CrossRef]
- Liao, C.Z.; Dong, C.; Zeng, L.M.; He, B.; Cao, W.H.; Yang, L.H. Crystal structure and physical properties of the new ternary compound MgNi7B3. J. Alloys Compd. 2010, 493, 31–34. [Google Scholar] [CrossRef]
- Manfrinetti, P.; Pani, M.; Dhar, S.K.; Kulkarni, R. Structure, transport and magnetic properties of MgNi3B2. J. Alloys Compd. 2007, 428, 94–98. [Google Scholar] [CrossRef]
- Pedneault, S.; Huot, J.; Rouéa, L. Nanostructured Mg2Ni materials prepared by cold rolling and used as negative electrode for Ni–MH batteries. J. Power Sources 2008, 185, 566–569. [Google Scholar] [CrossRef]
- Aswal, D.K.; Shashwati, S.; Singh, A.; Chandrasekhar Rao, T.V.; Vyas, J.C.; Gupta, L.C.; Gupta, S.K.; Sahni, V.C. Synthesis and characterization of MgB2 superconductor. Phys. C Supercond. 2001, 363, 149–154. [Google Scholar] [CrossRef]
- Takano, Y.; Oguro, N.; Kaieda, Y.; Togano, K. Superconducting properties of combustion synthesized MgB2. Phys. C Supercond. 2004, 412, 125–129. [Google Scholar] [CrossRef]
- Portehault, D.; Devi, S.; Beaunier, P.; Gervais, C.; Giordano, C.; Sanchez, C.; Antonietti, M. A general solution route toward metal boride nanocrystals. Angew. Chem. Int. Ed. 2011, 50, 3262–3265. [Google Scholar] [CrossRef] [PubMed]
- Carenco, S.; Portehault, D.; Boissière, C.; Mézailles, N.; Sanchez, C. Nanoscaled metal borides and phosphides: Recent developments and perspectives. Chem. Rev. 2013, 113, 7981–8065. [Google Scholar] [CrossRef] [PubMed]
- Li, W.; Vajo, J.J.; Cumberland, R.W.; Liu, P.; Hwang, S.J.; Kim, C.; Bowman, R.C. Hydrogenation of magnesium nickel boride for reversible hydrogen storage. Phys. Chem. Lett. 2010, 1, 69. [Google Scholar] [CrossRef]
- Grasso, G.; Malagoli, A.; Modica, M.; Tumino, A.; Ferdeghini, C.; Siri, A.S.; Vignola, C.; Martini, L.; Previtali, V.; Volpini, G. Fabrication and properties of monofilamentary MgB2 superconducting tapes. Supercond. Sci. Technol. 2003, 16, 271. [Google Scholar] [CrossRef]
- Bellingeri, E.; Malagoli, A.; Modica, M.; Braccini, V.; Siri, A.S.; Grasso, G. Neutron scattering studies of superconducting MgB2 tapes. Supercond. Sci. Technol. 2003, 16, 276–280. [Google Scholar] [CrossRef]
- Gross, K.J.; Zuttel, A.; Schlapbach, L. On the possibility of metal hydride formation Part I. The synthesis of MgNi B by mechanical milling and sintering. J. Alloys Compd. 1998, 274, 234. [Google Scholar] [CrossRef]
- Jung, W. Preparation and crystal structure of MgNi3B2 and Li1.2Ni2.5B2. Z. Naturforsch. 1977, 32, 1371. [Google Scholar] [CrossRef]
- Vajeeston, P.; Ravindran, P.; Ravi, C.; Asokamani, R. Electronic structure, bonding, and ground-state properties of AlB2-type transition-metal diborides. Phys. Rev. B 2001, 63, 045115. [Google Scholar] [CrossRef]
- Mackinnon, I.D.R.; Shahbazi, M.; Alarco, J.A.; Talbot, P.C. Low temperature decomposition of metal borohydride drives autogenous synthesis of MgB2. Supercond. Sci. Technol. 2017, 30, 055004. [Google Scholar] [CrossRef]
- Mackinnon, I.D.R.; Winnett, A.; Alarco, J.A.; Talbot, P.C. Synthesis of MgB2 at low temperature and autogenous pressure. Materials 2014, 7, 3901–3918. [Google Scholar] [CrossRef] [PubMed] [Green Version]
- Clarke, R.P.; Pease, R.N. A preliminary study of the kinetics of pyrolysis of Diborane. J. Am. Chem. Soc. 1951, 73, 2132–2134. [Google Scholar] [CrossRef]
- McCusker, L.B.; Von Dreele, R.B.; Cox, D.E.; Louer, D.; Scardi, P. Rietveld refinement guidelines. J. Appl. Crystallogr. 1999, 32, 36–50. [Google Scholar] [CrossRef]
- Momma, K.; Izumi, F. VESTA 3 for three-dimensional visualization of crystal, volumetric and morphology data. J. Appl. Crystallogr. 2011, 44, 1272–1276. [Google Scholar] [CrossRef]
- Bastin, G.F.; Heijligers, H.J.M. Quantitative electron probe microanalysis of Boron. J. Solid State Chem. 2000, 154, 177–187. [Google Scholar] [CrossRef]
- Bastin, G.F.; Dijkstra, J.M.; Heijligers, H.J.M. PROZA96: An improved matrix correction program for electron probe microanalysis, based on a double gaussian phi(rho z) approach. X-Ray Spectrom. 1998, 27, 3–10. [Google Scholar] [CrossRef]
- Drouin, D.; Couture, A.R.; Joly, D.; Tastet, X.; Aimez, V.; Gauvin, R. CASINO V2. 42—A fast and and easy-to-use modeling tool for scanning electron microscopy and microanalysis users. Scanning 2007, 29, 92–101. [Google Scholar] [CrossRef] [PubMed]
- Goldstein, J. Scanning Electron Microscopy and X-ray Microanalysis, Kluwer Academic, Plenum Publishers; Springer: New York, NY, USA, 2003. [Google Scholar]
- Rongeat, C.; Grosjean, M.-H.; Ruggeri, S.; Dehmas, M.; Bourlot, S.; Marcotte, S.; Rou’e, L. Evaluation of different approaches for improving the cycle life of MgNi-based electrodes for Ni-MH batteries. J. Power Sources 2006, 158, 747–753. [Google Scholar] [CrossRef]
- Varin, R.A.; Czujko, T.; Wronski, Z.S. Nanomaterials for Solid State Hydrogen Storage; Springer: New York, NY, USA, 2009. [Google Scholar]
- Shao, J.; Xiao, X.; Chen, L.; Fan, X.; Li, S.; Ge, H.; Wang, Q. Enhanced hydriding—Dehydriding performance of 2LiBH4–MgH2 composite by the catalytic effects of transition metal chlorides. J. Mater. Chem. 2012, 22, 20764–20772. [Google Scholar] [CrossRef]
- Shao, J.; Xiao, X.; Chen, L.; Fan, X.; Han, L.; Li, S.; Ge, H.; Wang, Q. Enhanced hydriding—Dehydriding performance of a 2LiH–MgB2 composite by the catalytic effects of Ni–B nanoparticles. J. Mater. Chem. A 2013, 1, 10184–10192. [Google Scholar] [CrossRef]
- Puszkiel, J.A.; Gennari, F.C. Reversible hydrogen storage in metal-doped Mg–LiBH4 composites. Scripta Mater. 2009, 60, 667–670. [Google Scholar] [CrossRef]
- Liao, C.-Z.; Dong, C.; Shih, K.; Zeng, L.; He, B.; Cao, W.; Yang, L. Preparation and properties of a new ternary phase Mg3+xNi7-xB2 (0.17–0.66) and its Cu-doping effect. J. Solid State Chem. 2015, 226, 24–28. [Google Scholar] [CrossRef]
- Bragg, J.K.; McCarthy, L.V.; Norton, F.J. Kinetics of Pyrolysis of Diborane. J. Am. Chem. Soc. 1951, 73, 2134–2140. [Google Scholar] [CrossRef]
- Borer, K.; Littlewood, A.B.; Phillips, C.S.G. A gas-chromatographic study of the diborane pyrolysis. J. Inorg. Nucl. Chem. 1960, 15, 316–319. [Google Scholar] [CrossRef]
- Zhu, C.; Hayashi, H.; Saita, I.; Akiyama, T. Direct synthesis of MgH2 nanofibers at different hydrogen pressures. Int. J. Hydrog. Energy 2009, 34, 7283–7290. [Google Scholar] [CrossRef]
- Sastri, M.V.; Viswanathan, B.; Murthy, S.S. Metal Hydrides-Fundamentals and Applications; Narosa Publishing House: New Delhi, India, 1998. [Google Scholar]
- Varin, R.A.; Czujko, T.; Wasmund, E.B.; Wronski, Z.S. Catalytic effects of various forms of nickel on the synthesis rate and hydrogen desorption properties of nanocrystalline magnesium hydride (MgH2) synthesized by controlled reactive mechanical milling (CRMM). J. Alloys Compd. 2007, 432, 217–231. [Google Scholar] [CrossRef]
- Polanski, M.; Nielsen, T.K.; Kunce, I.; Norek, M.; Płocinski, T.; Jaroszewicz, L.R.; Gundlach, C.; Jensen, T.R.; Bystrzycki, J. Mg2NiH4 synthesis and decomposition reactions. Intnl. J. Hydrog. Energy 2013, 38, 4003–4010. [Google Scholar] [CrossRef]
- Czujko, T.; Varin, R.A.; Wronski, Z.; Zaranski, Z.; Durejko, T. Synthesis and hydrogen desorption properties of nanocomposite magnesium hydride with sodium borohydride (MgH2 + NaBH4). J. Alloys Compd. 2007, 427, 291–299. [Google Scholar] [CrossRef]
- Prikhna, T.A.; Gawalek, W.; Savchuk, Y.M.; Moshchil, V.E.; Sergienko, N.V.; Surzhenko, A.B.; Wendt, M.; Dub, S.N.; Melnikov, V.S.; Schmidt, C.; et al. High-pressure synthesis of a bulk superconductive MgB2-based material. Phys. C Supercond. 2003, 386, 565–568. [Google Scholar] [CrossRef]
- Baranowski, B.; Filipek, S.M. 45 Years of nickel hydride—History and perspectives. J. Alloys Compd. 2005, 404, 2–6. [Google Scholar] [CrossRef]
Figure 1.
Crystal structure of MgNi3B2 (a) along the c axis highlighting the hexagonal array of B atoms in the Mg-B plane and (b) perspective view showing B atoms linked at apical equatorial sites of the Ni octahedral. Unit cell is outlined in red. Mg atoms are orange, B atoms are green, and Ni atoms are pink.
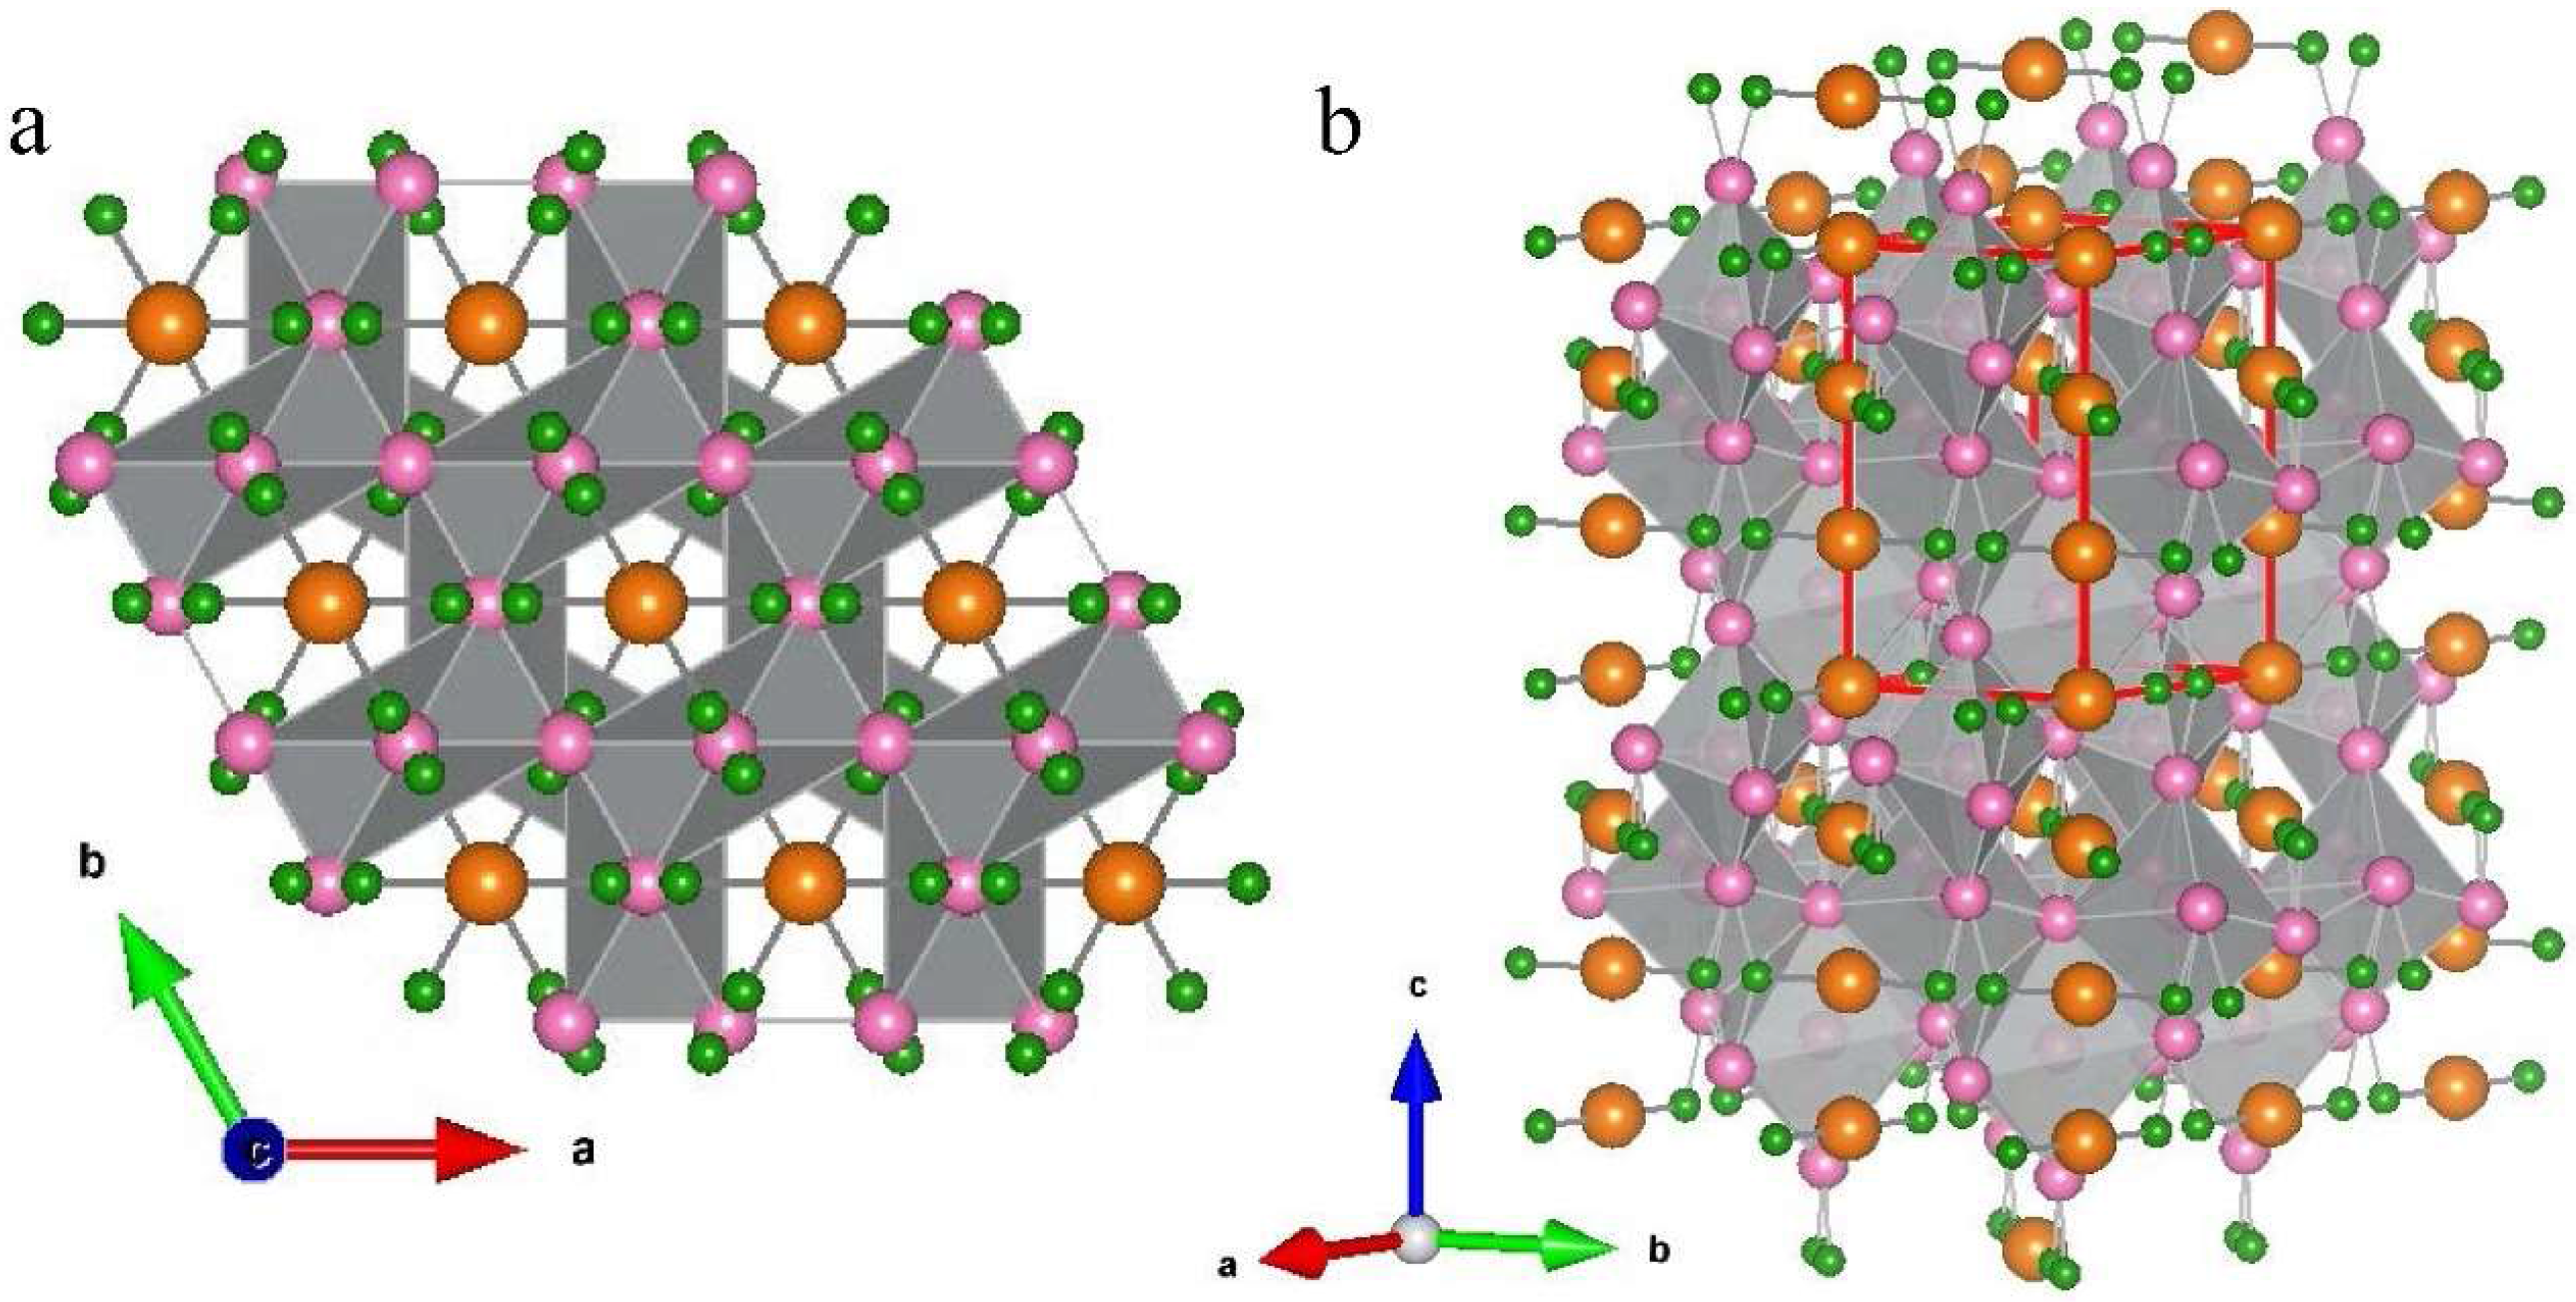
Figure 2.
(a) Typical heating profile and (b) pressure profiles for synthesis of MgNi3B2 and other Ni-B phases with conditions as listed in Table 1.
Figure 2.
(a) Typical heating profile and (b) pressure profiles for synthesis of MgNi3B2 and other Ni-B phases with conditions as listed in Table 1.

Figure 3.
Electron beam–specimen interaction volumes for EPMA analyses at 7 kV and 15 kV accelerating voltage. The inset at right (“energy by position”) illustrates the amount of energy lost by the simulated electron trajectories as a function of depth and lateral distance. For example the Ni Kα X-ray line (K 1s binding energy 8.33 KeV) cannot be excited at depths greater than ~300 nm, whereas the excitation volume for B Kα (K 1s binding energy 0.19 keV) extends near the outermost limits of electron trajectories, exceeding 1 μm3 at 15 kV but confined to <<1 μm3 at 7 kV accelerating voltage.
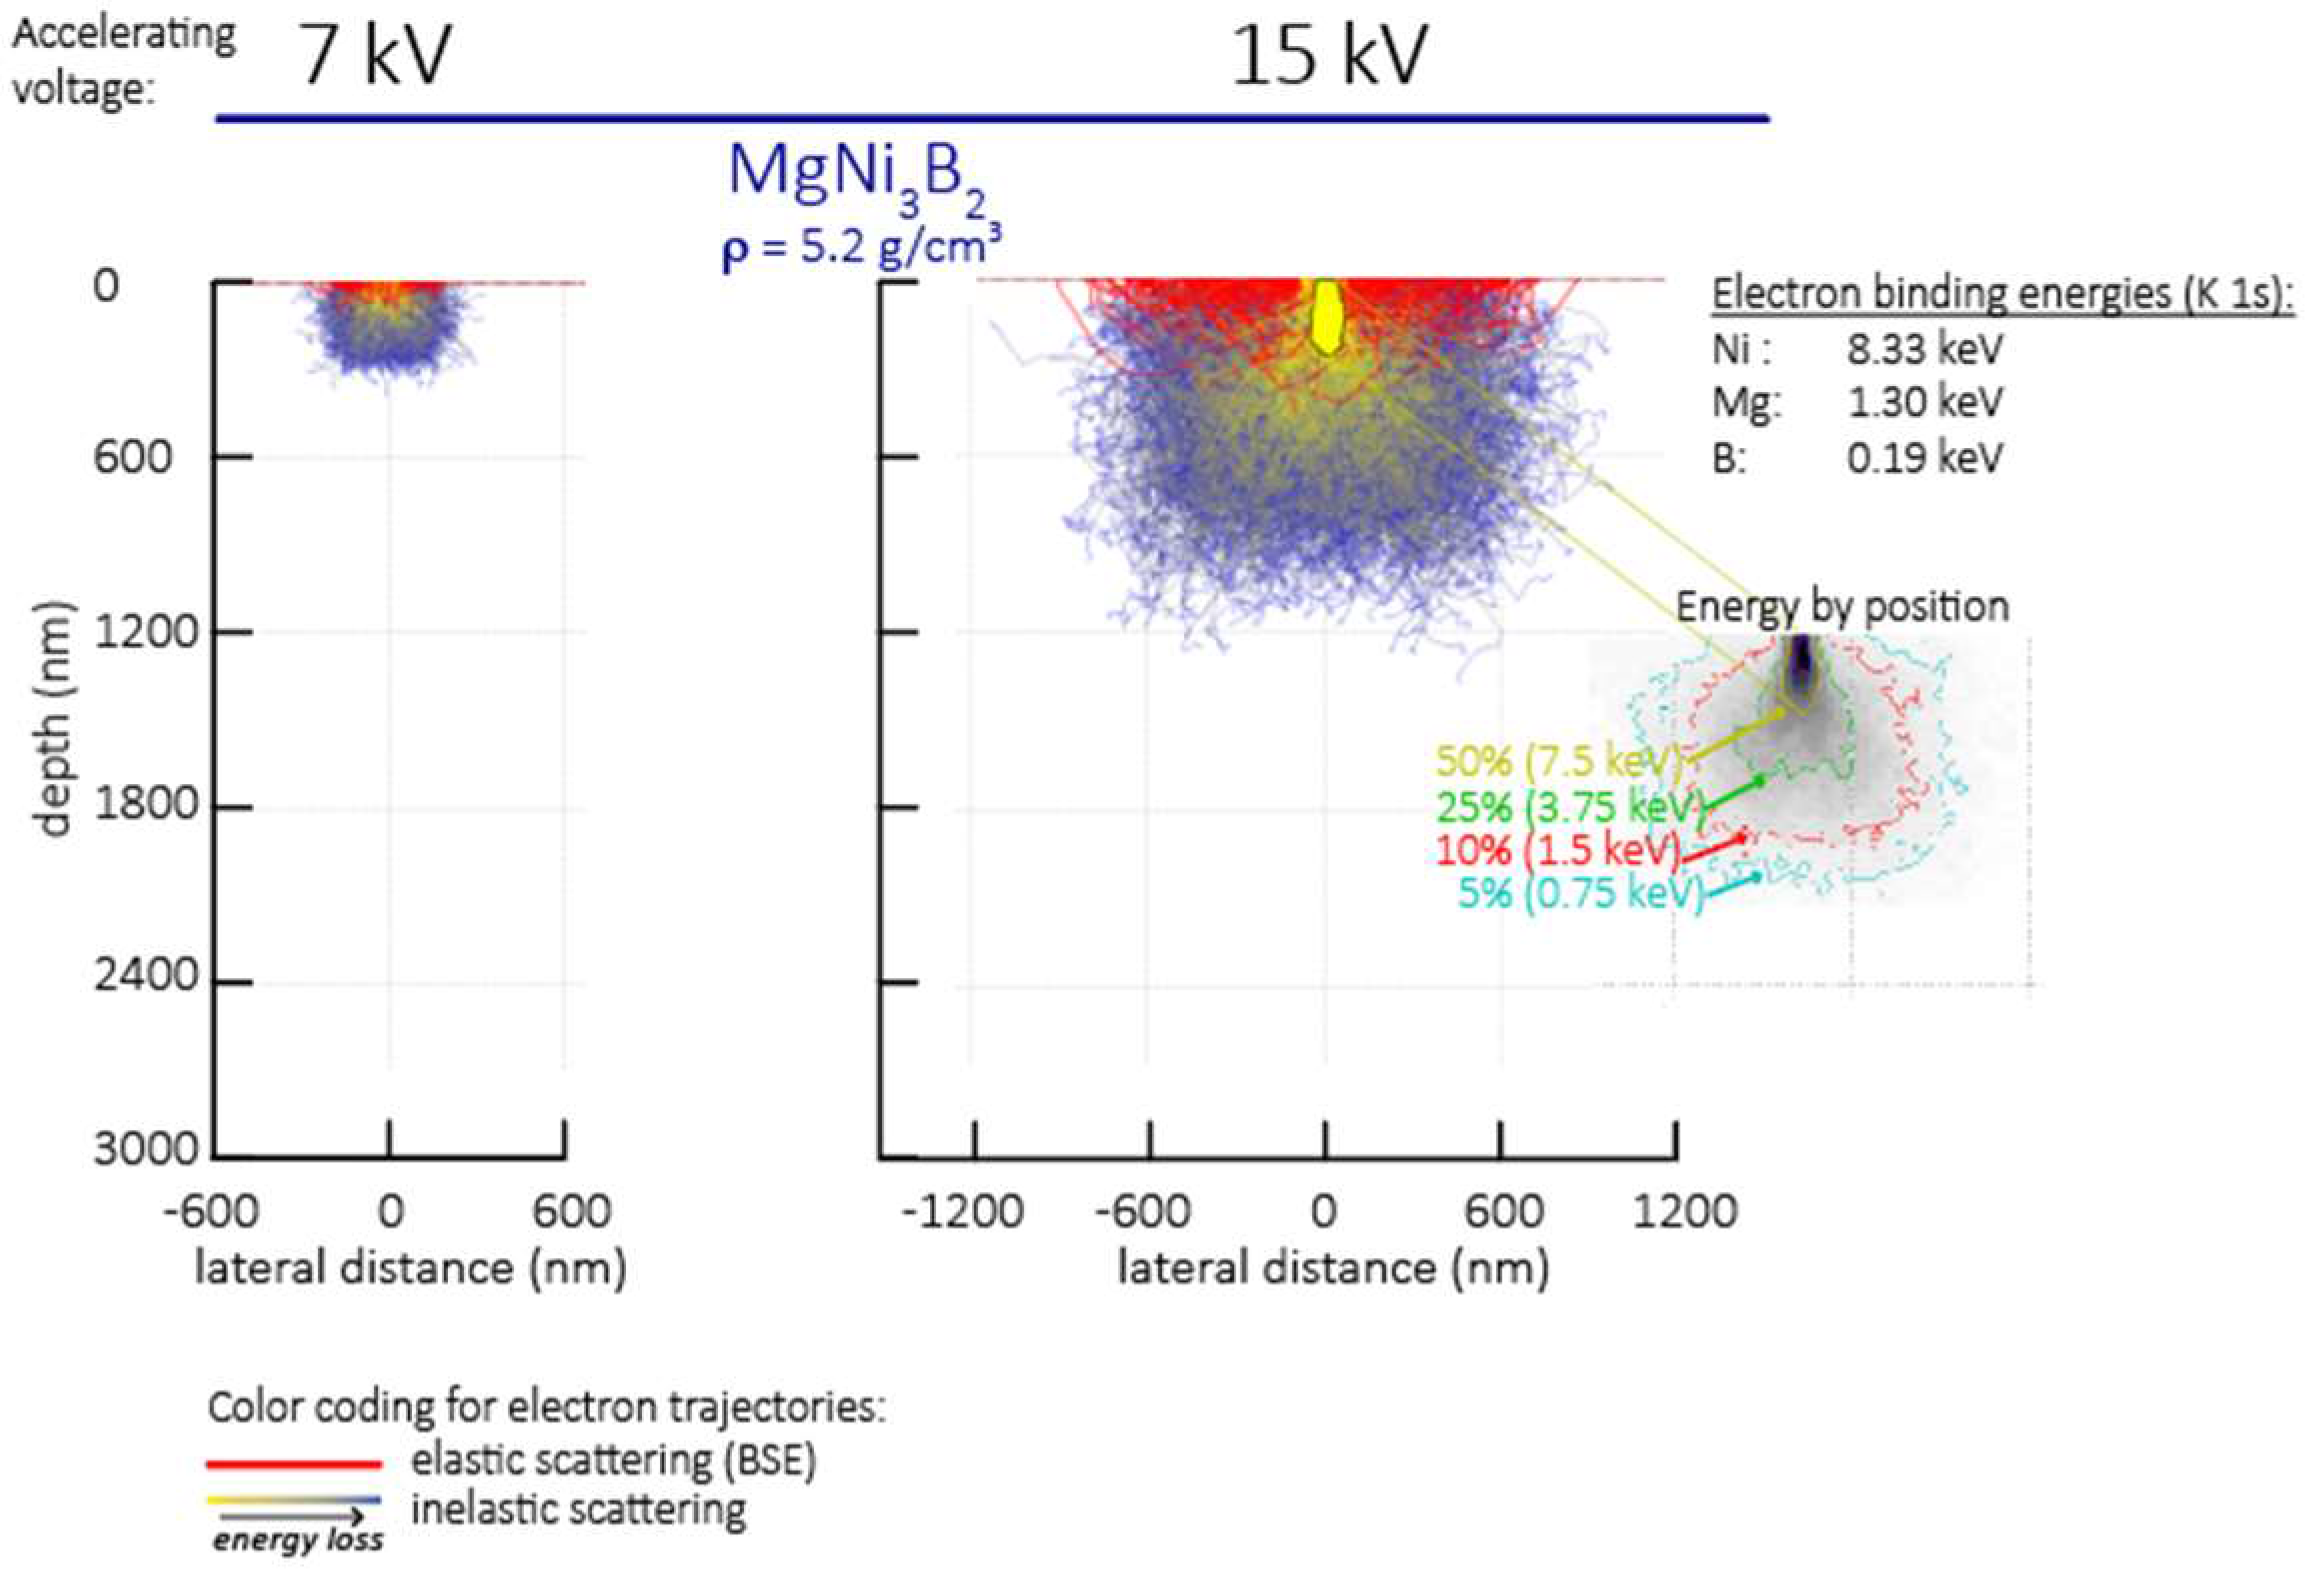
Figure 4.
The experimental (blue), fitted (red), and difference (grey line below observed and calculated pattern) XRD profile for sample from Run 1. Indexed reflections are for MgNi3B2. Other phases including MgNi6.7B2 and MgNi7B3 denoted with * and +, respectively.
Figure 4.
The experimental (blue), fitted (red), and difference (grey line below observed and calculated pattern) XRD profile for sample from Run 1. Indexed reflections are for MgNi3B2. Other phases including MgNi6.7B2 and MgNi7B3 denoted with * and +, respectively.

Figure 5.
SEM images of MgNi3B2 powder produced by autogenous pressure reactions listed in Table 1. Higher resolution SEM images (inset) show: (a) cauliflower shaped morphology consisting of smoothly rounded crystals, (b) hexagonal rod-like crystals of flower-like morphology. (c,d) SEM images of as-prepared powder from Run 5 showing a Mg-Ni-B shell and partial, or broken, shells without a Ni-B core.
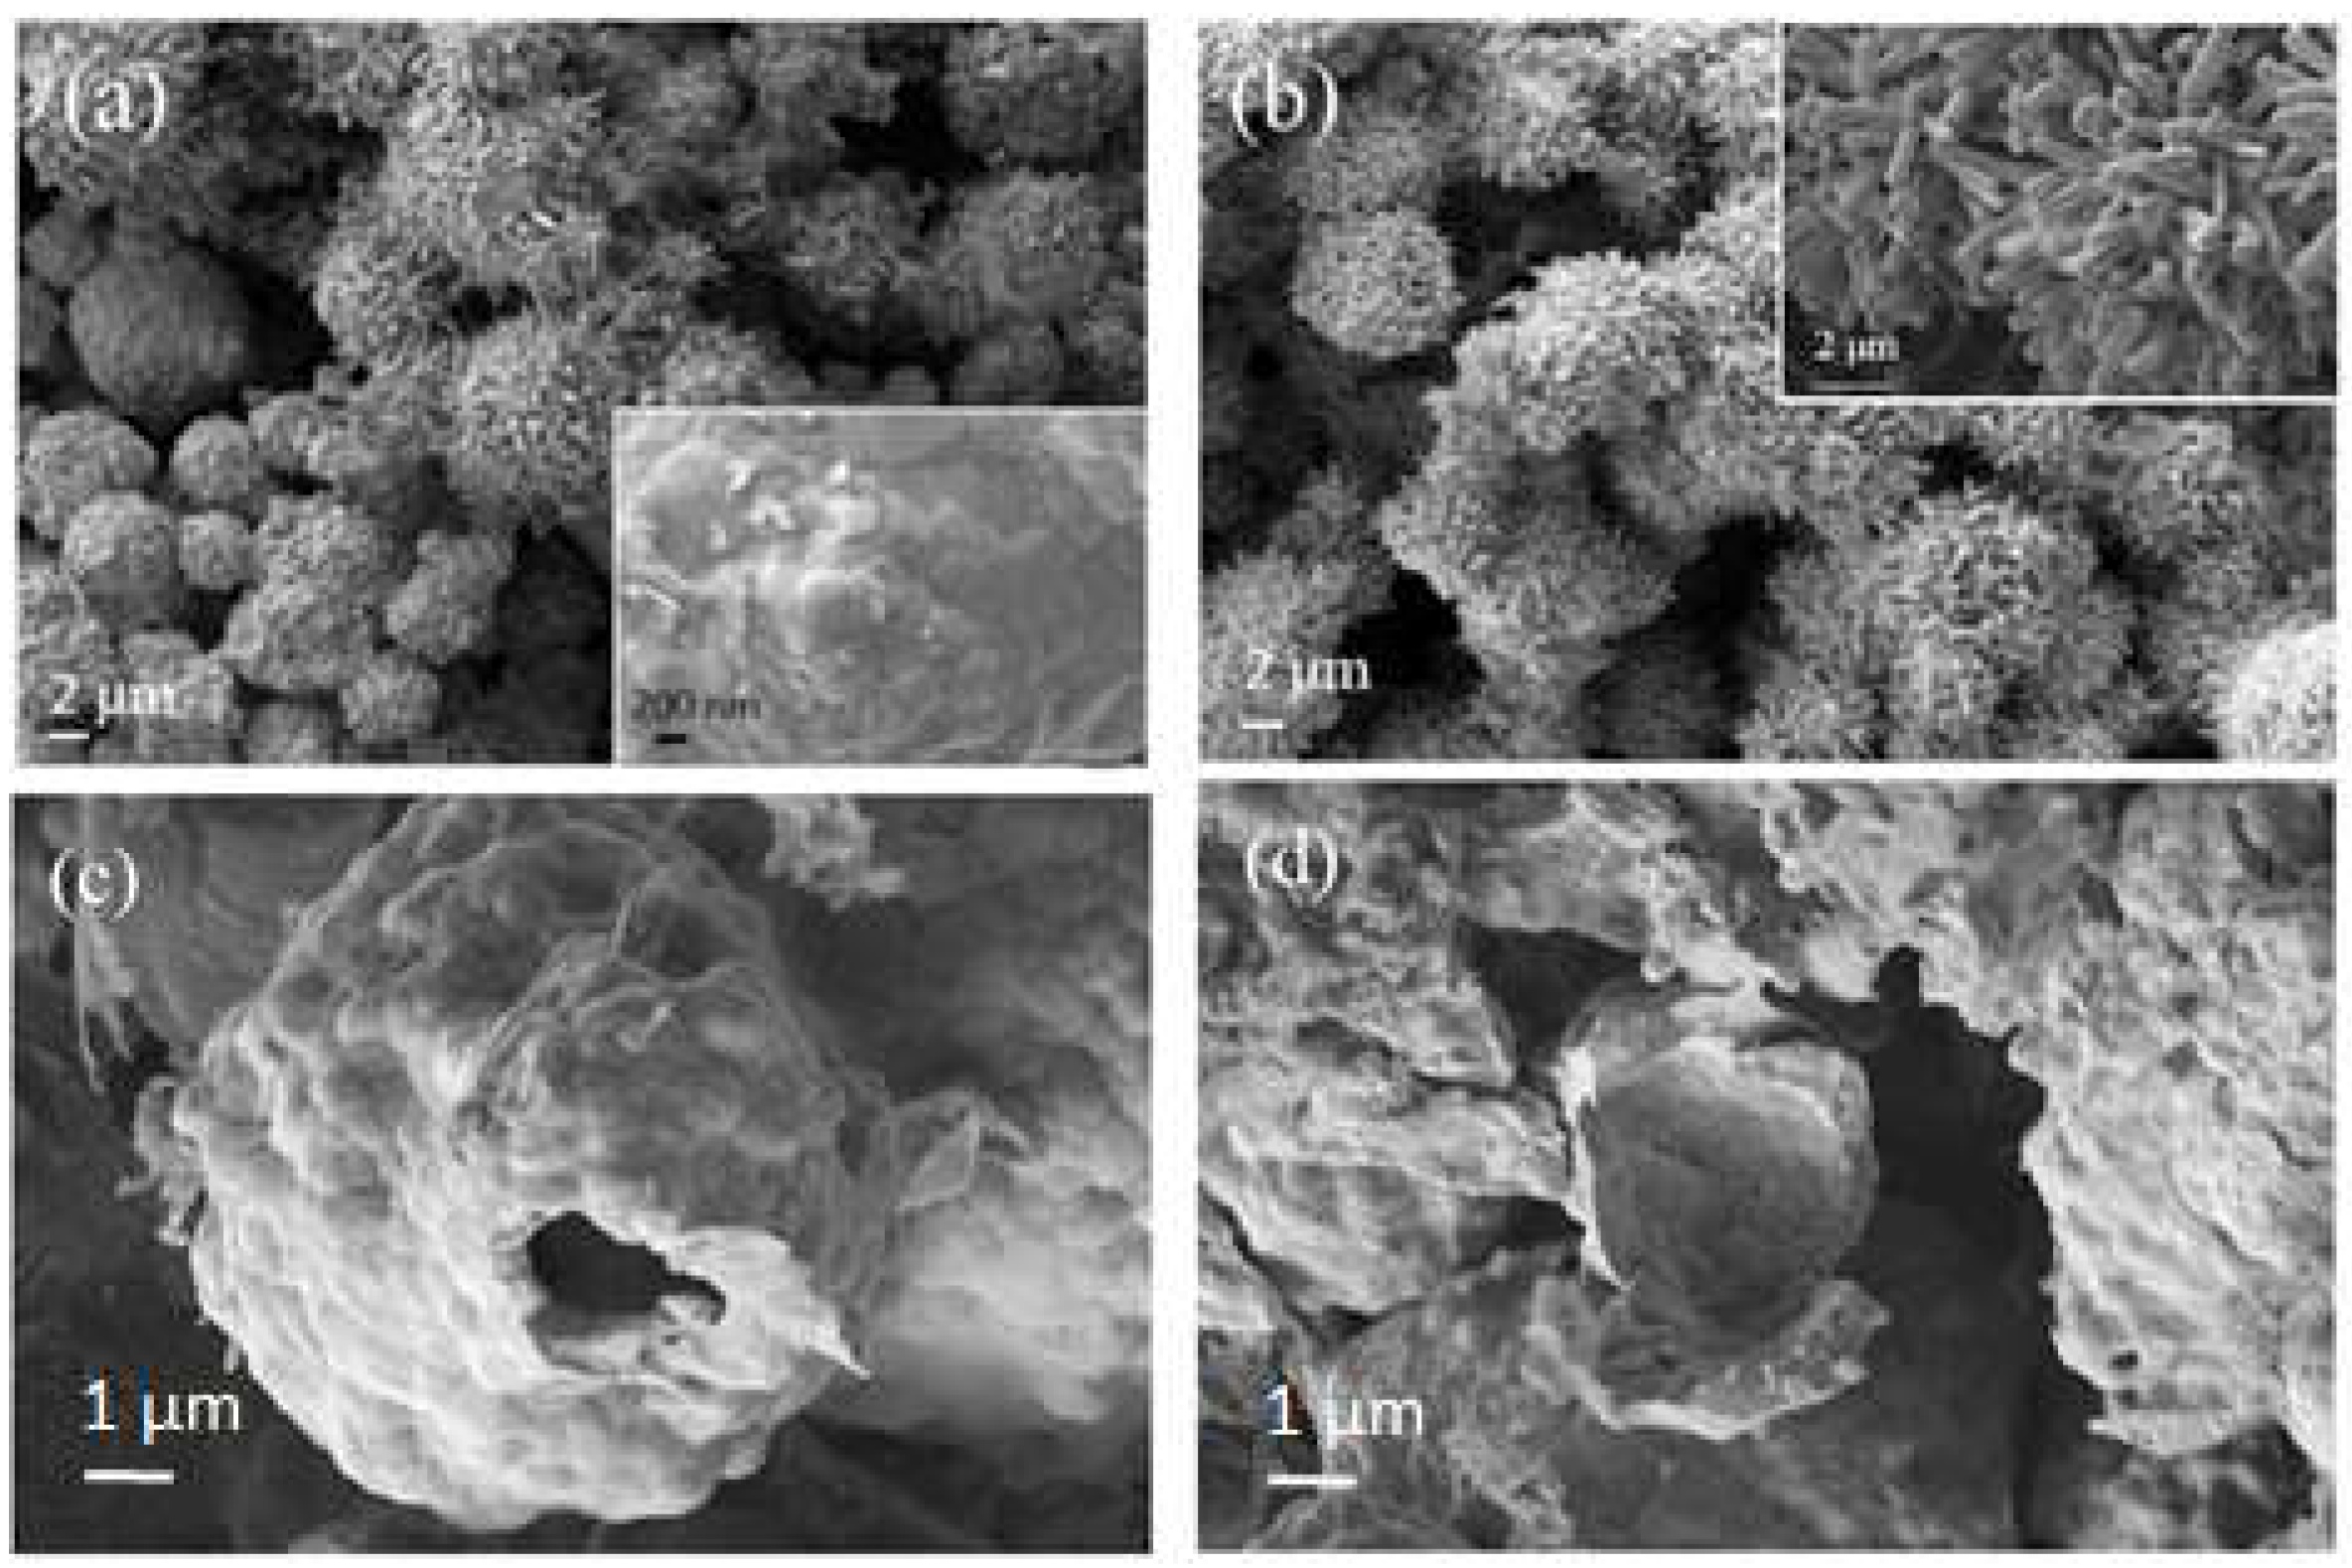
Figure 6.
(a) Secondary electron image and elemental map using the FE-SEM for (b) Ni and (c) Mg of a polished sample from Run 3.
Figure 6.
(a) Secondary electron image and elemental map using the FE-SEM for (b) Ni and (c) Mg of a polished sample from Run 3.
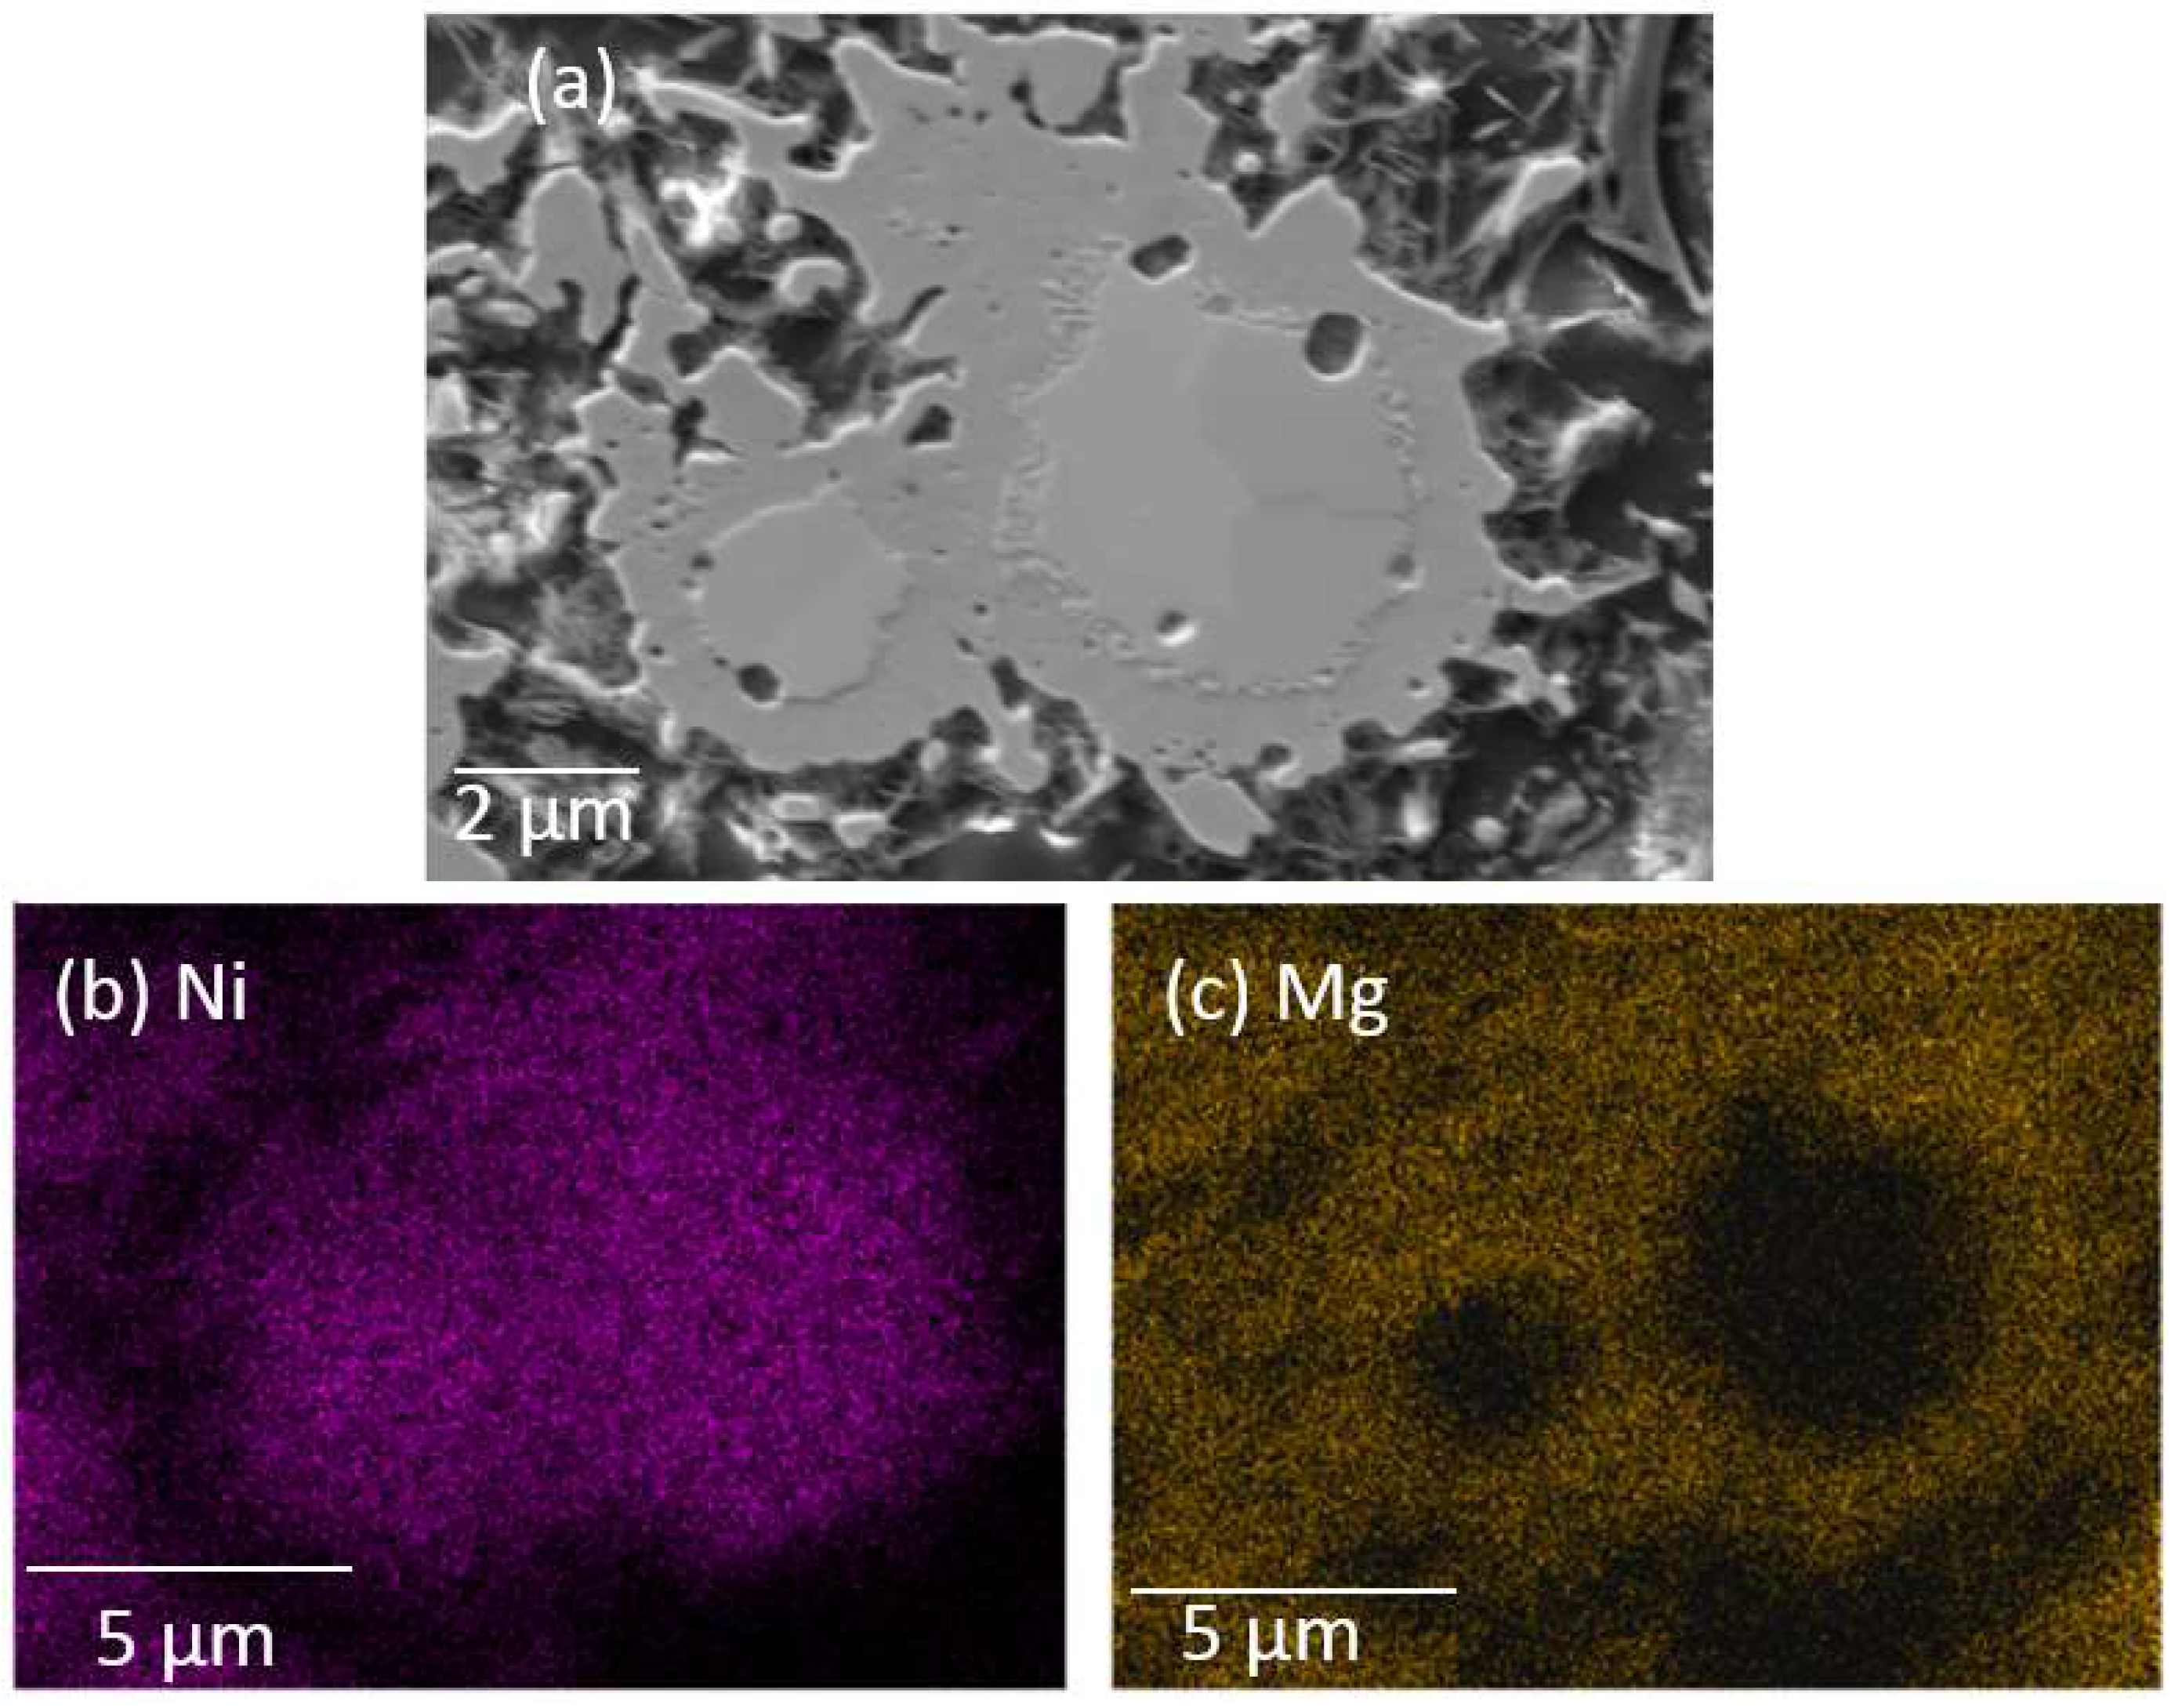
Figure 7.
Aggregate from Run 5 showing (a) backscattered electron (BSE) image with image contrast corresponding to lighter Ni-B and darker Mg-Ni-B regions; and wavelength-dispersive spectrometers (WDS) X-ray maps of (b) Ni, (c) Mg and (d) B distribution in the aggregate.
Figure 7.
Aggregate from Run 5 showing (a) backscattered electron (BSE) image with image contrast corresponding to lighter Ni-B and darker Mg-Ni-B regions; and wavelength-dispersive spectrometers (WDS) X-ray maps of (b) Ni, (c) Mg and (d) B distribution in the aggregate.

Figure 8.
Backscattered electron image of an aggregate from Run 3 showing a bright core and darker outer margin corresponding to Ni-B rich and Mg-Ni-B rich phases, respectively. Red circles denote locations of spot analyses using the field emission electron probe microanalyzer (EPMA); average values for these spot analyses are listed in Table 3.
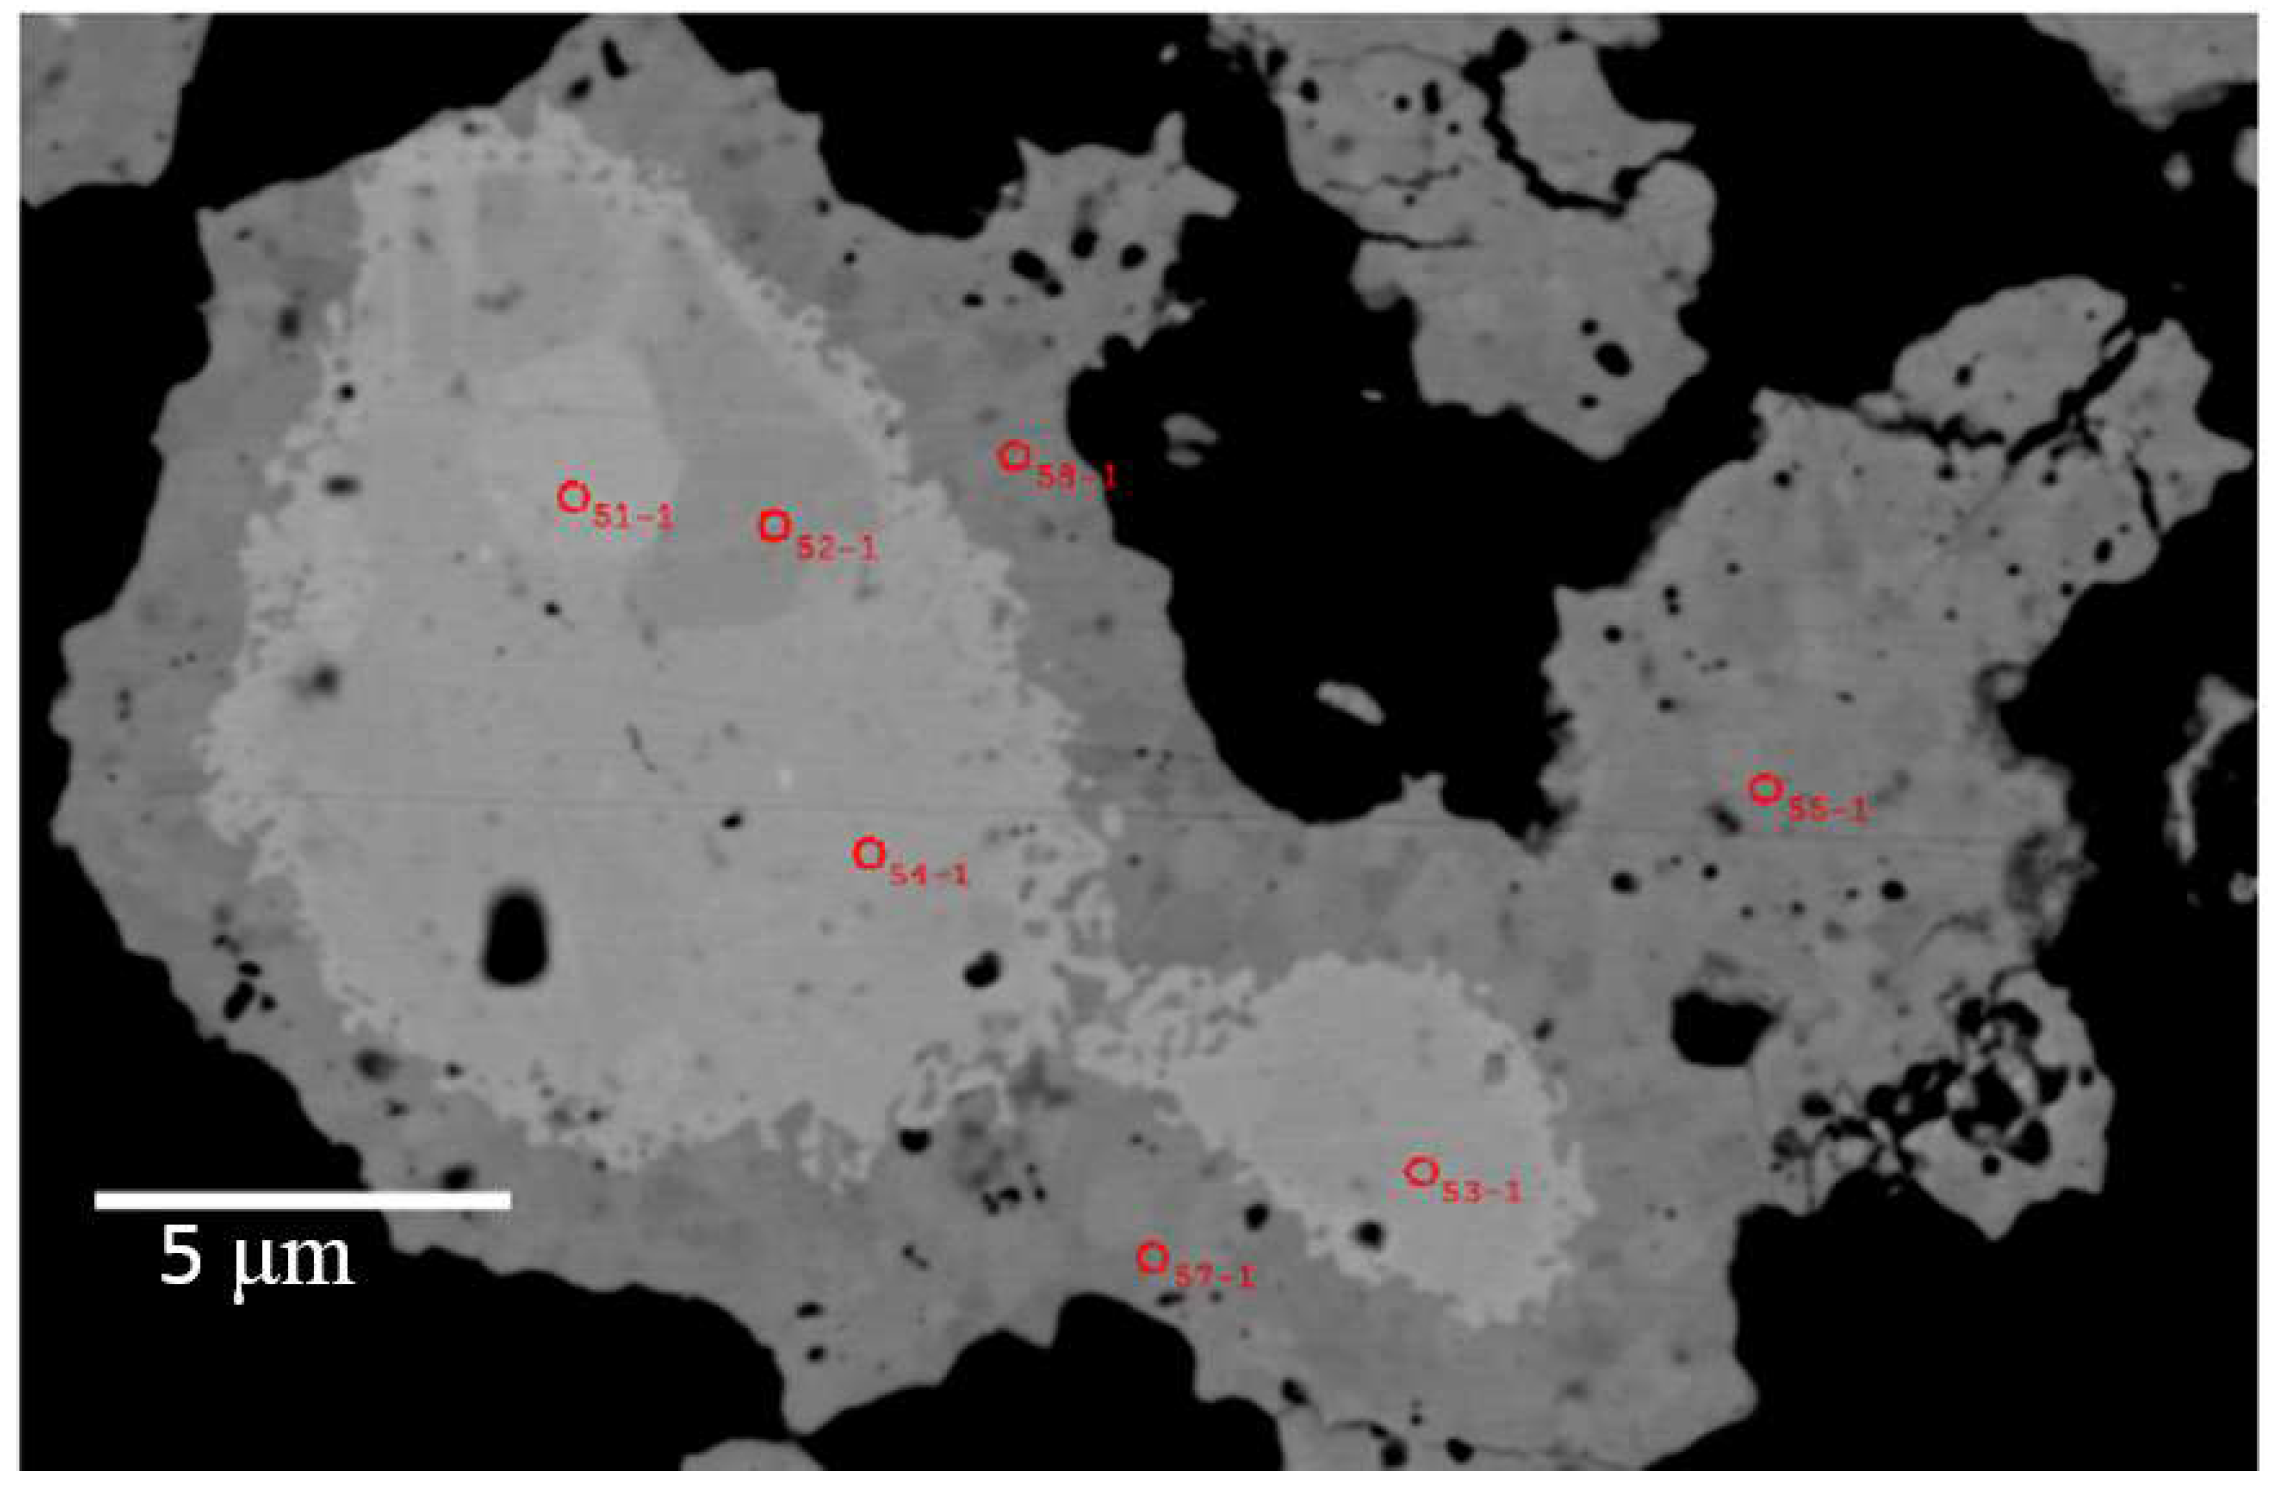
Figure 9.
SEM image of the polished surface of reaction products from Run 5. In (a) a mound is apparent at the core part of the sample, while in (b) the mound shows a region in which material appears to have been removed. (c) Backscattered electron image shows the structure of a Ni-B core region surrounded by a MgNi3B2 rim. (d) Backscattered electron image of Mg-Ni-B particle showing core region that is presumably removed through sample preparation.
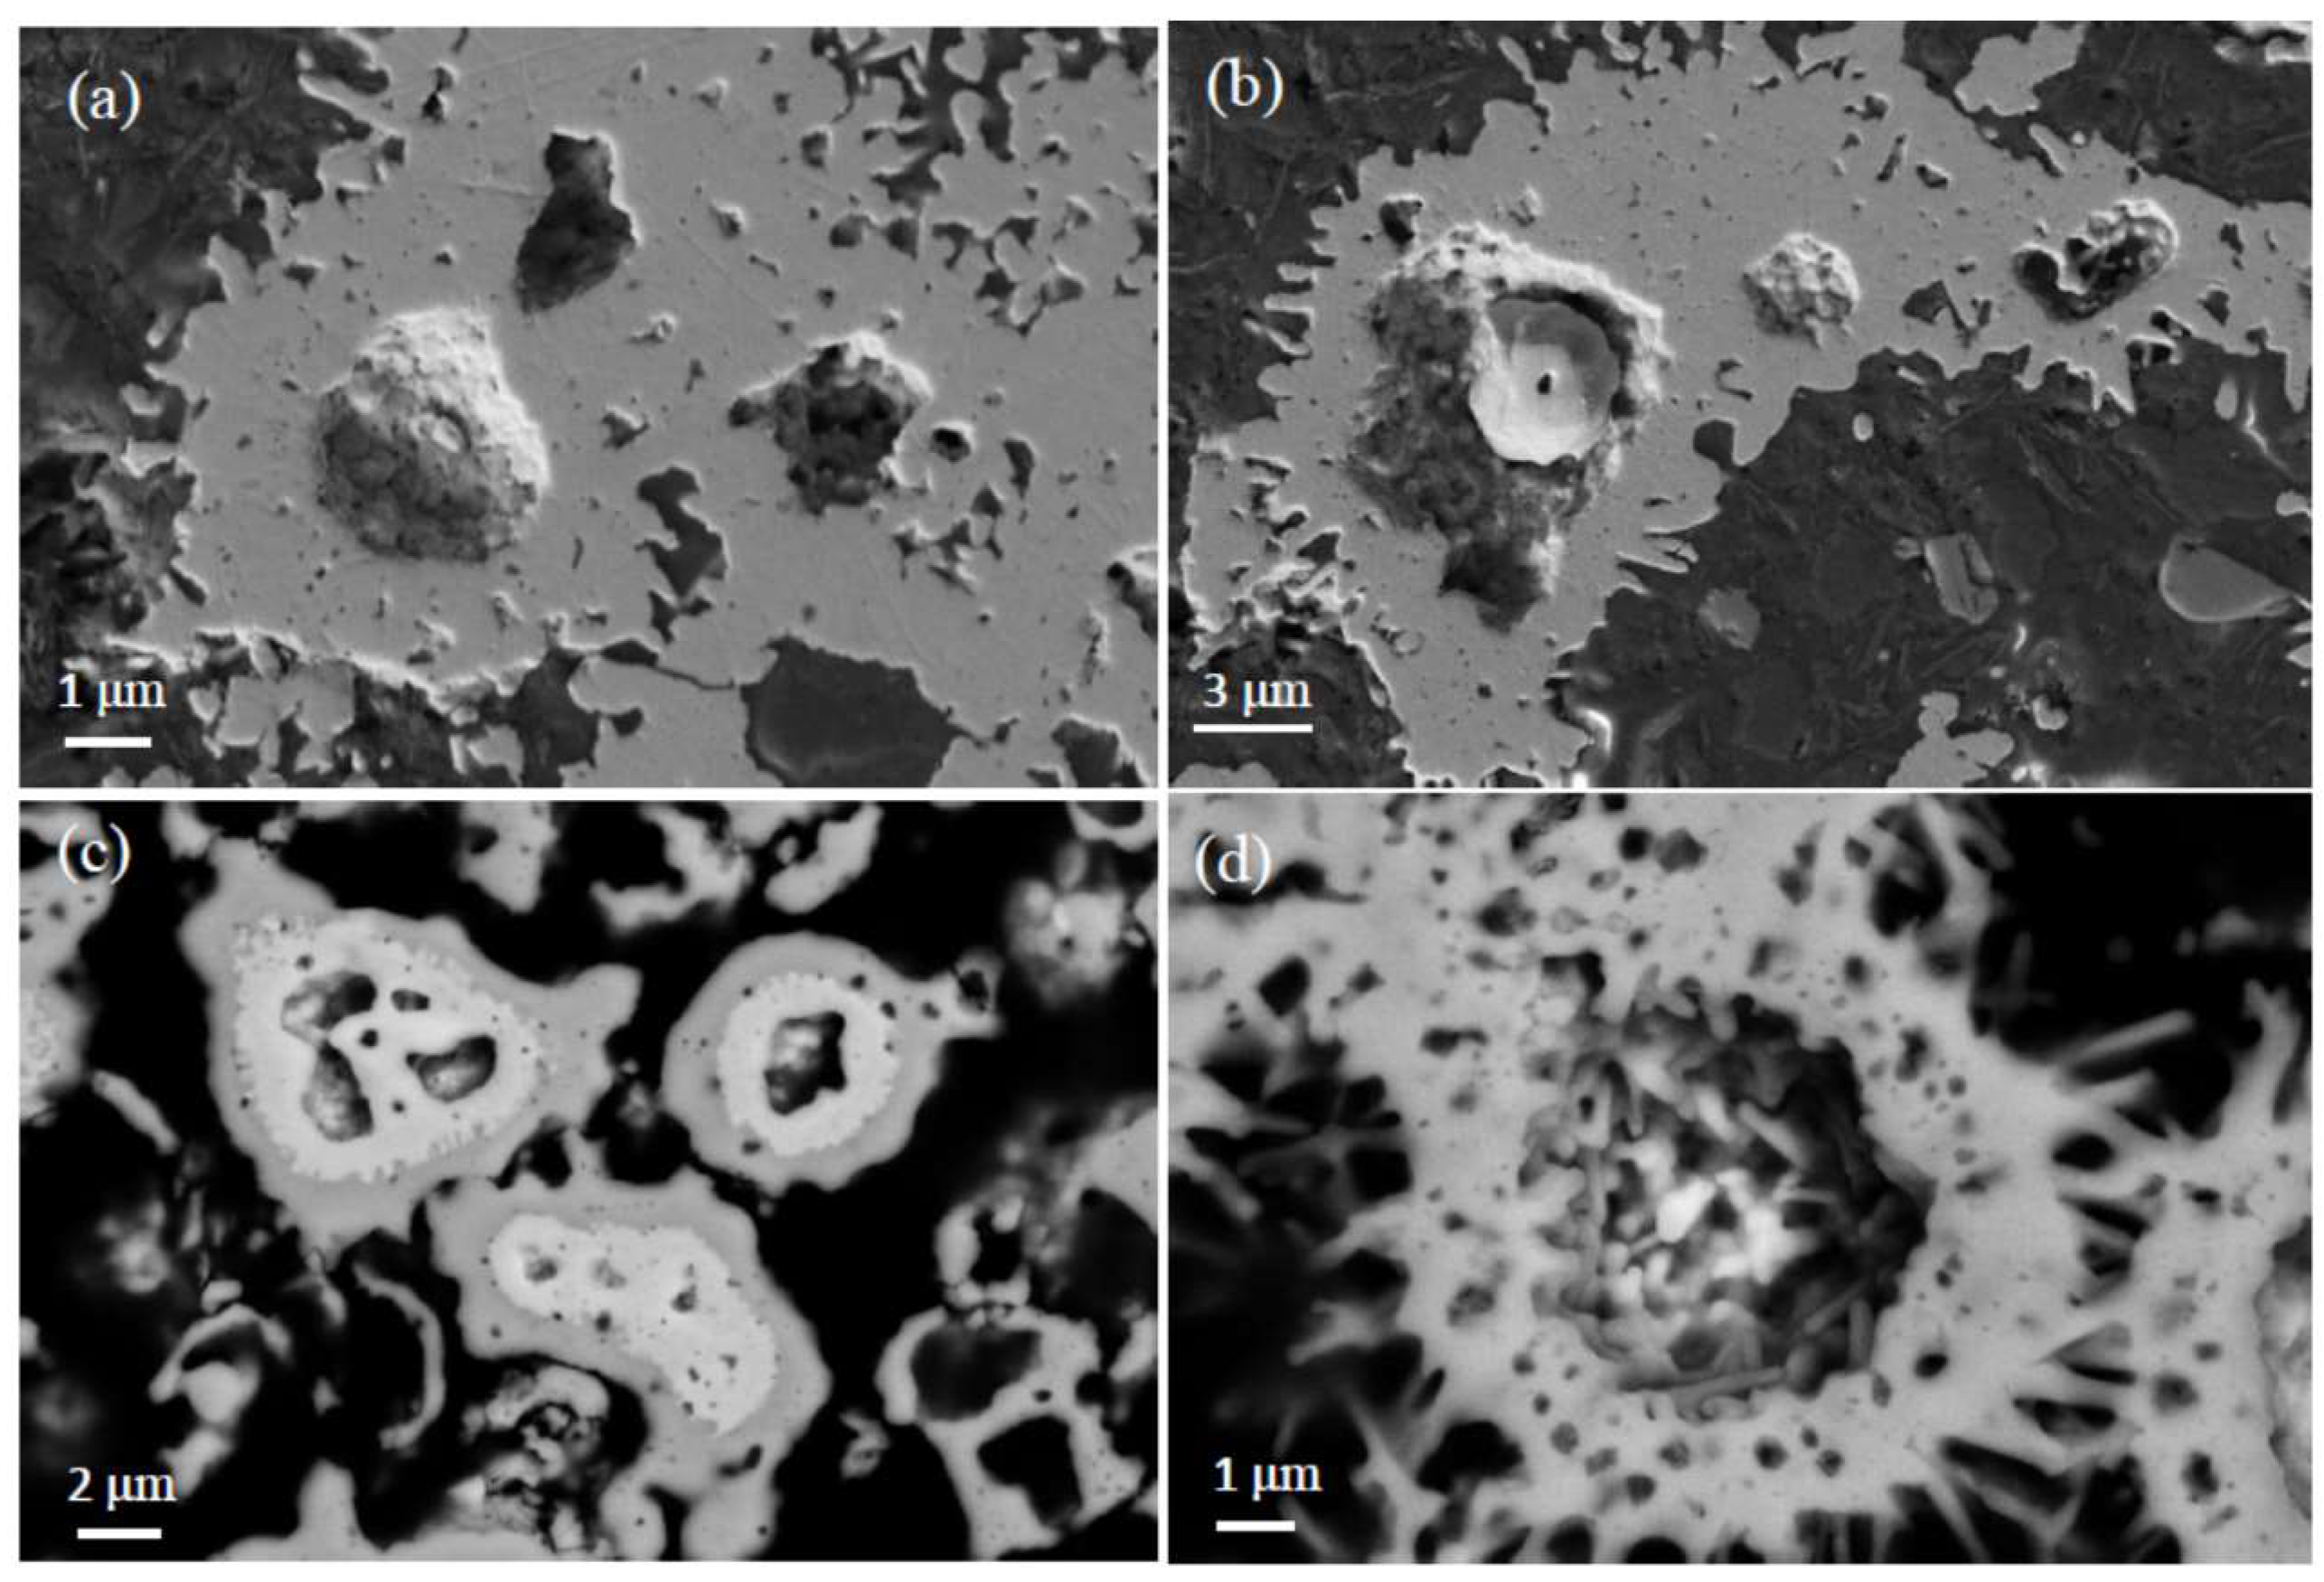
Figure 10.
Magnetic data for Run 4 sample showing (a) Field dependant magnetization at 290 K. (b) Higher magnification view of magnetization at low field.
Figure 10.
Magnetic data for Run 4 sample showing (a) Field dependant magnetization at 290 K. (b) Higher magnification view of magnetization at low field.

Table 1.
Synthesis conditions * for MgNi3B2.
| Run No. | NaBH4 (g) | Tmax £ (°C) | tTm (h) | Pmax MPa | % MgNi3B2 | Other Phases ** |
|---|---|---|---|---|---|---|
| 1 | 0.76 | 725 | 8 | 2.2 | 88% | MgNi6.7B2 MgNi7B3 |
| 2 | 0.76 | 670 | 8 | 2.1 | 70% | MgNi6.7B2 MgNi7B3 Ni2B Ni3B |
| 3 | 0.72 | 670 | 8 | 1.7 | 76% | MgNi6.7B2 MgNi7B3 Ni2B Ni3B |
| 4 | 0.72 | 670 | 8 | 2.0 | 90% | MgNi6.7B2 Ni2B MgNi7B3 |
| 5 | 0.72 | 670 | 40 | 2.0 | 85% | MgNi6.7B2 MgNi7B3 Ni3B |
| 6 | 0.72 | 725 | 30 | 2.5 | 76% | Ni2B (12%) MgNi7B3 (11%) |
* Molar ratio of Mg:Ni is 1:3 for all reactions; ** other phases are generally less than 10% by Rietveld refinement except where noted in parentheses. tTm is the time the reactor is held at Tmax; £ Base temperature.
Table 2.
Results of refinement for MgNi3B2 from Run 1.
| Parameter | MgNi3B2 (This Work) | MgNi3B2 [5] (Single Crystal) |
|---|---|---|
| Space group | P6422 | P6422 |
| a (Å) | 4.8799 (1) | 4.8800 (1) |
| c (Å) | 8.7884 (2) | 8.7870 (1) |
| Cell volume (Å3) | 181.2 (1) | 181.22 |
| Rwp | 3.8% | 4.0% |
| Rp | 2.7% | 1.9% |
| GoF | 1.98 | 0.93 |
| Atom: Ni2 (z; 6f) | 0.2062 (1) | 0.2083 (1) |
| Atom: B (x; 6i) | 0.6102 (7) | 0.6110 (8) |
Table 3.
Average compositions * (±1 σ) of selected regions in aggregates from Runs 3 and 5.
| Element (wt %) | Stoichiometry | ||||||||
|---|---|---|---|---|---|---|---|---|---|
| Compound | n + | B | Mg | Ni | Total | B | Mg | Ni | Total |
| Run 3 | |||||||||
| Ni2B (core 1) | 4 | 8.36 (0.47) | 0.04 (0.01) | 89.8 (0.9) | 98.2 (1.3) | 1 | 0.00 (0.00) | 1.98 (0.10) | 2.98 (0.10) |
| Ni3B (core 2) | 5 | 5.58 (0.32) | 0.03 (0.01) | 93.5 (1.3) | 99.1 (1.5) | 1 | 0.00 (0.00) | 3.09 (0.17) | 4.09 (0.17) |
| Ni4B3 (mid-core) | 5 | 12.0 (0.1) | 0.04 (0.02) | 87.9 (0.5) | 99.9 (0.4) | 3 | 0.00 (0.00) | 4.06 (0.06) | 7.06 (0.06) |
| MgNi3B2 (shell) | 5 | 9.01 (0.34) | 11.5 (0.1) | 79.2 (1.4) | 99.6 (1.3) | 2 | 1.13 (0.05) | 3.24 (0.16) | 6.37 (0.21) |
| Run 5 | |||||||||
| MgNi10.5B3 (core1) | 3 | 4.76 (0.11) | 3.65 (0.37) | 90.2 (0.4) | 98.6 (0.1) | 3 | 1.02 (0.04) | 10.50 (0.09) | 14.52 (0.10) |
| Ni3B (core2) | 2 | 5.53 | bdl | 93.2 | 98.7 | 1 | bdl ** | 3.11 | 4.11 |
| Ni4B3 (mid-core) | 1 | 12.2 | bdl | 87.2 | 99.5 | 3 | bdl ** | 3.94 | 6.94 |
| MgNi3B2 (shell) | 8 | 9.27 (0.14) | 11.7 (0.1) | 78.1 (1.0) | 99.1 (0.9) | 2 | 1.12 (0.02) | 3.10 (0.07) | 6.22 (0.09) |
| MgNi4B2 | 1 | 7.83 | 8.73 | 84.1 | 100.7 | 2 | 0.99 | 3.96 | 6.95 |
* All measurements by electron probe microanalysis; ** bdl = below detection limit, + number of point analyses.
© 2018 by the authors. Licensee MDPI, Basel, Switzerland. This article is an open access article distributed under the terms and conditions of the Creative Commons Attribution (CC BY) license (http://creativecommons.org/licenses/by/4.0/).
Share and Cite
MDPI and ACS Style
Shahbazi, M.; Cathey, H.E.; Mackinnon, I.D.R. Synthesis of Magnesium Nickel Boride Aggregates via Borohydride Autogenous Pressure. Materials 2018, 11, 480. https://doi.org/10.3390/ma11040480
AMA Style
Shahbazi M, Cathey HE, Mackinnon IDR. Synthesis of Magnesium Nickel Boride Aggregates via Borohydride Autogenous Pressure. Materials. 2018; 11(4):480. https://doi.org/10.3390/ma11040480
Chicago/Turabian StyleShahbazi, Mahboobeh, Henrietta E. Cathey, and Ian D. R. Mackinnon. 2018. "Synthesis of Magnesium Nickel Boride Aggregates via Borohydride Autogenous Pressure" Materials 11, no. 4: 480. https://doi.org/10.3390/ma11040480
Note that from the first issue of 2016, this journal uses article numbers instead of page numbers. See further details here.