A Review of Mechanoluminescence in Inorganic Solids: Compounds, Mechanisms, Models and Applications


1
LumiLab, Department of Solid State Sciences, Ghent University, Krijgslaan 281-S1, 9000 Ghent, Belgium
2
Center for Nano- and Biophotonics (NB Photonics), Ghent University, 9000 Ghent, Belgium
*
Author to whom correspondence should be addressed.
Materials 2018, 11(4), 484; https://doi.org/10.3390/ma11040484
Submission received: 10 February 2018
/
Revised: 8 March 2018
/
Accepted: 12 March 2018
/
Published: 23 March 2018
(This article belongs to the Section Smart Materials)
Abstract
:Mechanoluminescence (ML) is the non-thermal emission of light as a response to mechanical stimuli on a solid material. While this phenomenon has been observed for a long time when breaking certain materials, it is now being extensively explored, especially since the discovery of non-destructive ML upon elastic deformation. A great number of materials have already been identified as mechanoluminescent, but novel ones with colour tunability and improved sensitivity are still urgently needed. The physical origin of the phenomenon, which mainly involves the release of trapped carriers at defects with the help of stress, still remains unclear. This in turn hinders a deeper research, either theoretically or application oriented. In this review paper, we have tabulated the known ML compounds according to their structure prototypes based on the connectivity of anion polyhedra, highlighting structural features, such as framework distortion, layered structure, elastic anisotropy and microstructures, which are very relevant to the ML process. We then review the various proposed mechanisms and corresponding mathematical models. We comment on their contribution to a clearer understanding of the ML phenomenon and on the derived guidelines for improving properties of ML phosphors. Proven and potential applications of ML in various fields, such as stress field sensing, light sources, and sensing electric (magnetic) fields, are summarized. Finally, we point out the challenges and future directions in this active and emerging field of luminescence research.
1. Introduction
Luminescence is the emission of cold light due to different kinds of excitation sources, in contrast to the black body radiation as encountered in, e.g., incandescent lamps. Broadly speaking, luminescence as a response to mechanical stimuli is termed mechanoluminescence. This phenomenon was first recorded by Francis Bacon in his book The Advancement of Learning (1605) as “it is not the property of fire alone to give light...loaf-sugar in scraping or breaking” [1]. Yet, it must have been known centuries earlier because sugar canes were already imported by Europe since the 12th century [2].
Triboluminescence was historically used as a synonym for ML [2], but nowadays it refers to luminescence due to the contact of two dissimilar materials [3]. The process often involves a triboelectric field, a chemical reaction or just the generation of heat in the contact area. In a narrower sense, ML refers to luminescence induced by elastic deformation (elasticoluminescence), plastic deformation (plasticoluminescence), or fracture (fractoluminescence) depending on the magnitude of stress. Fractoluminescence was reported in as many as a thousand compounds and can be found in of inorganic, and even of all crystalline materials, according to an estimate in the late 1990s [4]. It is mainly attributed to the breaking of chemical bonds, which charges ambient nitrogen gas or/and luminescent dopants [5,6,7], and has found applications in sensors for damage monitoring [8]. The study of its mechanism is complicated by the difficulty in assessing the influence of crystal size, the mechanical load and the surrounding gasses, etc.
The discovery of elasticoluminescence in particular phosphors, such as SrAlO:Eu, Dy [9] and ZnS:Mn [10] in the late 1990s, has sparkled enthusiasm among scientists to research ML upon non-destructive elastic deformation. As an example in Figure 1a,b, the instantaneous ML intensity induced by elastic deformation of SrAMgSiO:Eu (A = Ca, Sr, Ba) is proportional to the stress load applied at a fixed rate [11]. Based on the linearity between ML intensity and stress, the stress distribution of a composite under compression [12], tensile load [13], torsion [14,15], ultrasound radiation [16] or vibration due to gas flow [17] has been estimated by this ML-based method. The stress field and wake in the vicinity of a crack [18,19], and its propagation [20,21] can also be visualized in an in situ manner thanks to ML phosphors. Recent reports showed that ML materials are able to emit light upon applying electric [13] or magnetic [22] fields when they are properly coupled with piezoelectric crystals (magnetic alloys).
Despite the great potential in different areas, novel ML phosphors have been mainly discovered in a trial-and-error process, evidenced by only a few tens of intense ML phosphors and their limited ranges of colours. Arguably, this results from the limited understanding of the mechanism behind the ML phenomenon. The emission of light in these ML phosphors under dynamic loading is due to a transition of electrons from the excited state to the ground state of dopants (transition metals, lanthanides, etc.). Intuitively, these electrons are generated upon deformation or are released from traps in phosphors where charge carriers were trapped during the photo-excitation process [23]. Indeed, the average mechanical energy gained by an atom during elastic deformation (eV is in principle not sufficient to directly excite it into emitting visible light, which requires a few eVs [7] (According to the infinitesimal theory, the strain energy density u (J/m) can be estimated as in which Young’s modulus , with K bulk modulus and G shear modulus. As an example, SrAlO:Eu has theoretical density of 3493 kg/m, GPa, GPa [24], which leads to J/m, i.e., eV/atom, in a typical ML experiment where 50 MPa can be expected (Appendix A)). Carriers are often stored in traps created by dopants/co-dopants or by cation/anion vacancies in phosphors. They can also escape from these traps by thermal energy, resulting in the delayed emission of light, which is termed persistent luminescence and is now reasonably well understood (see Refs [25,26] for a review), although the nature of (de)trapping process at defects remains unclear [27]. Alternatively, charge carriers can also be released upon mechanical load and subsequently recombine with luminescent centres, eventually yielding ML. Consequently, ML and persistent luminescence often take place simultaneously, which complicates the study of the detrapping mechanism.
It is still rather mysterious how carriers are facilitated to be released during elastic or plastic deformation of a ML phosphor. The piezoelectricity of host compounds was assumed to provide an internal electric field which helps carriers to overcome barriers, in order to escape from defects [28]. Piezoelectricity induced by breaking inversion symmetry via doping was also argued to be responsible for ML in CaNbO:Pr and CaNbO:Pr, which share centrosymmetric hosts [29]. However, neither persistent luminescence nor piezoelectricity in a certain phosphor guarantees the occurrence of ML. How the geometric configuration of defects, together with their energy levels, changes under deformation still remains unclear. In addition, strain-induced changes of microstructures, such as twin boundaries and domain walls [30], impose complexity to the problem. For these reasons, it is no wonder that substantial advancement in understanding ML phosphors came at a slow pace during the past two decades. In addition to a review on triboluminescence in 1977 [7], there are a few reviews available in the field of ML research at present. Some are too concise to take a deep dive into the structure clarification and mechanism study [31,32]. The other focuses only on lanthanide ML, which also include organic molecules, and does not relate ML to the research of persistent luminescence [33]. Therefore, we provide in this review an extensive overview of the field of ML. ML materials are first tabulated and possible trends of the crystal structure and microstructures are pointed out. A summary of proposed mechanisms is given and it is discussed how theoretical models improve our understanding of ML. Next we provide an overview of demonstrated and potential applications of ML materials. Finally, we highlight some of the remaining challenges and identify specific future research tracks in this particularly active area of phosphor research and applications.
2. Basic Concepts
ML is essentially related to detrapping of carriers in phosphors under dynamic loading, but the relatively small number of ML phosphors available makes it far from straightforward to better understand its mechanism and to distil guidelines for discovering new ML phosphors. However, it is instructive to assess first the roles of the host symmetry, the defects and the types of external mechanical load in ML. Finally, it is important to gain insight in how ML phosphors are commonly measured and evaluated.
2.1. Symmetry and Tensor Properties in Crystals
The full crystallographic symmetry of a crystal can be described by one of the 230 space groups. Modulation vectors can be added to describe incommensurate modulated structures [34]. Among these symmetry elements, point group is the most important because it is common to all of its physical properties (Neumann’s Principle [35]). Under an external influence, the induced phenomenon can be obtained through a physical property, which can often be described by a tensor (A tensor is a multilinear transformation which takes r vectors (r is also the rank of the tensor) as input and produces a number [36]. In physics, a tensor and its associated vectors are often physical properties (electric field, stress, etc.). Multilinearity ensures the independency of the chosen way of description and a consistent relationship between the components expressed in different coordinates). As the symmetry of a tensor is related to the medium and its intrinsic symmetry, the independent components and their relations can be gained by various methods, such as matrix method [37], direct inspection [38] and group theory [39].
For a better understanding of the ML phenomenon, both the crystallographic properties of the host and the effect induced by stress are required. The electric polarization per unit cell of insulating crystalline solid is the centre of charge of Wannier functions of the occupied bands [40]. In non-centrosymmetric compounds (excluding those with point group 432), electric polarization can be generated by applying a stress and the effect is termed piezoelectricity [41]. Permanent electric polarization can be present in polar crystals and leads to pyroelectricity, an effect where charges are generated by uniform changes of temperature [41]. Ferroelectricity is obtained when spontaneous polarization can be switched by an external field (temperature, electric field, etc.) [42]. Furthermore, polarization can also be generated by gradients of strain, which is called flexoelectricity for which the coefficients form a fourth rank tensor [43]. In addition to electric polarization, spontaneous strain can exist in crystals as well. In parallel, if the spontaneous strain can be switched by an applied external stress, the phenomenon is called ferroelasticity [44]. Another effect of stress on crystals is to change the refractive index (i.e., the photoelastic effect [45]), for which the tensor is called the piezo-optical coefficient. The symmetry of stress itself and the point group of crystals determine the relations of tensor components, as shown in Appendix B for piezoelectric coefficients and piezo-optical coefficients.
2.2. Dynamic Deformation and Its Consequences
The central role of dynamic finite strain (stress) in ML calls for a careful consideration of the definition and their consequences. Strain, a physical observable quantifying deformation of continuum matter, is now often described by a function of metric tensors (initial configuration) and (current configuration) in co-moving coordinates. For example, Green-Love strain in classical finite deformation theory is defined as [46]. All information on deformation is contained in the transformation that changes to , i.e., . Here,
where is Kronecker delta, and is the covariant derivative of displacement field in which is the Christoffel symbols of the second kind [47]. Based on the inner product of base vector, Green-Love strain fails to describe the local rotation correctly, which is very important for dynamic load, especially for large deformation. Chen, Z.-D. [48] suggested be decomposed into a symmetric tensor and an orthogonal tensor (Another decomposition scheme, i.e., the polar decomposition, was formulated as: , in which R, U and V are the orthogonal rotation tensor, the right stretch tensor and the left stretch tensor, respectively [49]. It is clear that such decomposition results in two unique stretch tensors and a temporal order of rotation and extension (compression). In such a sense, it does not place a very solid foundation of mechanics):
with
in which,
Here, T means transpose. Clearly, is an extension of Cauchy’s strain definition to finite deformation in an intrinsic co-moving system, while corresponds to finite rotation in Euler parameters, with being the rotation axis and the rotation angle (The Cauchy strain is defined in fixed Cartesian coordinates () by the displacement field as . In 3d space, a central rotation around the unit vector by an angle θ can be expressed in a concise form , where is the cross product of , ⊗ the tensor product and I the identity matrix.). In such sense, the strain can be simply defined as
Here, and correspond also to the longitudinal wave (P-wave, P for primary) and transverse wave (S-wave, S for secondary) in the theory of elastic wave [50]. A non-zero means irreversible strain residual even though the macrodeformation is “reversible” (The reverse transformation of is denoted as , satisfying . If , then a non-zero Θ means . Suppose the rotation is reversible, , then we have and . In principle, and therefore , which shows irreversibility), which may result in plasticity and fatigue [51], an effect that is often neglected.
Stress is normally viewed as the response of strain due to external forces, and is often defined as Cauchy stress, which in Cartesian coordinates reads,
where and are Lamé constants. Here, it is assumed that the continuum media react to external strain spontaneously. In the elastic limit, this relation can be expressed as Hooke’s Law:
in which is the elastic stiffness tensor with rank 4 and has only 36 independent components for static loads. In dynamic loads, the requirement of conservation of momentum and angular momentum leads to,
This relation means that stress is always asymmetric under dynamic loads and is symmetric in static loads [51].
In reality, stress may also depend on the history of loading, where elastic stiffness changes with time to a certain value. Following the theory of linear viscoelasticity, stress can then be calculated [52],
thanks to the Boltzmann superposition principle [53]. According to Chen’s decomposition, the constitutive relation is now,
where the second term corresponds to viscous stress which is here associated with local rotation [54]. Typical phenomena of viscoelasticity are stress relaxation (a step constant strain results in decreasing stress), creep (a step constant stress results in increasing strain), and hysteresis (a phase lag in stress-strain relation). The response to stress (strain) of elastic, viscous and viscoelastic materials are drawn schematically in Figure 2, for the purpose of comparison.
Viscoelasticity has also been observed in other physical properties, such as piezoelectricity, ferromagnetism, dielectricity, which account for the non-linearity of response to external fields and are argued to be related to domain structures [55]. Similarly, the mechanical response of the ML material itself has to be taken into account when investigating the mechanism of ML.
2.3. Measurement and Performance of ML Materials
A setup capable of deforming materials can be utilized to measure ML, combined with additional devices to collect the emission of light. A typical apparatus introduced by Xu et al. is shown in Figure 3a [57], where the force (or displacement) can be read from load actuators and the instantaneous ML intensity can be recorded by photomultiplier tubes (PMT), photodiodes, high speed cameras or portable spectrometers. It is also possible to detect ML at the micro-scale (Figure 3b) by attaching a photo-counting system to an atomic force microscope [58]. This method is helpful to gain insights into the relationship between the strain and ML intensity, although the signal is inevitably quite weak. Standardized measurement procedures are needed to compare ML results from different phosphors or setups, for example using calibrated detectors that quantify absolute ML energy [59].
A good ML phosphor often exhibits high ML intensities and excellent linearity between ML intensity and mechanical load, in addition to other merits of phosphors in lighting applications. The ML intensity carries a twofold meaning, namely the instantaneous intensity and the accumulated intensity. The former refers to the emitted power of photons detected by a camera or PMT subtracted by the instantaneous intensity of persistent luminescence free of mechanical load. The latter means the integration of instantaneous intensity from time when the load begins to any time of interest. The instantaneous intensity is often proportional to the mechanical power applied into ML phosphors and the slope between these quantities indicates the sensitivity to loads. The load range in which the instantaneous ML intensity is linear to mechanical loads, or range of linearity in brief, is a good indicator of ML phosphors for the capability of sensing stress. Of course, the storage capacity (for example SrAlO:Eu, Dy has a capacity of 1.6 × 10 photons/g [60]) and the initial fraction of the traps filled by photon charging determine the intensity of the trap controlled ML. Saturation, which makes ML independent of trap filling, can be obtained by increasing the duration or the intensity of the excitation during the charging step.
3. Mechanoluminescent Compounds
3.1. Known ML Compounds
In the early stage of ML research, more than a thousand compounds were reported to be luminescent due to fracture, i.e., fractoluminescence. Colored alkali halides and ZnS:Mn single crystals also exhibited ML under elastic or plastic deformations [7]. Elastico- or plastico-luminescence in phosphors gained interest only since the late 1990s. Hence, several criteria are set to screen the latter ML compounds. Crystals that show fractoluminescence are excluded here because its nature is associated with charge separation near crystal facets, providing only limited information on the physics of luminescence under deformation. Compounds showing ML due to impact are compiled only when the impact is of a sufficiently low velocity such that fracture is negligible. Persistent luminescence, if any, and depths of the relevant traps are noted when available in literature. Before ML experiments, phosphors are often charged by light of appropriate wavelength. In Table 1 , these compounds are listed in several groups based on their structural types (or their derivative structures), for the purpose of revealing common structural features and their impact on ML. In this regard, the preparation methods and post treatment were not accounted here though they are important for the final properties of phosphors. Interested readers are referred to other sources, such as Refs [61,62].
3.2. Crystal Structures and Their Relation to ML
3.2.1. Rock Salt and Wurtzite-Related Compounds
In rock salt compounds, which are built up with layers of edge-sharing octahedra, colour centres are often created by irradiation of X-rays, -rays or by treatment with metal vapor. Dislocations in these single crystals are prone to slip as the critical stress is only about 1 MPa [199]. Actually, ML was found in coloured alkali halides early since the 1930s, but non-irradiated alkali halides usually do not provide light during deformation except for fracture [7]. ML takes place even at a very low stress levels (see Table 1) and its intensity is linear to the stress within the elastic limit but is only proportional to mechanical power during plastic deformation [200]. In successive load cycles, a memory effect can be observed: ML only appears after new plastic deformation takes place [201].
An analogue of rock salt structures, wurzite-ZnS is a hexagonal close packing of layers connected by [ZnS] tetrahedra sharing common anions (Figure 4a). The layers are repeated in a …ABABA… fashion along (001) planes. The absence of inversion centres results in piezoelectricity [202]. ML has been found in ZnS doped with Cu, or Mn, which was argued to arise from the interaction between piezoelectricity and shallow acceptor and donor levels [203]. It is still unclear how these phosphors recover ML intensity to initial levels in successive load cycles (self-recovery) [10,108,121,204], although strong retrapping of electrons in the conduction band was proposed for such phenomenon [205].
CaZnOS can be classified as a wurtzite-related compound in terms of the packing of tetrahedra layers. These layers consist of [ZnSO] tetrahedra sharing common S in the basal plane and at z = c/2, while Ca ions are inserted into channels between these layers (Figure 4b)). All Zn-O bonds run parallel and point to the -c direction, making CaZnOS a polar compound characterized by a large piezoelectric constant ( = 38 pm/V) [206]. CaZnOS was found to be ML when doped with Cu, Mn, or lanthanides (Er, Sm), though there is no self-recovery of ML intensity as in the case of ZnS. For both ZnS and CaZnOS, persistent luminescence was not observed for various dopants except for Cu, indicating that also deeper defects are possibly responsible for ML. Interestingly, BaZnOS contains layers of vertex-linked [ZnOS] tetrahedra and adopts non-centrosymmetric space group Cmcm [207]. It gives red ML (634 nm) when doped with Mn, adding an example of ML in non-piezoelectric host [141,142].
3.2.2. Tridymites
Tridymite (Figure 5a), a high temperature polymorph of silica, is an excellent example to illustrate the bonding topology of framework structures, which are typical for silicates and aluminates. Vertex sharing [SiO] tetrahedra are often connected to form ring-like nets in planes, such that framework structures are formed when the third dimension is subject to further connections. The topology of ring-like structures is characterized by the sequence of upward (U) or downward (D) pointing of tetrahedra, e.g., UDUDUD for tridymite (Figure 5a). It is also possible to replace Si ions by ions of lower oxidation states, on condition that charge neutrality is achieved by suitable cations. These cations are stuffed in cavities, resulting in stuffed tridymite structures. Accordingly, different topologies of tetrahedron arrangements or/and structural distortions lead to a large number of supercells and structures of low symmetry [208].
AAlO (A = Ca, Sr, Ba) adopt the stuffed tridymite structure, but display structural differences in tetrahedra connectivity and site symmetry of cations. The three structures contain similar motifs consisting of rings with corner-sharing [AlO] tetrahedra, but the sequence of tetrahedra corners are slightly different. In CaAlO, the tetrahedra are heavily tilted and rotated, exhibiting a new tetrahedron sequence, DDUDUU, in addition to the common UDUDUD sequence (Figure 5b). Small Ca ions can be accommodated in three different coordination environments: two sites are coordinated by six O atoms from AlO tetrahedra, while the other site is ninefold coordinated [209]. On the contrary, both SrAlO and BaAlO adopt a UDUDUD tetrahedra corner sequence (Figure 5c,d). BaAlO features higher symmetry (P6), in which Ba are ninefold coordinated. Sr ions are so small for the large cavities in the undistorted framework that they occupy two nonequivalent sites to have irregular polyhedra [210]. [AlO] tetrahedra are tilted with respect to the (001) plane in addition to a cooperative rotation along the [001] direction [211]. It is noteworthy that SrAlO lattice is highly anisotropic since the thermal expansion coefficients along a and b axis are an order of magnitude larger than the one along c axis [212]. When doped with Eu or Ce, SrAlO is among the most studied ML compounds mainly due to its high brightness of ML. The distortion of tetrahedra in SrBaAlO ( 0–1.0) can be lifted by either raising temperature or by incorporating bigger cation (thus by increasing x) [211], and a transformation from monoclinic to hexagonal structure takes place around 0.31–0.43. Accidentally, the ML intensity of SrBaAlO:Eu, Eu decreases with increasing x and reaches zero around , the critical point [98]. Thus, the ML intensity seems to be related to the distortion of the tetrahedra framework since piezoelectricity and persistent luminescence are present throughout the whole composition range. Furthermore, twins, boundaries or planar defects are often found in low temperature form of these compounds mainly due to phase transitions [213,214]. Interestingly, when pulse loads P ( MPa) were applied to CaAlO: Eu, the instantaneous ML intensity I follows , which was argued to originate from electroluminescence upon piezoelectric field [93]. This different behaviour can provide insights for the mechanism of ML in this group of phosphors.
ZnGeO is a derivative structure of tridymite by replacing all [SiO] by [ZnO] and [GeO] in a ratio of 2:1. These tetrahedra are no longer arranged parallel to the a-b plane, but tilted in such a way that every tetrahedron gets one edge along [001] [215]. Persistent luminescence being weak, ZnGeO:Si, Mn shows green ML under compressive loads [100].
3.2.3. Anorthite and Melilites
Anorthite is an end member of plagioclase feldspar: NaAlSiO (albite)-CaAlSiO (anorthite). It exhibits complexity in anion connectivity and cation orders, while having structure modulations or phase transitions in albite-anorthite solid solutions or CaSrAlSiO (0 < x < 1) series. For anorthite as shown in Figure 6a, a framework structure composed of four-member rings is formed by [SiO] and [AlO] tetrahedra in an ordered manner, but disorders of tetrahedra may also be present since spontaneous strains are often found, leading to ferroelasticity. Chemical substitution reveals the influence of cation size on the crystal chemistry of feldspar. CaSrAlSiO transforms to monoclinic structure at 0.86 as the content of Sr increases [216], which also shows characteristics of ferroelasticity. The order parameters, i.e., internal strains and , disappear at the compositional transition point 0.86, indicating that SrAlSiO is fully disordered in the [AlO] and [SiO] tetrahedra [216] (Figure 6b). It is surprising to find that ML disappears at [170], which suggests that internal strains play an important role for ML in this anorthite series.
The crystal structure of SrMg(PO) is still unavailable but its zinc analogue, -SrZn(PO), is constructed from a three-dimensional network which is isotypic to BaAlSiO [217]. For this reason, it was grouped into anorthite related compounds based on the similar ionic size of Mg and Zn ( = 0.83 Å, = 0.74 Å for CN = 4 [218]), and their tendency to be tetrahedrally coordinated by O atoms [219].
Melilite phosphors have the general formula XTTO, with a large cation X = Na, Ca-Ba, Pb or lanthanides, while T = Mg, Zn, Al, Si, and T = Si, Ge, Al, B are often coordinated by oxygen ions. They crystallize in a tetragonal structure with space group P2m. Two [TO] tetrahedra are corner-linked to form [TO] dimers, which again are linked to four surrounding [TO] tetrahedra via bridging oxygen, thus forming tetrahedral sheets parallel to (001). The irregular pentagonal arrangements create large channels along the c-axis, in which X cations are located halfway between successive sheets [220]. The structure of CaMgSiO is shown in Figure 6c,d as an example. The strain due to the misfit between X cations and the tetrahedra sheet can be relaxed by rotation or twisting of tetrahedra together with possible atomic displacements of bridging O atoms [221,222], which is often thought as the structural reason for phase transitions in melilite compounds. Furthermore, particular ordering patterns of low-coordinated cations are directly linked to incommensurate structures [223,224]. Interestingly, the internal strains are so sensitive to cation size that alloying the cation site could even tune the modulation wavelength and phase transition temperature [225]. Meanwhile, incorporating Al into both T (Mg) and T sites (Si) tends to destroy the modulation structure (e.g., modulation structure is absent in CaAlSiO) and results in Al-Si order at the T site [226] and cation vacancies as a consequence of avoiding Al-O-Al bonds between [AlO] tetrahedra (“Loewenstein rule” [227]) [228].
It is clear from Table 1 that ML can be found in Ce or Eu doped anorthite and melilite, which also show persistent luminescence. Due to their unique structures, elasticity anisotropy can be expected from melilite and anorthite compounds. This was indeed confirmed by determination of the elastic stiffness constants from first principle calculation and experimental data [229,230,231,232]. Elastic anisotropy may help to reduce symmetry and hence to release trapped electrons when compounds are subjected to strain (especially shear strain), causing ML.
3.2.4. Perovskite Related Compounds
Simple as it may seem, ABO perovskites consist of corner-sharing [BO] octahedra adopting a primitive cubic unit cell, with the cations A stuffed in 12-coordinated interstices (Figure 7a–i). Site A can accommodate two kinds of cations as long as their sum of oxidation states is 6. The effect is two-fold: on one hand, the size requirement between site A and site B can result in twisted or distorted structures, while on the other hand cation ordering is also possible. The tunability of perovskite compounds, which can be achieved by altering the crystal structure and defects configurations by means of varying chemical composition or synthesis procedures, has made perovskites successful in many applications, such as piezoelectric transducers [233], superconductors [234], catalysts [235], and phosphors [236]. Perovskite BaCaTiO (0.25 < x < 0.9) is composed of the tetragonal ferroelectric phase BaCaTiO and the orthorhombic normal dielectric BaCaTiO [175]. Coupled with ferroelectric domains in Ba-rich phases, the polarization of Ca-rich phases was argued to induce ML in this system since large internal electric fields can be triggered under strain [175,237]. The structure of LiNbO, can be described by a displacement of hexagonally closed-packed oxygens, which makes it a ferroelectric crystal [238] ( = 69.2 pC/N). It is also a transformation from its high temperature structure, which is isomorphous to perovskite [239].
SrSnO (n = 1, 2, ∞) are termed Ruddlesden-Popper structures (Figure 7(aii,iii)), but they can be regarded as perovskite-rocksalt intergrowth structures, described by SrO(SrSnO), in which a rock-salt layer SrO grows with every n layers of perovskite SrSnO [240]. To minimize the mismatch (i.e., strain) between SnO and SrO layers, the [SnO] octahedra are tilted cooperatively in the case of n = 1 or 2 [240]. The sensitivity to cation size indicates that these compounds may adopt at high temperatures crystal structures with high symmetry to lower internal strains. As a comparison, BaSnO (Imm) differs from its strontium counterpart by the absence of octahedral distortions. Tilted [SnO] octahedra in CaSnO (Pbam) form one dimensional chains by sharing edges [182]. Sm doped SrSnO (n = 1, 2, ∞) are persistent luminescent materials for which the number of traps per volume (trap concentration) reduces as n increases from 1 to infinity [183]. The trap concentration and ML intensity were improved by alloying the cation site in SrSnO [186], or alloying [SnO] tetrahedra with Si or Ge in the case of SrSnO:Sm [187]. SrSnO (n = 1, 2, ∞): Sm shows ML, although they are not intrinsically piezoelectric. It is still possible that weak piezoelectricity is induced by defects at the microscale. Another member in Ruddlesden-Popper structures is CaTiO, which shows ML when doped with Pr [189].
Recently, Zhang et al. revealed ML in perovskite related niobates mCaO·NbO (m = 1–3) doped with Pr, in which CaO layers are inserted into layers of Nb-O polyhedral (Figure 7(bi)) or perovskite slabs (Figure 7(bii)) [29]. Although CaNbO and CaNbO are centrosymmetric, they showed piezoelectricity due to the anisotropy or cation vacancies of the hosts. Defects are created in these compounds, but lead to persistent luminescence only in CaNbO. The absence of the blue component of ML spectra with respect to photoluminescence emission spectra was argued to originate from a direct tunneling of electrons from intrinsic defect centres to Pr.
3.2.5. MSiON: Eu (M = Ba, Sr, Ca) and Other Compounds
For MSiON:Eu (M = Ba, Sr, Ca), the packing order of the polyhedra is more or less related to ML. In these three compounds, [SiON] tetraheda are connected by sharing a vertex to form condensed layers, while cations are bound to the terminal oxygen of the tetrahedra in consecutive layers. They differ in the sequence of tetrahedra and coordination environment of cations. BaSiON and SrSiON (or EuSiON) have the same tetrahedron sequence, but the consecutive silicate layers in SrSiON are shifted against each other to create distorted trigonal prisms of O atoms capped by one N atom (Figure 8b,c) [241]. On the contrary, CaSiON adopts different tetrahedra sequences, even though Ca atoms occupy the same coordination polyhedra as those in SrSiON (Figure 8a) [241]. The crystal structure of SrBaSiON: Eu solutions, transform from triclinic (P1) to another triclinic (P1) and finally to orthorhombic as x increases, accompanied by a change of cationic coordination polyhedra. Accordingly, a drastic change of emission energy was observed [242,243], which was also found when pressure driven phase transition occurs in this solution [244]. The fact that both SrSiON and BaSiON shows ML, in contrast to CaSiON, suggests that the ordering of the tetrahedra plays a fundamental role in addition to the defects responsible for trapping electrons. In BaSiON:Eu, both ML and persistent luminescence spectra show a 4 nm shift compared to that of the steady state photoluminescence, which was argued to origin from the existence of crystal grains with both Pbcn and Cmc2 [192]. The much lower intensity of ML in SrSiON:Eu compared to BaSiON:Eu is more likely to be related to differences in the concentration of traps [192] as thermoluminescence measurements revealed that SrSiON:Eu has a larger fraction of shallow traps than BaSiON:Eu [190].
It is not possible to comment in detail the behavior of all ML phosphors in Table 1, but defects in phosphors are evidently present and playing an important role. Spinels, which show ML under low velocity impact, are found to have cationic disorders by co-existence of inverse spinels. A peculiar connectivity of polyhedra of anion framework renders CaZr(PO) fairly anisotropic in thermal expansion [193]. The occurrence of multiple traps with different depth in CaZr(PO): Eu is likely to provide more channels to release trapped electrons under strains in the process of ML.
3.3. Microstructures
Optical properties of solid compounds are sensitive to both their general crystal structures and microstructures [245]. In addition to point defects and their agglomeration, there are still various kinds of microstructures, including twins, domains, domain walls, phase boundaries and compositional modulations. Moreover, the variation of chemical composition may generate unexpected ferroelectricity in intrinsically uniform compounds or by carefully doping distorted parts of the structure [246]. Polymorphisms and specific microstructures, if any, are listed in Table 2 for the purpose of searching potential elements that could impact the properties of ML compounds beyond their general crystal structure. The importance of atomic order/disorder, phase transitions and their consequences are also briefly outlined in this section.
3.3.1. Structural Phase Transitions and Their Consequences
In general, a phase transition refers to the change from one homogeneous state of matter into another one under external influences such as temperature, pressure, electric or magnetic field, and chemical substitution, etc. Structural phase transitions in solids due to temperature or chemical substitution (solid solution) carry importance, being directly related to techniques of preparing phosphors or tuning their properties. They can be achieved by a slight displacement of atoms (displacive transitions), by the breaking and reconstruction of chemical bonds (reconstructive transitions), or by the rearrangement of atoms in an ordered fashion (order-disorder transitions) [273].
A displacive phase transition involves only slight alteration of bond lengths and their relative orientations, implying that the space groups of the two phases are both subgroups of the space group of a reference structure (or prototype). One of its fundamental features is the formation of non-homogeneously textured low-symmetry domain structures, which are separated by domain walls. The types of domains and domain walls can be deduced from group theory [274,275,276]. The role of domains or twins and their boundaries, as reported in many compounds in Table 2, cannot be underestimated in the sense that they attract the impurity atoms (dopants) or generate ferroelectricity which is not intrinsic to the matrix. For example, the ferroelastic domains in SrAlO phosphor are pseudo-elastic under nano-indentation and are thought to help liberating trapped carriers in SrAlO:Eu, ultimately leading to ML [30]. Other important features of phase transitions are the anomalies of the elastic constants at the critical temperature T or pressure P, where the crystal tend to strongly “soften” or “harden” [277]. ML near this temperature range will certainly reveal the dependency of ML on the elastic properties of the host.
Chemical substitutions can alter phase transitions of compounds. They expand or shrink the crystal lattice and thus tune the transition temperature, as demonstrated in (CaSr)MgSiO where substitution of strontium reduces the temperature of transition from commensurate to incommensurate phases [225,266]. Chemical substitution itself can also induce phase transitions, i.e., morphotropic phase transitions, and the boundary between composition ranges in a T-x phase diagram is often called morphotropic phase boundary (MPB). Morphotropic phase transitions give rise to effects that are related to internal strains and atomic ordering due to the different size and/or charge of the impurity atoms, such as the ordered occupation of Sr in (CaSr)MgSiO, CaSrAlSiO, and SrBaSiON as reviewed above. As predicted from theoretical calculations by the coupled cluster method, emission spectra of dopants in inorganic solids are predominantly influenced by the local coordination environment (up to the second nearest neighbours) [278]. Thus, cationic or anionic alloying can bring a drastic shift of emission energy if there is a drastic change of local structures. A gradual blue shift of emission spectra in CaSrAlSiO:Eu () [169] was due to a smooth variation of the local coordination environment with chemical substitution although its crystal phase from P over I to I [216]. On the contrary, the emission drastically shifts from blue to orange when x crosses 0.75 in SrBaSiON:Eu solid solutions [242] because of a huge change in coordination polyhedra. The morphotropic phase transition in CaSrAlSiO () (Figure 9) causes the disappearance of internal strain at 0.86, around which the ML intensity drops to zero too in the Eu doped phosphors. Another merit offered by MPBs is the possibility to enhance the piezoelectric coefficients near the MPB due to a maximized shear anisotropy of piezoelectricity [279,280]. An increased piezoelectric field is favourable to release trapped charge carriers to produce observable ML, assuming that piezoelectricity is the driving force for the release of trapped charge carriers.
3.3.2. Modulated Structure and Chemical Gradients
Modulated structures are characterized by a periodic deformation of a basic structure that can be described by a conventional space group [34]. The modulation can be a periodic displacement of atomic positions or a periodic occupation of atoms at a specific crystallographic site [34], which can be interpreted in terms of the compromise between competing distortion modes or electronic instabilities [281]. A noteworthy case is the incommensurate structure in melilite compounds. A large displacement between the cations and the bridging O in tetrahedra layers results in distortions of the [MgO] and [SiO] tetrahedra. These distortions cannot be realized within one unit cell and thus lead to modulated structures [222,282].
The structure or chemical gradients in modulated structures may generate polarization through flexoelectricity effects [43], as well as by attracting impurities onto domain walls or other structural gradients [246]. The structure fluctuations can impose interesting effects on optical properties which depend heavily on the local atomic environment. The scheelite compound NaEuOMoO presents atomic occupational modulation when 0.5 (Figure 10a). Here, Eu are attracted to form Eu-Eu dimers (Figure 10b) due to the chemical gradient. The lifetime of the Eu D emission, being closely connected to the luminescent quantum efficiency, depends on the fraction of Eu ions that form dimers, as shown in Figure 10c [283]. Unfortunately, incommensurate structures in ML phosphors attract surprisingly little attention, although these structures can be important as local strain tends to modify the environment of dopants and hence the ML properties.
3.4. General Remarks
The relatively small number of ML compounds do not seemingly justify an explicit link between the crystal structures and the performance of ML, but it is true for most compounds that the emission centres of ML are the same as those of photoluminescence, persistent luminescence or electroluminescence, if present. The essential triggers for ML are found in the specific crystal structure, point defects and their agglomeration, and microstructures, such as domains or domain walls. Point defects and their clustering create suitable traps for charge carriers in phosphors. The change of their geometric configuration under strain brings about the change in binding energy for trapped charges, which may facilitate the escape of trapped charges. More importantly, centrosymmetry can locally be broken by defects and piezoelectricity can thus be observed [29]. In this regard, compounds with anisotropy in elasticity or piezoelectricity are favourable for the development of ML phosphors since internal electric fields in certain crystallographic directions can be large enough to induce observable ML. The structure survey shows roughly 80% of ML phosphors have flexible framework structures where anisotropy in the elasticity exists or can be expected.
Only limited research has been reported on ML at the microscale [58,149], but the influence of microstructure can be vital in several cases. Twin structures with various morphologies were found in SrAlO:Eu phosphors and the domains show quasi-elastic character under nano-indentation (refer to Section 4.2 for their roles in ML mechanism). The mechanically assisted release of carriers from sites near boundaries was argued to induce ML in this compound [30]. Microstructures in ML phosphors clearly deserve more attention and deeper investigation.
4. Proposed Mechanism and Models
Evidently, processes in ML take place at several scales in time and space. It is necessary to overview possible mechanisms or dynamics of ML at different stages. At the scale of unit cells of ML phosphors, it is widely accepted that ML originates from transitions of charge carriers at traps. To illustrate the relationships between traps and the host, the ML phosphor SrAlO:Eu, Dy serves an excellent example. The electronic structure of SrAlO , as shown in Figure 11, is described by a band structure, with dopants (here Eu, Dy) treated as localized charge state transition levels. The exact eigenstates of the dopants (displaced along the side of the band diagram) are actually treated by crystal field theory. Intraconfigurational transitions, which are obtained by subtracting the total energy of final and initial states, can then be compared with experimental findings. Oxygen vacancies are likely to play a role in trapping electrons in SrAlO:Eu, Dy since their levels are close enough to the conduction band [284]. The main influence of adding co-dopants, such as Dy, was argued to modify the trap depth distribution [83], stabilize vacancies via electrostatic interaction [92], or increase trap density via charge compensation mechanism [285] and trap carriers in some cases [286]. The positions of these defects levels are normally calculated by density functional theory. Interested readers are referred to Ref [287] for more information and the accuracy analysis.
The motion of large number of charge carriers (electrons or holes) often happens in phosphors at the spatial scale of microcrystals and the time span can be from 10 s to ∼100 h. Among many processes in charging stand out two kinds of activities that deserve special attention. On the one hand, 4f electrons of Eu can be directly excited to its 5d states and subsequently ionizes (i.e., Eu is obtained), which was confirmed by a Eu→ Eu process in XAFS [286] and EPR [289] results. The ionization can be thermally assisted, especially when one excites the lower 5d states of Eu. On the contrary, the Dy→ Dy was not convincingly detected, which suggested that the electron is presumably not fully trapped by Dy although loosely bound Dy-e pairs are also possible [286]. On the other hand, electron-holes can be created by elevating electrons from the valence band to the conduction band, which can be trapped at various defects (donors for electrons, acceptors for holes), but only electrons were argued to be the carriers responsible for the subsequent luminescence [289]. For other ML phosphors, holes can be charge carriers.
The dynamics of these processes can be approximately simulated in the framework of homogeneous or heterogeneous chemical reaction methods, where the change of species are described by differential equations. When the dependency on spatial distances are included, one can reach numerical solutions based on the Monte Carlo method, see Refs [290,291] for example. Another route to ML dynamics lies in the non-equilibrium thermodynamics, in which the evolution of all admissible processes can be predicted by the second law of thermodynamics. The irreversible processes (ML here), can be related to stress/strain tensor, or its related variables. The intrinsic irreversibility of dynamic deformation here can be treated as “damage” to the electrons stored at defects and thus can be included in thermodynamics as an internal variable. It is possible to decouple processes at different length/time scale via these phenomenological approaches and its validation with experiments.
However, we are only able to detect ML at the scale that statistical mechanics works well, which usually provides the average value of intrinsic ML properties. The driving force of ML should be a small part of the distortion energy during dynamic processes since spatial dependency of ML agrees well with the Von Mises stress , which is associated with the asymmetry of principal stress [292]. Unfortunately, Von Mises stress is not a tensor that can be used as a state function of the ML phosphor system. In reality, we are not relating stress (a state function) to ML, but its change, which might include non-linear effects of ML intensity. Clearly, we missed the link that relates mechanics to the real driving force of ML, which often takes place at the scale of single grain particles of ML phosphors.
The best scenario is to have a good knowledge of the relevant defects level and how they change under mechanical load, so that we then can connect experimental findings to defects in phosphors through thermodynamics. The intuitive concept is that the energy barriers of trapped carriers are lowered upon mechanical load, either by reducing the band gap of the host or changing the positions of defects in the band gap of the host. For many wide band gap semiconductors, the band gap changes about 10–40 meV under hydrostatic pressure of 1 GPa or at 1% strain of lattice [293] (The band gap of semiconductors under pressure p can be written as , in eV and p in GPa. The coefficient a can reach ∼50 meV/GPa for many direct wide band gap semiconductors and about −20 meV/GPa for indirect band gap semiconductors. b is on the order of 0.1 meV/GPa). In a typical ML experiment, the band gap reduction is estimated as several meV since the maximum shear stress is often below 100 MPa (Appendix A). External electric field can only cause a tiny reduction of band gap via the Franz-Keldish effect [294,295] or quantum confined Stark effect [296] of quantum well structures (e.g., 0.7 meV for hexagonal ZnS crystal [297] at 10 V/cm). Another source of band gap shift is from extended defects in crystal such as dislocations [298], faults and grain boundaries, which can generate large electric fields (10 V/cm for ZnS [299]) and thus also reduce the band gap. In this regard, piezoelectric phosphors are likely to have appreciable reduction of band gap when they are strained, which coincides with the fact that many ML phosphors exhibit defects as stated in Table 2. It is also very likely that energy levels of defects move towards to conduction band because of the geometry change of the configuration, which is probably due to its relatively distorted structure of the phosphors.
4.1. Mechanism 1: Piezoelectrically Induced Detrapping by Reducing Trap Depth
This mechanism is based on the idea that piezoelectricity is responsible for the internal electric field that helps to release trapped carriers, which takes place in persistent phosphors or doped semiconductors. Piezoelectricity can originate from intrinsic properties of non-centrosymmetric compounds (excluding compounds with 432 point group) or centrosymmetric compounds that have proper types of lattice defects or microstructure [27,28,262]. A decrease of effective energy barriers of traps leads to the release of an extra amount of carriers with the help of mechanical load [189]. Take Eu as a typical emitting center, and this mechanism is summarized in the following steps:
- i
- upon photo-excitation, 4f electrons of Eu ions are lifted to 5d levels and subsequently escape to the conduction band, leading to Eu ions being oxidized to Eu;
- ii
- the created electrons in the conduction band are trapped at defect centres, e.g., vacancies , co-dopants R, or other defects;
- iii
- when stress is loaded, the depth of traps is reduced due to the piezoelectric field, leading to the detrapping of electrons (to the conduction band);
- iv
- the released electron is captured by Eu, which in turn reduces to an excited ion Eu;
- v
- de-excitation of the excited Eu ions provides emission of light.
Interested readers are referred to references [28,300,301,302,303] for a summary. It should be straightforward that anisotropy in the elasticity is favourable here to lower site symmetry or to create strong electric field in specific directions. Moreover, the energy levels of defects and that of dopants should be close enough if a direct tunneling between them is responsible for ML, e.g., in CaNbO:Pr [29]. Actually, this mechanism seems to work well for most, if not all, persistent phosphors where trap depths are in a proper range.
However, it is more complicated to apply this mechanism to ML in some doped semiconductors, especially ZnS:Mn and CaZnOS:Mn, in which the traps are probably emptied at room temperature. ML in ZnS:Mn was argued to originate from electroluminescence triggered by internal piezoelectric field since traps are too shallow [106] to hold electrons at room temperature. The maximum piezoelectric field of perfect ZnS crystal is estimated as only 320 V/cm in a typical ML experiment (Appendix C), which is about 100 times smaller than the threshold field for electroluminescence [304]. In fact, the threshold of stress for ML in ZnS:Mn is only 0.6 MPa [108] , which corresponds to an electric field of 2 V/cm. Chandra et al. proposed that enhanced piezoelectric constants can be achieved by electric dipoles induced in photo-excitation [305], but the existence and stability of such dipoles still remains speculative. For the case of CaZnOS:Mn phosphor, the red emission is attributed to G(T)→S(A) transition in 3d states of Mn, which can be excited through charge transfer states efficiently [306]. Its ML intensity is independent of prior heat treatment under different temperature, suggesting that traps for ML are either too deep or a novel mechanism should be proposed. Huang et al. proposed that intrinsic defects produced by substituting Zn/Ca with Mn in the lattice are responsible for ML and concentration quenching [307]. Interestingly, oxygen vacancies are claimed to be responsible for the luminescence process in undoped CaZnOS [133]. Consequently, the complexity of defects and the interaction with piezoelectricity of hosts can tremendously complicate our understanding of ML.
It is interesting to note that, when multiple defects and luminescent centres are both active for ML, a tuning of emission colour could be anticipated via strain/stress. This is true for ZnS:Al, Cu whose emission spectrum shifted to higher energy when the frequency of the stress field [121], the electric field [121,123] or the magnetic field [125] increases. It seems that some deeper traps are only available for luminescence under dynamic load with high strain rate.
To obtain a quantitative model, one must have a good knowledge of the distribution of traps with trap depth, how the reduction of trap depth relates to stress and the dynamics of free carriers in a host’s conduction band. Luckily, several empirical models are available to provide a predictive relation between mechanical load and instantaneous ML intensity.
4.1.1. The Rate Equation Method
The dynamics of luminescence can be often modelled by solving “rate equations”, where the emission of a photon is considered as a homogeneous “chemical reaction”. Kim et al. managed to numerically solve rate equations for SrAlO:Eu, Dy in an attempt to understand how stress helps to release trapped carriers [308]. Unfortunately, the original rate equations were falsely based on an assumption that holes are the charge carriers and that Dy is formed [77]. In fact, electrons are the charge carriers in this particular phosphor and oxygen vacancies are presumably electron traps. Hence we display here the correctly labelled rate equations using the symbols V and V to denote traps before and after capturing electrons. The modified rate equations are,
where K and K are rate constants of detrapping and recombination respectively, and N is the numbers of ions or vacancies per unit volume. The initial conditions and boundary condition are, respectively,
Here, is the total number of ions or vacancies both at ground state and excited state and m is the initial ratio of traps that has already captured electrons. The quantity , which is supposed to be proportional to the spontaneous ML intensity, can be solved by a Runge–Kutta algorithm [309].
For a rod (dimension shown in the insect of Figure 12a) subjected to a maximum of 500 N applied at two different rates, the instantaneous ML intensities were obtained (Figure 12a) and compared with numerical solution of rate equations (Figure 12b). The main feature of ML curve (downward convexity) is only present when the combination of m and falls into a specific region as shown in the inset of Figure 12b. Clearly, m is related to the photoexcitation process while depends on the properties of traps and the release mechanism of electrons.
Similarly, Chandra et al. proposed that instantaneous ML intensity is proportional to the number of electrons in conduction band [310,311], which follows from the rate equation,
in which is number of trapped electrons at defects, the depth of a trap and the lifetime of excited electrons in conduction band after which they are retrapped or captured by Eu centres via process i. They further assumed that trap density decays exponentially with trap depth and that the increase of electrostatic energy of trapped electrons is responsible for the reduction of detrapping barriers, i.e., with the electrostatic energy of a trapped electron due to stress . Here, is the piezoelectric coefficient, the dielectric constant, e the elementary charge, and a scale factor. Then, the detrapping rate of electrons due to stress is given by:
A final solution provides formulae for the instantaneous intensity and accumulated ML intensity as:
Obviously, the instantaneous ML intensity is proportional to the product of stress and stress rate while accumulated ML intensity is roughly quadratic with stress, which also agrees with experimental findings [81]. Actually, the assumption of the trap distribution is not physically validated, e.g., a Gaussian distribution [312] was found in CaAlO:Eu, Nd, and should not be a prerequisite in deducing the above equation. Furthermore, the bimolecular nature of retrapping and recombination, which is valid for persistent luminescence and optically stimulated luminescence [313], was absent in Chandra’s formulation and can lead to failure of describing the hysteresis behaviour of ML (Section 4.1.2).
4.1.2. Viscoelasticity Method
It is possible that instantaneous ML intensity also depends on the history of loading, which often exhibits a phase lag with respect to the load and a hysteresis effect. Under cyclic sinusoidal loads, the intensity of instantaneous ML and its associated persistent luminescence of SrAlO:Eu, Dy shows a phase lag with respect to the load (Figure 13a) and a hysteresis effect during load-unload cycles (Figure 13b), which is intrinsic to ML processes since no phase lag was detected in the stress-strain relationship [314]. Therefore, Sohn et al. included a “second-order” term to account for the non-linearity of ML [314] so that:
in which describes the decay of light intensity and , are complex constants accounting for the phase lag or hysteresis. An excellent fitting of experimental data can be obtained through this model, as shown in Figure 13a.
A more detailed treatment on the hysteresis of ML phenomenon was given by Dubernet et al., who built the model from linear viscoelasticity theory [315]. The mechanical power taken by the SrAlO:Eu, Dy phosphor depends on the history of applied strain energy,
where is a creep function . can be calculated from a relaxation function, which is a stretched exponential function for complex system with strong correlation [316,317], and ends with,
The detrapping rate of trapped electrons () was assumed to obey the same stress dependence as and to be proportional to the relative fraction of the remaining trapped electrons, which leads to
where and are the number of total and of trapped electrons, respectively. The instantaneous ML intensity at t should be proportional to the rate of photon emission (), thus
with a scale factor.
As shown in Figure 14, an excellent agreement was achieved between ML intensity and the fitting of the model under varying loading rate. The ML peak upon abrupt decrease of load was also predicted by this model, while its physical picture can be understood from the Boltzmann superposition principle [53]. The abrupt release in load is equal to the sum of stress before unloading plus an equal amount of load in the negative direction, which induces recovery phenomena (see Figure 2). In our case, it produces another ML peak. The physical origin of hysteresis of ML are argued to be the combination of trapping and retrapping of electrons during ML since the phase lag and hysteresis loop disappear upon illuminating the material with a laser of high power [318].
4.2. Mechanism 2: Carrier Release by the Electric Field Produced by Domain Structures
As reviewed in Section 3.3, domain structures possess special mechanical properties and they can also create internal electric fields. Indeed, domains and domain walls were proposed to be linked to ML by several researchers [30,175]. Matsuo et al. reported the existence of twin structures with three different morphologies formed by the thermoelastic martensitic transition in SrAlO:Eu [30]. The movement of twin boundaries under nano-indentation exhibits pseudo-elastic behaviour (shown in Figure 15a). The authors then proposed a model based on this unique behavior of twin boundaries as follows (Figure 15b):
- i
- electrons are photo-ionized from Eu ions and trapped at defects in SrAlO:Eu.
- ii
- upon the mechanical load, the twin boundaries show a pseudo-elastic deformation and creates an electric field around the boundary to release the trapped electrons.
- iii
- the electrons are captured by Eu, which turn into Eu, and the de-excitation to the ground state of Eu yields the emission of light.
When boundaries meet with Eu ions, electrons at boundaries can reduce Eu into Eu. Since there are many kinds of microstructures in SrAlO:Eu, other defects could also play a role. Unfortunately, the scarcity of quantitative data has prevented researchers from building a mathematical formula to validate the mechanism proposed here.
Wang et al. proposed that the ferroelectric domains in composite ceramics of Pr-doped BaTiO-CaTiO induce large electrostriction effects [237], electroluminescence and ML [175]. The composite material BaCaTiO () was thought to be composed of the tetragonal ferroelectric phase BaCaTiO and orthorhombic normal dielectric BaCaTiO, which has a relative dielectric constant of 160–200 [175]. The polarization of Ca-rich phases interacts with the ferroelectric domains in Ba-rich phases since the two phases contact in three dimensions. The rotation of domains is thus hampered, resulting in a high electrostriction effect near the solution limit. Under mechanical load, ferroelectric phases provide electric fields, which become enhanced by electrostriction, and can then excite luminescent centres Pr in the persistent luminescent phosphor BaCaTiO:Pr, leading to luminescence.
The study of ML at a microscale is not readily available and the direct relationships between domains and light emission have thus not yet been substantiated. The mechanism proposed here provides clues that the hysteresis of ML might be related to domain states and other microstructures.
4.3. Mechanism 3: Carrier Release by Movement of Dislocation
Defects in coloured alkali halides can be grouped into F-centres (an electron trapped at a anion vacancy), V-centres (A V-centre is the self-trapped hole in deformed alkali halides, i.e. a combination of a neutral halogen atom (the hole) with an adjacent halide anion, both off their regular site. It moves only by incoherent jumps from one site to another due to the local lattice distortion and polarization. See Ref [319]), and impurity centres (such as Cu, Tl, Ag etc.) [320,321]. The energy levels of F-centres and V-centres are often several hundreds of meV below the conduction band and above the valence band, respectively [320,321]. Shallow electron traps can be present as well. Charged by cations or anions, dislocations can bind electrons, holes and excitons [322] through elastic [323] and electrostatic [324] interactions with point defects . The interactions are more predominant when the dislocations are bent or move during elastic and plastic deformation, respectively.
It has now been established that ML of coloured cubic alkali halides is mainly due to the recombination of electrons from F-centres and holes from V-centers or impurities [64,67,325], as exceptionally pure and additively coloured crystals do not yield light due to the absence of holes [66]. The bending of dislocations due to internal friction [326] within the elastic limit interacts with electrons in colour centres, reducing the energy barriers for electrons. Upon plastic deformation, a dislocation line moves as a whole in crystals and helps to liberate electrons when it sweeps across F-centres with the assistance of thermal energy. The liberation of holes from V-centres or impurities can also be sensitized by dislocations [327]. The existence of dislocation induced bands (DIBs) in the band gap is not always valid, for example such DIBs are absent in the band gap of KCl and NaCl as predicted by quantum chemical calculations [328]. The energy difference between the F-centre levels and DIBs as claimed in temperature dependent ML is actually associated with the thermal activation energy of the movement of dislocations [329]. The driving force of capturing carriers (electrons or holes) is more probably related to the geometrical configuration, density and velocity of dislocations, which also determines the activation energy of dislocation movement. Vividly enough, the anisotropic distribution of ML on certain crystal facets of rock salt compounds coincides with the geometrical alignment of thier slip systems [64], indicating slip of dislocation is rather essential in ML.
A schematic diagram is presented in Figure 16a as modified from Ref [330]. It should be pointed out that carriers responsible for ML originates from F-centres and V-centres and also from the movement of dislocations. The black arrows pointing to F-centre and V-centre represent the capturing of produced carriers while carriers recombine mostly via the conduction or valence bands of host. Chandra et al. developed a mathematical model for the evolution of the ML intensity during elastic and plastic deformation [326,330] under a step load, which was approximated by,
with being the maximum amplitude of stress and the rise time of the stress. The authors assumed that the bending of a dislocation will sweep some area within the crystal as the movement of dislocations does. Therefore the difference between elastic and plastic deformation is reflected in the choice of the stress-strain relation, i.e., Hooke’s law for elastic deformation and the power-law for plastic deformation [330]. The rate of dislocations swept out to the surface is
where , are the number and velocity of moving dislocations respectively. During its movement, dislocations capture electrons with a rate,
in which is the electron density generated in the dislocations and a constant. and are the density and the interaction radius of the F-centres. The recombination of these electrons with holes at V-centres induces ML, whose instantaneous intensity should be proportional to . Given the stress-strain relationship, can be calculated by:
in which and are constants. The solution of yields the following form for both elastic and plastic deformation:
where , , and are constants. The solution shows first an increase and then a decrease of the ML intensity as a function of time, which agrees fairly well with experimental findings. In the case of deformation under fixed strain rate, Chandra et al. took into account the diffusion and drift of electrons in dislocations, and obtained a single exponential relaxation function [331]. However, the ML peak upon the abrupt release of the load (Figure 16b) was not predicted by the models above and it may be related to the viscoelastic nature of ML in alkali halides. Other experimental evidence that cannot be explained by this model is the fact that the instantaneous ML intensity is proportional to the product of strain and strain rate [66], and that it is inversely proportional to temperature [332] with an activation energy on the order of ∼0.1 eV regardless of the chemical composition [72] in various alkali halides.
Hayashiuchi et al. proposed another model to explain experimental findings by considering not only the contribution of electrons and holes liberated by the movement of dislocation, but thermal energy as well [333]. To calculate the contribution of electrons to instantaneous ML intensity, rate equations for the number of free electrons (n) and electrons at the F-centre (m) were respectively:
in which is the density of F-centres with charge i, and denotes the transition probability from state i to state j. The number of photons emitted from per unit time is thus:
with the product of the electron capture cross section, electron velocity, and total number of F-centres before deformation (C). As , the ML from V-centres was given by,
provided that the cross section for electron capture is small and the density of V-centres is large. After introducing the rate of point defects interacting with dislocations, with the dislocation density and r the effective interaction range, an expression could be obtained:
in which is a relaxation time (close to the pinning time of dislocations), being largely determined by thermal activation. Let U be the potential barrier of dislocation movement and the activation volume, then the depinning probability per unit time is given by,
Here, is defined as
in which 〈〉 means average. A final relationship between strain rate and ML intensity was thus established :
This explained the power-law dependence of the instantaneous ML intensity on strain rate and the Arrhenius relation between instantaneous ML intensity and temperature. When and , where , the temperature dependence of is weak and .
4.4. Remarks
For most of the investigated materials, mechanisms of ML are far from complete. New mechanism and models may emerge, for example electroluminescence triggered by triboelectricity was proposed for the peculiar ML behaviour of ZnS:Cu [122,334], and they are supposed to reveal common features of ML. Nevertheless, the role of defects is essential. Considering the connection with the phenomenon of persistent luminescence, the trap density and trap depth distribution is crucial for the ML phenomenon. Having more defect sites to trap charge carriers implies a potentially higher ML intensity, e.g., the non-stoichiometry in ZnS:Cu increases ML via sulfur vacancies [335]. Shallow traps, however, are often thermally detrapped before the start of the ML experiment. Deeper traps can also be helpful for the reasons that ML can be found when persistent luminescence has dropped to very low level, or their transition levels of defects match well with that of emitting centres, or they interact with shallow traps. The interplay between these levels under dynamical loads also opens the door to tune ML properties. For example, the shallow and deep traps in ZnS:Cu can be active under different frequency of loads, leading to a change of emission spectrum [121,123]. Point defects and extended defects are valuable in ML phosphors, especially whose host is piezoelectric, in that they may create large internal electric fields and thus reduce detrapping barriers. In a typical ML experiment where stress is around several tens of MPa, a dramatic change of the band gap of the host is not likely, which means internal electric fields caused by defects play a role in detrapping of carriers. A reduction of the detrapping barrier can be achieved by a change of the structure of defects which is so flexible that even small magnitude of stress induces appreciable shift of the detrapping barrier. This presumably explains why ML is mainly found in compounds with flexible framework structures. Additionally, extended defects, such as dislocations and domain walls, induce changes in the electronic structure of ML phosphors since they tend to move under certain mechanical loads. It is clear that a better understanding of ML will only be achieved after a deep investigation of defects in ML phosphors.
The modelling of the dynamics of ML at various time scales is also vital for the purpose of comparing simulations with experiments. This is the way to connect ML to the microscopic feature of ML phosphors, while thermodynamics (often non-equilibrium thermodynamics) can make sense for the irreversible nature of ML process, maybe even creating new research tracks in ML.
5. Proven and Potential Applications
ML materials can emit light under mechanical stress of various forms. These materials can thus have a large number of applications in stress sensing, dynamic pressure mapping, light sources or the detection of electric and magnetic fields. The key performance of these sensors relies on the properties of the ML process, especially the sensitivity, the strain-luminescence response and the self-recovery effect (durability). In the case of mapping stress distributions, the most desirable indicator for ML phosphors is a small threshold and a good linearity. A small threshold stress value will extend the range of mapping to very low stress levels while good linearity between ML and stress provides very reliable values of the amount of stress in a large range. For dynamic mapping of stress, the contrast for different types of stress is of great importance and a large sensitivity is thus desired. Meanwhile, the maximum stress where linearity holds is also important for cases with local concentration of stress. Below, the key application areas of ML materials are outlined.
5.1. Visualization of Stress Distribution
Mapping stress distributions when stress is applied or monitoring total stress of a component under performance, is extremely informative when studying repetitive loading of actual components or in the design phase of structural components. Based on the linear relationship between stress and instantaneous ML intensity, ML phosphors provide an alternative choice for other sensor materials because of their flexibility, limited invasiveness and easy adjustability when compared to electric or fibre-based strain gauges. These ML materials can be incorporated in a translucent matrix, or painted on the surfaces of interested objects or embedded in other composites as long as collecting ML intensity is accessible and convenient.
The stress intensity factor (SIF) K is used in the fracture mechanism to predict the stress state near the tip of the crack by a remote load. In the first mode (pure opening mode), crack surfaces move directly apart and the SIF is denoted by . Timilsina et al. have explored the possibility of calculating from the emission of ML materials coated on stainless steel under compact tension [19]. The instantaneous ML intensity is shown in Figure 17a, and contours were constructed in Figure 17b accordingly. The ML intensity was treated as a stress distribution from elasticity relations, and thus can be calculated from data points on these contour lines. Based on the assumption that the stress deviator is responsible for the ML, the calculated agrees well with values measured according to methods proposed by American Society for Testing of Materials. Similarly, the plastic SIF can be even calculated from the accumulated ML intensity from the plastic field in the vicinity of a crack [336]. It extends ML into the field of complex nonlinear plasticity under complex loading conditions.
Further research validated the possibility of measuring full field strain (Von Mises strain) via ML phosphors [292]. The visualization of propagation of cracks was realized by Kim et al. [90]. The stress distribution of the composite (containing 30 wt % SrAlO:Eu) was modeled by solving the dynamic stress field under mixed-mode conditions. The theoretical calculation agrees well with the stress distribution contour obtained from the ML intensity [20]. With the help of a high speed camera (8000 fps), the quasi-dynamic materials resistance curve (R-curve) of zirconia polycrystals can be measured for crack speeds up to 15 m/s [18]. This method illustrates the feasibility of visualizing and calculating static stress field from ML materials and can even be extended to dynamic conditions.
Dynamic stress sensing is also crucial for the diagnosis of possible damage in constructions via a structural health monitoring process. Recently, Xu et al. demonstrated the possibility of applying ML paint as a historical-log stress system for monitoring crack evolution on a bridge in use under general traffic conditions [337] (Figure 18a,b). The ML particles SrAlO:Eu were mixed with epoxy resin which is then coated on the bridge. Another photoelectric layer is put on the ML sheet with black packing tape to detect the light intensity that was emitted from the ML materials (Figure 18c, dotted area). When vehicles passed along the bridge, the stress in the concrete increases and ML emission was recorded by the photosensitive layer. The overlap of the position of a visible crack and the recorded ML intensity (Figure 18d) indicates that ML paint can indeed be used as historical-log recording system. Such function of monitoring fatigue cracks via ML has been demonstrated in cases such as steel vessels [338] and hydrogen tanks [339].
Wang et al. [108] recently devised a signature recording system thanks to the self-recovery of ZnS:Mn. The schematic components of the system are depicted in Figure 19a. A signature of letter “e” was recorded by digital imaging (Figure 19b) and its corresponding pressure distribution can be extracted via ML intensity (Figure 19c). This technique would give signatures another merit, i.e., pressure mapping, which makes them quite personalized. In a complicated system, the limited sensitivity of ZnS:Mn at low pressure range can be compensated by triboelectric sensor layer, which enables one to sense dynamic pressure range in our daily life [340].
5.2. Visualization of Ultrasonic Fields
Ultrasound produces pressure at the wavefront of sound waves, and some ML materials are able to show luminescence upon stimulation of ultrasound. Terasaki et al. demonstrated the feasibility of ML due to ultrasound radiation to act as light sources in vivo or as light source for photo-catalysis [341,342]. However, the pressure field produced by an ultrasound wave was only visualized in detail with the help of BaSiON:Eu by Kersemans et al. in 2015 [16]. BaSiON:Eu is able to emit light which is proportional to the power of the ultrasound produced by a transducer. Thus, an epoxy plate was placed at different distances to the transducer to sense pressure via ultrasound induced light emission. ML intensities were first recorded by a camera and the data were then retrieved digitally from software to represent the pressure distribution at the corresponding distances (Figure 20b). The pressure distribution obtained via this method was compared to the one obtained by directly scanning the interested area via a hydrophone. A good correlation between the two methods has been found, and the agreement is supported by simulations (Figure 20a). Therefore, it is possible for researchers to reconstruct 3D ultrasonic fields through ML materials in a fast and efficient manner.
5.3. Light Sources and Displays
Mechanoluminescent materials in general can be viewed as energy storage materials that are able to release energy (and thus light) upon mechanical stimulus. Intuitively, the emission can be used as a light source under proper kind of stimulation from the environment, for example wind, gas turbulence, or friction. Jeong et al. has taken advantage of the self-recovery of ZnS phosphors doped with Mn or Cu. ZnS:Cu in PDMS films maintained at least 80% of its original intensity as it underwent 30 thousands cycles of stretching and releasing [121]. Later on, they discovered that ZnS doped with Mn or Cu could emit light when they are subjected to the force of wind [17] (Figure 21a). As shown in Figure 21b–d, the micro-pillar coated with ML particles could emit light when exposed to a N gun and the “ML” image can be clearly seen (Figure 21b,c). The light output is proportional to the gas flow rate, and by mixing of ZnS:Mn and ZnS:Cu, various colour temperatures can be generated [127] (Figure 21d). Unfortunately, the efficiency of this process was not reported, which may impose limits on the application of ML phosphors as display materials in cases where wind is the only excitation source. Meanwhile, the tuning of emission spectra can be achieved by mixing different ratio of ZnS:Mn/ZnS:Cu [127] or using dyes as spectrum converter based on energy transfer [126].
5.4. Sensing Other Fields
It is not surprising that ML materials can sense strains induced from other types of fields. Zhang et al. showed that ZnS:Mn films deposited on a PMN-PT single crystal can emit light when an AC electric field was applied to the crystal [117]. The strain experienced by the coated ML films could result in light emission, with the output power [123] and emission spectra being tunable by the frequency of electric field in the case of ZnS:Cu (Figure 22a–d) [13].
Besides, Wong et al. demonstrated that ZnS:Al, Cu phosphors could yield light emission under a magnetic field when they are mixed with Fe-Co-Ni alloys and PDMS [22]. The ML intensity could indicate the application and removal of the AC magnetic field (Figure 23a–d), while the intensity was proportional to the frequency and the square of the magnetic field intensity. Tuning of the emission can also be obtained by tuning the frequency of the alternating magnetic field [125]. Such a new type of device is capable of sensing or converting a dynamic magnetic action without the need of using a power unit for the device.
These two examples also demonstrate that ML particles, especially piezoelectric ones, could respond to various fields that cause strain by emission of light.
5.5. Design Consideration for ML Phosphors
Stresses and strains are so diverse that sensing stress fields can be of interest from a practical view. The application of ML phosphors in sensing stress relies more on the behaviour of ML phosphors than on the precise knowledge of the release mechanisms of carriers. It is possible to improve the desired merit of properties, such as efficiency, sensitivity and the range of linearity, by alloying cations or anions, codoping or tuning syntheses parameters of known ML phosphors. It demands understanding of the ML mechanism and also imagination to discover new host and dopants combinations in practice, but researchers do have some options. Searching derivatives of known ML hosts may provide more chances to find novel hosts (Notice that most of ML hosts can be grouped in a certain type of structure as in Table 1), since similar hosts provide similar structure chemistry and elastic properties. Compounds consisting of layers or flexible framework (which is the case for most ML hosts), which in addition show photoluminescence or persistent luminescence, open the door for appreciable change of defects for ML. Phase transitions, especially Martensic phase transitions, can favour strong ML because of the presence of various kinds of microstructures produced in these transitions. With the help of these considerations, researchers may draft their own candidates of ML host and screen them via doping with metal impurities. Unexpected outcomes are in turn helpful for the study of ML mechanism. With more proper ML phosphors and a better understanding of ML mechanism, we can also expect the application of ML in other fields, such as bio-imaging using ultrasound, and wearable devices for safety signalling.
6. Conclusions and Outlooks
Despite the promising application potential of mechanoluminescence, the research field is still faced with difficulties in understanding the mechanism of ML and in developing novel ML materials. A thorough survey of crystal structures of ML phosphors shows the complexity posed by the co-existence of anisotropy of chemical bonding and certain types of microstructure such as twins, domains and modulations. The guidelines for searching ML candidates are thus more complicated than just identifying piezoelectric persistent phosphors with elastic anisotropy, an implicit hint gained from a literature study of proposed mechanisms and reported compounds. The emission wavelength and its tunability is also very limited. For example, there is a severe lack of ML phosphors that emit near infra-red light, which can be fascinating in biomedical imaging using ultrasound radiation. Challenges come from a complex interaction of anionic frameworks and microstructures with dopants, depending on the specific material under investigation as well. The change of energy levels of dopants upon stress is also unclear even for the most studied ML materials. The lack of the much desired solid evidence keeps the study of the mechanism behind ML on the level of phenomenological modelling. In this sense, in depth studies of how defect levels change under various strain at the atomic level is highly desired. Density functional theory could soon be up to this task, due to an ever improved precision in predicting the position of impurity levels in the band gap with the help of hybrid functionals, GW method, or other methods with improved accuracy. The release of carriers can be related to the intrinsic defects of ML materials or related to extended defects, which has been evidenced by several research on the mechanism, as discussed in Section 4. An important improvement in the mechanism of ML is the recognition of the hysteresis of the ML itself.The relevant model is not only suitable to predict instantaneous ML intensity under varying load conditions, but also successful in explaining the presence of a ML peak upon abruptly releasing the mechanical load. Hysteresis in piezoelectricity, ferroelasticity and ferromagnetism are based on the movement of domain states. Obviously, ML is not reversible under strains and thus the existence of “domain states” in ML phenomenon are not yet available. This provides a good direction for future research.
Unexpected outcomes from efforts of discovering novel ML phosphors in turn can reveal insights in the mechanism behind ML. A well-known example is the relation of Sr ordering in the CaSrAlSiO series, which causes the absence of ML at the morphotropic transition point. Phase transitions due to temperature or chemical substitution can thus be used to tune the properties of ML, the reason being that phase transitions may lead to lattice distortion, cation or anion orderings or domain states which are apparently important for ML. Given that a large proportion of ML compounds show certain types of phase transitions (Table 2), a promising research direction would be the influence of phase transition on elastic properties, electronic properties and ML performances of these compounds. Equally importantly, a standardized procedures to characterize ML phosphors would make comparison of different ML phosphors possible and thus lower the difficulties of discovering novel materials.
Despite the challenges ahead, the development of ML can be enhanced by our deeper understanding of the ML mechanism, by our efforts in tuning ML properties and by carefully analysing the trial-and-error synthesis attempts. The intriguing mechanisms and promising applications deserve an intense research in this particular field of luminescence, which requires efforts from chemists, physicists and engineers.
Acknowledgments
Both authors are grateful for the financial support from the “Enclose” Project (Special Research Fund-Ghent University). They would also like to thank Jonas Joos for his constructive comments on the manuscript.
Author Contributions
Ang Feng wrote the draft. Philippe F. Smet and Ang Feng revised the manuscript.
Conflicts of Interest
The authors declare no conflict of interest.
Appendix A. Stress Distribution of a Disc Under a Pair of Diametrical Compressive Load
The experimental set-up for sensing stress distribution via ML (Figure 3a) can be summarized as a pair of equal load P applied diametrically to a disc with diameter and thickness l (Figure A1).
Figure A1.
Schematic view of a disc with diameter and thickness l subjected to a diametrical load P.
Figure A1.
Schematic view of a disc with diameter and thickness l subjected to a diametrical load P.

The analytical solutions of tensile stress , and shear stress in the neighbourhood of a point in the surface plane can be found as [343]
The maximum shear stress and the maximum tensile stress are calculated by:
For a typical ML experiment, 12.5 mm, 10 mm, and 1000 N, the components of stress tensor, the maximum tensile tress and the maximum shear stress are calculated and visualized in Figure A2. It is clear that the distribution of ML intensity agrees well with , which is directly related to the isochromatic fringes in photoelasticity.
Figure A2.
The distribution of components of stress tensor (a); (b); and (c) respectively and the corresponding distribution of maximum tensile stress (d) and maximum shear stress (e). An optical image of ML in CaYAlO: Eu phosphor (f) (Reproduced from Ref [165]. Copyright 2008, The Electrochemical Society.) in a composite disc (diameter mm, thickness mm) under load N. Solid circles exhibit the boundary of the disc.

Appendix B. Influence of Point Group on the Components of Piezoelectric Tensor and Piezo-Optical Tensor
Neumann’s principle places symmetry restrictions on the tensors of physical properties. Furthermore, some symmetry of the interested physical quantity itself also influence the relations of tensor components. Her, the piezoelectric tensor is shown how it is influenced by the symmetry of static stress and the point group of a crystal. The piezoelectricity effect relate electric polarization to stress by the relation:
where is the third rank piezoelectric tensor. The symmetry of static stress tensor reduced the number of independent components from 27 to 18. For a specific point group, e.g., 4 (rotation axis along ), applying Neumann’s principle via the direct inspection method results new relations between these components. Rotation 4 induces the transform of axis as , thus piezoelectric constants transform as follows:
Here, the Voigt notation was applied: . Thus, there are four independent piezoelectric components, namely , while other components are zero. In any centrosymmetric crystals, an inversion centre leads to because the vector basis transform requires , while Neumann’s principle asks for .
The photoelastic effect is the phenomenon that application of stress changes the refractive index of a crystal. It can be represented as:
since the refractive index is specified by the indicatrix which is an ellipsoid whose coefficients are the components of relative dielectric impermeability tensor (a second rank tensor). is the piezo-optical coefficients, a fourth-rank tensor and the number of components is 81. The symmetry of both and leads to which satisfy , but generally . As an example, the point group 23 (cubic system) will lead to relations in by direct inspection method. A triad axis along <111> changes the suffixes as ,which cause the suffix of tensor transform as (in two-suffix form) . Hence, the relations between components are [45]
Appendix C. An Estimation of Piezoelectric Field in ZnS Crystallite
ZnS (wurtzite) is a piezoelectric semiconductor, with space group . The piezoelectric tensor is [202]
and the electric field due to shear stress is
in which pC/N, the permittivity of vacuum pC/(Vm), and the relative dielectric constant of ZnS . Therefore,
which is also applicable to ZnS doped with divalent cations. The critical electric field for electroluminescence is around V/cm [304], which is ∼100 times larger than the piezoelectric field at a stress of 100 MPa.
References
- Bacon, F. Fourth Book. In The Advancement of Learning, 1st ed.; Devey, J., Ed.; Press of P. F Collier & Son: New York, NY, USA, 1901; pp. 208–209. [Google Scholar]
- Harvey, K.N. Triboluminescence, Piezoluminescence, Crystalloluminescence and Lyoluminescence. In A History of Luminescence—From Earliest Times Until 1900, 1st ed.; Harvey, K.-N., Ed.; The American Philosophical Society: Philadelphia, PA, USA, 1957; pp. 378–379. [Google Scholar]
- Chandra, B.P. Mechanoluminescence. In Luminescence of Solids, 1st ed.; Vlj, O.-R., Ed.; Springer Science+Business Media, LLC: New York, NY, USA, 1998; pp. 361–387. ISBN 978-1-4613-7446-6. [Google Scholar]
- Sweeting, L.M. Triboluminescence with and without air. Chem. Mater. 2001, 13, 854–870. [Google Scholar] [CrossRef]
- Jha, P.; Chandra, B.P. Survey of the literature on mechanoluminescence from 1605 to 2013. Luminescence 2014, 29, 977–993. [Google Scholar] [CrossRef] [PubMed]
- Kricka, L.J.; Stroebe, l.J.; Stanley, P.E. Triboluminescence: 1968–1998. Luminescence 1999, 14, 215–220. [Google Scholar] [CrossRef]
- Walton, A.J. Triboluminescence. Adv. Phys. 1977, 26, 887–948. [Google Scholar] [CrossRef]
- Sage, I.; Bourhill, G. Triboluminescent materials for structural damage monitoring. J. Mater. Chem. 2001, 11, 231–245. [Google Scholar] [CrossRef] [Green Version]
- Xu, C.-N.; Watanabe, T.; Akiyama, M.; Zheng, X.-G. Direct view of stress distribution in solid by mechanoluminescence. Appl. Phys. Lett. 1999, 74, 2414–2416. [Google Scholar] [CrossRef]
- Xu, C.-N.; Watanabe, T.; Akiyama, M.; Zheng, X.-G. Artificial skin to sense mechanical stress by visible light emission. Appl. Phys. Lett. 1999, 74, 1236–1238. [Google Scholar] [CrossRef]
- Zhang, H.; Terasaki, N.; Yamada, H.; Xu, C.-N. Mechanoluminescence of Europium-doped SrAMgSi2O7 (A = Ca, Sr, Ba). Jpn. J. Appl. Phys. 2009, 48, 04C109. [Google Scholar] [CrossRef]
- Xu, C.-N.; Zheng, X.-G.; Akiyama, M.; Nonaka, K.; Watanabe, T. Dynamic visualization of stress distribution by mechanoluminescence image. Appl. Phys. Lett. 2000, 76, 179–181. [Google Scholar] [CrossRef]
- Chen, L.; Wong, M.-C.; Bai, G.; Jie, W.; Hao, J. White and green light emissions of flexible polymer composites under electric field and multiple strains. Nano Energy 2015, 14, 372–381. [Google Scholar] [CrossRef]
- Kim, J.S.; Kim, G.-W. New non-contacting torque sensor based on the mechanoluminescence of ZnS:Cu microparticles. Sens. Actuators A Phys. 2014, 218, 125–131. [Google Scholar] [CrossRef]
- Kim, G.-W.; Kim, J.-S. Dynamic torsional response analysis of mechanoluminescent paint and its application to non-contacting automotive torque transducers. Meas. Sci. Technol. 2014, 25, 015009. [Google Scholar] [CrossRef]
- Kersemans, M.; Smet, P.F.; Lammens, N.; Degrieck, J.; Van Paepegem, W. Fast reconstruction of a bounded ultrasonic beam using acoustically induced piezoluminescence. Appl. Phys. Lett. 2015, 107, 234102. [Google Scholar] [CrossRef]
- Jeong, S.M.; Song, S.; Joo, K.-I.; Kim, J.; Hwang, S.-H.; Jeong, J.; Kim, H. Bright, Wind-driven white mechanoluminescence from zinc sulphide microparticles embedded in a polydimethylsiloxane elastomer. Energy. Environ. Sci. 2014, 7, 3338–3346. [Google Scholar] [CrossRef]
- Kim, J.S.; Koh, H.J.; Lee, W.D.; Shin, N.; Kim, J.G.; Lee, K.H.; Sohn, K.S. Quasi-dynamic visualization of crack propagation and wake evolution in Y-TZP ceramic by mechano-luminescence. Met. Mater. Int. 2008, 14, 165–169. [Google Scholar] [CrossRef]
- Timilsina, S.; Lee, K.H.; Jang, I.Y.; Kim, J.S. Mechanoluminescent determination of the mode I stress intensity factor in SrAl2O4:Eu2+, Dy3+. Acta Mater. 2013, 61, 7197–7206. [Google Scholar] [CrossRef]
- Timilsina, S.; Lee, K.H.; Kwon, Y.N.; Kim, J.S. Optical evaluation of in situ crack propagation by using mechanoluminescence of SrAl2O4:Eu2+, Dy3+. J. Am. Ceram. Soc. 2015, 98, 2197–2204. [Google Scholar] [CrossRef]
- Kim, J.S.; Kwon, Y.-N.; Shin, N.; Sohn, K.-S. Mechanoluminescent SrAl2O4:Eu, Dy phosphor for use in visualization of quasidynamic crack propagation. Appl. Phys. Lett. 2007, 90, 241916. [Google Scholar] [CrossRef]
- Wong, M.-C.; Chen, L.; Tsang, M.-K.; Zhang, Y.; Hao, J. Magnetic-induced luminescence from flexible composite laminates by coupling magnetic field to piezophotonic effect. Adv. Mater. 2015, 27, 4488–4495. [Google Scholar] [CrossRef] [PubMed]
- Akiyama, M.; Xu, C.-N.; Matsui, H.; Nonaka, K.; Watanabe, T. Recovery phenomenon of mechanoluminescence from Ca2Al2SiO7:Ce by irradiation with ultraviolet light. Appl. Phys. Lett. 1999, 75, 2548–2550. [Google Scholar] [CrossRef]
- Carpenter, M.A.; Howard, C.J.; Andrew, M.J.; McKnight, R.E.A.; Liu, Y.; Withers, R.L. Elastic anomalies due to structural phase transitions in mechanoluminescent SrAl2O4:Eu. J. Appl. Phys. 2010, 107, 013505. [Google Scholar] [CrossRef]
- Van den Eeckhout, K.; Smet, P.F.; Poelman, D. Persistent luminescence in Eu2+-doped compounds: A review. Materials 2010, 3, 2536–2566. [Google Scholar] [CrossRef] [Green Version]
- Van den Eeckhout, K.; Poelman, D.; Smet, P.F. Persistent luminescence in non-Eu2+-doped compounds: A review. Materials 2013, 6, 2789–2818. [Google Scholar] [CrossRef] [PubMed] [Green Version]
- Smet, P.F.; Viana, B.; Tanabe, S.; Peng, M.; Hölsä, J.; Chen, W. Feature issue introduction: persistent and photostimulable phosphors—An established research field with clear challenges ahead. Opt. Mater. Express 2016, 6, 1414–1419. [Google Scholar] [CrossRef]
- Chandra, V.K.; Chandra, B.P.; Jha, P. Models for intrinsic and extrinsic elastico and plastico-mechanoluminescence of solids. J. Lumin. 2013, 138, 267–280. [Google Scholar] [CrossRef]
- Zhang, J.-C.; Long, Y.-Z.; Yan, X.; Wang, X.; Wang, F. Creating recoverable mechanoluminescence in piezoelectric calcium niobates through Pr3+ doping. Chem. Mater. 2016, 28, 4052–4057. [Google Scholar] [CrossRef]
- Matsuo, H.; Ikeda, K.; Hata, S.; Nakashima, H.; Yamada, H.; Xu, C.-N. Phase transformation behavior and pseudoelastic deformation in SrAl2O4. J. Alloys Compd. 2013, 577, S507–S516. [Google Scholar] [CrossRef]
- Peng, D.; Chen, B.; Wang, F. Recent advances in doped mechanoluminescent phosphors. ChemplusChem 2015, 80, 1029–1215. [Google Scholar] [CrossRef]
- Timilsina, S.; Kim, J.S.; Kim, J.; Kim, G.-W. Review of state-of-the-art sensor applications using mechanoluminescence microparticles. Int. J. Precis. Eng. Man. 2016, 17, 1237–1247. [Google Scholar] [CrossRef]
- Bünzli, J.-C.G.; Wong, K.-L. Lanthanide mechanoluminescence. J. Rare Earth. 2018, 36, 1–41. [Google Scholar] [CrossRef]
- Janssen, T.; Janner, A.; Looijenga-Vos, A.; De Wolff, P.M. Incommensurate and commensurate modulated structures. In International Tables for Crystallography, 3rd ed.; Prince, E., Ed.; Kluwer Academic Publishers: Dordrecht, The Netherlands, 2006; Volume C, pp. 907–955. ISBN 1-4020-1900-9. [Google Scholar]
- Neumann, F.E. Vorlesungen über die Theorie der Elastizität der festen Körper und des Lichtähers, 1st ed.; B. G. Teubner-Verlag: Leipzig, Germany, 1885. [Google Scholar]
- Jeevanjee, N. An Introduction to Tensors and Group Theory for Physicists, 1st ed.; Springer Science+Business Media, LLC: New York, NY, USA, 2011; pp. 3–81. ISBN 978-0-8176-4714-8. [Google Scholar]
- Authier, A. Introduction to the properties of tensors. In International Tables for Crystallography, 1st ed.; Authier, A., Ed.; Kluwer Academic Publishers: Dordrecht, The Netherlands, 2003; Volume D, pp. 3–32. ISBN 1-4020-0714-0. [Google Scholar]
- Fumi, F.G. Physical properties of crystals: The direct-inspection method. Acta Crystallogr. 1952, 5, 44–48. [Google Scholar] [CrossRef]
- Dresselhaus, M.S.; Dresselhaus, G.; Jorio, A. Group Theory: Application to the Physics of Condensed Matter, 1st ed.; Springer-Verlag: Berlin/Heidelberg, Germany, 2008; pp. 455–479. ISBN 978-3-540-32897-1. [Google Scholar]
- Vanderbilt, D.; King-Smith, R.D. Electric polarization as a bulk quantity and its relations to surface charge. Phys. Rev. B 1993, 48, 4442–4455. [Google Scholar] [CrossRef]
- Nye, J.F. Physical Properties of Crystals: Their Representation by Tensors and Matrices, 1st ed.; Clarendon Press: Oxford, UK, 1985; pp. 68–81. ISBN 0-19-851165-5. [Google Scholar]
- Lines, M.E.; Glass, A.M. Principles and Applications of Ferroelectrics and Related Materials, 1st ed.; Clarendon Press: Clarendon, UK, 1977; pp. 8–15. ISBN 0-19-851286-4. [Google Scholar]
- Jiang, X.; Huang, W.; Zhang, S. Flexoelectric nano-generator: Materials structures and devices. Nano Energy 2013, 2, 1079–1092. [Google Scholar] [CrossRef]
- Salje, E.K.H. Phase Transitions in Ferroelastic and Co-elastic Crystals; Cambridge University Press: Cambridge, UK, 1993; pp. 1–12. ISBN 978-0-521-42936-8. [Google Scholar]
- Nye, J.F. Physical Properties of Crystals: Their Representation by Tensors and Matrices, 1st ed.; Clarendon Press: Oxford, UK, 1985; pp. 235–273. ISBN 0-19-851165-5. [Google Scholar]
- Green, A.E.; Zerna, W. Theoretical Elasticity, 2nd ed.; Dover Publications, Inc.: New York, NY, USA, 1968; pp. 53–76. ISBN 0-486-67076-7. [Google Scholar]
- Arfken, G.B.; Weber, H.J.; Harris, F.E. Mathematical Methods for Physicists, 7th ed.; Academic Press: Waltham, MA, USA, 2013; pp. 205–249. ISBN 78-0-12-384654-9. [Google Scholar]
- Chen, Z.-D. Geometric field theory of finite deformation in continuum mechanics. Chin. J. Theor. Appl. Mech. 1979, 15, 107–117. [Google Scholar] [CrossRef]
- Noll, W. A mathematical theory of the mechanical behavior of continuous media. Arch. Ration. Mech. Anal. 1958, 2, 197–226. [Google Scholar] [CrossRef]
- Xiao, J. Geometric Field Theory of Strain, 1st ed.; Science Press: Beijing, China, 2017; pp. 136–160. ISBN 978-7-03-050711-2. [Google Scholar]
- Xiao, J. Evolution of Continuum from Elastic Deformation to Flow. arXiv, 2005; arXiv:physics/0511170. [Google Scholar]
- Lakes, R. Viscoelastic Materials, 1st ed.; Cambridge University Press: Cambridge, UK, 2009; pp. 14–52. ISBN 978-0-521-88568-3. [Google Scholar]
- Boltzmann, L. Zur Theorie der elastischen Nachwirkung. Wiener Berichte 1874, 70, 275–306. [Google Scholar]
- Xiao, J. Theoretic discussion on rate-dependent constitutive equations. In Advance in Rheology Research in China, 1st ed.; Zhejiang University Press: Hangzhou, China, 2010; pp. 26–30. ISBN 9787308080545. [Google Scholar]
- Smith, R.C.; Seelecke, S.; Dapino, M.; Ounaies, Z. A unified framework for modelling hysteresis in ferroic materials. J. Mech. Phys. Solids 2006, 45, 46–85. [Google Scholar] [CrossRef]
- Lakes, R. Viscoelastic Materials, 1st ed.; Cambridge University Press: New York, NY, USA, 2009; pp. 3–5. ISBN 978-0-521-88568-3. [Google Scholar]
- Kamimura, S.; Yamada, H.; Xu, C.-N. Development of new elasticoluminescent material SrMg2(PO4)2:Eu. J. Lumin. 2012, 132, 526–530. [Google Scholar] [CrossRef]
- Sakai, K.; Koga, T.; Imai, Y.; Maehara, S.; Xu, C.-N. Observation of mechanically induced luminescence from microparticles. Phys. Chem. Chem. Phys. 2006, 8, 2819–2822. [Google Scholar] [CrossRef] [PubMed]
- Persits, N.; Aharoni, A.; Tur, M. Quantitative characterization of ZnS:Mn embedded polyurethane optical emission in three mechanoluminescent regimes. J. Lumin. 2017, 181, 467–476. [Google Scholar] [CrossRef]
- Van der Heggen, D.; Joos, J.J.; Burbano, D.C.R.; Capobianco, J.A.; Smet, P.F. Counting the photons: Determining the absolute storage capacity of persistent phosphors. Materials 2017, 10, 867. [Google Scholar] [CrossRef] [PubMed]
- Li, Y.; Gecevicius, M.; Qiu, J. Long persistent phosphors—From fundamentals to applications. Chem. Soc. Rev. 2016, 45, 2090–2136. [Google Scholar] [CrossRef] [PubMed]
- Zhang, Q.Y.; Huang, X.Y. Recent progress in quantum cutting phosphors. Prog. Mater Sci. 2010, 55, 352–427. [Google Scholar] [CrossRef]
- Chandra, B.P.; Baghel, R.N.; Singh, P.K.; Luka, A.K. Deformation-induced excitation of the luminescence centres in coloured alkali halide crystals. Radiat Eff. Defects Solids 2009, 164, 500–507. [Google Scholar] [CrossRef]
- Butler, C.T. Room-temperature deformation luminescence in alkali halides. Phys. Rev. 1966, 141, 750–757. [Google Scholar] [CrossRef]
- Bose, H.N. Thermoluminescence of alkali halide phosphors. Proc. Phys. Soc. B 1954, 68, 249–252. [Google Scholar] [CrossRef]
- Atari, N.A. Piezoluminescence phenomenon. Phys. Lett. 1982, 90, 93–96. [Google Scholar] [CrossRef]
- Hagihara, T.; Hayashiuchi, Y.; Kojima, Y.; Yamamoto, Y.; Ohwaki, S.; Okada, T. Deformation luminescence in gamma-irradiated alkali halides. Phys. Lett. A 1989, 137, 213–216. [Google Scholar] [CrossRef]
- Alvarez-García, S.; Piters, T.M. Participation of Eu-aggregates in the photoluminescence, afterglow and thermoluminescence of UV-irradiated KCl:Eu at 20 K. J. Phys. Condens. Matter 2005, 17, 181–188. [Google Scholar] [CrossRef] [PubMed]
- Nakamura, S.; Kawaguchi, K.; Ohgaku, T. Deformation luminescence of X-irradiated KCl:Eu2+ by bending test. IOP Conf. Ser. Mater. Sci. Eng. 2009, 3, 012022. [Google Scholar] [CrossRef]
- Sharma, J. Thermoluminescence properties of some alkali halides. Phys. Rev. 1956, 101, 1295–1297. [Google Scholar] [CrossRef]
- Gartia, R.K.; Rey, L.; Singh, T.T.; Singh, T.B. Thermoluminescence of alkali halides and its implications. Nucl. Instrum. Methods Phys. Res. B 2012, 274, 129–134. [Google Scholar] [CrossRef]
- Molotskii, M.I.; Shmurak, S.Z. Elementary acts of deformation luminescence. Phys. Lett. A 1992, 166, 286–291. [Google Scholar] [CrossRef]
- Sastry, S.B.S.; Balasubramany, K. Thermoluminescence of irradiated RbCl and RbCI:Sn crystals. Phys. Status Solidi B 1978, 90, 375. [Google Scholar] [CrossRef]
- Sastry, S.B.S.; Sapru, S. Thermoluminescence glow and emission studies on suprapure rubidium bromide irradiated at room temperature. Phys. Status Solidi B 1979, 94, K149–K154. [Google Scholar] [CrossRef]
- Shao, Q.; Tolner, H.; Li, H.; Kuang, Y.; Li, Q.; Dong, Y.; Jiang, J. P-146: Thermoluminescence spectra of MgO poly-crystals exposed to vacuum ultraviolet (VUV) radiation. SID Symp. Dig. Tech. 2012, 39, 1756–1758. [Google Scholar] [CrossRef]
- Dickinson, J.T.; Scudiero, L.; Yasuda, K.; Kim, M.-W.; Langford, S.C. Dynamic tribological probes: Particle emission and transient electrical measurements. Tribol. Lett. 1997, 3, 53–67. [Google Scholar] [CrossRef]
- Matsuzawa, T.; Aoki, Y.; Takeuchi, N.; Murayama, Y. A new long phosphorescent phosphor with high brightness SrAl2O4:Eu2+, Dy3+. J. Electrochem. Soc. 1996, 143. [Google Scholar] [CrossRef]
- Katsumata, T.; Nabae, T.; Sasajima, K.; Komuro, S.; Morikawa, T. Effects of composition on the long phosphorescent SrAl2O4:Eu2+, Dy3+ phosphor crystals. J. Electrochem. Soc. 1997, 144, L243–L245. [Google Scholar] [CrossRef]
- Fu, X.; Yamada, H.; Xu, C.-N. Triboluminescence properties of highly oriented SrAl2O4:Eu2+ films on Inconel 600 substrate. Electrochem. Solid-State Lett. 2008, 11, J27–J30. [Google Scholar] [CrossRef]
- Xu, C.-N.; Yamada, H.; Wang, X.S.; Zheng, X.-G. Strong elasticoluminescence from monoclinic-structure SrAl2O4. Appl. Phys. Lett. 2004, 84, 3040–3042. [Google Scholar] [CrossRef]
- Yun, G.J.; Rahimi, M.R.; Gandomi, A.H.; Lim, G.-C.; Choi, J.-S. Stress sensing performance using mechanoluminescence of SrAl2O4:Eu (SAOE) and SrAl2O4:Eu, Dy (SAOED) under mechanical loadings. Smart Mater. Struct. 2013, 22, 055006. [Google Scholar] [CrossRef]
- Jia, Y.; Yei, M.; Jia, W.Y. Stress-induced mechanoluminescence in SrAl2O4:Eu2+, Dy3+. Opt. Mater. 2006, 28, 974–979. [Google Scholar] [CrossRef]
- Katsumata, T.; Toyomane, S.; Sakai, R.; Komuro, S.; Morikawa, T. Trap levels in Eu-doped SrAl2O4 phosphor crystals co-doped with rare earth elements. J. Am. Ceram. Soc. 2006, 89, 932–936. [Google Scholar] [CrossRef]
- Terasawa, Y.; Xu, C.-N.; Yamada, H.; Kubo, M. Near infra-red mechanoluminescence from strontium aluminate doped with rare-earth ions. IOP Conf. Ser. Mater. Sci. Eng. 2011, 18, 212013. [Google Scholar] [CrossRef]
- Jia, D. Relocalization of Ce3+ 5d electrons from host conduction band. J. Lumin. 2006, 117, 170–178. [Google Scholar] [CrossRef]
- Jia, D.; Wang, X.-J.; Jia, W.; Yen, W.M. Trapping processes of 5d electrons in Ce3+ doped SrAl2O4. J. Lumin. 2007, 122, 311–314. [Google Scholar] [CrossRef]
- Zhang, H.; Yamada, H.; Terasaki, N.; Xu, C.-N. Ultraviolet mechanoluminescence from SrAl2O4:Ce and SrAl2O4:Ce, Ho. Appl. Phys. Lett. 2007, 91, 081905. [Google Scholar] [CrossRef]
- Sohn, K.-S.; Seo, S.Y.; Park, H.D. Search for long phosphorescence materials by combinatorial chemistry method. Electrochem. Solid-State Lett. 2001, 4, H26–H29. [Google Scholar] [CrossRef]
- Sohn, K.-S.; Seo, S.Y.; Kwon, Y.N.; Park, H.D. Direct observation of crack tip stress field using the mechanoluminescence of SrAl2O4:(Eu, Dy, Nd). J. Am. Ceram. Soc. 2002, 85, 712–714. [Google Scholar] [CrossRef]
- Kim, J.S.; Kwon, Y.-N.; Sohn, K.-S. Dynamic visualization of crack propagation and bridging stress using the mechano-luminescence of SrAl2O4:(Eu, Dy, Nd). Acta Mater. 2003, 51, 6437–6442. [Google Scholar] [CrossRef]
- Katsumata, T.; Nabae, T.; Matsuzawa, K.S.T. Growth and characteristics of long persistent SrAl2O4-and CaAl2O4-based phosphor crystals by a floating zone technique. J. Cryst. Growth 1998, 183, 361–365. [Google Scholar] [CrossRef]
- Aitasalo, T.; Hölsä, J.; Jungner, H.; Lastusaari, M.; Niittykoski, J. Thermoluminescence study of persistent luminescence materials: Eu2+- and R3+-doped calcium aluminates, CaAl2O4:Eu2+, R3+. J. Phys. Chem. B 2006, 110, 4589–4598. [Google Scholar] [CrossRef] [PubMed]
- Wei, Y.; Wu, Z.; Jia, Y.; Liu, Y. Piezoelectrically-induced stress-luminescence phenomenon in CaAl2O4:Eu2+. J. Alloys Compd. 2015, 646, 86–89. [Google Scholar] [CrossRef]
- Jia, D.; Wang, X.-J.; Yen, W.M. Electron traps in Tb3+-doped CaAl2O4. Chem. Phys. Lett. 2002, 363, 241–244. [Google Scholar] [CrossRef]
- Satapathy, K.K.; Mishra, G.C.; Kher, R.S.; Dhoble, S.J. Mechanoluminescence and thermoluminescence characterization of Tb3+ doped CaAl2O4: A theoretical and experimental study. RSC Adv. 2015, 5, 79391–79396. [Google Scholar] [CrossRef]
- Tanaka, K.; Fujita, K.; Taniguchi, T.; Hirao, K.; Ishihara, T. Triboluminescence of alkaline earth aluminate polycrystals doped with Dy3+. J. Appl. Phys. 2000, 88, 4069–4074. [Google Scholar] [CrossRef] [Green Version]
- Katsumata, T.; Sakai, R.; Komuro, S.; Morikawa, T.; Kimura, H. Growth and characteristics of long duration phosphor crystals. J. Cryst. Growth 1999, 188, 869–871. [Google Scholar] [CrossRef]
- Sakaihara, I.; Tanaka, K.; Wakasugi, T.; Ota, R.; Fujita, K.; Hirao, K.; Ishihara, T. Triboluminescence of (Sr, Ba)Al2O4 polycrystals doped with Eu3+ and Eu2+. Jpn. J. Appl. Phys. 2002, 41, 1419–1423. [Google Scholar] [CrossRef]
- Qiu, J.; Igarashi, H.; Makishima, A. Long-lasting phosphorescence in Mn2+:Zn2GeO4 crystallites precipitated in transparent GeO2-B2O3-ZnO glass-ceramics. Sci. Technol. Adv. Mater. 2005, 6, 431–434. [Google Scholar] [CrossRef]
- Zhao, H.; Wang, X.; Li, J.; Li, Y.; Yao, X. Strong mechanoluminescence of Zn2(Ge0.9Si0.1)O2: Mn with weak persistent luminescence. Appl. Phys. Express 2016, 9, 012104. [Google Scholar] [CrossRef]
- Marsui, H.; Xu, C.-N.; Akiyama, M.; Watanabe, T. Strong mechanoluminescence from UV-irradiated spinels of ZnGa2O4: Mn and MgGa2O4: Mn. Jpn. J. Appl. Phys. 2000, 39, 6582–6586. [Google Scholar] [CrossRef]
- Uheda, K.; Maruyama, T.; Takizawa, H.; Endo, T. Synthesis and long-period phosphorescence of ZnGa2O4:Mn2+ spinel. J. Alloys Compd. 1997, 262, 60–64. [Google Scholar] [CrossRef]
- Matsui, H.; Xu, C.-N.; Tateyama, H. Stress-stimulated luminescence from ZnAl2O4:Mn. Appl. Phys. Lett. 2001, 78, 1068–1070. [Google Scholar] [CrossRef]
- Satapathy, K.K.; Mishra, G.C.; Khan, F. ZnAl2O4:Eu novel phosphor: SEM and mechanoluminescence characterization synthesized by solution combustion technique. Luminescence 2015, 30, 564–567. [Google Scholar] [CrossRef] [PubMed]
- Matsui, H.; Xu, C.N.; Liu, Y.; Tateyama, H. Origin of mechanoluminescence from Mn-activated ZnAl2O4: Triboelectricity-induced electroluminescence. Phys. Rev. B 2004, 69. [Google Scholar] [CrossRef]
- Garlick, G.F.J.; Wells, A.F.; Wilkins, M.H.F. Zinc sulfide phosphor constitution and its effect on electron traps. J. Chem. Phys. 1949, 17, 399–404. [Google Scholar] [CrossRef]
- Xu, C.-N.; Zheng, X.-G.; Watanabe, T.; Akiyama, M.; Usui, I. Enhancement of adhesion and triboluminescence of ZnS:Mn films by annealing technique. Thin Solid Films 1999, 352, 273–277. [Google Scholar] [CrossRef]
- Wang, X.; Zhang, H.; Yu, R.; Dong, L.; Peng, D.; Zhang, A.; Zhang, Y.; Liu, H.; Pan, C.; Wang, Z.L. Dynamic pressure mapping of personalized handwriting by a flexible sensor matrix based on the mechanoluminescence process. Adv. Mater. 2015, 27, 2324–2331. [Google Scholar] [CrossRef] [PubMed]
- Agyeman, O.; Xu, C.-N.; Usui, I.; Zheng, X.-G.; Suzuki, M. Thermal annealing effects on the triboluminescence intensity of sputtered ZnS:Mn thin films. In Advanced Photonic Sensors: Technology and Applications, Proceedings of the Optics and Optoelectronic Inspection and Control: Techniques, Applications, and Instrumentation, Beijing, China, 8–10 November 2000; Tang, J., Xu, C.-N., Li, H.H., Eds.; Spie: Washington, DC, USA, 2001; Volume 4220, pp. 350–354. [Google Scholar]
- Agyeman, O.; Xu, C.-N.; Shi, S.W.; Zheng, X.-G.; Suzuki, M. Enhancement in ZnS:Mn triboluminescent film intensity using ZnO films as buffer layers. In Advanced Environmental Sensing Technology II, Proceedings of the Environmental and Industrial Sensing, Boston, MA, USA, 28–31 October 2001; Vo-Dinh, T., Buttgenbach, S., Eds.; SPIE: Washington, DC, USA, 2002; Volume 4576, pp. 181–187. [Google Scholar]
- Agyeman, O.; Xu, C.-N.; Suzuki, M.; Zheng, X.-G. Upgrading the triboluminescence of ZnS:Mn film by optimization of sputtering and thermal annealing conditions. J. Mater. Res. 2002, 17, 959–963. [Google Scholar] [CrossRef]
- Onwona-Agyeman, B.; Xu, C.-N.; Shi, W.S.; Suzuki, M.; Zheng, X.-G. Triboluminescence of ZnS:Mn films deposited on quartz substrates with ZnO buffer layers. Jpn. J. Appl. Phys. 2002, 41, 5259–5261. [Google Scholar] [CrossRef]
- Chandra, B.P.; Xu, C.-N.; Yamada, H.; Zheng, X.-G. Luminescence induced by elastic deformation of ZnS:Mn nanoparticles. J. Lumin. 2010, 130, 442–450. [Google Scholar] [CrossRef]
- Fontenot, R.S.; Hollerman, W.A. Measuring triboluminescence from ZnS:Mn produced by ballistic impacts. J. Instrum. 2011, 6. [Google Scholar] [CrossRef]
- Kobakhidze, L.; Guidry, C.J.; Hollerman, W.A.; Fontenot, R.S. Detecting mechanoluminescence from ZnS:Mn powder using a high speed camera. IEEE Sens. J. 2013, 13, 3053–3059. [Google Scholar] [CrossRef]
- Chandra, V.K.; Chandra, B.P.; Jha, P. Mechanoluminescence of ZnS:Mn phosphors excited by hydrostatic pressure steps and pressure pulses. Physica B 2014, 452, 23–30. [Google Scholar] [CrossRef]
- Zhang, Y.; Gao, G.; Chan, H.L.W.; Dai, J.; Wang, Y.; Hao, J. Piezo-phototronic effect-induced dual-mode light and ultrasound emission from ZnS:Mn/PMN-PT thin film strucutres. Adv. Mater. 2012, 24, 1729–1735. [Google Scholar] [CrossRef] [PubMed]
- Garlick, G.F.J.; Gibson, A.F. The electron trap mechanism of luminescence in sulphide and silicate phosphors. Proc. Phys. Soc. 1948, 60, 574–590. [Google Scholar] [CrossRef]
- Hoogenstraaten, W. The chemistry of traps in zinc sulfide phophors. J. Electrochem. Soc. 1953, 100, 356–365. [Google Scholar] [CrossRef]
- Smith, A.W.; Turkevich, J. A study of the electron traps in zinc sulfide phosphor. Phys. Rev. 1952, 87, 306–308. [Google Scholar] [CrossRef]
- Jeong, S.M.; Song, S.; Lee, S.-K.; Choi, B. Mechanically driven light-generator with high durability. Appl. Phys. Lett. 2013, 102, 051110. [Google Scholar] [CrossRef]
- Sohn, K.S.; Timilsina, S.; Singh, S.P.; Lee, J.W.; Kim, J.S. A mechanoluminescent ZnS:Cu/Rhodamine/ SiO2/PDMS and piezoresistive CNT/PDMS hybrid sensor: Red-light emission and a standardized strain quantification. ACS Appl. Mater. Interfaces 2016, 8, 34777–34783. [Google Scholar] [CrossRef] [PubMed]
- Chen, Y.; Zhang, Y.; Karnaushenko, D.; Chen, L.; Hao, J.; Ding, F.; Schmidt, O.G. Addressable and color-tunable piezophotonic light-emitting stripes. Adv. Mater. 2017, 29, 1605165. [Google Scholar] [CrossRef] [PubMed]
- Cho, M.Y.; Kim, J.S.; Kim, G.W. Hysteresis compensation of photoluminescence in ZnS:Cu for noncontact shaft torque sensing. Appl. Opt. 2016, 55, 1670–1674. [Google Scholar] [CrossRef] [PubMed]
- Wong, M.C.; Chen, L.; Bai, G.; Huang, L.B.; Hao, J. Temporal and remote tuning of piezophotonic-effect-induced luminescence and color gamut via modulating magnetic field. Adv. Mater. 2017, 29. [Google Scholar] [CrossRef] [PubMed]
- Jeong, S.M.; Song, S.; Kim, H.; Joo, K.-I.; Takezoe, H. Mechanoluminescence color conversion by spontaneous fluorescent-dye-diffusion in elastomeric zinc sulfide composite. Adv. Funct. Mater. 2016, 26, 4848–4858. [Google Scholar] [CrossRef]
- Jeong, S.M.; Song, S.; Lee, S.-K.; Ha, N.Y. Color manipulation of mechanoluminescence from stress-activated composite films. Adv. Mater. 2013, 25, 6194–6200. [Google Scholar] [CrossRef] [PubMed]
- Jeong, S.M.; Song, S.; Joo, K.-I.; Jeong, J.; Chung, S.-H. Bidirectional two colored light emission from stress-activated ZnS-microparticles-embedded polydimethylsiloxane elastomer films. Opt. Mater. Express 2013, 3, 1600–1607. [Google Scholar] [CrossRef]
- Reddy, D.R.; Reddy, B.K. Laser-like mechanoluminescence in ZnMnTe-diluted magnetic semiconductor. Appl. Phys. Lett. 2002, 81, 460–462. [Google Scholar] [CrossRef]
- Pateria, D.; Baghel, R.N.; Bisen, D.P.; Jha, P.; Chandra, B.P. Mechanoluminescence of (ZnS)1−x(MnTe)x nanophosphors excited by impact of a load. J. Lumin. 2015, 166, 335–345. [Google Scholar] [CrossRef]
- Rao, N.M.; Krishnaiah, G.; Sambasivam, S.; Reddy, K.R.; Reddy, D.R.; Reddy, B.K.; Xu, C.-N. Structural, optical and electrical properties of luminescent (ZnS)1−x(MnTe)x powders. J. Alloys Compd. 2009, 468, 360–364. [Google Scholar] [CrossRef]
- Rao, N.M.; Reddy, D.R.; Reddy, B.K.; Xu, C.-N. Intense red mechanoluminescence from (ZnS)1−x(MnTe)x. Phys. Lett. A 2008, 372, 4122–4126. [Google Scholar] [CrossRef]
- Pan, C.; Zhang, J.-C.; Zhang, M.; Yan, X.; Long, Y.-Z.; Wang, X. Intrinsic oxygen vacancies mediated multi-mechano-responsive piezoluminescence in undoped zinc calcium oxysulfide. Appl. Phys. Lett. 2017, 110, 233904. [Google Scholar] [CrossRef]
- Zhang, J.-C.; Xu, C.-N.; Kamimura, S.; Terasawa, Y.; Yamada, H.; Wang, X. An intense elastico-mechanoluminescence material CaZnOS:Mn2+ for sensing and imaging multiple mechanical stresses. Opt. Express 2013, 21, 12976–12986. [Google Scholar] [CrossRef] [PubMed]
- Tu, D.; Xu, C.-N.; Fujio, Y. Intense red emitting mechanoluminescence from CaZnOS:Mn, Li with c-axis preferred orientation. J. Adv. Dielectr. 2014, 04, 1450017. [Google Scholar] [CrossRef]
- Tu, D.; Xu, C.-N.; Fujio, Y.; Kamimura, S.; Sakata, Y.; Ueno, N. Phosphorescence quenching by mechanical stimulus in CaZnOS:Cu. Appl. Phys. Lett. 2014, 105, 011908. [Google Scholar] [CrossRef]
- Tu, D.; Xu, C.-N.; Fujio, Y.; Yoshida, A. Mechanism of mechanical quenching and mechanoluminescence in phosphorescent CaZnOS:Cu. Light Sci. Appl. 2015, 4, e356. [Google Scholar] [CrossRef]
- Tu, D.; Xu, C.-N.; Fujio, Y.; Yoshida, A. Tuning the mechano-optical conversion in CaZnOS with Cu ion concentration. J. Phys. D Appl. Phys. 2015, 48, 475105. [Google Scholar] [CrossRef]
- Zhang, H.; Peng, D.; Wang, W.; Dong, L.; Pan, C. Mechanically induced light emission and infrared-laser-induced upconversion in the Er-doped CaZnOS multifunctional piezoelectric semiconductor for optical pressure and temperature sensing. J. Phy. Chem. C 2015, 119, 28136–28142. [Google Scholar] [CrossRef]
- Wang, W.; Peng, D.; Zhang, H.; Yang, X.; Pan, C. Mechanically induced strong red emission in samarium ions doped piezoelectric semiconductor CaZnOS for dynamic pressure sensing and imaging. Opt. Commun. 2016, 395, 24–28. [Google Scholar] [CrossRef]
- Tu, D.; Peng, D.; Xu, C.-N.; Yoshida, A. Mechanoluminescence properties of red-emitting piezoelectric semiconductor MZnOS:Mn2+ (M = Ca, Ba) with layered structure. J. Cerm. Soc. Jpn. 2016, 124, 702–705. [Google Scholar] [CrossRef]
- Li, L.; Wong, K.-L.; Li, P.; Peng, M. Mechanoluminescence properties of Mn2+-doped BaZnOS phosphor. J. Mater. Chem. C 2016, 4, 8166–8170. [Google Scholar] [CrossRef]
- Aitasalo, T.; Hölsä, J.; Kirm, M.; Laamanen, T.; Lastusaari, M.; Niittykoski, J.; Raud, J.; Valtonen, R. Persistent luminescence and synchrotron radiation study of Ca2MgSi2O7:Eu2+, R3+ materials. Radiat. Meas. 2007, 42, 644–647. [Google Scholar] [CrossRef]
- Gong, Y.; Wang, Y.; Jiang, Z.; Xu, X.; Li, Y. Luminescent properties of long lasting phosphor Ca2MgSi2O7:Eu2+. Mater. Res. Bull. 2009, 44, 1916–1919. [Google Scholar] [CrossRef]
- Zhang, H.; Yamada, H.; Terasaki, N.; Xu, C.-N. Green mechanoluminescence of Ca2MgSi2O7:Eu2+ and Ca2MgSi2O7:Eu2+, Dy. J. Electrochem. Soc. 2008, 155, J55–J57. [Google Scholar] [CrossRef]
- Jiang, L.; Chang, C.; Mao, D. Luminescent properties of CaMgSi2O6 and Ca2MgSi2O7 phosphors activated by Eu2+, Dy3+, and Nd3+. J. Alloys Compd. 2003, 360, 193–197. [Google Scholar] [CrossRef]
- Lin, Y.; Nan, C.-W.; Zhou, X.; Wu, J.; Wang, H.; Chen, D.; Xu, S. Preparation and characterization of long afterglow M2MgSi2O7-based (M = Ca, Sr, Ba) photoluminescent phosphors. Mater. Chem. Phys. 2003, 82, 860–863. [Google Scholar] [CrossRef]
- Zhang, H.; Terasaki, N.; Yamada, H.; Xu, C.-N. Development of mechanoluminescent micro-particles Ca2MgSi2O7:Eu, Dy and their application in sensors. Thin Solid Films 2009, 518, 610–613. [Google Scholar] [CrossRef]
- Zhang, H.; Xu, C.-N.; Terasaki, N.; Yamada, H. Detection of stress distribution using Ca2MgSi2O7:Eu, Dy microparticles. Physica E 2010, 42, 2872–2875. [Google Scholar] [CrossRef]
- Shrivastava, R.; Kaur, J. Mechanoluminescence of Ca2MgSi2O7:Eu2+, Dy3+ phosphor by impulsive deformation. Integr. Ferroelectr. 2015, 159, 49–56. [Google Scholar] [CrossRef]
- Sahu, I.P.; Bisen, D.P.; Brahme, N.; Tamrakar, R.K. Enhanced luminescence performance of Sr2MgSi2O7:Eu2+ blue long persistence phosphor by co-doping with Ce3+ ions. J. Mater. Sci. Mater. Electron. 2016, 27, 554–569. [Google Scholar] [CrossRef]
- Liua, B.; Shi, C.; Yin, M.; Dong, L.; Xiao, Z. The trap states in the Sr2MgSi2O7 and (Sr, Ca)2MgSi2O7 long afterglow phosphor activated by Eu2+ and Dy3+. J. Alloys Compd. 2005, 387, 65–69. [Google Scholar] [CrossRef]
- Lin, Y.; Tang, Z.; Zhang, Z.; Wang, X.; Zhang, J. Preparation of a new long afterglow blue-emitting Sr2MgSi2O7 photoluminescence phosphors. J. Mater. Sci. Lett. 2001, 20, 1505–1506. [Google Scholar] [CrossRef]
- Sahu, I.P.; Bisen, D.P.; Brahme, N.; Sharma, R. Luminescence properties of Eu2+, Dy3+-doped Sr2MgSi2O7, and Ca2MgSi2O7 phosphors by solid-state reaction method. Res. Chem. Intermed. 2015, 41, 6649–6664. [Google Scholar] [CrossRef]
- Aitasalo, T.; Hreniak, D.; Hölsä, J.; Laamanen, T.; Lastusaari, M.; Niittykoski, J.; Pellé, F.; Strȩk, W. Persistent luminescence of Ba2MgSi2O7:Eu2+. J. Lumin. 2007, 122, 110–112. [Google Scholar] [CrossRef]
- Shrivastava, R.; Kaura, J.; Chandra, B.P. Mechanoluminescence of Ba2MgSi2O7 doped with Eu2+ and Dy3+ phosphor by impulsive deformation. Luminescence 2015, 30, 1207–1211. [Google Scholar] [CrossRef] [PubMed]
- Zhang, H.; Yamada, H.; Terasaki, N.; Xu, C.-N. Stress-induced mechanoluminescence in SrCaMgSi2O7:Eu. Electrochem. Solid-State Lett. 2007, 10, J129–J131. [Google Scholar] [CrossRef]
- Fu, X.; Zheng, S.; Shi, J.; Zhang, H. Enhanced blue mechanoluminescence of SrnMgSi2O5+n:Eu alkali-earth silicate induced by defective phase. J. Lumin. 2017, 192, 117–122. [Google Scholar] [CrossRef]
- Kodama, N.; Takahashi, T.; Yamaga, M.; Tanii, Y.; Qiu, J.; Hirao, K. Long-lasting phosphorescence in Ce3+ doped Ca2Al2SiO7 and CaYAl3O7 crystals. Appl. Phys. Lett. 1999, 75, 1715–1717. [Google Scholar] [CrossRef]
- Akiyama, M.; Xu, C.-N.; Nonaka, K. Improvement in mechanoluminescence intensity of Ca2Al2SiO7:Ce by the statistical approach. J. Electrochem. Soc. 2003, 150, H115–H118. [Google Scholar] [CrossRef]
- Ding, Y.; Zhang, Y.; Wang, Z.; Li, W.; Mao, D.; Han, H.; Chang, C. Photoluminescence of Eu single doped and Eu/Dy codoped Sr2Al2SiO7 phosphors with long persistent. J. Lumin. 2009, 129. [Google Scholar] [CrossRef]
- Sahu, I.P.; Bisen, D.P.; Brahme, N.; Tamrakar, R.K. Luminescence enhancement of bluish-green Sr2Al2SiO7:Eu2+ phosphor by dysprosium co-doping. J. Lumin. 2015, 167, 278–288. [Google Scholar] [CrossRef]
- Sahu, I.P. The role of europium and dysprosium in the bluish-green long lasting Sr2Al2SiO7:Eu2+, Dy3+ phosphor by solid state reaction method. J. Mater. Sci. Mater. Electron. 2015, 26, 7059–7072. [Google Scholar] [CrossRef]
- Kodama, N.; Sasaki, N.; Yamaga, M.; Masui, Y. Long-lasting phosphorescence of Eu2+ in melilite. J. Lumin. 2001, 94–95, 19–22. [Google Scholar] [CrossRef]
- Zhang, H.; Yamada, H.; Terasaki, N.; Xu, C.-N. Blue light emission from stress-activated CaYAl3O7:Eu. J. Electrochem. Soc. 2008, 155, J128–J131. [Google Scholar] [CrossRef]
- Zhang, H.; Xu, C.-N.; Terasaki, N.; Yamada, H. Electro-mechano-optical luminescence from CaYAl3O7:Ce. Electrochem. Solid-State Lett. 2011, 14, J76–J80. [Google Scholar] [CrossRef]
- Ju, G.; Hu, Y.; Chen, L.; Wang, X.; Mu, Z. Persistent luminescence in CaAl2Si2O8:Eu2+-R3+ (R = Pr, Nd, Dy, Ho, Er). J. Lumin. 2014, 146, 102–108. [Google Scholar] [CrossRef]
- Zhang, L.; Yamada, H.; Imai, Y.; Xu, C.-N. Observation of elasticoluminescence from CaAl2Si2O8:Eu2+ and its water resistance behavior. J. Electrochem. Soc. 2008, 155, J63–J65. [Google Scholar] [CrossRef]
- Wang, Z.; Wang, Y.; Zhang, P.; Fan, X.; Qian, G. Tunable afterglow color in Eu2+ and Dy3+ co-activated alkaline earth feldspar solid solutions phophors. J. Lumin. 2007, 124, 140–142. [Google Scholar] [CrossRef]
- Zhang, L.; Xu, C.-N.; Yamada, H.; Bu, N. Enhancement of mechanoluminescence in CaAl2Si2O8:Eu2+ by partial Sr2+ substitution for Ca2+. J. Electrochem. Soc. 2010, 157, J50–J53. [Google Scholar] [CrossRef]
- Zhan, T.Z.; Xu, C.-N.; Yamada, H.; Terasawa, Y.; Zhang, L.; Iwase, H.; Kawai, M. Enhancement of impact-induced mechanoluminescence by swift heavy ion irradiation. Appl. Phys. Lett. 2012, 100, 0141019. [Google Scholar] [CrossRef]
- Liu, L.; Li, C.; Wang, S.; Su, Q. Redshift phenomenon of the excitation light of long life emission phosphor. Appl. Phys. Lett. 2006, 88, 241107. [Google Scholar] [CrossRef]
- Jia, W.; Jia, D.; Rodriguez, T.; Evans, D.R.; Meltzer, R.S.; Yen, W.M. UV excitation and trapping centers in CaTiO3:Pr3+. J. Lumin. 2006, 119, 13–18. [Google Scholar] [CrossRef]
- Zhang, J.-C.; Long, Y.-Z.; Wang, X.; Xu, C.-N. Controlling elastico-mechanoluminescence in diphase (Ba, Ca)TiO3:Pr3+ by co-doping different rare earth ions. RSC Adv. 2014, 4, 40665–40675. [Google Scholar] [CrossRef]
- Wang, X.; Xu, C.-N.; Yamada, H.; Nishikubo, K.; Zheng, X.-G. Electro-mechano-optical conversions in Pr3+-doped BaTiO3-CaTiO3 ceramics. Adv. Mater. 2005, 17, 1254–1258. [Google Scholar] [CrossRef]
- Zhang, J.-C.; Tang, M.; Wang, X.; Li, Y.; Yao, X. Elastico-mechanoluminescence properties of Pr3+-doped BaTiO3-CaTiO3 diphase ceramics with water resistance behavior. Ceram. Int. 2012, 38, S581–S584. [Google Scholar] [CrossRef]
- Zhang, J.-C.; Wang, X.; Yao, X.; Xu, C.-N.; Yamada, H. Strong elastico-mechanoluminescence in diphase (Ba, Ca)TiO3:Pr3+ with self-assembled sandwich architectures. J. Electrochem. Soc. 2010, 157, G269. [Google Scholar] [CrossRef]
- Zhang, J.-C.; Wang, X.; Yao, X.; Xu, C.-N.; Yamada, H. Studies on AC electroluminescence device made of BaTiO3-CaTiO3:Pr3+ diphase ceramics. Appl. Phys. Express 2010, 3, 022601. [Google Scholar] [CrossRef]
- Zhang, J.-C.; Wan, Y.; Xin, X.; Han, W.-P.; Zhang, H.-D.; Sun, B.; Long, Y.-Z.; Wang, X. Elastico-mechanoluminescent enhancement with Gd3+ codoping in diphase (Ba, Ca)TiO3:Pr3+. Opt. Mater. Express 2014, 4, 2300. [Google Scholar] [CrossRef]
- Tu, D.; Xu, C.-N.; Yoshida, A.; Fujihala, M.; Hirotsu, J.; Zheng, X.-G. LiNbO3:Pr3+: A multipiezo material with simultaneous piezoelectricity and sensitive piezoluminescence. Adv. Mater. 2017, 29, 1606914. [Google Scholar] [CrossRef] [PubMed]
- Lei, B.-F.; Yue, S.; Zhang, Y.-Z.; Liu, Y.-L. Luminescence properties of Sr2SnO4:Sm3+ afterglow phosphors. Chin. Phys. Lett. 2010, 27, 037201. [Google Scholar] [CrossRef]
- Xu, X.; Wang, Y.; Zeng, W.; Gong, Y. Luminescence and storage properties of Sm-doped alkaline-earth atannates. J. Electrochem. Soc. 2011, 158, J305–J309. [Google Scholar] [CrossRef]
- Kamimura, S.; Yamada, H.; Xu, C.-N. Strong reddish-orange light emission from stress-activated Srn+1SnnO3n+1:Sm3+ (n = 1, 2, ∞) with perovskite-related structures. Appl. Phys. Lett. 2012, 101, 091113. [Google Scholar] [CrossRef]
- Lei, B.; Manb, S.-Q.; Liu, Y.; Yue, S. Luminescence properties of Sm3+-doped Sr3Sn2O7 phosphor. Mater. Chem. Phys. 2014, 124, 912–915. [Google Scholar] [CrossRef]
- Ju, Z.; Wei, R.; Zheng, J.; Gao, X.; Zhang, S.; Liu, W. Synthesis and phosphorescence mechanism of a reddish orange emissive long afterglow phosphor Sm3+-doped Ca2SnO4. Appl. Phys. Lett. 2011, 98, 121906. [Google Scholar] [CrossRef]
- Zhao, H.; Chai, X.; Wang, X.; Li, Y.; Yao, X. Mechanoluminescence in (Sr, Ca, Ba)2SnO4:Sm3+, La3+ ceramics. J. Alloys Compd. 2016, 656, 94–97. [Google Scholar] [CrossRef]
- Li, J.; Xu, C.-N.; Tu, D.; Chai, X.; Wang, X.; Liu, L.; Kawasaki, E. Tailoring bandgap and trap distribution via Si or Ge substitution for Sn to improve mechanoluminescence in Sr3Sn2O7:Sm3+ layered perovskite oxide. Acta Mater. 2018, 145, 464–469. [Google Scholar] [CrossRef]
- Wang, B.; Lin, H.; Xu, J.; Chen, H.; Lin, Z.; Huang, F.; Wang, Y. Design, preparation, and characterization of a novel red long-persistent perovskite phosphor: Ca3Ti2O7:Pr3+. Inorg. Chem. 2015, 54, 11299–11306. [Google Scholar] [CrossRef] [PubMed]
- Fan, X.-H.; Zhang, J.-C.; Zhang, M.; Pan, C.; Yan, X.; Han, W.-P.; Zhang, H.-D.; Long, Y.-Z.; Wang, X. Piezoluminescence from ferroelectric Ca3Ti2O7:Pr3+ long-persistent phosphor. Opt. Express 2017, 25, 14238–14246. [Google Scholar] [CrossRef] [PubMed]
- Botterman, J.; Van den Eeckhout, K.; Bos, A.J.J.; Dorenbos, P.; Smet, P.F. Persistent luminescence of MSi2O2N2:Eu phosphor. Opt. Mater. Express 2012, 2, 341–349. [Google Scholar] [CrossRef]
- Qin, J.; Zhang, H.; Lei, B.; Hu, C.; Li, J.; Liu, Y.; Meng, J.; Wang, J.; Zheng, M.; Xiao, Y. Thermoluminescence and temperature-dependent afterglow properties in BaSi2O2N2:Eu2+. J. Am. Ceram. Soc. 2013, 96, 3149–3154. [Google Scholar] [CrossRef]
- Botterman, J.; Van den Eeckhout, K.; De Baere, I.; Poelman, D.; Smet, P.F. Mechanoluminescence in BaSi2O2N2:Eu. Acta Mater. 2012, 60, 5494–5500. [Google Scholar] [CrossRef] [Green Version]
- Bregiroux, D.; Wallez, G.; Popa, K. Structural study of polyporphism and thermal behavior of CaZr(PO4)2. Solid State Sci. 2015, 41, 43–47. [Google Scholar] [CrossRef]
- Zhang, J.-C.; Xu, C.-N.; Long, Y.-Z. Elastico-mechanoluminescence in CaZr(PO4)2:Eu2+ with multiple trap levels. Opt. Express 2013, 21, 13699–13709. [Google Scholar] [CrossRef] [PubMed]
- Cong, Y.; Li, B.; Wang, X.-J.; Lei, B.; Li, W. Synthesis and optical property study of nanocrystalline ZrO2:Ti long-lasting phosphors. J. Electrochem. Soc. 2008, 15, K195–K198. [Google Scholar] [CrossRef]
- Carvalho, J.M.; Rodrigues, L.C.V.; Hölsä, J.; Lastusaari, M.; Nunes, L.A.O.; Felinto, M.C.F.C.; Malta, O.L.; Brito, H.F. Influence of titanium and lutetium on the persistent luminescence of ZrO2. Opt. Mater. Express 2012, 2, 331–340. [Google Scholar] [CrossRef]
- Tiwari, N.; Kuraria, R.K.; Kuraria, S.R. Mechanoluminescence induced by impulsive deformation in zirconium:Ti phosphor. Radiat Eff. Defects Solids 2015, 170, 679–689. [Google Scholar] [CrossRef]
- Akiyama, M.; Xu, C.-N.; Nonaka, K. Intense visible light emission from stress-activated Zr2:Ti. Appl. Phys. Lett. 2002, 81, 457–459. [Google Scholar] [CrossRef]
- Tyler, W.W. Plastic flow in alkali halide crystals. Phys. Rev. 1952, 86, 801–802. [Google Scholar] [CrossRef]
- Kruglov, A.S.; Ei-shanshoury, I.A.; Matta, M.K. On the Luminescence of γ-rayed KCl crystals induced by plastic deformation. J. Phys. Soc. Jpn. 1966, 21, 2147–2153. [Google Scholar] [CrossRef]
- Alzetta, G.; Chudacek, I.; Scarmozzino, R. Excitation of triboluminescence by deformation of single crystals. Phys. Status Solidi A 1970, 1, 775–785. [Google Scholar] [CrossRef]
- Catti, M.; Noel, Y.; Dovesi, R. Full piezoelectric tensors of wurtzite and zinc blende ZnO and ZnS by first principle calculations. J. Phys. Chem. Solids 2003, 64, 2183–2190. [Google Scholar] [CrossRef]
- Meyer, B.K.; Stadler, W. Native defect identification in II–VI materials. J. Cryst. Growth 1996, 161, 119–127. [Google Scholar] [CrossRef]
- Krishnan, S.; Van der Walt, H.; Venkatesh, V.; Sundaresan, V.B. Dynamic characterization of elastico-mechanoluminescence towards structural health monitoring. J. Intell. Mater. Syst. Sturct. 2017, 28, 2458–2464. [Google Scholar] [CrossRef]
- Chandra, V.K.; Chandra, B.P.; Jha, P. Self-recovery of mechanoluminescence in ZnS:Cu and ZnS:Mn phosphors by trapping of drifting charge carriers. Appl. Phys. Lett. 2013, 103, 161113. [Google Scholar] [CrossRef]
- Sambrook, T.; Smura, C.F.; Clarke, S.J.; Ok, K.M.; Halasyamani, P.S. Structure and physical properties of the polar oxysulfide CaZnOS. Inorg. Chem. 2007, 46, 2571–2574. [Google Scholar] [CrossRef] [PubMed]
- Broadley, S.; Gál, Z.A.; Corà, F.; Smura, C.F.; Clarke, S.J. Vertex-linked ZnO2S2 tetrahedra in the oxysulfide BaZnOS: A new coordination environment for zinc in a condensed solid. Inorg. Chem. 2005, 44, 9092–9096. [Google Scholar] [CrossRef] [PubMed]
- Müller-Buschbaum, H. The crystal chemistry of AM2O4 oxometalates. J. Alloys Compd. 2003, 349, 49–104. [Google Scholar] [CrossRef]
- Prodjosantoson, A.K.; Kennedyn, B.J. Synthesis and evolution of the crystalline phases in Ca1−xSrxAl2O4. J. Solid State Chem. 2002, 168, 229–236. [Google Scholar] [CrossRef]
- Schulze, A.-R.; Buschbaum, M. Zur Verbindungsbildung von MeO: M2O3. IV. Zur Struktur von monoklinem SrAl2O4. Z. Anorg. Allg. Chem. 1981, 475, 205–210. [Google Scholar] [CrossRef]
- Henderson, C.M.B.; Taylor, D. The Structural behaviour of the nepheline family: (1) Sr and Ba aluminates (MAl2O4). Mineral. Mag. 1982, 45, 111–127. [Google Scholar] [CrossRef]
- Yamada, H.; Kusaba, H.; Xu, C.-N. Anisotropic lattice behavior in elasticoluminescent material SrAl2O4: Eu2+. Appl. Phys. Lett. 2008, 92, 101909. [Google Scholar] [CrossRef]
- Ishii, Y.; Tsukasaki, H.; Tanaka, E.; Mori, S. A fluctuating state in framework compounds (Ba, Sr)Al2O4. Sci. Rep. 2016, 6, 19154. [Google Scholar] [CrossRef] [PubMed]
- Rodehorst, U.; Carpenter, M.A.; Marion, S.; Henderson, C.M.B. Structural phase transitions and mixing behaviour of the Ba-aluminate (BaAl2O4)–Sr-aluminate (SrAl2O4) solid solution. Mineral. Mag. 2003, 67, 989–1013. [Google Scholar] [CrossRef]
- Hang, C.; Simonov, M.A.; Belov, N.V. Crystal strucutre of williemite Zn2[SiO4] amd its germanium analog Zn2[GeO4]. Sov. Phys. Crystallogr. 1970, 15, 387–390. [Google Scholar]
- McGuinn, M.D.; Redfern, S.A.T. Ferroelastic phase transition along the join CaAl2Si2O8-SrAl2Si2O8. Am. Mineral. 1994, 79, 24–30. [Google Scholar]
- Hemon, A.; Courbion, G. The crystal structure of α-SrZn2(PO4)2: A hurlbutite type. J. Solid State Chem. 1990, 85, 164–168. [Google Scholar] [CrossRef]
- Shannon, R.D. Revised effective ionic radii and systematic studies of interatomic distances in halides and chaleogenides. Acta Crystallogr. A 1976, 32, 751–767. [Google Scholar] [CrossRef]
- Greenwood, N.N.; Earnshaw, A. Chemistry of the Elements, 2nd ed.; Butterworth-Heinemann: Oxford, UK, 1998; pp. 112–115, 1027–1028. ISBN 0-7506-3365-4. [Google Scholar]
- Schaper, A.K.; Schosnig, M.; Kutoglu, A.; Treutmann, W.; Rager, H. Transition from the incommensurately modulated structure to the lock-in phase in Co-åkermanite. Acta Crystallogr. B 2001, 57, 443–448. [Google Scholar] [CrossRef] [PubMed]
- Tamura, T.; Yoshiasa, A.; Iishi, K.; Takeno, S.; Maeda, H.; Emura, S.; Koto, K. Local structure of (Ca, Sr)2(Mg, Co, Zn)Si2O7 melilite solid-solution with modulated structure. Phys. Chem. Miner. 1996, 23, 81–88. [Google Scholar] [CrossRef]
- Van Heurck, C.; Van Tendeloo, G.; Amelinckx, S. The modulated structure in the melilite Ca2ZnGe2O7. Phys. Chem. Miner. 1992, 18, 441–452. [Google Scholar] [CrossRef]
- Seifert, F.; Czank, M.; Simons, B.; Schmahl, W. A commensurate-incommensurate phase transition in iron-bearing åkermanites. Phys. Chem. Miner. 1987, 14, 26–35. [Google Scholar] [CrossRef]
- Kusaka, K.; Haga, N.; Ohmasa, M.; Hagiya, K.; Iishi, K.; Haga, N. On variety of the Ca coordination in the incommensurate structure of synthetic iron-bearing åkermanite, Ca2(Mg0.55, Fe0.45)Si2O7. Mineral. J. 1998, 20, 47–58. [Google Scholar] [CrossRef]
- Jiang, J.C.; Schosnig, M.; Schaper, A.K.; Ganster, K.; Rager, H.; Tóth, L. Modulations in incommensurate (Ca1−xSrx)2MgSi2O7 single crystals. Phys. Chem. Miner. 1998, 26, 128–134. [Google Scholar] [CrossRef]
- Louisnathan, S.J. Refinement of the crystal structure of a natural gehlenite Ca2Al(Al, Si)2O7. Can. Mineral. 1971, 10, 822–837. [Google Scholar]
- Loewenstein, W. The distribution of aluminum in the tetrahedra of silicates and aluminates. Am. Mineral. 1954, 39, 92–96. [Google Scholar]
- Gemmi, M.; Merlini, M.; Cruciani, G.; Artioli, G. Non-ideality and defectivity of the åkermanite-gehlenite solid solution: An X-ray diffraction and TEM study. Am. Mineral. 2007, 92, 1685–1694. [Google Scholar] [CrossRef]
- Yang, Y.; Lu, H.; Yu, C.; Chen, J.-M. First-principles calculations of structural, electronic and elastic properties of Ca2MgSi2O7. Compt. Mater. Sci. 2009, 47, 35–40. [Google Scholar] [CrossRef]
- Haussühl, S.; Liebertz, J. Elastic and thermoelastic properties of synthetic Ca2MgSi2O7 (åkermanite) and Ca2ZnSi2O7 (hardystonite). Phys. Chem. Miner. 2004, 31, 565–567. [Google Scholar] [CrossRef]
- Brown, J.M.; Ange, R.J.; Ross, N.L. Elasticity of plagioclase feldspars. J. Geophys. Res. B Solid Earth 2016, 121, 663–675. [Google Scholar] [CrossRef]
- Kaercher, P.; Militzer, B.; Wenk, H.-R. Ab initio calculations of elastic constants of plagioclase feldspars. Am. Mineral. 2014, 99, 2344–2352. [Google Scholar] [CrossRef]
- Damjanovic, D. Lead-based piezoelectric materials. In Piezoelectric and Acoustic Materials for Transducer Applications, 1st ed.; Safari, A., Akdoğan, E.K., Eds.; Springer: New York, NY, USA, 2008; pp. 59–79. ISBN 978-0-387-76538-9. [Google Scholar]
- Fisk, Z.; Sarrao, J.L. The new generation high-temperature superconductors. Annu. Rev. Mater. Sci. 1997, 27, 35–67. [Google Scholar] [CrossRef]
- Zhu, J.; Thomas, A. Perovskite-type mixed oxides as catalytic material for NO removal. Appl. Catal. B 2009, 92, 225–233. [Google Scholar] [CrossRef]
- Yamamoto, H.; Okamoto, S.; Kobayashi, H. Luminescence of rare-earth ions in perovskite-type oxides: From basic research to applications. J. Lumin. 2002, 100, 325–332. [Google Scholar] [CrossRef]
- Wang, X.; Yamada, H.; Xu, C.-N. Large electrostriction near the solubility limit in BaTiO3-CaTiO3 ceramics. Appl. Phys. Lett. 2005, 86, 022905. [Google Scholar] [CrossRef]
- Smith, R.T.; Welsh, F.S. Temperature dependence of the elastic, piezoelectric, and dielectric constants of lithium tantalate and lithium niobate. J. Appl. Phys. 1971, 42, 2219–2230. [Google Scholar] [CrossRef]
- Megaw, H.D. A Note on the strueture of lithium niobate, LiNbO3. Acta Crystallogr. A 1968, 24, 583–588. [Google Scholar] [CrossRef]
- Green, M.A.; Prasssides, K.; Day, P.; Neumann, D.A. Structure of the n = 2 and n = ∞ member of the Ruddlesden-Popper series, Srn+1SnnO3n+1. Int. J. Inorg. Mater. 2000, 2, 35–41. [Google Scholar] [CrossRef]
- Kechele, J.A.; Oeckler, O.; Stadler, F.; Schnick, W. Structure elucidation of BaSi2O2N2–A host lattice for rare-earth doped luminescent materials in phosphor-converted (pc)-LEDs. Solid State Sci. 2009, 11, 537–543. [Google Scholar] [CrossRef]
- Bachmann, V.; Ronda, C.; Oeckler, O.; Schnick, W.; Meijerink, A. Color point tuning for (Sr, Ca, Ba)Si2O2N2:Eu2+ for white light LEDs. Chem. Mater. 2009, 21, 316–325. [Google Scholar] [CrossRef]
- Seibald, M.; Rosenthal, T.; Oeckler, O.; Fahrnbauer, F.; Tucks, A.; Schmidt, P.J.; Schnick, W. Unexpected luminescence properties of Sr0.25Ba0.75Si2O2N2:Eu2+—A narrow blue emitting oxonitridosilicate with cation ordering. Chem. Eur. J. 2012, 18, 13446–13452. [Google Scholar] [CrossRef] [PubMed]
- Lazarowska, A.; Mahlik, S.; Grinberg, M.; Li, G.; Liu, R.S. Structural phase transitions and photoluminescence properties of oxonitridosilicate phosphors under high hydrostatic pressure. Sci. Rep. 2016, 6, 34010. [Google Scholar] [CrossRef] [PubMed]
- Shimakawa, K.; Singh, J.; O’Leary, S.K. Optical properties of disordered condensed matter. In Optical Properties of Condensed Matter and Applications, 1st ed.; Singh, J., Ed.; John Wiley & Sons, Ltd.: West Sussex, UK, 2006; pp. 47–62. ISBN 978-0-470-02192-7. [Google Scholar]
- Salje, E.K.H. Modulated minerals as potential ferroic materials. J. Phys. Condens. Matter 2015, 27, 305901. [Google Scholar] [CrossRef] [PubMed]
- Tsukasaki, H.; Ishii, Y.; Tanaka, E.; Kurushima, K.; Mori, S. Modulated structures and associated microstructures in the ferroelectric phase of Ba1−xSrxAl2O4 (0.7 < x < 1.0). Jpn. J. Appl. Phys. 2016, 55, 011502. [Google Scholar] [CrossRef]
- Avdeev, M.; Yakovlev, S.; Yaremchenko, A.A.; Kharton, V.V. Transitions between P21, P63 (A) and P6322 modifications of SrAl2O4 by in situ high-temperature X-ray and neutron diffraction. J. Solid State Chem. 2007, 180, 3535–3544. [Google Scholar] [CrossRef]
- Abakumov, A.M.; Lebedev, O.I.; Nistor, L.; Van Tendeloo, G.; Amelinckx, S. The ferroelectric phase transition in tridymite type BaAl2O4 studied by electron microscopy. Phase Transit. 2000, 71, 143–160. [Google Scholar] [CrossRef]
- Larsson, A.-K.; Withers, R.L.; Perez-Mato, J.M.; Gerald, J.D.F.; Saines, P.J.; Kennedy, B.J.; Liu, Y. On the microstructure and symmetry of apparently hexagonal BaAl2O4. J. Solid State Chem. 2008, 181, 1816–1823. [Google Scholar] [CrossRef]
- Stokes, H.T.; Sadate, C.; Hatch, D.M.; Boyer, L.L.; Mehl, M.J. Analysis of the ferroelectric phase transition in BaAl2O4 by group theoretical methods and first principles calculations. Phys. Rev. B 2002, 65, 064105. [Google Scholar] [CrossRef]
- Mori, S.; Katsumura, S.; Ozaki, T.; Tanaka, E.; Ishii, Y.; Kurushima, K.; Kubota, Y.; Taniguchi, H. Structural phase transition and microstructures in stuffed tridymite-type compounds: Ba(Al, Fe)2O4. Ferroelectrics 2014, 464, 116–121. [Google Scholar] [CrossRef]
- Tanaka, E.; Ishii, Y.; Tsukasaki, H.; Taniguchi, H.; Mori, S. Structural changes and microstructures in stuffed tridymite-type compounds Ba1−xSrxAl2O4. Jpn. J. Appl. Phys. 2014, 53, 09PB01. [Google Scholar] [CrossRef]
- Fukuda, K.; Iwata, T.; Orito, T. Structural disorder in Ba0.6Sr0.4Al2O4. J. Solid State Chem. 2005, 178, 3662–3666. [Google Scholar] [CrossRef]
- Ghose, S.; McMullan, P.K.; Weber, H.-P. Neutron diffraction studies of the P ⇔ I transition in anorthite, CaAl2Si2O8, and the crystal structure of the body-centered phase at 514 K. Z. Kristallogr. 1993, 204, 215–237. [Google Scholar] [CrossRef]
- Angel, R.J.; Carpenter, M.A.; Finger, L.W. Structural variation associated with compositional variation and order-disorder behaviour in anorthite-rich feldspars. Am. Mineral. 1990, 75, 150–162. [Google Scholar]
- Ghose, S.; Van Tendeloo, G.; Amelinckx, S. Dynamics of a second-order phase transition: P to I phase transition in anorthite, CaAl2Si2O8. Science 1988, 242, 1539–1541. [Google Scholar] [CrossRef] [PubMed]
- Xu, H.; Buseck, P.R.; Carpenter, M.A. Twinning in synthetic anorthite: A transmission electron microscopy investigation. Am. Mineral. 1997, 82, 125–130. [Google Scholar] [CrossRef]
- Töepel-Schadt, J.; Müeller, W.F.; Pentinghaus, H. Transmission electron microscopy of SrAl2Si2O8—Feldspar and hexacelsian polymorphs. J. Mater. Sci. 1978, 13, 1809–1816. [Google Scholar] [CrossRef]
- Müller, W.F. Phase transitions and associated domains in hexacelsian (BaAl2Si2O8). Phys. Chem. Miner. 1977, 1, 71–82. [Google Scholar] [CrossRef]
- McGuinn, M.D.; Redfern, S.A.T. Lattice simulation studies of the ferroelastic phase transitions in (Na, K)AISi3O8 and (Sr, Ca)Al2Si2O8 feldspar solid solutions. Am. Mineral. 1997, 82, 8–15. [Google Scholar] [CrossRef]
- McGuinn, M.D.; Redfern, S.A.T. High temperature ferroelastic strain below the I-I transition in Ca1−xSrxAl2Si2O8 feldspars. Eur. J. Mineral. 1997, 9, 1159–1172. [Google Scholar] [CrossRef]
- Tribaudino, M.; Zhang, M.; Salje, E.K.H. Cation ordering and phase transitions in feldspars along the join CaAl2Si2O8-SrAl2Si2O8: A TEM, IR and XRD investigation. Am. Mineral. 2009, 73, 119–130. [Google Scholar] [CrossRef] [Green Version]
- Benna, P.; Bruno, E. Single-crystal in-situ high-temperature structural investigation of the I-I phse transition in the Ca0.2Sr0.8Al2Si2O8 feldspar. Am. Mineral. 2003, 88, 1532–1541. [Google Scholar] [CrossRef]
- Ma̧czka, M.; Hanuza, J.; Kaminskii, A.; Kojima, S. High-resolution Brillouin scattering studies of phase transitions in Ca2MgSi2O7 and Ca2ZnSi2O7 silicates. J. Alloys Compd. 2015, 638, 34–37. [Google Scholar] [CrossRef]
- Kusz, J.; Bohm, H. X-ray studies of phase transitions of (Ca,Sr)-åkermanite solid solutions. Z. Kristallogr. 2001, 216, 509–512. [Google Scholar] [CrossRef]
- Van Aert, S.; Turner, S.; Delville, R.; Schryvers, D.; Van Tendeloo, G.; Ding, X.; Salje, E.K.H. Functional twin boundaries. Phase Transit. 2013, 86, 1052–1059. [Google Scholar] [CrossRef]
- Van Aert, S.; Turner, S.; Delville, R.; Schryvers, D.; Van Tendeloo, G.; Salje, E.K.H. Direct observation of ferroelectricity at ferroelastic domain boundaries in CaTiO3 by electron microscopy. Adv. Mater. 2012, 24, 523–527. [Google Scholar] [CrossRef] [PubMed] [Green Version]
- Von Hippel, A. Ferroelectricity, domain structure, and phase transitions of barium titanate. Rev. Mod. Phys. 1950, 22, 221–237. [Google Scholar] [CrossRef]
- Fu, W.T.; Visser, D.; IJdo, D.J.W. Neutron powder diffraction study of phase transitions in Sr2SnO4. J. Solid State Chem. 2004, 177, 4081–4086. [Google Scholar] [CrossRef]
- Oeckler, O.; Stadler, F.; Rosenthal, T.; Schnick, W. Real structure of SrSi2O2N2. Solid State Sci. 2007, 9, 205–212. [Google Scholar] [CrossRef]
- Trolliard, G.; Mercurio, D.L.; Perez-Mato, J.M. Martensitic phase transition in pure zirconia: A crystal chemistry viewpoint. Z. Kristallogr. 2011, 226, 264–290. [Google Scholar] [CrossRef]
- Tolédano, J.-C.; Janovec, V.; Kopsky, V.; Scott, J.F.; Bocěk, P. Structural phase transitions. In International Tables for Crystallography, 1st ed.; Authier, A., Ed.; Kluwer Academic Publishers: Dordrecht, The Netherlands, 2003; Volume D, pp. 338–376. ISBN 1-4020-0714-0. [Google Scholar]
- Guymont, M. Domain structures arising from transitions between two crystals whose space groups are group-subgroup related. Phys. Rev. B 1978, 18, 5385–5393. [Google Scholar] [CrossRef]
- Janovec, V.; Přívratská, J. Domain structures. In International Table of Crystallography, 1st ed.; Authier, A., Ed.; Kluwer Academic Publishers: Dordrecht, The Netherlands, 2003; Volume D, pp. 449–502. ISBN 1-4020-0714-0. [Google Scholar]
- Dove, M.T. Theory of displacive phase transitions in minerals. Am. Mineral. 1997, 82, 213–244. [Google Scholar] [CrossRef]
- Carpenter, M.A. Elastic properties of minerals and the influence of phase transitions. Am. Mineral. 2006, 91, 229–246. [Google Scholar] [CrossRef]
- Barandiaran, Z.; Seijo, L. The abinitio model potential representation of the crystalline environment. theoretical study of the local distortion on NaCl:Cu+. J. Chem. Phys. 1988, 89, 5739–5746. [Google Scholar] [CrossRef]
- Davis, M.; Budimir, M.; Damjanovic, D.; Setter, N. Rotator and extender ferroelectrics: Importance of the shear coefficient to the piezoelectric properties of domain-engineered crystals and ceramics. J. Appl. Phys. 2007, 101, 054112. [Google Scholar] [CrossRef]
- Budimir, M.; Damjanovic, D.; Setter, N. Piezoelectric anisotropy-phase transition in perovskite single crystals. J. Appl. Phys. 2003, 94, 6753–6761. [Google Scholar] [CrossRef]
- Pinheiroa, C.B.L.; Abakumov, A.M. Superspace crystallography: A key to the chemistry and properties. IUCrJ 2015, 2, 137–154. [Google Scholar] [CrossRef] [PubMed]
- Yang, H.; Hazen, R.M.; Downs, R.T.; Finger, L.W. Structural change associated with the incommensurate-normal phase transition in åkermanite, Ca2MgSi2O7 , at high pressure. Phys. Chem. Miner. 1997, 24, 510–519. [Google Scholar] [CrossRef]
- Arakcheeva, A.; Logvinovich, D.; Chapuis, G.; Morozov, V.; Eliseeva, S.V.; Bünzli, J.-C.G.; Pattison, P. The luminescence of NaxEu3+2/3−x/3MoO4 scheelites depends on the number of Eu-clusters occurring in their incommensurately modulated structure. Chem. Sci. 2012, 3, 384–390. [Google Scholar] [CrossRef]
- Zhai, B.-G.; Yang, L.; Ma, Q.-L.; Liu, X.; Huang, Y.M. Mechanism of the prolongation of the green afterglow of SrAl2O4:Dy3+ caused by the use of H3BO3 flux. J. Lumin. 2017, 181, 78–87. [Google Scholar] [CrossRef]
- Su, Q.; Li, C.; Wang, J. Some interesting phenomena in the study of rare earth long lasting phosphors. Opt. Mater. 2014, 36, 1894–1900. [Google Scholar] [CrossRef]
- Korthout, K.; Van den Eeckhout, K.; Botterman, J.; Nikitenko, S.; Poelman, D.; Smet, P.F. Luminescence and X-ray absorption measurements of persistent SrAl2O4:Eu,Dy powders: Evidence for valence state changes. Phys. Rev. B 2011, 84, 085140. [Google Scholar] [CrossRef]
- Joos, J.J.; Poelman, D.; Smet, P.F. Energy level modelling of lanthanide materials: Review and uncertainty analysis. Phys. Chem. Chem. Phys. 2015, 17, 19058–19078. [Google Scholar] [CrossRef] [PubMed]
- Botterman, J.; Joos, J.J.; Smet, P.F. Trapping and detrapping in SrAl2O4:Eu,Dy persistent phosphors: Influence of excitation wavelength and temperature. Phys. Rev. B 2014, 90, 085147. [Google Scholar] [CrossRef]
- Clabau, F.; Rocquefelte, X.; Jobic, S.; Deniard, P.; Whangbo, M.-H.; Garcia, A.; Mercier, T.L. Mechanism of Phosphorescence Appropriate for the Long-Lasting Phosphors Eu2+-Doped SrAl2O4 with Codopants Dy3+ and B3+. Chem. Mater. 2005, 17, 3904–3912. [Google Scholar] [CrossRef]
- Jain, M.; Guralnik, B.; Andersen, M.T. Stimulated luminescence emission from localized recombination in randomly distribution defects. J. Phys. Condens. Matter 2012, 24, 385402. [Google Scholar] [CrossRef] [PubMed]
- Pagonis, V.; Kulp, C.; Chaney, C.-G.; Tchiya, M. Quantum tunneling recombination in a system of randomly distributed trapped electrons and positive ions. J. Phy. Condens. Matter 2017, 29, 365701. [Google Scholar] [CrossRef] [PubMed]
- Azad, A.I.; Rahimi, M.R.; Yun, G.J. Quantitative full-field strain measurements by SAOED (SrAl2O4:Eu2+, Dy3+) mechanoluminescent materials. Smart Mater. Struct. 2016, 25, 095032. [Google Scholar] [CrossRef]
- Adachi, S. Properties of Group-IV, II-V and II-VI Semiconductors, 1st ed.; John Wiley & Sons, Ltd.: West Sussex, UK, 2005; pp. 103–143. ISBN 0-470-09032-4. [Google Scholar]
- Keldish, L.V. The effect of strong electric field on the optical properties of insulating crystals. Sov. Phys. JETP 1958, 34, 788–790. [Google Scholar]
- Franz, V.W. Einflußeines elektrischen Feldes auf eine optische Absorptionskante. Z. Naturforschg. 1958, 13, 484–489. [Google Scholar] [CrossRef]
- Miller, D.A.B.; Chemla, D.S.; Damen, T.C.; Gossard, A.C.; Wiegmann, W.; Wood, T.H.; Burrus, C.A. Band-edge electroabsorption in quantum well structures: The quantum-confined stark effect. Phys. Rev. Lett. 1984, 53, 2173–2176. [Google Scholar] [CrossRef]
- Yacobi, B.G.; Brada, Y. Franz-Keldysh effect and internal fields in ZnS crystals. Phys. Rev. B 1974, 10, 665–670. [Google Scholar] [CrossRef]
- Peiner, E.; Guttzeit, A.; Wehmann, H.-H. The effect of threading dislocations on optical absorption and electron scattering in strongly mismatched heteroepitaxial III-V compound semiconductors on silicon. J. Phys. Condens. Matter 2002, 14, 13195–13201. [Google Scholar] [CrossRef]
- Yacobi, B.G.; Brada, Y. Defect-induced electric field in ZnS. Solid State Commun. 1976, 18, 135–138. [Google Scholar] [CrossRef]
- Chandra, B.P.; Chandra, V.K.; Jha, P. Elastico-mechanoluminescence and crystal-structure relationships in persistent luminescent materials and II–VI semiconductor phosphors. Physica B 2015, 463, 62–67. [Google Scholar] [CrossRef]
- Chandra, V.K.; Chandra, B.P. Dynamics of the mechanoluminescence induced by elastic deformation of persistent luminescent crystals. J. Lumin. 2012, 132, 858–869. [Google Scholar] [CrossRef]
- Chandra, V.K.; Chandra, B.P. Suitable materials for elastico mechanoluminescence-based stress sensors. Opt. Mater. 2011, 34, 194–200. [Google Scholar] [CrossRef]
- Chandra, B.P.; Baghel, R.N.; Luka, A.K.; Sanodiya, T.R.; Kuraria, R.K.; Kuraria, S.R. Strong mechanoluminescence induced by elastic deformation of rare-earth-doped strontium aluminate phosphors. J. Lumin. 2009, 129, 760–766. [Google Scholar] [CrossRef]
- Sasakura, H.; Kobayashi, H.; Tanaka, S.; Mita, J. The dependence of electroluminescent characteristics of ZnS:Mn thin films unpon their device parameters. J. Appl. Phys. 1981, 52, 6901–6906. [Google Scholar] [CrossRef]
- Chandra, V.K.; Chandra, B.P.; Jha, P. Strong luminescence induced by elastic deformation of piezoelectric crystals. Appl. Phys. Lett. 2013, 102, 241105. [Google Scholar] [CrossRef]
- Joos, J.J.; Lejaeghere, K.; Korthout, K.; Feng, A.; Poelman, D.; Smet, P.F. Charge transfer induced energy storage in CaZnOS:Mn—Insight from experimental and computational spectroscopy. Phys. Chem. Chem. Phys. 2017, 19, 9075–9085. [Google Scholar] [CrossRef] [PubMed]
- Huang, B.; Peng, D.; Pan, C. “Energy Relay Center” for doped mechanoluminescence materials: A case study on Cu-doped and Mn-doped CaZnOS. Phys. Chem. Chem. Phys. 2017, 19, 1190–1208. [Google Scholar] [CrossRef] [PubMed]
- Kim, J.S.; Kibble, K.; Kwon, Y.N.; Sohn, K.-S. Rate-equation model for the loading-rate-dependent mechanoluminescence of SrAl2O4:Eu2+, Dy3+. Opt. Lett. 2009, 34, 1915–1917. [Google Scholar] [CrossRef] [PubMed]
- Press, W.H.; Teukolsky, S.A.; Vetterling, W.T.; Flannery, B.P. Numerical Recipes—The art of Scientific Computing, 3rd ed.; Cambride University Press: New York, NY, USA, 2007; pp. 899–954. ISBN 978-0-521-88068-8. [Google Scholar]
- Chandra, B.P.; Chandra, V.K.; Jha, P. Microscopic theory of elastico-mechanoluminescent smart materials. Appl. Phys. Lett. 2014, 104, 031102. [Google Scholar] [CrossRef]
- Chandra, B.P.; Chandra, V.K.; Jha, P. Piezoelectrically-induced trap-depth reduction model of elastico-mechanoluminescent materials. Physica B 2015, 461, 38–48. [Google Scholar] [CrossRef]
- Van den Eeckhout, K.; Bos, A.J.J.; Poelman, D.; Smet, P.F. Revealing trap depth distributions in persistent phosphors. Phys. Rev. B 2013, 87, 0465126. [Google Scholar] [CrossRef]
- Chen, R.; Pagonis, V. Thermally and Optically Stimulated Luminescence: A Simulation Approach, 1st ed.; John Wiley & Sons Ltd.: West Sussex, UK, 2011; pp. 39–63. ISBN 9780470749272. [Google Scholar]
- Sohn, K.-S.; Park, W.B.; Timilsina, S.; Kim, J.S. Mechanoluminescence of SrAl2O4:Eu2+, Dy3+ under cyclic loading. Opt. Lett. 2014, 39, 1410–1413. [Google Scholar] [CrossRef] [PubMed]
- Dubernet, M.; Gueguen, Y.; Houizot, P.; Célarié, F.; Sangleboeuf, J.-C.; Orain, H.; Rouxel, T. Evidence and modelling of mechanoluminescne in a transparent glass particulate composite. Appl. Phys. Lett. 2015, 107, 151906. [Google Scholar] [CrossRef] [Green Version]
- Palmer, R.G.; Stein, D.L.; Abrahams, E.; Anderson, P.W. Hierarchically constrained dynamics for glassy relaxation. Phys. Rev. Lett. 1984, 53, 958–961. [Google Scholar] [CrossRef]
- Chen, R. Apparent stretched-exponential luminescence decay in crystalline solids. J. Lumin. 2003, 102, 510–518. [Google Scholar] [CrossRef]
- Sohn, K.-S.; Cho, M.Y.; Kim, M.; Kim, J.S. A smart load-sensing system using standardized mechano-luminescence measurement. Opt. Express 2015, 23, 6073–6082. [Google Scholar] [CrossRef] [PubMed]
- Stoneham, A.M. Theory in Solids: Electronic Structure of Defects in Insulators and Semiconductors; Clarendon Press: Oxford, UK, 2001; pp. 652–680. ISBN 978-0198507802. [Google Scholar]
- Seitz, F. Colour centers in alkali halide crystals II. Rev. Mod. Phys. 1954, 26, 7–94. [Google Scholar] [CrossRef]
- Seitz, F. Colour centers in alkali halide crystals. Rev. Mod. Phys. 1946, 18, 384–408. [Google Scholar] [CrossRef]
- Emtage, P.R. Binding of electrons, holes, and excitons to dislocations in insulators. Phys. Rev. 1967, 163, 865–872. [Google Scholar] [CrossRef]
- Hirth, J.P.; Lothe, J. Theory of Dislocations, 2nd ed.; John Wiley & Sons: New York, NY, USA, 1982; pp. 487–639. ISBN 0-471-09125-1. [Google Scholar]
- Whitworth, R.W. Charged dislocations in ionic crystals. Adv. Phys. 1975, 24, 203–304. [Google Scholar] [CrossRef]
- Metz, F.I.; Schweiger, R.N.; Leidler, H.R.; Girifalco, L.A. Stress activated luminescence in X-irradiated alkali halide crystals. J. Phys. Chem. 1957, 61, 86–89. [Google Scholar] [CrossRef]
- Chandra, B.P. Mechanoluminescence induced by elastic deformation of coloured alkali halide crystals using pressure steps. J. Lumin. 2008, 128, 1217–1224. [Google Scholar] [CrossRef]
- Senchukov, F.D.; Shmurak, S.Z. Interaction of dislocations with hole centers in colored alkali halide crystals. Zh. Eksp. Teor. Fiz. 1973, 65, 2356–2363. [Google Scholar]
- Timoshenko, Y.K.; Shunina, V.A. Electronic structure of the KCl and AgCl nanocrystals with edge dislocations. Phys. Status Solidi C 2005, 2, 1788–1791. [Google Scholar] [CrossRef]
- Shmurak, S.Z. Dislocation spectroscopy of crystals. Phys. Solid State 1999, 41, 1963–1969. [Google Scholar] [CrossRef]
- Chandra, B.P.; Bagri, A.K.; Chandra, V.K. Mechanoluminescence response to the plastic flow of coloured alkali halide crystals. J. Lumin. 2010, 130, 309–314. [Google Scholar] [CrossRef]
- Chandra, B.P.; Goutam, R.K.; Chandra, V.K.; Raghuwanshi, D.S.; Luka, A.K.; Baghel, R.N. Mechanoluminescence induced by elastic and plastic deformation of coloured alkali halide crystals at fixed strain rates. Radiat. Eff. Defects Solids 2010, 165, 907–919. [Google Scholar] [CrossRef]
- Rajput, N.; Tiwari, S.; Chandra, B.P. Temperature dependence of pulse-induced mechanoluminescence excitation in coloured alkali halide crystals. Bull. Mater. Sci. 2004, 27, 505–509. [Google Scholar] [CrossRef]
- Hayashiuchi, Y.; Hagihara, T.; Okada, T. Theory of deformation luminescence in KCl crystals. Phys. Lett. A 1990, 147, 245–249. [Google Scholar] [CrossRef]
- Sohn, K.-S.; Timilsina, S.; Singh, S.P.; Choi, T.; Kim, J.S. Mechanically driven luminescence in a ZnS:Cu-PDMS composite. APL Mater. 2016, 4, 106102. [Google Scholar] [CrossRef]
- Gan, J.; Kang, M.G.; Meeker, M.A.; Khodaparast, G.A.; Bodnar, R.J.; Mahaney, J.E.; Maurya, D.; Priya, S. Enhanced piezoluminescence in non-stoichiometric ZnS:Cu microparticle based light emitting elastomers. J. Mater. Chem. C 2017, 5, 5387–5394. [Google Scholar] [CrossRef]
- Basnet, R.; Timilsina, S.; Lee, K.H.; Kim, J.S. Evaluation of the elasto-plastic crack tip singularities via mechano-luminescent effects. Int. J. Eng. Sci. 2018, 123, 127–142. [Google Scholar] [CrossRef]
- Terasaki, N.; Xu, C.-N. Historical-log recording system for crack opening and growth based on mechanoluminescent flexible sensor. IEEE Sens. J. 2013, 13, 3999–4004. [Google Scholar] [CrossRef]
- Ueno, N.; Xu, C.-N.; Watanabe, S. Fatigue crack detection of CFRP composite pressure vessel using mechanoluminescent Sensor. In Proceedings of the 2013 IEEE Sensor, Baltimore, MD, USA, 3–6 November 2013; IEEE: New York, NY, USA, 2013; pp. 1–4. [Google Scholar]
- Fujio, Y.; Xu, C.-N.; Terasawa, Y.; Sakata, Y.; Yamabe, J.; Ueno, N.; Terasaki, N.; Yoshida, A.; Watanabe, S.; Murakami, Y. Sheet sensor using SrAl2O4:Eu mechanoluminescent material for visualizing inner crack of high-pressure hydrogen vessel. Int. J. Hydrog. Energy 2016, 41, 1333–1340. [Google Scholar] [CrossRef]
- Wang, X.; Que, M.; Chen, M.; Han, X.; Li, X.; Pan, C.; Wang, Z.L. Full Dynamic-range pressure sensor matrix based on optical and electrical dual-mode sensing. Adv. Mater. 2017, 29, 1605817. [Google Scholar] [CrossRef] [PubMed]
- Terasaki, N.; Yamada, H.; Xu, C.-N. Ultrasonic wave induced mechanoluminescence and its application for photocatalysis as ubiquitous light source. Catal. Today 2013, 201, 203–208. [Google Scholar] [CrossRef]
- Terasaki, N.; Xu, C.-N. Performance of single mechanoluminescent particle as ubiquitous light source. J. Colloid Interface Sci. 2014, 427, 62–66. [Google Scholar] [CrossRef] [PubMed]
- Sadd, M.H. Elasticity: Theory, Application, and Numerics, 1st ed.; Elsevier Butterworth-Heinemann: Oxford, UK, 2005; pp. 186–189. ISBN 0-12-605811-3. [Google Scholar]
Figure 1.
ML intensity-load relationship (a) and optical ML images (b) of SrAMgSiO:Eu for A = Ca, Sr and Ba, noted as SCMSE, SMSE and SBMSE, respectively. Reproduced from Ref [11] Copyright (2009) The Japan Society of Applied Physics.
Figure 1.
ML intensity-load relationship (a) and optical ML images (b) of SrAMgSiO:Eu for A = Ca, Sr and Ba, noted as SCMSE, SMSE and SBMSE, respectively. Reproduced from Ref [11] Copyright (2009) The Japan Society of Applied Physics.
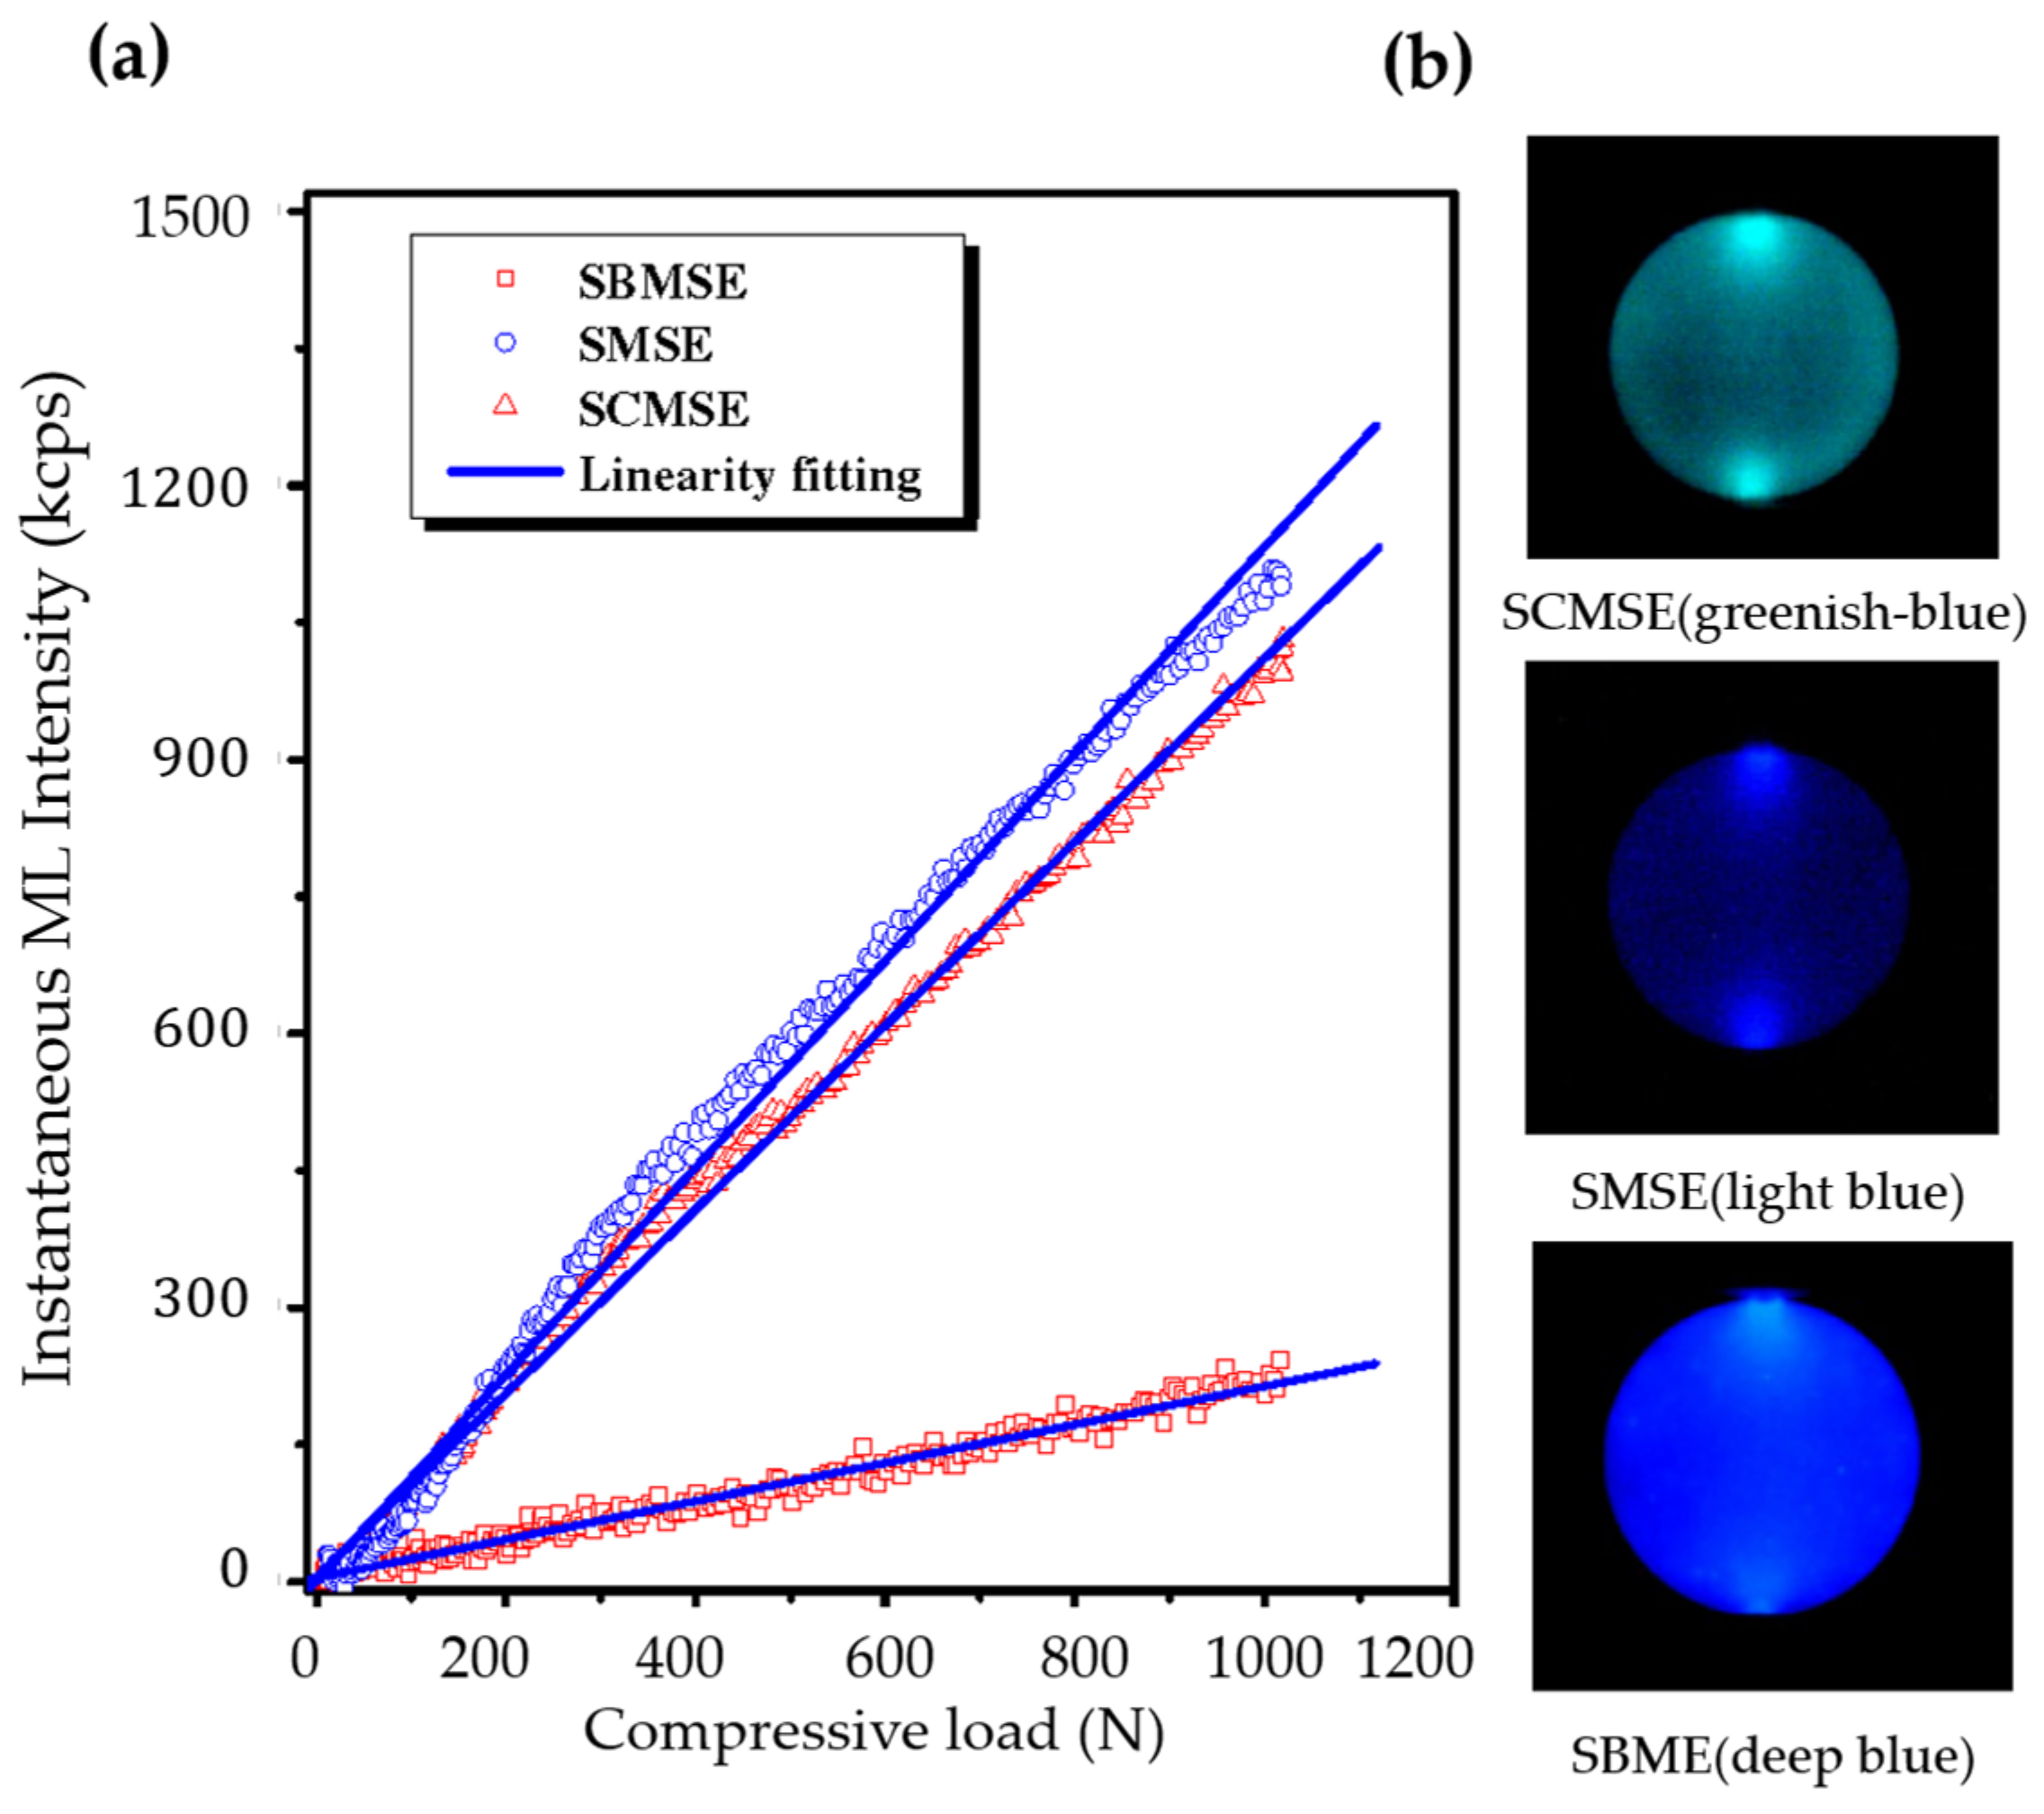
Figure 2.
The strain evolution under step stress load (a) and stress evolution under step strain load (b) for elastic, viscous and viscoelastic materials. Reproduced from Ref [56], with permission from Cambridge University Press.
Figure 2.
The strain evolution under step stress load (a) and stress evolution under step strain load (b) for elastic, viscous and viscoelastic materials. Reproduced from Ref [56], with permission from Cambridge University Press.
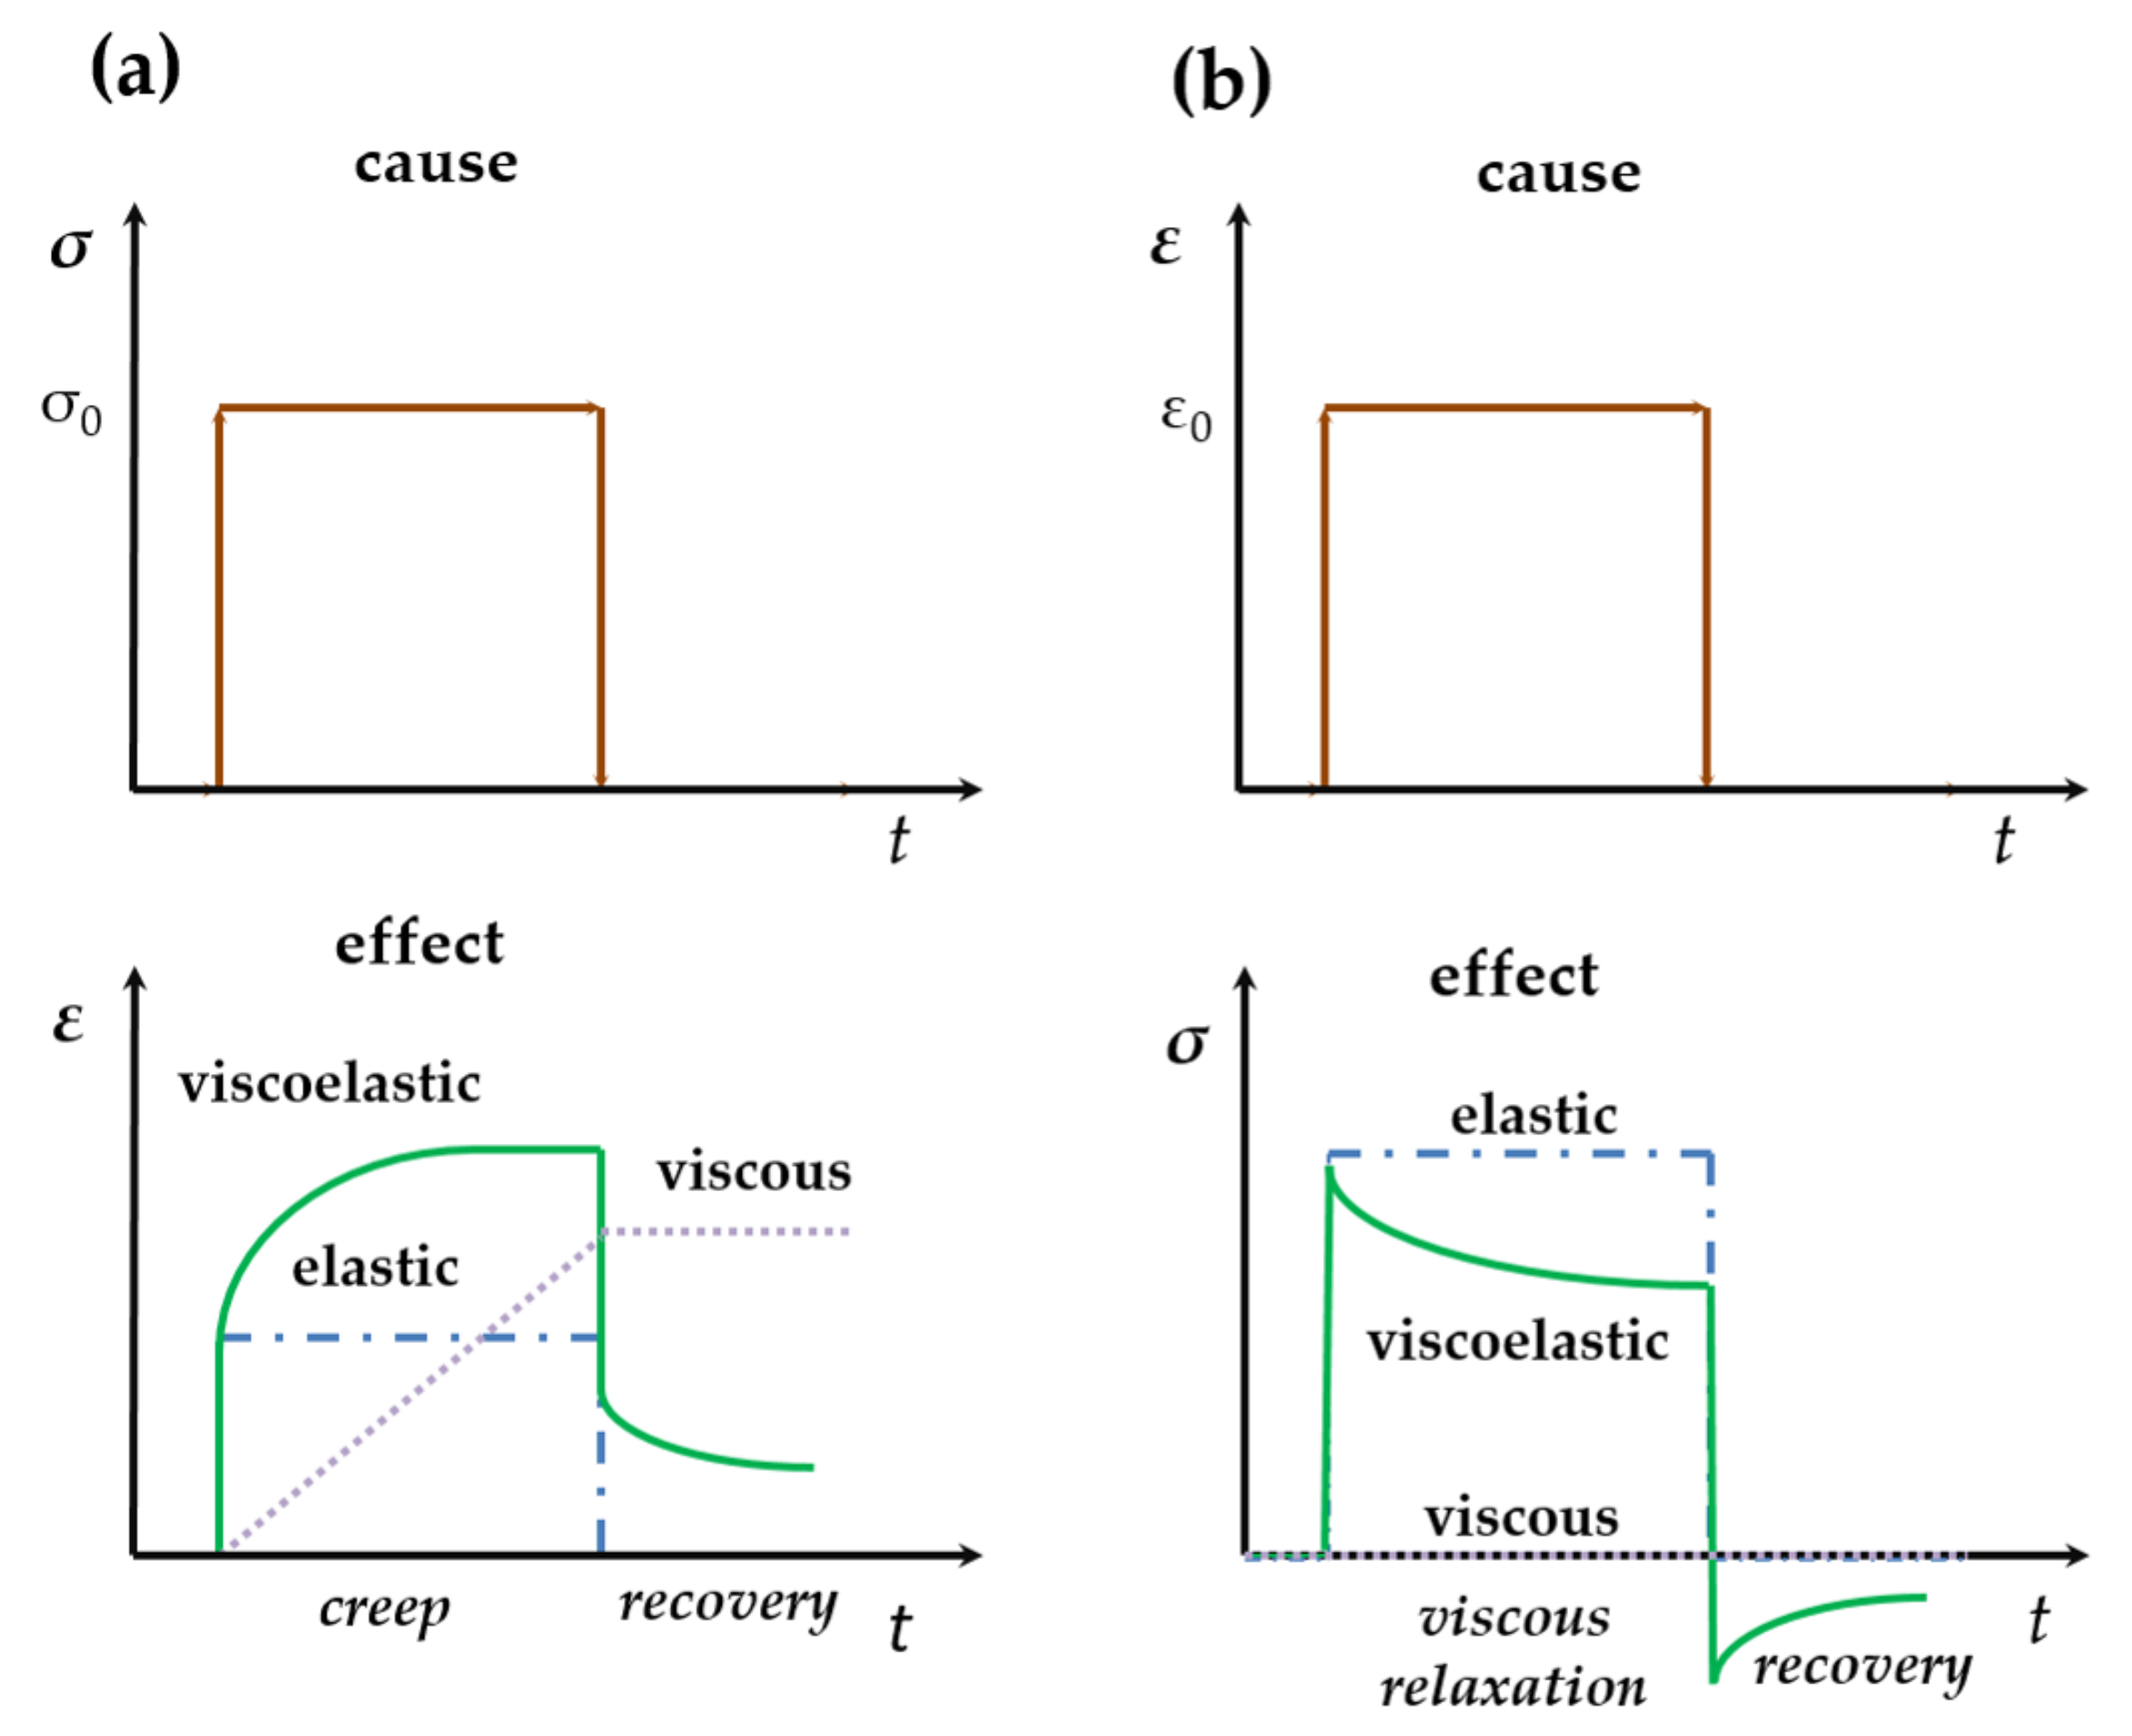
Figure 3.
A setup for testing the ML response under compressive load (a); and a setup for testing ML for a single microparticle (b). Reproduced from Ref [57], Copyright (2012), with permission from Elsevier and Ref [58] with permission of The Royal Society of Chemistry, respectively.
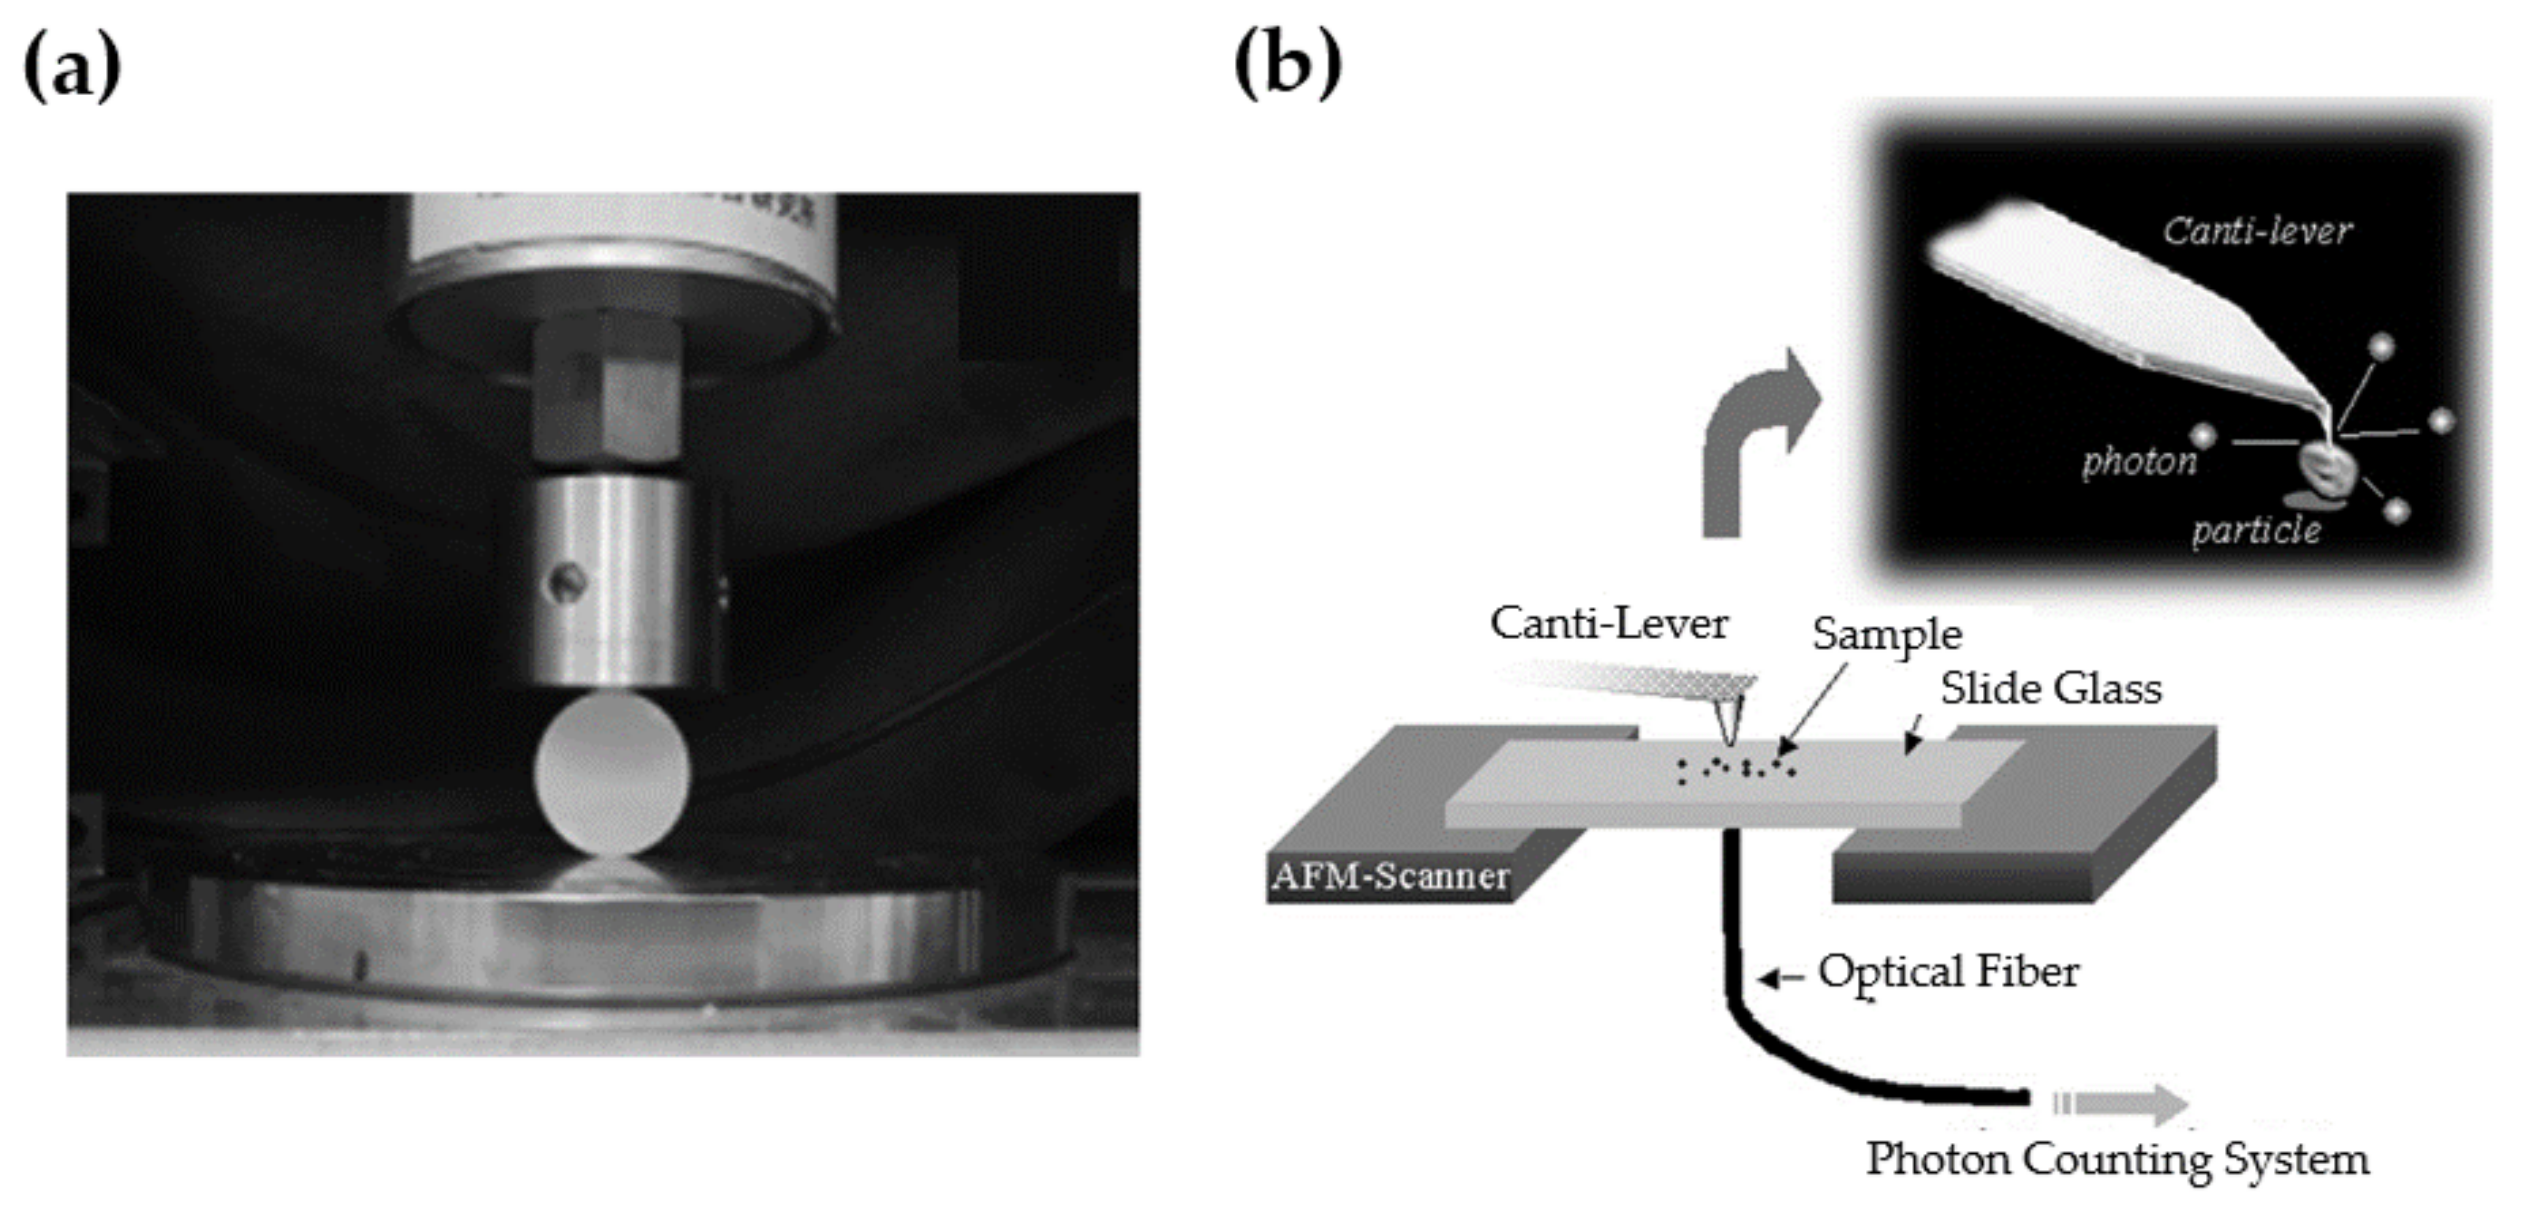
Figure 4.
Crystal structure of ZnS (a) along [00] and crystal structure of CaZnOS (b) as a 2 × 2 × 1 supercell (dashed line) along [001]. Unit cells are outlined by solid lines. (S: yellow, Ca: green, O: red.)
Figure 4.
Crystal structure of ZnS (a) along [00] and crystal structure of CaZnOS (b) as a 2 × 2 × 1 supercell (dashed line) along [001]. Unit cells are outlined by solid lines. (S: yellow, Ca: green, O: red.)
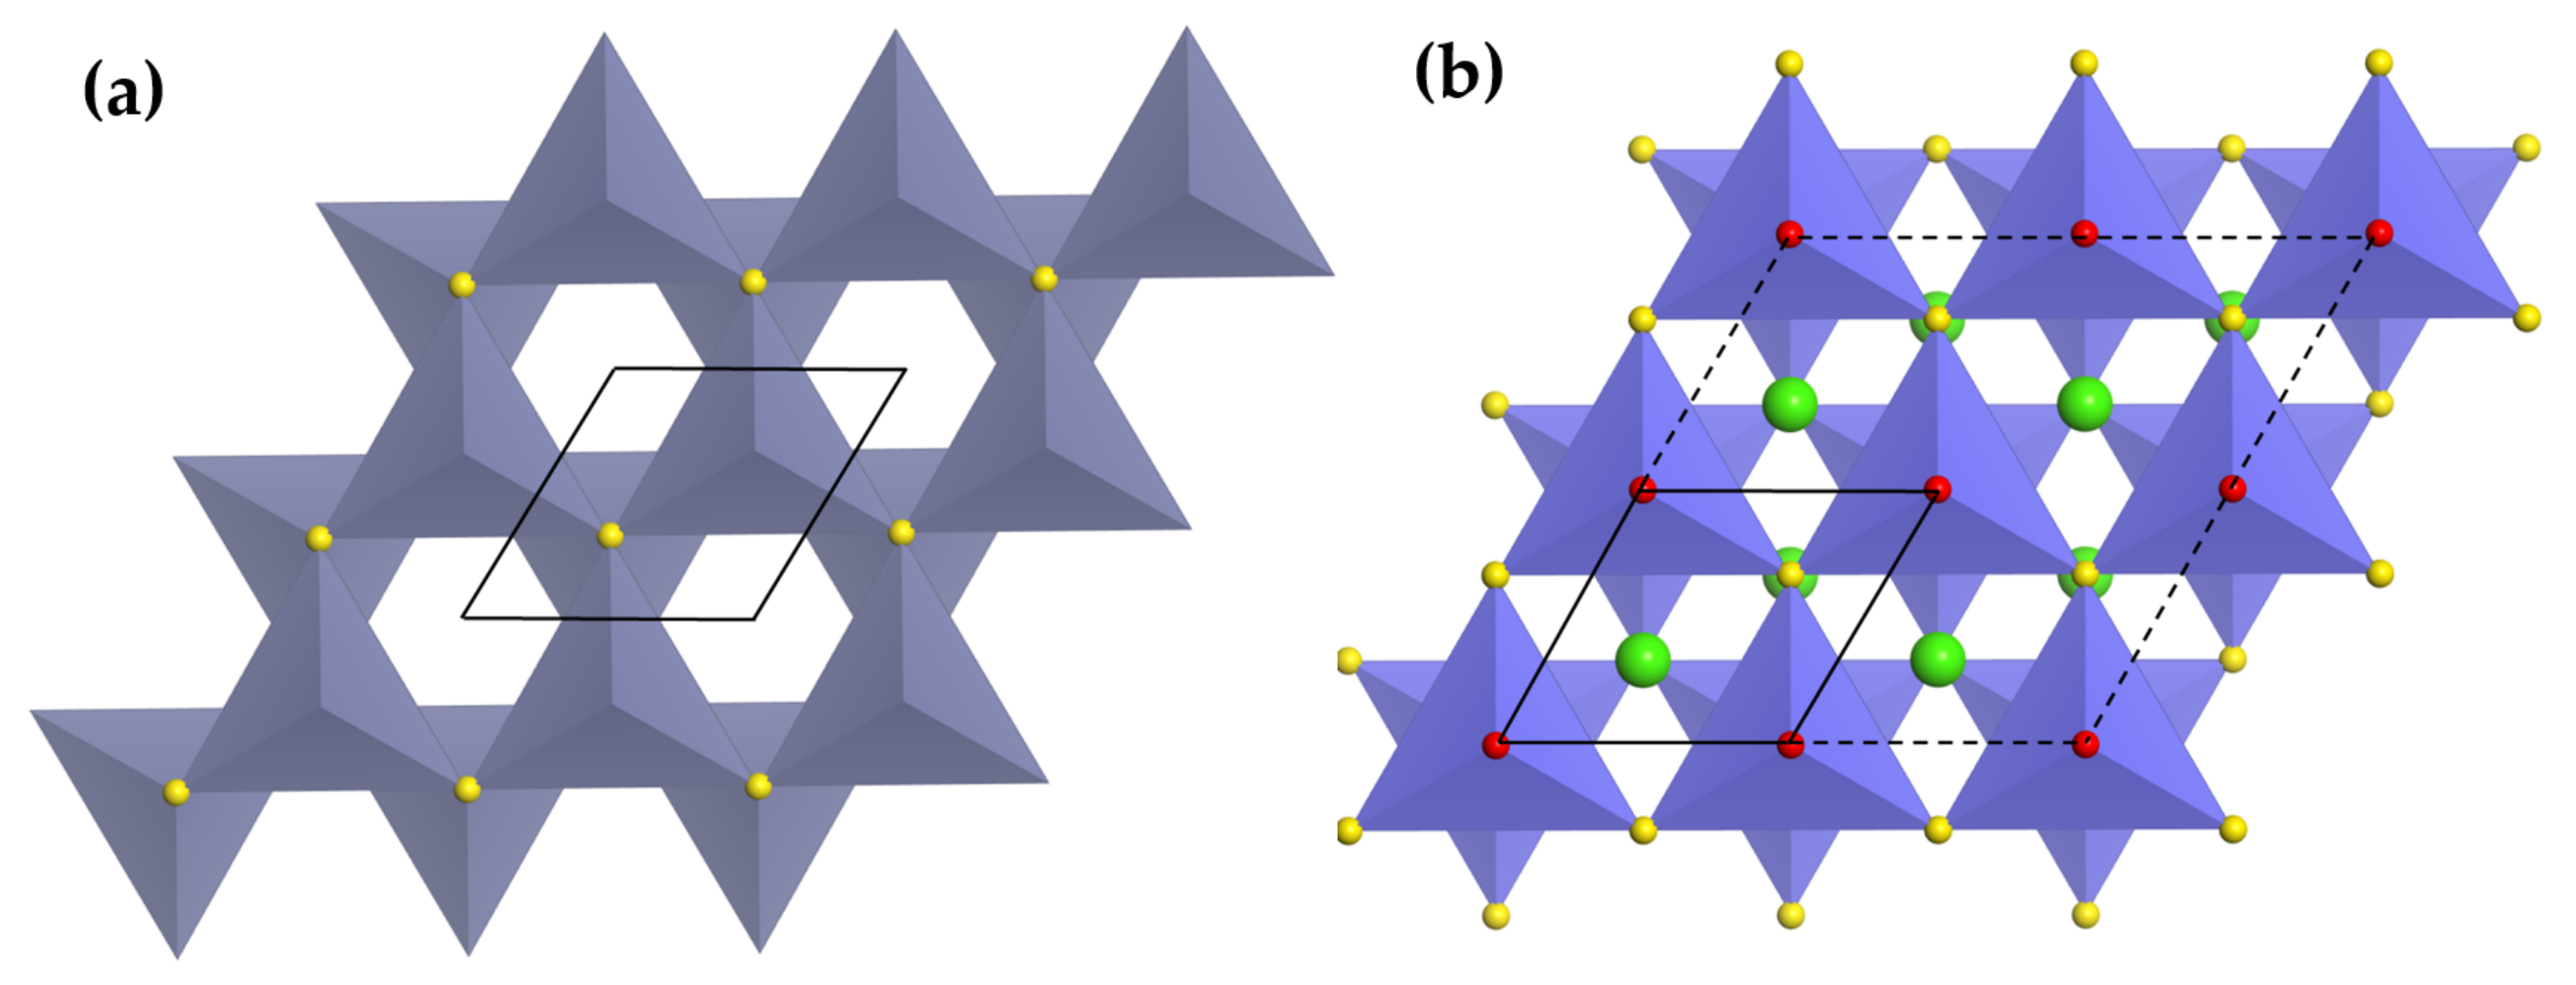
Figure 5.
Structure of tridymite (a) along [001], crystal structure of CaAlO unit cell (b) along [010], crystal structure of SrAlO supercell () (c) along [100], and crystal structure of BaAlO supercell () (d) along [001]. Unit cells are outlined by black lines, and the direction of tetrahedra was marked as U(up) and D (down). (Ca: green, Sr: deep green, Ba: heavy green, O: red.)
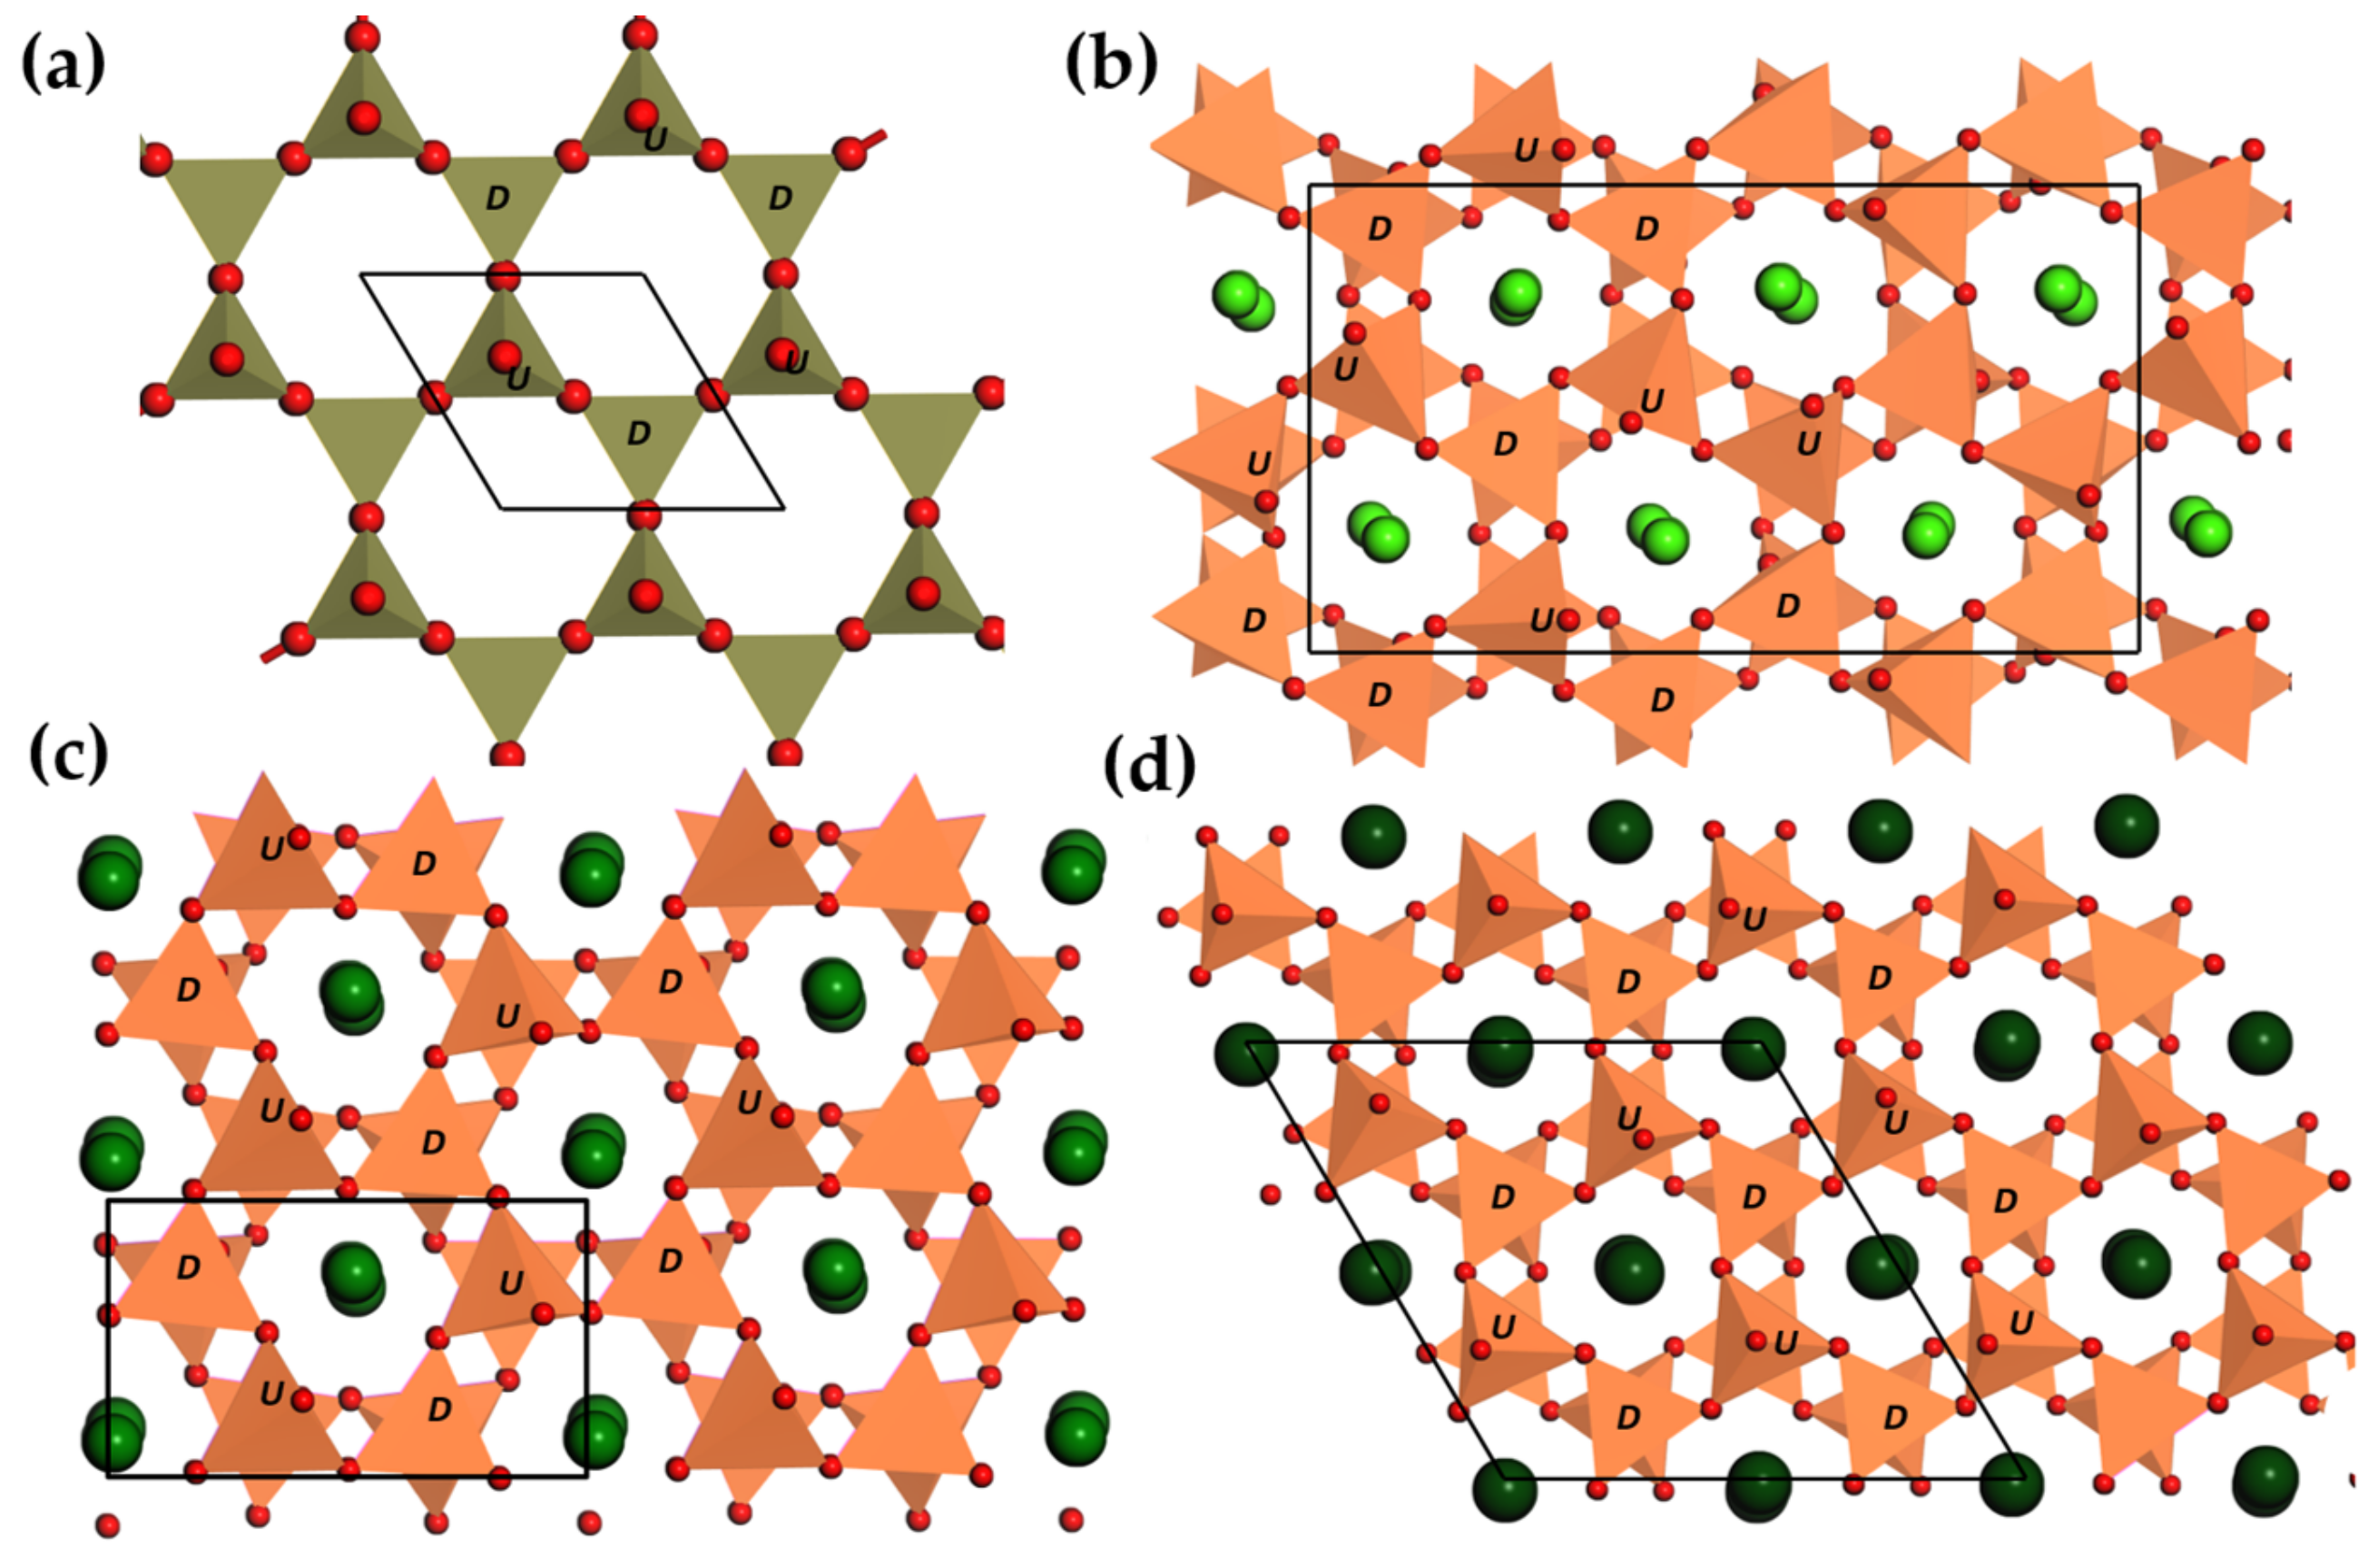
Figure 6.
The structure of CaAlSiO (a) along [001], the structure of SrAlSiO (b) along [001], and the structure of melilite CaMgSiO along [001] (c), and along [100] (d). (Ca: green, Sr: deep green, O: red, [SiO]: earth, [AlO]: brown, [MgO]: deep cayan, [(Al, Si)O]: orange.)
Figure 6.
The structure of CaAlSiO (a) along [001], the structure of SrAlSiO (b) along [001], and the structure of melilite CaMgSiO along [001] (c), and along [100] (d). (Ca: green, Sr: deep green, O: red, [SiO]: earth, [AlO]: brown, [MgO]: deep cayan, [(Al, Si)O]: orange.)
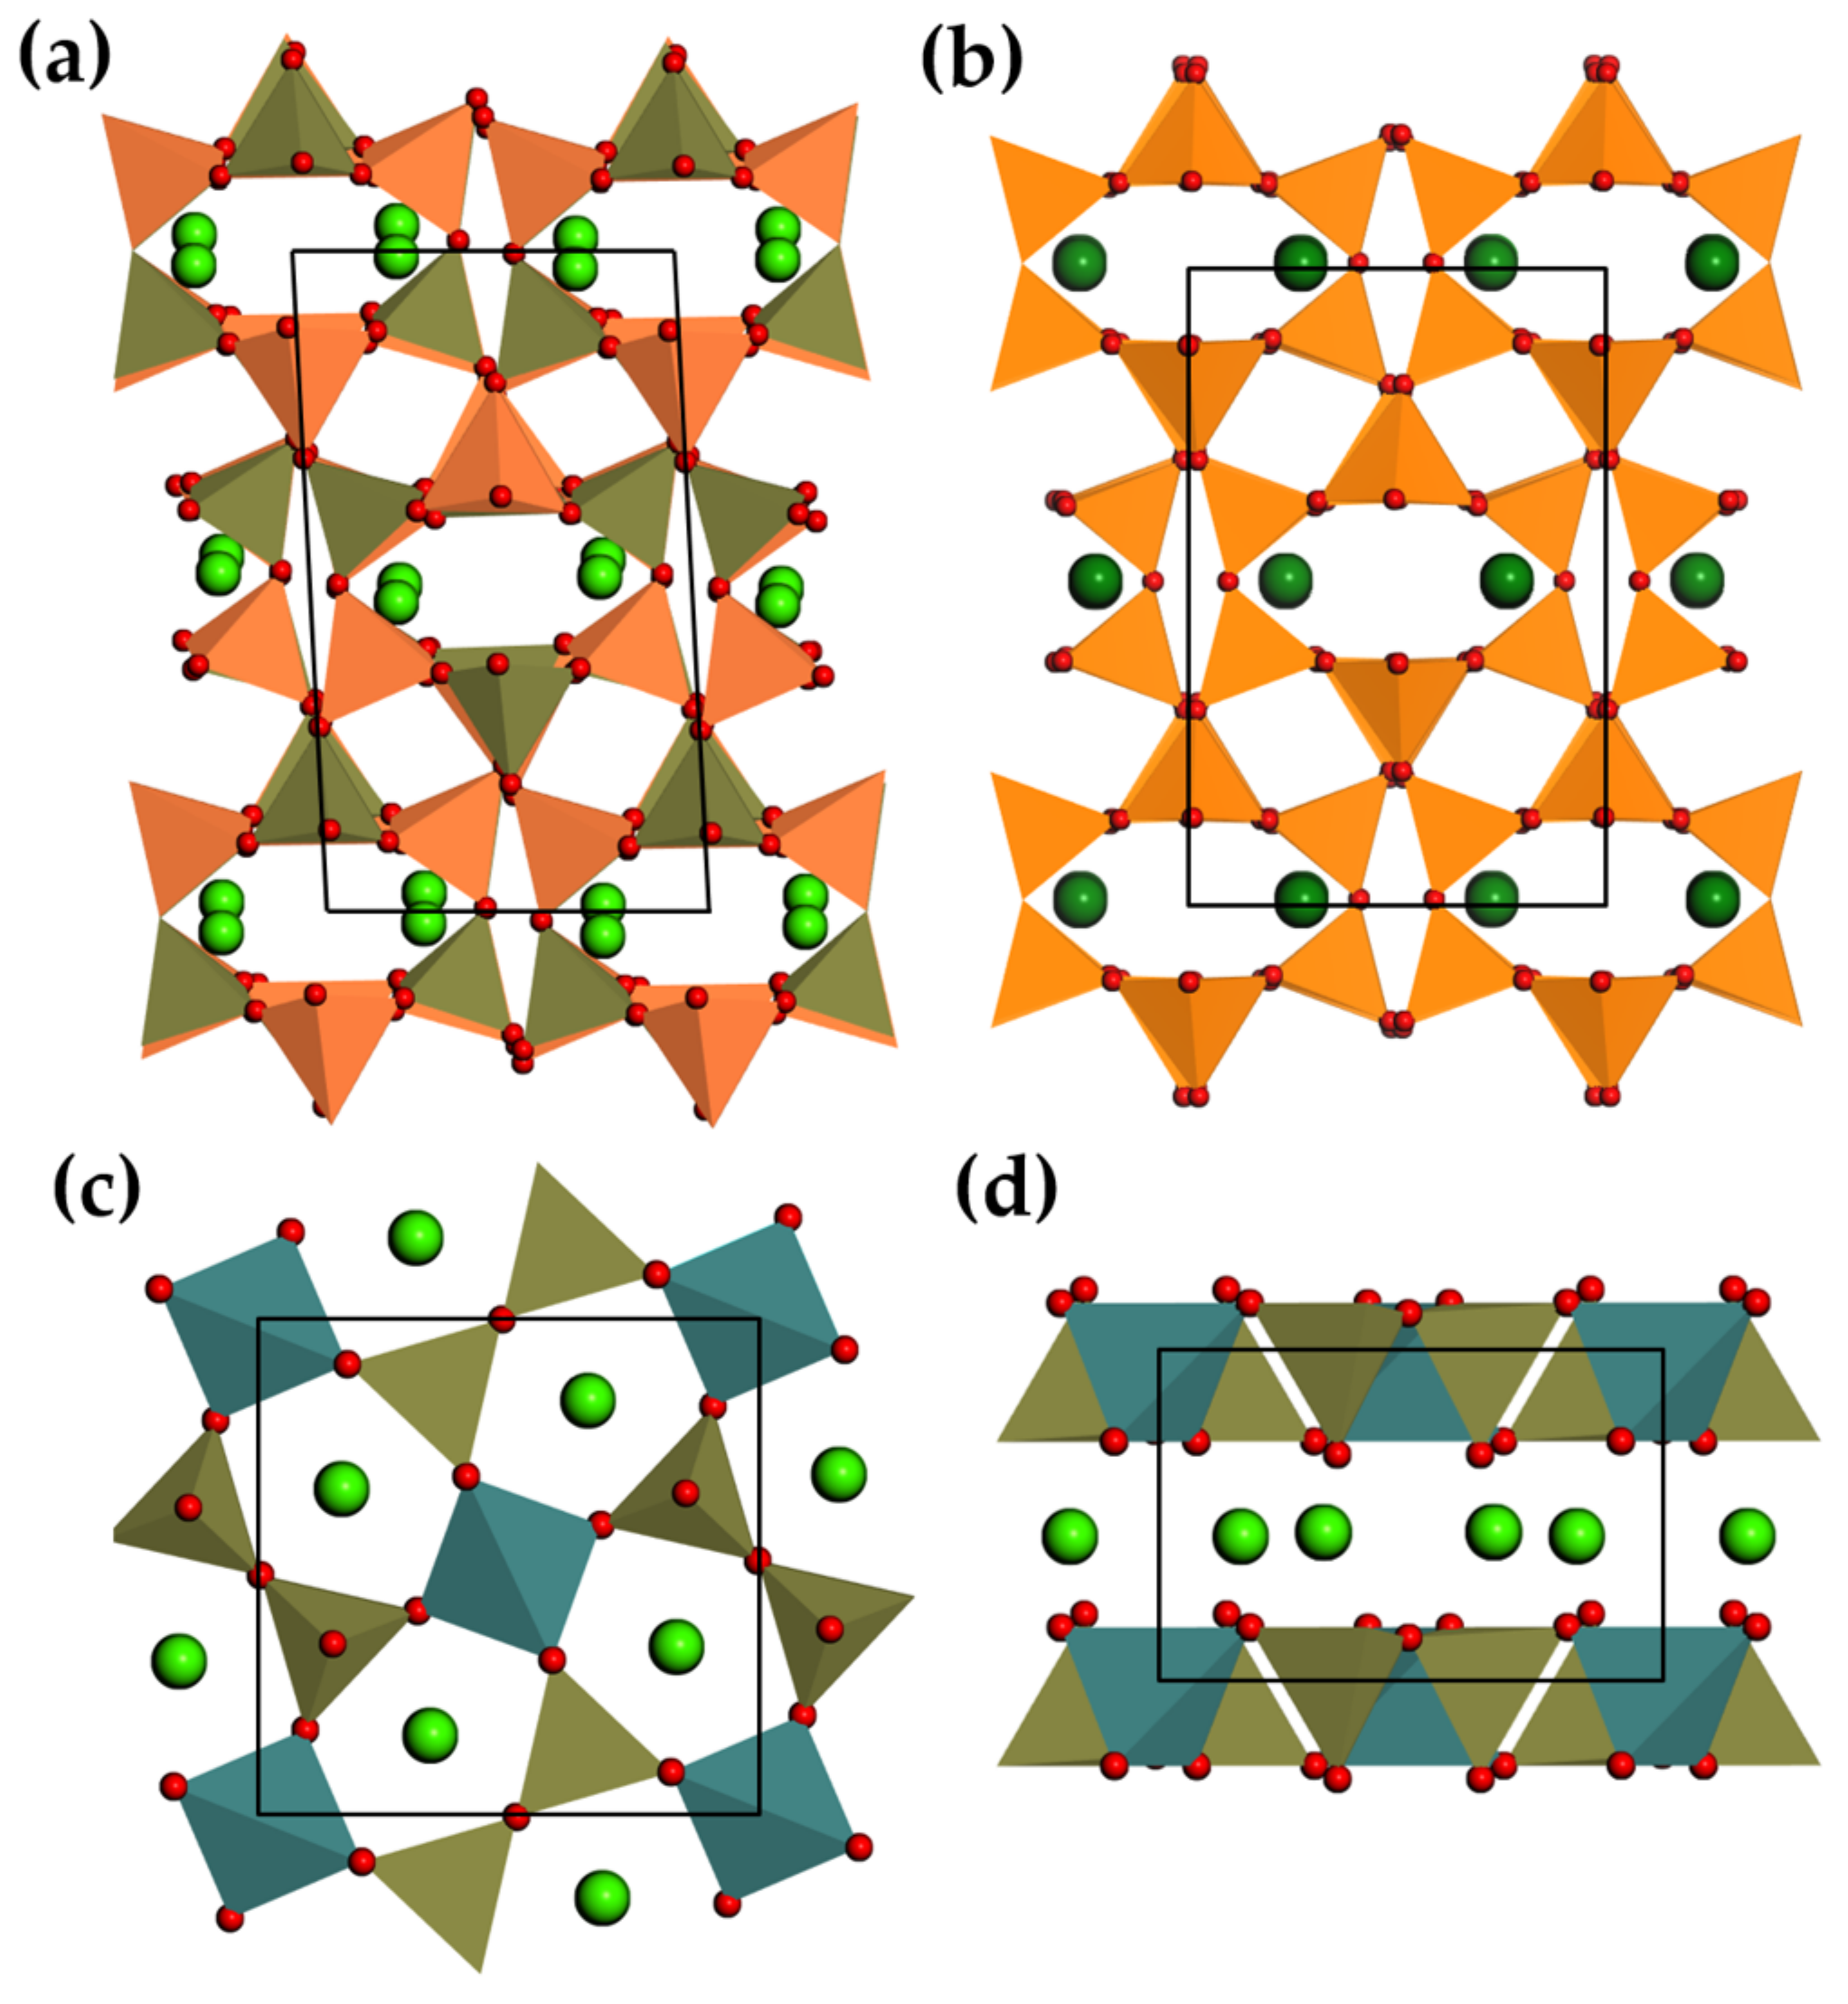
Figure 7.
Crystal structure of Ruddlesden-Popper structures SrSnO (a) viewed along [010], where (i) n = ∞, (ii) n = 1, and (iii) n = 2; crystal structure of calcium niobates mCaO·NbO (b) for (i) m = 1, and (ii) m = 2. Reproduced from Refs [29,183] with the permission of AIP Publishing and Copyright (2016) American Chemical Society, respectively.

Figure 8.
The crystal structure (top), silicate layers along [100] (middle) and cation coordination (bottom) in CaSiON (a); SrSiON (b); and BaSiON (c). Tetrahedra with vertices up and down are depicted in dark gray, and in light respectively (N: black, O: light gray). Reproduced from Ref [241], Copyright (2009), with permission from Elsevier.

Figure 9.
The order parameter—internal strain , and ML intensity data (deep green) as a function of Sr content in CaSrAlSiO series. Reproduced from Refs [170,216] with permission from Mineralogical Society of America and Copyright 2010, The Electrochemical Society, respectively.
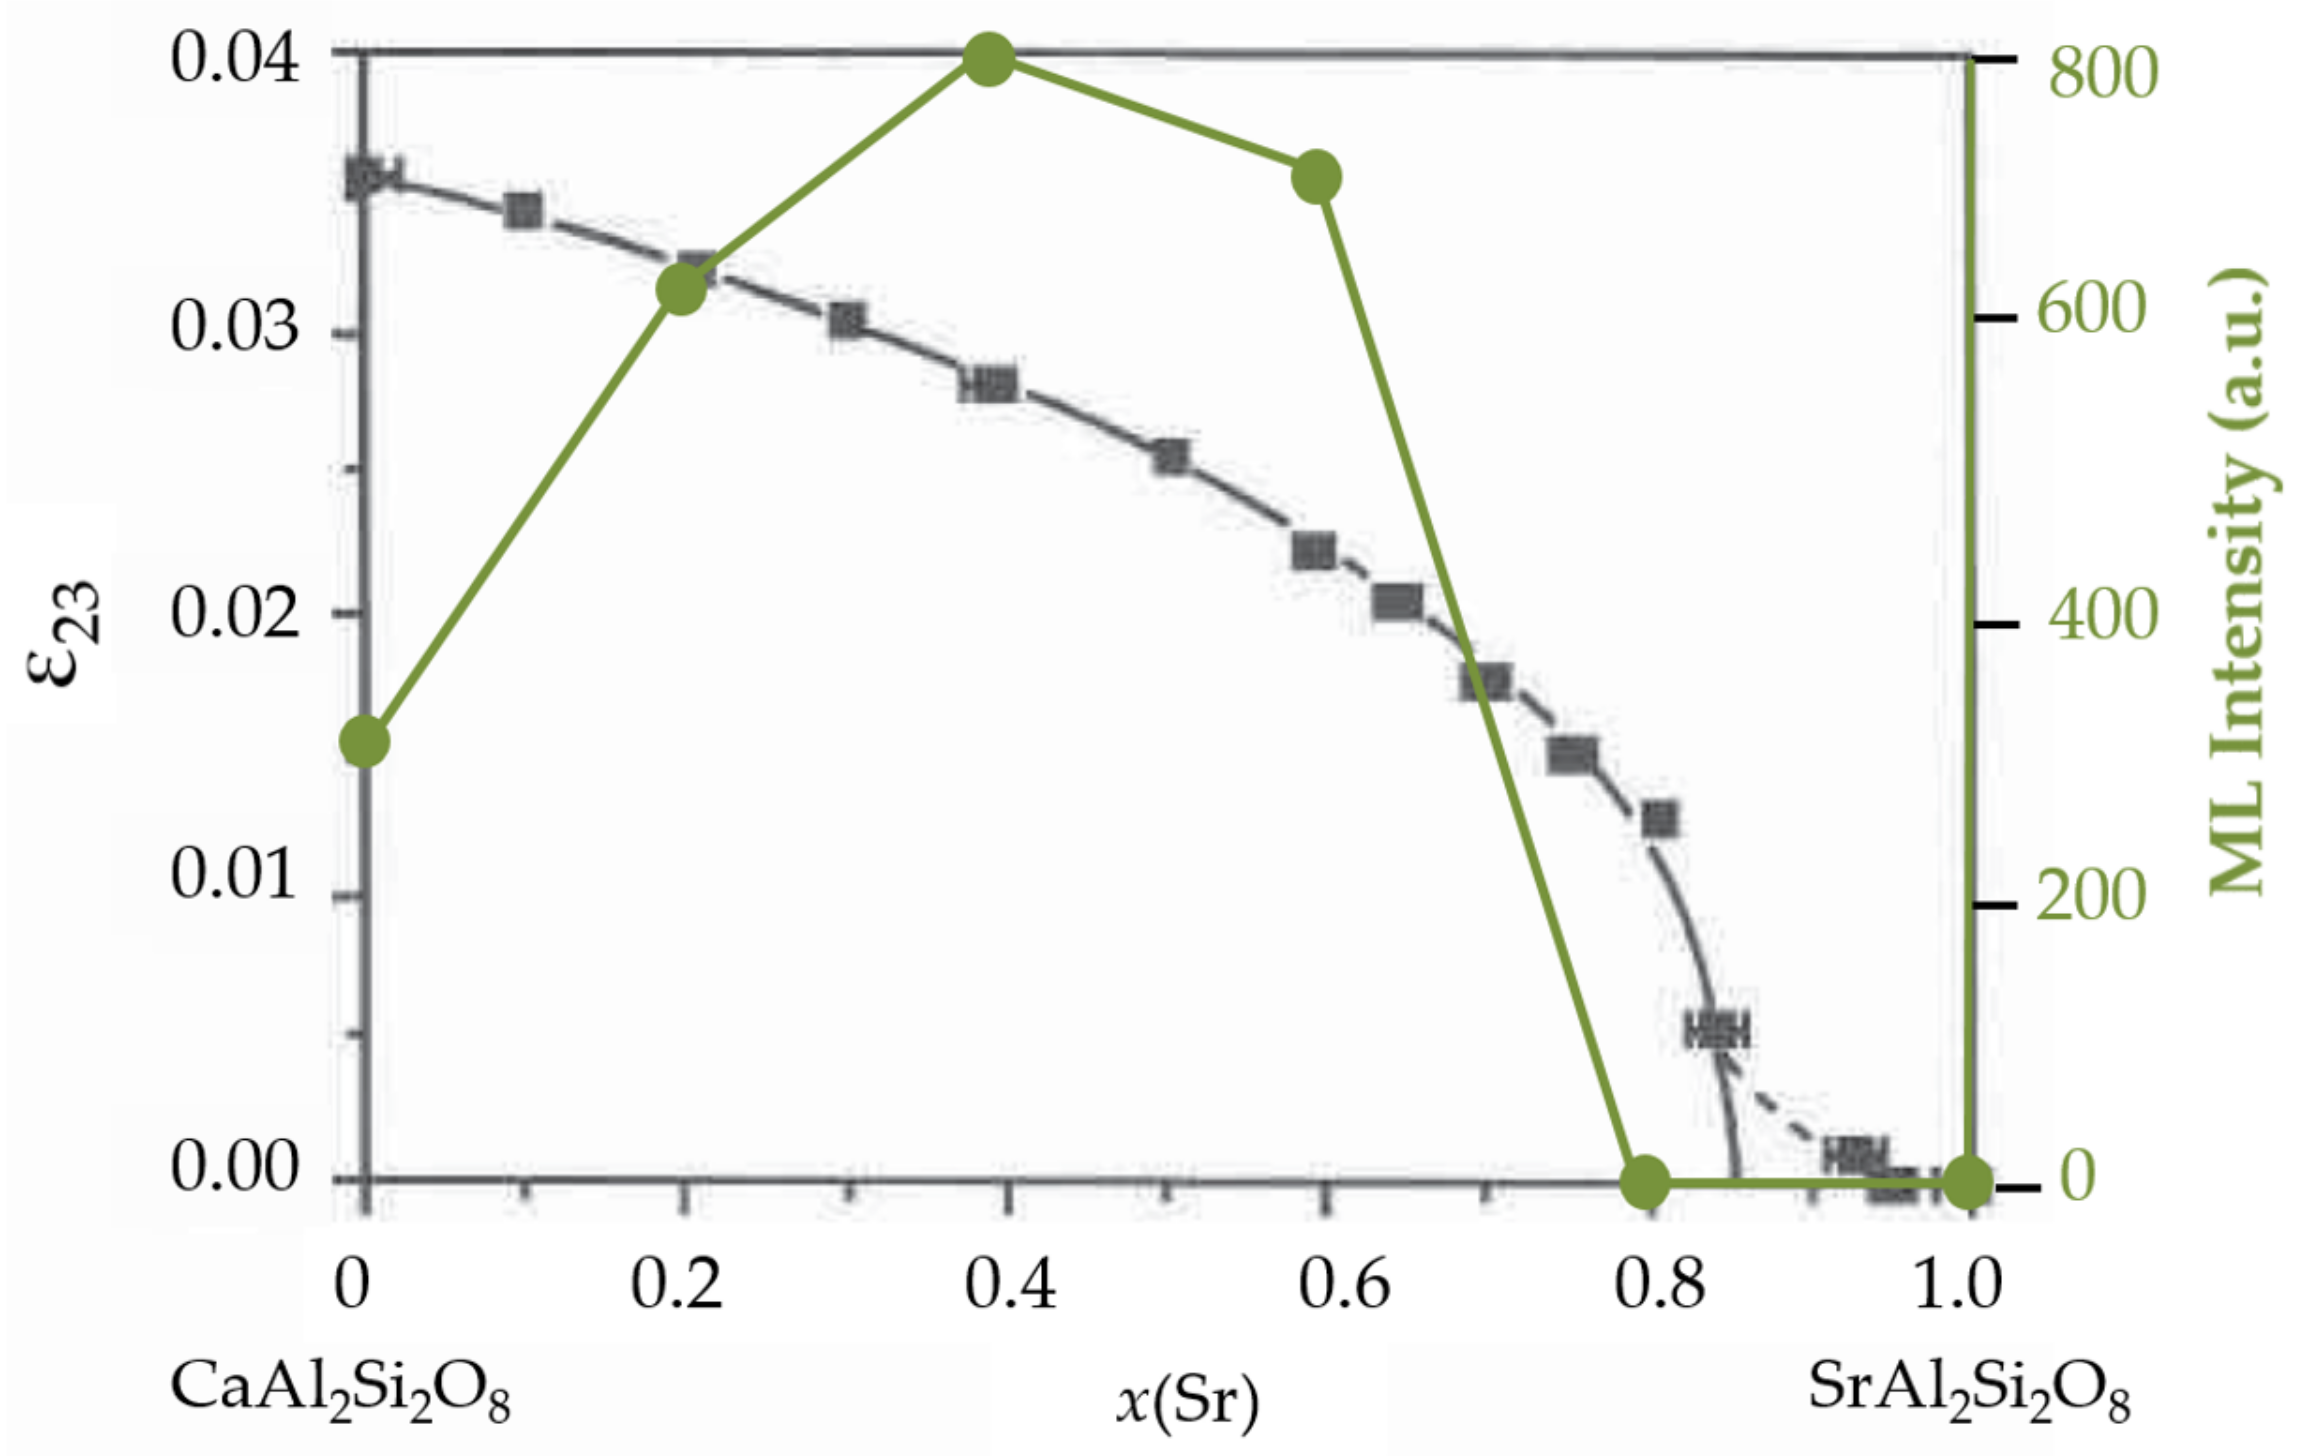
Figure 10.
Part of the cation subset along [001] (a), the nearest neighbors of the Eu dimer (b) in NaEuOMoO, and (c) the lifetime of levels as a function of relative amount of Eu clusters at 77 K and 293 K. (In (a), Eu: dark, Na: light blue, vacancies: white, Eu-Eu: yellow, different cation distribution in adjacent cells: red box.) Reproduced from Ref [283] with permission of The Royal Society of Chemistry.
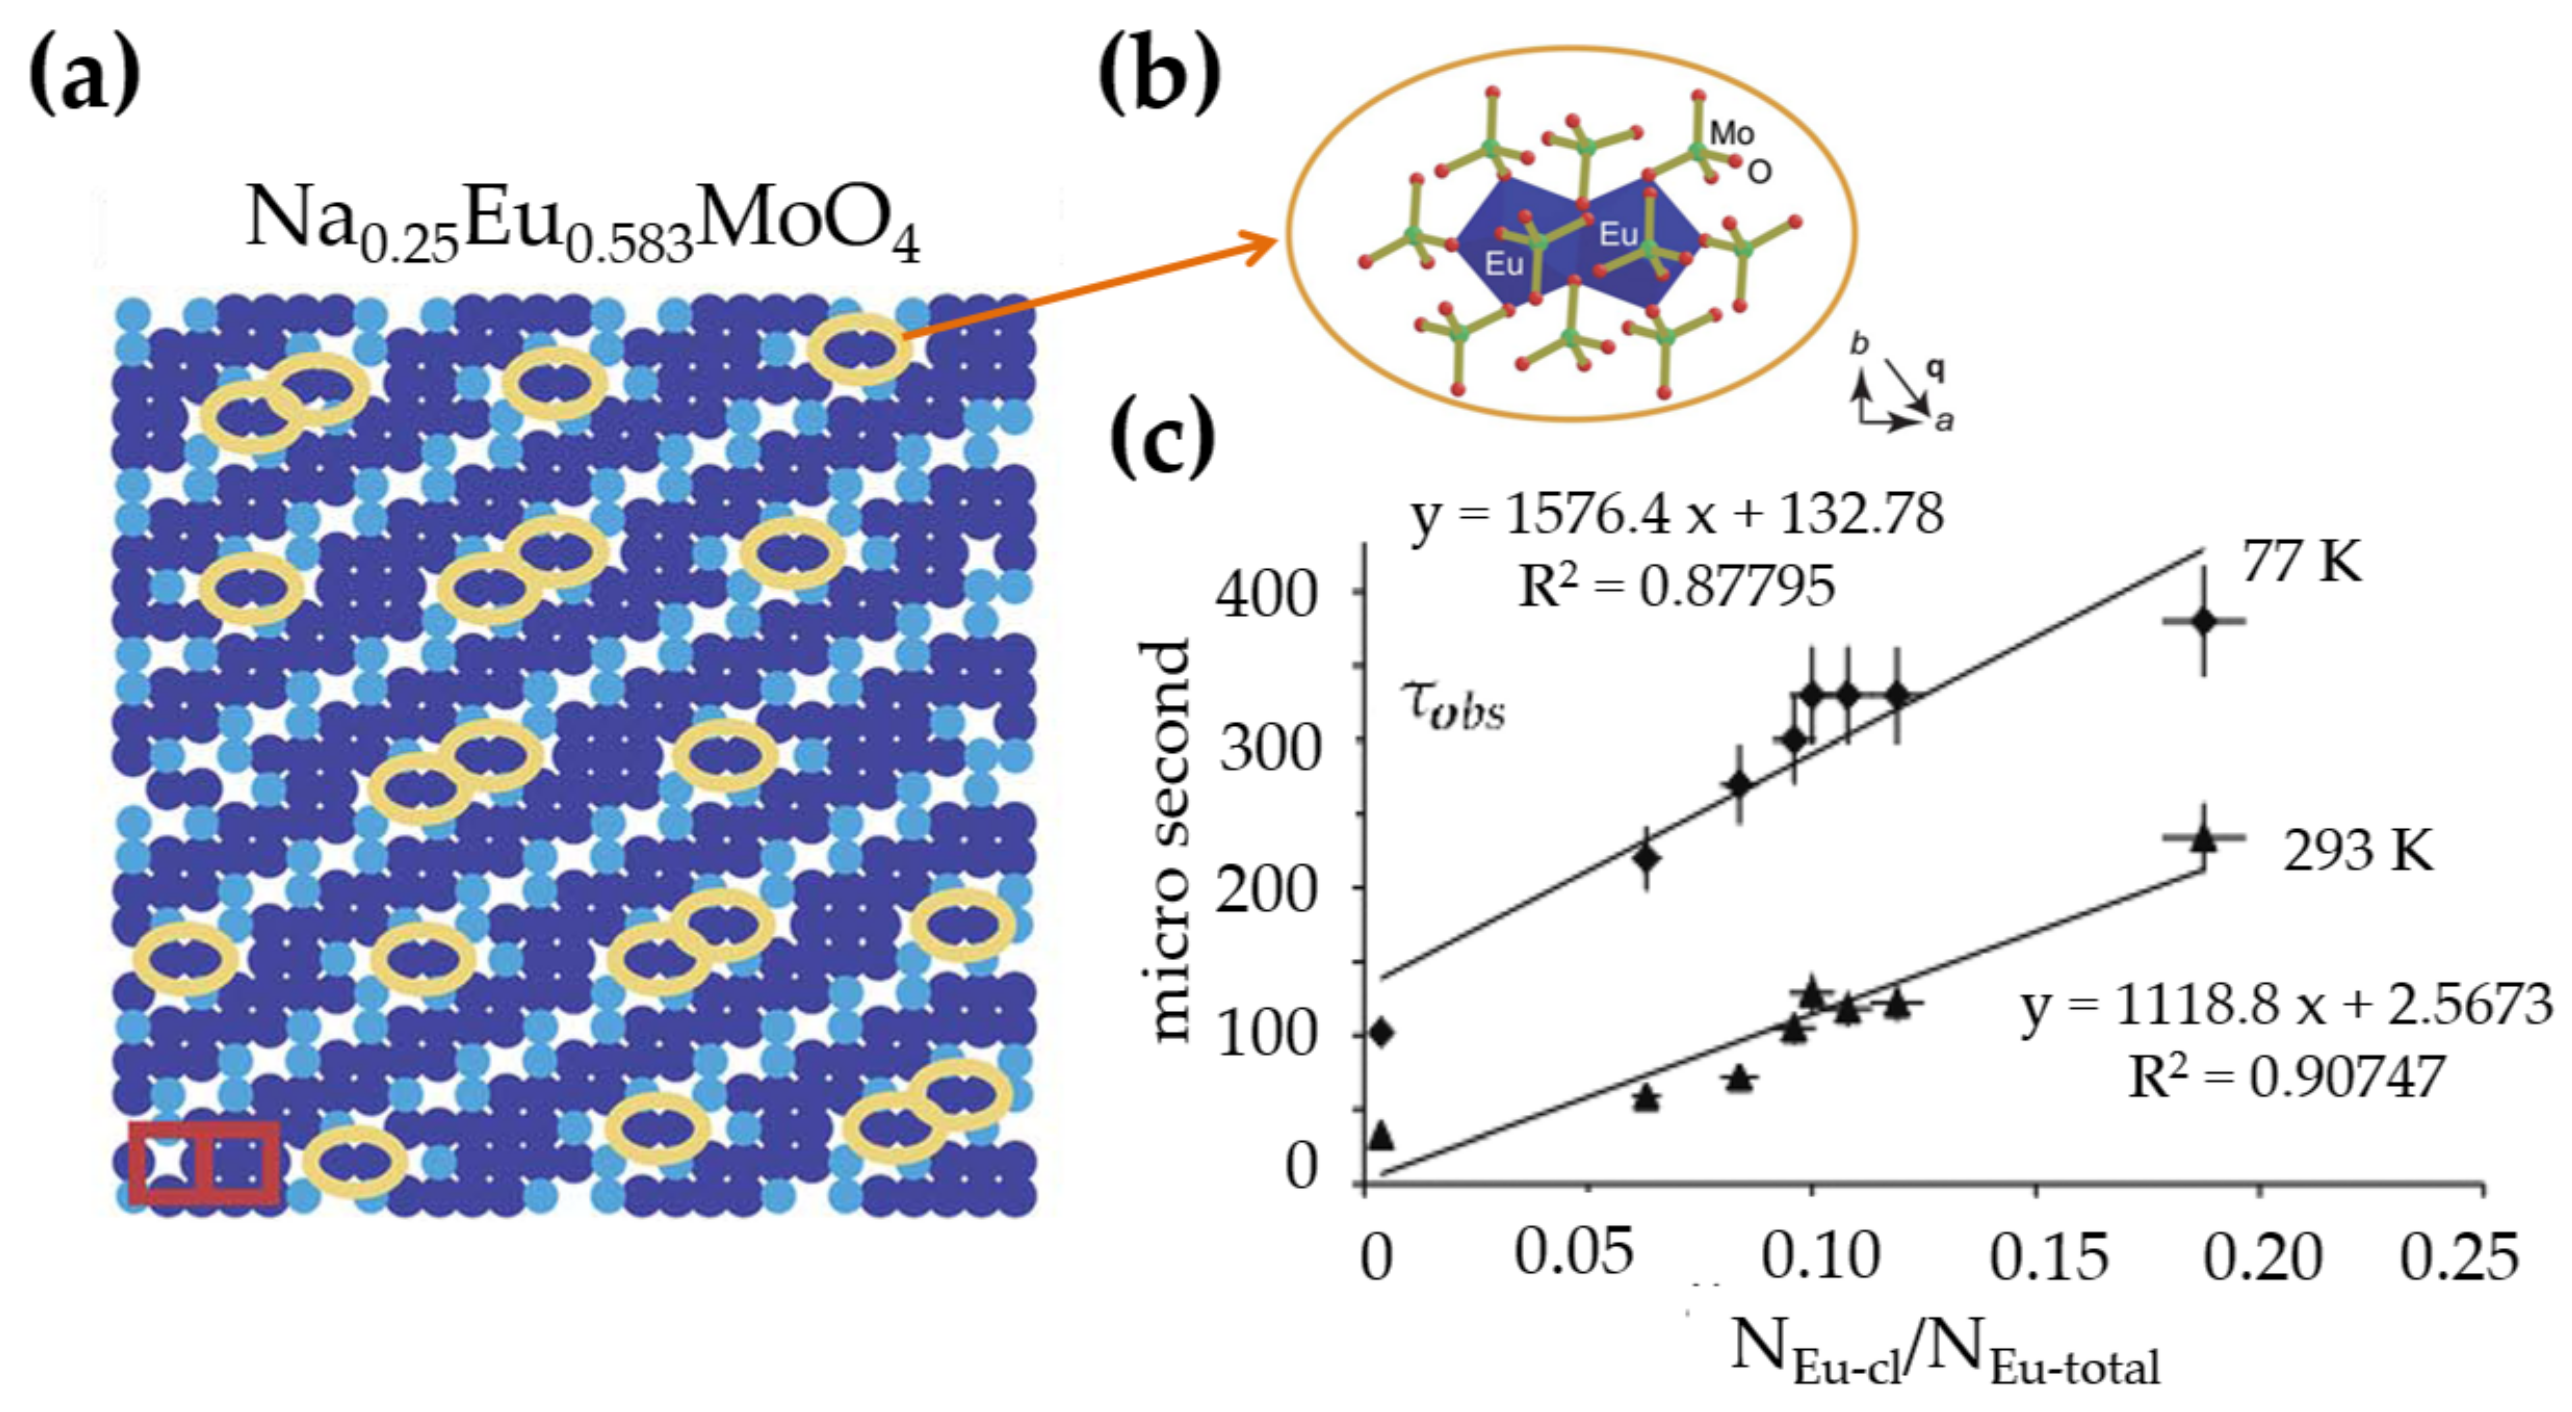
Figure 11.
Vacuum referred (VRBE) and host referred (HRBE) binding energy of lanthanides R (R = Eu(red), Eu(black and orange), Dy(pink), Dy(purple)) and oxygen vacancies levels (green) with respect to the valence band of SrAlO host, with all R being assumed to occupy the Sr1 site. Energy unit is eV. Reproduced with permission from Ref [92] Copyright (2006) American Chemical Society and from Ref [288] Copyright (2014) American Physical Society .

Figure 12.
(a) The ML intensity and applied load for two different loading rates; and (b) their comparison with calculated results (colour line) where the inset shows boundaries of m and for downward convexity of ML. Reproduced from Ref [308], with permission. © 2009 Optical Society of America.
Figure 12.
(a) The ML intensity and applied load for two different loading rates; and (b) their comparison with calculated results (colour line) where the inset shows boundaries of m and for downward convexity of ML. Reproduced from Ref [308], with permission. © 2009 Optical Society of America.
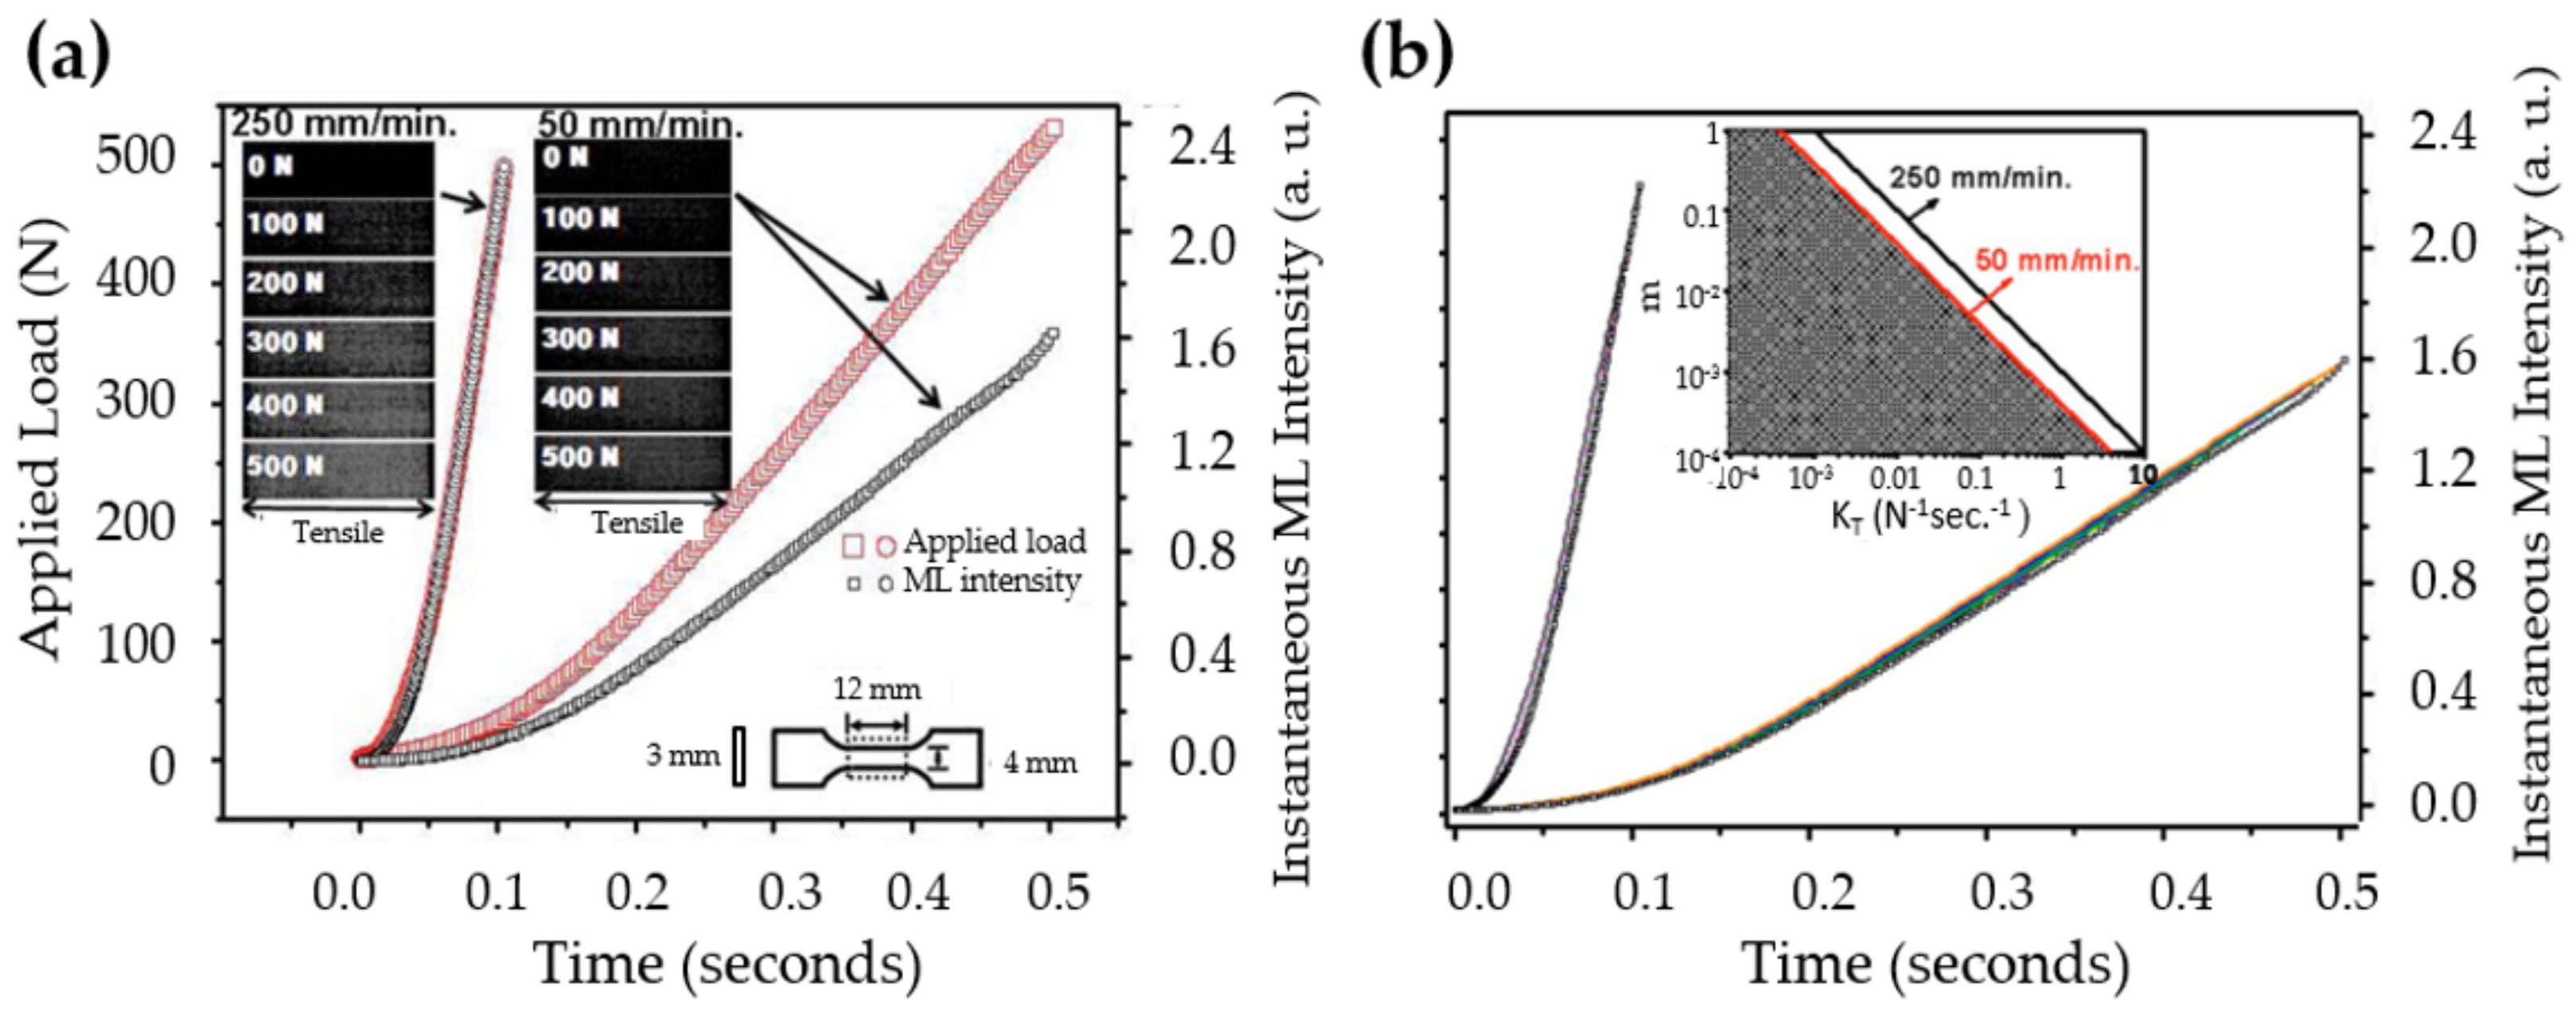
Figure 13.
(a) Fitting of the ML intensity with a model with loading frequency of 5 Hz (the inset shows the corresponding FFT results), and the hysteresis loops (b) at various frequencies (1–5 Hz) of SrAlO:Eu/Dy composites. Reproduced from Ref [314], with permission. © 2014 Optical Society of America.
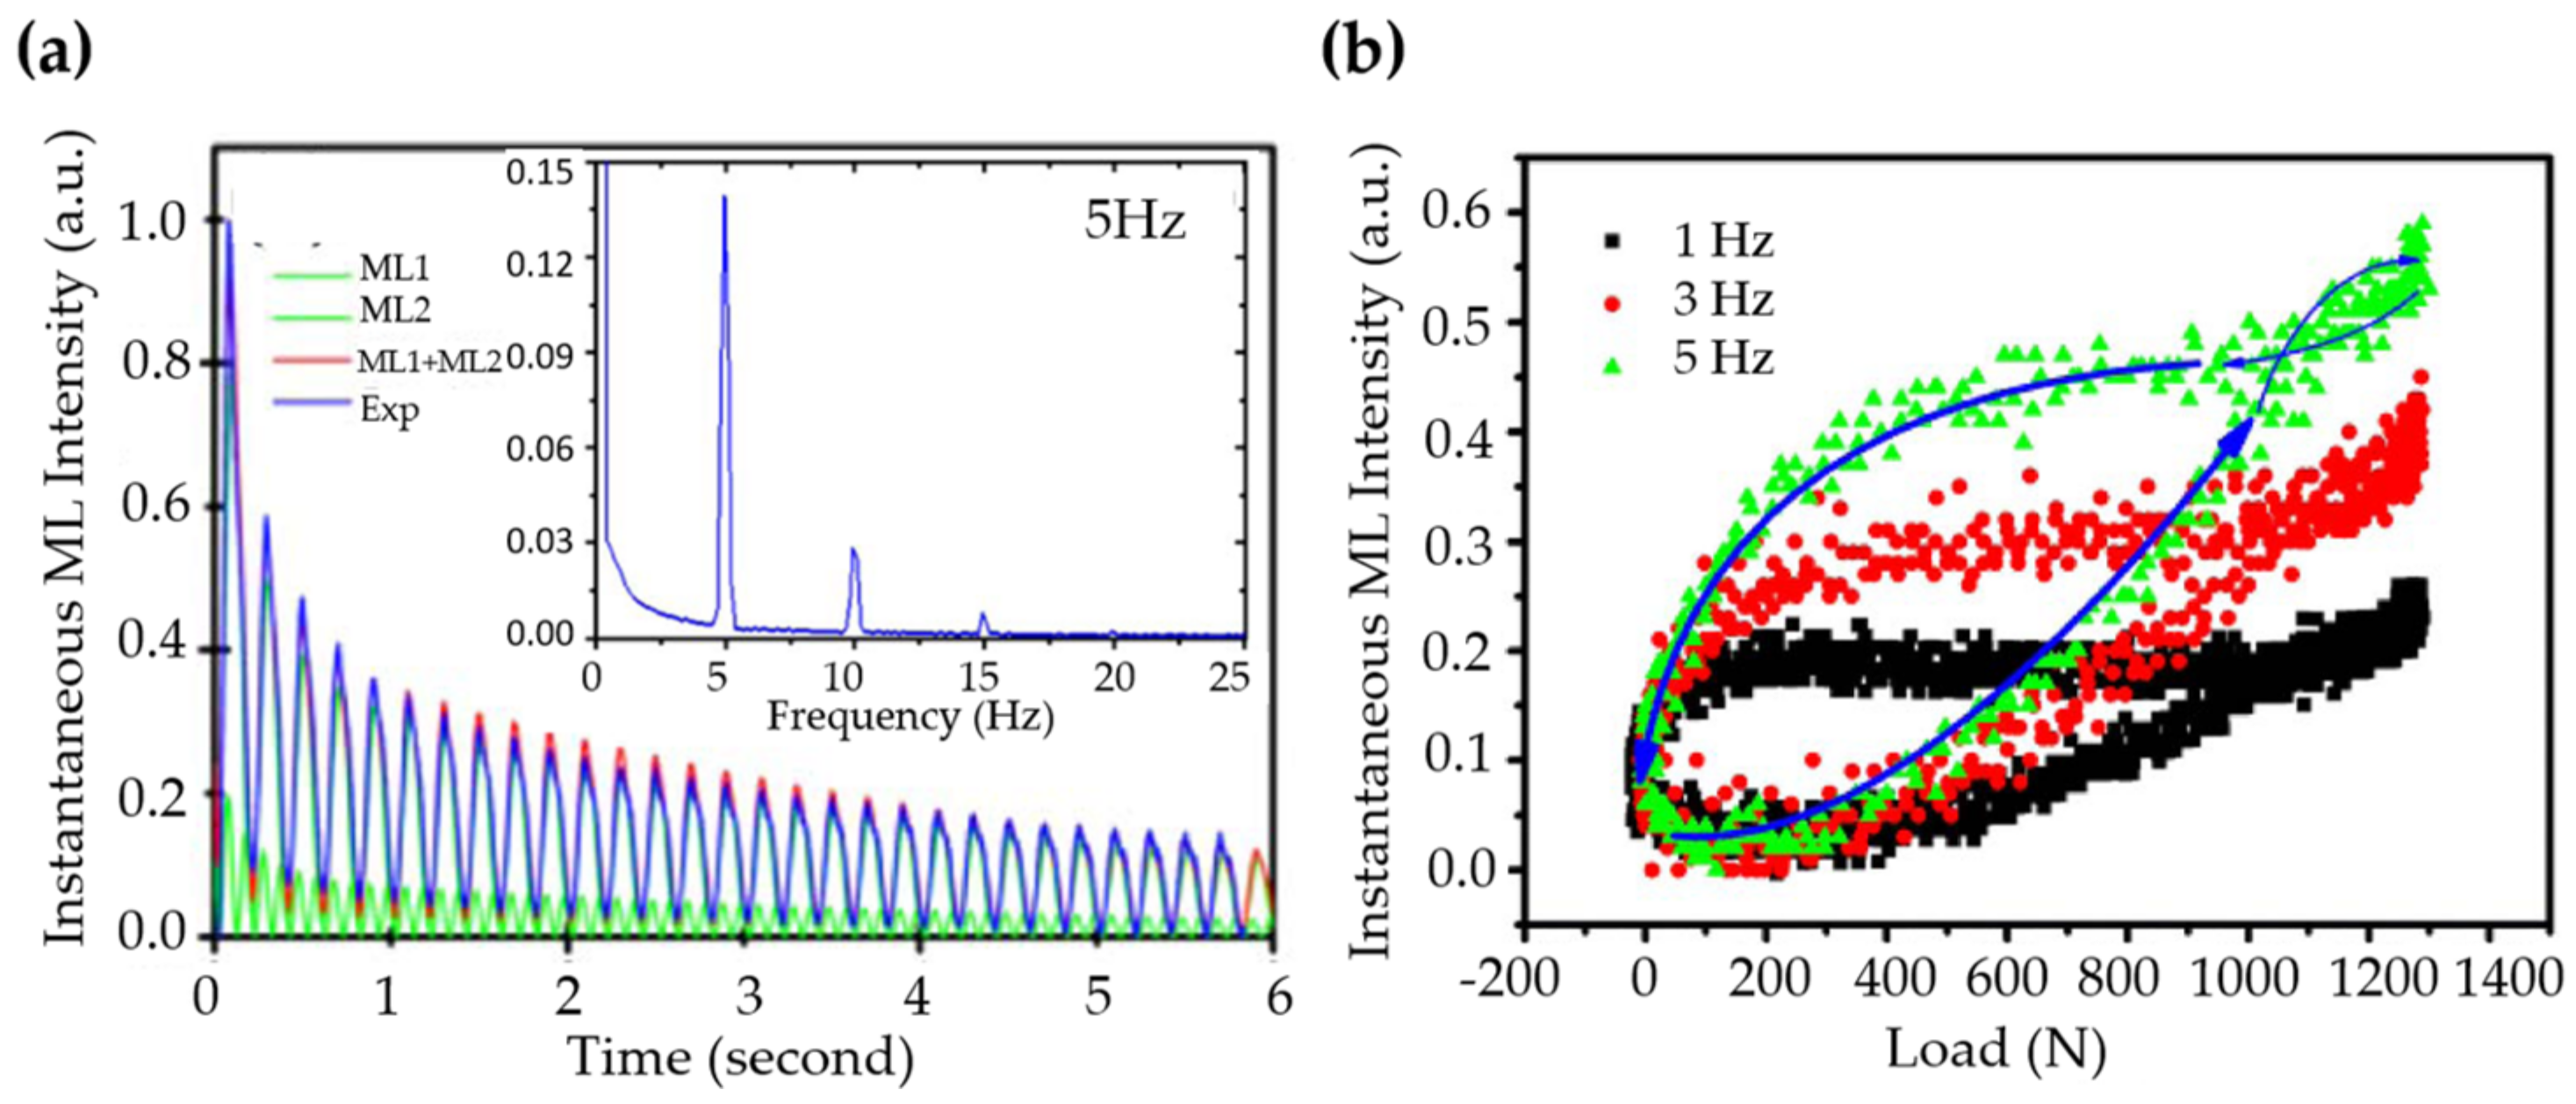
Figure 14.
ML intensity (top, blue circles) for varying loads (bottom, green) without (a) and with (b) holding at maximum loading for some time in the glass composite containing SrAlO: Eu, Dy, and their fitting by the model (top, red lines). Reproduced from Ref [315], with the permission of AIP Publishing.

Figure 15.
Snapshots of a domain boundary (a) in SrAlO: Eu during nano-indentation, and the schematic diagram (b) showing the proposed mechanism. Reproduced from Ref [30], Copyright (2013), with permission from Elsevier.
Figure 15.
Snapshots of a domain boundary (a) in SrAlO: Eu during nano-indentation, and the schematic diagram (b) showing the proposed mechanism. Reproduced from Ref [30], Copyright (2013), with permission from Elsevier.

Figure 16.
Schematic diagram (a) depicted the ML induced by movement of dislocation, and the ML intensity (b) as a function of square of pressure of KBr and KCl (A, B indicate their elastic limit and red rectangle in the insect indicates the load history). Reproduced from Ref [330], Copyright (2010), with permission from Elsevier and Ref [66], Copyright (1982), with permission from Elsevier, respectively.

Figure 17.
Digital Image of ML (a) in the vicinity of the crack tip of a compact tension specimen under a load of 61 N (rate: 80 N/s) where white arrows show the load manner, and its comparison (b) (isostress contour lines (black)) with theoretical calculations (white line). Reproduced from Ref [19], Copyright (2013), with permission from Elsevier.

Figure 18.
Health monitoring at a bridge in use with full view (a) by attaching ML sheet type sensor (b) to the original concrete girder surface (c) (dotted line), and the ML integral image using the historical-log recording system (d). © 2013 IEEE. Reprinted, with permission from Ref [337].
Figure 18.
Health monitoring at a bridge in use with full view (a) by attaching ML sheet type sensor (b) to the original concrete girder surface (c) (dotted line), and the ML integral image using the historical-log recording system (d). © 2013 IEEE. Reprinted, with permission from Ref [337].
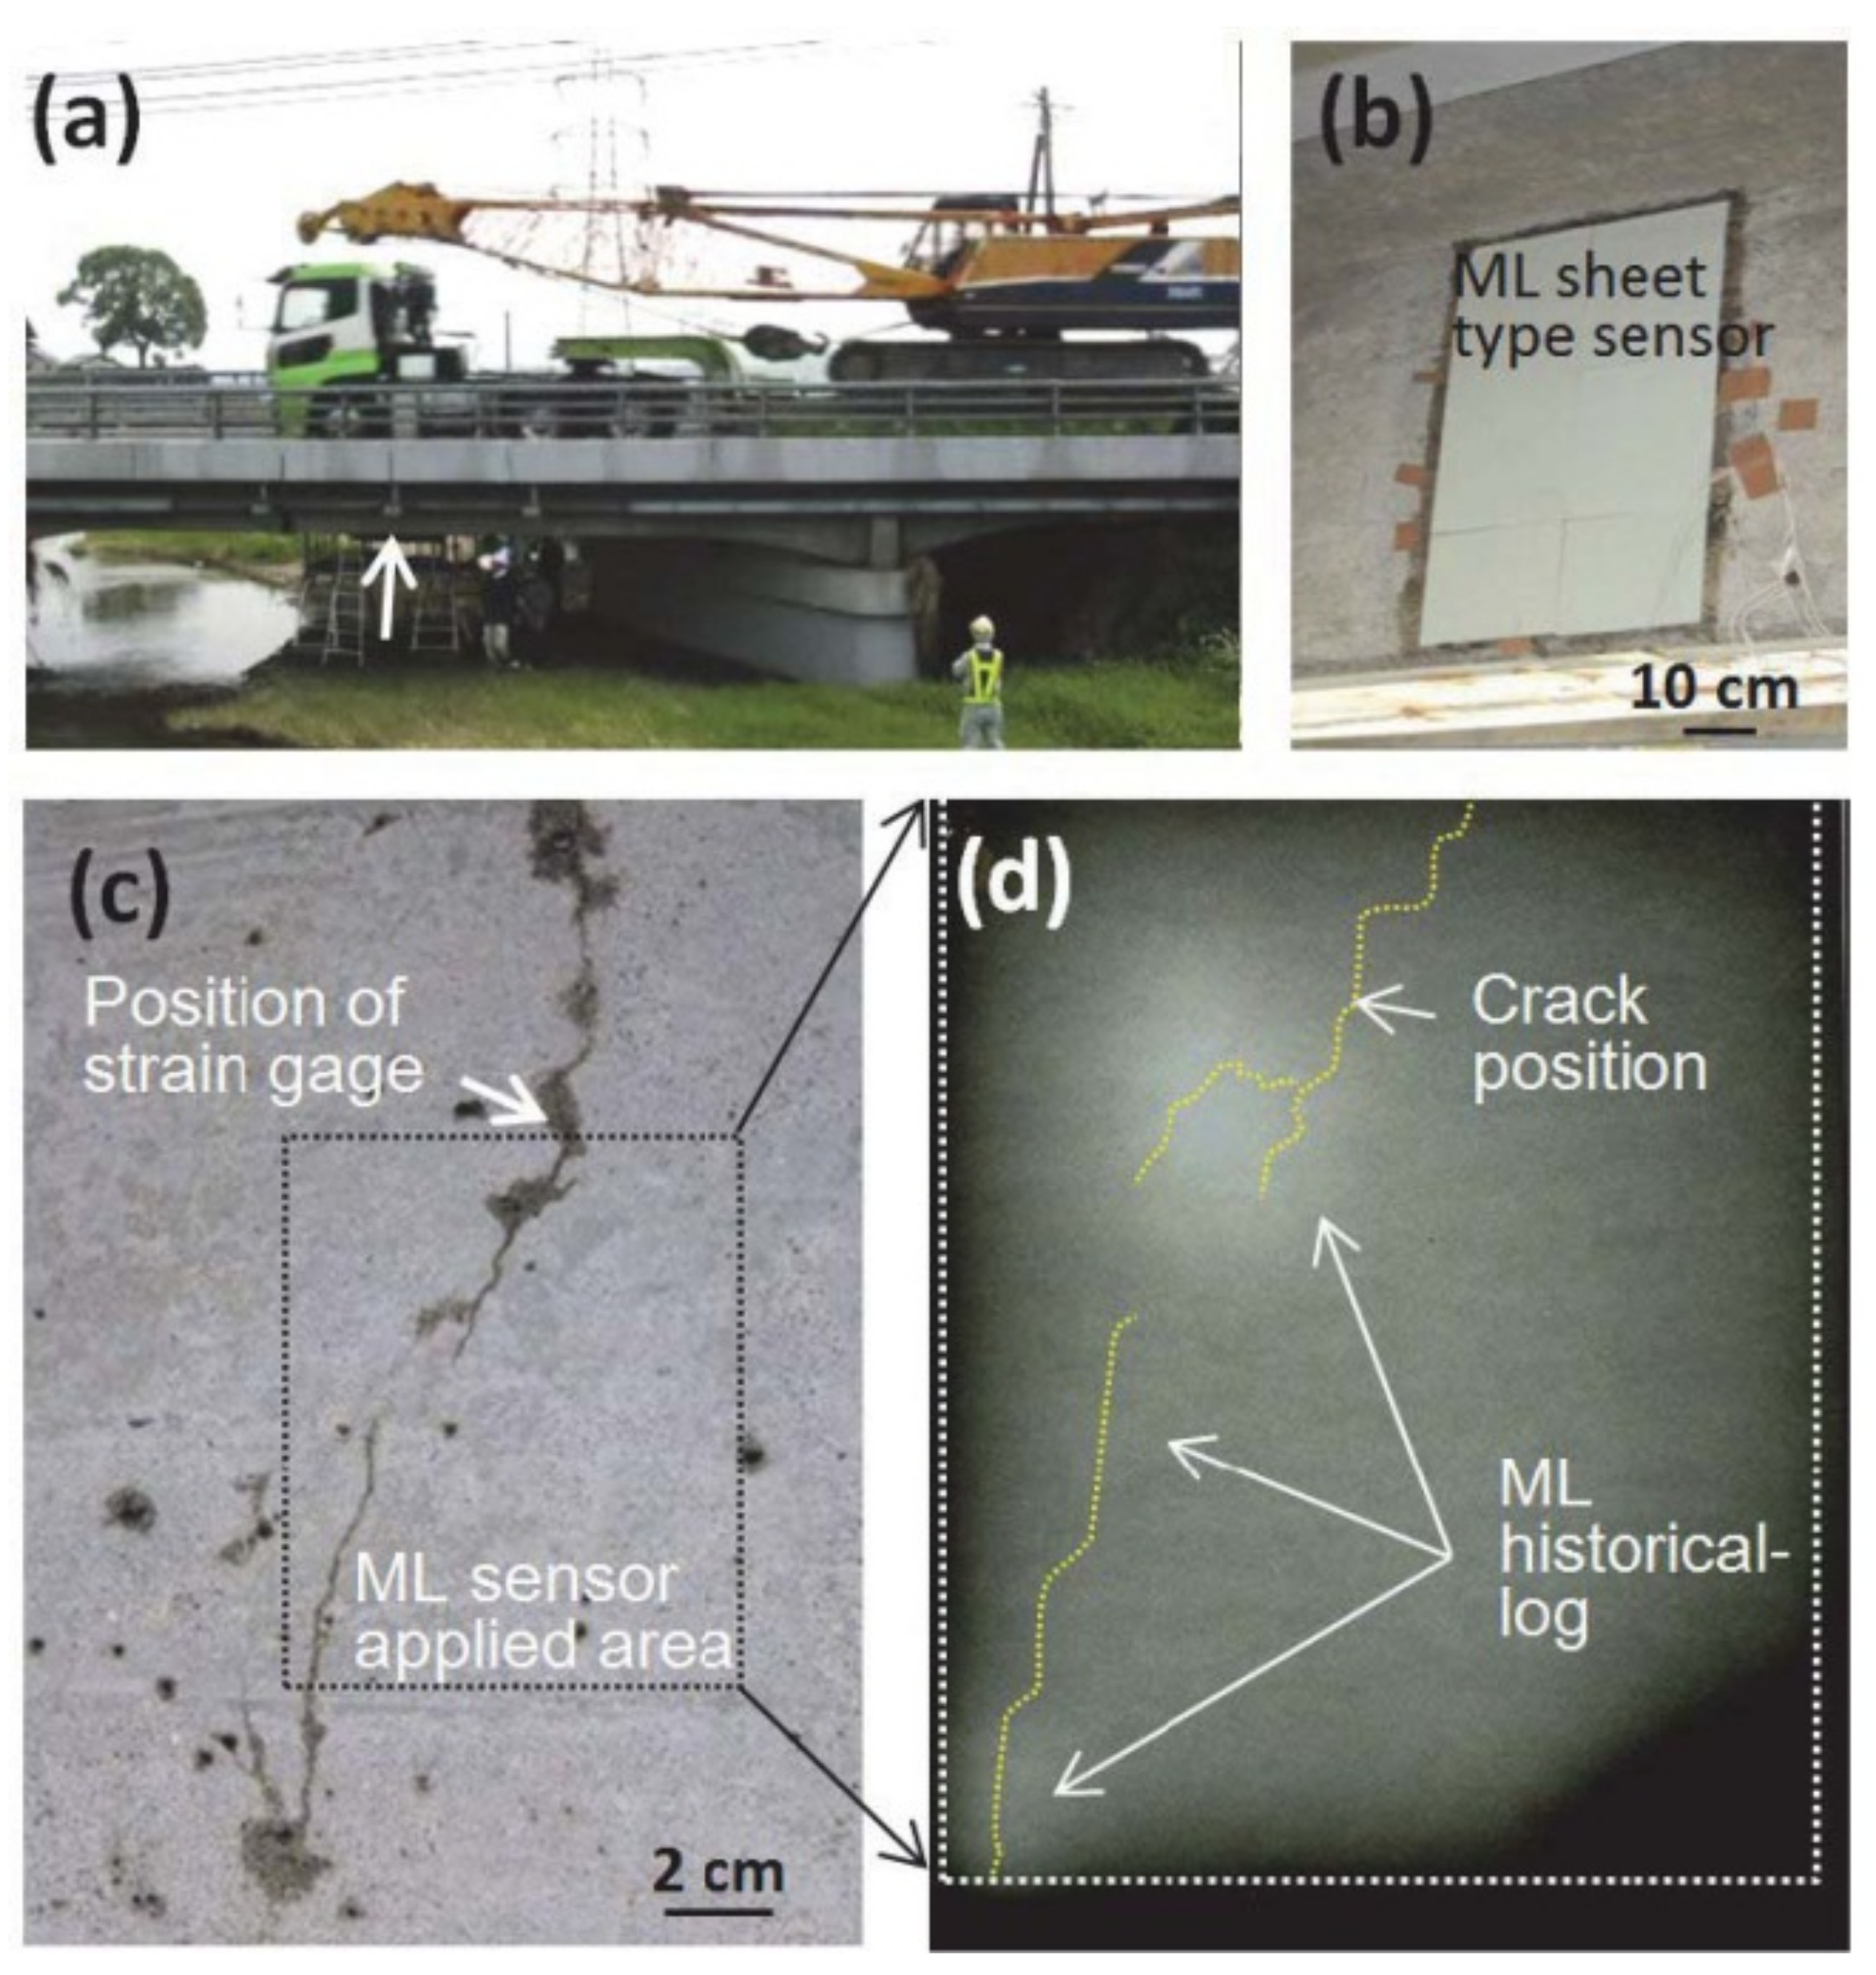
Figure 19.
The schematic illustration of the image acquisition and processing system (a) (schematic structure of ZnS composite film in iii)), which is capable of mapping 2D planar pressure i) and detecting single-point dynamic pressure ii), and the digital visualization (b) and its pressure distribution contour (c) of a handwritten “e” via ML method. Reproduced from Ref [108], with permission from John Wiley and Sons.
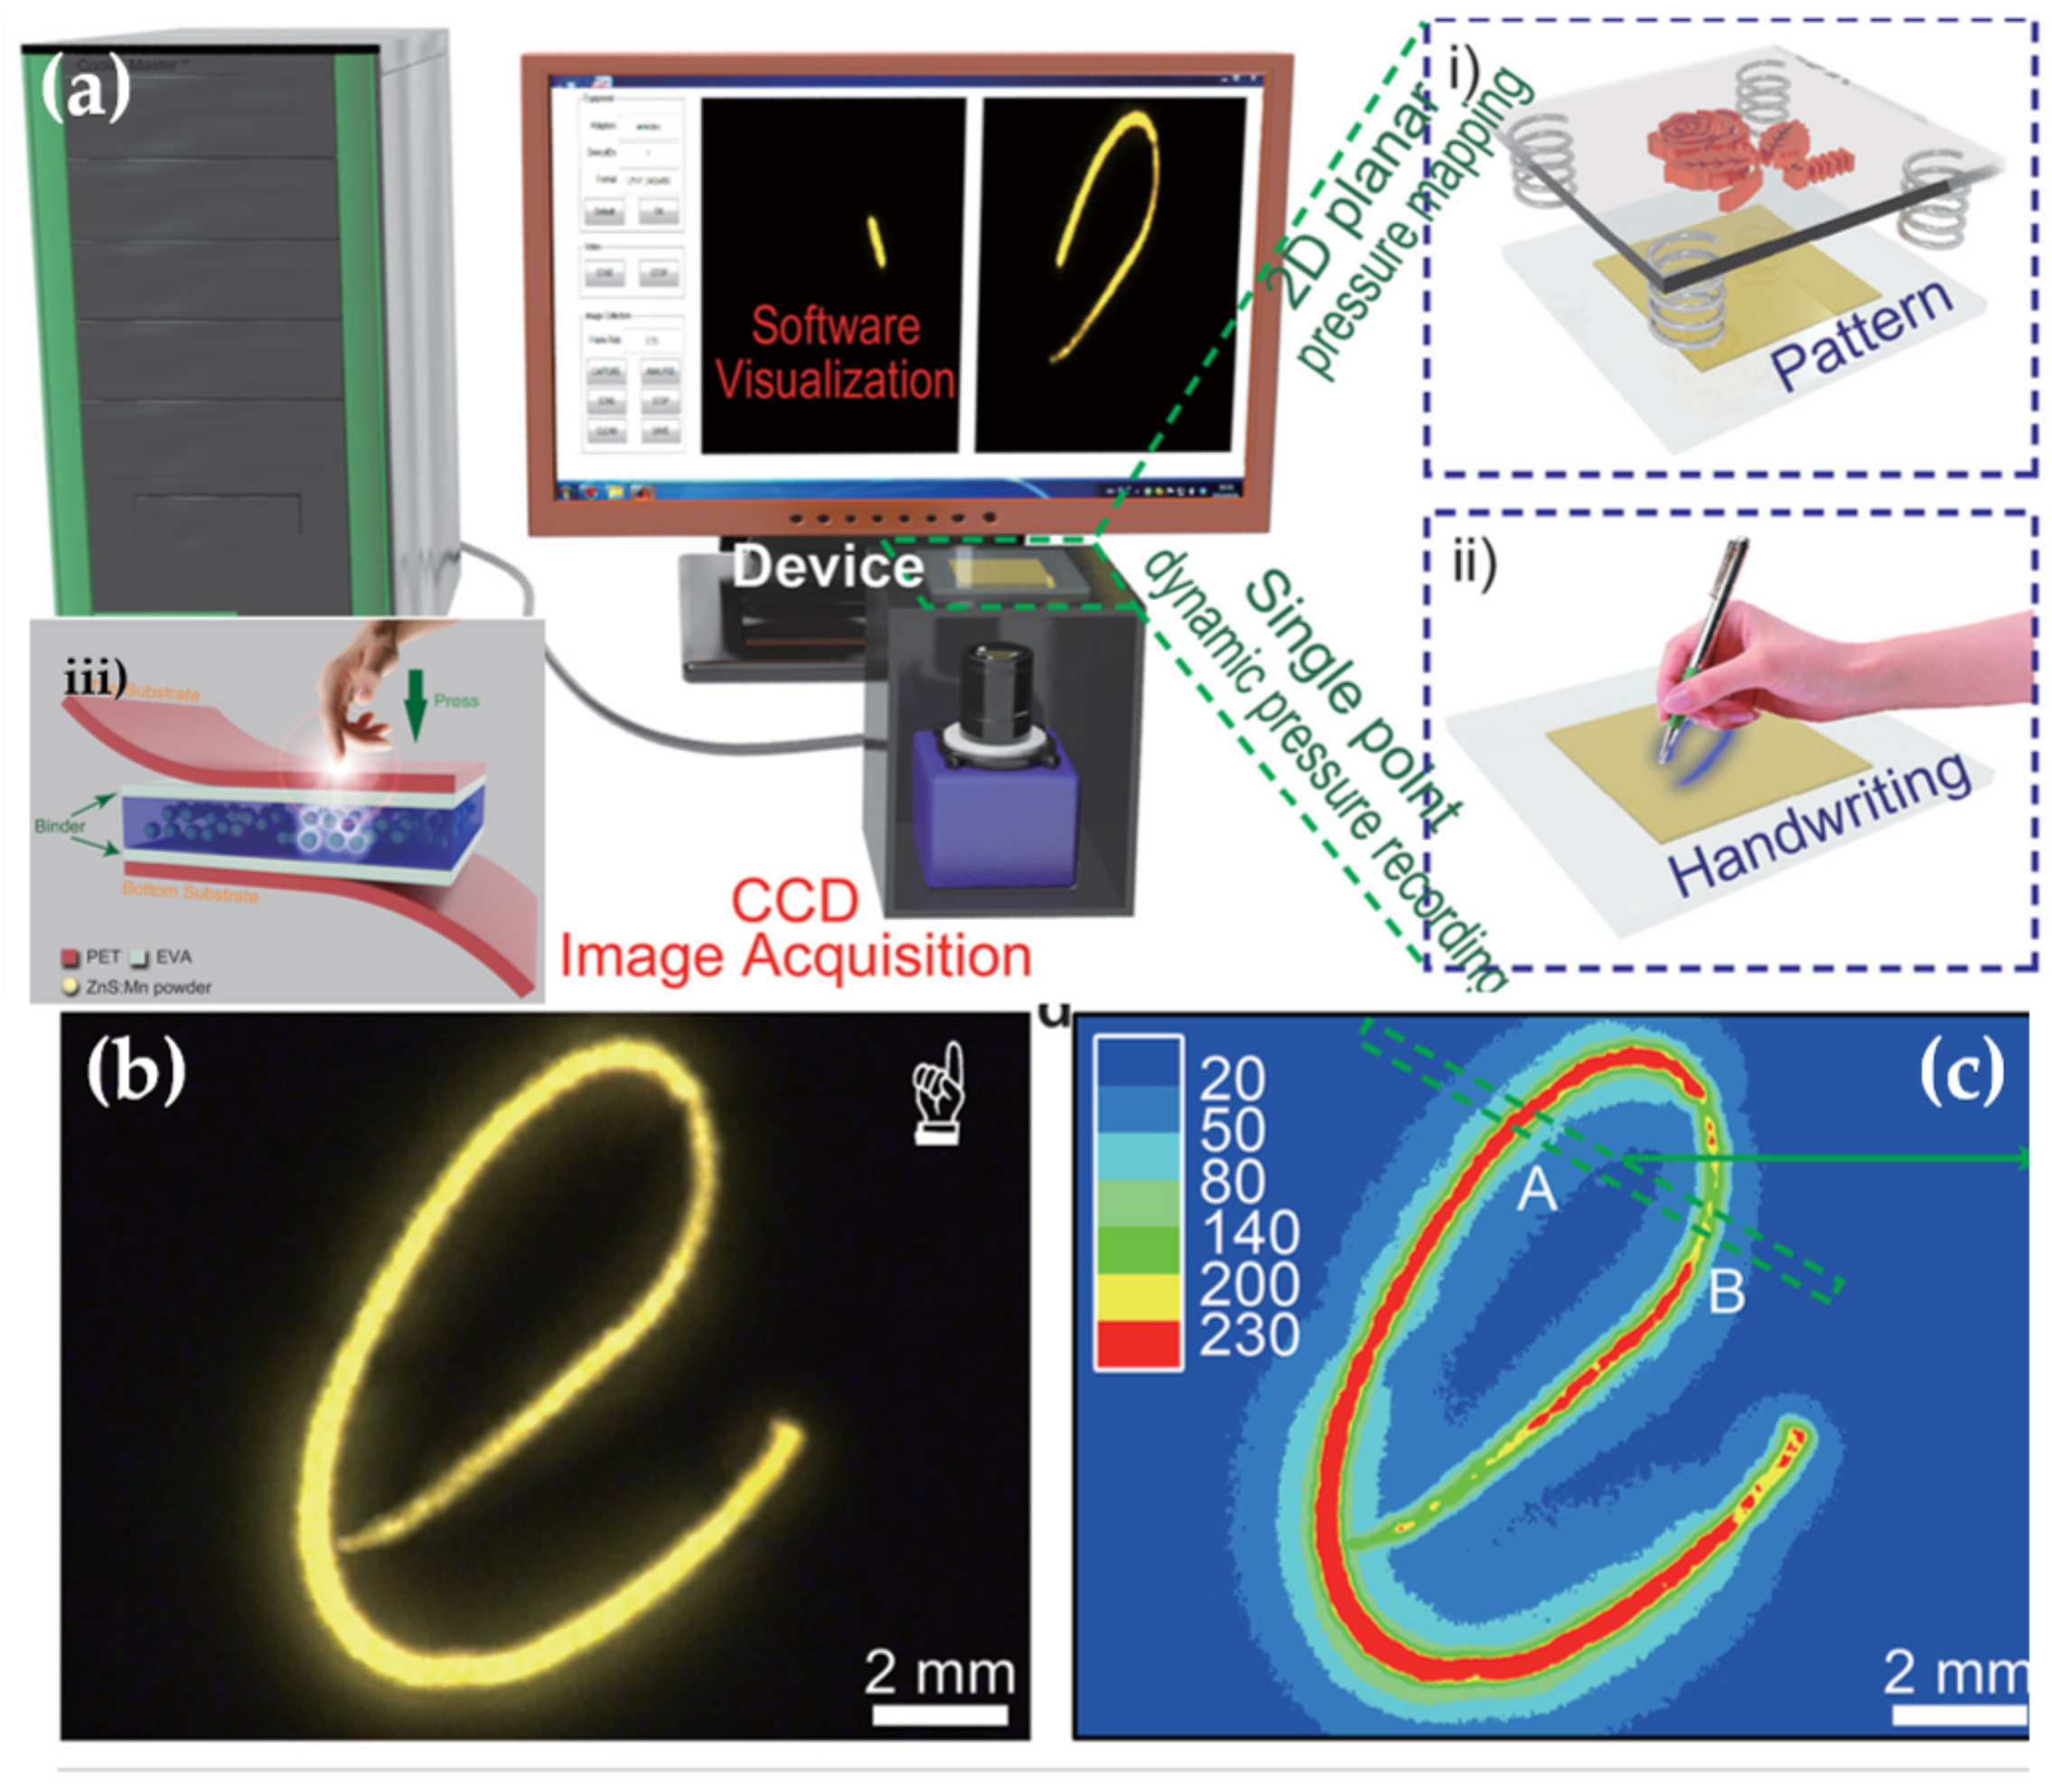
Figure 20.
The simulation (a) of the ultrasound intensity at different distances from the source (beam transducer), and the ML intensity distribution (b) of the BaSiON:Eu sensing material. Reproduced from Ref [16], with the permission of AIP Publishing.
Figure 20.
The simulation (a) of the ultrasound intensity at different distances from the source (beam transducer), and the ML intensity distribution (b) of the BaSiON:Eu sensing material. Reproduced from Ref [16], with the permission of AIP Publishing.

Figure 21.
Schematic illustration of set-up (a) for wind-driven ML display, and photographs showing the emission form ML phosphors upon N flow (b) and images of “ML” letter in different background colours: dark (c) and yellowish (d) due to different fabrication structures. Reproduced from Ref [17] Published by The Royal Society of Chemistry.
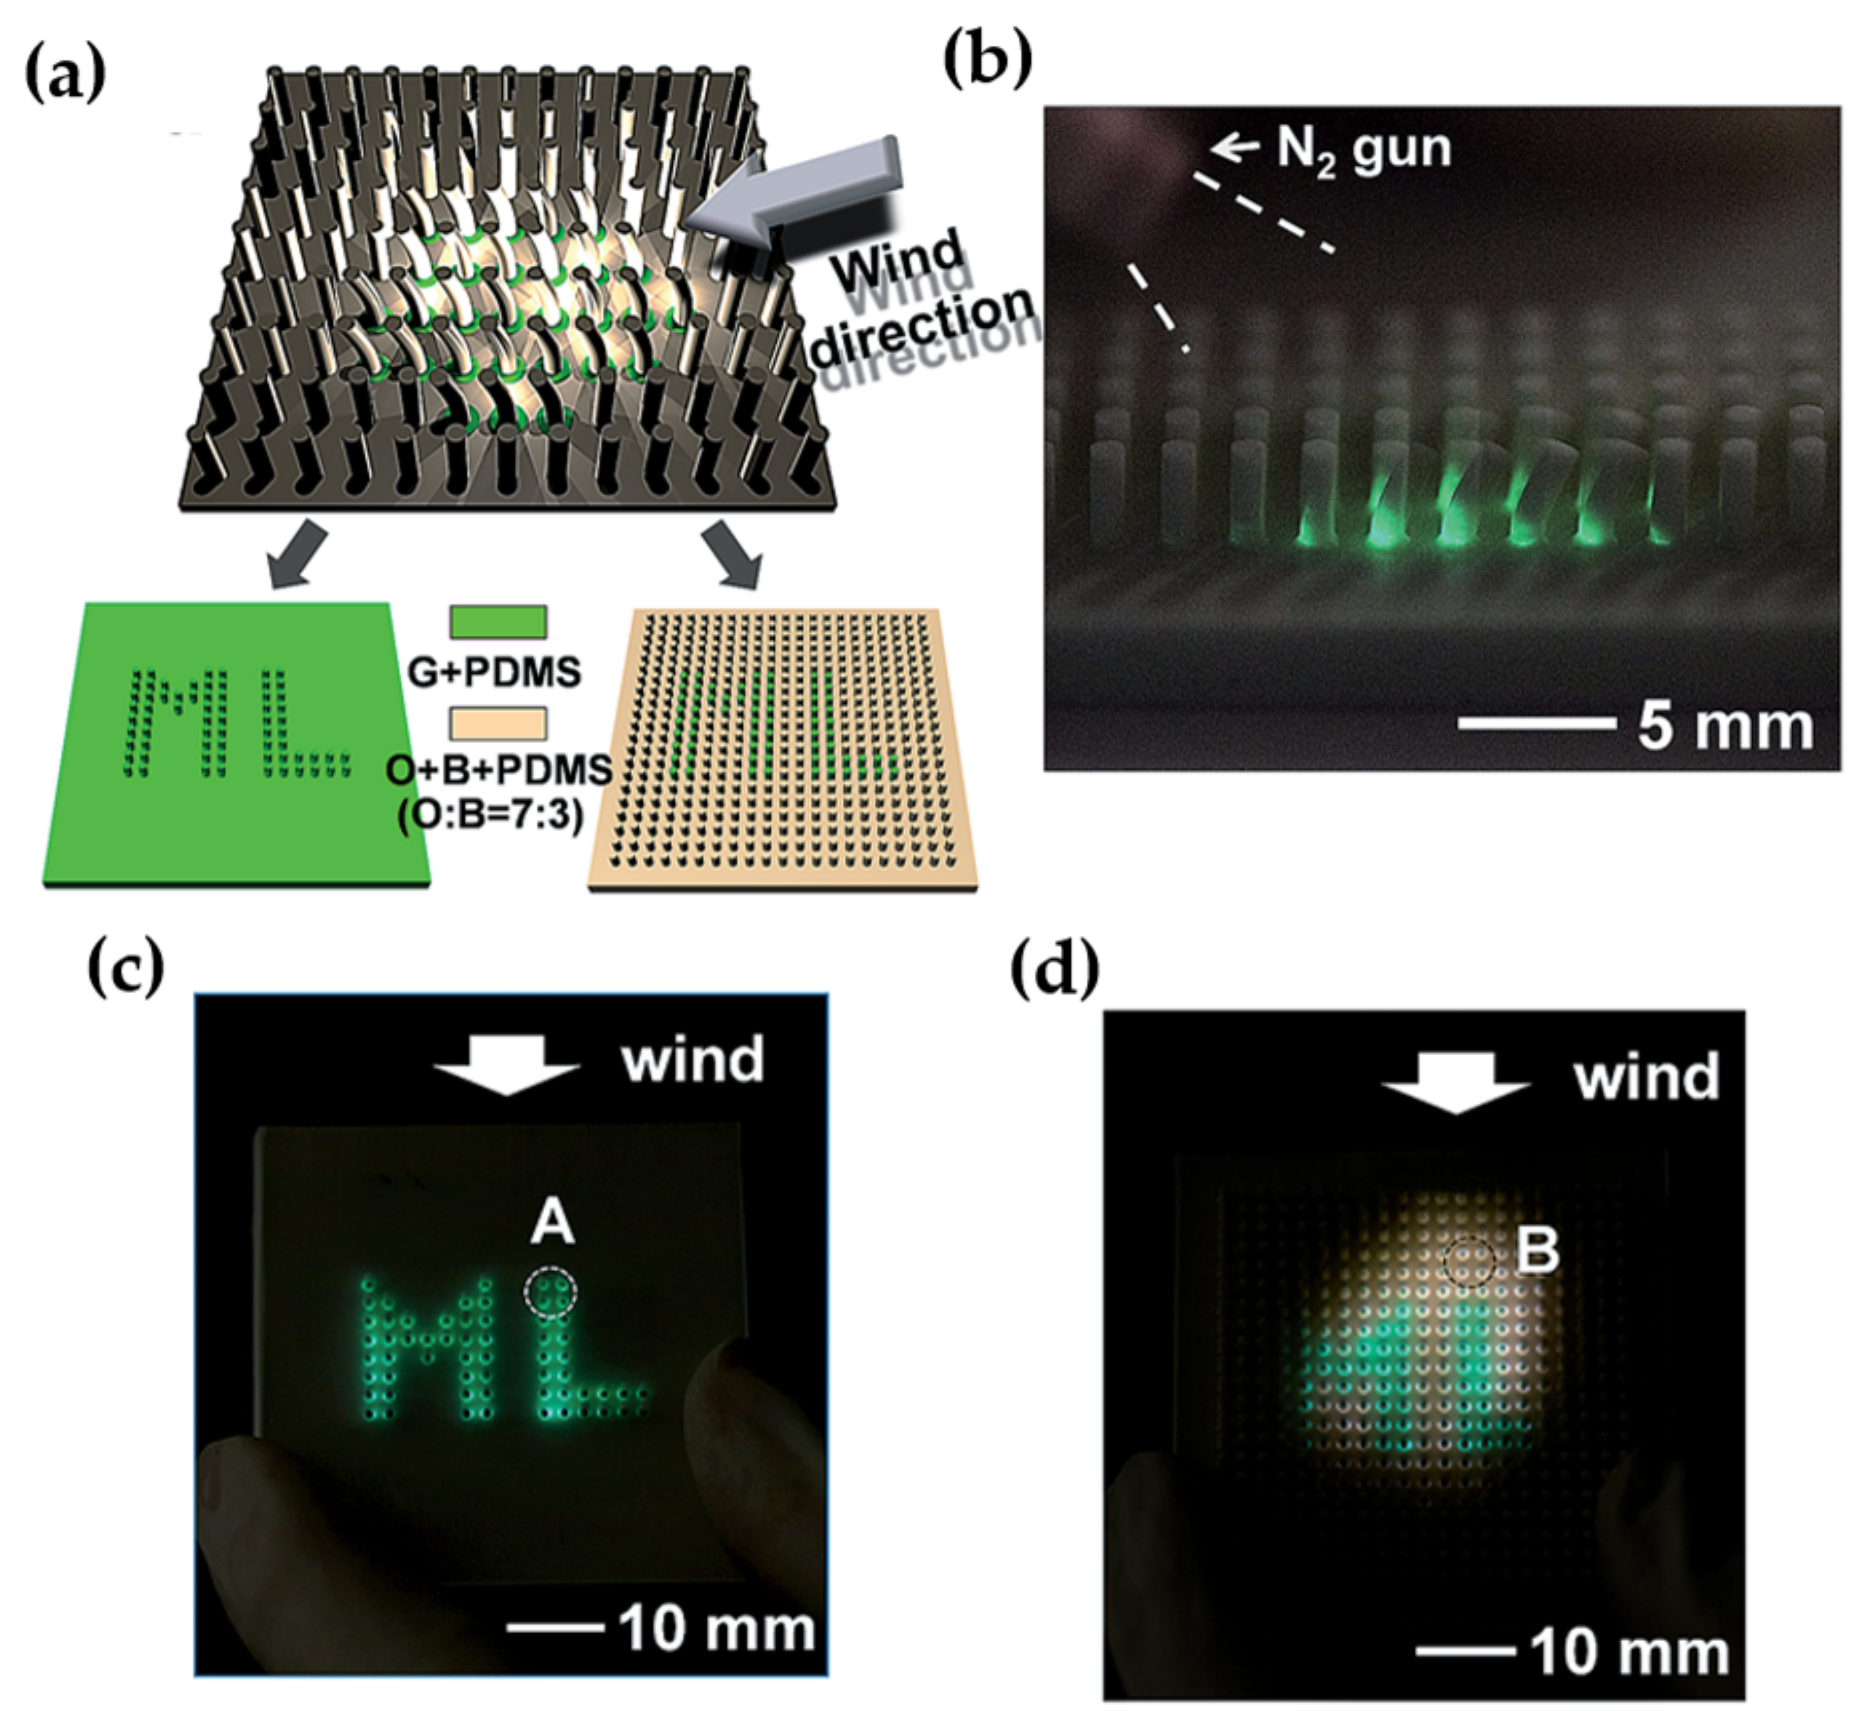
Figure 22.
The structure of the piezo-phototronic luminescence device (a) and its luminescence intensity 508 nm (b) under a square-wave voltage (blue dashed line) stimulus (Reproduced from Ref [13], Copyright (2015), with permission from Elsevier); the change of emission spectrum with increasing electric field of ZnS:Cu, Al films (c) (Ref [123], with permission from John Wiley and Sons), and of ZnS:Cu phosphor (d) (Ref [121], with the permission of AIP Publishing).

Figure 23.
The time dependent luminescence profiles (a); the emission profile (b); and the normalized emission intensity (c) of ZnS:Cu, Al emitting at 472 and 503 nm under a sinusoidal magnetic field with various frequencies and the dependency on the square of the magnetic-field strength (d) with the corresponding linear fittings. Reproduced from Ref [125], with permission from John Wiley and Sons.


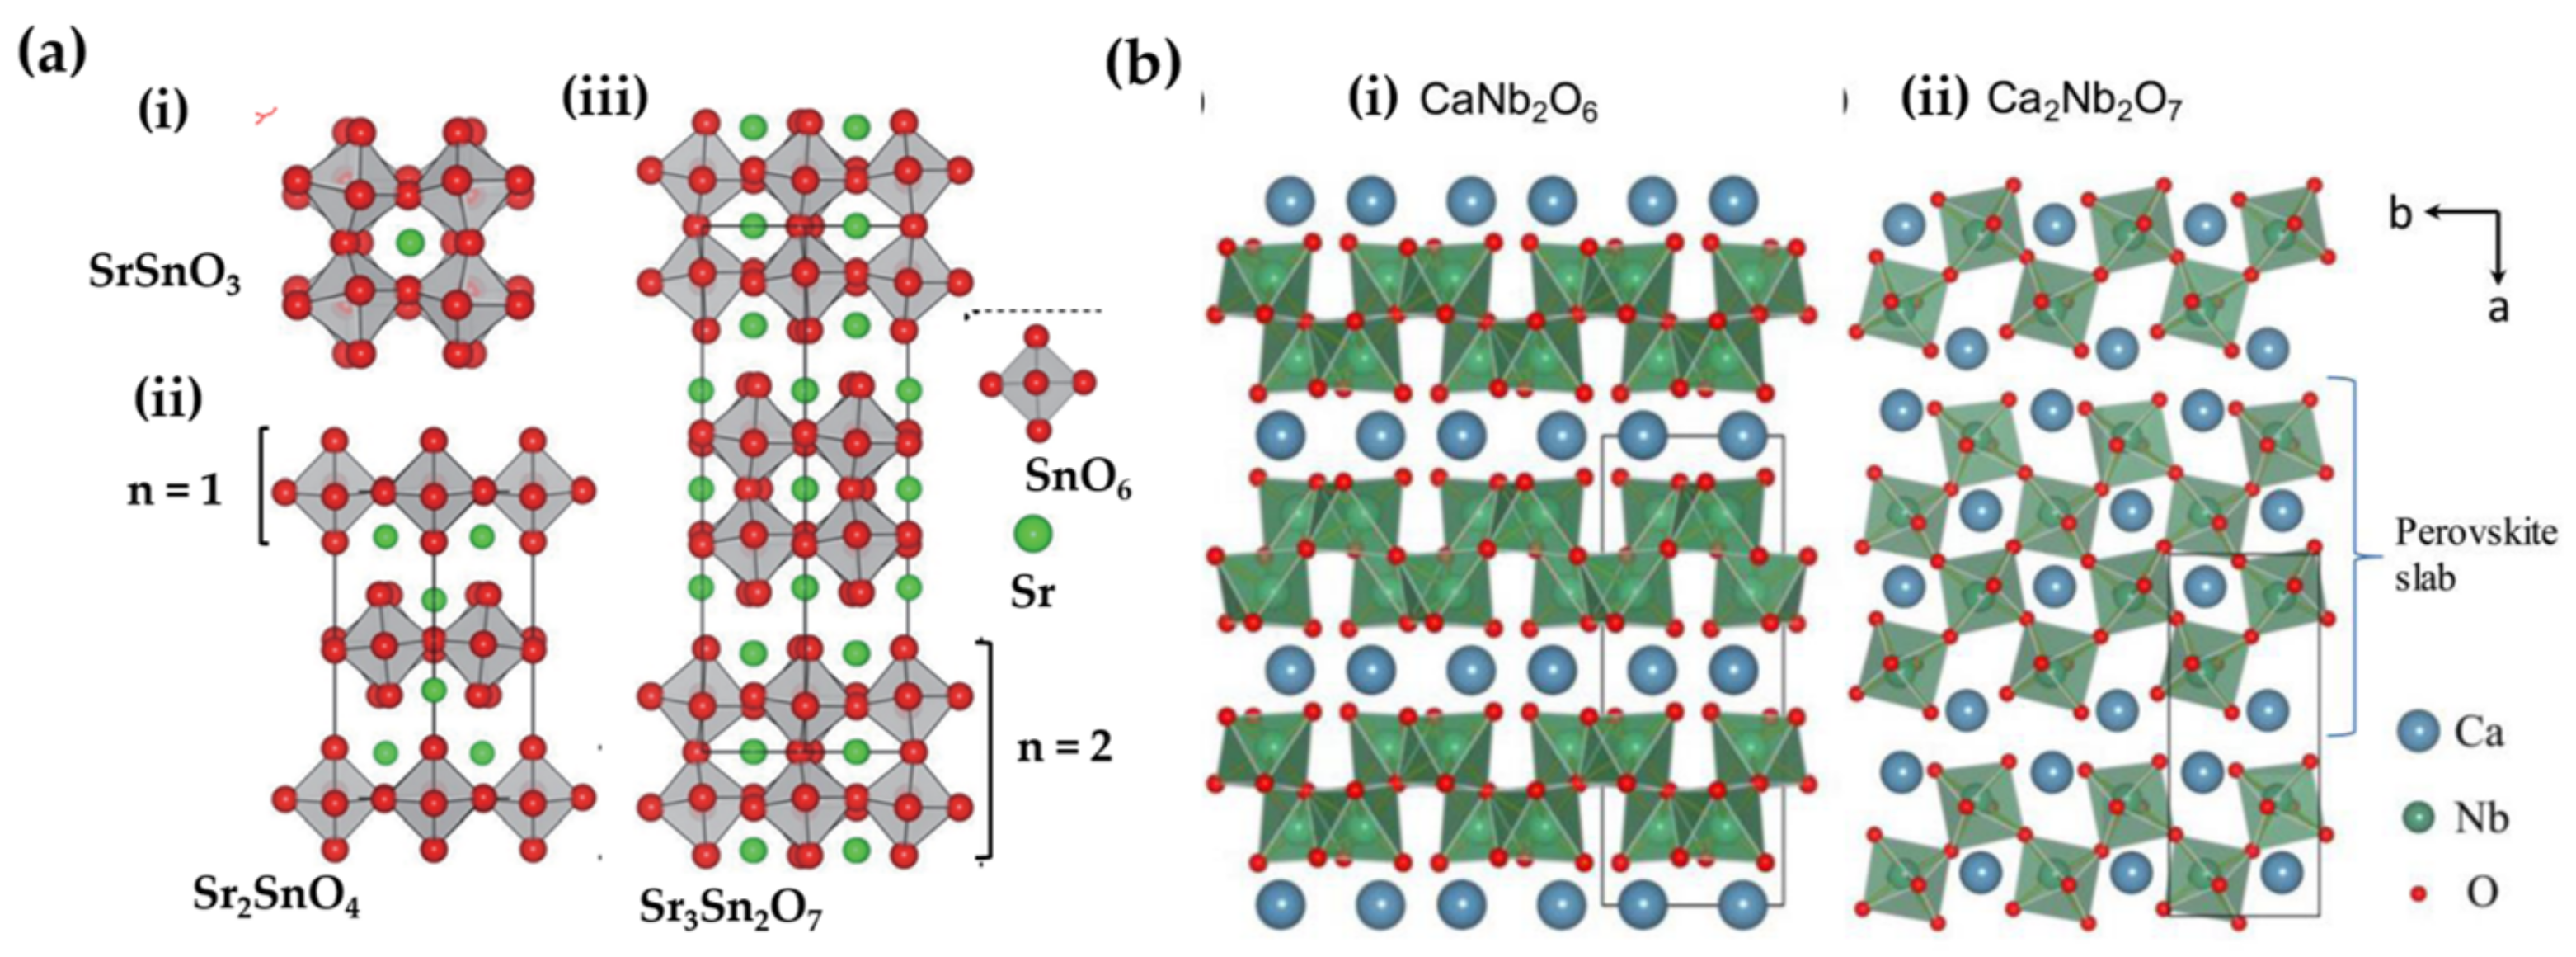
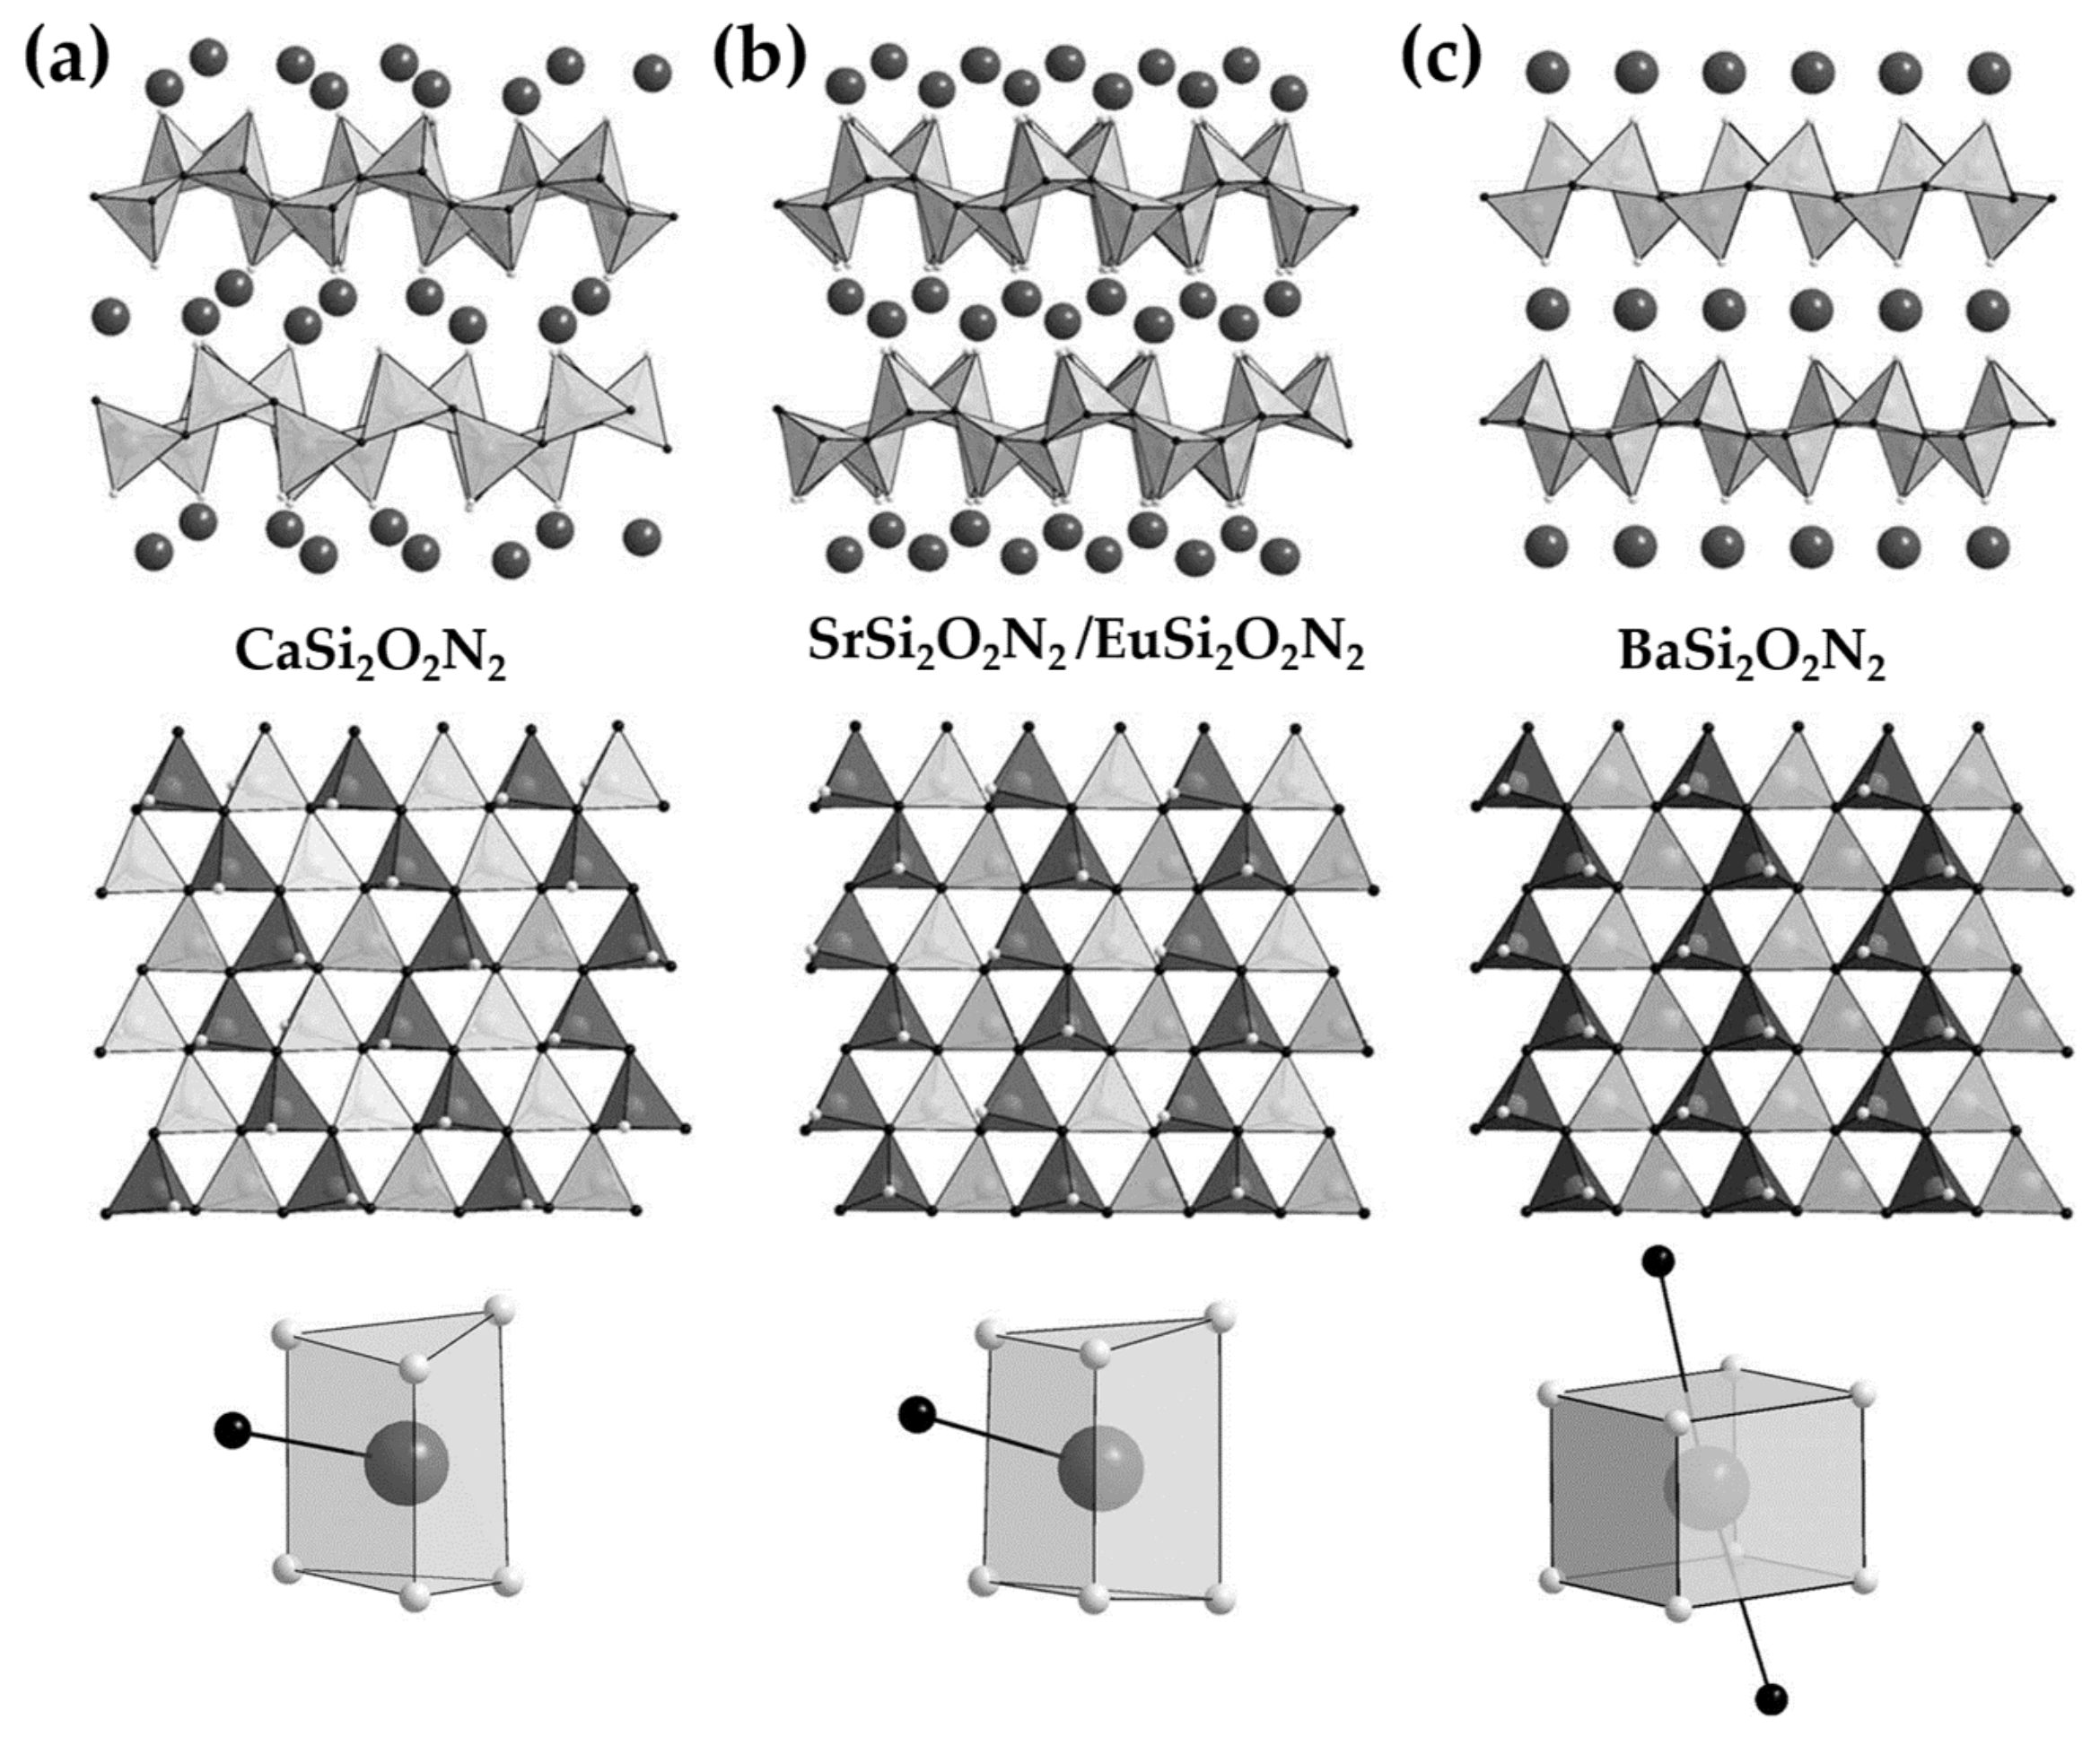
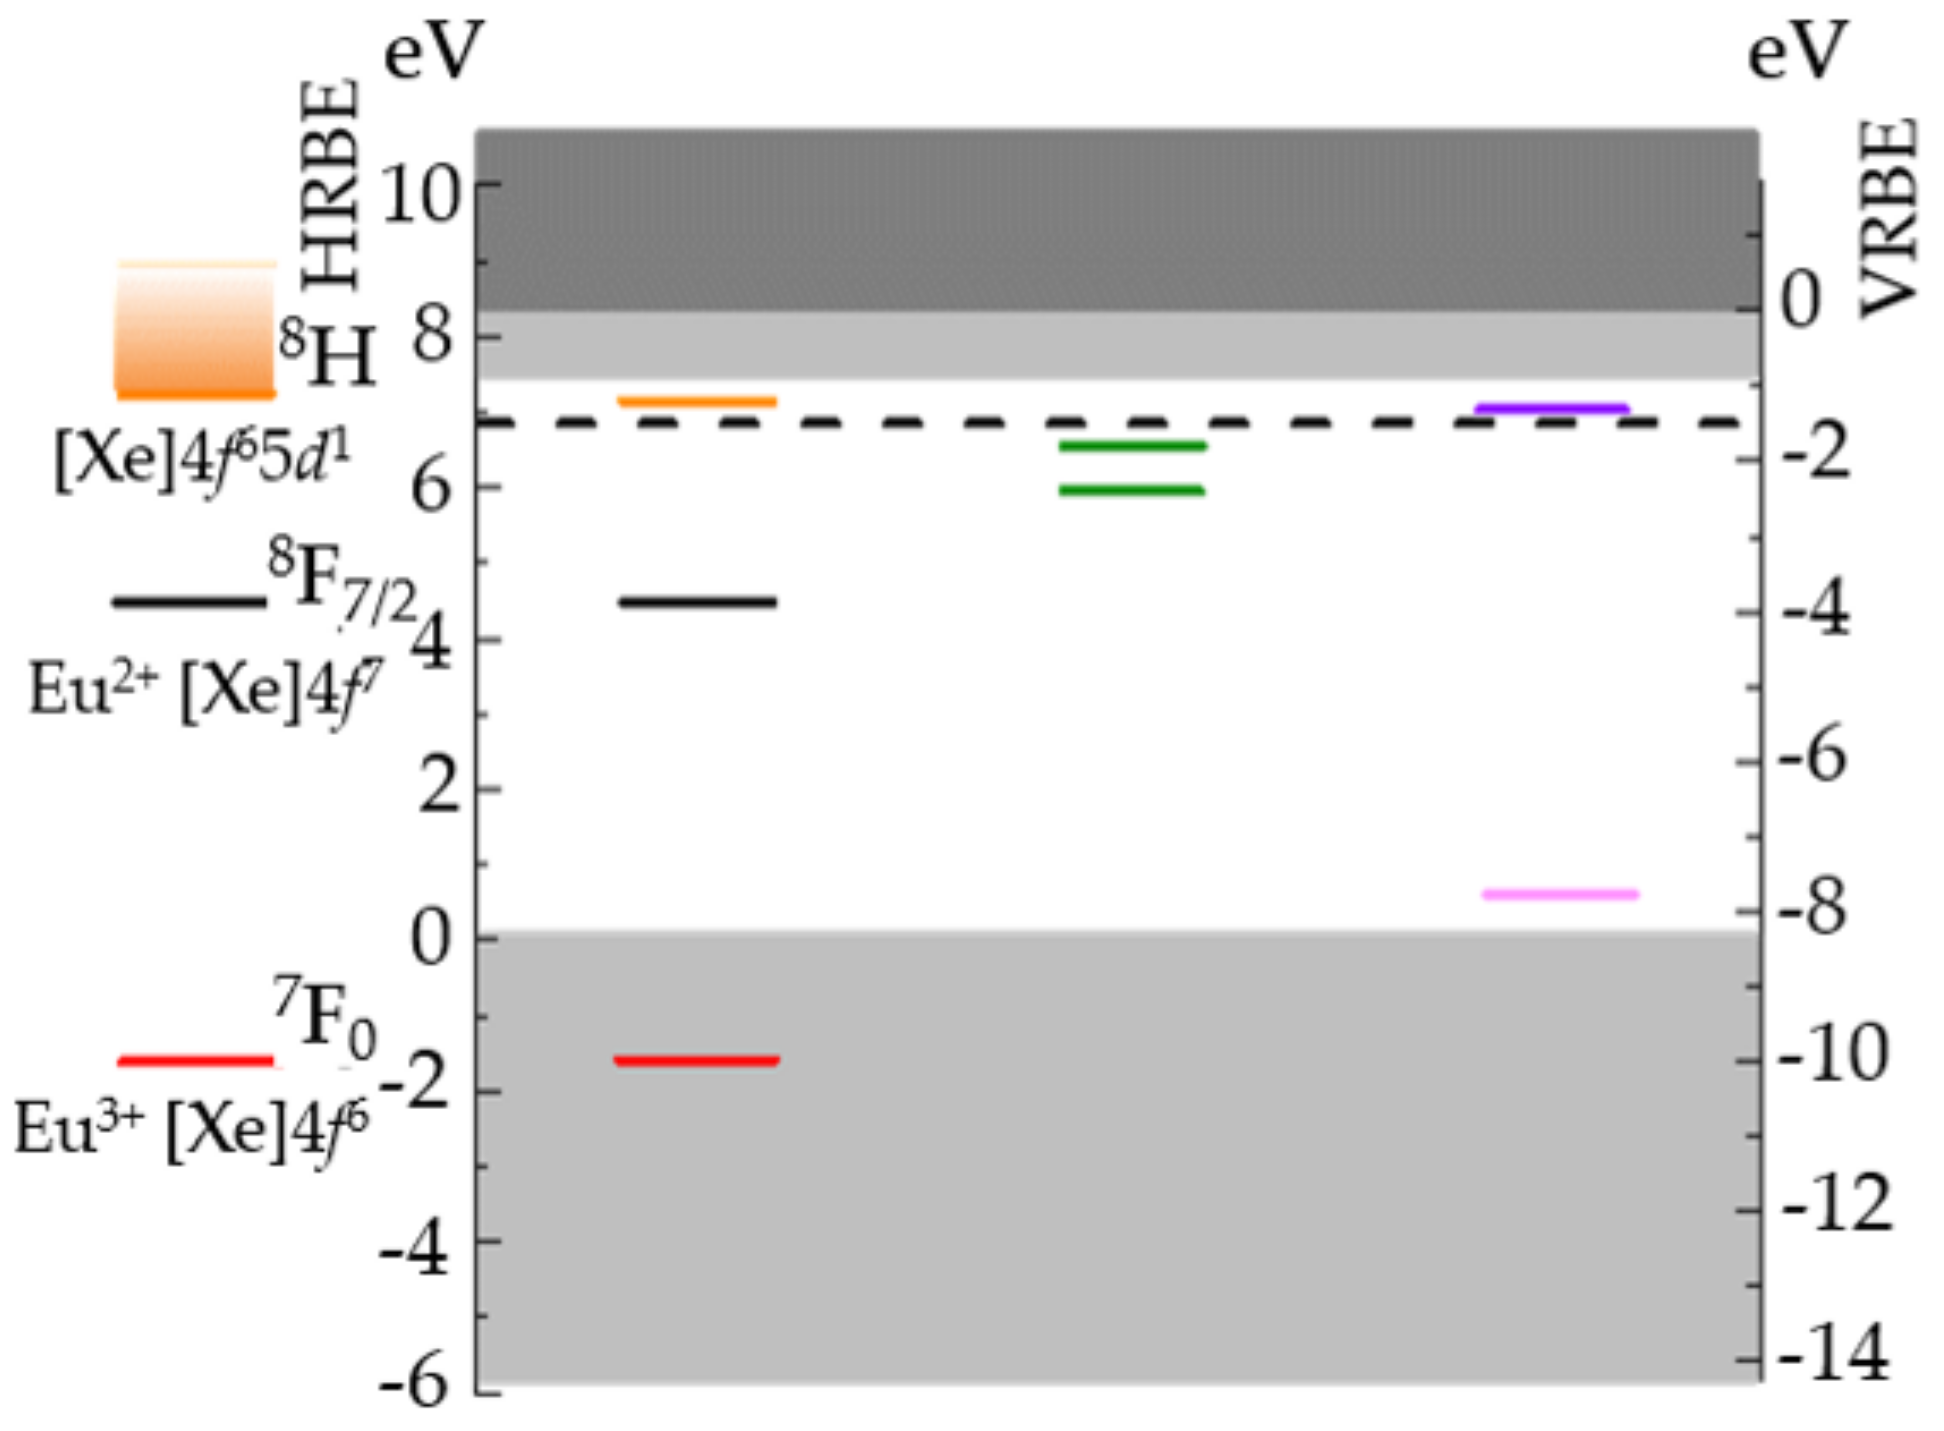
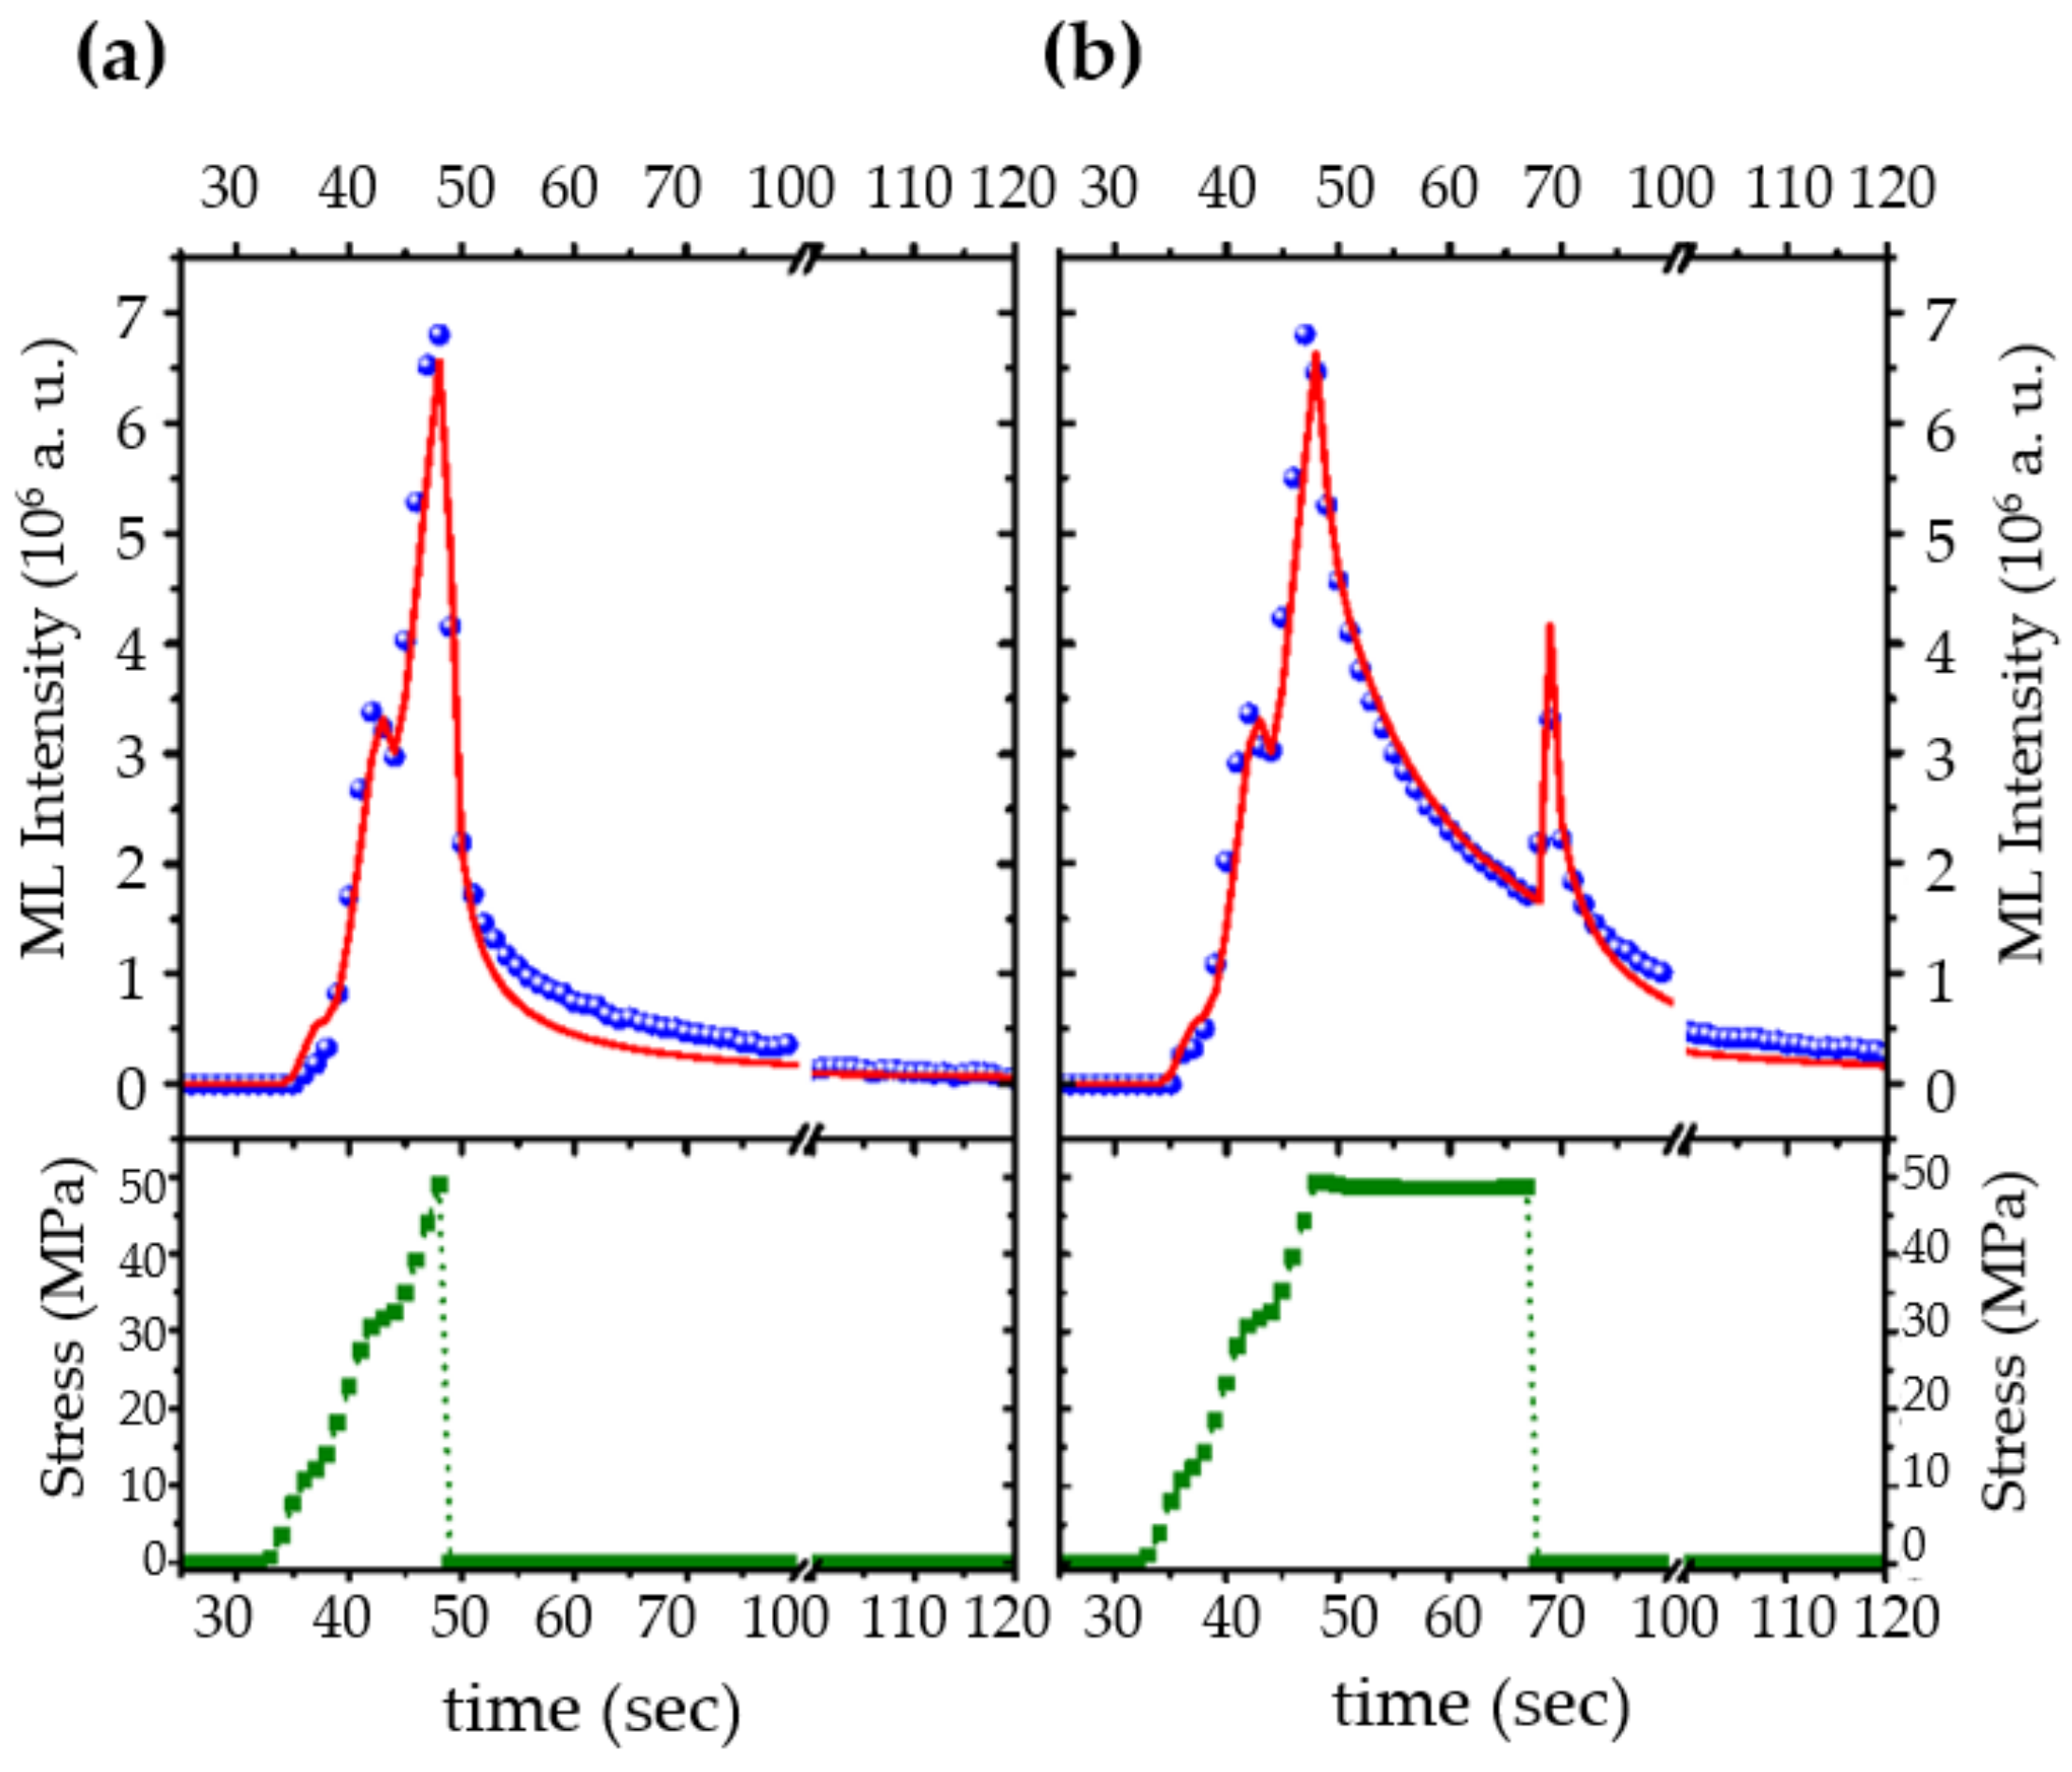
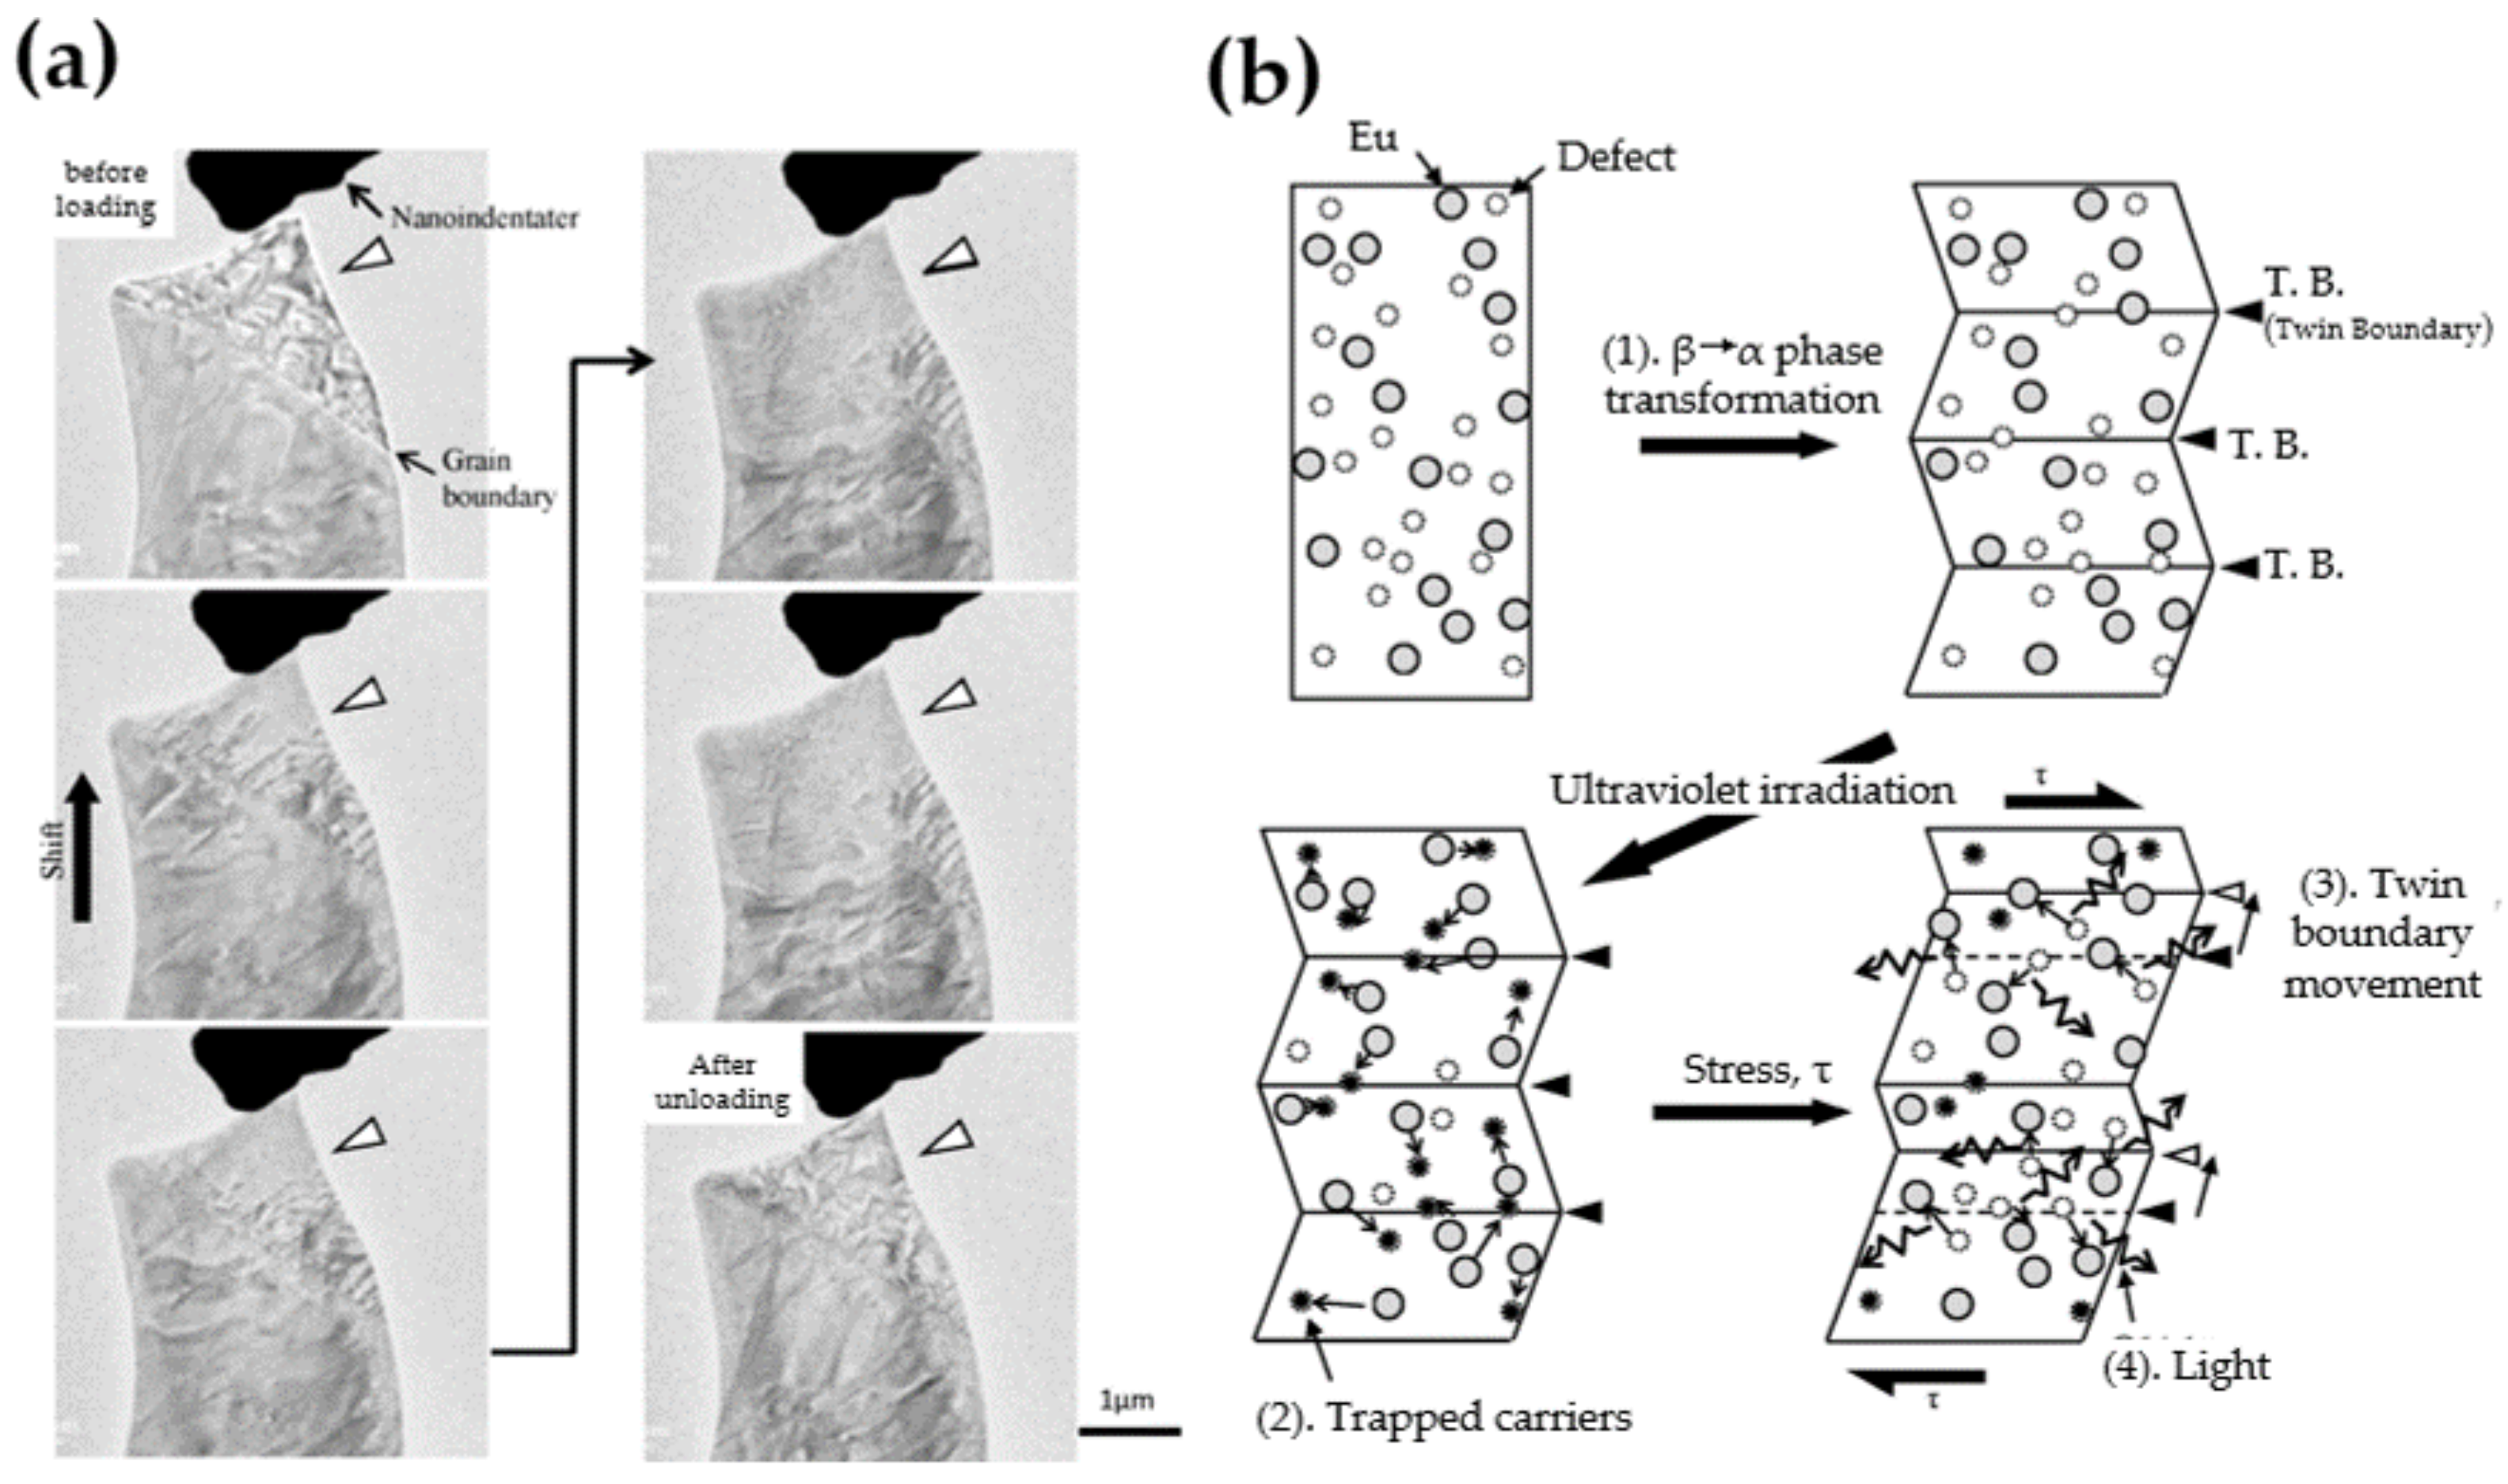
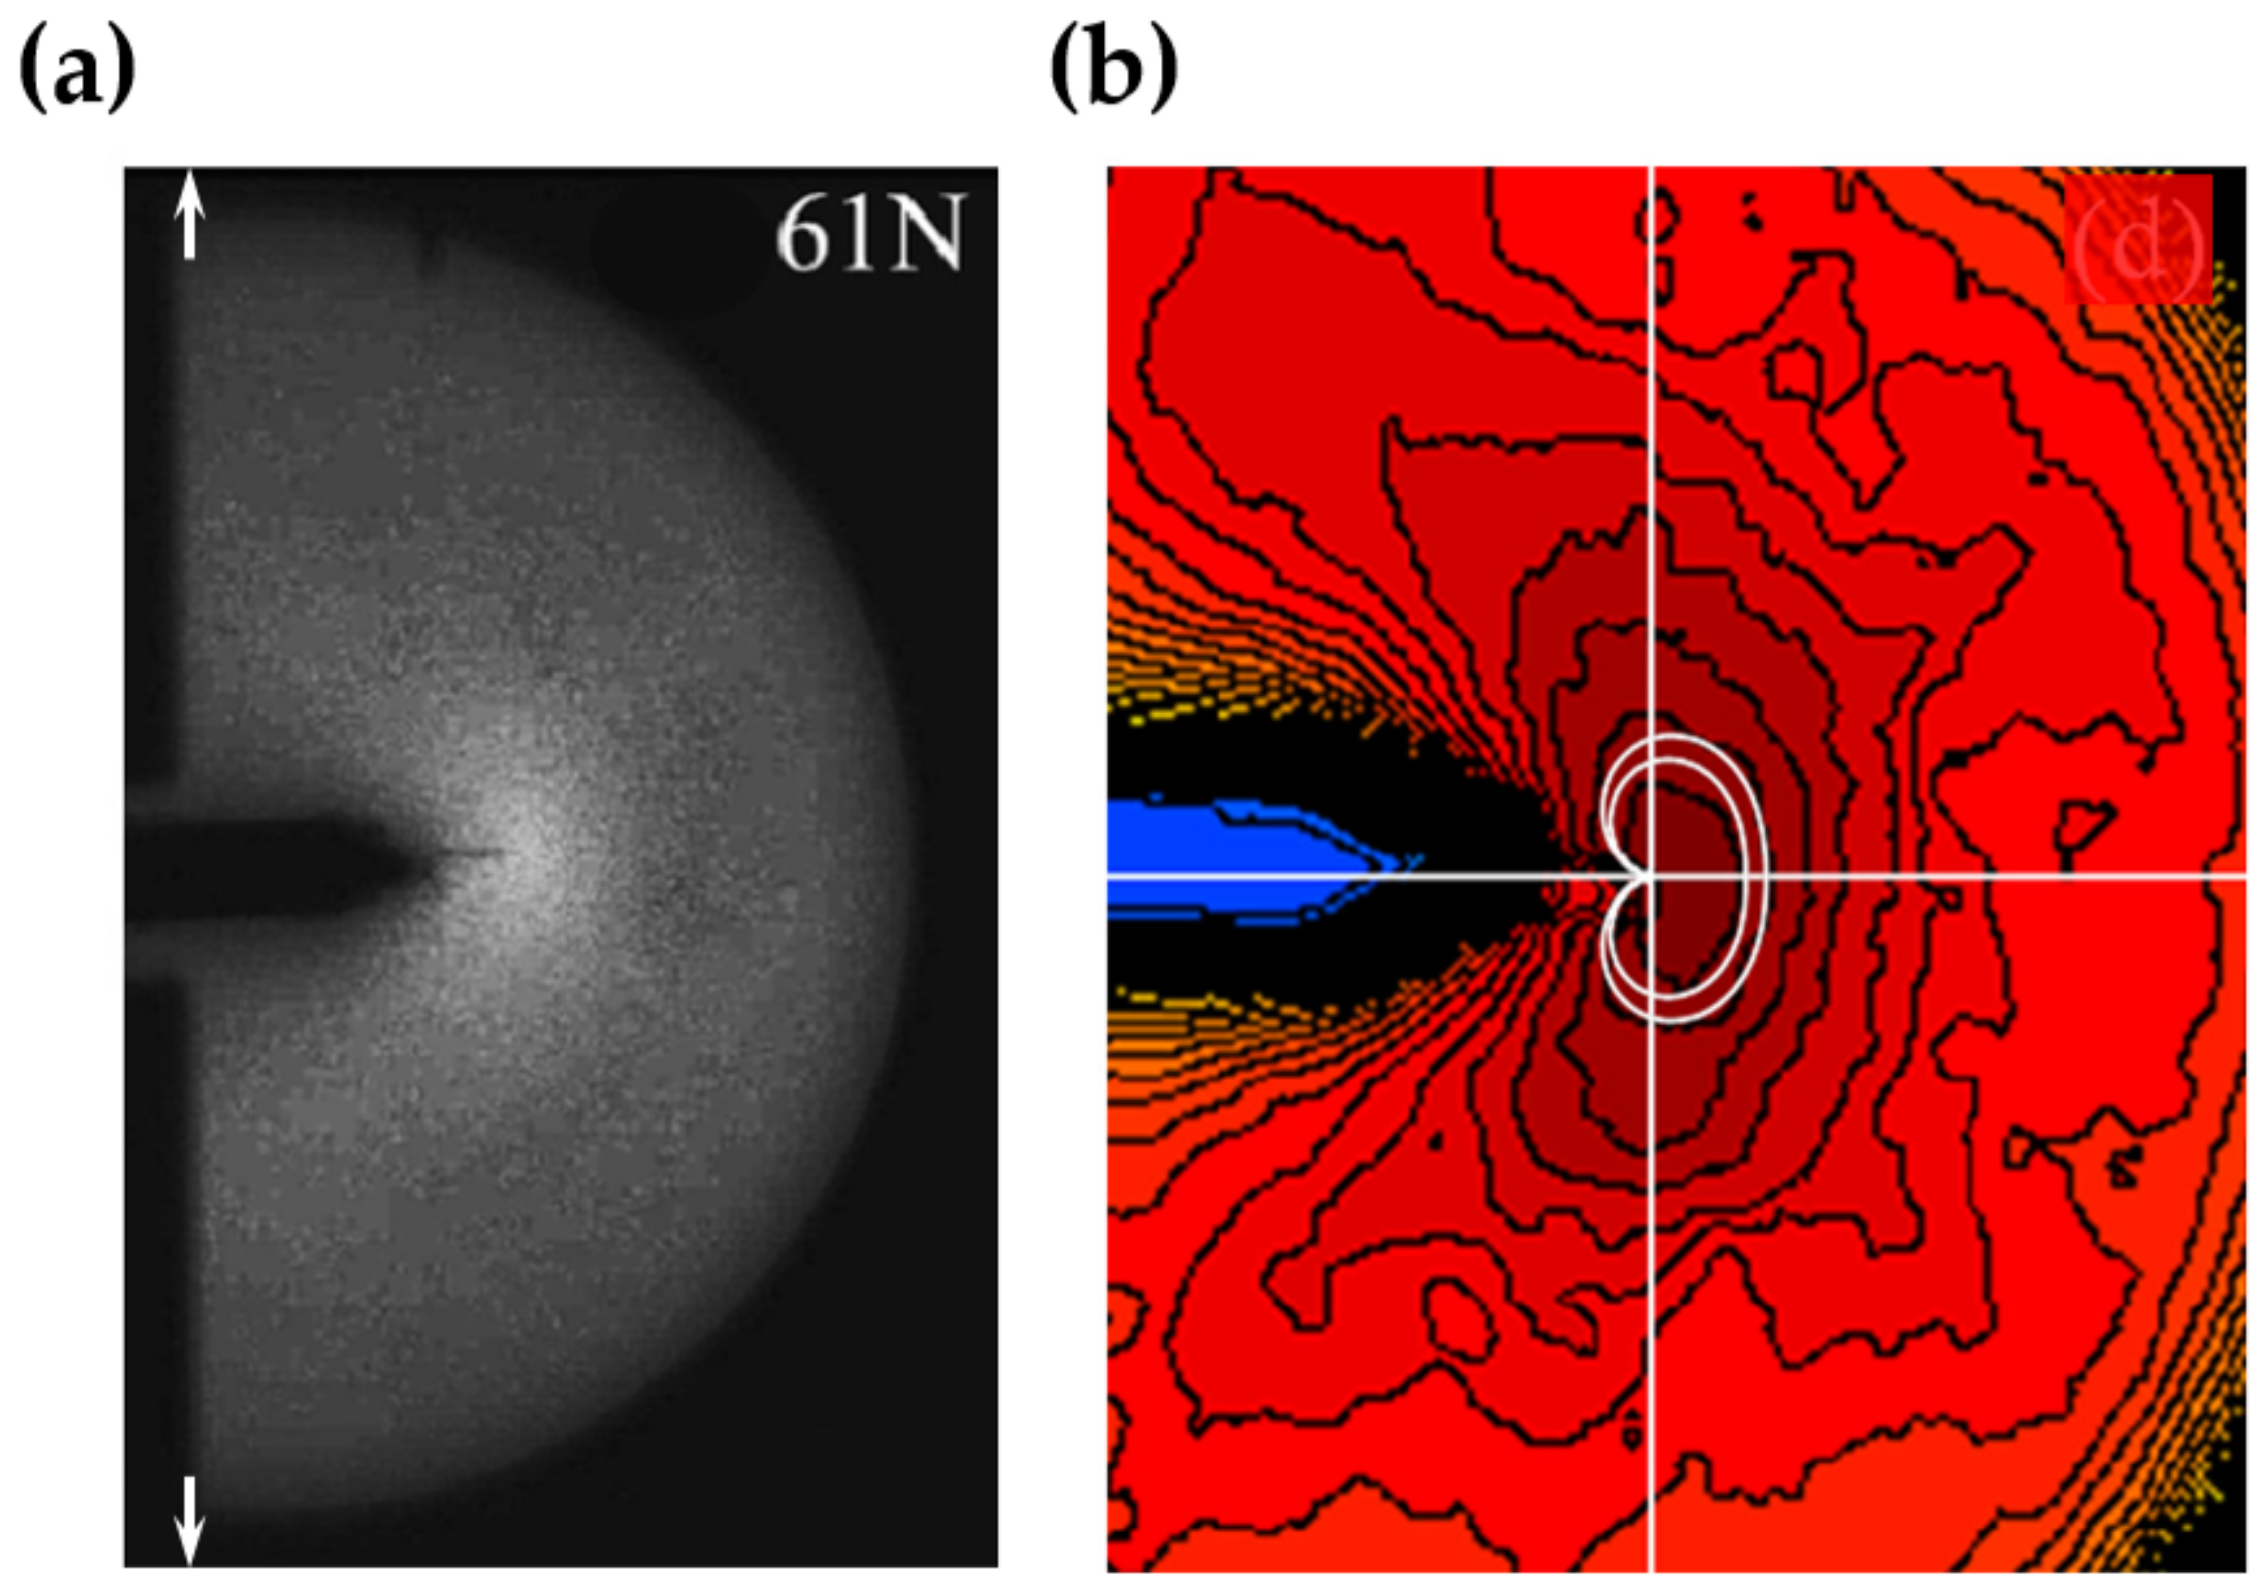
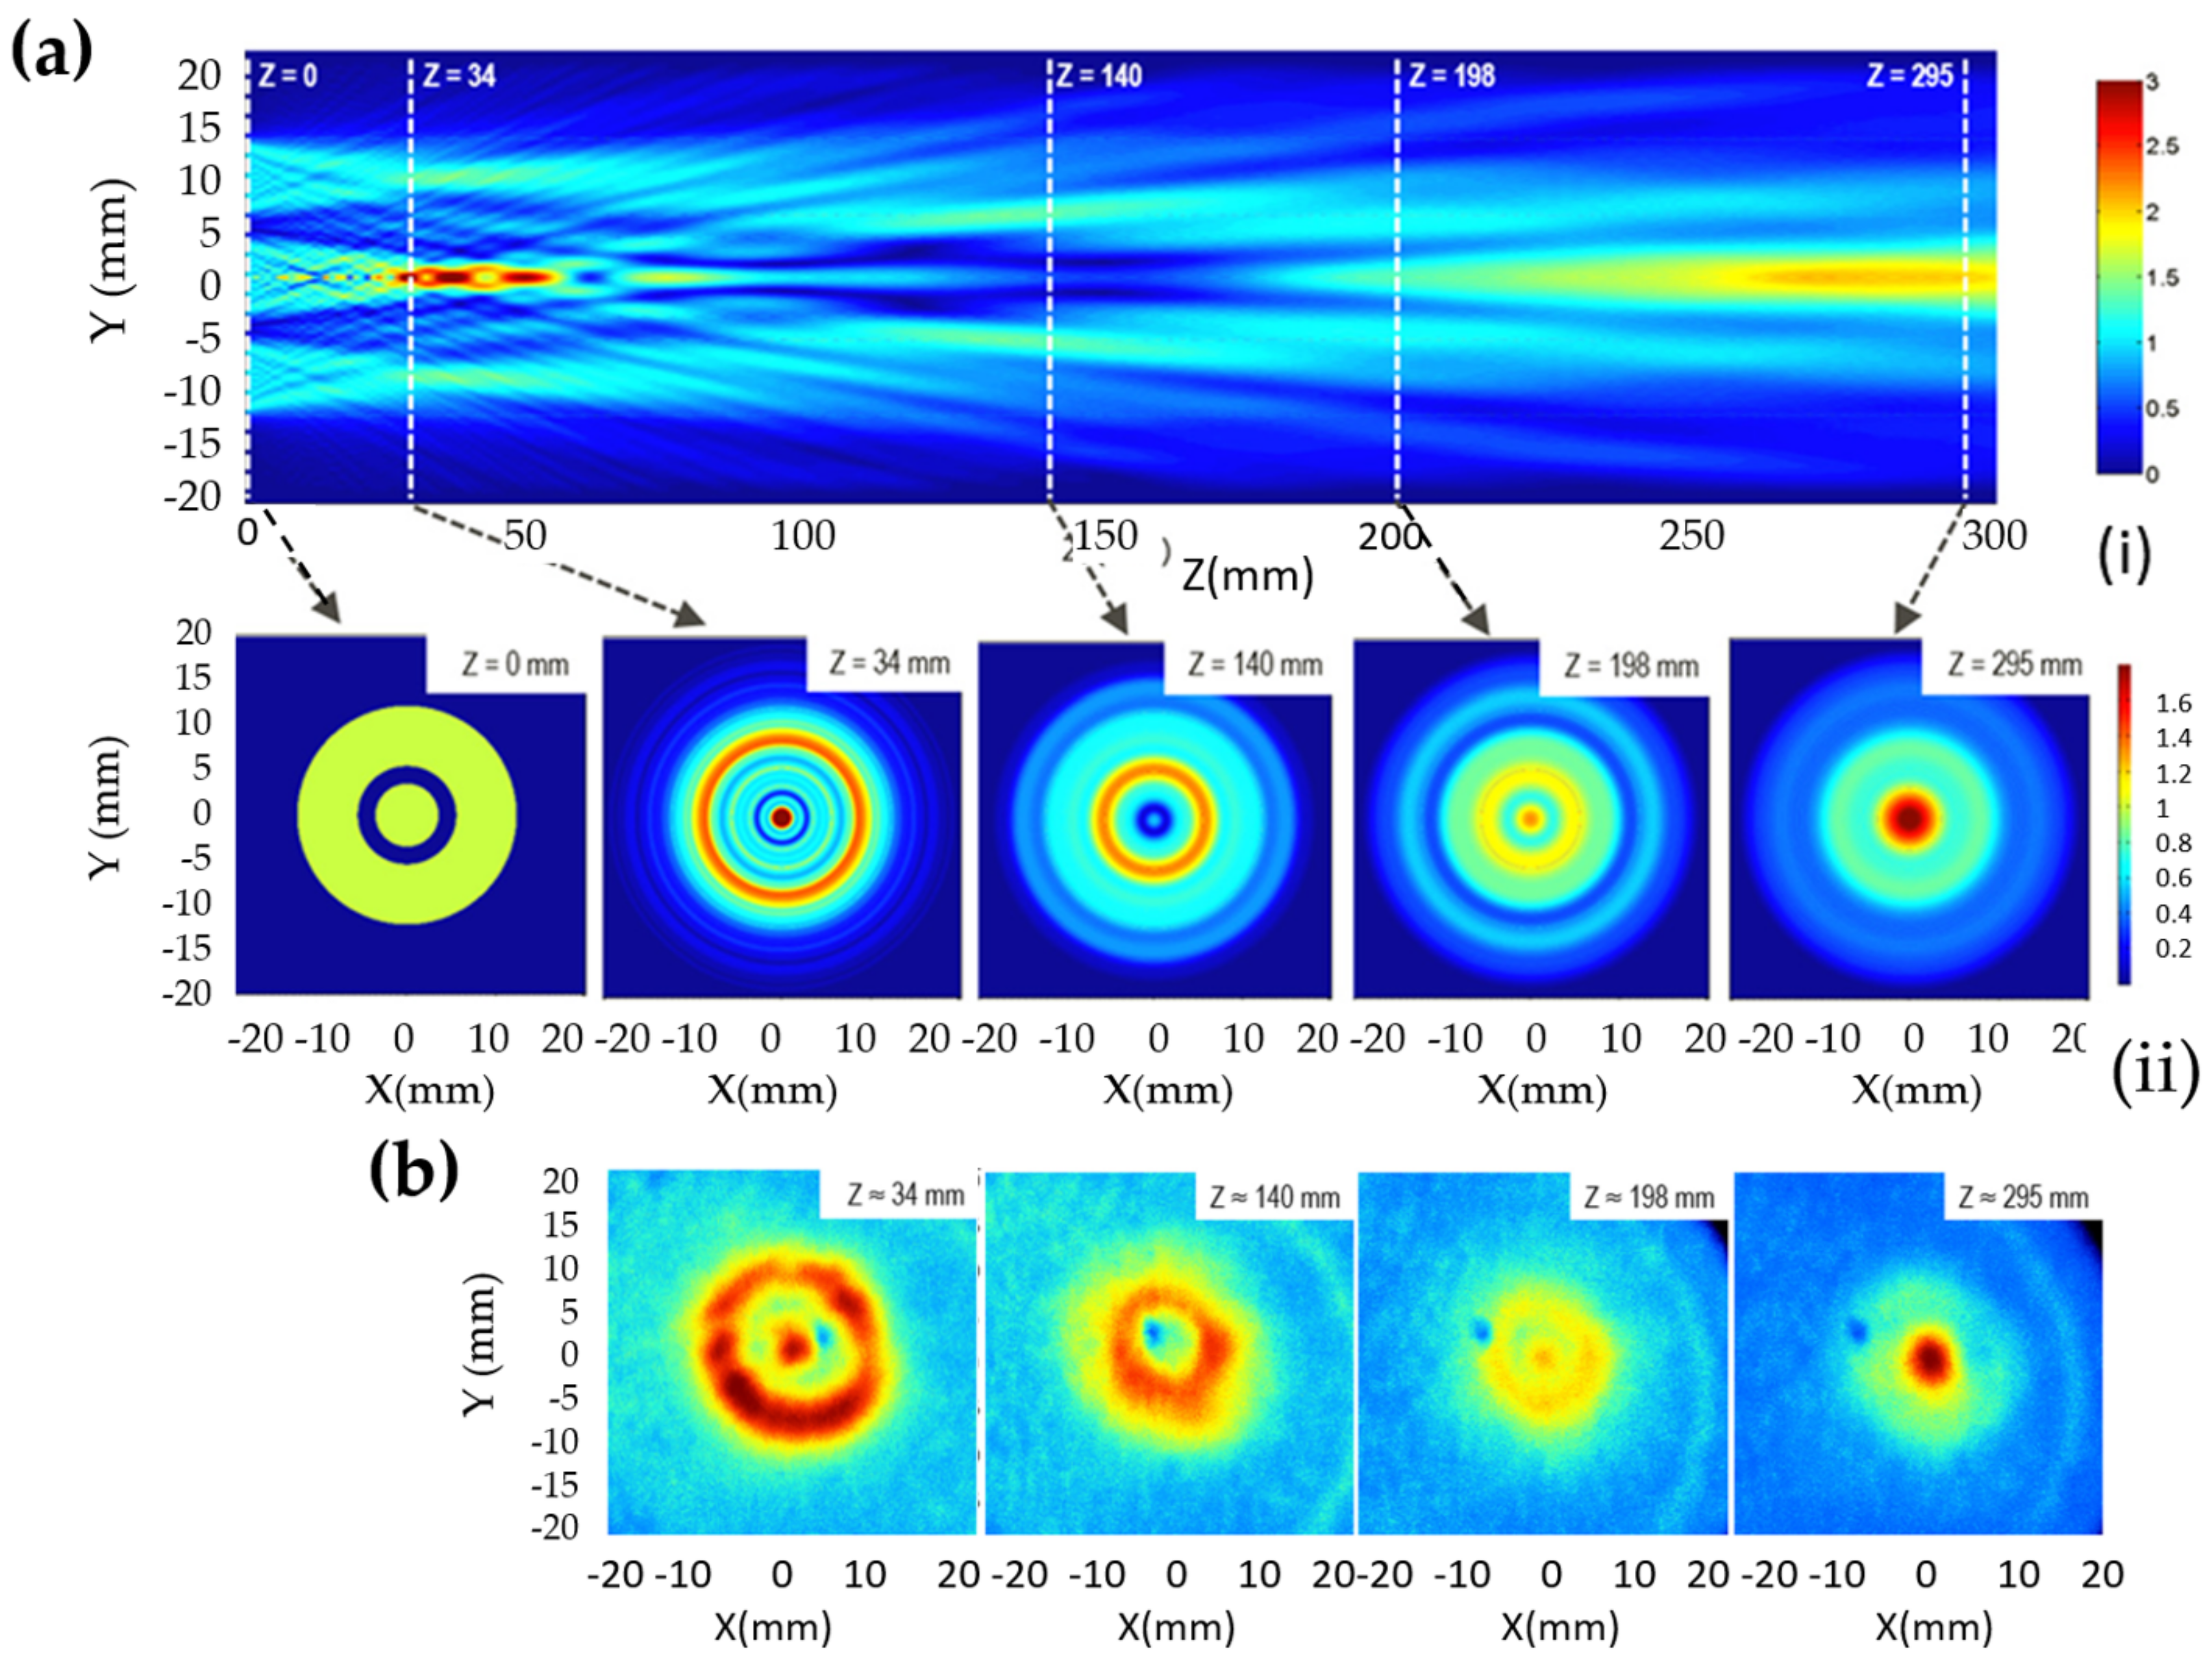
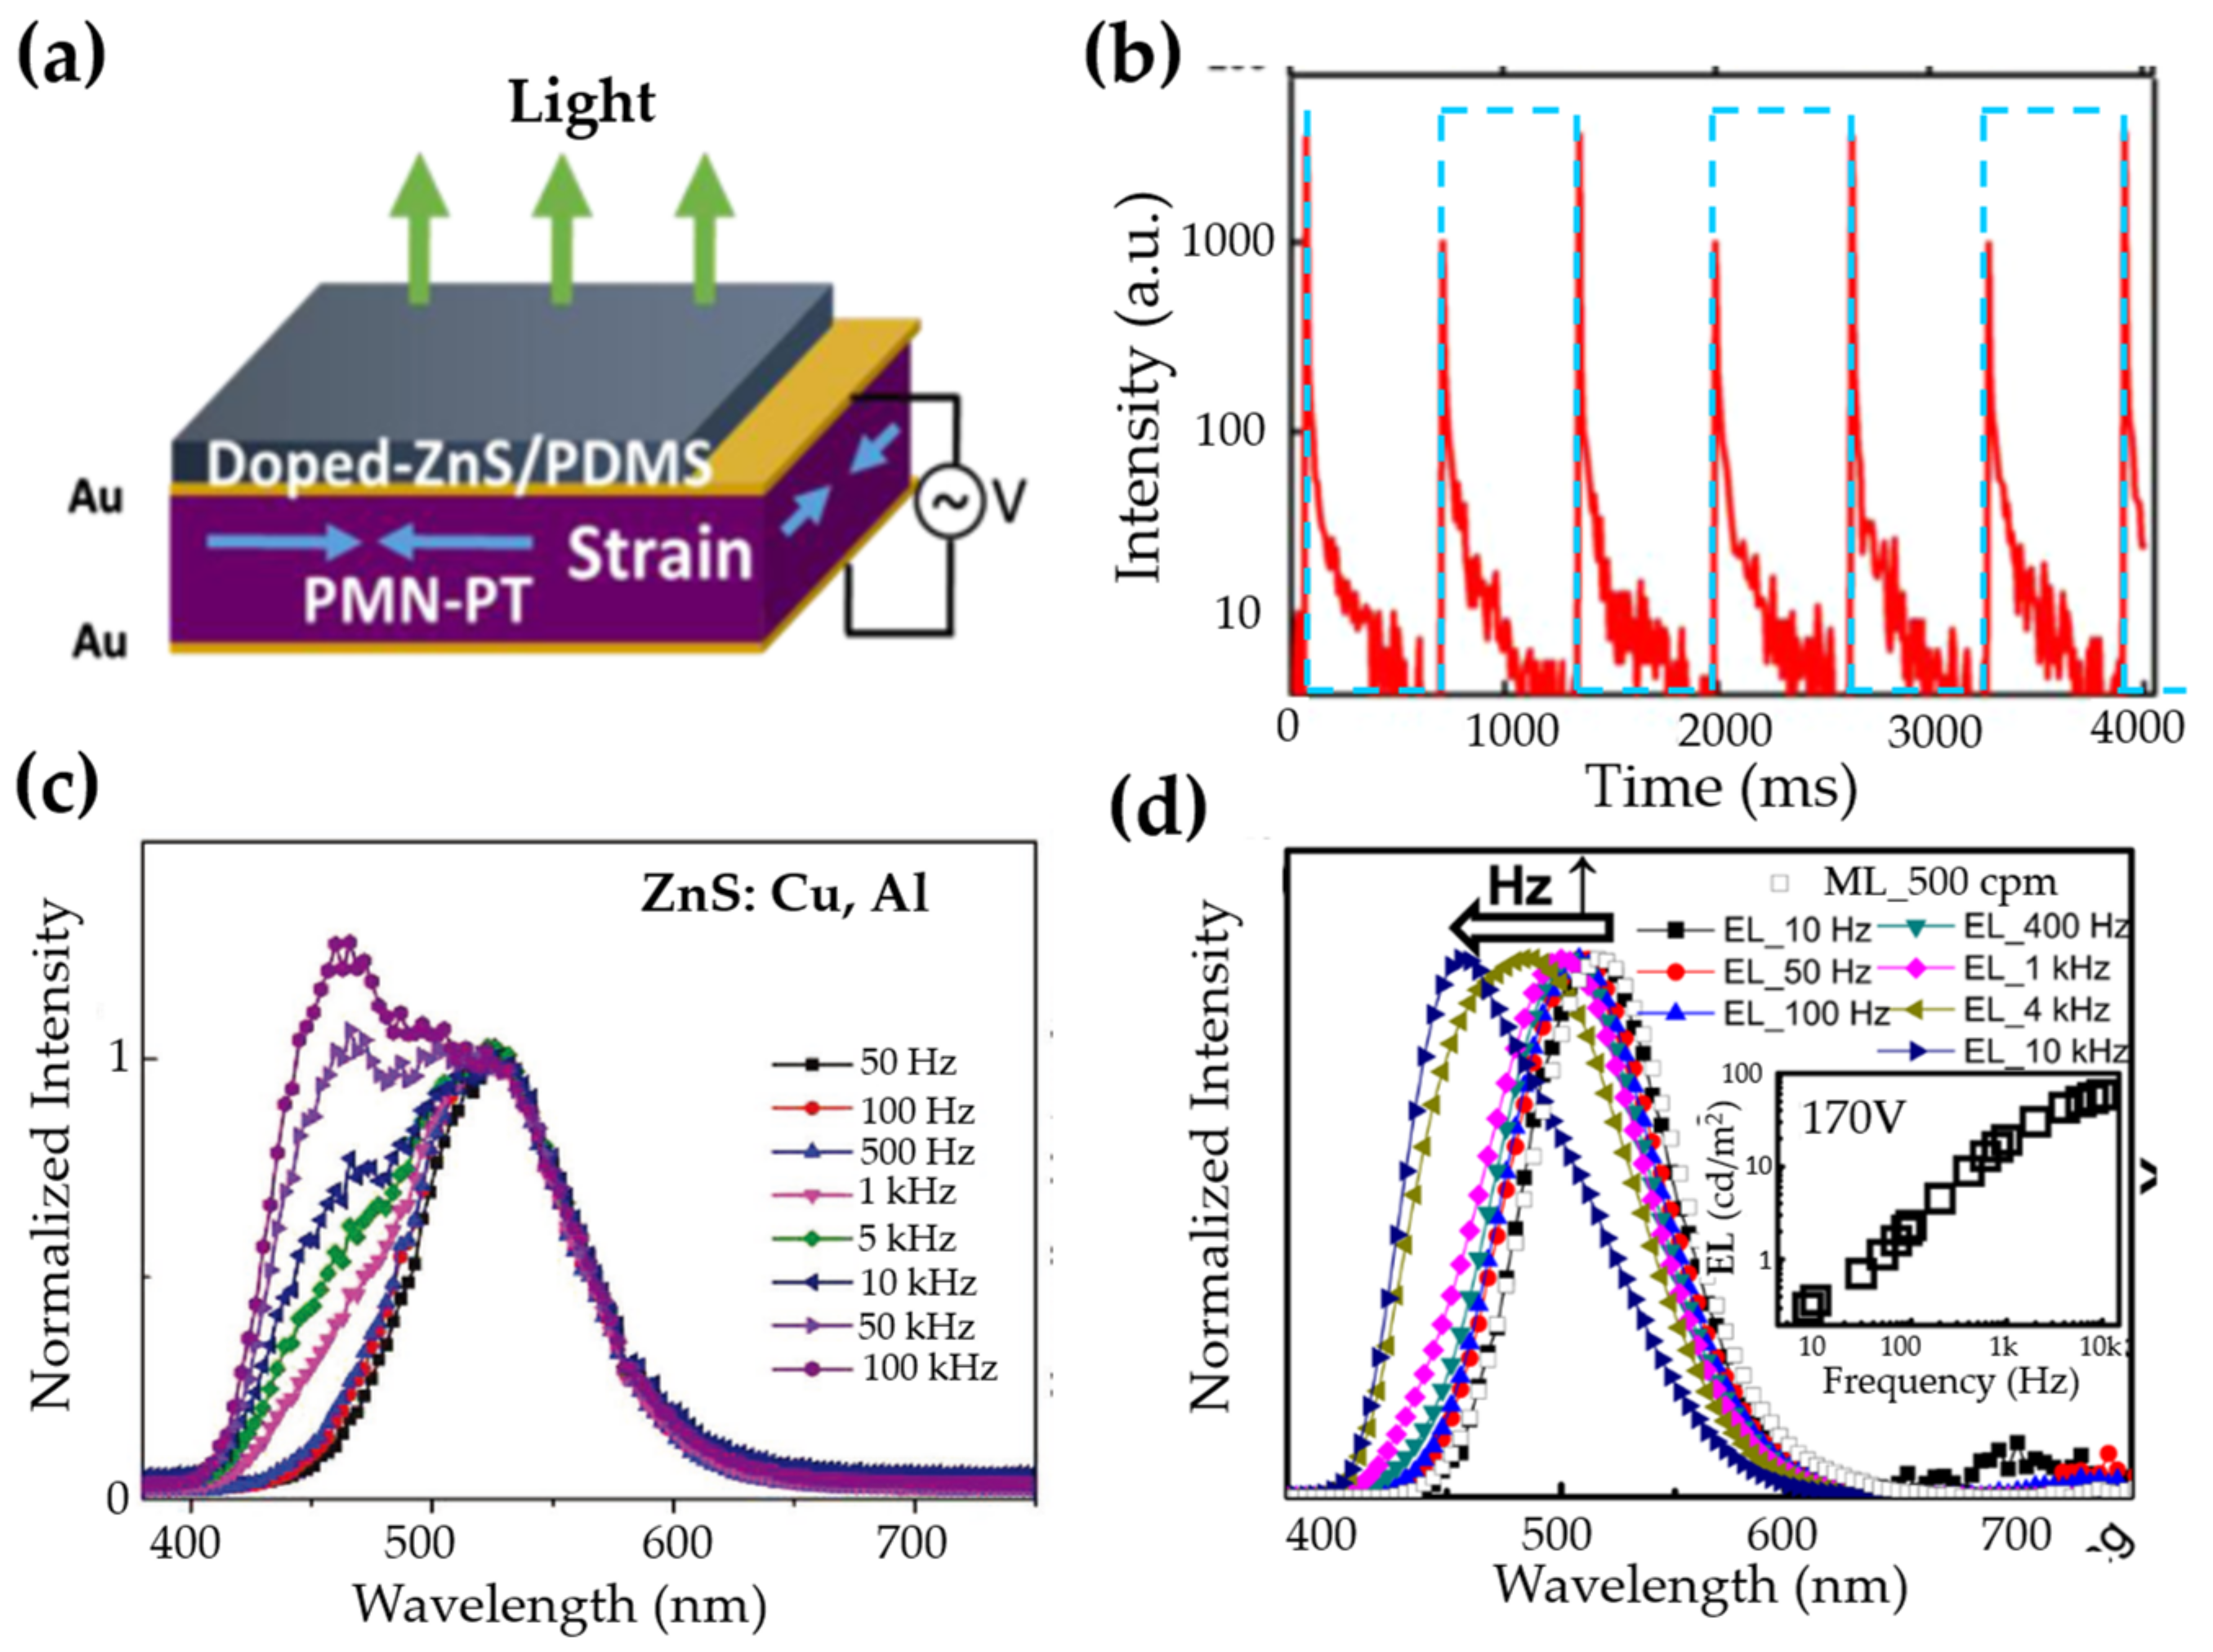
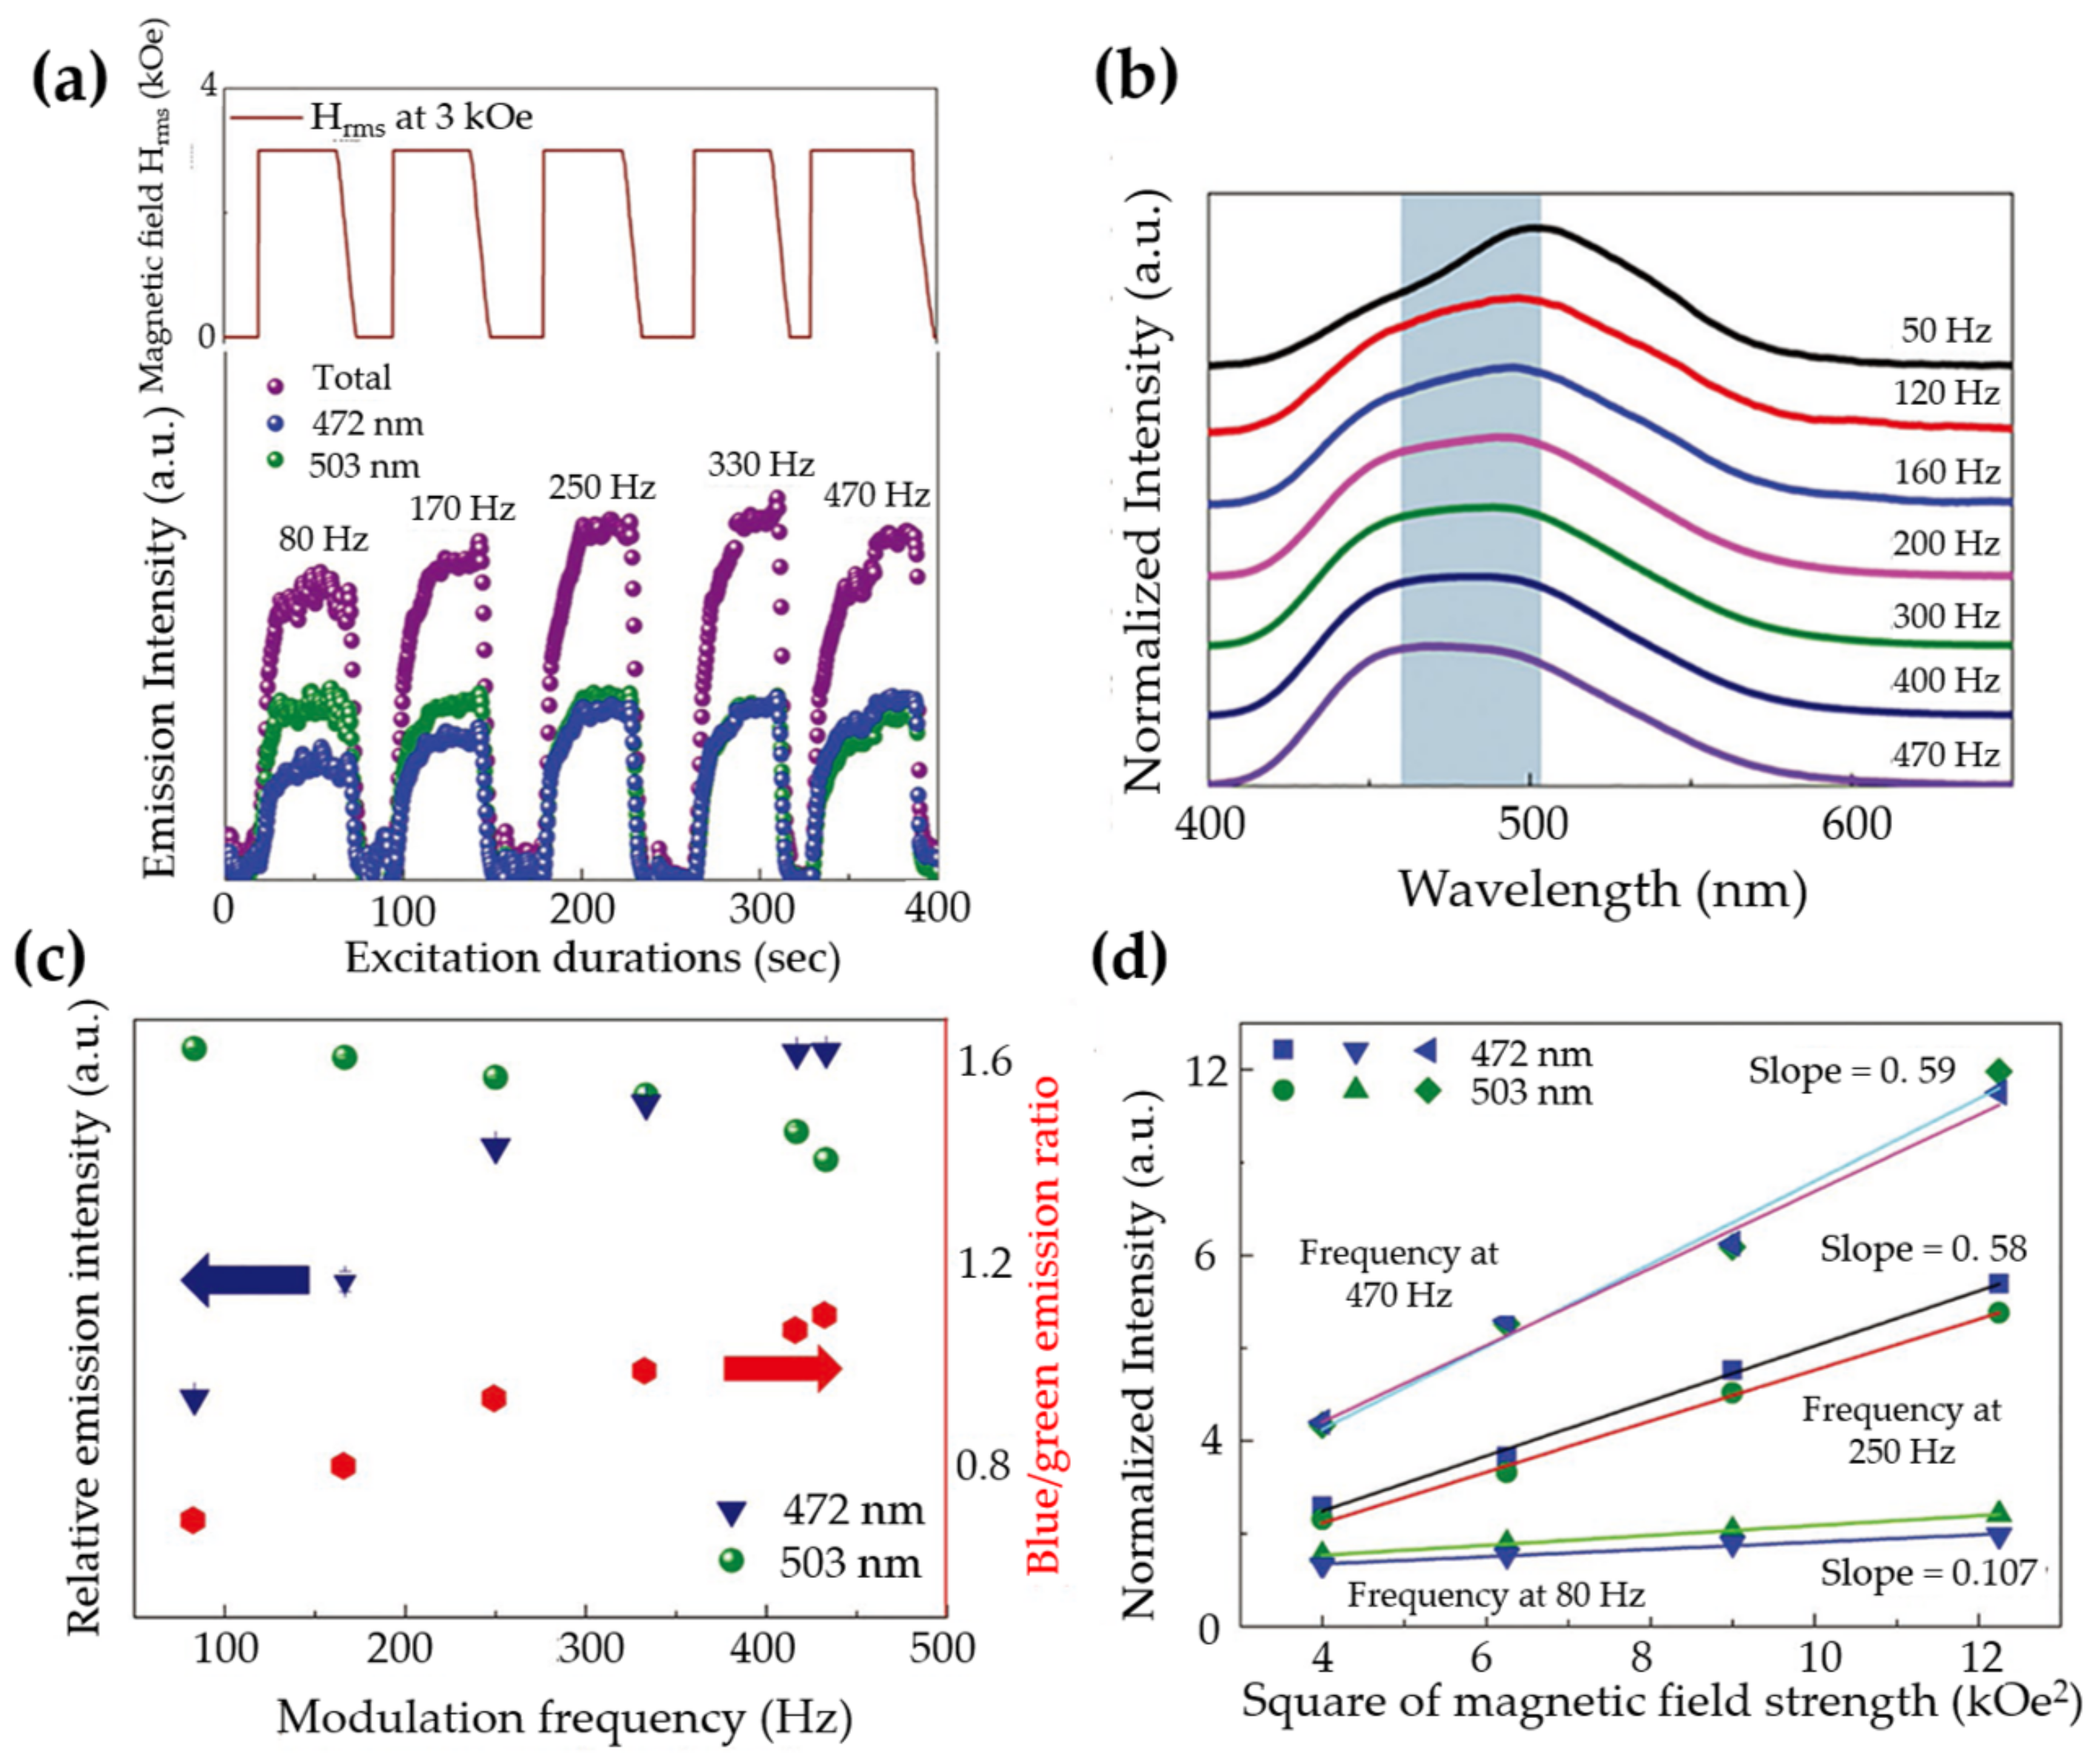
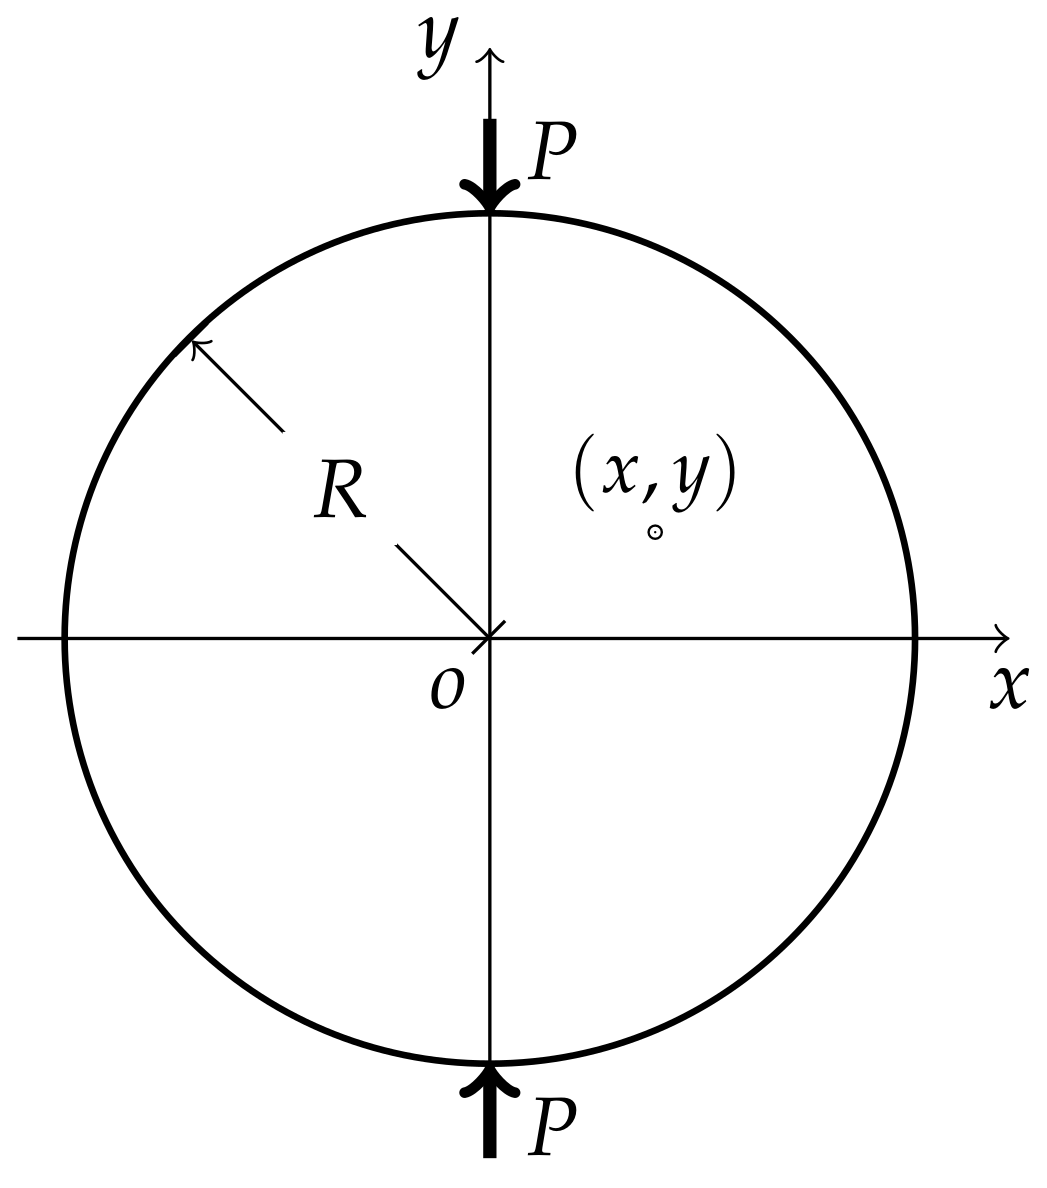
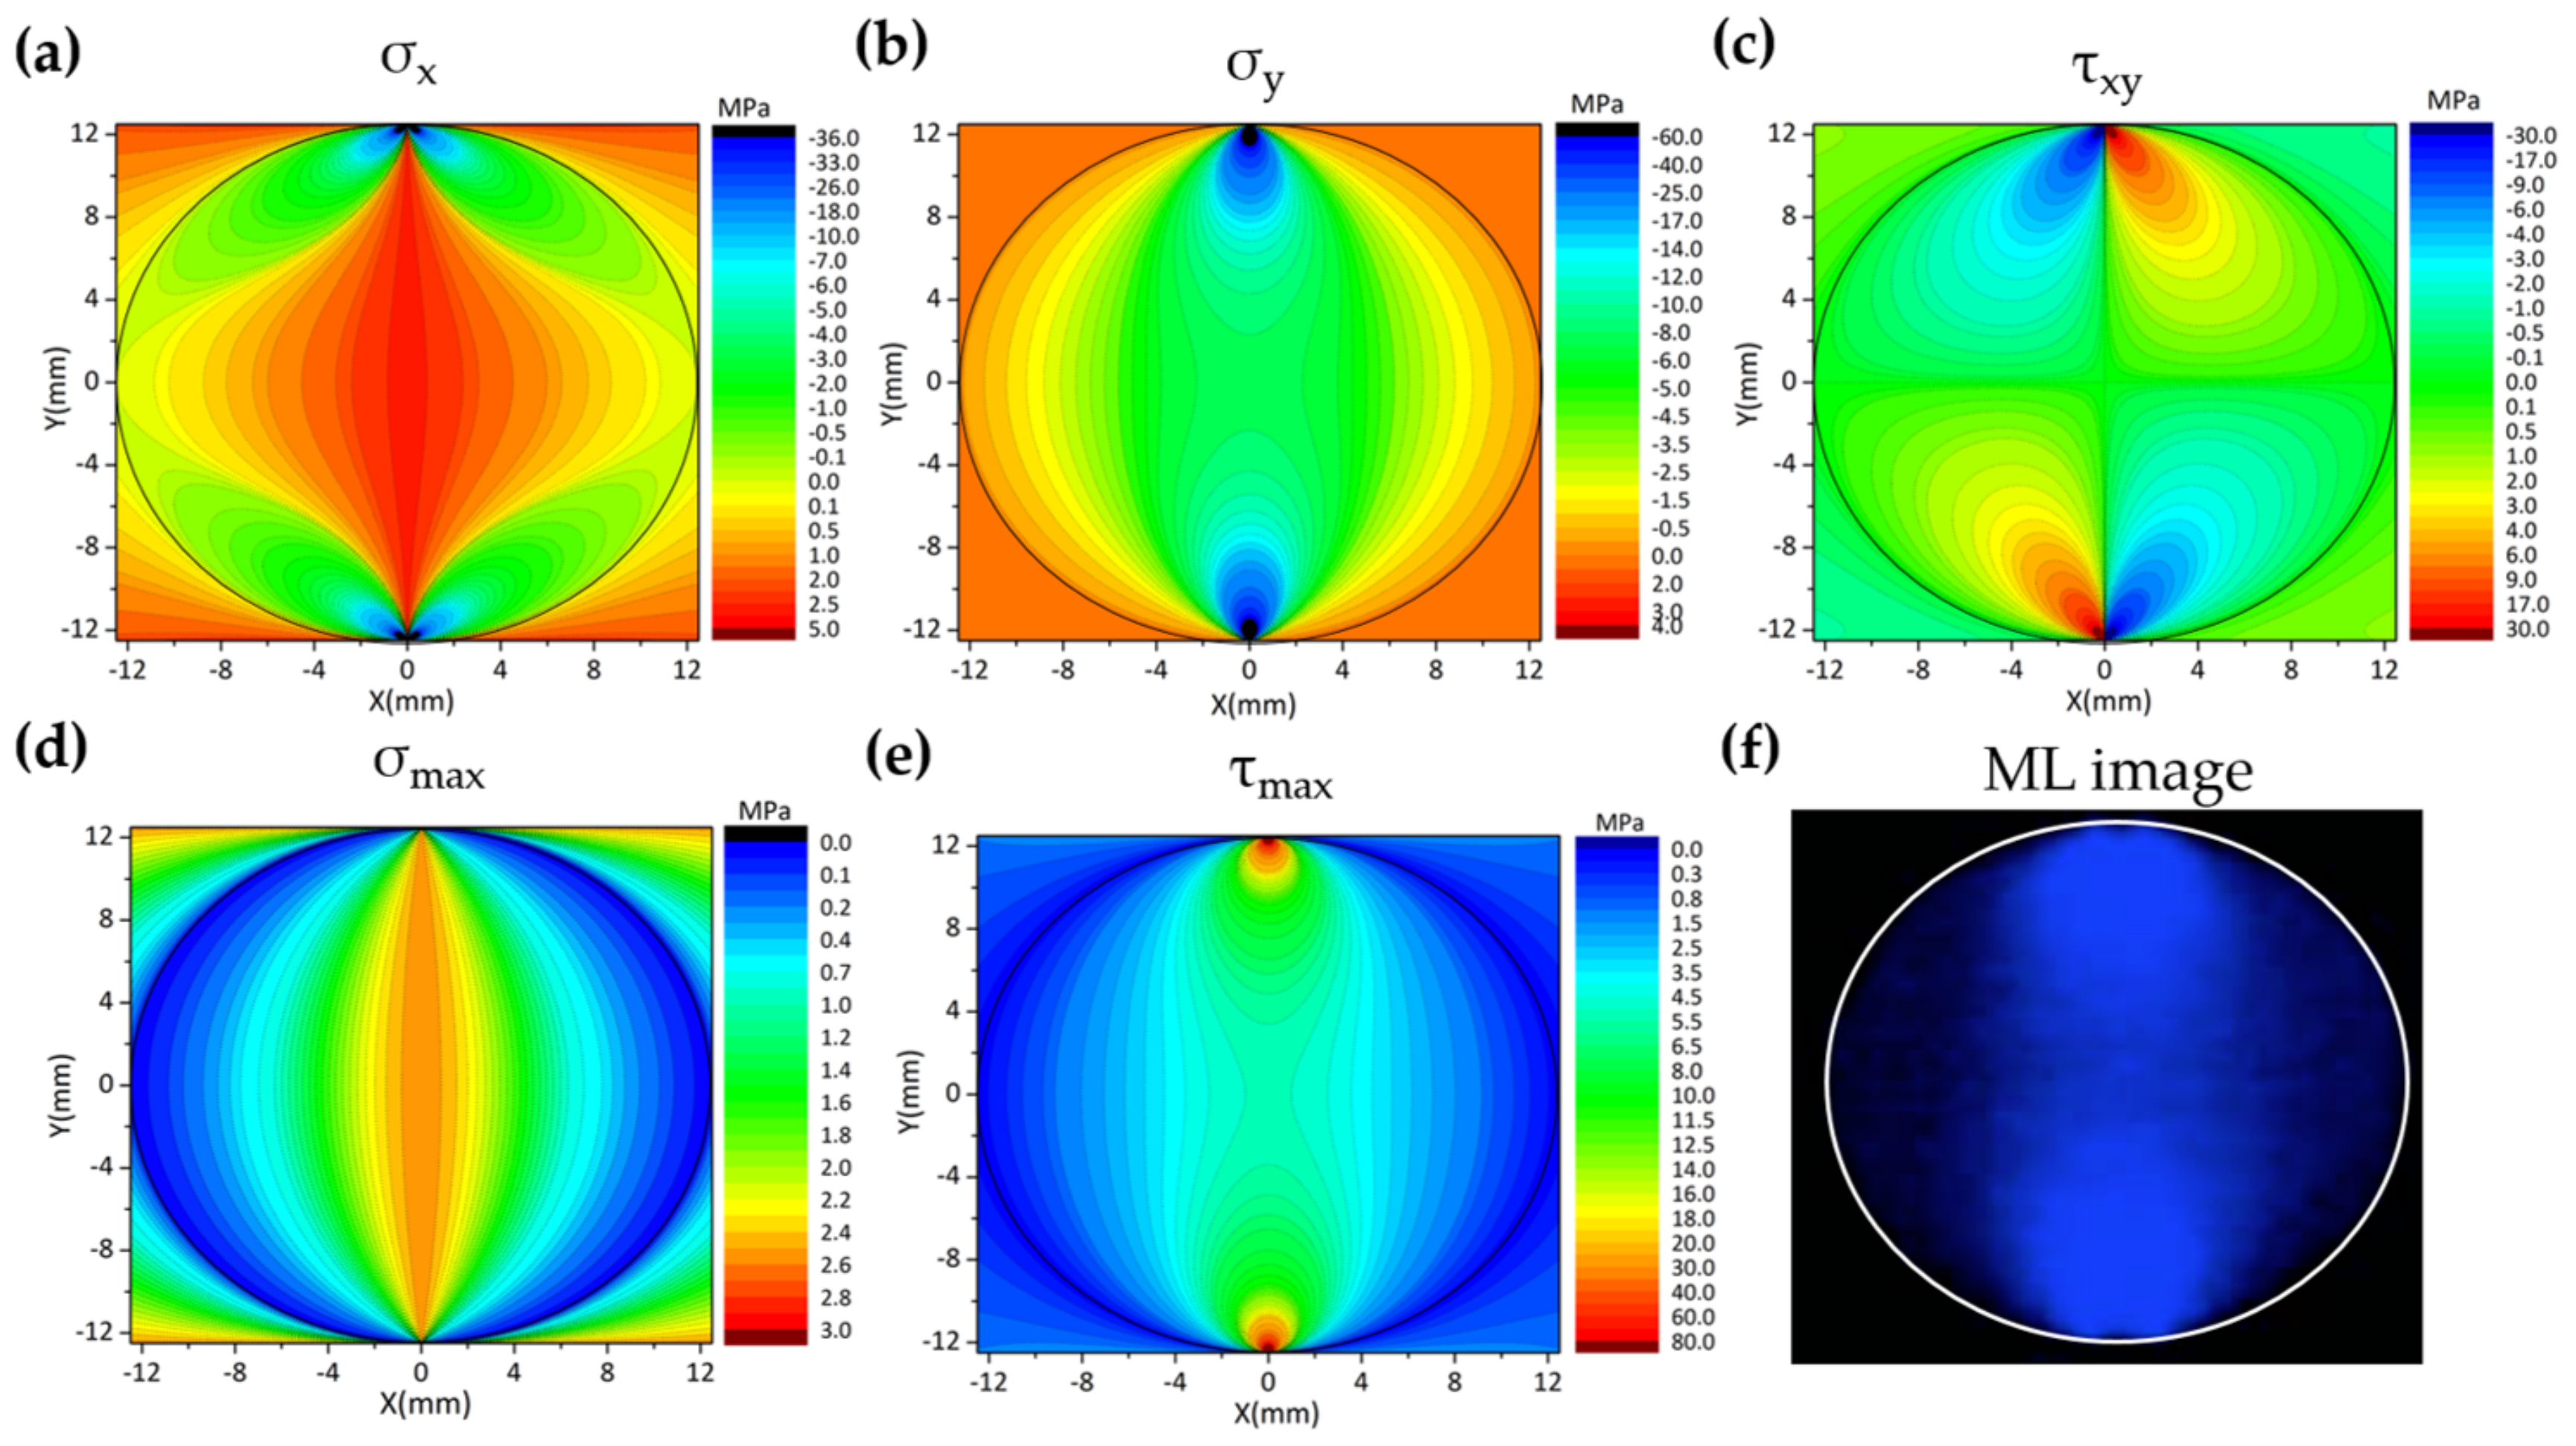
Table 1.
Reported mechanoluminescent compounds and their properties.
| Structure | Host | Space Group | Piezo | Dopants | (nm) | PerL, Trap Depth (eV) | Load | ML Indicators |
|---|---|---|---|---|---|---|---|---|
| Rock Salt | KCl | Fmm | − | - | 430, 520 | + [63,64], 0.22, 0.37, 0.51, 1.12 [65] | E, P [63,64,66,67] | ?, ? |
| KCl | Fmm | − | Eu | 420 | + [68] | E, P [69] | ?, ? | |
| KI | Fmm | − | - | 515 | + [63,64], 0.20, 0.21, 0.22, 0.29, 0.32, 0.43 [70] | E, P [63,64] | ?, ? | |
| KBr | Fmm | − | - | 465 | + [63,64], 0.27, 0.28, 0.29, 0.35, 0.36, 0.44 [71] | E, P [63,64] | ?, ? | |
| NaF | Fmm | − | - | 270, 306, 334, 410, 610 | + [64], 0.31, 0.57, 0.67, 0.84, 1.0, 1.22 [70] | E, P [64] | ?, ? | |
| NaCl | Fmm | − | - | 282, 318, 362, 610 | + [63,64], 0.74, 0.86, 0.99, 1.20, 1.47 [71] | E, P [63,64] | ?, ? | |
| LiF | Fmm | − | - | 290, 560, 650 | +, 0.25, 0.26, 0.36, 0.46, 0.53, 0.78 [70] | E, P [63,64,72] | ||
| RbCl | Fmm | − | - | 510, 430 | + [64], 1.65 [73] | E, P [64] | ?, ? | |
| RbBr | Fmm | − | - | 465, 495 | + [64], 1.55, 1.78 [74] | E, P [64] | ?, ? | |
| RbI | Fmm | − | - | 525, 630 | + [64], ? | E, P [64] | ?, ? | |
| MgO | Fmm | − | - | 420, 520 | ?, 0.31 [75] | E, P [76] | (0.1, ?), ? | |
| Tridymite | SrAlO | P2 | + | Eu | 520 | +, 0.77 [77,78] | E, T [79] | (40, 900) [19], - |
| SrAlO | P2 | + | Eu/Dy | 520 | +, 0.65 [77,78] | E [80,81,82] | (0, >1.0 k), - | |
| SrAlO | P2 | + | Eu/Er | 524, 1530 | + [77,78], 0.75 [83] | E [84] | (30, 750)(IR), - | |
| SrAlO | P2 | + | Ce | 381, 450 | + [85], 0.75 [86] | E [87] | (∼0, 500), 0.005 | |
| SrAlO | P2 | + | Ce/Ho | 381, 450 | + [85], ? | E [87] | (30, 700), 0.052 | |
| SrAlO | P2 | + | Eu/Dy/Nd | 520 | + [88] , ? | E, P [89,90] | -, - | |
| SrAlO | P2 | + | Eu/B | 520 | +, 0.77 | E, T | ?, - | |
| CaAlO | P2/n | − | Eu | 440 | + [91], 0.42, 0.53, 0.58 [92] | I [93] | -, - | |
| CaAlO | P2/n | − | Tb | 495,545 | +, 0.66, 1.08 [94] | I [95] | -, - | |
| SrBaAlO (x = 0, 0.1, 0.2, 0.4) | P6(x = 0.4) P2(others) | + | Dy | 480,575 | ?, ? | T [96] | -, - | |
| SrBaAlO (x = 0, 0.1, 0.2, 0.4) | P6(x = 0.4) P2(others) | + | Eu/Eu | 520, 613, 700 | + [97], ? | T [98] | -, - | |
| SrCaAlO | P2 | + | Dy | 480, 575 | +, ? | T [96] | -, - | |
| ZnGeSiO | R3 | + | Mn | 535 | +, 40 C [99] | E [100] | (600, 2.8k), ∼10 | |
| Spinels | MgGaO | Fdm | − | Mn | 506 | +, 60 C [101] | T [101] | ?, ? |
| ZnGaO | Fdm | − | Mn | 505 | +, 70 C [102] | T [101] | ?, ? | |
| ZnAlO | Fdm | − | Mn | 560 | +, 125 C [103] | T, I [103,104,105] | ?, ? | |
| Wurtzite | ZnS | P6mc | + | Mn | 585 | −, 0.3 [106] | E, P, T [107,108,109,110,111,112,113,114,115,116,117] | (0.6, 50), 0.7|2.2 |
| ZnS | P6mc | + | Cu | 520 | + [118], 0.20–0.30, 0.42–0.46, 0.54–0.60 [119,120] | E [14,121,122,123,124,125,126] | ?, ? | |
| ZnS | P6mc | + | Mn/Cu(Al) | 517, 587 | +, ? | E [13,17,22,127,128] | ?, ? | |
| ZnS | P6mc | + | Cu/Al | (475), 525 | +, ? | E [22,123] | ?, ? | |
| ZnTe | P6mc | + | Mn | ? | −, ? | T [129] | ∼0, ? | |
| (ZnS)(MnTe) (x < 1/4) | P6mc | + | Mn | 650 | ?, ? | I [130,131,132] | ?, ? | |
| CaZnOS | P6mc | + | - | 438, 515, 614 | −, 0.17, 0.58 [133] | T, E, I [133] | ?, ? | |
| CaZnOS | P6mc | + | Mn | 580 | −, 0.18, 0.58, 0.67 [134] | T, E [134,135] | (0, 1.0 k), ∼0.325 | |
| CaZnOS | P6mc | + | Cu | 450, 530 | +, 0.42, 0.71 [136] | E [136,137,138] | (0, 350), ? | |
| CaZnOS | P6mc | + | Er | 525, 540, 560 | − [139], ? | E [139] | ?, ? | |
| CaZnOS | P6mc | + | Sm | 566, 618, 655 | −, ? | E, T [140] | (13, 65), 0.48 | |
| BaZnOS | Cmcm | − | Mn | 634 | + [141], 0.83 [142] | E [141,142] | (∼100, 5.0 k), 1.0 | |
| Melilite | CaMgSiO | P2m | + | Eu | 530 | + [143], 90 C [144] | E [145] | (0, 1.0 k), < |
| CaMgSiO | P2m | + | Eu/Dy | 530 | +, 0.66 [143,146,147] | E [148,149,150] | (∼70, 1.0 k), 1.433 | |
| SrMgSiO | P2m | + | Eu | 499 | + [151], 0.50 [11] | E [11] | (∼70, ?), 1.134 | |
| SrMgSiO | P2m | + | Eu/Dy | 460 | +, 0.75 [147,152,153] | I [148,154] | ?, ? | |
| BaMgSiO | C2/c | + | Eu/Dy | 495 | + [155], ? | I [156] | ?, ? | |
| SrCaMgSiO | P2m | + | Eu | 496 | +, 0.47 [11] | E [157] | (∼70, 1.0 k), 1.02 | |
| SrBaMgSiO | P2m | + | Eu | 440 | +, 0.55 [11] | E [11] | (∼0, 1.0 k), 0.213 | |
| SrMgSiO () | P2m | + | Eu | 468 | +, 0.45, 0.78 [158] | E [158] | ?, ? | |
| CaAlSiO | P2m | + | Ce | 417 | +, 90 C [159] | E [23,160] | (220, 1.0 k), - | |
| SrAlSiO | P2m | + | Eu | 484 | +, 0.88 [161] | I [162,163] | -, - | |
| SrAlSiO | P2m | + | Eu/Dy | 484 | +, 0.52 [161] | I [162,163] | -, - | |
| CaYAlO | P2m | + | Eu | 440 | + [164], ? | E [165] | (30, 1.0 k), 0.03 | |
| CaYAlO | P2m | + | Ce | 425 | +, 80 C [159] | E [166] | (10, 1.0 k), - | |
| Anorthite | CaAlSiO | P | − | Eu | 430 | +, 0.68, 0.82 [167] | E [168] | (33, >1.0 k), 0.748 |
| CaSrAlSiO () | I | − | Eu | 406–440 | + [169], ? | E [168,170,171] | (44, 400), 1.12 (x = 0.4) | |
| SrMg(PO) | Pm | + | Eu | 412 | +, 0.77 [172] | E [57] | (∼0, >1.0 k), - | |
| Perovskite | BaCaTiO () | P4mm+Pbnm | + | Pr | 612 | + [173], 0.356 [174] | E [175,176,177,178] | (70, >1.0 k), 0.006 |
| BaCaTiO | P4mm+Pbnm | + | Pr/Dy | 612 | +, 0.35 [173] | E [174,179] | (∼0, >900), 0.003 | |
| BaCaTiO | P4mm+Pbnm | + | Pr/La-Lu | 612 | +, 0.31–0.38 [173], 0.00 for Ce [173] | E [174] | ?, ? | |
| LiNbO | R3c | + | Pr | 612 | ?, ? | E [180] | (30, 1.0 k)?, - | |
| SrSnO | Pccn | − | Sm | 575, 625, 660 | + [181], 117 C, 187 C [182] | E [183] | (15, >250), - | |
| (Ca, Sr, Ba)SnO | Pccn | − | Sm/La | 575, 625, 660 | +, 0.56, 0.84, 1.35 [185,186] | E [186] | (20, 100), - | |
| SrSnO | Amam | − | Sm | 575, 625, 660 | + [184], ? | E [183] | (15, 250)?, - | |
| Sr(Sn, Si)O | Amam | − | Sm | 575, 625, 660 | +, 113 C [187] | E [187] | (?, ∼2350), ∼1.3 | |
| Sr(Sn, Ge)O | Amam | − | Sm | 575, 625, 660 | +, 117 C [187] | E [187] | (?, ∼2350), ∼2.1 | |
| CaTiO | Ccm2 | + | Pr | 615 | +, 0.69–0.92 [188] | E,T [189] | (∼10, 200), - | |
| CaNbO | Pbcn | − | Pr | 613 | − [29], 0.71, 0.81, 1.04 [29] | E [29] | (∼30, 1.0 k), 0.001 | |
| CaNbO | P2 | + | Pr | 613 | + [29], 0.60, 0.89, 1.04, 1.27 [29] | E [29] | (∼0, 1.0 k), 0.016 | |
| CaNbO | Fm3m or P4/nnc | + | Pr | 613 | − [29], 0.74 [29] | E [29] | (∼50, 1.0 k), 0.004 | |
| MSiON (M = Ca, Sr, Ba) | BaSiON | Cmcm | + | Eu | 498 | + [190], 0.46, 0.48 [191] | E [192] | -, - |
| SrSiON | P1 | + | Eu | 498 | +, 100 C [190] | E [192] | -, - | |
| Others | CaZr(PO) | Pna2 [193] | + | Eu | 474 | +, 0.69, 0.83, 1.17, 1.87 [194] | E [194] | (5, >2.0 k), - |
| ZrO | P2/c | − | Ti | 470 | + [195], 0.81, 1.00, 1.16 [196] | E [197,198] | (∼0, 100), - |
Notes: Piezo : + = piezoelectric, − = not piezoelectric; Dopants : − = undoped; PerL, trap depth (eV) : PerL = Persistent luminescence, + = yes, − = no, the main traps are in italic; Load : E = Elastic, P = Plastic, T = Friction, I = low velocity impact; ML Indicators : format: linear range (N, N) in Newton (italic for MPa), sensitivity in kcps/N (italic for kcps/MPa). ? denote unknown and - incalculable from the references.
Table 2.
Structure disorder at the microstructure level for some ML compounds.
| Host | HT Phase | Atomic Order | Domains | Twins |
|---|---|---|---|---|
| SrAlO | P6 (680–860 C) P622 (>860 C) | Al displacement, modulation q = (0, 0.5, 0) [30,247,248] | translational, ferroelastic, ferroelectric [30,247,248] | 3 types [30,247,248] |
| BaAlO | P622 [249,250,251] | modulation q = (0.5, 0, 0) (<250 K) [252] | translational, orientational, nano, APBs [249,250] | 180 rotational twins [249,250] |
| SrCaAlO | P622, C2 [253] | ? | ferroelectric | ? |
| SrBaAlO () | P622, C2 [253] | Al displacement, modulation q = (0, 0.5, 0) [253] | ferroelastic ferroelectric | twins [247] |
| SrBaAlO | P622 (>500 K) [214] | [AlO] fluctuation, O disorder [253,254] | ferroelectric [253,254] | ? |
| MgGaO | ? | Mg disorder, inverse spinel [101] | ? | ? |
| CaAlSiO | I [255] (>514 K) | ∼8% Al, Si disorder [256] | APBs [257] | twins [258]//(010) |
| SrAlSiO | Immm [259] | Al, Si disorder | APBs [259] | twins [259] |
| BaAlSiO | Immm [260] | ? | APBs [260] | ? |
| CaSrAlSiO () | I [261] | ? | ? | ? |
| CaSrAlSiO ( 0.60–0.85) | I [262,263] | O disorder [264] | APBs [264] | albite twins [264] |
| CaSrAlSiO () | I | Al-Si disorder [256] | ? | ? |
| CaMgSiO | P [265] (>355 K) | modulation [223] | micro [225,266] | ? |
| CaAlSiO | P | Al-Si order@T, Al partly order@T | ? | ? |
| CaSrMgSiO () | P 350–295 K | ‘Titan’ modulation, Sr order [225,266] | micro [225,266] | ? |
| Ca(AlMg)-(AlSi)O | ? | Al, Si order [228] | twins [228] | |
| CaTiO | ? | Ti displacement | ? | twins [267,268] |
| BaTiO | Pmm | Ti displacement | ferroelectric ferroelastic | twins [269] |
| LiNbO | Rc (>1470 K) | Li [180] vacancies | ? | ? |
| SrSnO | Bmab [270] (400–600 K) Imm [270] (>600 K) | vacancies | ? | ? |
| -CaZr(PO) | Pnma [193] (>1000 C) | ? | ? | ? |
| BaSiON | ? | disorder [241] | domains [192,241] | twins [271] |
| SrSiON | ? | ? | domains [271] | ? |
| ZrO | Pmc [272] (>1500 K) | ? | ? | ? |
Notes: HT Phase : high temperature phase; Atomic Order : q is the modulation vector; Domains : APBs = anti-phase boundaries; ? = data unavailable.
© 2018 by the authors. Licensee MDPI, Basel, Switzerland. This article is an open access article distributed under the terms and conditions of the Creative Commons Attribution (CC BY) license (http://creativecommons.org/licenses/by/4.0/).
Share and Cite
MDPI and ACS Style
Feng, A.; Smet, P.F. A Review of Mechanoluminescence in Inorganic Solids: Compounds, Mechanisms, Models and Applications. Materials 2018, 11, 484. https://doi.org/10.3390/ma11040484
AMA Style
Feng A, Smet PF. A Review of Mechanoluminescence in Inorganic Solids: Compounds, Mechanisms, Models and Applications. Materials. 2018; 11(4):484. https://doi.org/10.3390/ma11040484
Chicago/Turabian StyleFeng, Ang, and Philippe F. Smet. 2018. "A Review of Mechanoluminescence in Inorganic Solids: Compounds, Mechanisms, Models and Applications" Materials 11, no. 4: 484. https://doi.org/10.3390/ma11040484
Note that from the first issue of 2016, this journal uses article numbers instead of page numbers. See further details here.