Influence of the Quartz Deformation Structures for the Occurrence of the Alkali–Silica Reaction

 , ,
, , 
Abstract
:1. Introduction
2. Materials and Methods
2.1. Selection of the Samples
2.2. Preparation of the Samples
2.3. Methods
3. Results
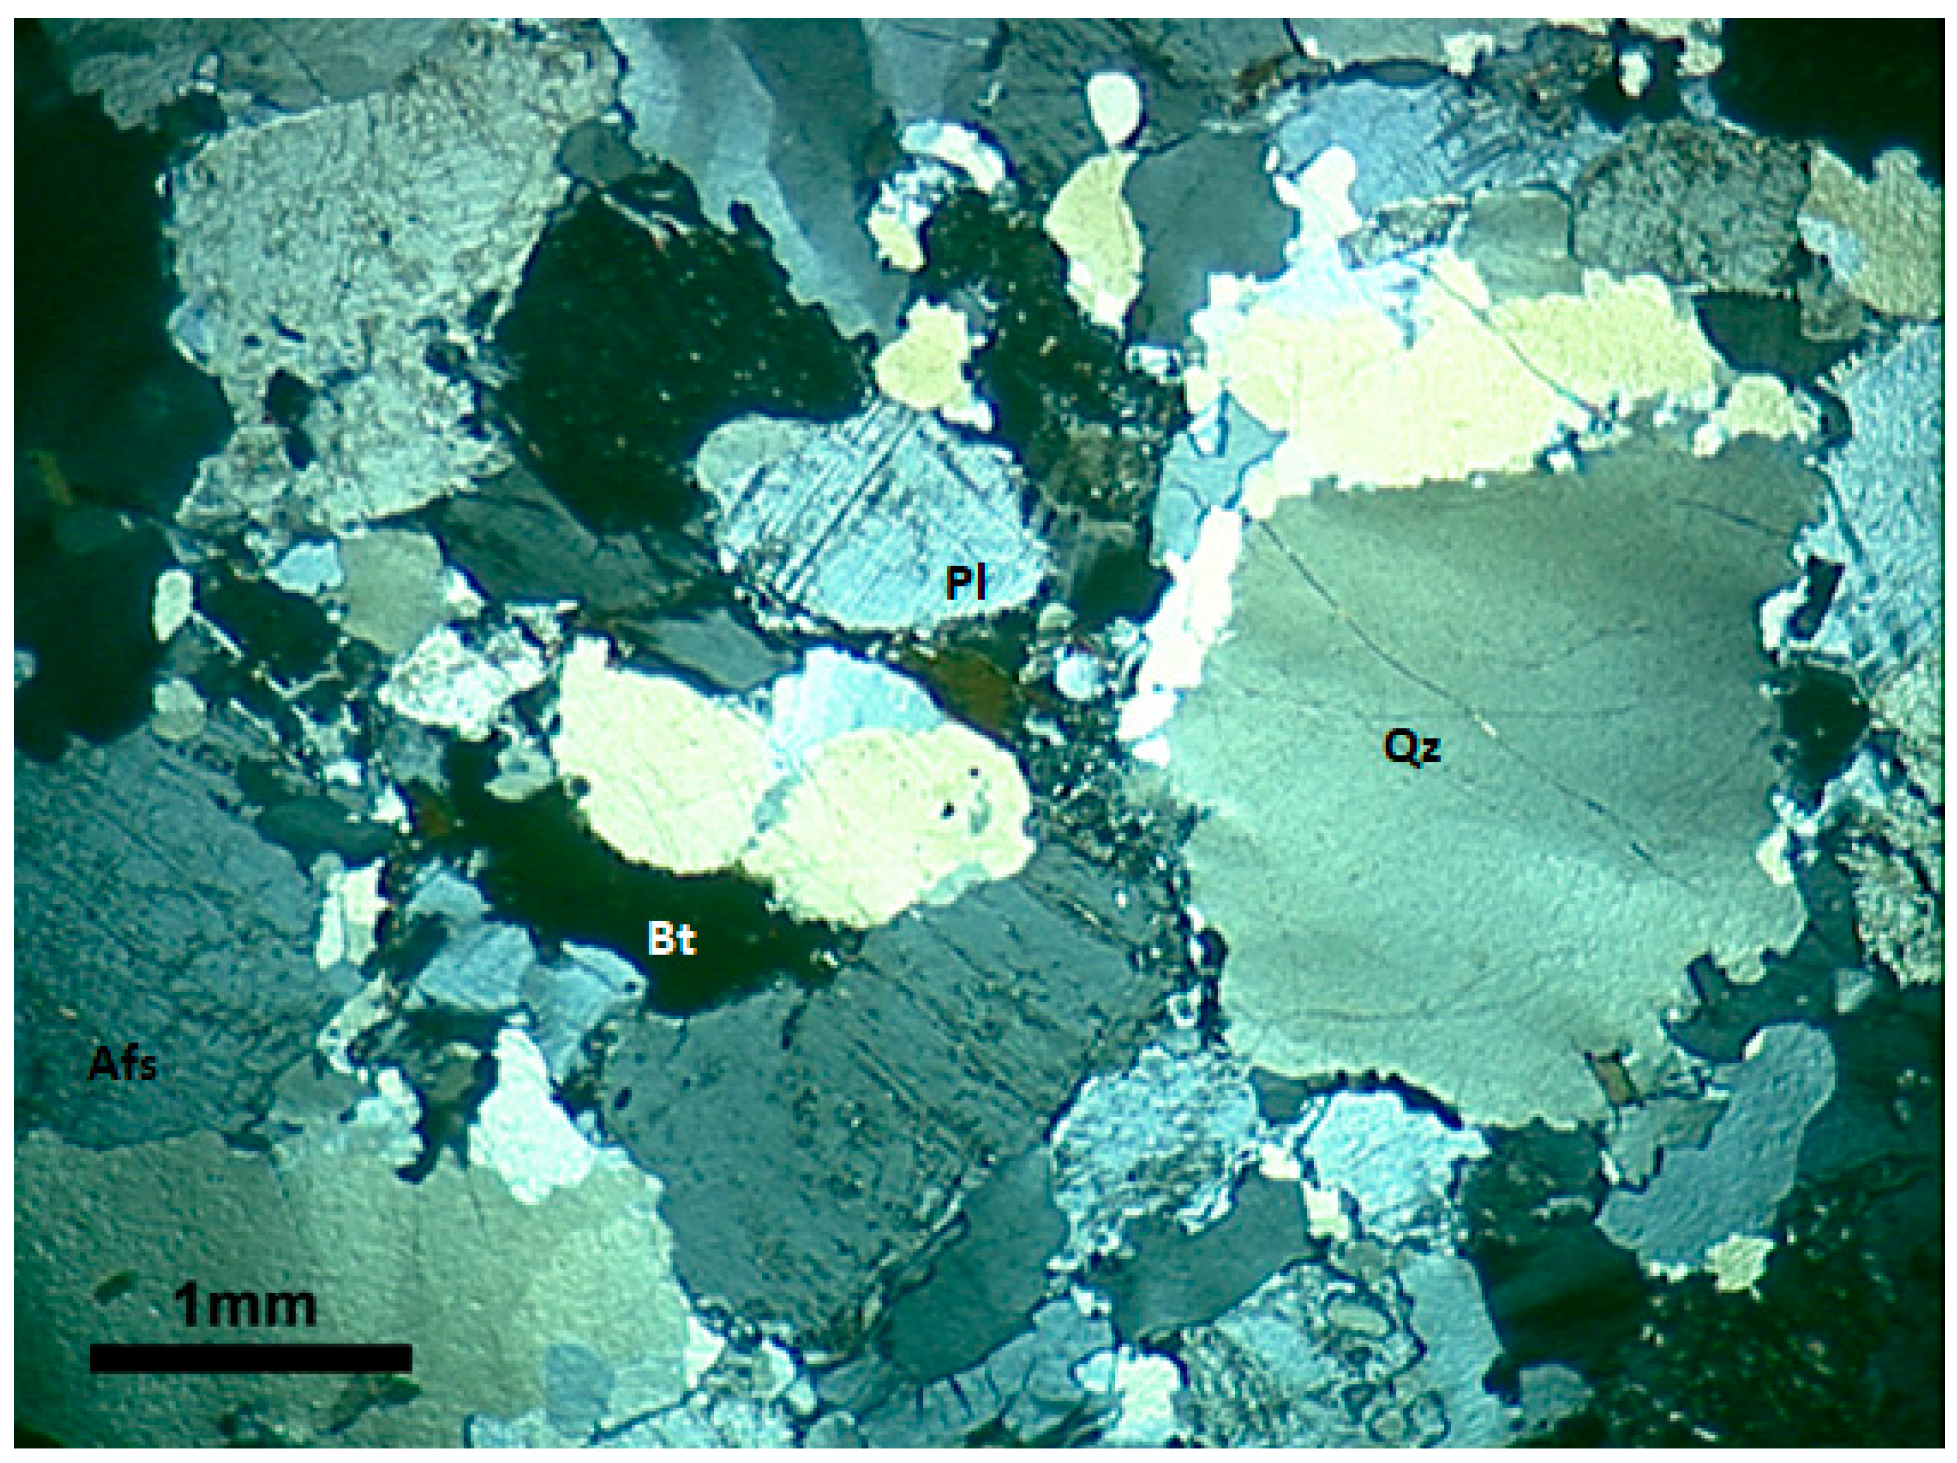
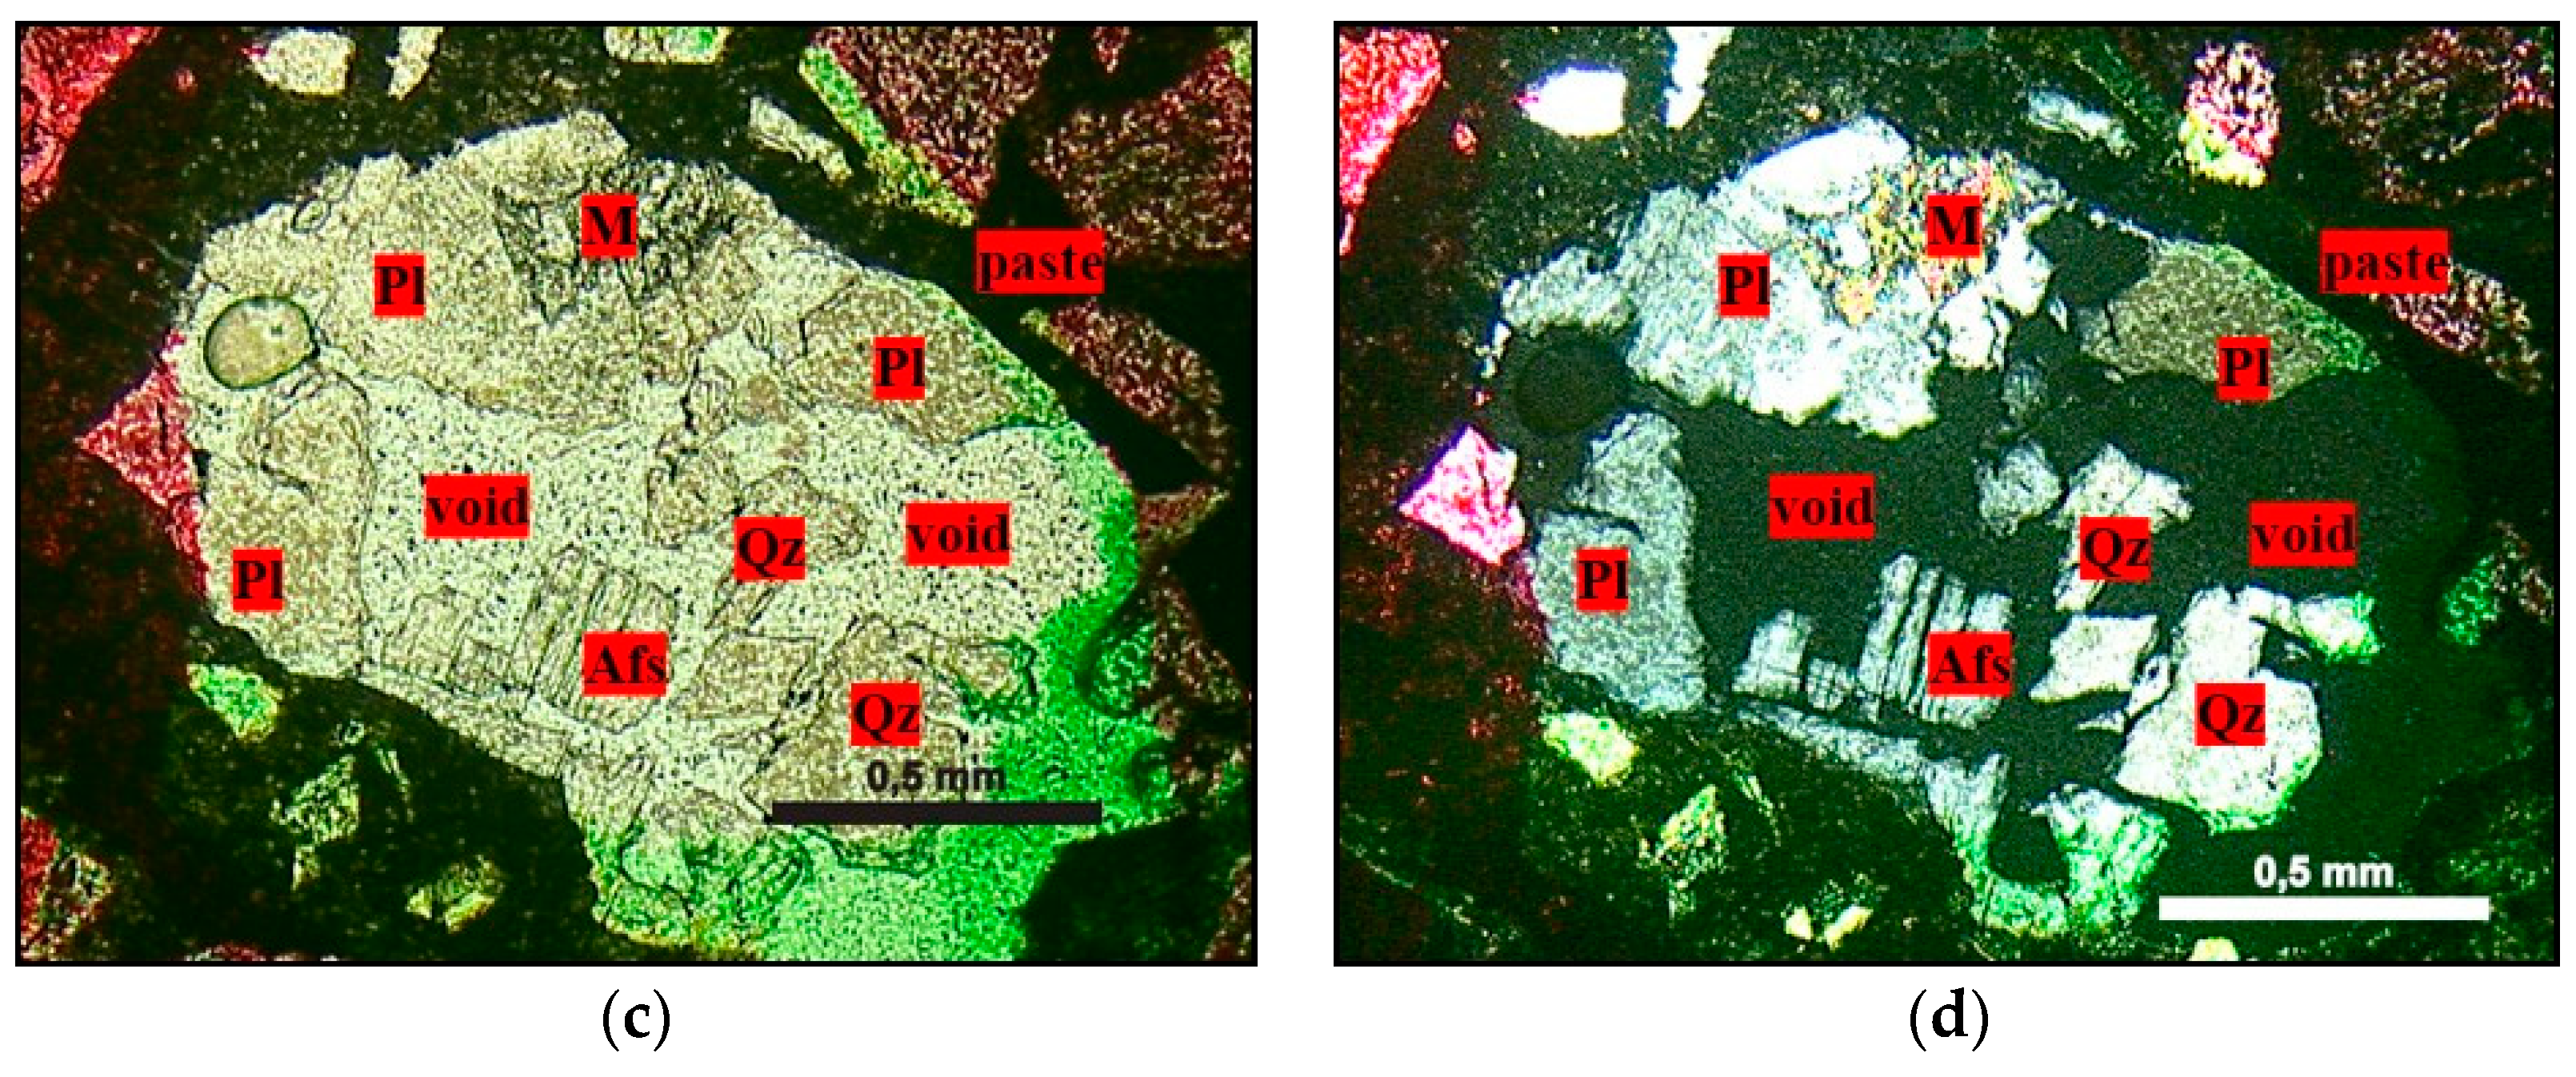
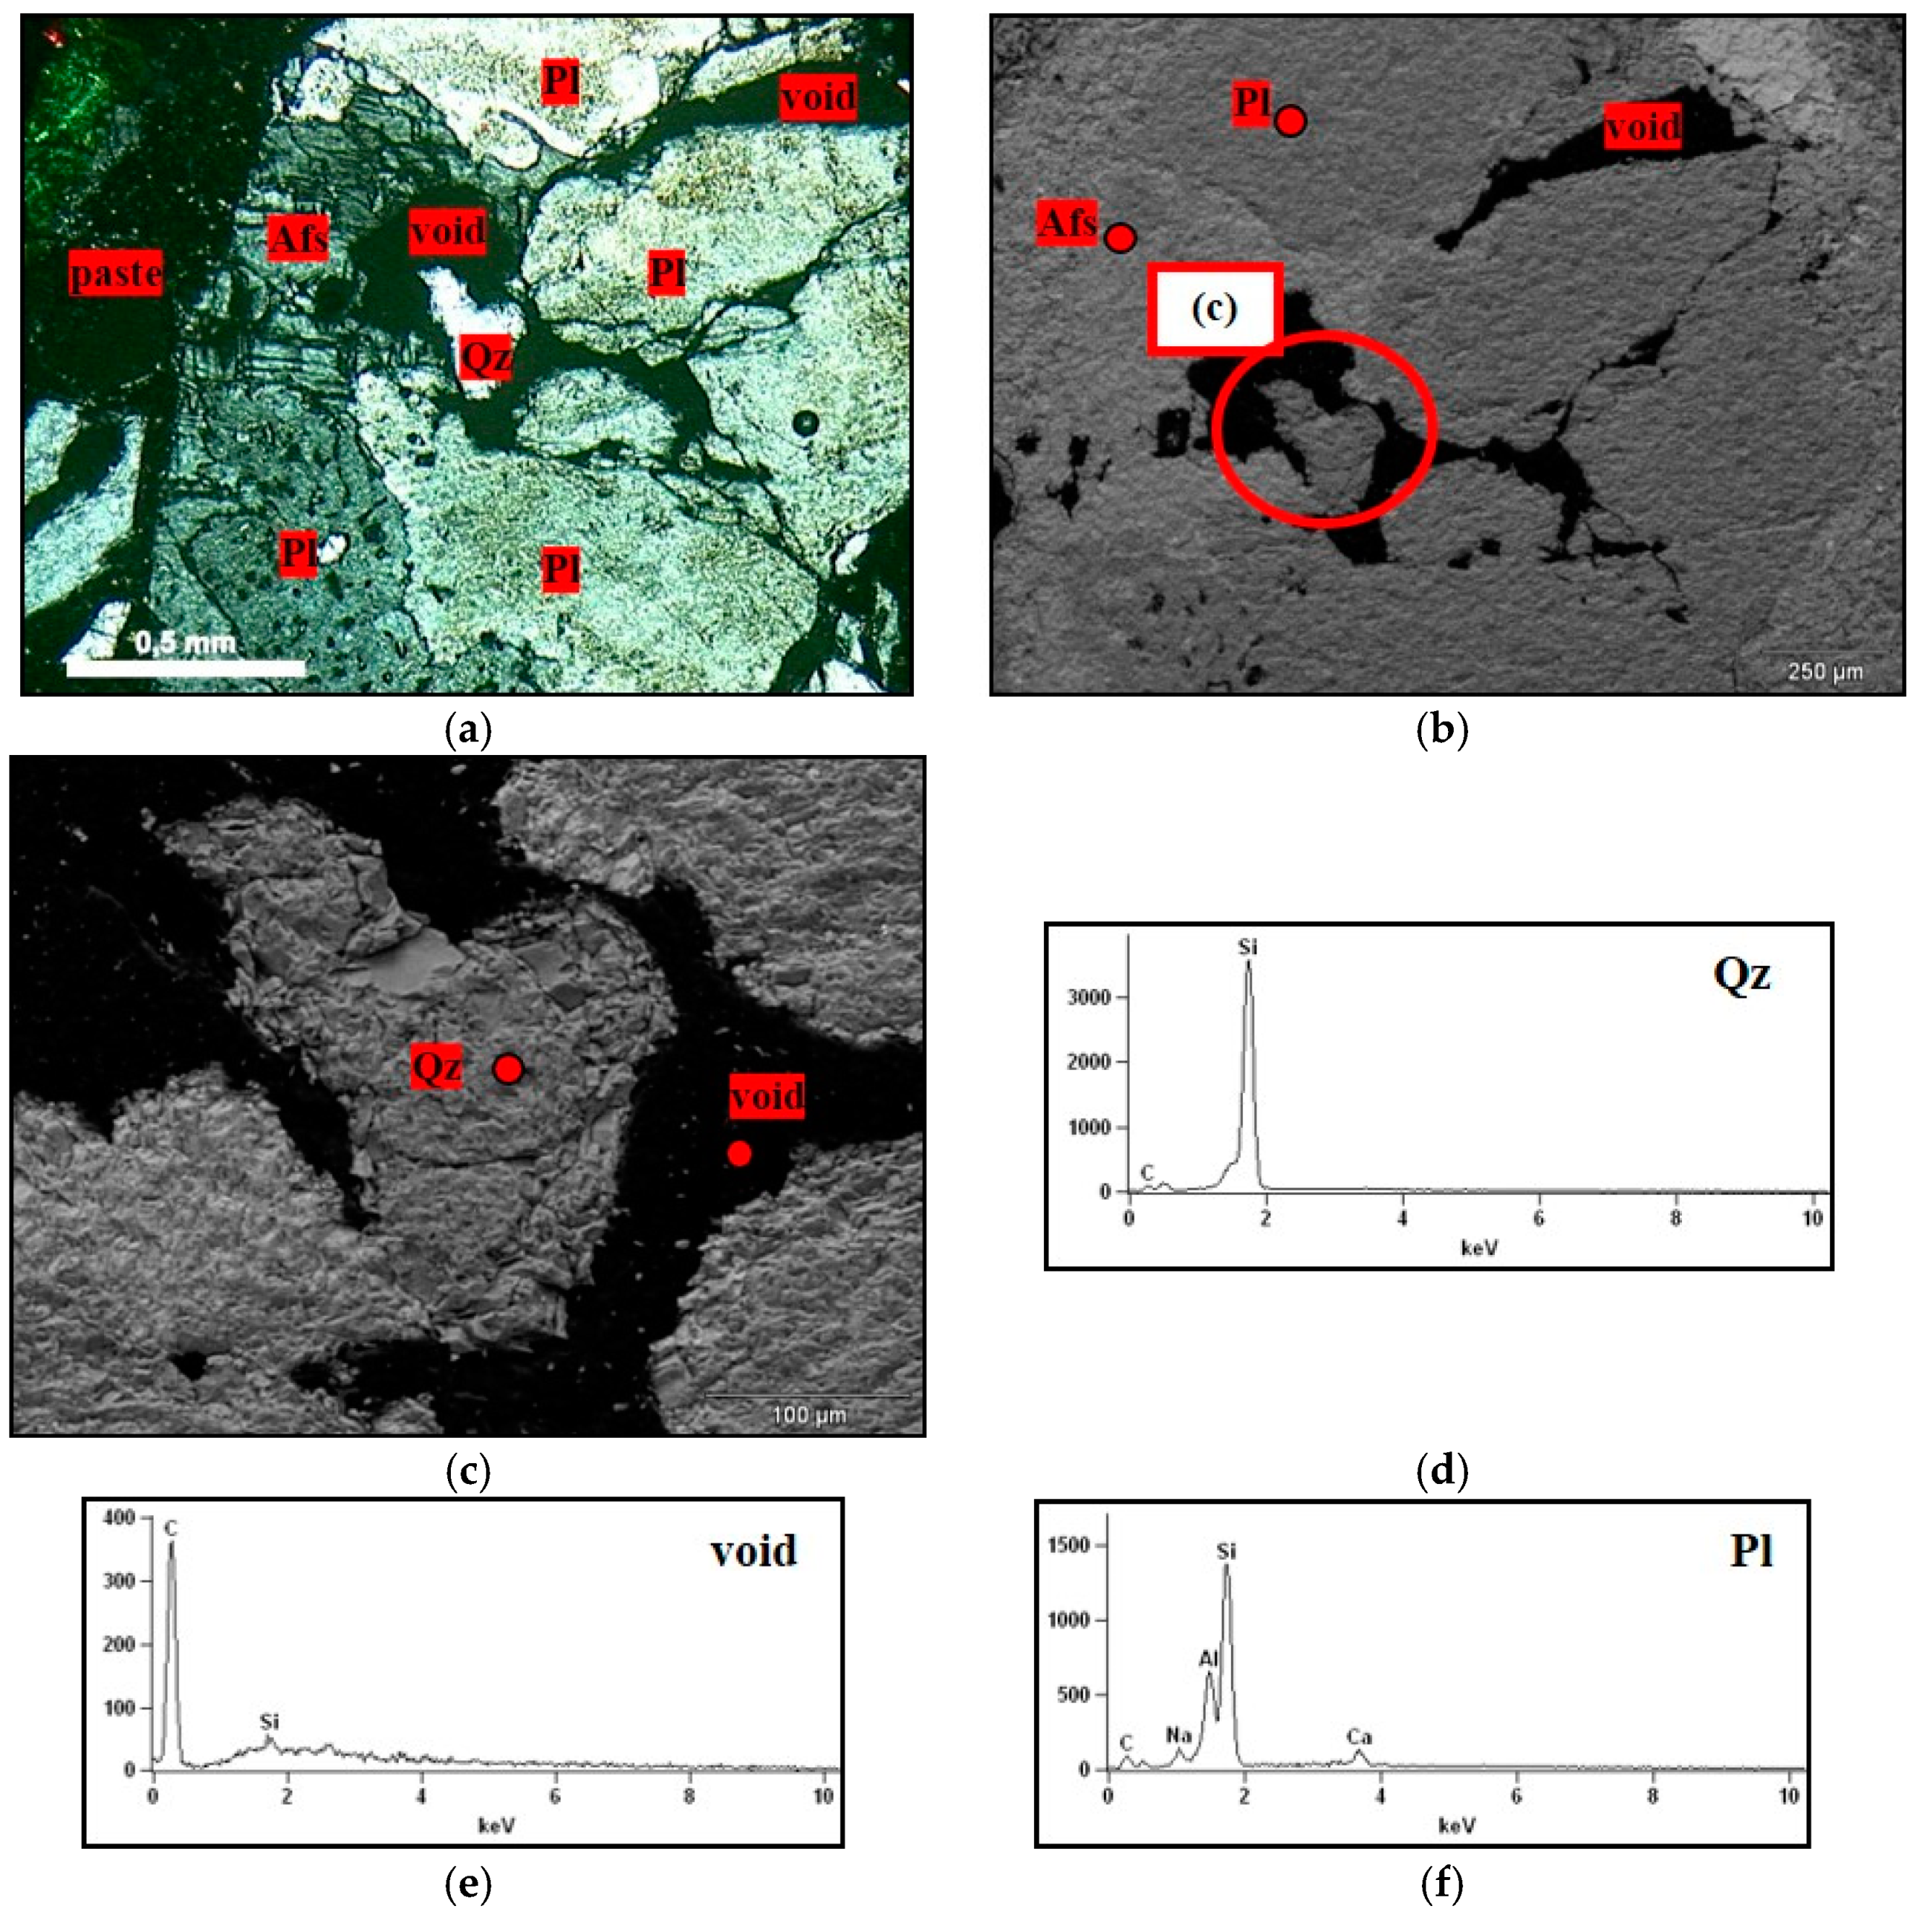
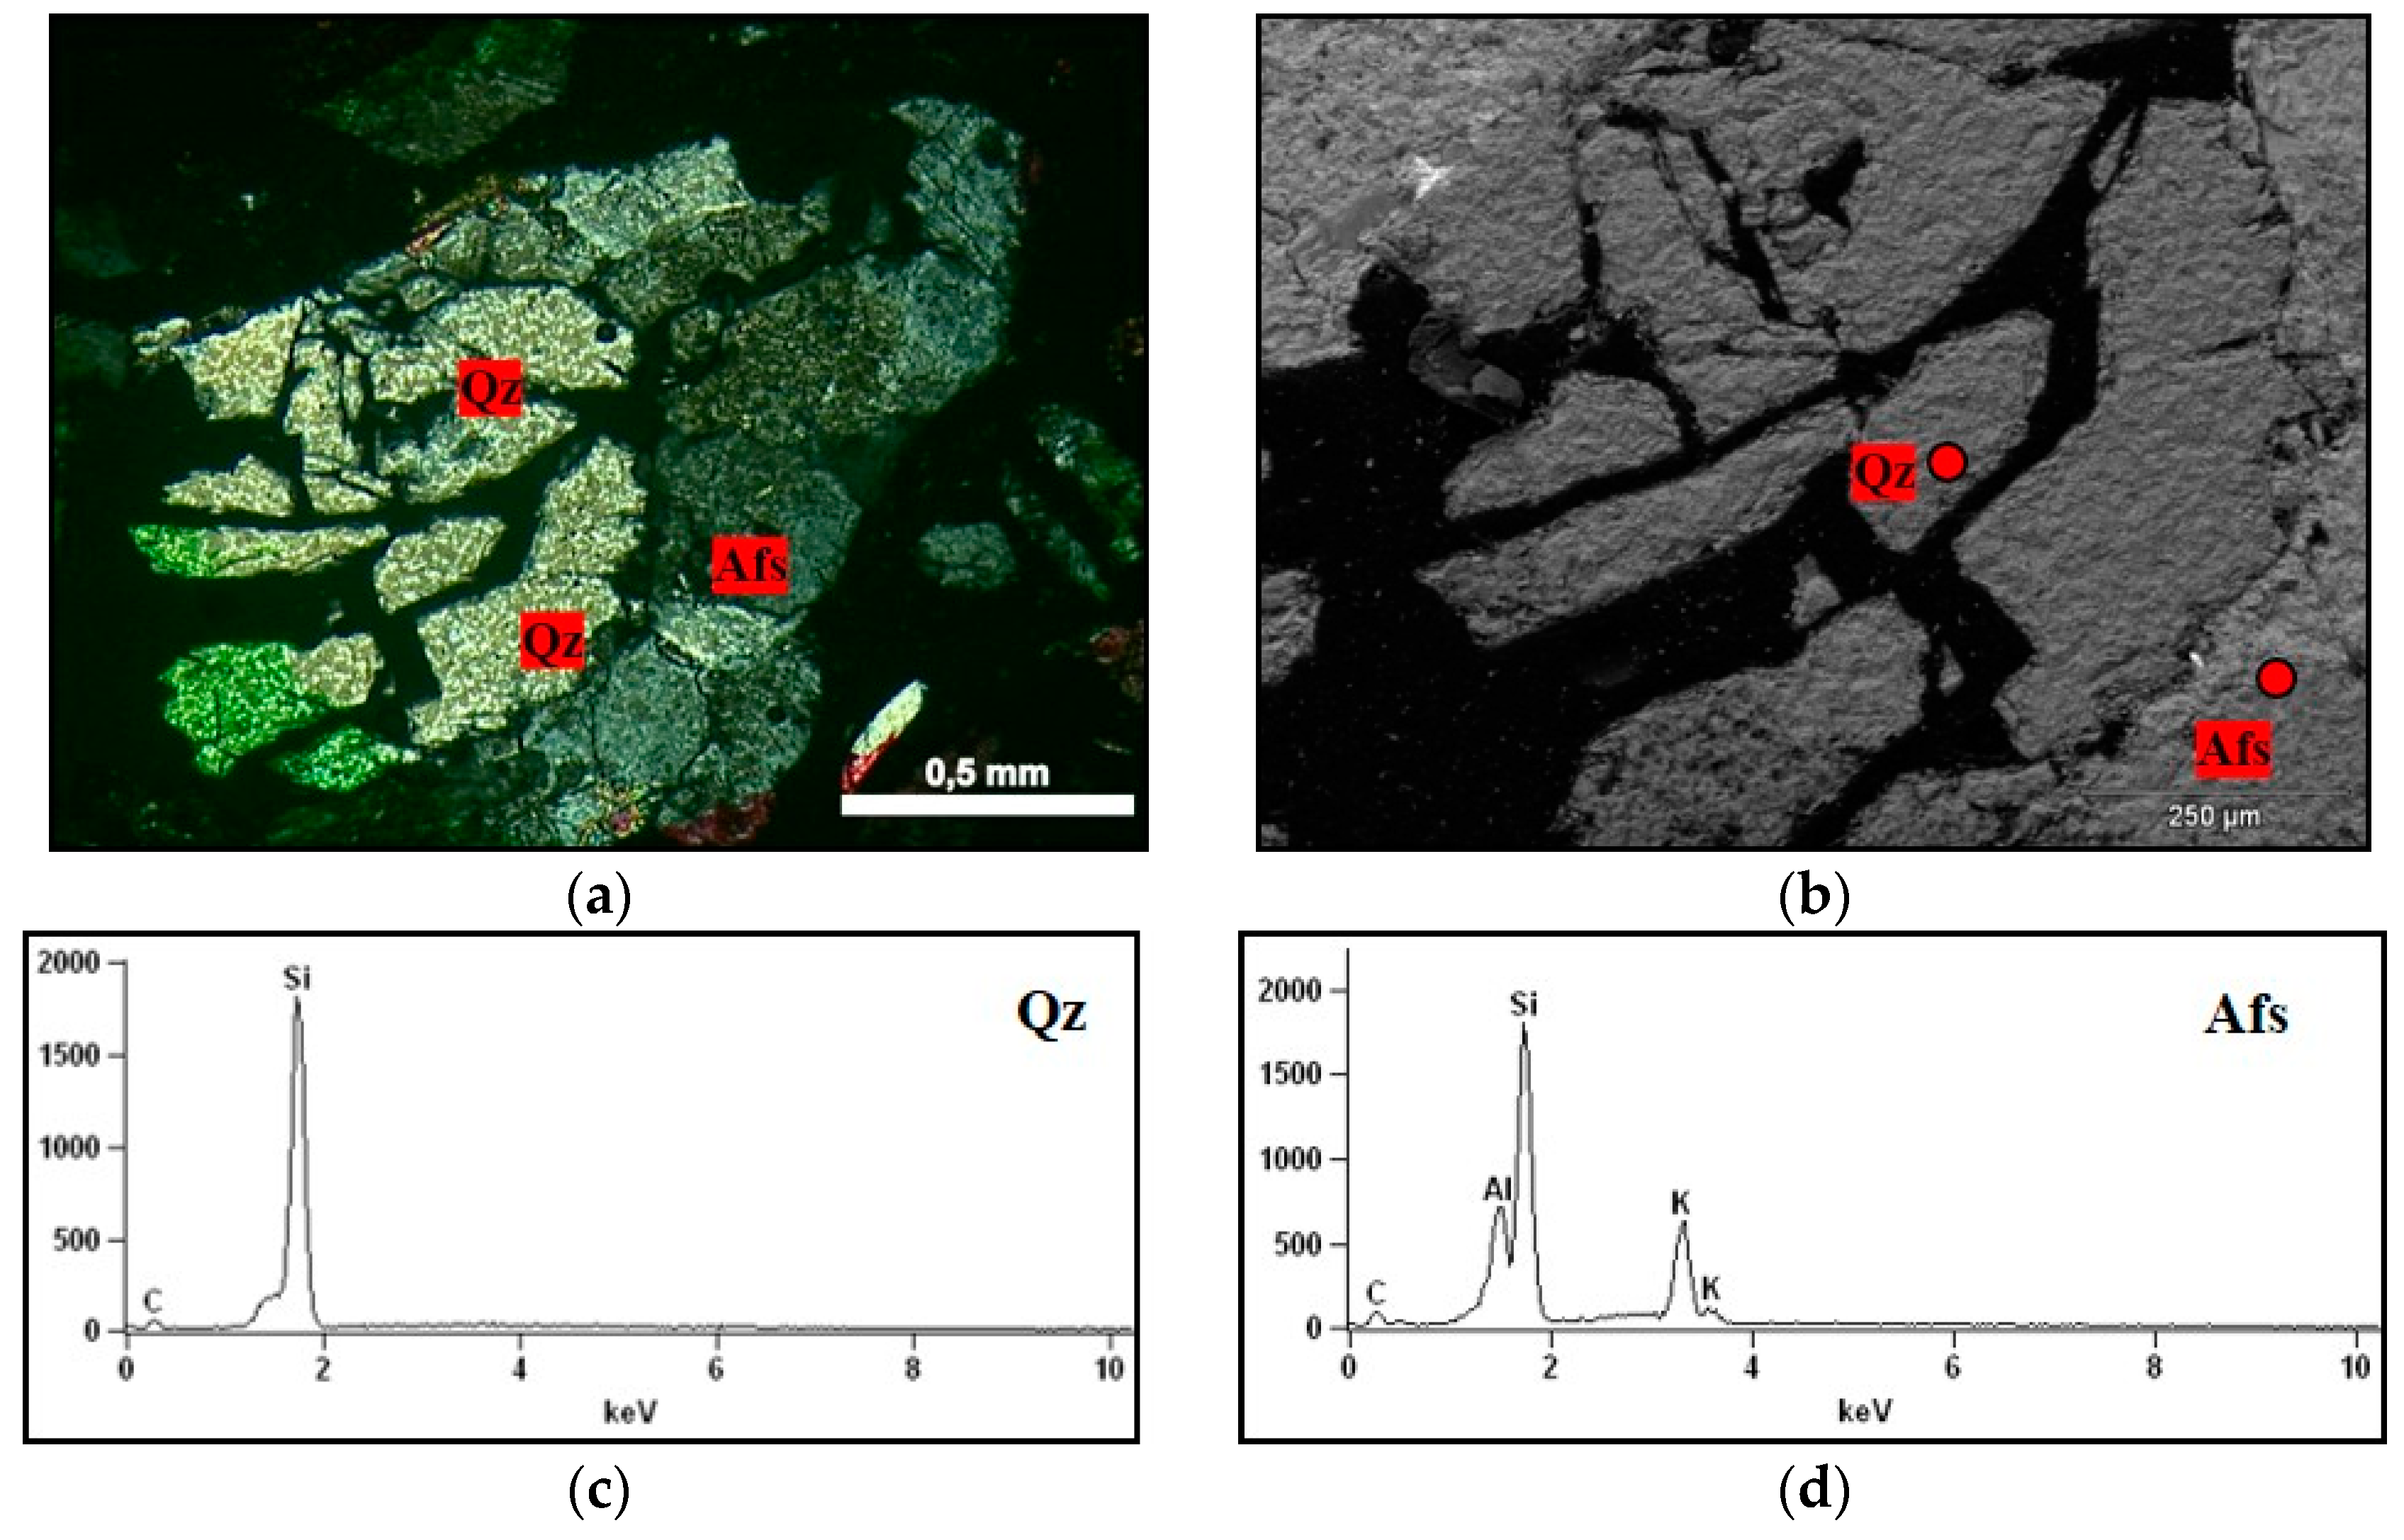
3.1. Chemical and Petrographic Characterization of the Rocks
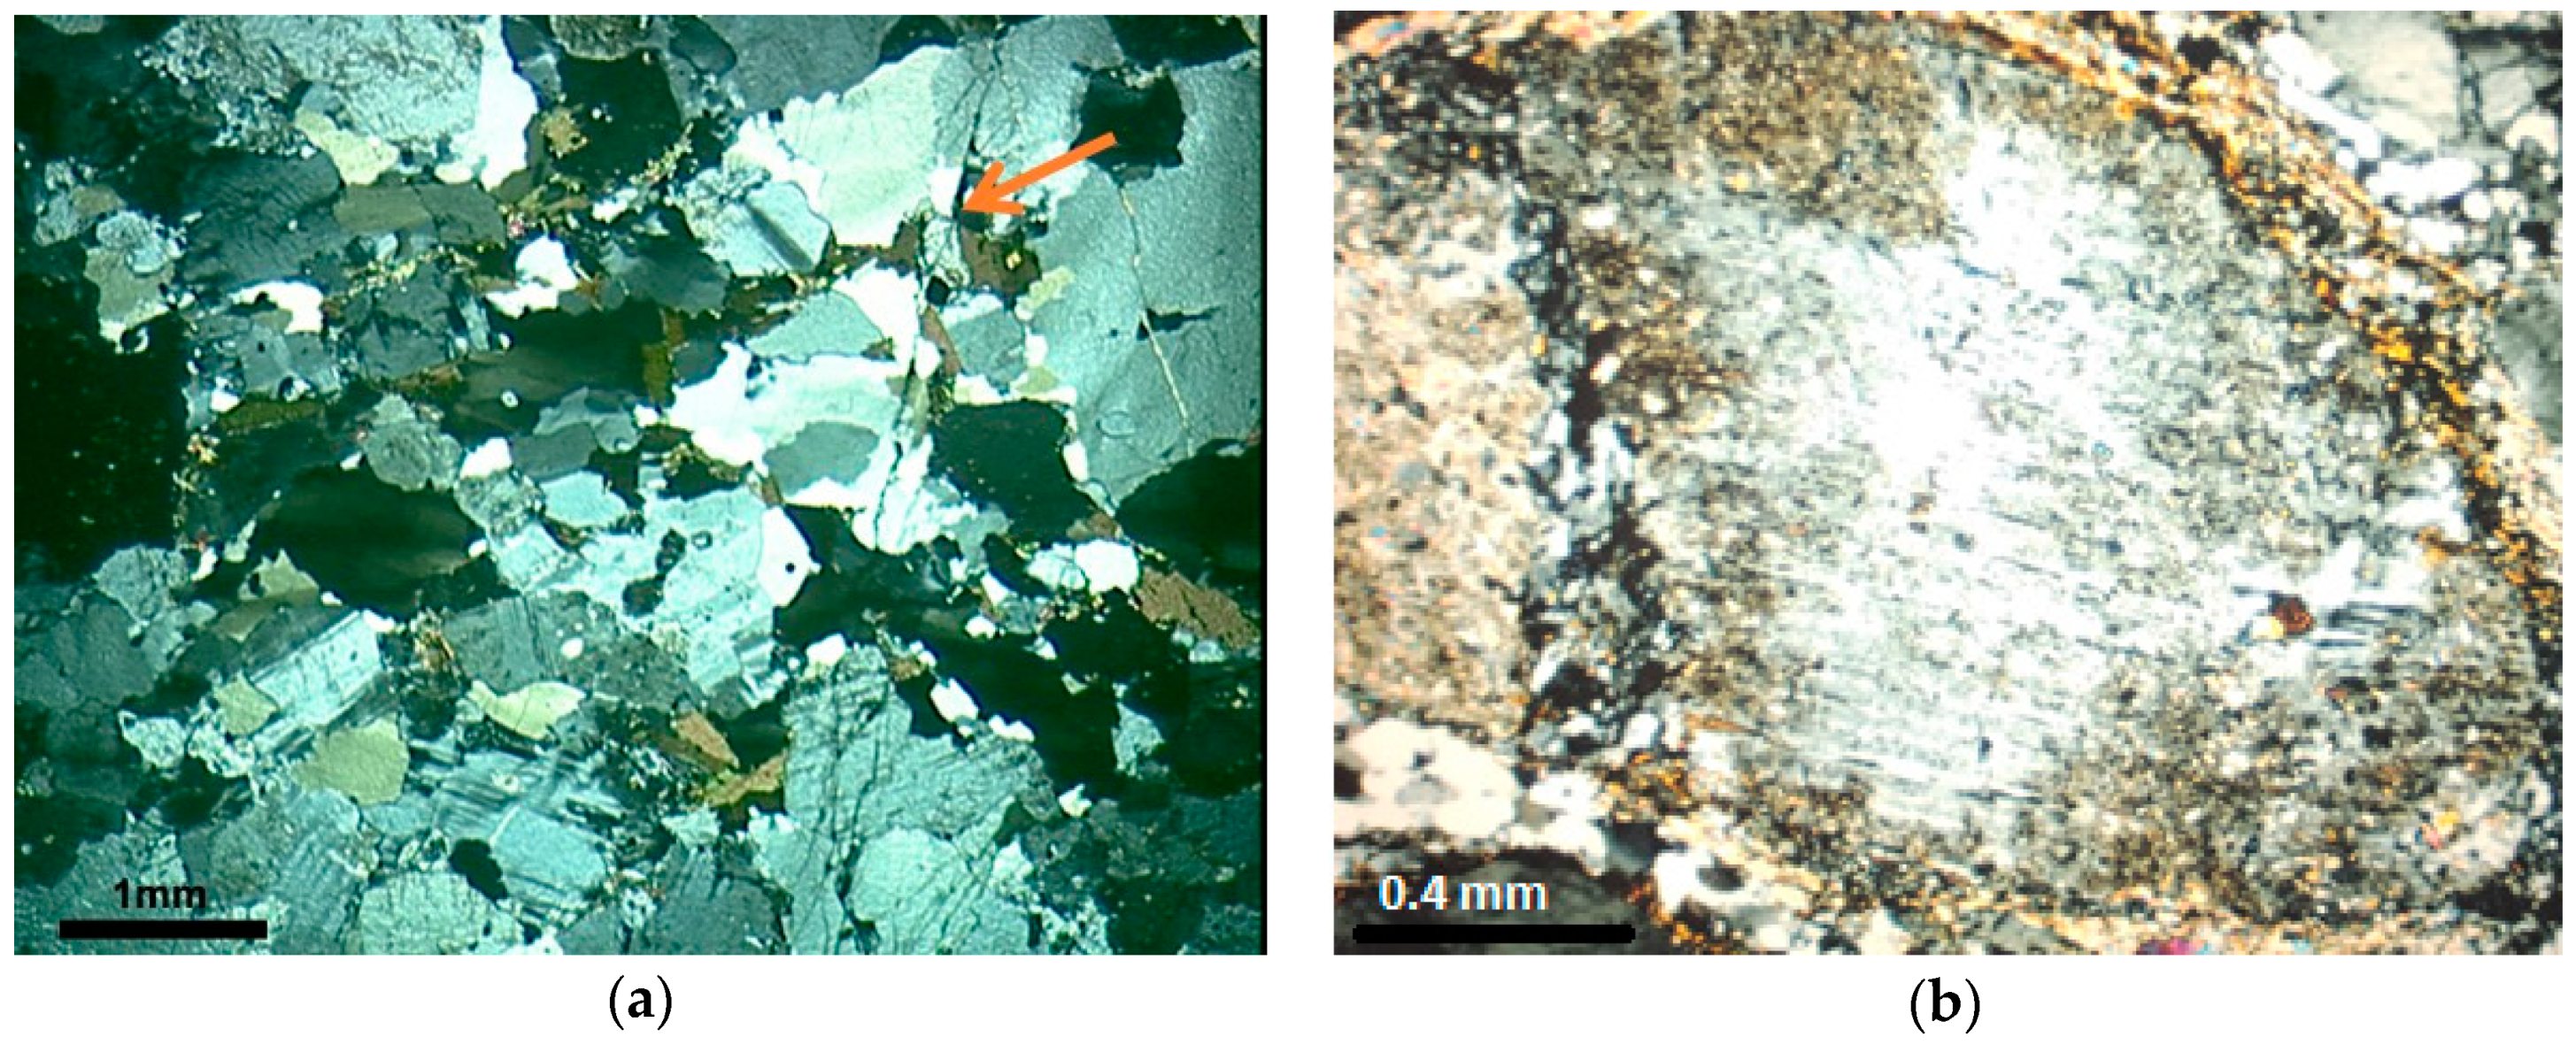
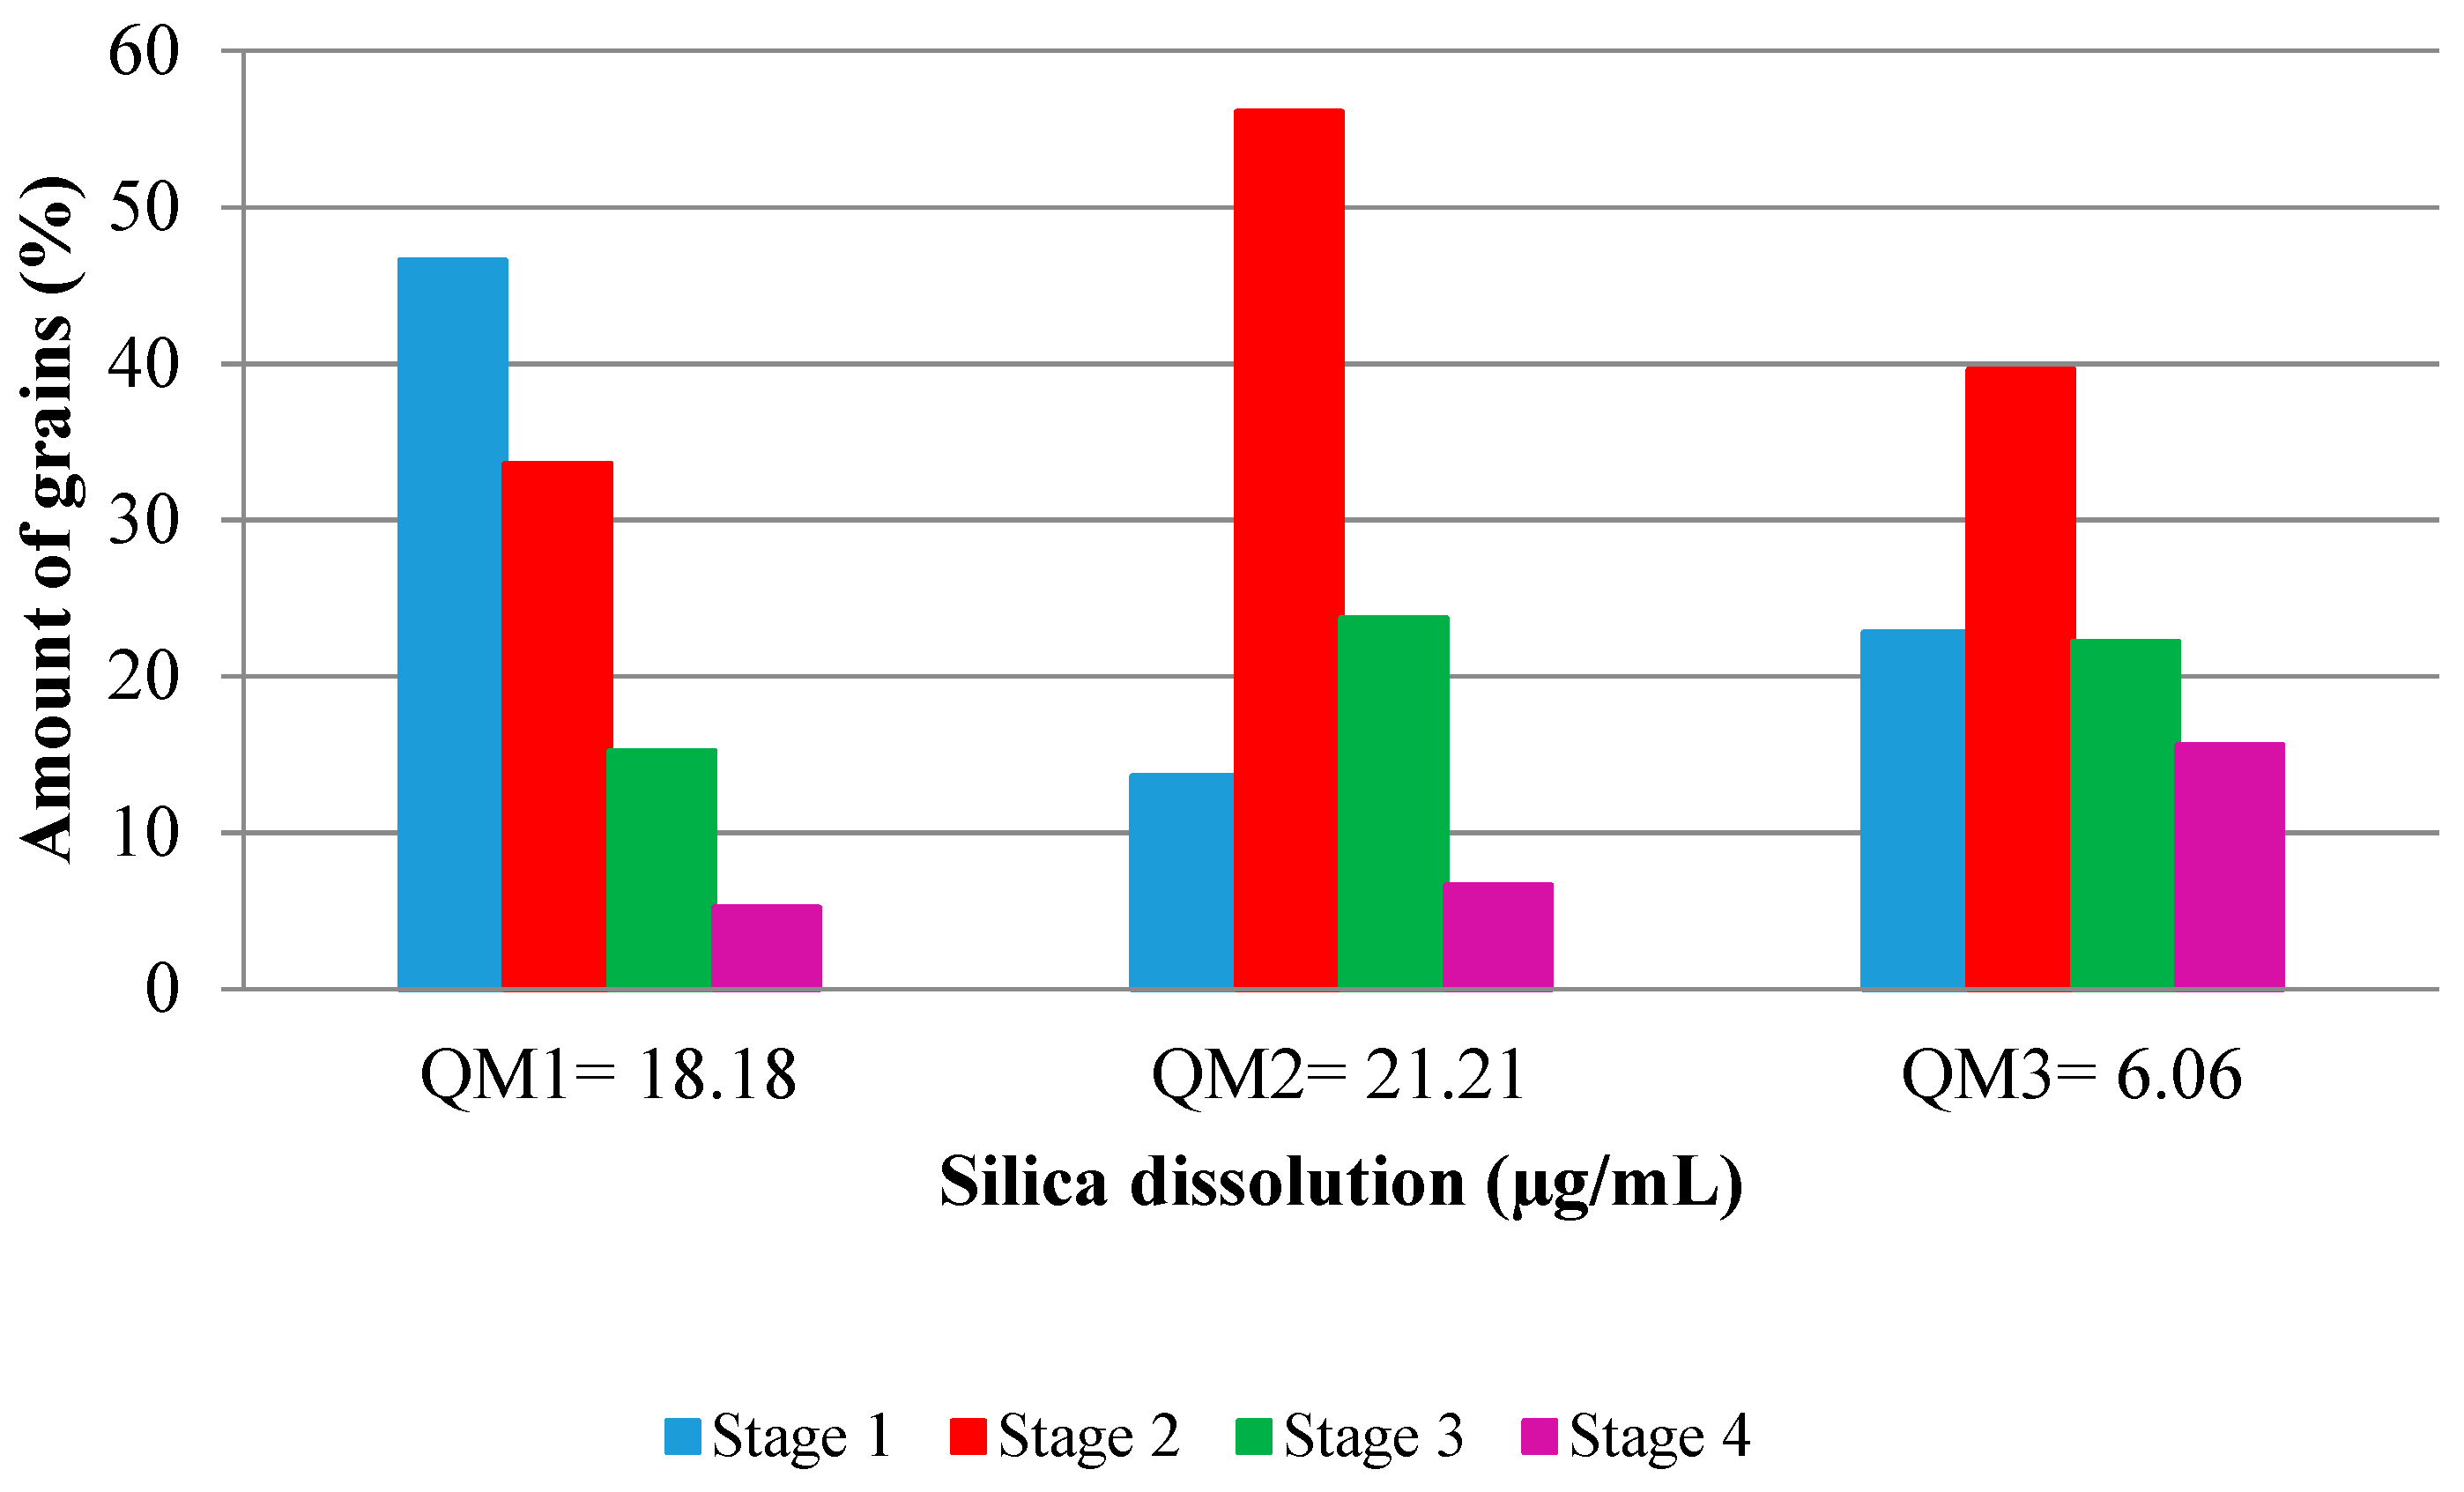
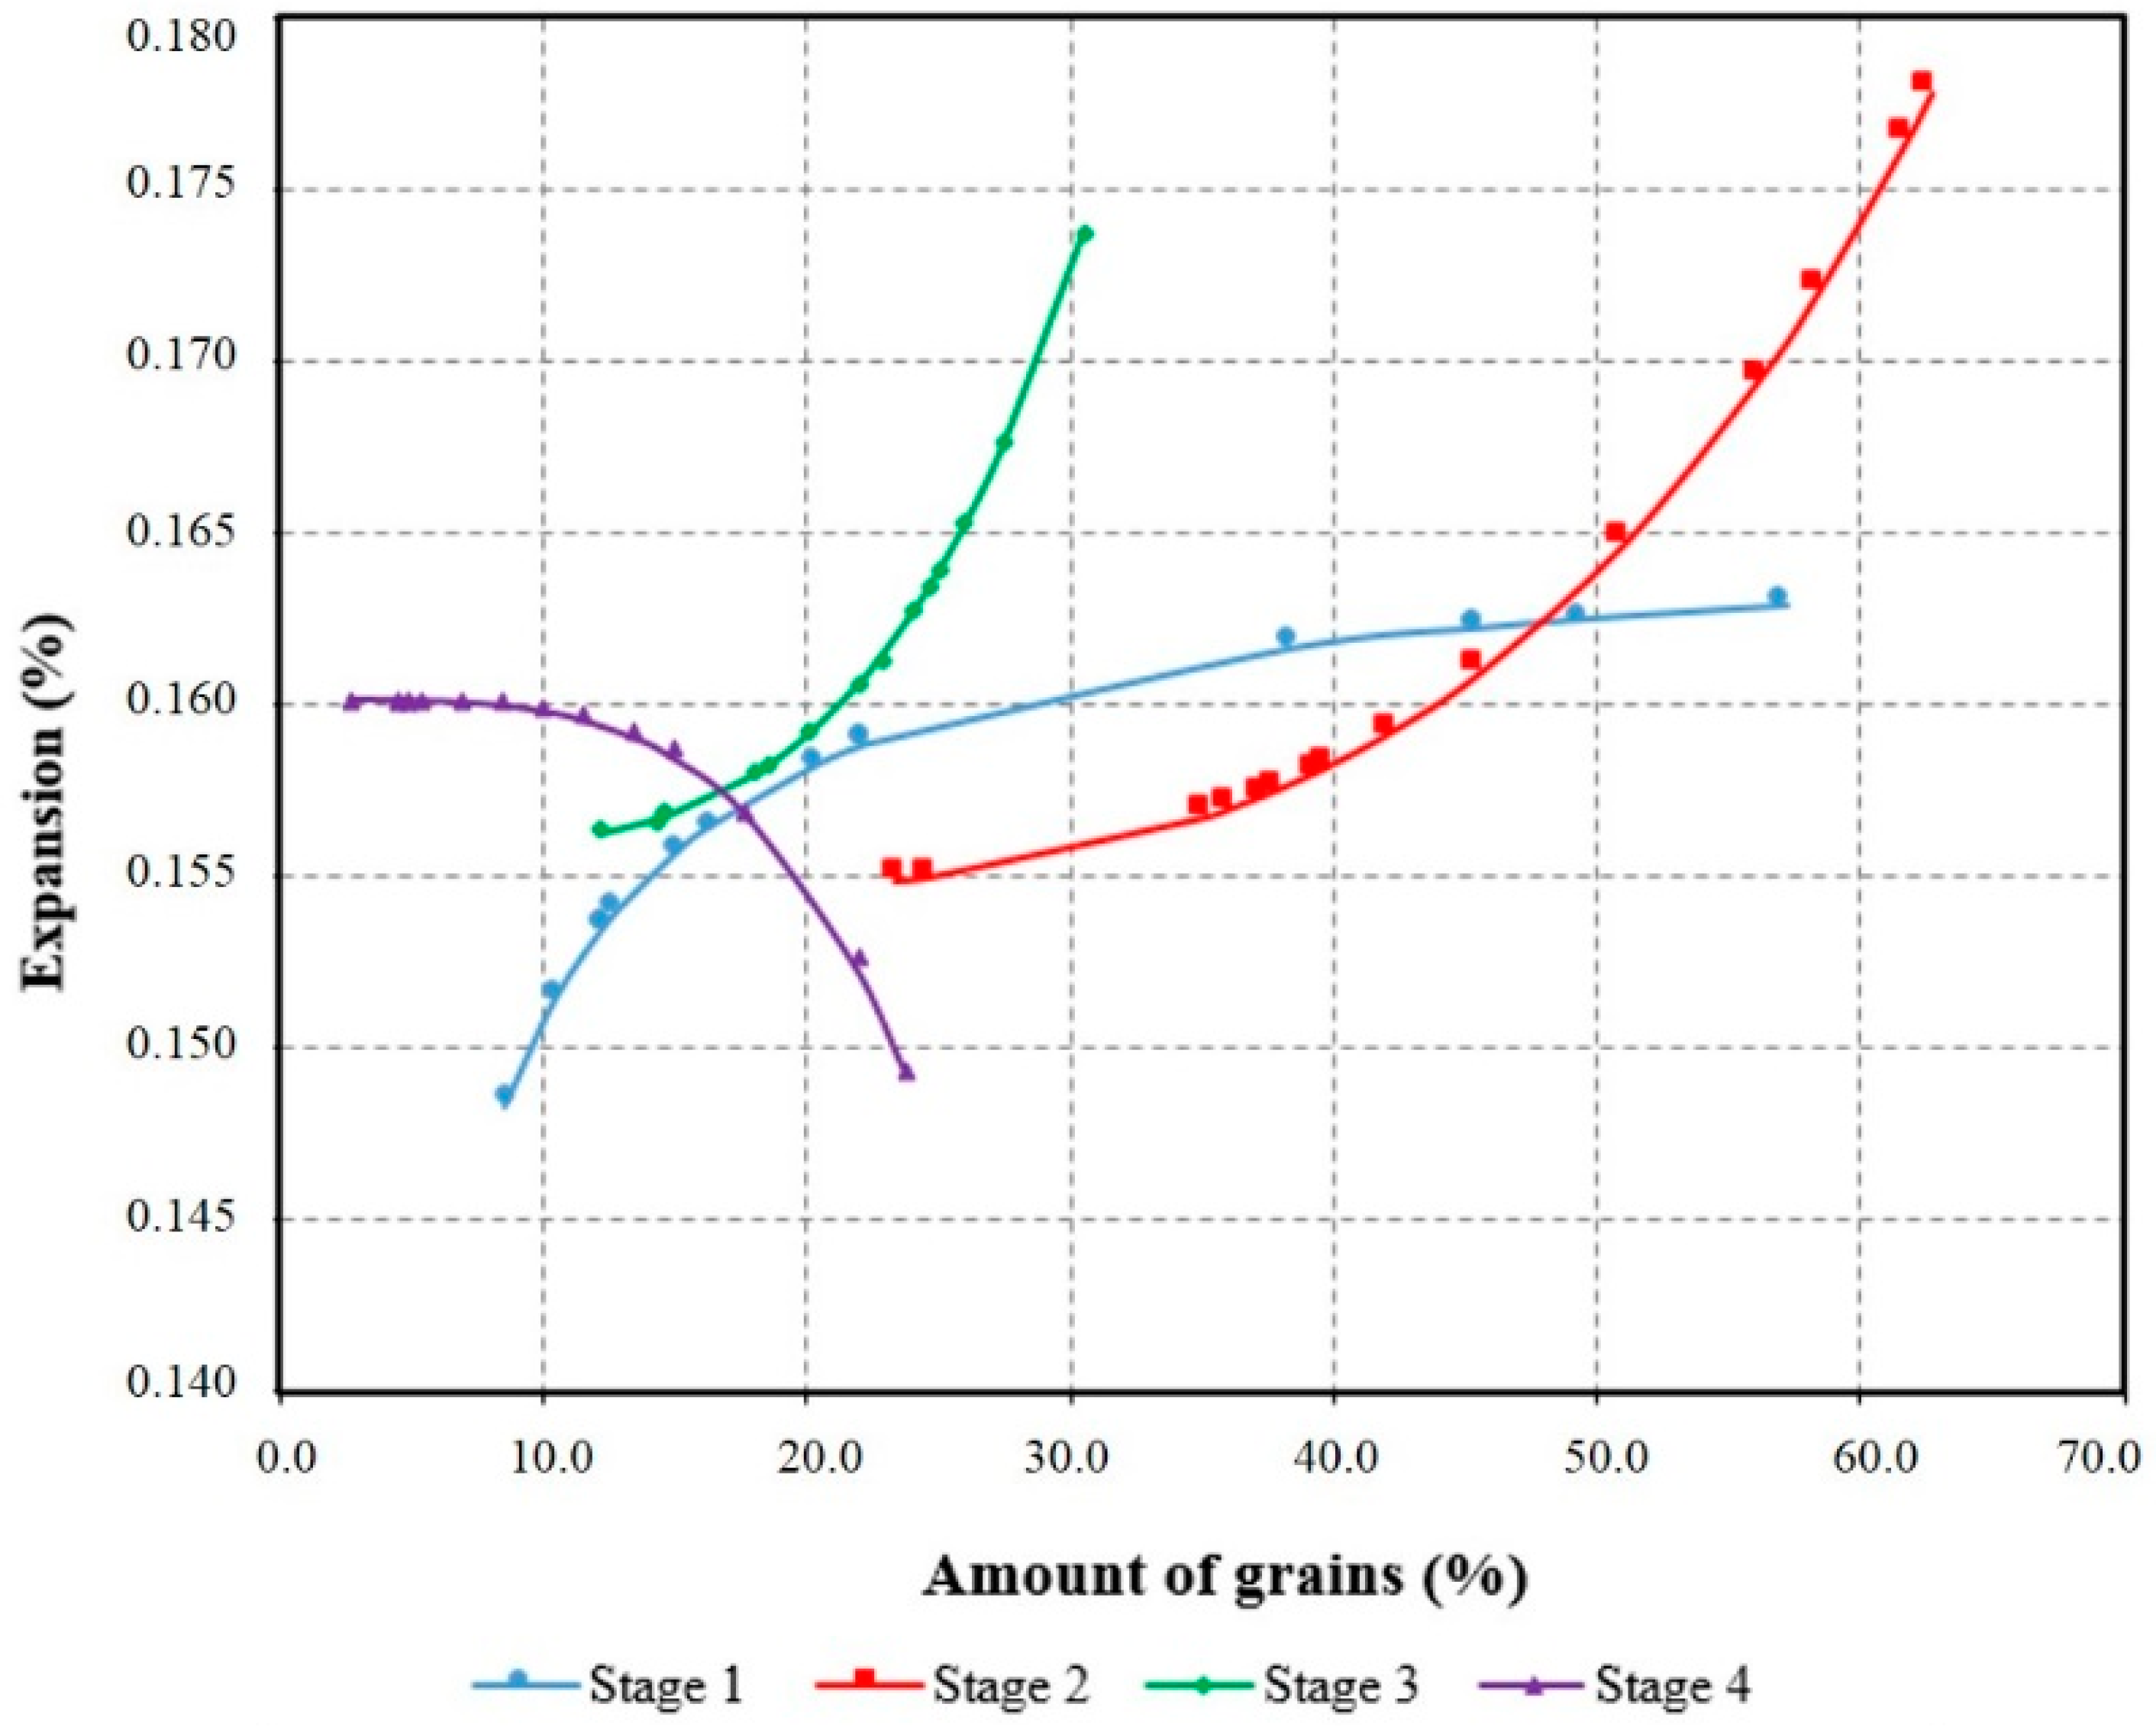
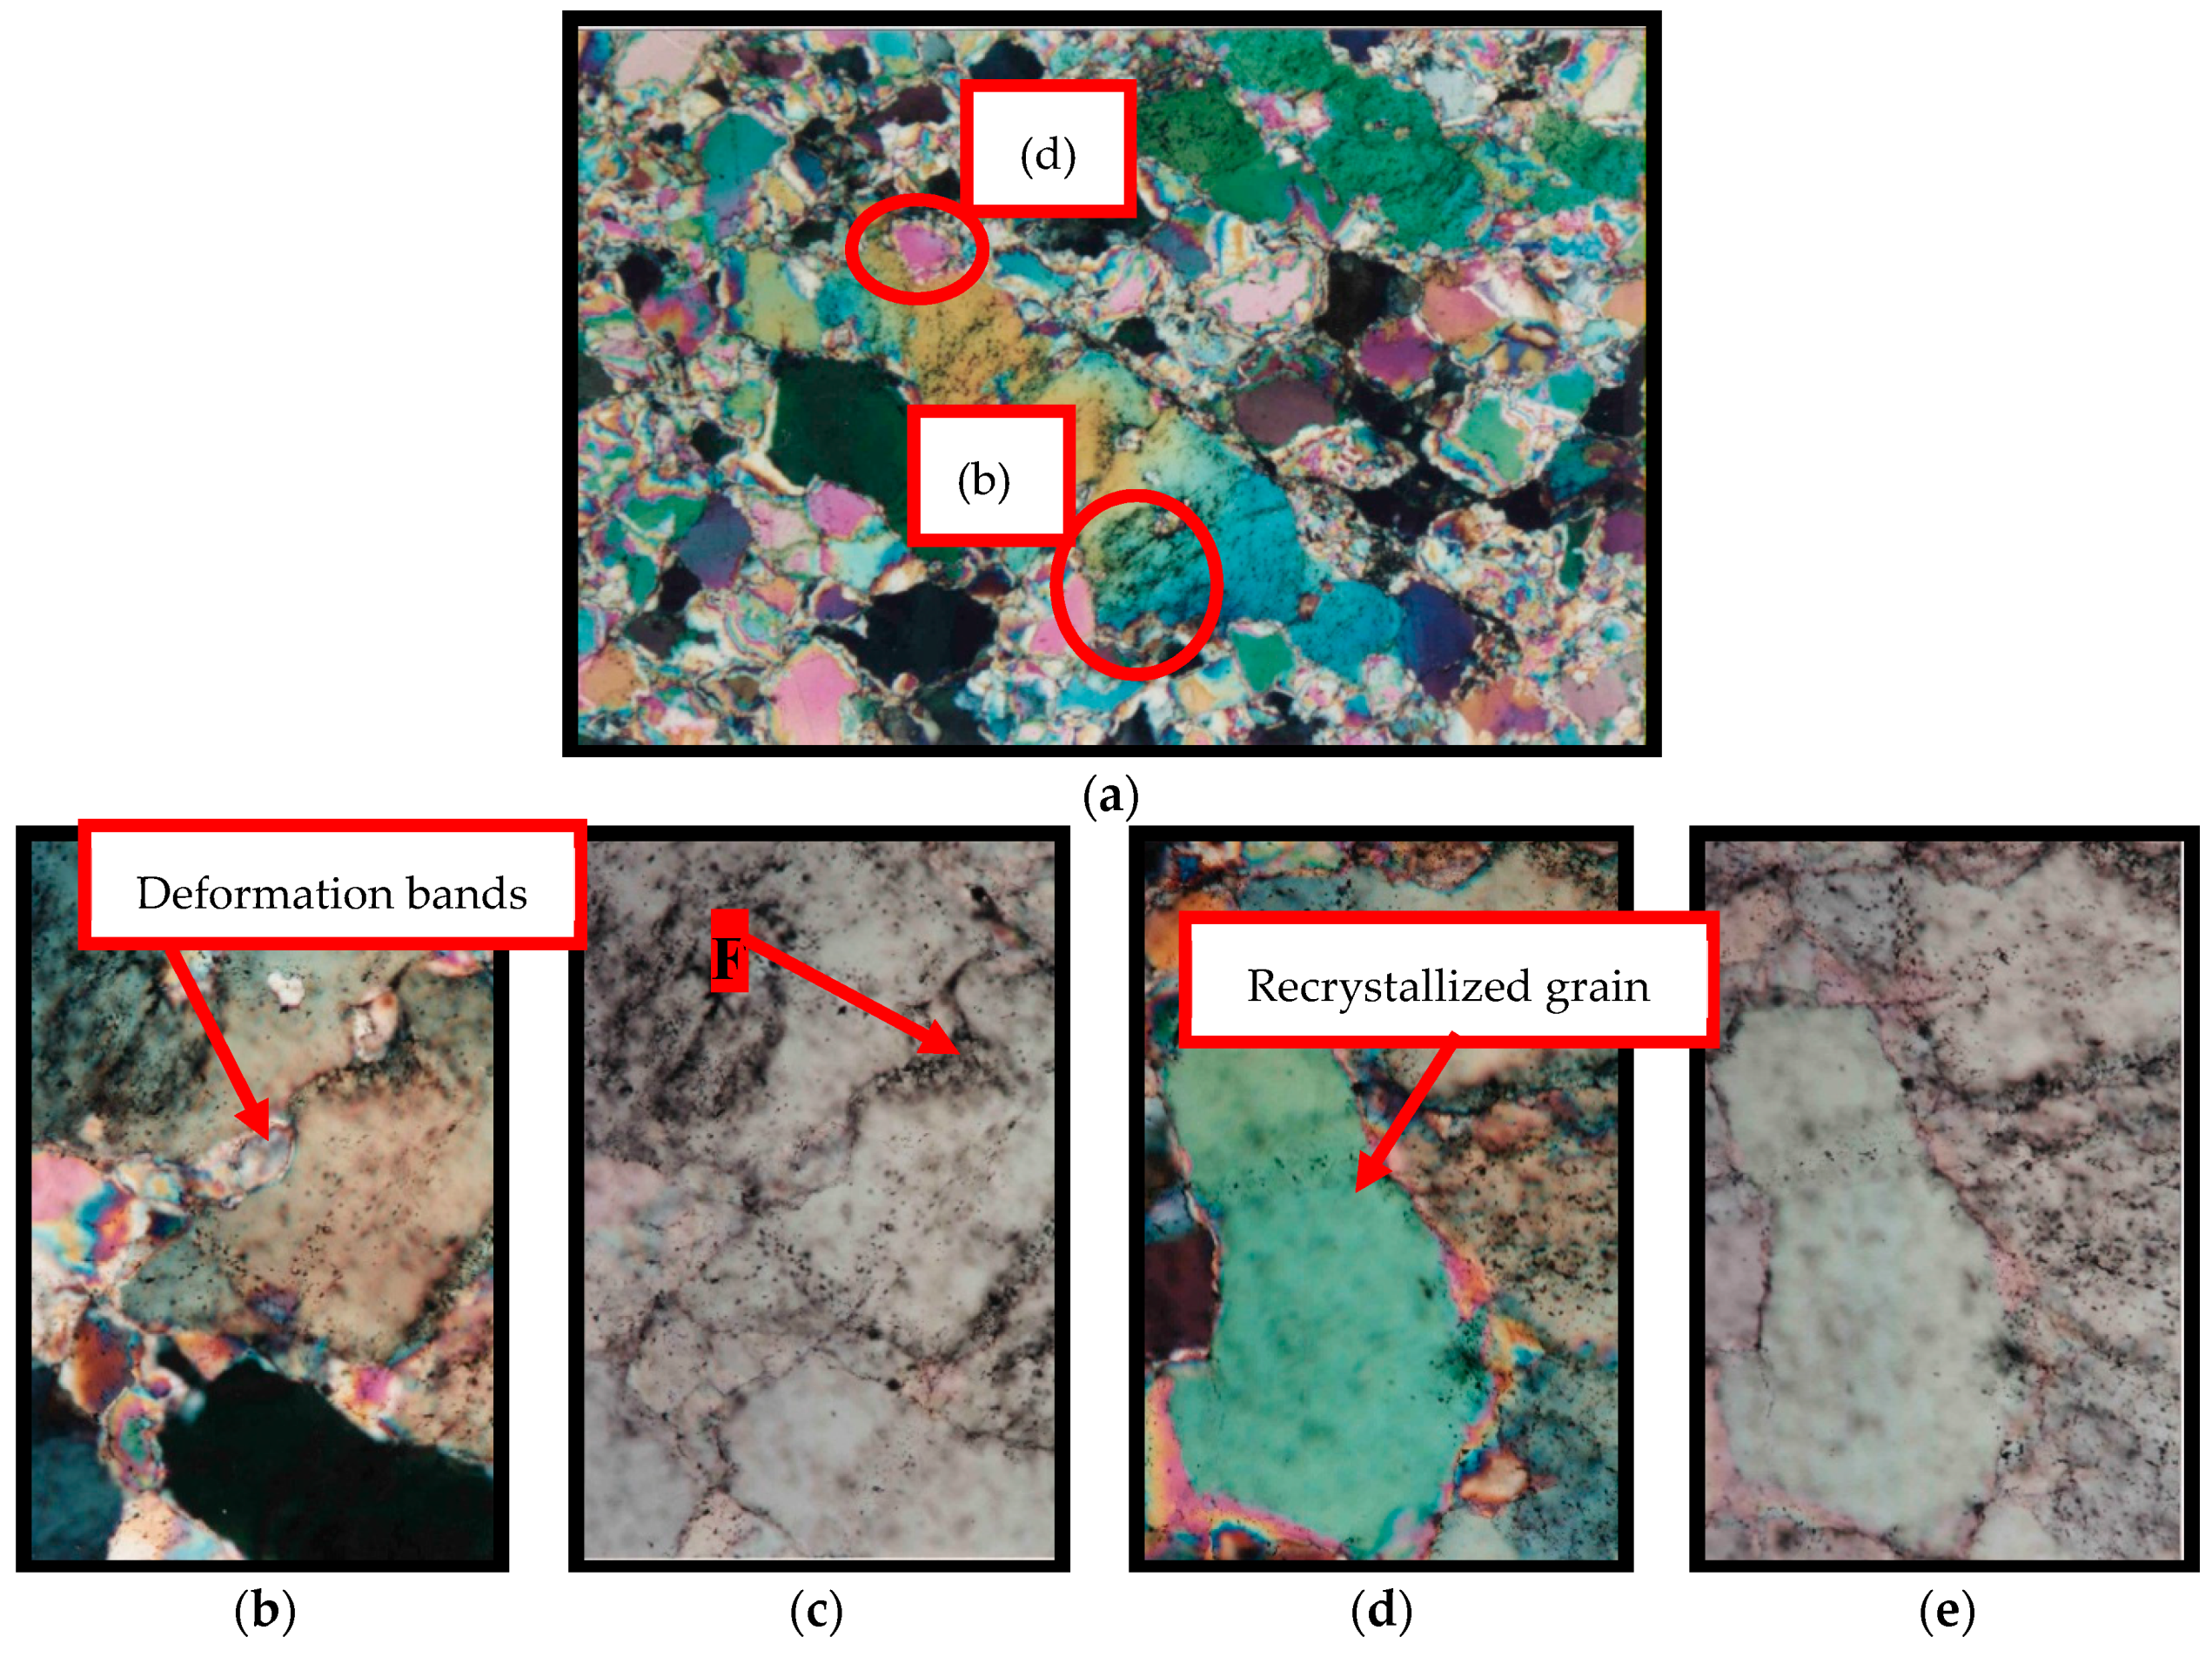
3.2. Relationship between the Deformation of the Quartz and Susceptibility to the Alkaline Attack
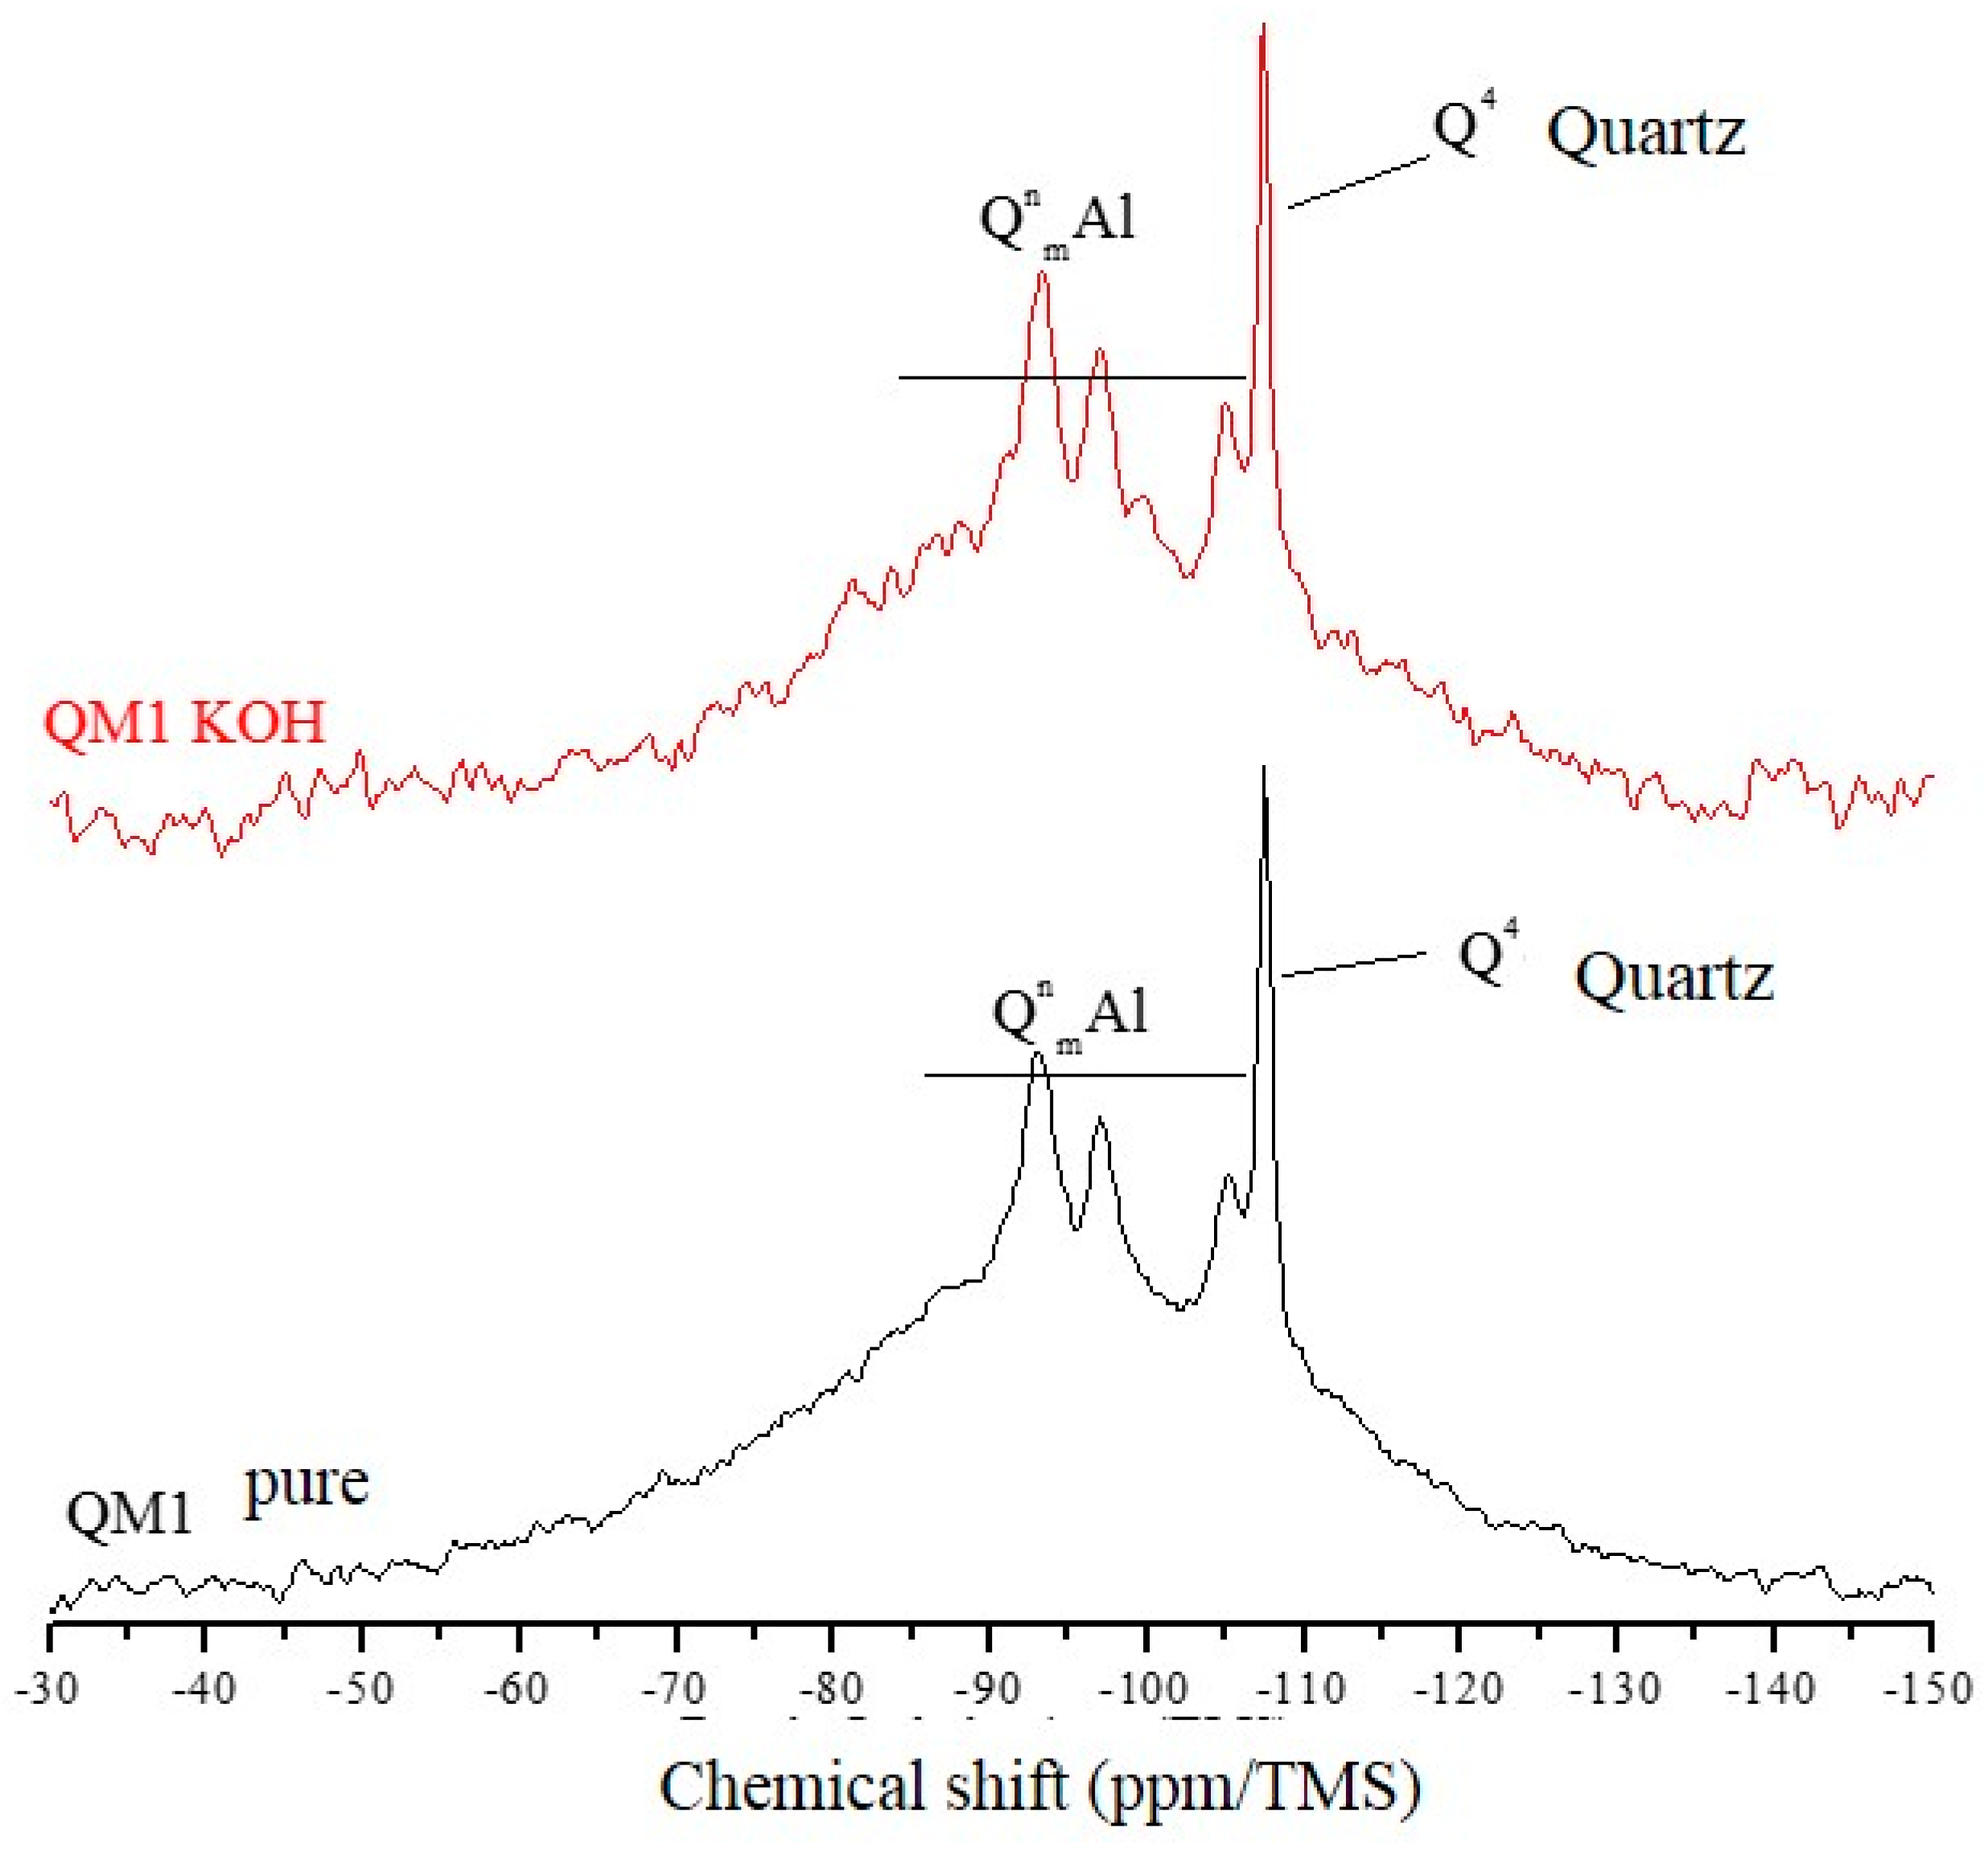
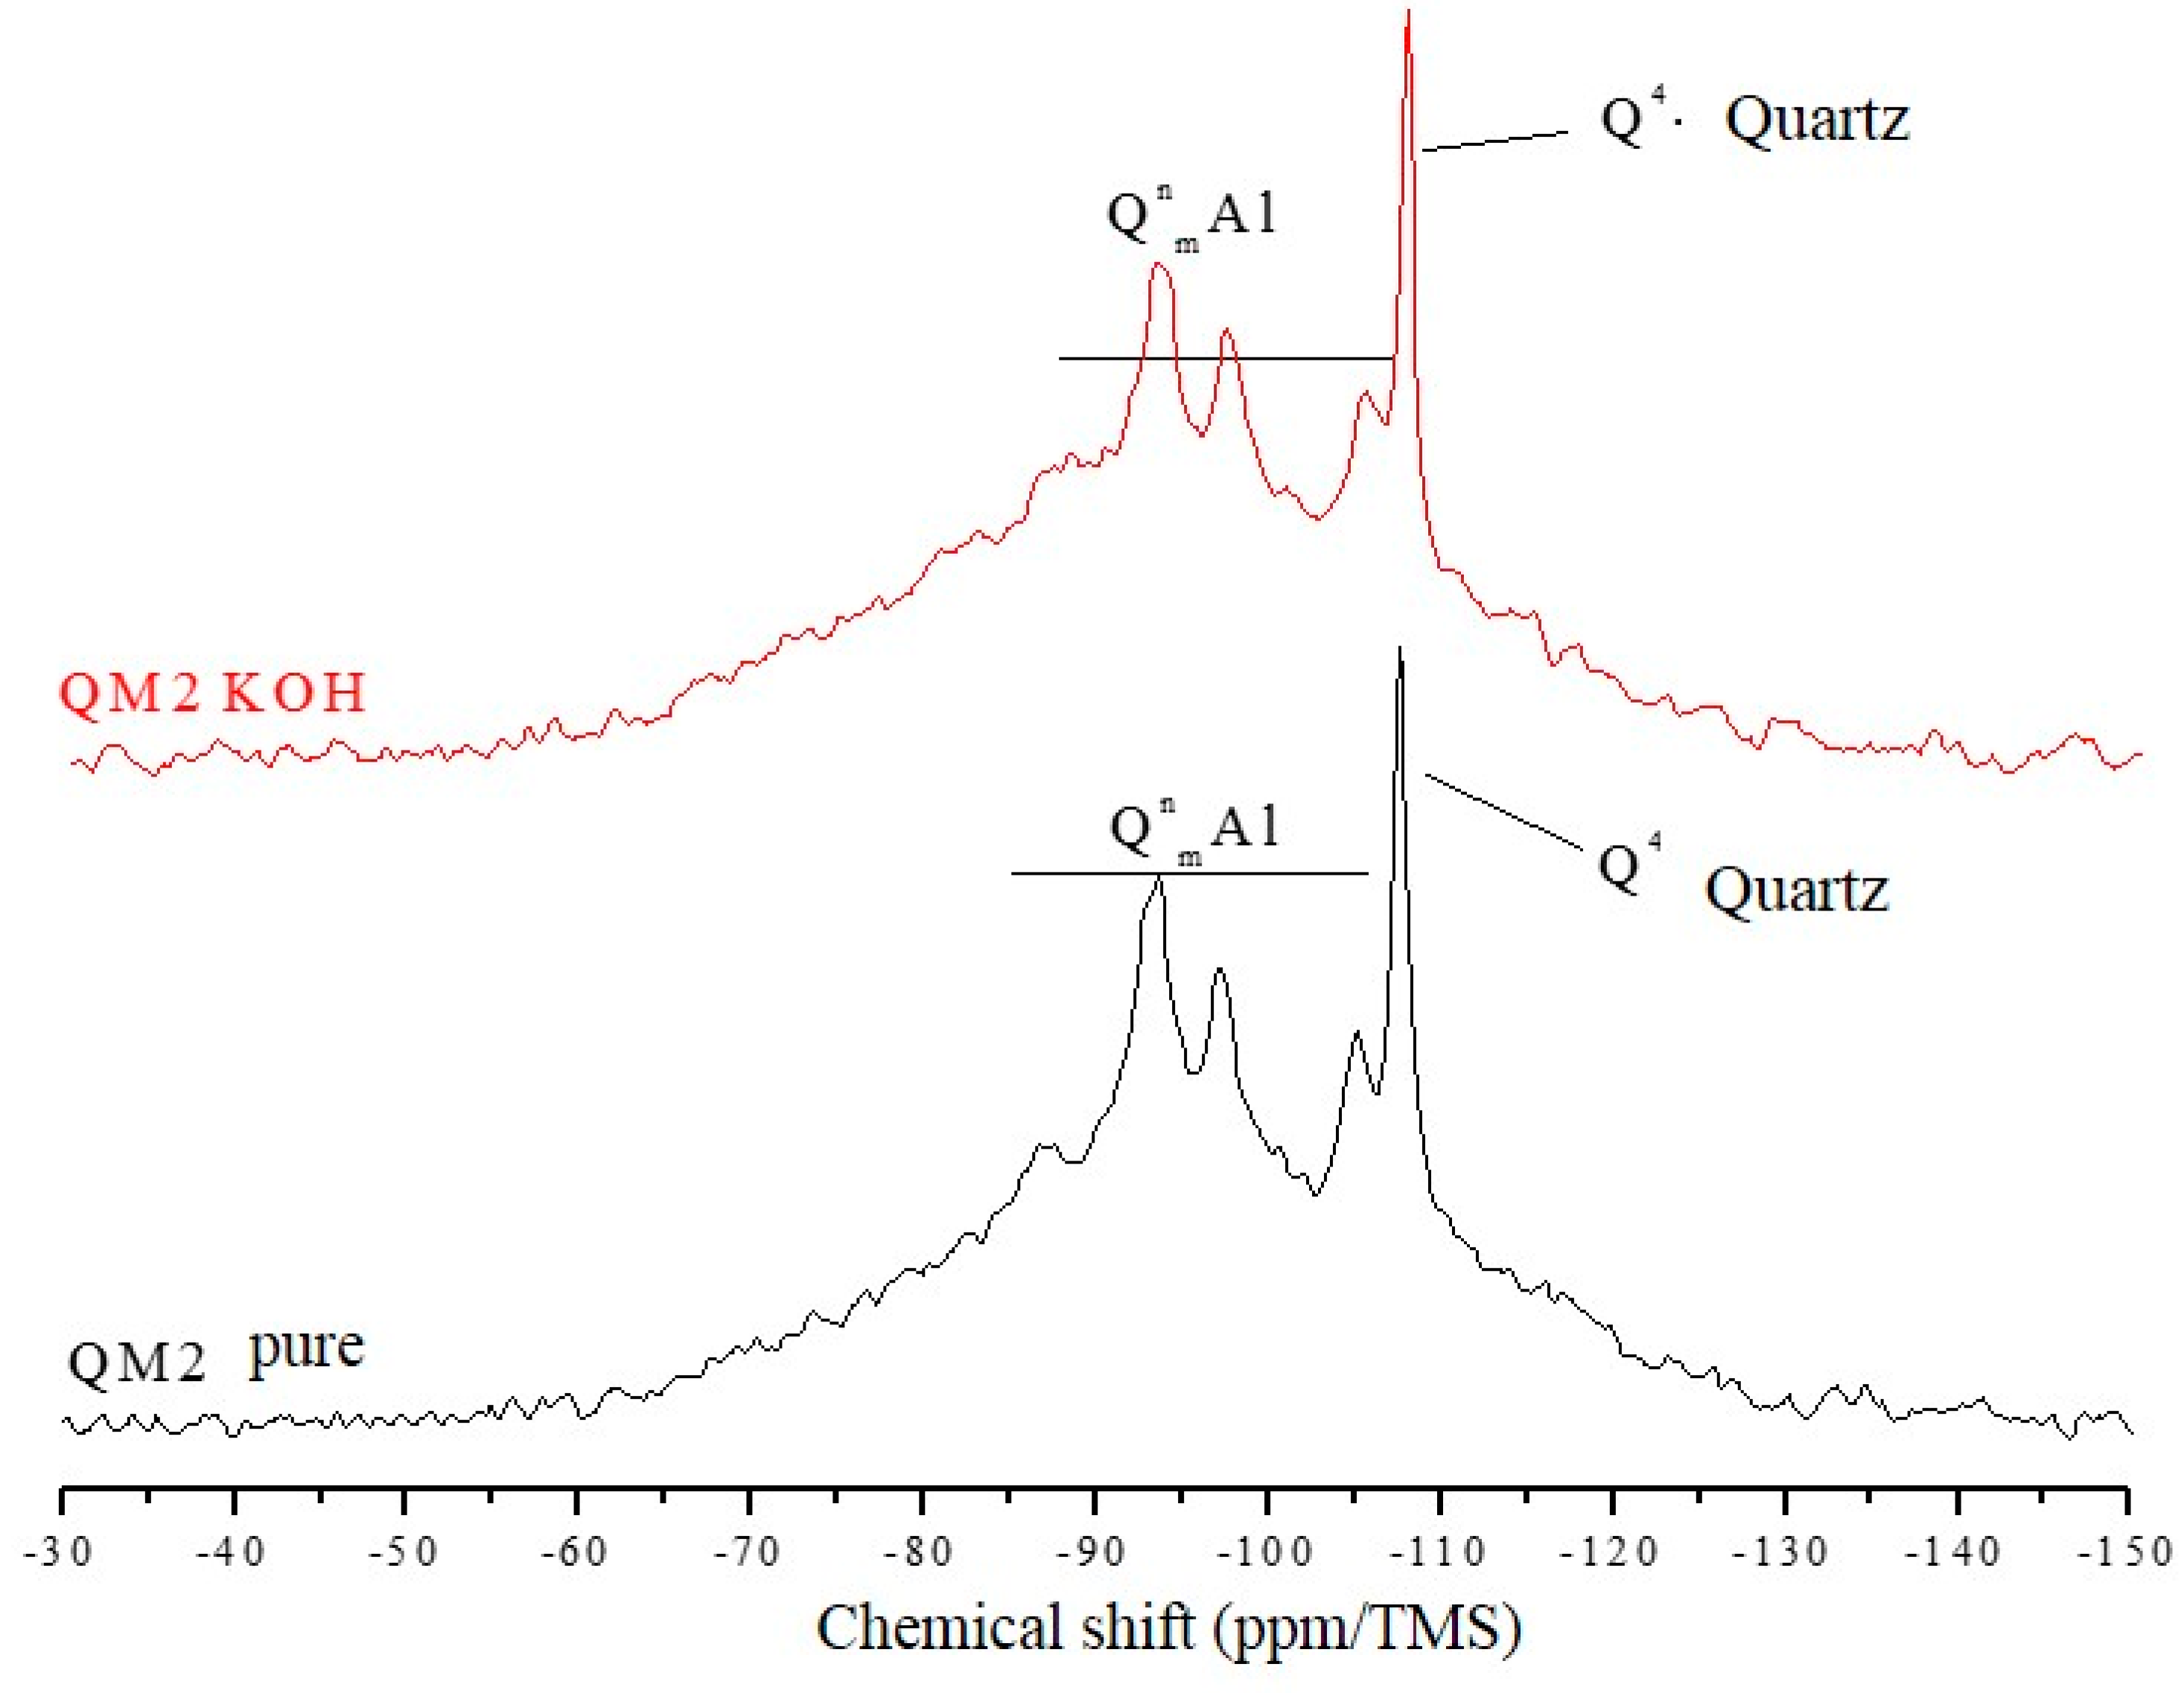
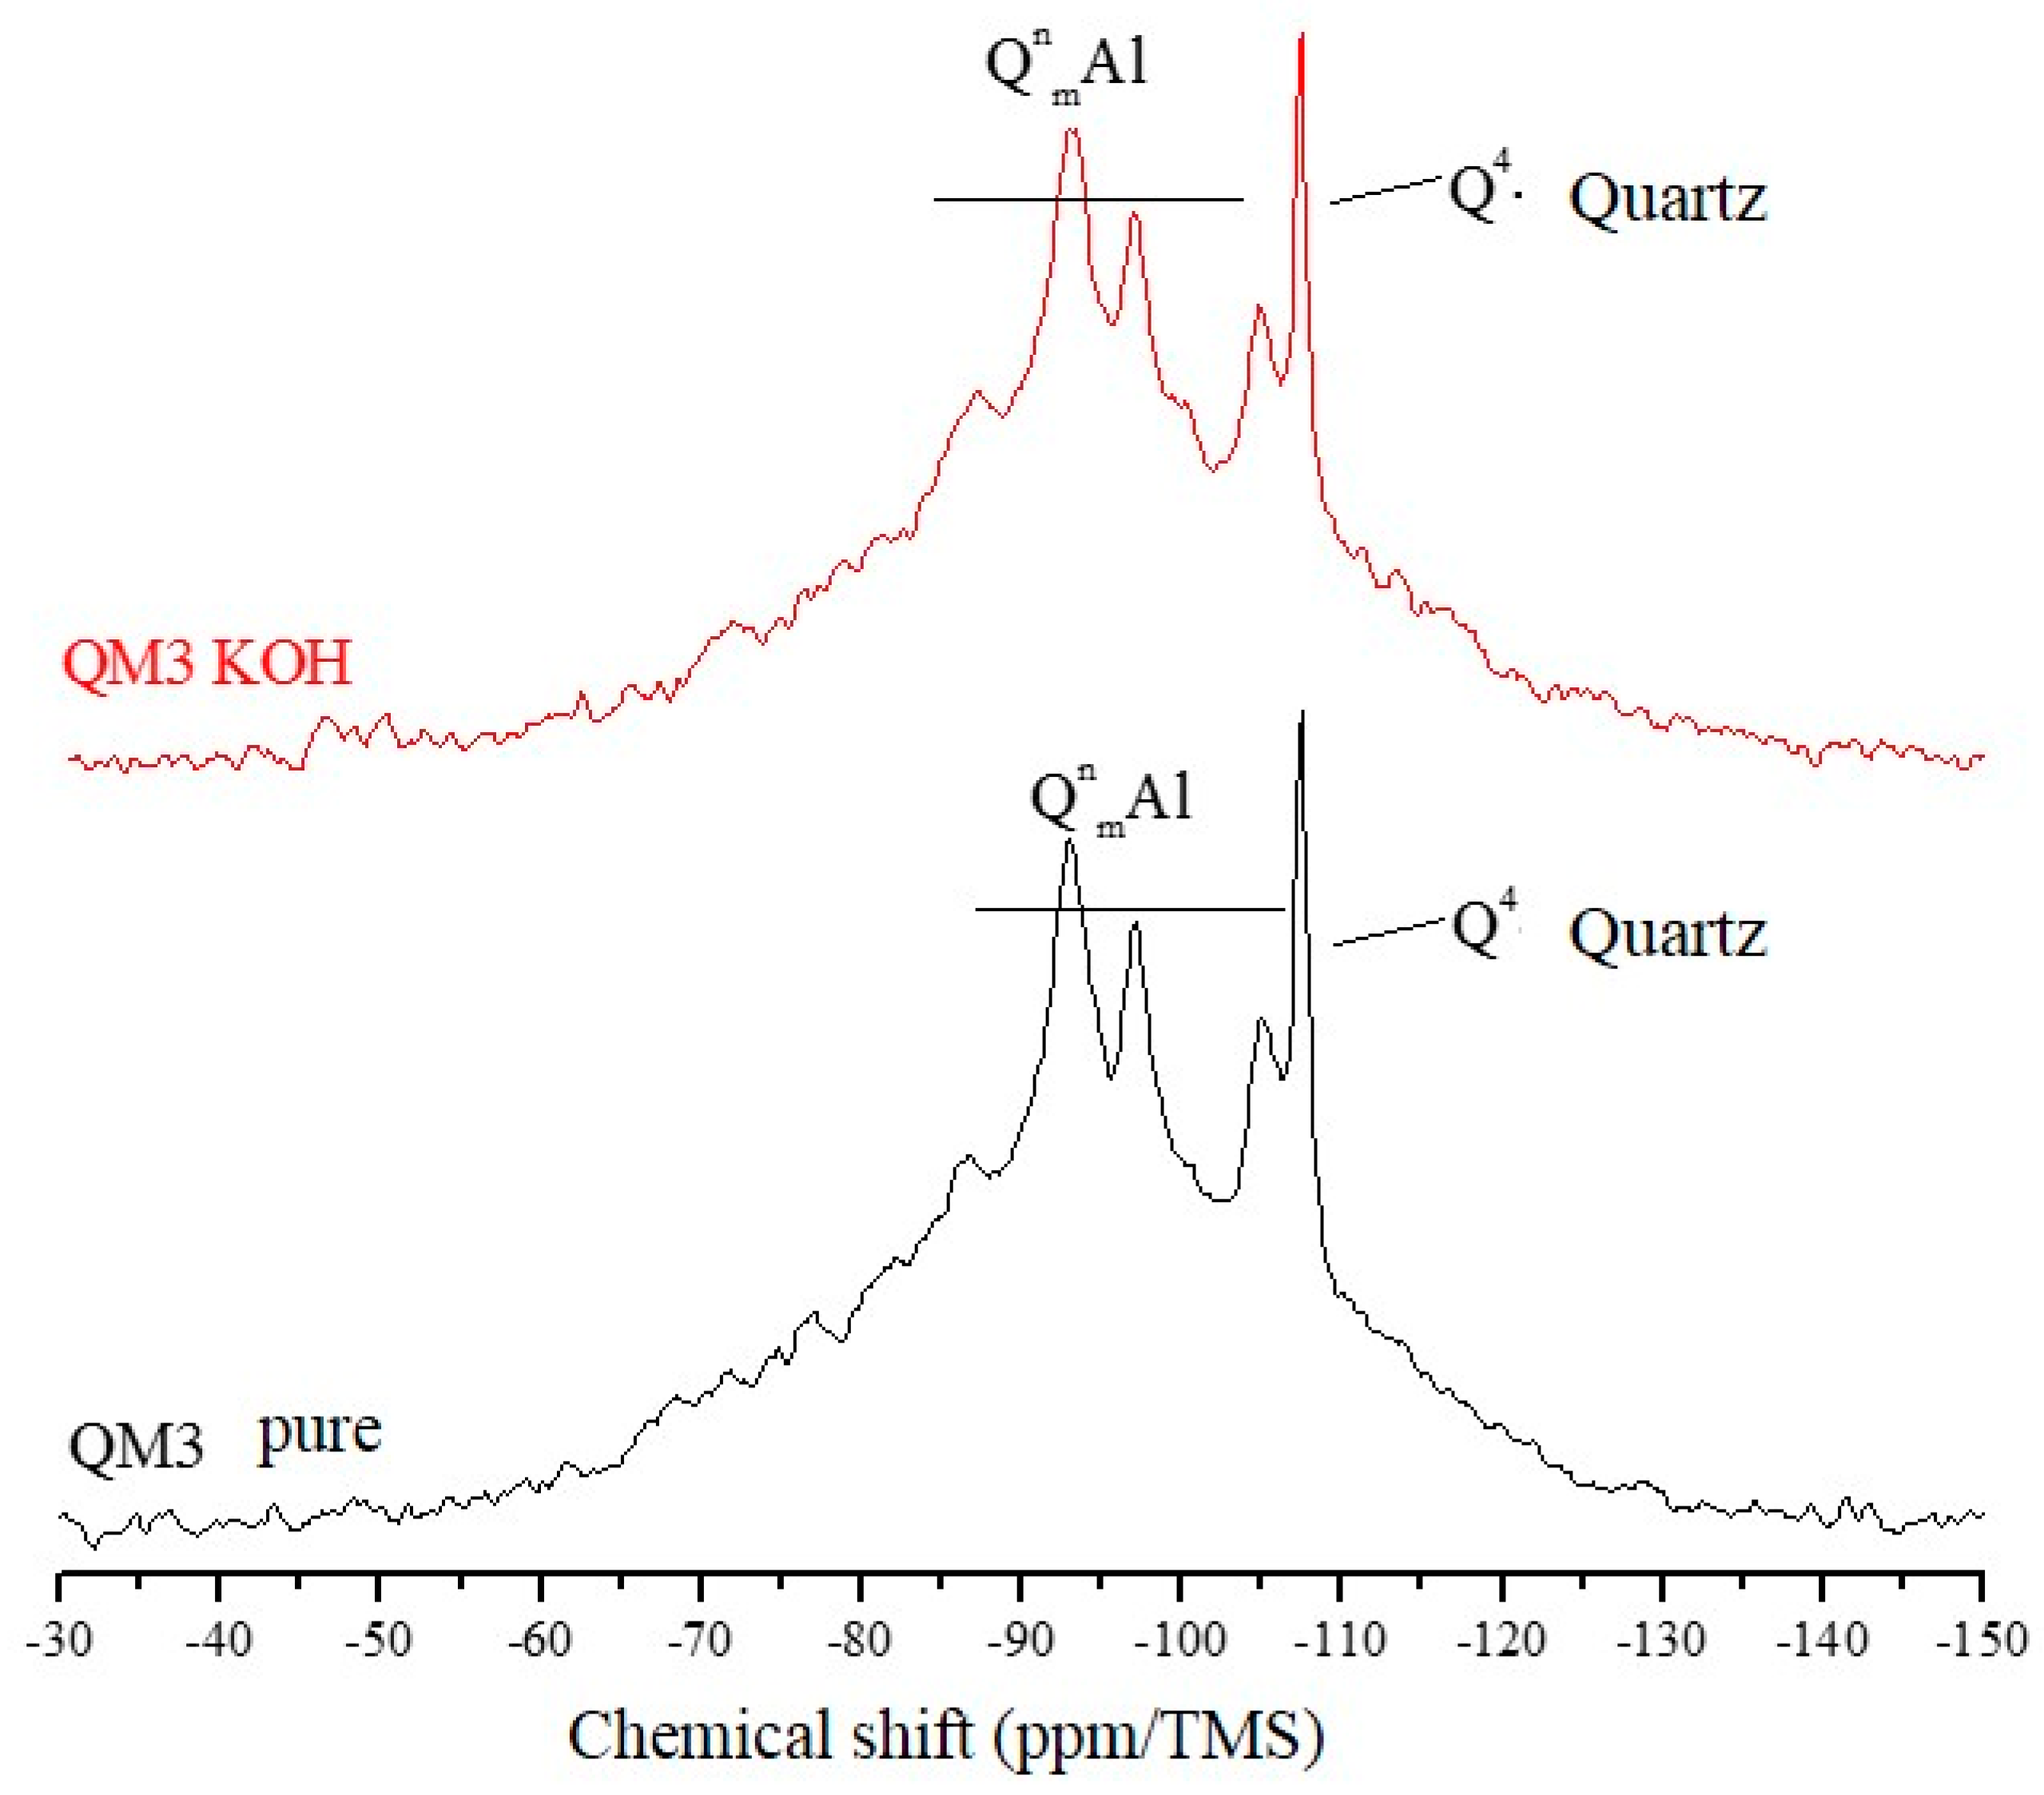
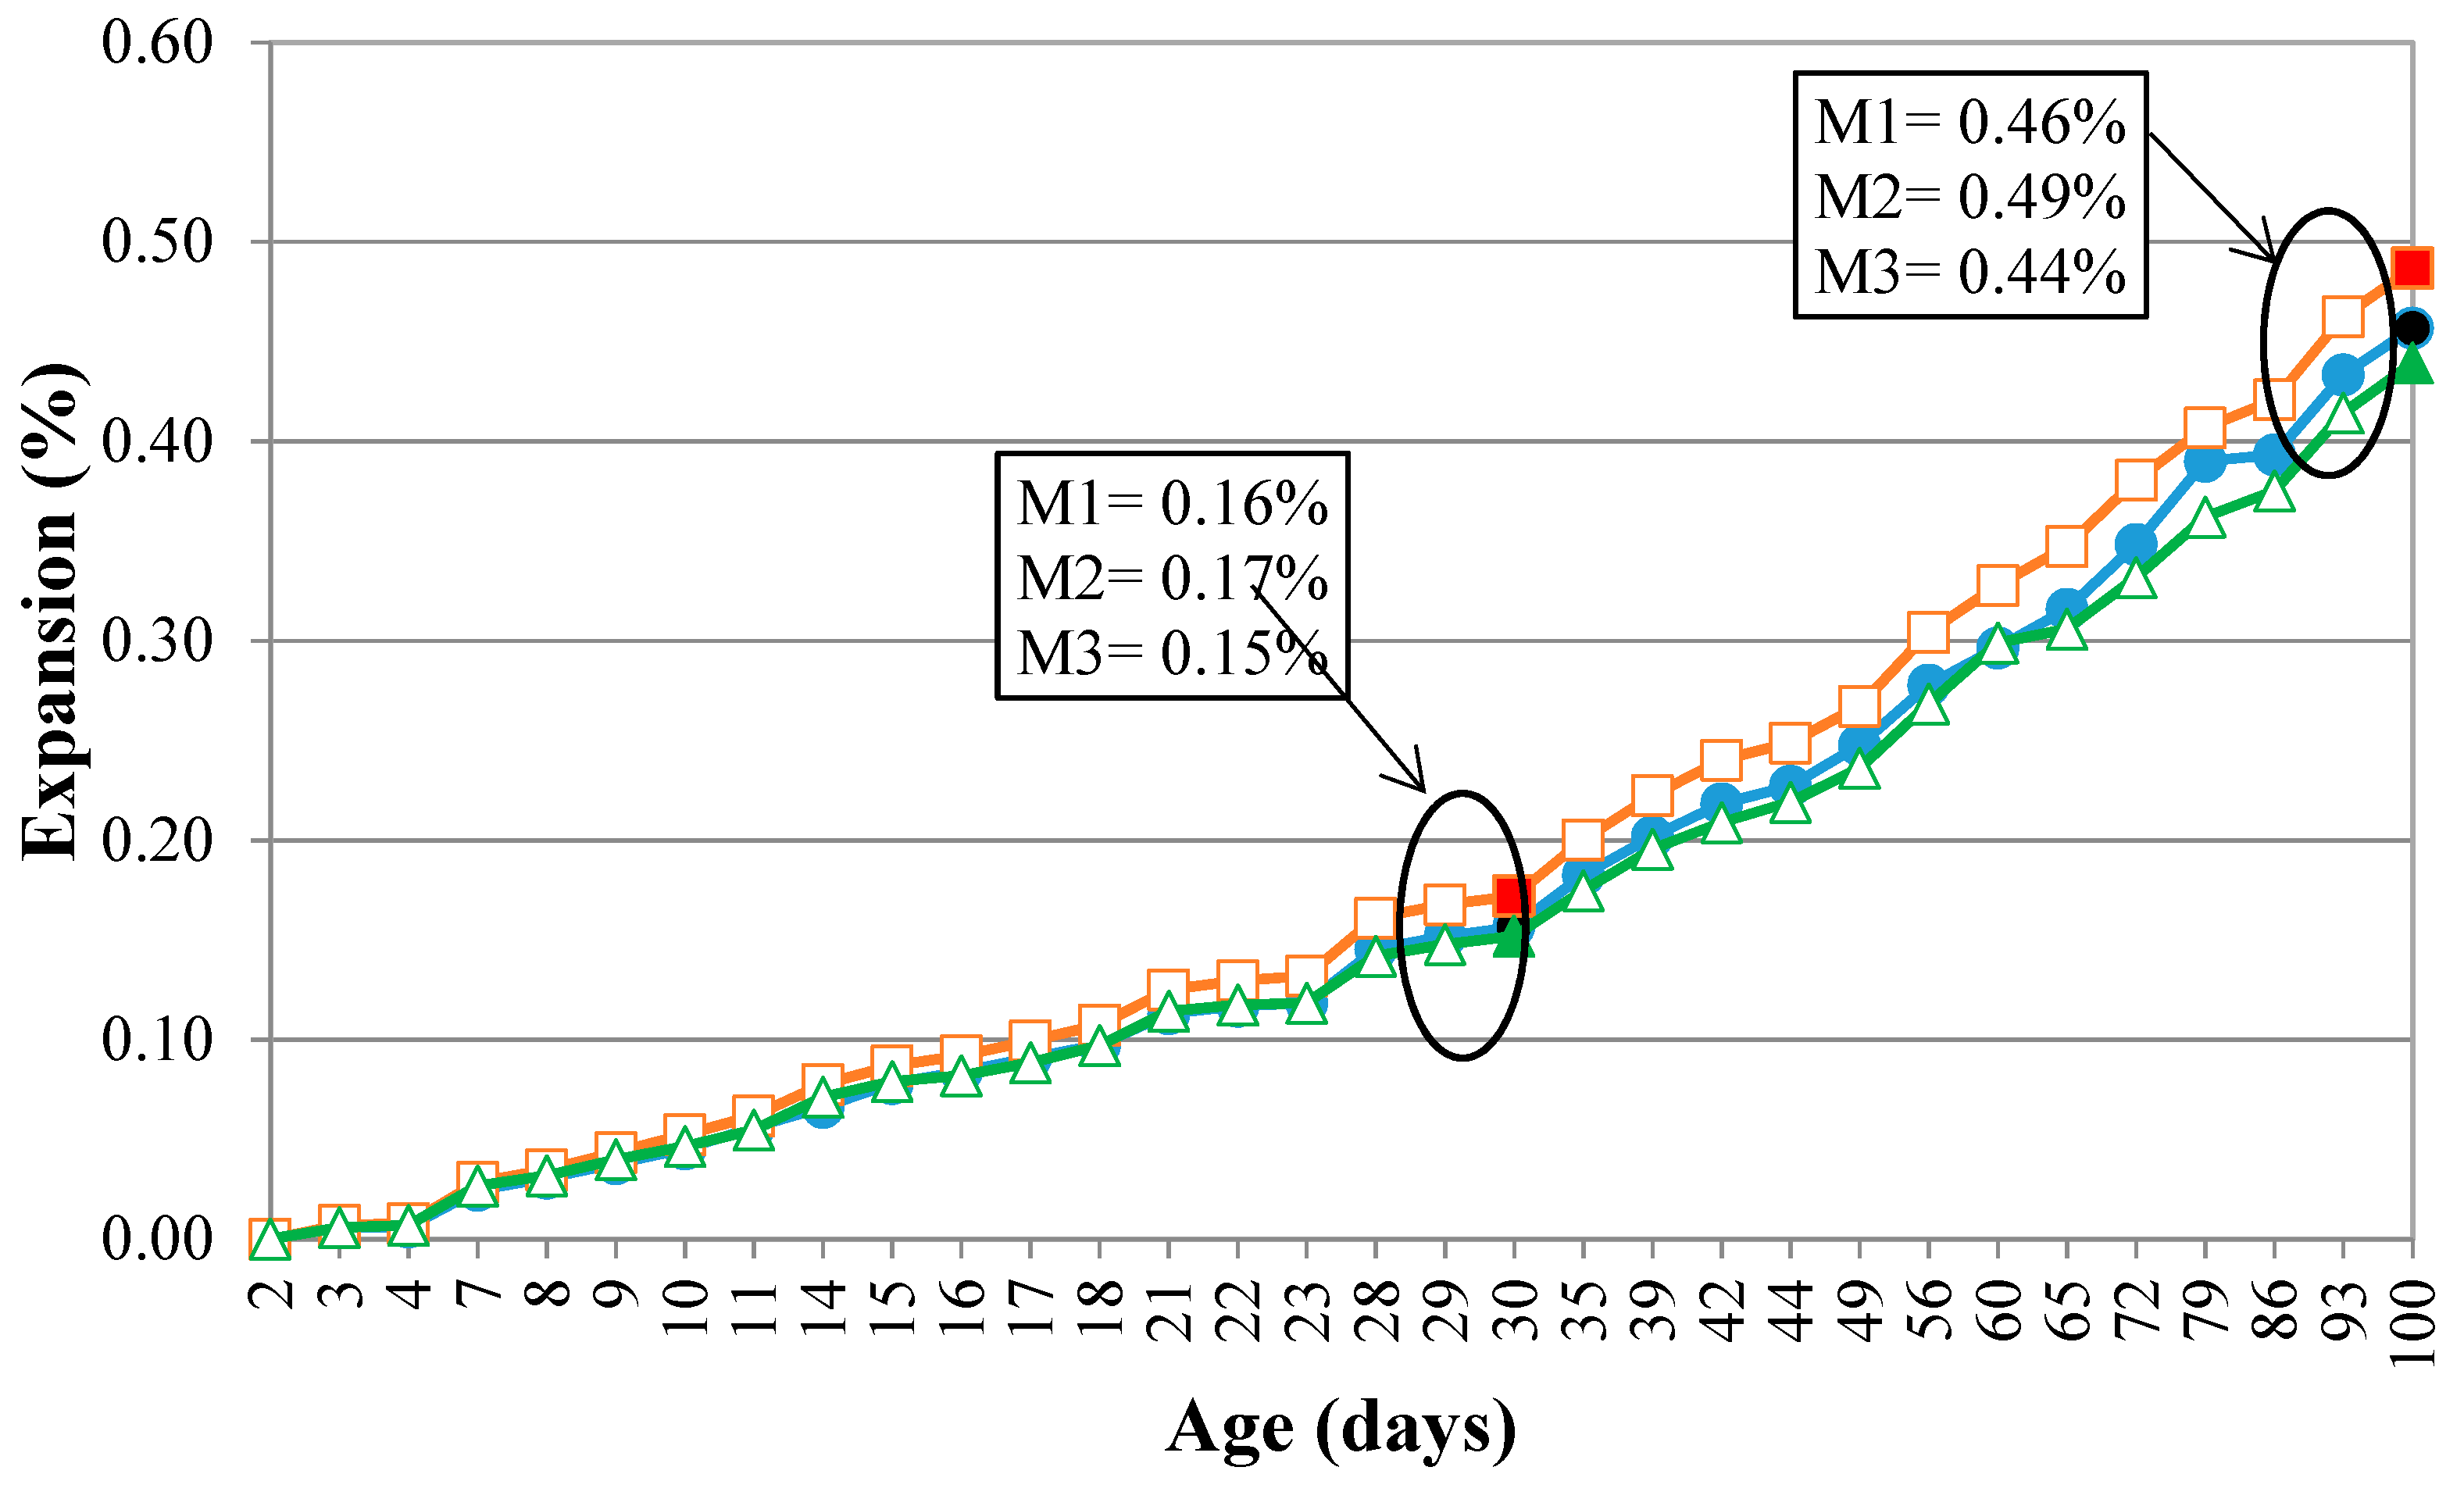
3.3. Assessment of the Development of the ASR
4. Discussion
5. Conclusions
Author Contributions
Funding
Acknowledgments
Conflicts of Interest
References
- Broekmans, M.A.T.M. Structural properties of quarts and their potential role for ASR. Mater. Charact. 2004, 53, 129–140. [Google Scholar] [CrossRef]
- Wenk, H.R.; Monteiro, P.J.M.; Shomglin, K. Relationship between aggregate microstructure and mortar expansion: A case study of deformed granitic rocks from the Santa Rosa mylonite zone. J. Mater. Sci. 2008, 23, 1278–1285. [Google Scholar] [CrossRef]
- Fernandes, I.; Noronha, F.; Teles, M. Microscopic analysis of alkali–aggregate reaction products in a 50-year-old concrete. Mater. Charact. 2004, 53, 295–306. [Google Scholar] [CrossRef]
- Yan, L.; Lee, C.F.; Fu, P.X. Alkali–silica reaction (ASR) characteristics of concrete made from granite aggregates. In Proceedings of the 12th International Conference on Alkali-Aggregate Reaction in Concrete, Beijing, China, 15–19 October 2004; Tan, M.S., Deng, M., Eds.; International Academic Publishers: Beijing, China, 2004. [Google Scholar]
- Passchier, C.W.; Trow, R.A.J. Microtectonics; Springer: Berlin/Heidelberg, Germany, 1998. [Google Scholar] [CrossRef]
- Tiecher, F.; Gomes, M.E.B.; Dal Molin, D.C.C.; Hasparyk, N.P.; Monteiro, P.M. Relationship between Degree of Deformation in Quartz and Silica Dissolution for the Development of Alkali–silica Reaction in Concrete. Materials 2017, 10, 1022. [Google Scholar] [CrossRef] [PubMed]
- Ponce, J.M.; Batic, O.R. Different manifestation of the alkali–silica reaction in concrete according to the reaction kinetics of the reactive aggregate. Cem. Concr. Res. 2006, 36, 1148–1156. [Google Scholar] [CrossRef]
- Leemann, A.; Holzer, L. Alkali-aggregate reaction: Identifying reactive silicates in complex aggregates by ESEM observation of dissolution features. Cem. Concr. Compos. 2005, 27, 796–801. [Google Scholar] [CrossRef]
- Andrade, T.; Silva, J.J.R.; Hasparyk, N.P.; Silva, C.M. Investigação do potencial de reatividade para o desencadeamento de RAA dos agregados miúdos e graúdos comercializados na região metropolitana de Recife. In Proceedings of the II Simpósio Sobre Reação Álcali-Agregado em Estruturas de Concreto, Rio de Janeiro, Brazil, 24–25 September 2006; ISBN 978-85-98576-13-8. [Google Scholar]
- Hasparyk, N.P. Investigação dos Mecanismos da Reação Álcali-Agregado: Efeito da Cinza de Casca de Arroz e da Sílica Ativa. Master’s Thesis, Universidade Federal de Goiás, Goiânia, Brazil, July 1997; p. 257. [Google Scholar]
- Silva, P.N. Reação Álcali-Agregado Nas Usinas Hidrelétricas do Complexo Paulo Afonso/CHESF: Influência da Reação Nas Propriedades do Concreto. Master’s Thesis, Universidade de São Paulo, São Paulo, Brazil, March 2007; p. 274. [Google Scholar]
- Tiecher, F.; Gomes, M.E.B.; Dal Molin, D.C.C. Alkali-aggregate reaction: Study of the influence of the petrographic characteristics of volcanic rocks. Eng. Technol. Appl. Sci. Res. 2018, 8, 1–6. [Google Scholar]
- Shukowsky, W.; Mantovani, M.S.M. Estruturação dos terrenos Pré-Crambianos da região sul do Brasil e oeste do Uruguai: Um estudo por modelamento gravimétrico. Braz. J. Geophys. 2005, 9, 275–287. [Google Scholar]
- Phillip, R.P.; Machado, R. The late neoproterozoic granitoid magmatism of the Pelotas Batholith, southern Brazil. J. S. Am. Earth Sci. 2005, 19, 461–478. [Google Scholar] [CrossRef]
- Philipp, R.P.; Mesquita, M.J.; Gomes, M.E.B.; Almeida, D.P. Reconhecimento Estrutural e Geoquímico dos Granitóides Brasilianos da Região de Pelotas, RS. Pesquisas em Geociências (UFRGS) 1993, 20, 3–13. [Google Scholar]
- Mesquita, M.J.; Fernandes, L.A.D. Petrografia dos Granitóides Deformados na Zona de Cisalhamento Dorsal de Cangucu, Região Quitéria/Capivarita, RS. Acta Geol. Leopold. 1991, 30, 55–74. [Google Scholar]
- Mesquita, M.J.; Gomes, M.E.B. Correlação estrutural e geoquímica de granitóides sin-cinemáticos à Zona de Cisalhamento Dorsal de Canguçu-RS. In Proceedings of the III Congresso Brasileiro de geoquímica/I Congresso de Geoquímica dos Países de Língua Portuguesa, São Paulo, Brazil, 30 September 1991; pp. 286–290. [Google Scholar]
- Mesquita, M.J. Petrografia dos granitóides deformados na Zona de Cisalhamento Dorsal de Canguçu (Piratini/Quitéria, RS). Master’s Thesis, Universidade Federal do Rio Grande do Sul, Porto Alegre, Brazil, 1991. [Google Scholar]
- Gomes, M.E.B. Petrologia do Granito Arroio Moinho (Canguçu/RS): Geoquímica e Deformação. Master’s Thesis, Universidade Federal do Rio Grande do Sul, Porto Alegre, Brazil, 1990. [Google Scholar]
- Gomes, M.E.B. Granito Arroio Moinho-Feições de Deformação. Acta Geol. Leopold. 1989, XIII, 37–54. [Google Scholar]
- Deer, W.A.; Howie, R.A.; Zussman, J. Minerais Constituintes das Rochas: Uma Introdução, 2nd ed.; Fundação Calouste Gulbenkian: Lisboa, Portugal, 2000. [Google Scholar]
- Annual book of ASTM standards-American Society for Testing and Materials. ASTM C 1260/01: Standard Test Method for Potential Alkali Reactivity of Aggregates (Mortar-Bar Test); ASTM International: West Conshohocken, PA, USA, 2014. [Google Scholar]
- Associação Brasileira de Normas Técnicas. NBR 9848: Soda Cáustica Líquida—Determinação de Sílica: Método Espectrofotométrico Visível com Molibdato de Amônio; ABNT: Rio de Janeiro, Brazil, 2004. [Google Scholar]
- Wise, D.U.; Dunn, E. Fault-related rocks: Suggestions for terminology. Geology 1984, 12, 391–394. [Google Scholar] [CrossRef]
- Stebbins, J.F. Nuclear magnetic resonance spectroscopy of silicates and oxides in geochemistry and geophysics. In Handbook of Physical Constants; Ahrens, T.J., Ed.; American Geophysical Union: Washington, DC, USA, 1995; pp. 303–332. [Google Scholar] [CrossRef]
- Engelhardt, G.; Michel, D. High Resolution Solid-State NMR of Silicates and Zeolites; Wiley: New York, NY, USA, 1987. [Google Scholar]
- Leemann, A. Raman microscopy of alkali–silica reaction (ASR) products formed in concrete. Cem. Concr. Res. 2017, 102, 41–47. [Google Scholar] [CrossRef]
- Florindo, R.N. Estudo da Reação Álcali-Sílica em Concretos Através de Ressonância Magnética Nuclear de Alta Resolução. Master’s Thesis, Universidade de São Paulo, São Carlos, Brazil, March 2009; p. 148. [Google Scholar]
- Tambelli, C.E.; Schneider, J.F.; Hasparyk, N.P.; Monteiro, P.J.M. Study of the structure of alkali–silica reaction gel by high-resolution NMR spectroscopy. J. Non-Cryst. Solids 2006, 352, 3429–3436. [Google Scholar] [CrossRef]
- Cong, X.D.; Kirkpatrick, R.J.; Diamond, S. 29Si MAS NMR spectroscopic investigation of alkali silica reaction product gels. Cem. Concr. Res. 1993, 23, 811–823. [Google Scholar] [CrossRef]
- Dahn, R.; Arakcheeva, A.; Schaub, P.; Chapuis, G.; Grolimund, D.; Wieland, E.; Leemann, A. Application of micro X-ray diffraction to investigate the reaction products formed by alkali–silica reaction in concrete structures. Cem. Concr. Res. 2016, 79, 49–56. [Google Scholar] [CrossRef]
- Št’astná, A.; Šanchlová, Š.; Pertold, Z.; Přikryl, R. Factors affecting alkali-reactivity of quartz-rich metamorphic rocks: Qualitative vs. quantitative microscopy. Eng. Geol. 2015, 187, 1–9. [Google Scholar] [CrossRef]
- Valduga, L.; Influência das Condições de Ensaio da ASTM C 1260 na Verificação da Reação Álcali-Agregado. Tese (Doutorado em Engenharia)-Faculdade de Engenharia Civil, Universidade Federal do Rio Grande do Sul, Porto Alegre. 2007. 204f. Available online: https://lume.ufrgs.br/handle/10183/142145 (accessed on 11 September 2018).
- Hasparyk, N.P.; Battagin, A.; Castro, A.P.; Salles, F.M.; Munhoz, T.A.; Kuperman, S.C.; Filho, J.M. Comportamento reativo de agregados brasileiros do ponto de vista da reação álcali-agregado. In Proceedings of the 50° Congresso Brasileiro do Concreto, Salvador, Brazil, 4–9 September 2008; ISBN 978-85-98576-17-6. [Google Scholar]
- Mo, X.; Fournier, B. Investigation of structural properties associated with alkali–silica reaction by means of macro and micro-analysis. Mater. Charact. 2007, 58, 179–189. [Google Scholar] [CrossRef]
- Mexias, A.S. Alteração Hidrotermal e Mineração de ouro Associada no Distrito Aurífero de Lavras do Sul/RS—A Área do Bloco Butiá. Ph.D. Thesis, Universidade Federal do Rio Grande do Sul, Porto Alegre, Brazil, 2000. [Google Scholar]
- Locati, F.; Marfil, S.; Baldo, E. Effect of ductile deformation of quartz-bearing rocks on the alkali–silica reaction. Eng. Geol. 2010, 116, 117–118. [Google Scholar] [CrossRef]
- Marinoni, N.; Voltolini, M.; Broekmans, M.A.T.M.; Mancini, L.; Monteiro, P.J.M.; Rotiroti, N.; Ferrari, E.; Bernasconi, A. A combined synchrotron radiation micro computed tomography and micro X-ray diffraction study on deleterious alkali-silica reaction. J. Mater. Sci. 2015, 50, 7985–7997. [Google Scholar] [CrossRef]


| Compound | M1 | M2 | M3 |
| Major Elements (% Mass) | |||
| SiO2 | 78.18 | 77.46 | 77.33 |
| Al2O3 | 11.82 | 12.16 | 12.02 |
| TiO2 | 0.10 | 0.13 | 0.14 |
| Fe2O3 (total) | 1.74 | 1.58 | 1.66 |
| MnO | 0.03 | 0.04 | 0.04 |
| MgO | 0.05 | 0.13 | 0.16 |
| CaO | 0.78 | 0.89 | 1.05 |
| Na2O | 1.98 | 2.14 | 2.14 |
| K2O | 5.12 | 5.06 | 4.63 |
| P2O5 | 0.02 | 0.02 | 0.01 |
| LOI | 0.24 | 0.27 | 0.24 |
| TOTAL | 100.07 | 99.88 | 99.42 |
| Trace Elements (ppm) | |||
| Y | 6 | 6 | 5 |
| Pb | 47 | 47 | 45 |
| Ni | - | - | - |
| Co | - | - | - |
| Cu | 8 | 9 | 9 |
| Ga | 11 | 13 | 12 |
| Sr | 118 | 109 | 158 |
| Zr | 78 | 78 | 81 |
| Zn | 18 | 24 | 27 |
| Nb | 2 | 5 | 3 |
| Rb | 198 | 205 | 186 |
| As | 4 | 4 | 3 |
| Cr | 88 | 28 | 60 |
| Ba | 491 | 483 | 618 |
| Stage of Deformation | Description of the Characteristic | Petrographic Aspect | Modal (%) | ||
|---|---|---|---|---|---|
| M1 | M2 | M3 | |||
| 0 | Quartz without deformation | --- | - | - | - |
| 1 | Quartz with slight undulatory extinction | 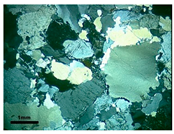 | 46.6 | 13.6 | 22.8 |
| 2 | Quartz with strong undulatory extinction, with formation of bands of deformation in the grain | 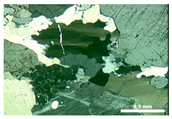 | 33.6 | 56.1 | 39.6 |
| 3 | Quartz with strong undulatory extinction, with formation of subgrains |  | 15.2 | 23.7 | 22.2 |
| 4 | Quartz recrystallized from subgrain | 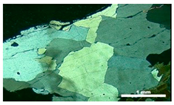 | 5.2 | 6.6 | 15.6 |
| Quartz Samples | Phases Identified | GOF |
|---|---|---|
| QM1 | Quartz–95.10% Albite–2.33% Microclíne–2.43% Muscovite–0.15% | 1.87 |
| QM2 | Quartz–98.51% Albite–1.21% Microcline–0.28% | 1.80 |
| QM3 | Quartz–69.63% Albite–24.26% Microcline–2.01% Muscovite–4.11% | 1.98 |
| Sample | Crystalline Silicates (% in Area) | Amorphous Silicates (% in Area) | Crystalline Quartz (% in Area) |
|---|---|---|---|
| Pure QM1 | 28.5 | 65.1 | 6.4 |
| QM1 KOH | 28.5 | 65.5 | 6.0 |
| Pure QM2 | 30.0 | 63.1 | 6.9 |
| QM2 KOH | 29.8 | 64.0 | 6.2 |
| Pure QM3 | 31.7 | 63.1 | 5.3 |
| QM3 KOH | 28.6 | 66.1 | 5.2 |
| Sample | Dissolved SiO2 (µg/mL) |
|---|---|
| QM1 | 18.2 |
| QM2 | 21.2 |
| QM3 | 6.1 |
| Effect | Degrees of Freedom | Squared Mean | Degrees of Freedom of the Error | Squared Mean of the Error | Test F | p-Value |
|---|---|---|---|---|---|---|
| Type of rock | 2 | 0.010758 | 192 | 0.000052 | 207.357 | 0.0000 |
| Age | 31 | 0.164571 | 192 | 0.000052 | 3174.891 | 0.0000 |
| Type of rock and age | 62 | 0.000208 | 192 | 0.000052 | 4.016 | 0.0000 |
© 2018 by the authors. Licensee MDPI, Basel, Switzerland. This article is an open access article distributed under the terms and conditions of the Creative Commons Attribution (CC BY) license (http://creativecommons.org/licenses/by/4.0/).
Share and Cite
Tiecher, F.; Florindo, R.N.; Vieira, G.L.; Gomes, M.E.B.; Dal Molin, D.C.C.; Lermen, R.T. Influence of the Quartz Deformation Structures for the Occurrence of the Alkali–Silica Reaction. Materials 2018, 11, 1692. https://doi.org/10.3390/ma11091692
Tiecher F, Florindo RN, Vieira GL, Gomes MEB, Dal Molin DCC, Lermen RT. Influence of the Quartz Deformation Structures for the Occurrence of the Alkali–Silica Reaction. Materials. 2018; 11(9):1692. https://doi.org/10.3390/ma11091692
Chicago/Turabian StyleTiecher, Francieli, Renata N. Florindo, Geilma L. Vieira, Márcia E. B. Gomes, Denise C. C. Dal Molin, and Richard T. Lermen. 2018. "Influence of the Quartz Deformation Structures for the Occurrence of the Alkali–Silica Reaction" Materials 11, no. 9: 1692. https://doi.org/10.3390/ma11091692