High-Performance Lithium-Rich Layered Oxide Material: Effects of Preparation Methods on Microstructure and Electrochemical Properties

 ,
,
Abstract
:1. Introduction
2. Experiment
2.1. The Reagents and Materials
2.2. Sol–Gel Method
2.3. Co-Precipitation Method
2.4. Materials Characterization
3. Results and Discussion
4. Conclusions
Author Contributions
Funding
Conflicts of Interest
References
- Cano, Z.P.; Banham, D.; Ye, S.Y.; Hintennach, A.; Lu, J.; Fowler, M.; Chen, Z.W. Batteries and fuel cells for emerging electric vehicle markets. Nat. Energy 2018, 3, 279–289. [Google Scholar] [CrossRef]
- Chu, S.; Cui, Y.; Liu, N. The path towards sustainable energy. Nat. Mater. 2016, 16, 16–22. [Google Scholar] [CrossRef] [PubMed]
- Zhu, C.; Wei, D.H.; Wu, Y.L.; Zhang, Z.; Zhang, G.H.; Duan, J.F.; Li, L.J.; Zhu, H.L.; Zhu, Z.Y.; Chen, Z.Y. Controllable construction of interconnected SnO/N-doped carbon/carbon composite for enhanced-performance lithium-ion batteries anodes. J. Alloy. Compd. 2019, 778, 731–740. [Google Scholar] [CrossRef]
- Ji, Y.; Zhou, C.K.; Lin, F.; Li, B.J.; Yang, F.F.; Zhu, H.L.; Duan, J.F.; Chen, Z.Y. Submicron Sized Nb Doped Lithium Garnet for High Ionic Conductivity Solid Electrolyte and Performance of All Solid-State Lithium Battery. Preprints 2019, 2019120307. [Google Scholar] [CrossRef]
- Goodenough, J.B.; Kim, Y. Challenges for Rechargeable Li Batteries. Chem. Mater. Rev. 2010, 22, 587–603. [Google Scholar] [CrossRef]
- Nitta, N.; Wu, F.X.; Lee, J.T.; Yushin, G. Li-ion battery materials: Present and future. Mater. Today 2015, 18, 252–264. [Google Scholar] [CrossRef]
- Schmuch, R.; Wagner, R.; Hörpel, G.; Placke, T.; Winter, M. Performance and cost of materials for lithium-based rechargeable automotive batteries. Nat. Energy 2018, 3, 267–278. [Google Scholar] [CrossRef]
- Andre, D.; Kim, S.J.; Peter, L.; Lux, S.F.; Maglia, F.; Paschosa, O.; Stiasznya, B. Future generations of cathode materials: An automotive industry perspective. J. Mater. Chem. A 2015, 3, 6709–6732. [Google Scholar] [CrossRef]
- Manthiram, A.; Song, B.H.; Li, W.D. A perspective on nickel-rich layered oxide cathodes for lithium-ion batteries. Energy Storage Mater. 2017, 6, 125–139. [Google Scholar] [CrossRef]
- Myung, S.T.; Maglia, F.; Park, K.J.; Yoon, C.S.; Lamp, P.; Kim, S.J.; Sun, Y.K. Nickel-Rich Layered Cathode Materials for Automotive Lithium-Ion Batteries: Achievements and Perspectives. ACS Energy Lett. 2017, 2, 196–223. [Google Scholar] [CrossRef]
- Li, M.; Lu, J.; Chen, Z.W.; Amine, K. 30 Years of Lithium-Ion Batteries. Adv. Mater. 2018, 30, 1800561–1800584. [Google Scholar] [CrossRef] [PubMed] [Green Version]
- Zhang, H.L.; Zhao, H.B.; Khan, M.A.; Zou, W.W.; Xu, J.Q.; Zhang, L.; Zhang, J.J. Recent progress in advanced electrode materials, separators and electrolytes for lithium batteries. J. Mater. Chem. A 2018, 6, 20564–20620. [Google Scholar] [CrossRef]
- Liu, J.; Bao, Z.N.; Cui, Y.; Dufek, E.J.; Goodenough, J.B.; Khalifah, P.; Li, Q.Y.; Liaw, B.Y.; Liu, P.; Manthiram, A.; et al. Pathways for practical high-energy long-cycling lithium metal batteries. Nat. Energy 2019, 4, 180–186. [Google Scholar] [CrossRef]
- Thackeray, M.M.; Kang, S.H.; Johnson, C.S.; Vaughey, J.T.; Benedek, R.; Hackney, S.A. Li2MnO3-stabilized LiMO2 (M = Mn, Ni, Co) electrodes for lithium-ion batteries. J. Mater. Chem. 2007, 17, 3112–3125. [Google Scholar] [CrossRef]
- Mohanty, D.; Li, J.L.; Abraham, D.P.; Huq, A.; Payzant, E.A.; Wood, D.L.; Daniel, C. Unraveling the Voltage-Fade Mechanism in High-Energy-Density Lithium-Ion Batteries: Origin of the Tetrahedral Cations for Spinel Conversion. Chem. Mater. 2014, 26, 6272–6280. [Google Scholar] [CrossRef]
- Sathiya, M.; Abakumov, A.M.; Foix, D.; Rousse, G.; Ramesha, K.; Saubanere, M.; Doublet, M.L.; Vezin, H.; Laisa, C.P.; Prakash, A.S.; et al. Origin of voltage decay in high-capacity layered oxide electrodes. Nat. Mater. 2015, 14, 230–239. [Google Scholar] [CrossRef]
- Hu, E.Y.; Yu, X.Q.; Lin, R.Q.; Bi, X.X.; Lu, J.; Bak, S.; Nam, K.W.; Xin, H.L.; Jaye, C.; Fischer, D.A.; et al. Evolution of redox couples in Li- and Mn-rich cathode materials and mitigation of voltage fade by reducing oxygen release. Nat. Energy 2018, 3, 690–698. [Google Scholar] [CrossRef]
- Singer, A.; Zhang, M.; Hy, S.; Cela, D.; Fang, C.; Wynn, T.A.; Qiu, B.; Xia, Y.; Liu, Z.; Ulvestad, A.; et al. Nucleation of dislocations and their dynamics in layered oxide cathode materials during battery charging. Nat. Energy 2018, 3, 641–647. [Google Scholar] [CrossRef]
- Zhu, H.L.; Li, Q.F.; Gong, X.L.; Cao, K.F.; Chen, Z.Y. Enhanced High Voltage Performance of Chlorine/Bromine Co-Doped Lithium Nickel Manganese Cobalt Oxide. Crystals 2018, 8, 425. [Google Scholar] [CrossRef] [Green Version]
- Pang, W.K.; Lin, H.F.; Peterson, V.K.; Lu, C.Z.; Liu, C.E.; Liao, S.C.; Chen, J.M. Effects of Fluorine and Chromium Doping on the Performance of Lithium-Rich Li1+xMO2 (M = Ni, Mn, Co) Positive Electrodes. Chem. Mater. 2017, 29, 10299–10311. [Google Scholar] [CrossRef] [Green Version]
- Liu, D.M.; Fan, X.J.; Li, Z.H.; Liu, T.; Ling, M.; Liu, Y.J.; Liang, C.D. A cation/anion co-doped Li1.12Na0.08Ni0.2Mn0.6O1.95F0.05 cathode for lithium ion batteries. Nano Energy 2019, 58, 786–796. [Google Scholar] [CrossRef]
- Zheng, J.M.; Gu, M.; Xiao, J.; Polzin, B.J.; Yan, P.F.; Chen, X.L.; Wang, C.M.; Zhang, J.G. Functioning Mechanism of AlF3 Coating on the Li- and Mn-Rich Cathode Materials. Chem. Mater. 2014, 26, 6320–6327. [Google Scholar] [CrossRef]
- Xu, M.; Chen, Z.Y.; Li, L.J.; Zhu, H.L.; Zhao, Q.F.; Xu, L.; Peng, N.F.; Gong, L. Highly crystalline alumina surface coating from hydrolysis of aluminum isopropoxide on lithium-rich layered oxide. J. Power Sources 2015, 281, 444–454. [Google Scholar] [CrossRef]
- Liu, Y.J.; Fan, X.J.; Zhang, Z.Q.; Wu, H.H.; Liu, D.M.; Dou, A.C.; Su, M.R.; Zhang, Q.B.; Chu, D.W. Enhanced electrochemical performance of Li-rich layered cathode materials by combined Cr doping and LiAlO2 coating. ACS Sustain. Chem. Eng. 2019, 7, 2225–2235. [Google Scholar] [CrossRef]
- Shi, J.L.; Xiao, D.D.; Ge, M.Y.; Yu, X.Q.; Chu, Y.; Huang, X.J.; Zhang, X.D.; Yin, Y.X.; Yang, X.Q.; Guo, Y.G.; et al. High-Capacity Cathode Material with High Voltage for Li-Ion Batteries. Adv. Mater. 2018, 30, 1705575–1705582. [Google Scholar] [CrossRef]
- Shi, J.L.; Zhang, J.N.; He, M.; Zhang, X.D.; Yin, Y.X.; Li, H.; Guo, Y.G.; Gu, L.; Li, J.W. Mitigating Voltage Decay of Li-Rich Cathode Material via Increasing Ni-Content for Lithium-Ion Batteries. ACS Appl. Mater. Interfaces 2016, 8, 20138–20146. [Google Scholar] [CrossRef]
- Ju, X.K.; Hou, X.; Liu, Z.Q.; Zheng, H.F.; Huang, H.; Qu, B.H.; Wang, T.H.; Li, Q.H.; Li, J. The full gradient design in Li-rich cathode for high performance lithium ion batteries with reduced voltage decay. J. Power Sources 2019, 437, 226902. [Google Scholar] [CrossRef]
- Du, C.Q.; Zhang, F.; Ma, C.X.; Wu, J.W.; Tang, Z.Y.; Zhang, X.H.; Qu, D.Y. Synthesis and electrochemical properties of Li1.2Mn0.54Ni0.13Co0.13O2 cathode material for lithium-ion battery. Ionics 2016, 22, 209–218. [Google Scholar] [CrossRef]
- Tang, T.; Zhang, H.L. Synthesis and electrochemical performance of lithium-rich cathode material Li[Li0.2Ni0.15Mn0.55Co0.1-xAlx]O2. Electrochim. Acta 2016, 191, 263–269. [Google Scholar] [CrossRef]
- Fu, F.; Huang, Y.Y.; Wu, P.; Bu, Y.K.; Wang, Y.B.; Yao, J.N. Controlled synthesis of lithium-rich layered Li1.2Mn0.56Ni0.12Co0.12O2 oxide with tunable morphology and structure as cathode material for lithium-ion batteries by solvo/hydrothermal methods. J. Alloy. Compd. 2015, 618, 673–678. [Google Scholar] [CrossRef]
- Shi, S.J.; Tu, J.P.; Tang, Y.Y.; Yu, Y.X.; Zhang, Y.Q.; Wang, X.L. Synthesis and electrochemical performance of Li1.131Mn0.504Ni0.243Co0.122O2 cathode materials for lithium ion batteries via freeze drying. J. Power Sources 2013, 221, 300–307. [Google Scholar] [CrossRef]
- Chen, Z.Y.; Yan, X.Y.; Xu, M.; Cao, K.F.; Zhu, H.L.; Li, L.J.; Duan, J.F. Building Honeycomb-Like Hollow Microsphere Architecture in a Bubble Template Reaction for High-Performance Lithium-Rich Layered Oxide Cathode Materials. ACS Appl. Mater. Interfaces 2017, 9, 30617–30625. [Google Scholar] [CrossRef] [PubMed]
- Bareno, J.; Lei, C.H.; Wen, J.G.; Kang, S.H.; Petrov, I.; Abraham, D.P. Local structure of layered oxide electrode materials for lithium-ion batteries. Adv. Mater. 2010, 22, 1122–1127. [Google Scholar] [CrossRef] [PubMed]
- Jarvis, K.A.; Deng, Z.Q.; Allard, L.F.; Manthiram, A.; Ferreira, P.J. Atomic Structure of a Lithium-Rich Layered Oxide Material for Lithium-Ion Batteries: Evidence of a Solid Solution. Chem. Mater. 2011, 23, 3614–3621. [Google Scholar] [CrossRef]
- Long, B.R.; Croy, J.R.; Dogan, F.; Suchomel, M.R.; Key, B.; Wen, J.G.; Miller, D.J.; Thackeray, M.M.; Balasubramanian, M. Effect of Cooling Rates on Phase Separation in 0.5Li2MnO3·0.5LiCoO2 Electrode Materials for Li-Ion Batteries. Chem. Mater. 2014, 26, 3565–3572. [Google Scholar] [CrossRef]
- Zheng, J.M.; Gu, M.; Genc, A.; Xiao, J.; Xu, P.H.; Chen, X.L.; Zhu, Z.H.; Zhao, W.B.; Pullan, L.; Wang, C.M.; et al. Mitigating Voltage Fade in Cathode Materials by Improving the Atomic Level Uniformity of Elemental Distribution. Nano Lett. 2014, 14, 2628–2635. [Google Scholar] [CrossRef]
- Shojan, J.; Rao, C.V.; Torres, L.; Singh, G.; Katiyar, R.S. Lithium-ion battery performance of layered 0.3Li2MnO3-0.7LiNi0.5Mn0.5O2 composite cathode prepared by co-precipitation and sol-gel methods. Mater. Lett. 2013, 104, 57–60. [Google Scholar] [CrossRef]
- Wang, C.C.; Jarvis, K.A.; Ferreira, P.J.; Manthiram, A. Effect of Synthesis Conditions on the First Charge and Reversible Capacities of Lithium-Rich Layered Oxide Cathodes. Chem. Mater. 2013, 25, 3267–3275. [Google Scholar] [CrossRef]
- Li, L.J.; Xu, M.; Chen, Z.Y.; Zhou, X.; Zhang, Q.B.; Zhu, H.L.; Wu, C.; Zhang, K.L. High-performance lithium-rich layered oxide materials: Effects of chelating agents on microstructure and electrochemical properties. Electrochim. Acta 2015, 174, 446–455. [Google Scholar] [CrossRef]
- Liu, J.; Liu, Q.M.; Zhu, H.L.; Lin, F.; Ji, Y.; Li, B.J.; Duan, J.F.; Chen, Z.Y. Effect of Different Composition on Voltage Attenuation of Li-Rich Cathode Material for LithiumIon Batteries. Materials 2020, 13, 40. [Google Scholar] [CrossRef] [Green Version]
- Yu, R.Z.; Zhang, Z.J.; Jamil, S.; Chen, J.C.; Zhang, X.H.; Wang, X.Y.; Yang, Z.H.; Shu, H.B.; Yang, X.K. Effects of Nanofiber Architecture and Antimony Doping on the Performance of Lithium-Rich Layered Oxides: Enhancing Lithium Diffusivity and Lattice Oxygen Stability. ACS Appl. Mater. Interfaces 2018, 10, 16561–16571. [Google Scholar] [CrossRef] [PubMed]
- Gu, M.; Belharouak, I.; Genc, A.; Wang, Z.; Wang, D.; Amine, K.; Gao, F.; Zhou, G.; Thevuthasan, S.; Baer, D.R.; et al. Conflicting roles of nickel in controlling cathode performance in lithium ion batteries. Nano Lett. 2012, 12, 5186–5191. [Google Scholar] [CrossRef] [PubMed]
- Chen, Z.Y.; Zhang, Z.; Zhao, Q.F.; Duan, J.F.; Zhu, H.L. Understanding the Impact of K-Doping on the Structure and Performance of LiFePO4/C Cathode Materials. J. Nanosci. Nanotechnol. 2019, 19, 119–124. [Google Scholar] [CrossRef] [PubMed]


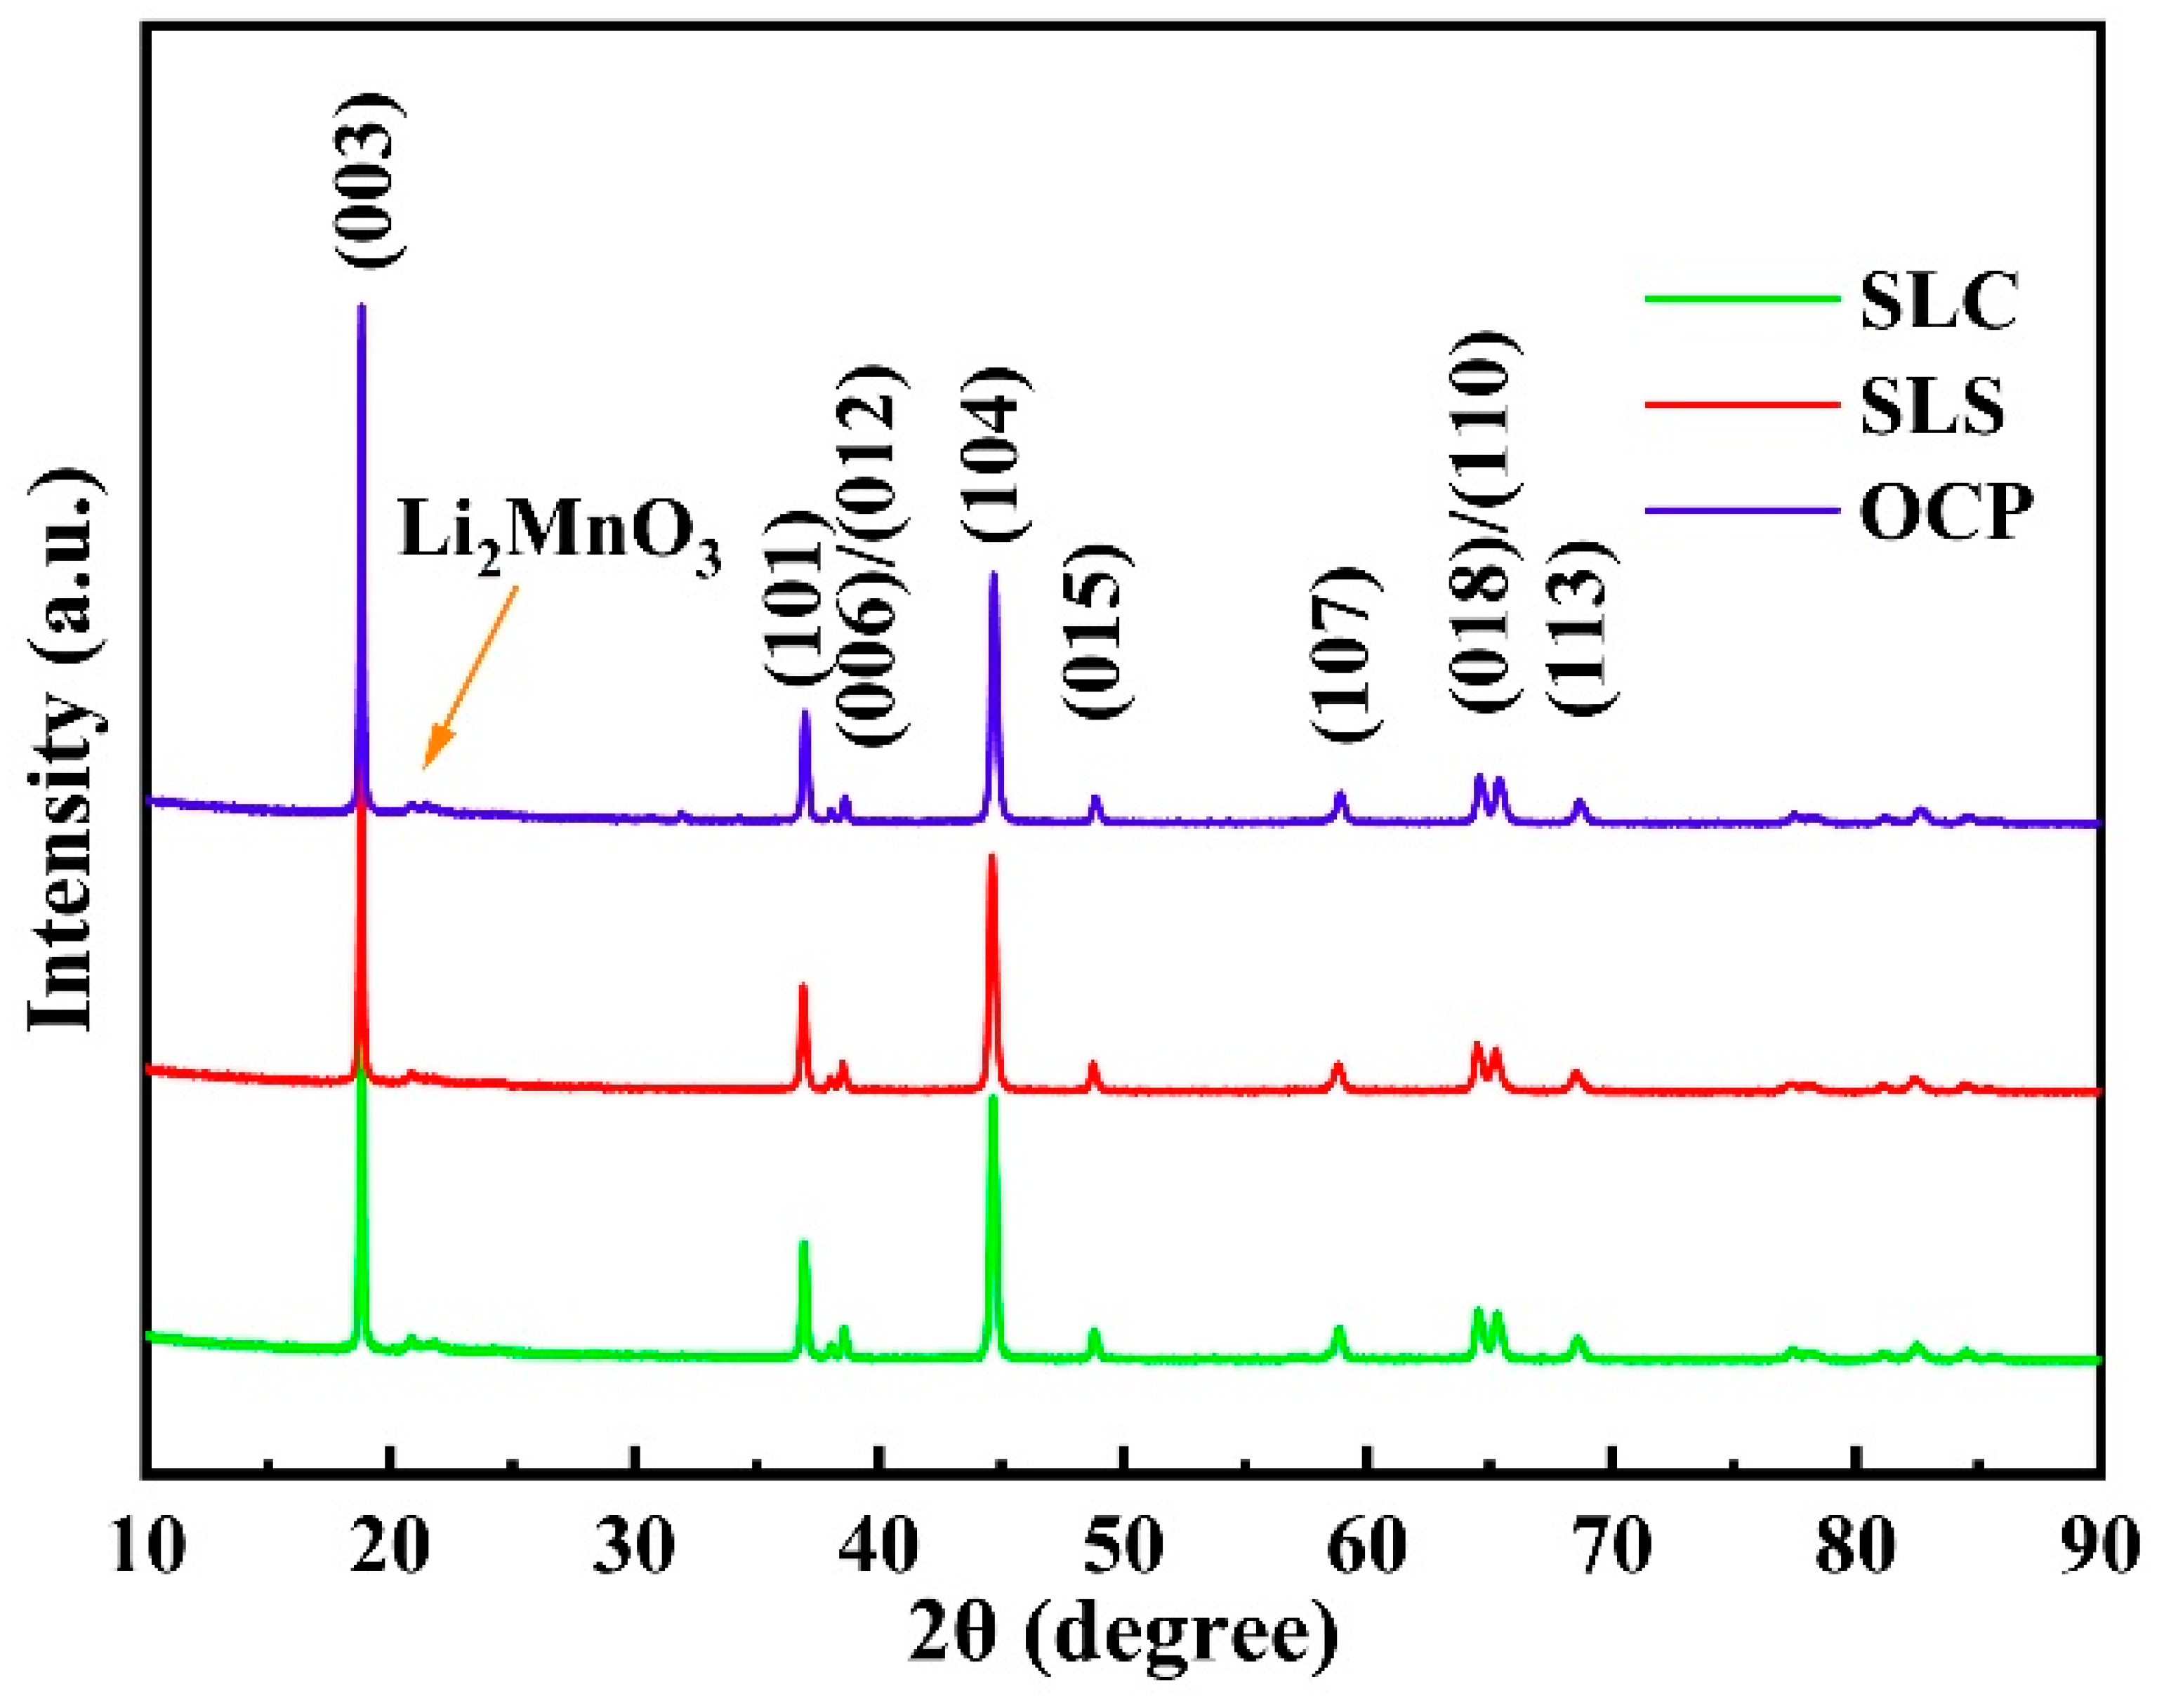
| Sample | Lattice Parameters | c/a | ||
|---|---|---|---|---|
| a (Å) | c (Å) | v (Å3) | ||
| SLC | 2.8564 | 14.2203 | 100.49 | 4.978 |
| SLS | 2.8605 | 14.2348 | 100.87 | 4.976 |
| OCP | 2.8551 | 14.2376 | 100.37 | 4.980 |
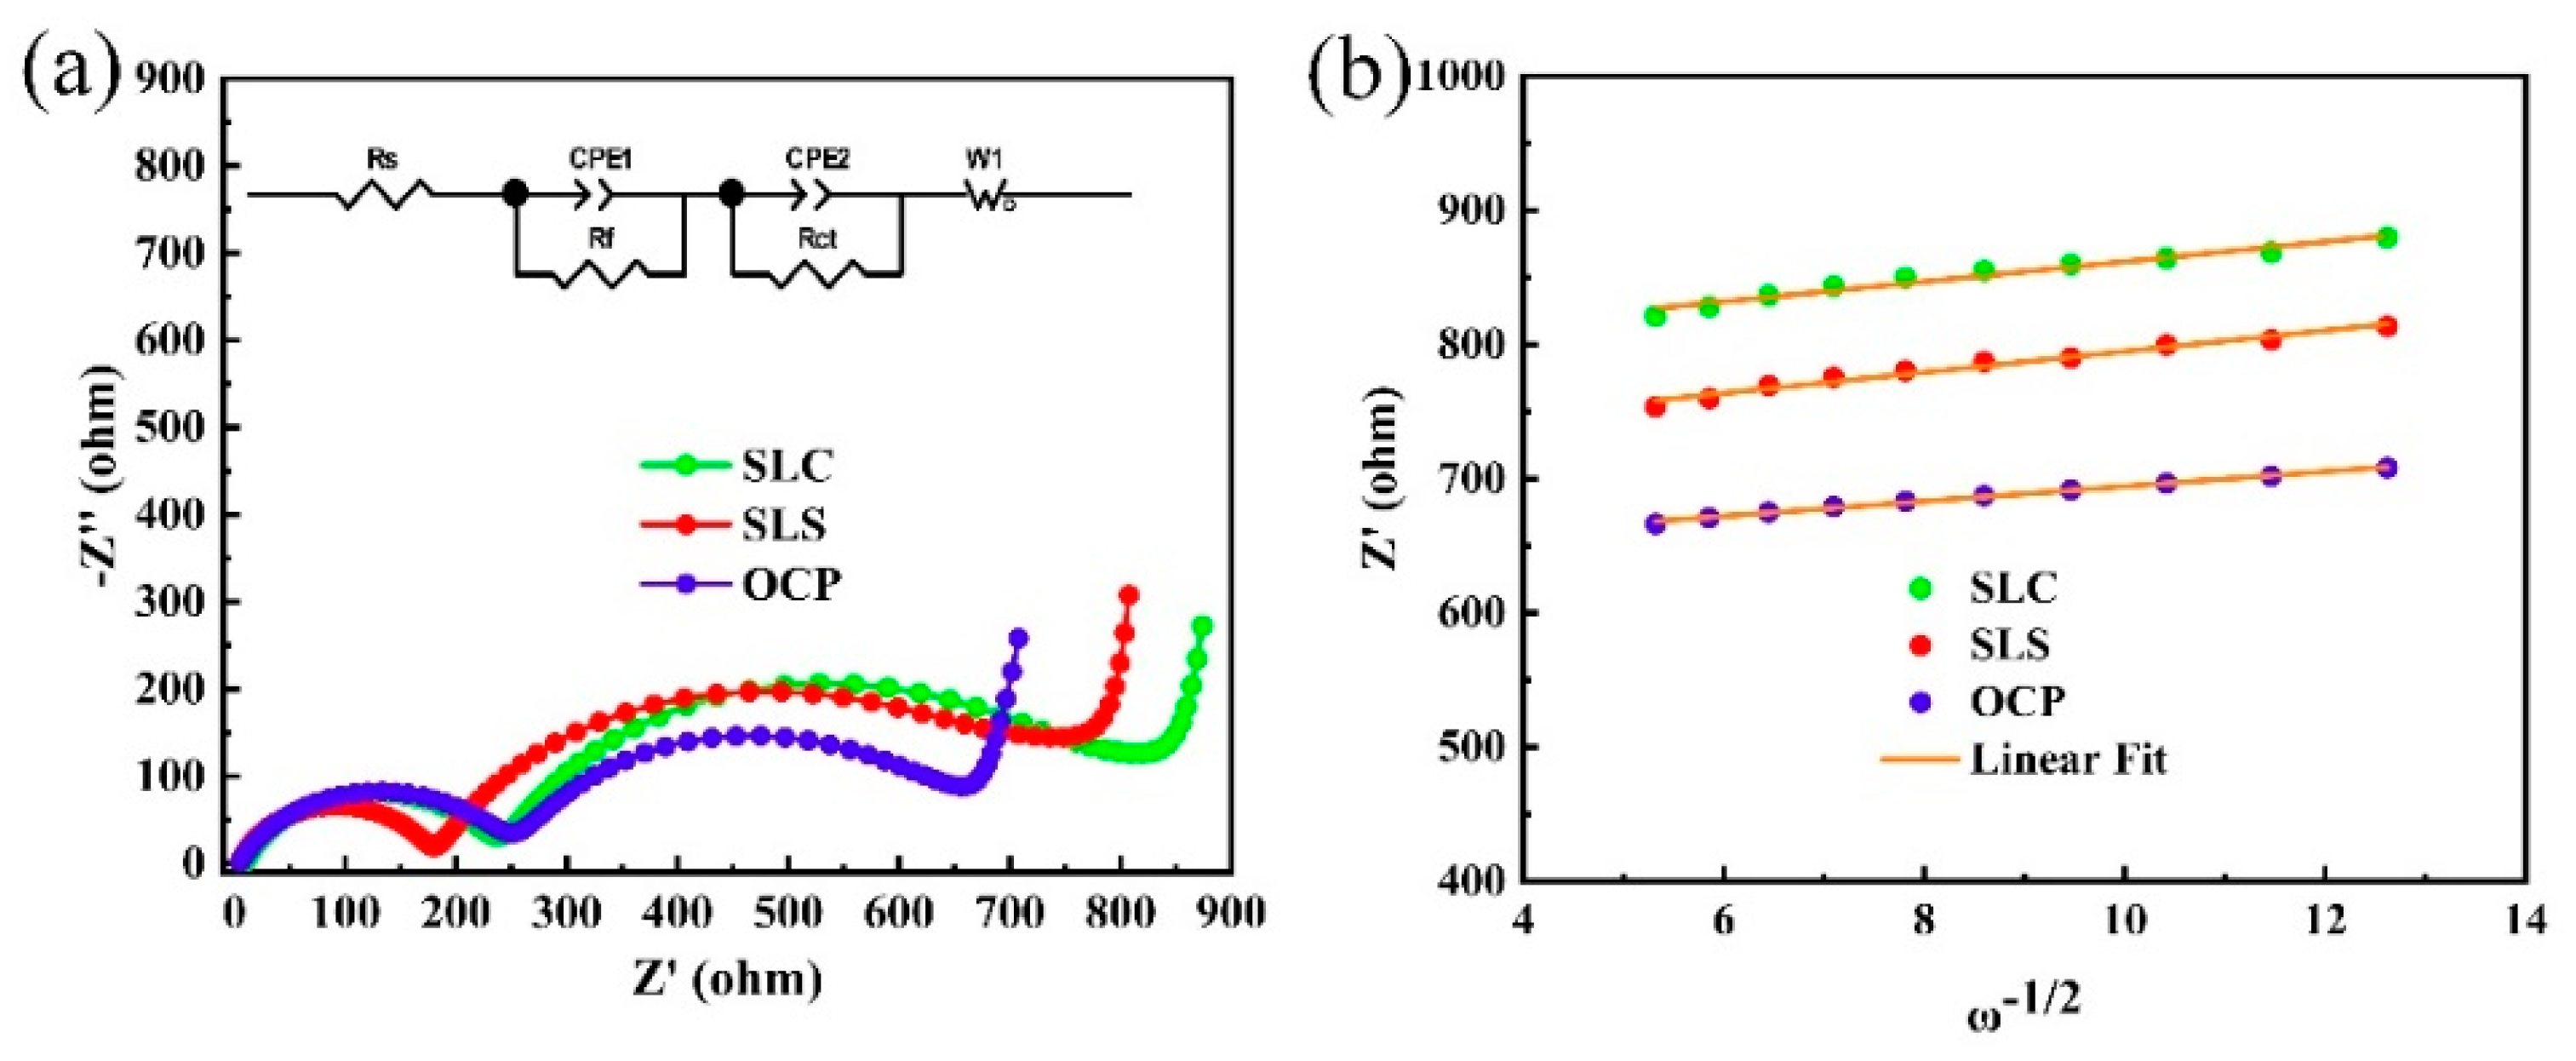
| Sample | Rf (Ω) | Rct (Ω) | DLi+ (cm2·s−1) |
|---|---|---|---|
| SLC | 230 | 503 | 2.04 × 10⁻¹³ |
| SLS | 173 | 491 | 1.86 × 10⁻¹³ |
| OCP | 246 | 369 | 3.67 × 10⁻¹³ |
© 2020 by the authors. Licensee MDPI, Basel, Switzerland. This article is an open access article distributed under the terms and conditions of the Creative Commons Attribution (CC BY) license (http://creativecommons.org/licenses/by/4.0/).
Share and Cite
Liu, Q.; Zhu, H.; Liu, J.; Liao, X.; Tang, Z.; Zhou, C.; Yuan, M.; Duan, J.; Li, L.; Chen, Z. High-Performance Lithium-Rich Layered Oxide Material: Effects of Preparation Methods on Microstructure and Electrochemical Properties. Materials 2020, 13, 334. https://doi.org/10.3390/ma13020334
Liu Q, Zhu H, Liu J, Liao X, Tang Z, Zhou C, Yuan M, Duan J, Li L, Chen Z. High-Performance Lithium-Rich Layered Oxide Material: Effects of Preparation Methods on Microstructure and Electrochemical Properties. Materials. 2020; 13(2):334. https://doi.org/10.3390/ma13020334
Chicago/Turabian StyleLiu, Qiming, Huali Zhu, Jun Liu, Xiongwei Liao, Zhuolin Tang, Cankai Zhou, Mengming Yuan, Junfei Duan, Lingjun Li, and Zhaoyong Chen. 2020. "High-Performance Lithium-Rich Layered Oxide Material: Effects of Preparation Methods on Microstructure and Electrochemical Properties" Materials 13, no. 2: 334. https://doi.org/10.3390/ma13020334