Article

The Effect of (Ag, Ni, Zn)-Addition on the Thermoelectric Properties of Copper Aluminate

1
Department of Electrical and Electronic Engineering, Hakodate National College of Technology, 14-1 Tokura, Hakodate, Hokkaido 042-8501, Japan
2
Fuel Cells and Solid State Chemistry Division, Risø National Laboratory for Sustainable Energy, Technical University of Denmark, Roskilde 4000, Denmark
*
Author to whom correspondence should be addressed.
Materials 2010, 3(1), 318-328; https://doi.org/10.3390/ma3010318
Submission received: 21 December 2009 / Revised: 7 January 2010 / Accepted: 8 January 2010 / Published: 11 January 2010
(This article belongs to the Special Issue Novel Thermoelectric Materials and Applications)

Abstract

:
Polycrystalline bulk copper aluminate Cu1-x-yAgxByAlO2 with B = Ni or Zn were prepared by spark plasma sintering and subsequent thermal treatment. The influence of partial substitution of Ag, Ni and Zn for Cu-sites in CuAlO2 on the high temperature thermoelectric properties has been studied. The addition of Ag and Zn was found to enhance the formation of CuAlO2 phase and to increase the electrical conductivity. The addition of Ag or Ag and Ni on the other hand decreases the electrical conductivity. The highest power factor of 1.26 × 10⁻⁴ W/mK2 was obtained for the addition of Ag and Zn at 1,060 K, indicating a significant improvement compared with the non-doped CuAlO2 sample.

1. Introduction

Thermoelectric materials have been widely studied over the past decades owing to their potential application as a thermoelectric convertor of waste heat into electricity [1]. This energy conversion technique has the advantage of being maintenance-free because of the ability to operate without moving parts and/or chemical reactions. However, this technique has not been widely used in industrial applications so far due to the low thermoelectric conversion efficiency. In general, the performance of a thermoelectric material is evaluated by the figure of merit Z or the dimensionless figure of merit ZT, as follows:
Z T = σ S 2 κ T
where σ, S, κ and T are the electrical conductivity, Seebeck coefficient, thermal conductivity and absolute temperature, respectively. To achieve high Z, a large S, a high σ and a small κ are required. However, it is difficult to increase Z because these three parameters are all functions of carrier concentration and are interrelated with each other. There are some approaches to increase figure of merit Z: an optimization of carrier concentration, which varies between 1019 to 1021 carriers per cm3 for common semiconductors [1,2], lowering the thermal conductivity by heavier element substitution [3] and nanostructuring of the materials [4].
Many kinds of materials are currently under investigation, which include Bi2Te3 [5], PbTe [6] based materials, SiGe [7], silicides [8], β-Zn4Sb3 [9], skutterudites [10], half-Heusler alloys [11] and clathrate compounds [12]. In addition, since the first report of NaCo2O4 in 1997 [13], various new oxide materials with good thermoelectric properties such as Ca3Co4O9 system [14], ZnO [15] and SrTiO3 [16] have attracted increasing attention because of their thermal and chemical stability at high temperature in air, low toxicity, low cost and easy manufacture.
Another type of oxide material, copper aluminate (CuAlO2), which is stable at high temperatures up to 1,400 K and possessing a good thermoelectric power, is expected to be another promising material for thermoelectric devices [17,18]. This type of materials has also gained much attention in the field of optoelectronic applications [19,20] due to the fact that the CuAlO2 has a direct band-gap of 3.5 eV [21] and is a transparent conductor. CuAlO2 crystallizes in the rhombohedral, delafossite-type structure (a=2.85670 Å, c=16.9430 Å) [22] and shows p-type semiconductivity [23]. Park et al. have investigated the thermoelectric properties of CuAl1-xCaxO2 (0 ≤ x ≤ 0.2) [24] and found that the substitution of Ca for Al up to x = 0.1 increases both the electrical conductivity and the Seebeck coefficient. Lately, the effects of Mg or Fe substitution for Al in CuAlO2 were also reported [25,26]. Among these studied elements, the highest value of power factor (1.1 × 10⁻⁴ W/mK) was obtained for the CuAl0.9Fe0.1O2 sample at 1,140 K. Moreover, the calculation of the electronic structure of Ni or Zn doped CuAlO2 using a full potential linear augmented plane-wave method, reported by Lalic et al., showed that Ni and Zn substituted for Cu-sites act as acceptor and donor impurities, respectively [27]. As for delaffosite-type of materials, the effect of Ag substitution for Cu-sites in CuRhO2 has been investigated [28]. However, to our knowledge, the effect of element substitution for Cu-sites in CuAlO2 has not been reported to date.
In this study, we focus on the substitution of Ag, Ni and Zn to Cu-sites in CuAlO2 and systematically investigate their effects on the high temperature thermoelectric properties of these compounds.

2. Experimental

2.1. Preparation of samples

A series of samples with the composition Cu1-x-yAgxByAlO2 with B = Ni or Zn was prepared by the solid-state reaction method. Highly pure powders of CuO, Al2O3, NiO, ZnO (Sigma-Aldrich, Inc., 99.99%) and Ag2O (Sigma-Aldrich, Inc., 99%) were sufficiently mixed and ground in an Al2O3 mortar by using an automatic mill. The nominal compositions of samples are expressed as follows: CuAlO2, Cu0.98Ag0.02AlO2, Cu0.979Ag0.02Ni0.001AlO2 and Cu0.979Ag0.02Zn0.001AlO2. The doping level of 0.1% for Ni and Zn was chosen to generate about 2.5 × 10¹⁹ carriers per cm3 for an optimization of carrier concentration. The mixtures were placed into a graphite die with an inner diameter of 15 mm and then sintered in a spark plasma sintering (SPS) machine (Sumitomo Coal Mining Co.) at 1,123 K for 20 min under uniaxial pressure of 30 MPa in vacuum. After the SPS process, the samples were annealed at 1,373 K for 24 h in flowing air. The samples were cut into rectangular bars with the approximate dimension of 2 × 3 × 10 mm3 for measurements of the electrical conductivity and Seebeck coefficient. For thermal conductivity measurements, the samples were cut into a shape of 10 × 10 × 2 mm3.

2.2. Characterization

The crystalline structures of the samples were analyzed by X-ray diffraction (XRD) on a STOE diffractometer with Cu-Kα radiation. Microstructures of the samples were observed by scanning electron microscopy (SEM) with a Hitachi TM-1000 system. The electrical conductivity and Seebeck coefficient were simultaneously measured using an ULVAC-RIKO ZEM-3 thermoelectric property measurement system under a low-pressure helium atmosphere. The thermal conductivity was determined from thermal diffusivity and specific heat measured using a Netzsch LFA-457 laser flash apparatus in a N2 atmosphere.

3. Results and Discussion

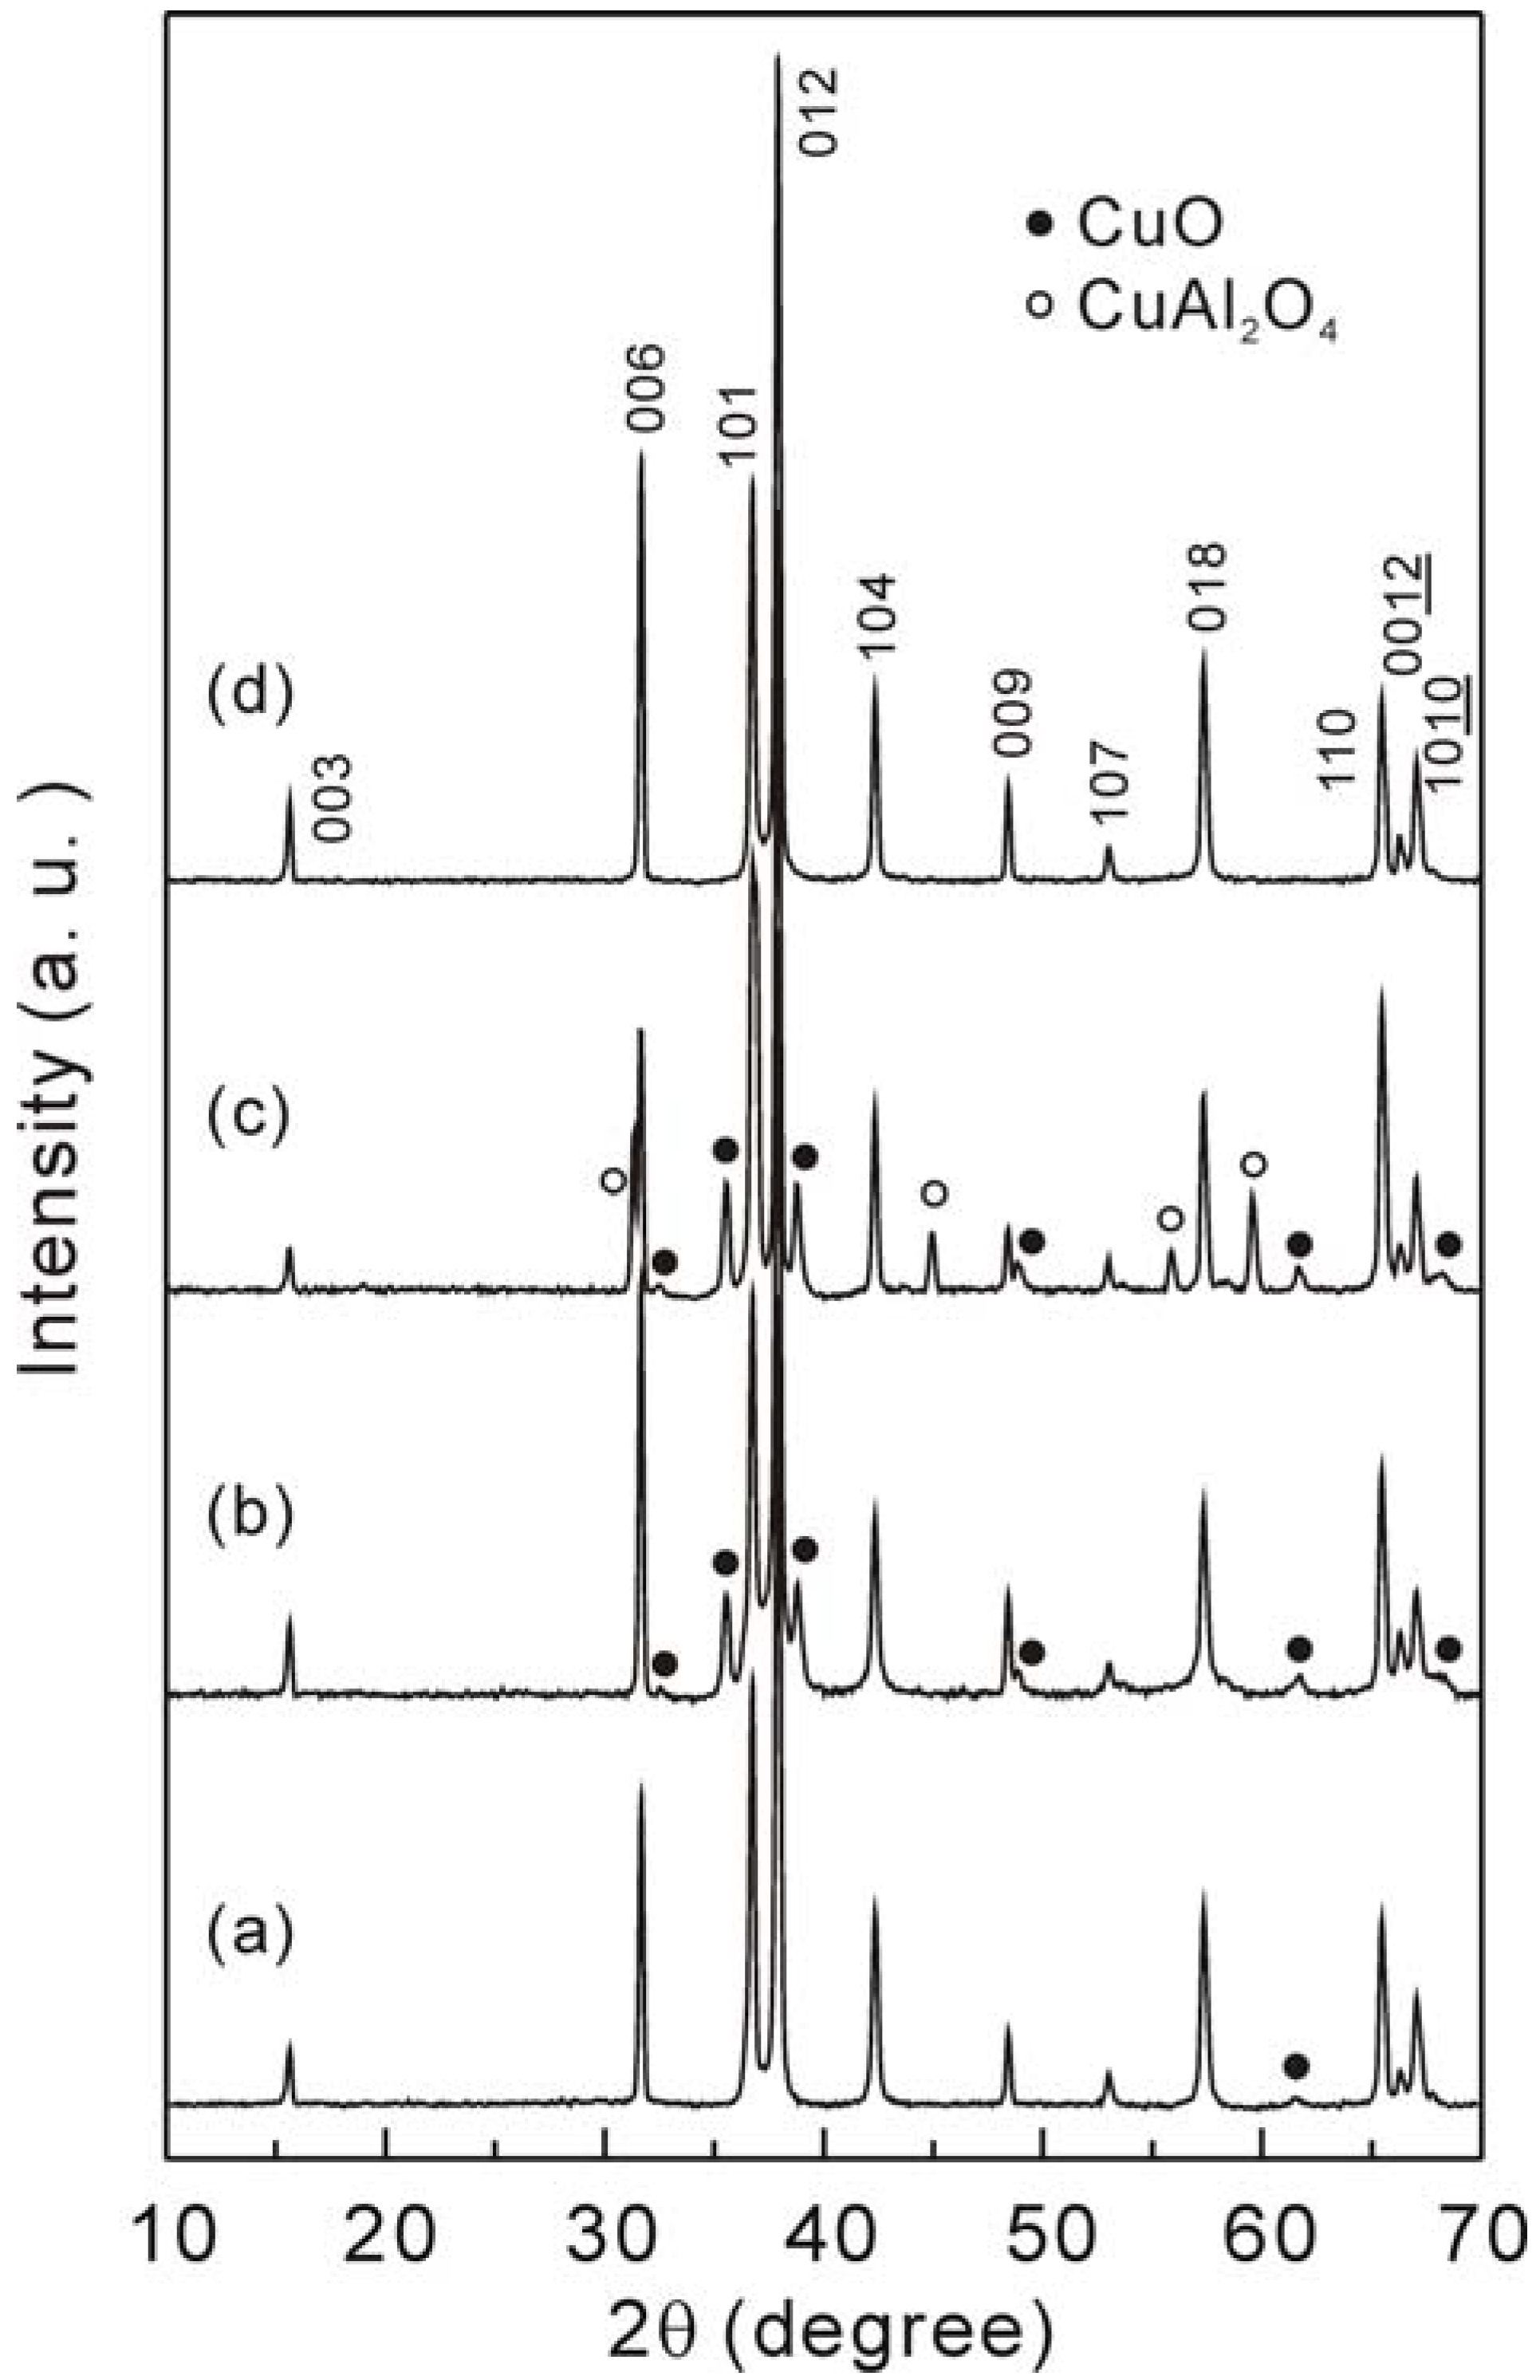
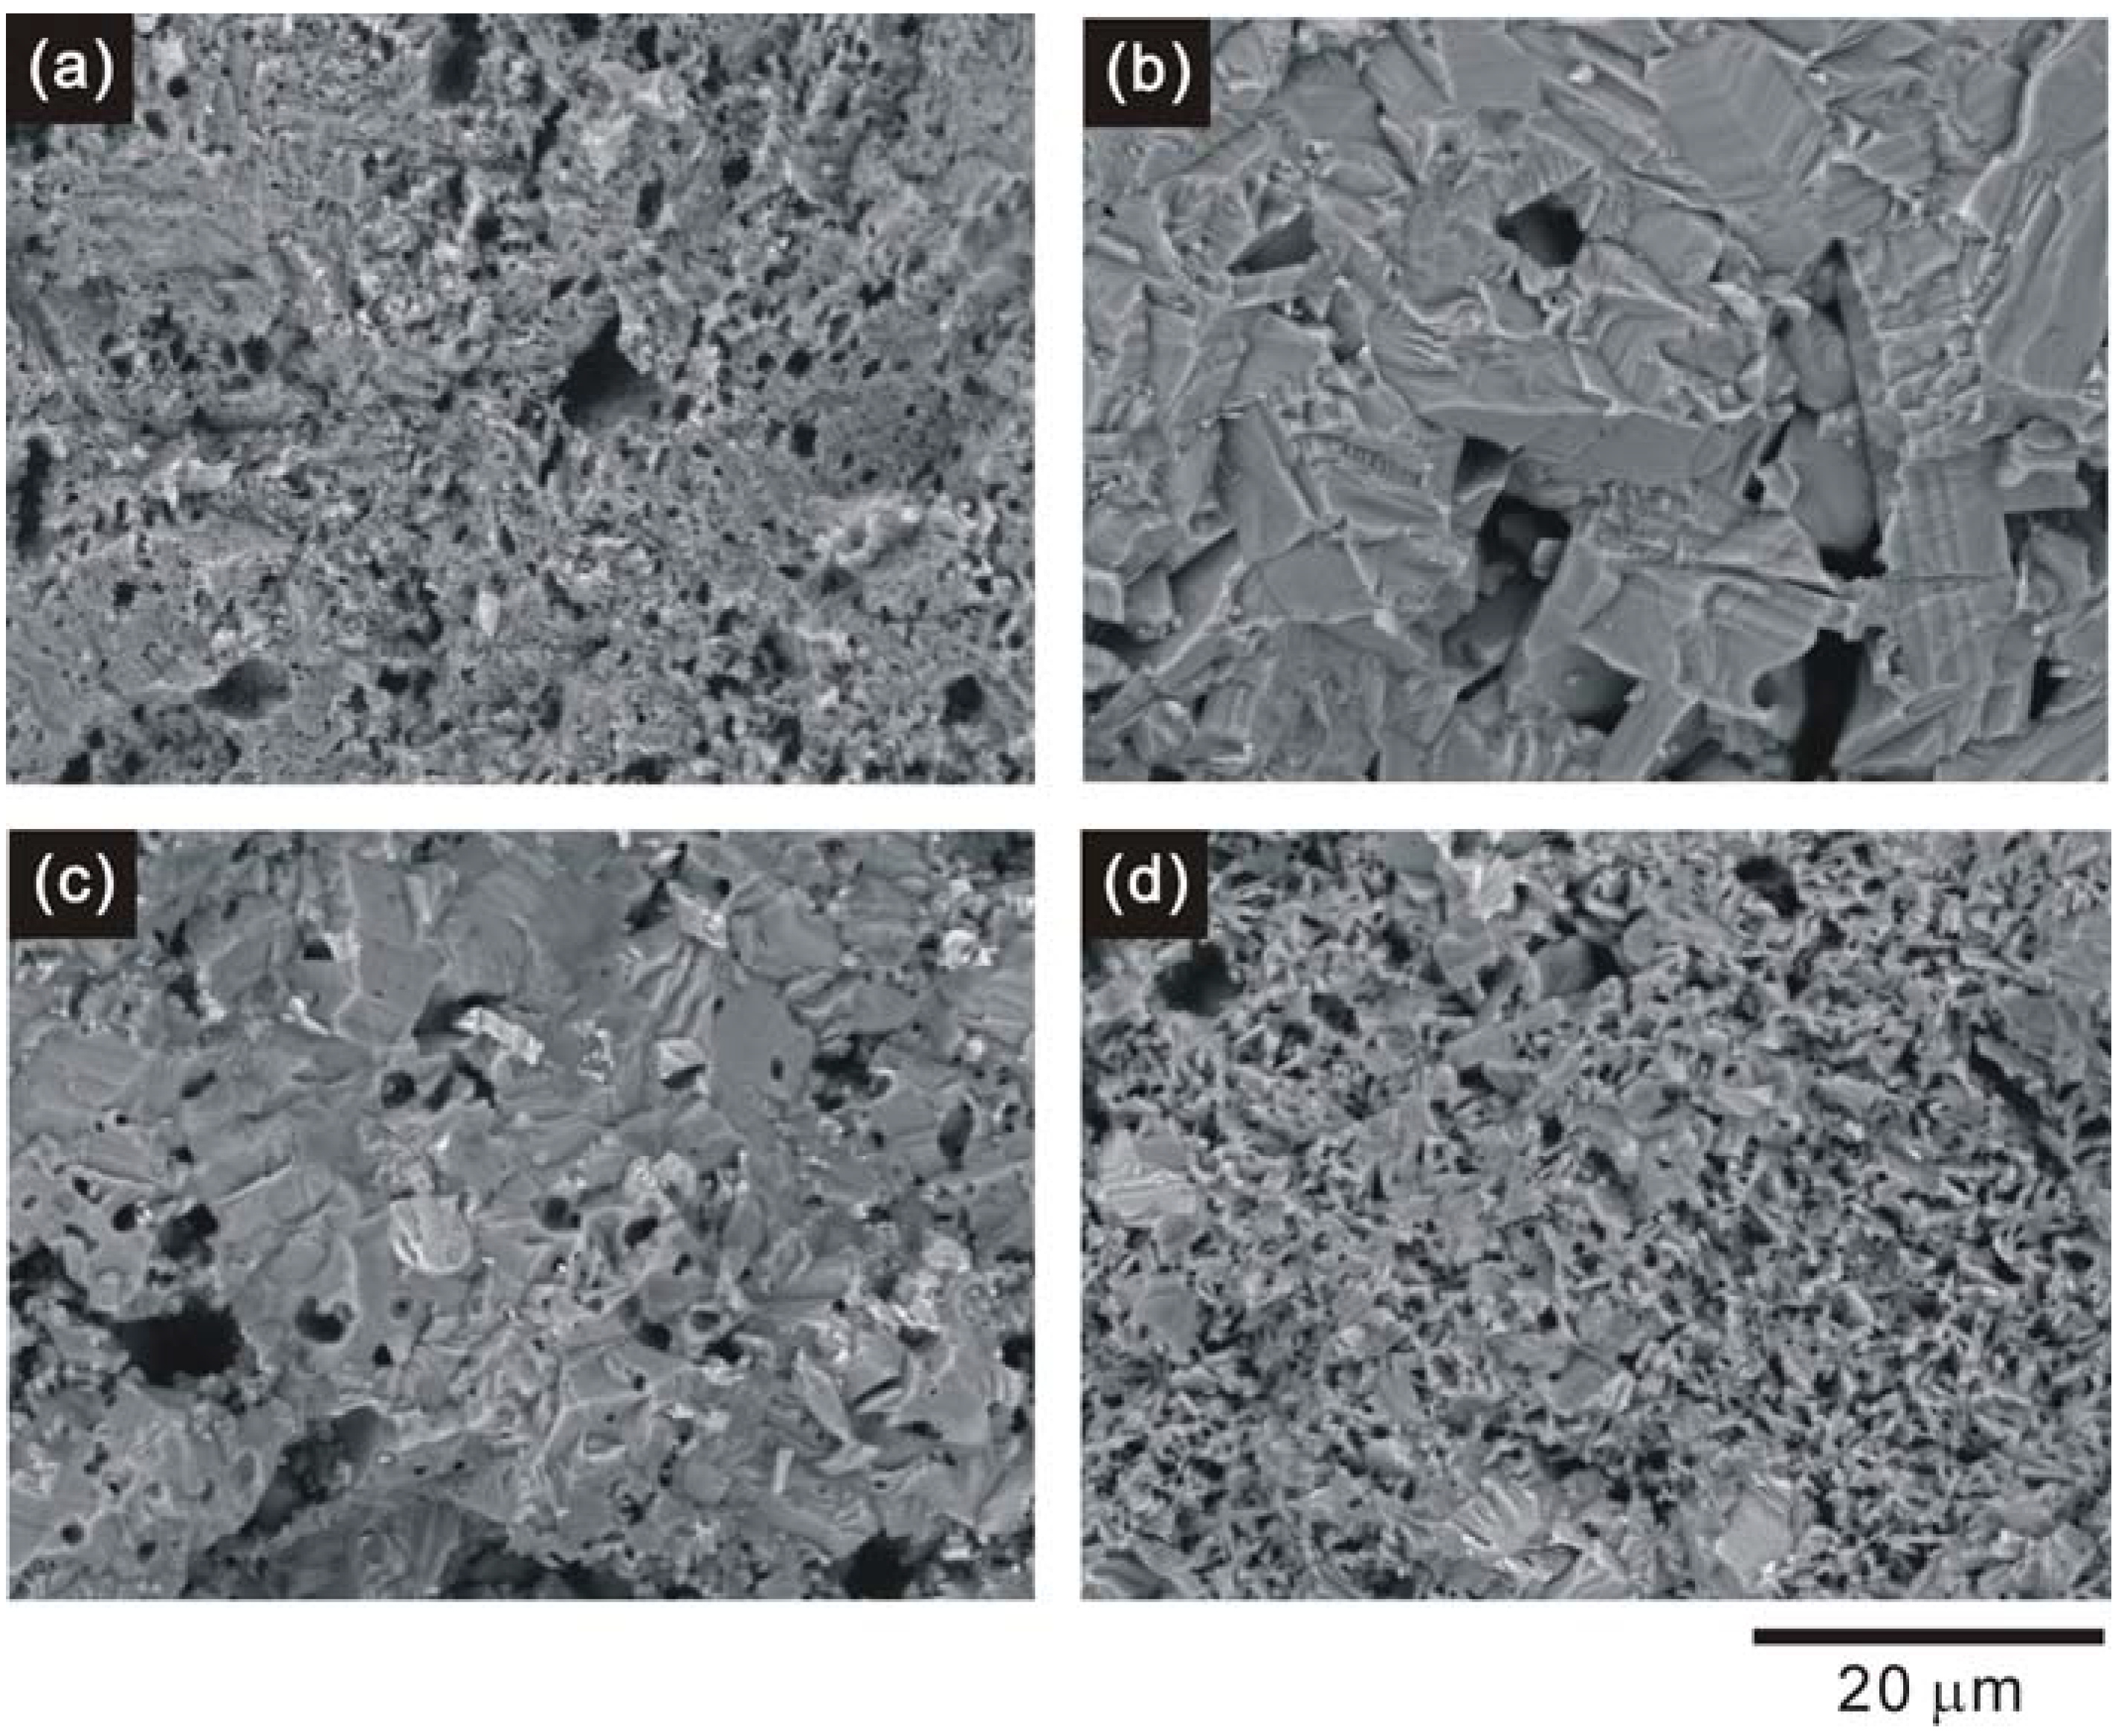
3.1. Crystal structure and microstructure

Figure 1 shows the powder XRD patterns of the samples. For the non-doped CuAlO2, all the diffraction peaks can be indexed as the rhombohedral, delafossite-type structure (standard ICDD-PDF 35-1401) except for a very small peak which belongs to the CuO phase at a scattering angle of 61.5°. With the addition of Ag, besides the primary phase of CuAlO2, a secondary phase of CuO (a = 4.662 Å, b = 3.416 Å, c = 5.118 Å, β = 99.49°, ICDD-PDF: 065-2309) with a monoclinic structure was detected. As for the Cu0.979Ag0.02Ni0.001AlO2, two secondary phases of CuO and CuAl2O4 (a = 8.0790 Å, ICDD-PDF: 078-1605) with a cubic structure were observed. In the case of the Cu0.979Ag0.02Zn0.001AlO2, the sample is found to be a single-phase of CuAlO2 without any other secondary peaks. In all the samples, no peaks belonging to the Ag were observed, indicating a complete solubility of the Ag. The chemical reaction process of CuAlO2 from the CuO and the Al2O3 is expressed by following reactions:
(1)
CuO + Al2O3 → CuAl2O4, and
(2)
CuAl2O4 + CuO → 2CuAlO2 + 1/2O2↑.
Therefore, it appears that the addition of Ag which has a larger ionic radius (Ag+: 0.67 Å) than the Cu (Cu+: 0.46 Å) [29] seems to prevent the formation of only the CuAlO2 phase. As indicated by the results that the formation of the CuAlO2 phase is hindered by the addition of Ag and Ni. However, the addition of Ag and Zn seems to facilitate the abovementioned reactions (1) and (2).
Figure 1. Powder XRD patterns of the samples: (a) CuAlO2, (b) Cu0.98Ag0.02AlO2, (c) Cu0.979Ag0.02Ni0.001AlO2 and (d) Cu0.979Ag0.02Zn0.001AlO2 samples.
Materials 03 00318 g001
Figure 2 illustrates the SEM images of the fractured surface of the samples. It can be seen from Figure 2 (a) and Figure 2 (b) that the addition of Ag strongly enhances the grain growth, although a few large pores could be observed. With the addition of Ni or Zn, the microstructures tend to be deteriorated due to the reduction of the grain size, as clearly shown in Figure 2 (c) and Figure 2 (d). Even so, the grain size of the Cu0.979Ag0.02Zn0.001AlO2 sample is still larger than that of the non-doped CuAlO2 sample.

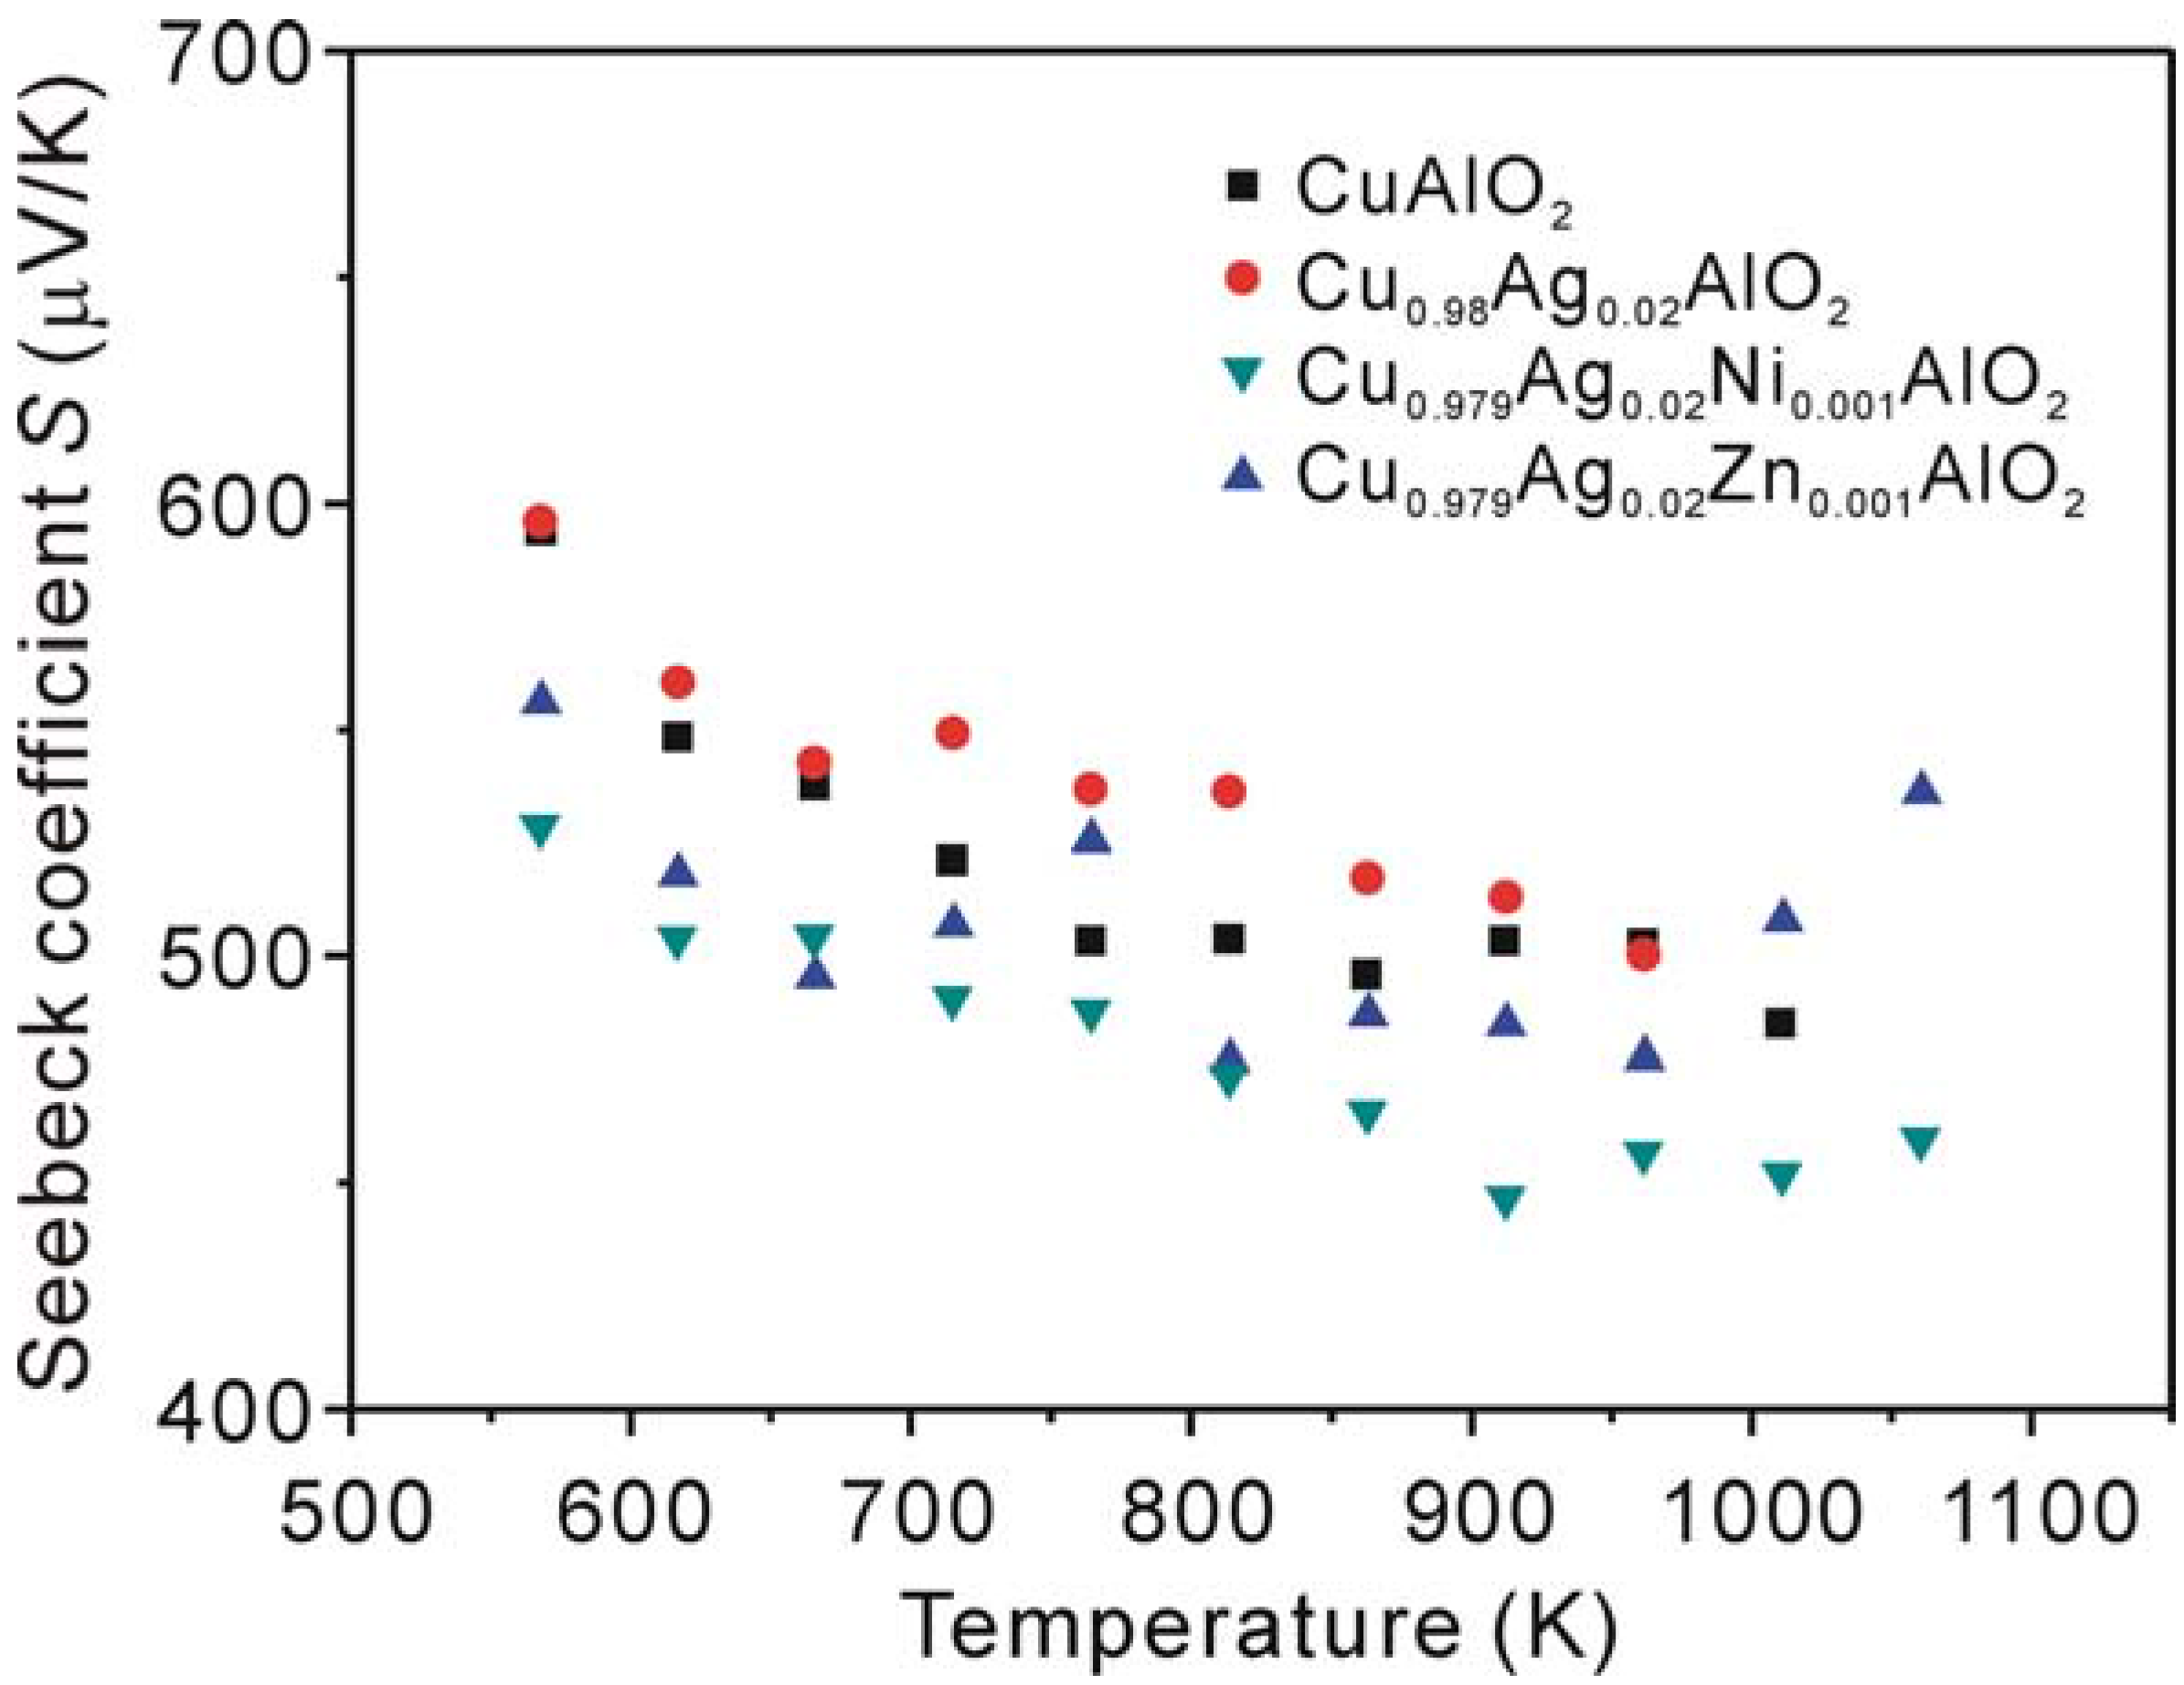
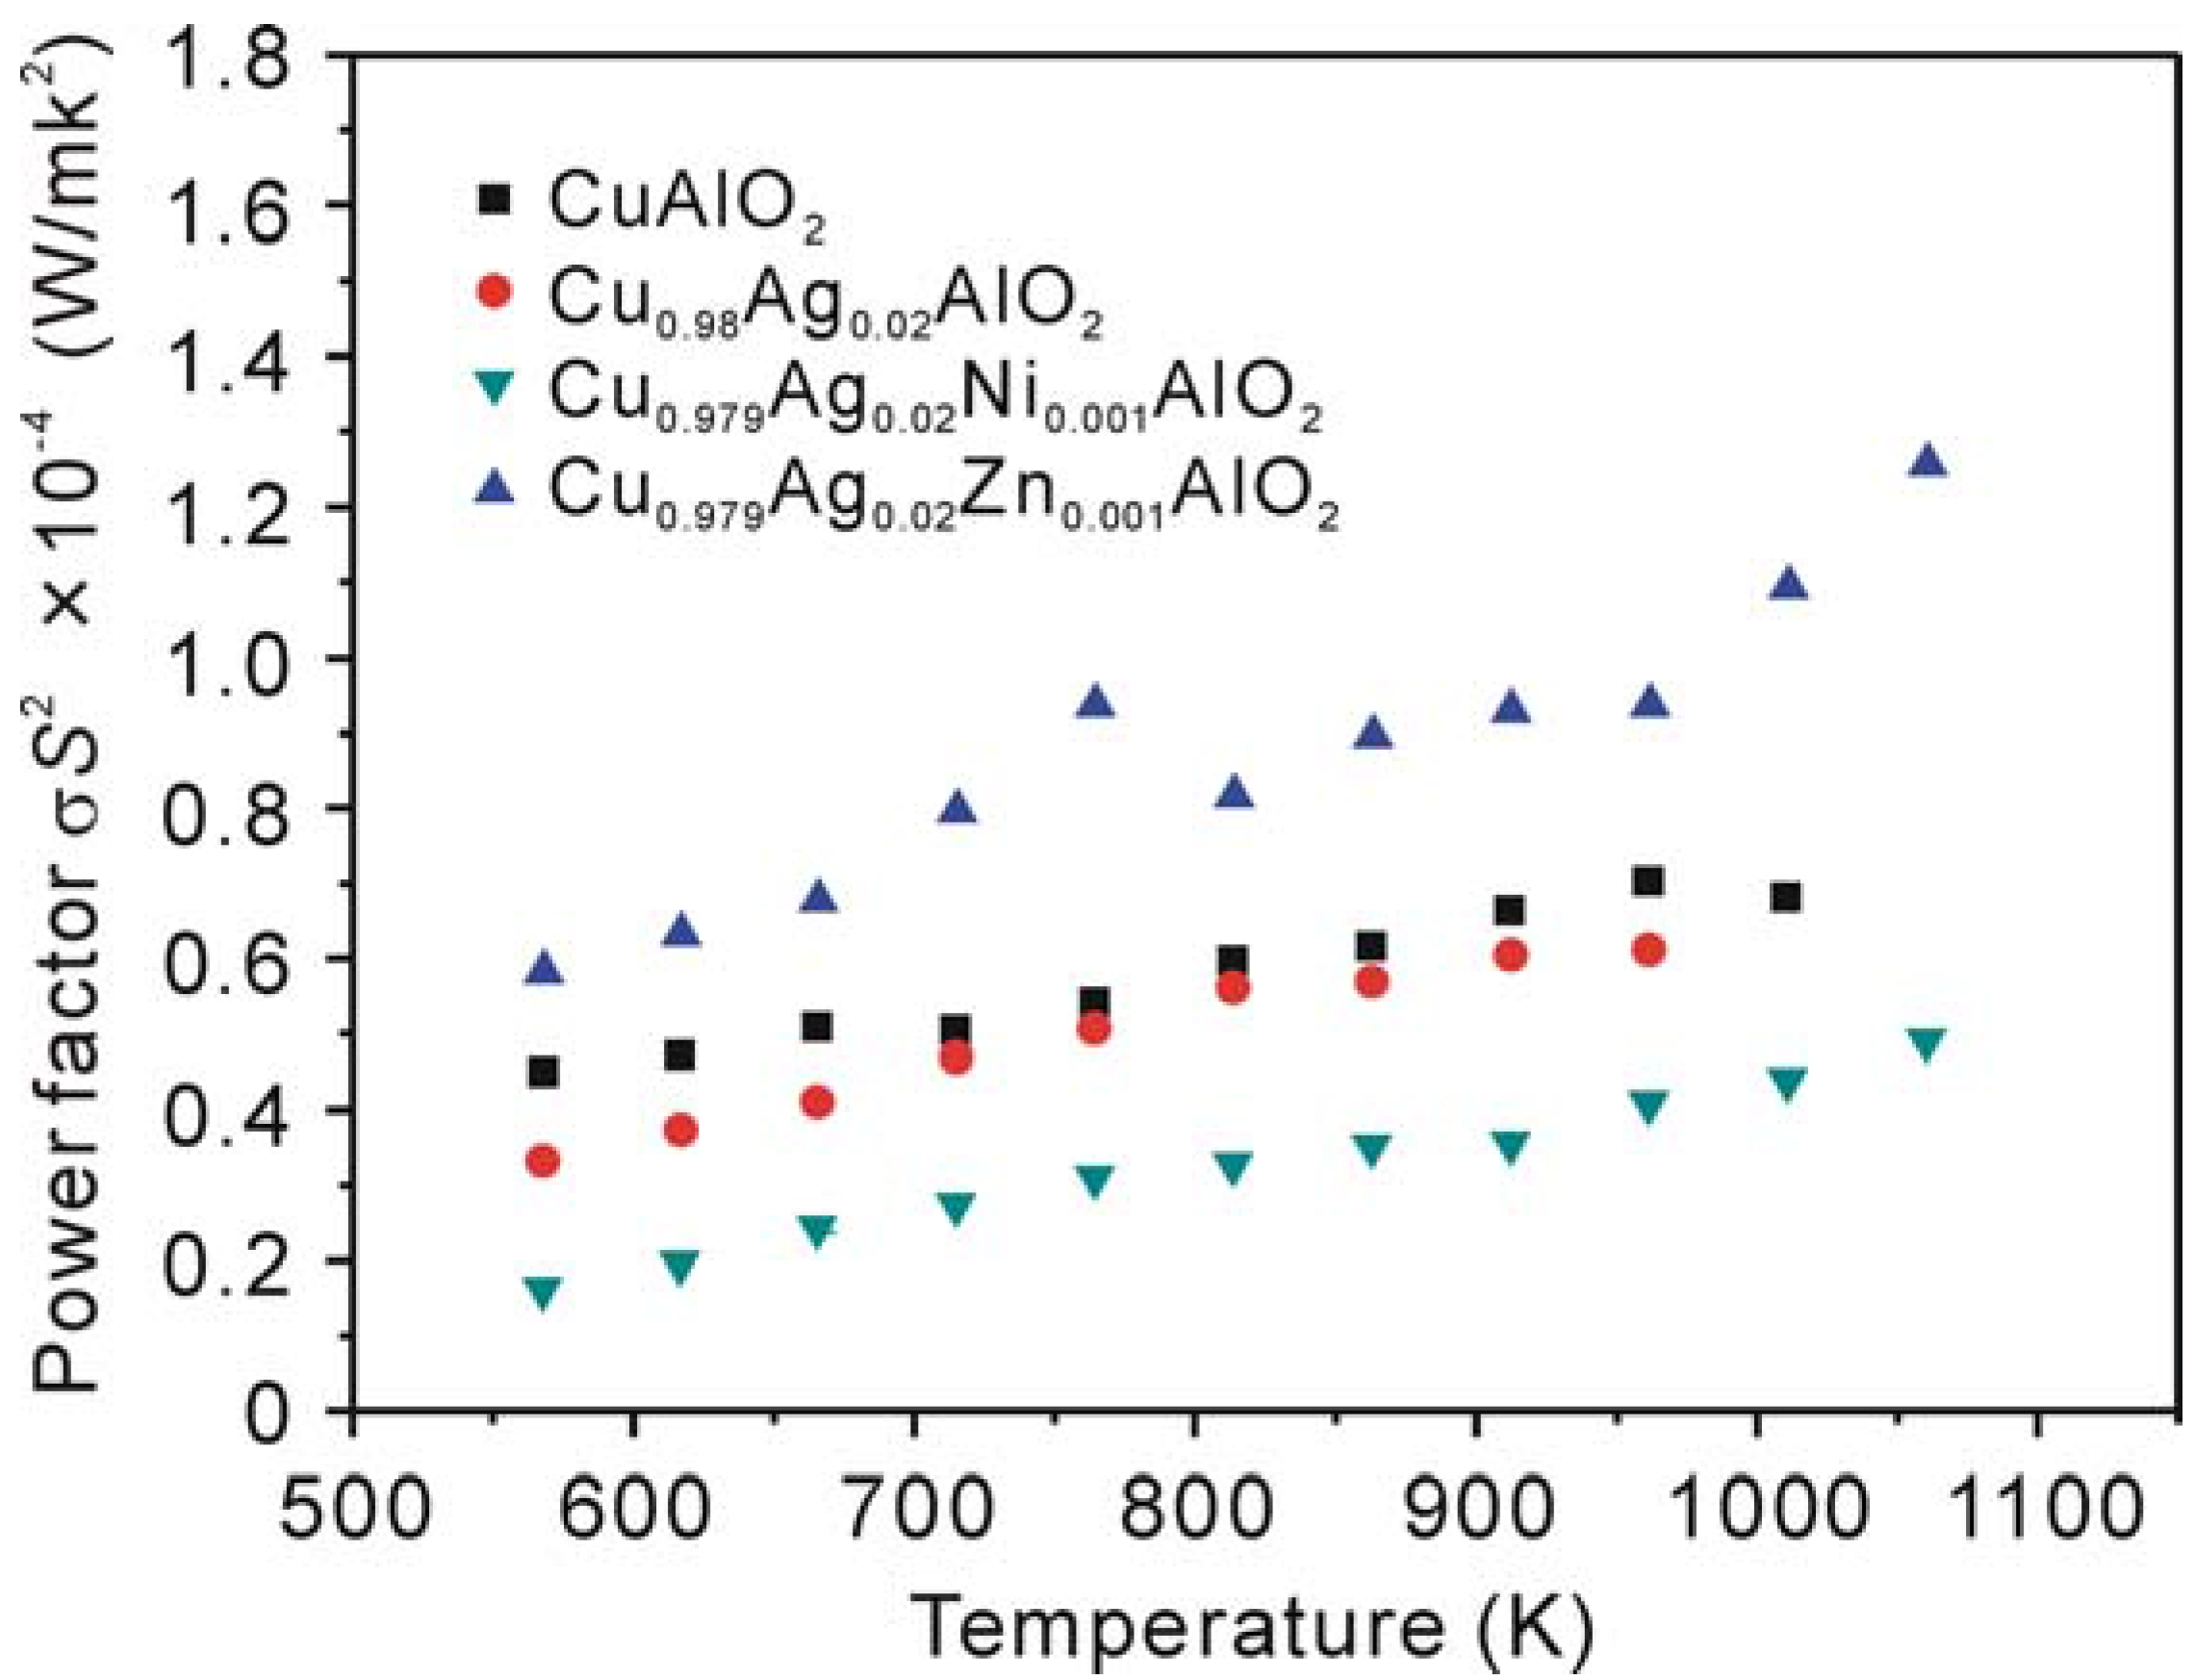
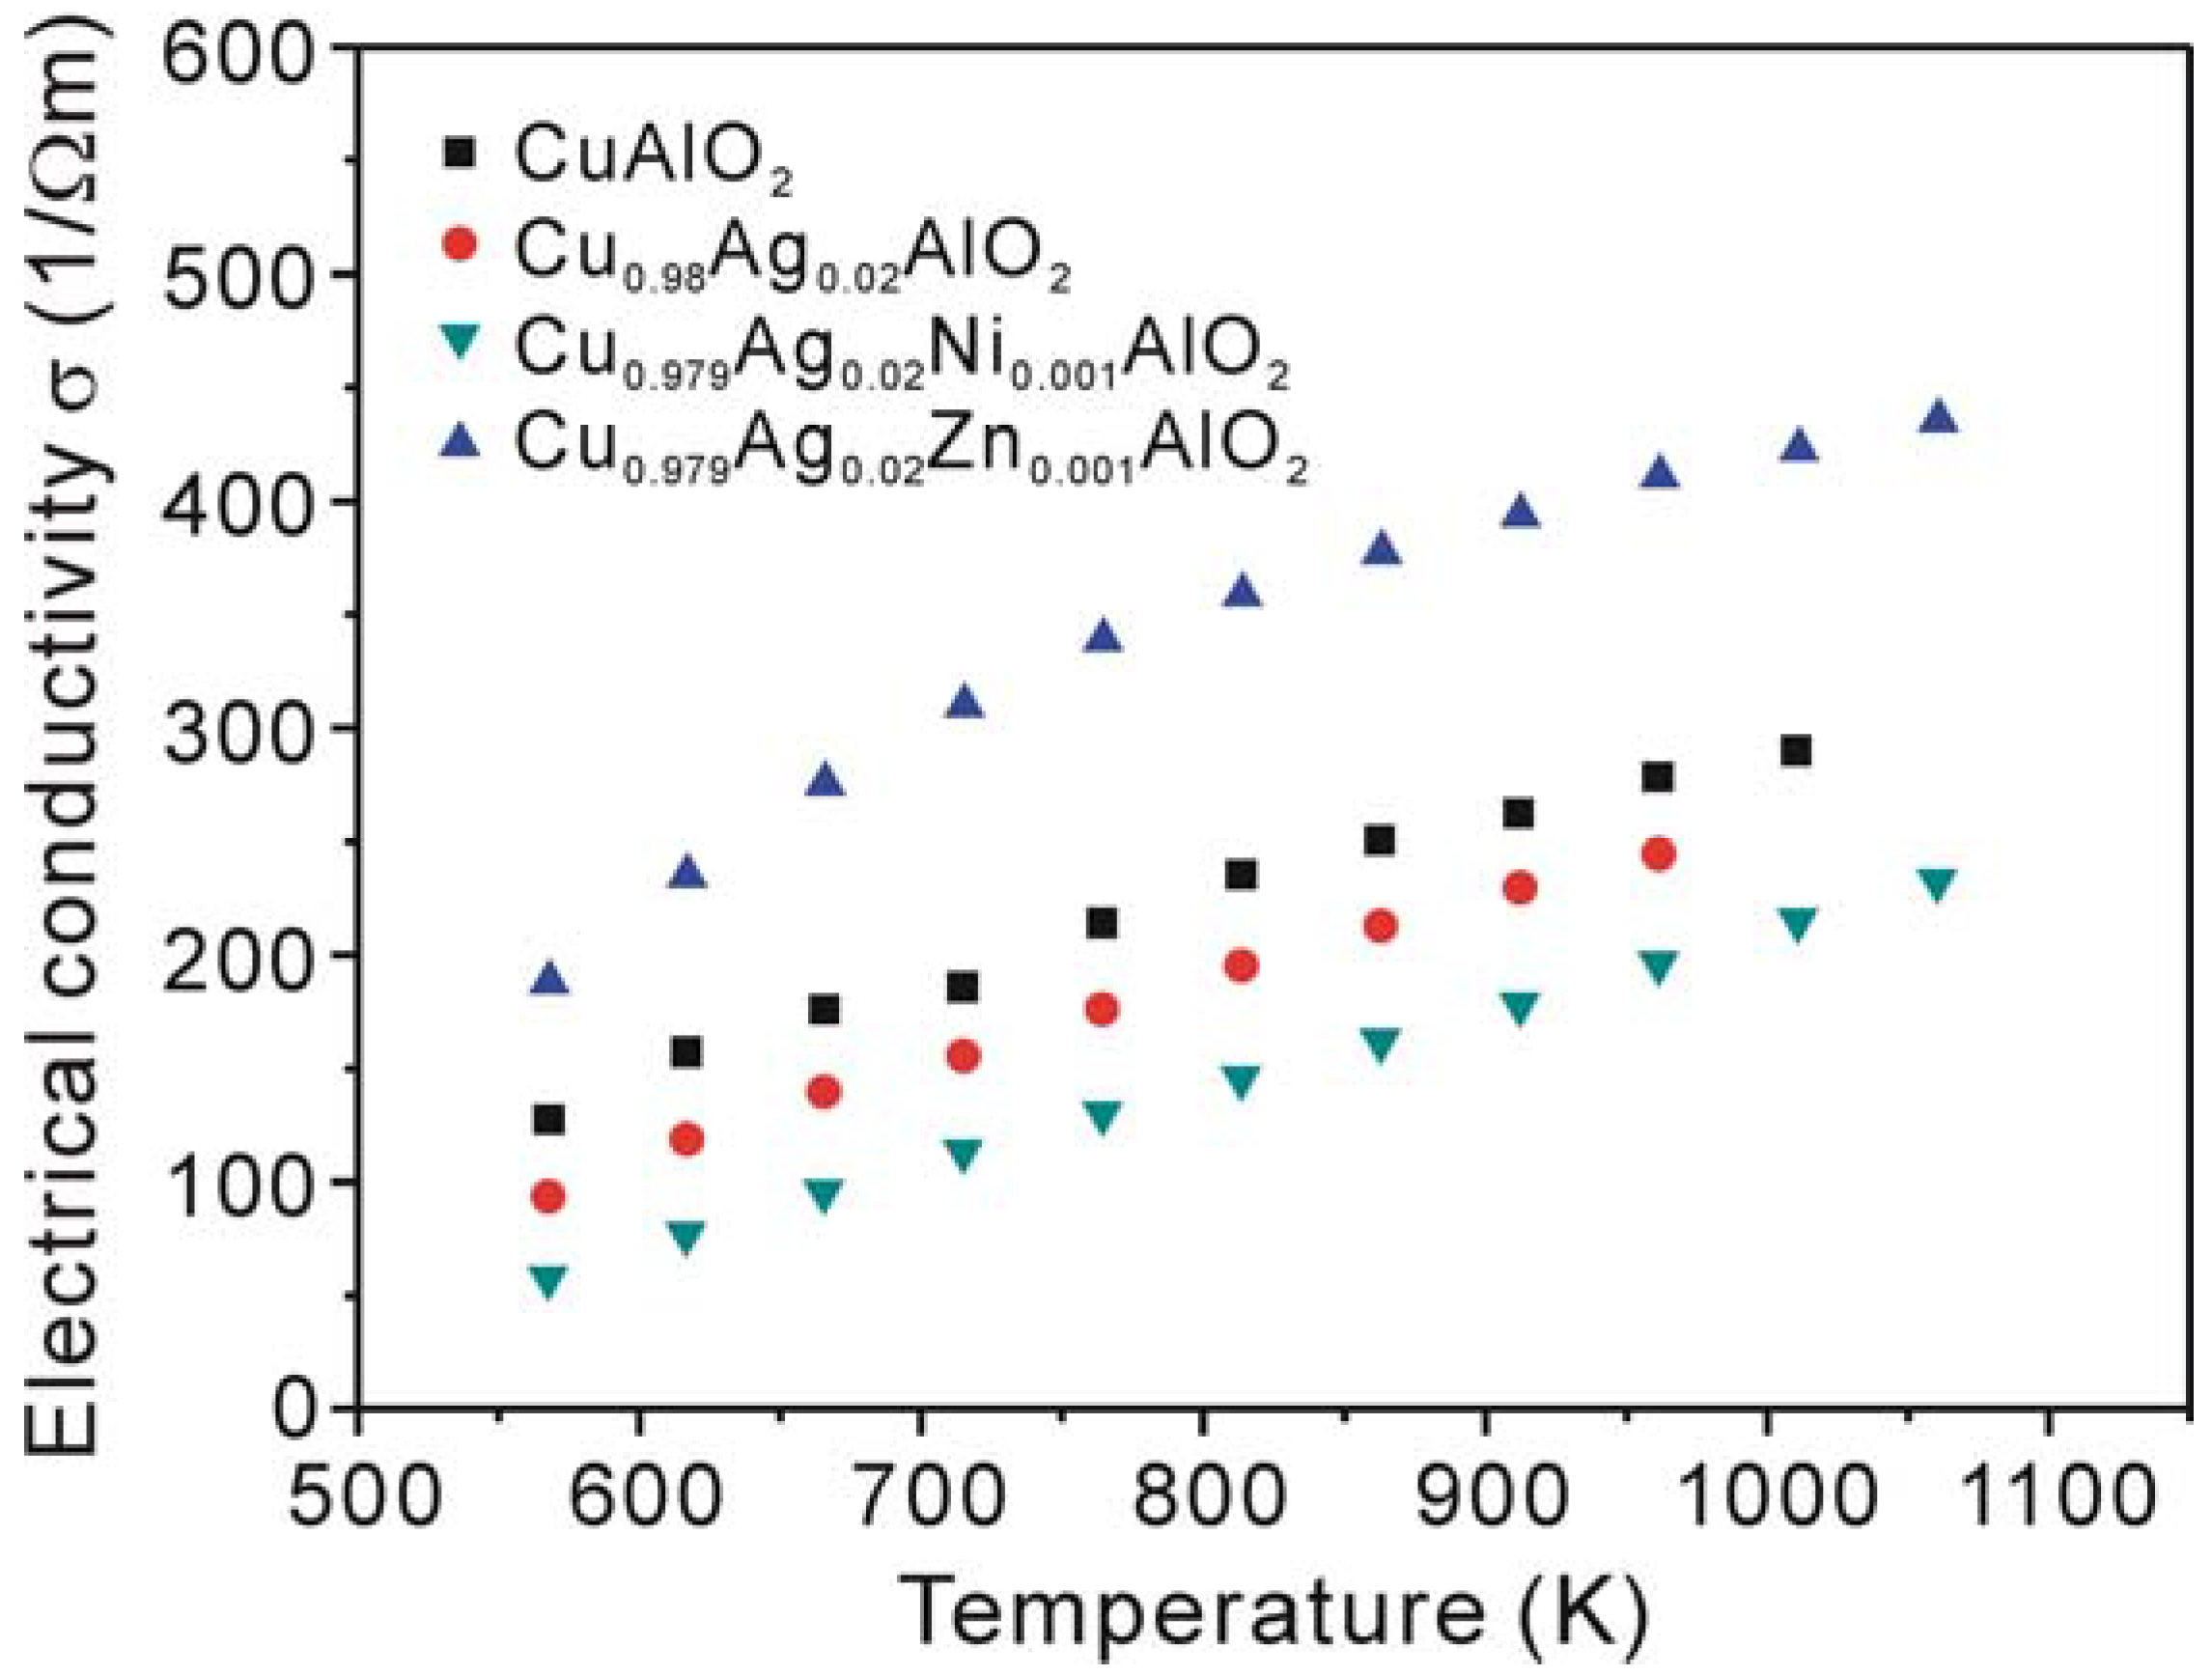
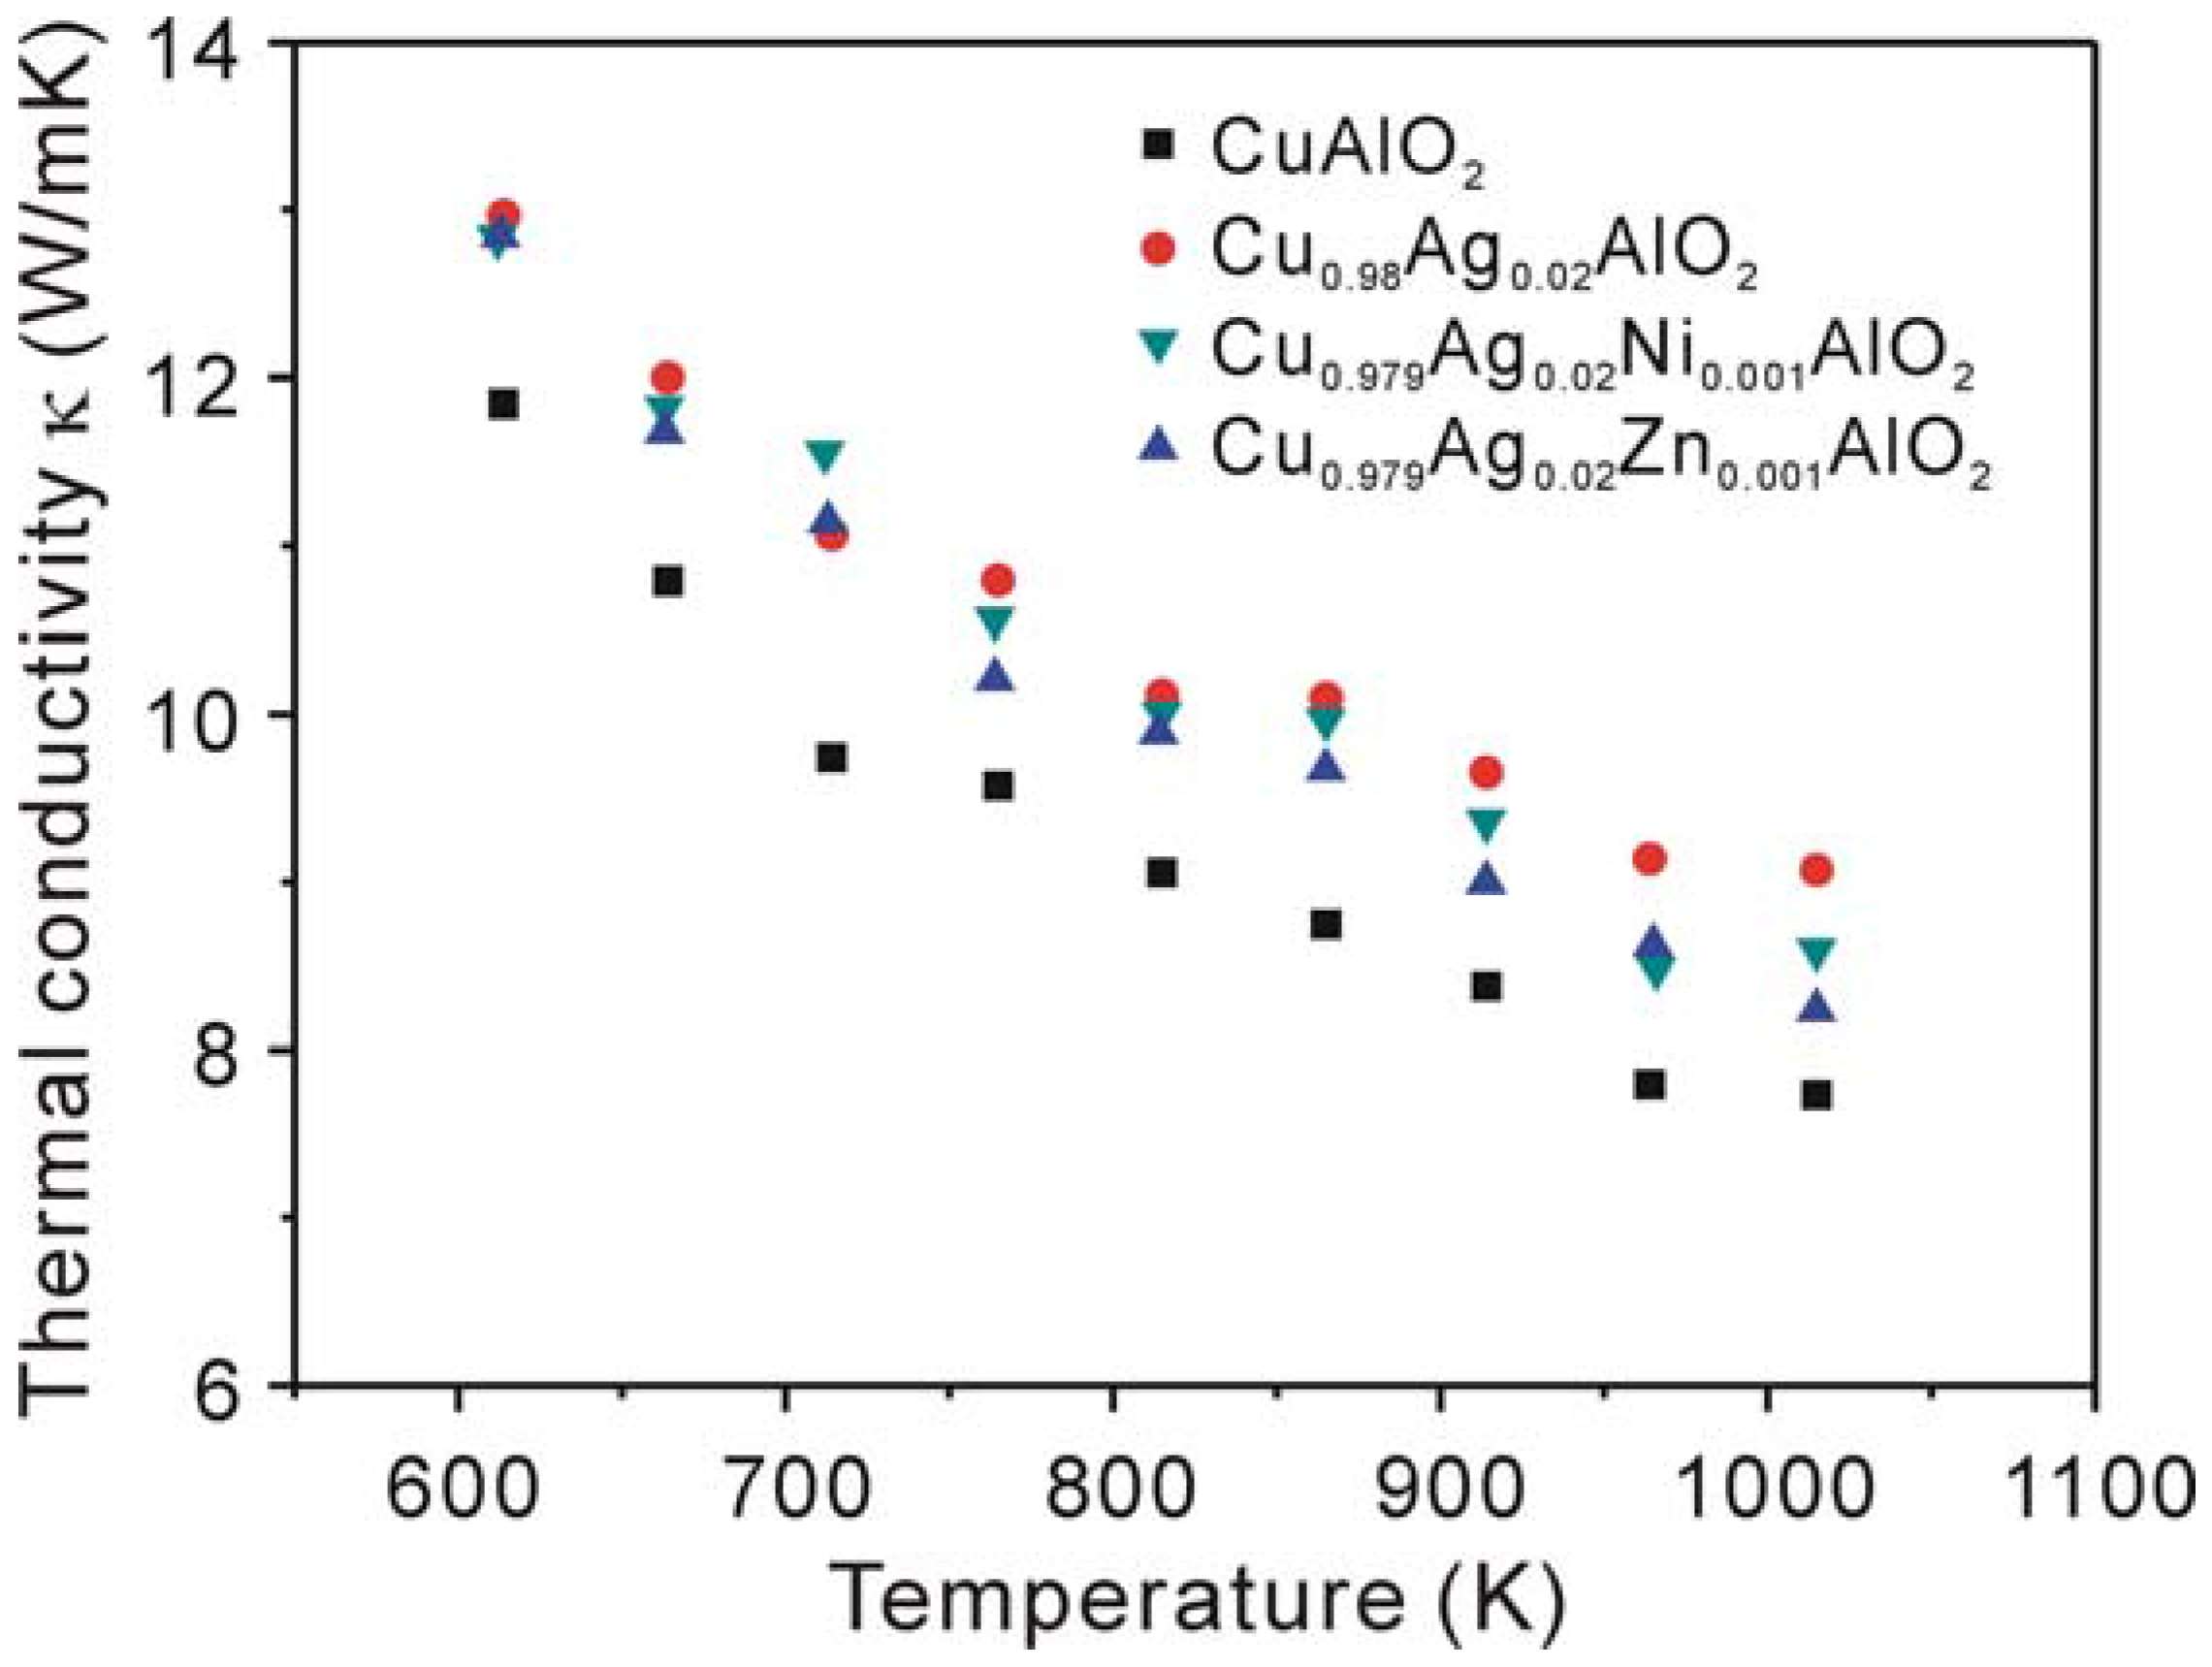
3.2. Thermoelectric properties

The temperature dependence of the electrical conductivity (σ) is shown in Figure 3. The σ value of the non-doped CuAlO2 sample increases with increasing temperature over the measured temperature range, indicating a semiconducting behavior. Hamada et al. calculated the formation energy of the native defects in CuAlO2 using ab initio total energy calculation and concluded that copper vacancies are relevant to the p-type conductivity in CuAlO2 [30]. Also, excess oxygen contributions to hole generation in CuAlO2 were demonstrated by Ingram et al. [31] in the measurement of the electrical conductivity by controlling the oxygen partial pressure at a constant temperature of 800 °C. The observed result revealed that the semiconducting property is due to the carriers induced by off-stoichiometry.
Figure 2. The SEM images of the fractured surface of (a) CuAlO2, (b) Cu0.98Ag0.02AlO2, (c) Cu0.979Ag0.02Ni0.001AlO2 and (d) Cu0.979Ag0.02Zn0.001AlO2 samples.
Materials 03 00318 g002
Figure 3. Temperature dependence of the electrical conductivity σ of CuAlO2, Cu0.98Ag0.02AlO2, Cu0.979Ag0.02Ni0.001AlO2 and Cu0.979Ag0.02Zn0.001AlO2 samples.
Materials 03 00318 g003
The addition of Ag and Ni to the Cu-sites in CuAlO2 was found to decrease the electrical conductivity compared to that of the non-doped CuAlO2 sample. This is attributed to the low electrical conductivity of the secondary phases, i.e. CuO and CuAl2O4 which form in these samples. Moreover, the substitution of Ni for Cu will decrease the hole concentration, that is Ni2+ substituted for Cu+ will act as a donor impurity contrary to the result in Ref. [27]. A similar effect of Ni substitution on the electrical conductivity was reported by Wongcharoen et al. for the Ni-doped CuAlO2 polycrystalline bulk samples [32]. It is interesting to see from Figure 3 that the addition of Ag and Zn resulted in an increase in the electrical conductivity. Generally, the substitution of Zn2+ for Cu+ ions in CuAlO2 produces electrons, leading to a decrease in the hole concentration of the p-type CuAlO2, and thereby decreasing the electrical conductivity. However, this is not consistent with the observed results in this study. One possible reason for this inconsistency may be that the Zn2+ ion substituted not for the Cu+ ion but for the Al3+ ion, which can generate both holes and Cu vacancies, both contribute to the increase in the electrical conductivity.
Figure 4 shows the Seebeck coefficient (S) of the samples as a function of temperature. The sign of the Seebeck coefficient is positive over the measured temperature range. These results confirm that holes are the majority carriers in these samples. The Seebeck coefficient of the samples tends to decrease with increasing temperature below 900 K, except for the Cu0.979Ag0.02Zn0.001AlO2 sample, which shows a clear trend of increasing the Seebeck coefficient above 900 K. Ingram et al. has previously reported that a small polaron hopping behavior occurring in CuAlO2 [33] in the temperature range from 950 to 1,020 K, indicating that the number of carriers is constant in this range of temperature. However, our results showed that the Seebeck coefficient of these samples is dependent on temperature, suggesting that the carrier concentration is also temperature-dependent. Therefore, the electrical conduction of these samples in the temperature range from 573 to 1,060 K cannot be explained by the small polaron hopping conduction.
Figure 4. Temperature dependence of the Seebeck coefficient S of CuAlO2, Cu0.98Ag0.02AlO2, Cu0.979Ag0.02Ni0.001AlO2 and Cu0.979Ag0.02Zn0.001AlO2 samples.
Materials 03 00318 g004
For semiconductor materials, Seebeck coefficient generally decreases with increasing carrier concentration, leading to the increase of electrical conductivity [34]. The increase in the Seebeck coefficient of the Cu0.98Ag0.02AlO2 sample is presumably related to the decrease in the carrier concentration. However, the Seebeck coefficient of the Cu0.979Ag0.02Ni0.001AlO2 sample, which has the lowest electrical conductivity, also shows the lowest value of S. This could be caused by the formation of the secondary phases. These results are consistent with the report in Ref. [32] for the CuAl1-xNixO2 (x = 0.05, 0.10) samples.
It is quite interesting that the Cu0.979Ag0.02Zn0.001AlO2 sample shows a higher value not only of the electrical conductivity but also of the Seebeck coefficient at temperature above 1,000 K, compared to that of the non-doped sample. Such phenomena cannot be explained by the above mentioned general relationship between σ and S. However, the energy correlated carrier mobility μ(E) may play a crucial role in determining S. According to Ref. [35], the Seebeck coefficient can be expressed by the following formula:
S ( T ) = c e n + π 2 k B 2 T 3 e [ ln μ ( E ) E ] E = E F
where ce = (π 2kB2T/3e)N(E), and n, ce, kB, and N(E) are carrier concentration, specific heat, the Boltzmann constant and density of states, respectively. Although the first term ce/n of the Equation 2 is in inverse to the carrier concentration, the increase of S at high temperature for the Cu0.979Ag0.02Zn0.001AlO2 sample suggests that the second term may play a dominant role. We could assume that addition of Ag and Zn has changed μ(E), and the change of the μ(E) affects the increase of S. However, further investigations such as electronic band calculations and Hall measurements are needed to clarify the effect of the addition of Ag and Zn to the Seebeck coefficient of CuAlO2.
The power factor (σS2) calculated from the measured electrical conductivity (σ) and Seebeck coeffieicent (S) as a function of temperature is shown in Figure 5. The power factor for all samples increases with increasing temperature. The Cu0.979Ag0.02Zn0.001AlO2 sample shows the highest values of power factor over the investigated temperature range and the σS2 value reaches 1.26 × 10⁻⁴ W/mK2 at 1,060 K. To the best our knowledge, this is the highest value among the previously reported values for CuAlO2-related bulk materials.
Figure 6 shows the temperature dependence of the thermal conductivity (κ) of the samples. It is expected that the addition of heavier elements such as Ag to the Cu-sites in CuAlO2 will lead to a lower thermal conductivity than that of the non-doped sample due to the increase of phonon scattering induced by additional elements. However, the observed results showed that the values of the thermal conductivity with the addition of Ag, Ni and Zn are larger compared with the non-doped sample. The κ value is of about 10 % larger for the Cu0.979Ag0.02Zn0.001AlO2 sample than that for the non-doped one. The total thermal conductivity κ consists of the phonon contribution κph and the electronic contribution κe, i.e. κ = κph + κe. The electronic component can be estimated using the Wiedemann-Franz law, κe = L0, where L0 = 2.45 × 10⁻⁸ WΩ/K2 is the Lorenz number and T is absolute temperature. The calculated κe for all samples in this study is only about 0.1% of the total thermal conductivity κ. This suggests that the main contribution to the total thermal conductivity is the phonon part, and the electronic part can be negligible. The reason why the addition of Ag or Ag and Ni results in a larger κ suggests that there might be a contribution of secondary phase of CuO with high thermal conductivity (33 W/mK at RT [36]) to the total thermal conductivity. Moreover, the addition of Ag, Ni and Zn results in samples with larger grain size compared to that of the non-doped sample (see Figure 2). Thus, the observed increase in κ for the Cu0.979Ag0.02Zn0.001AlO2 sample is probably attributed to the increase in the κph due to the reduction of phonon scattering caused by increasing in the grain size.
Figure 5. Temperature dependence of the power factor of CuAlO2, Cu0.98Ag0.02AlO2, Cu0.979Ag0.02Ni0.001AlO2 and Cu0.979Ag0.02Zn0.001AlO2 samples.
Materials 03 00318 g005
Figure 6. Temperature dependence of the thermal conductivity κ for the samples.
Materials 03 00318 g006
The highest dimensionless figure of merit ZT of about 0.016 was obtained for the Cu0.979Ag0.02Zn0.001AlO2 sample at 1,060 K. Although this value is not high enough for practical application, the improvement of thermoelectric performance in this study is significant and important for this system which contains cheep elements. Further investigations using several approaches, e.g., an optimization of carrier concentration and improving the density by applying other sintering procedure, are expected to improve the ZT of CuAlO2.

4. Conclusions

Polycrystalline bulk copper aluminate Cu1-x-yAgxByAlO2 (x = 0, 0.02 and y = 0, 0.001, B = Ni or Zn) were prepared by spark plasma sintering and subsequent thermal treatment. The effect of the addition of Ag, Ni and Zn for Cu-sites on the thermoelectric properties of CuAlO2 was investigated. The results of XRD measurements revealed that the addition of Ag and Zn enhanced the formation of CuAlO2 phase, whereas the addition of Ag and Ni inhibited the reaction between the starting materials of CuO and Al2O3. The addition of Ag and Zn was found to increase the electrical conductivity over the measured temperature range and the Seebeck coefficient above 1,000 K compared to those of the non-doped CuAlO2 sample, while the addition of Ag or Ag and Ni decreased the electrical conductivity. All the doped samples showed a higher thermal conductivity than that of non-doped sample. The power factor was substantially improved by the addition of Ag and Zn. The maximum power factor reaches a value of 1.26 × 10⁻⁴ W/mK2 for Cu0.979Ag0.02Zn0.001AlO2 sample at 1,060 K, enable a ZT value of 0.016 to be reached.

Acknowledgments

The authors thank Yuji Takahashi and Yoshiya Mizushima for their contributions to sample preparation by using SPS and Johannes Steen Bang for sample preparation for thermoelectric measurements.

References

  1. Snyder, G.J.; Toberer, E.S. Complex thermoelectric materials. Nat. Mater. 2008, 7, 105–114. [Google Scholar] [CrossRef] [PubMed]
  2. Bhandari, C.M.; Rowe, D.M. Optimization of carrier concentration. In CRC Handbook of Thermoelectrics; Rowe, D.M., Ed.; CRC Press: Boca Raton, FL, USA, 1995; pp. 43–53. [Google Scholar]
  3. Ohtaki, M.; Araki, K.; Yamamoto, K. High thermoelectric performance of dually doped ZnO ceramics. J. Electron. Mater. 2009, 38, 1234–1238. [Google Scholar] [CrossRef]
  4. Poudel, B.; Hao, Q.; Ma, Y.; Lan, Y.; Minnich, A.; Yu, B.; Yan, X.; Wang, D.; Muto, A.; Vashaee, D.; Chen, X.; Liu, J.; Dresselhaus, M.S.; Chen, G.; Ren, Z. High-thermoelectric performance of nanostructured bismuth antimony telluride bulk alloys. Science 2008, 320, 634–638. [Google Scholar] [CrossRef] [PubMed]
  5. Scherrer, H.; Scherrer, S. Thermoelectric properties of bismuth antimony telluride solid solutions. In Thermoelectrics Handbook: Macro to Nano; Rowe, D.M., Ed.; CRC Press: Boca Raton, FL, USA, 2006; p. 27. [Google Scholar]
  6. Hsu, K.F.; Loo, S.; Guo, F.; Chen, Y.; Dyck, J.S.; Uher, C.; Hogan, T.; Polychroniadis, E.K.; Kanatzidis, M.G. Cubic AgPbmSbTe2+m: bulk thermoelectric materials with high figure of merit. Science 2004, 303, 818–821. [Google Scholar] [CrossRef] [PubMed]
  7. Rowe, D.M.; Shukla, V.S. The effect of phonon-grain boundary scattering on the lattice thermal conductivity and thermoelectric conversion efficiency of heavily doped fine-grained, hot-pressed silicon germanium alloy. J. Appl. Phys. 1981, 52, 7421–7426. [Google Scholar] [CrossRef]
  8. Zhang, Q.; He, J.; Zhu, T.J.; Zhang, S.N.; Zhao, X.B.; Tritt, T.M. High figures of merit and natural nanostructures in Mg2Si0.4Sn0.6 based thermoelectric materials. Appl. Phys. Lett. 2008, 93, 102109. [Google Scholar] [CrossRef]
  9. Caillat, T.; Fleurial, J.-P.; Borshchevsky, A. Preparation and thermoelectric properties of semiconducting Zn4Sb3. J. Phys. Chem. Solids 1997, 58, 1119–1125. [Google Scholar] [CrossRef]
  10. Shi, X.; Kong, H.; Li, C.-P.; Uher, C.; Yang, J.; Salvador, J.R.; Wang, H.; Chen, L.; Zhang, W. Low thermal conductivity and high thermoelectric figure of merit in n-type BaxYbyCo4Sb12 double-filled skutterudites. Appl. Phys. Lett. 2008, 92, 182101. [Google Scholar] [CrossRef]
  11. Sakurada, S.; Shutoh, N. Effect of Ti substitution on the thermoelectric properties of (Zr,Hf)NiSn half-Heusler compounds. Appl. Phys. Lett. 2005, 86, 082105. [Google Scholar] [CrossRef]
  12. Kim, J.H.; Okamoto, N. L.; Kishida, K.; Tanaka, K.; Inui, H. High thermoelectric performance of type-III clathrate compounds of the Ba-Ge-Ga system. Acta. Mater. 2006, 54, 2057–2062. [Google Scholar] [CrossRef]
  13. Terasaki, I.; Sasago, Y.; Uchinokura, K. Large thermoelectric power in NaCo2O4 single crystals. Phys. Rev.B 1997, 56, R12685–R12687. [Google Scholar] [CrossRef]
  14. Masset, A.C.; Michel, C.; Maignan, A.; Hervieu, M.; Toulemonde, O.; Studer, F.; Raveau, B.; Hejtmanek, J. Misfit-layered cobaltite with an anisotropic giant magnetoresistance: Ca3Co4O9. Phys. Rev. B 2000, 62, 166–175. [Google Scholar] [CrossRef]
  15. Ohtaki, M.; Tsubota, T.; Eguchi, K.; Arai, H. High-temperature thermoelectric properties of (Zn1–xAlx )O. J. Appl.Phys. 1996, 79, 1816–1818. [Google Scholar] [CrossRef]
  16. Ohta, S.; Ohta, H.; Koumoto, K. Grain size dependence of thermoelectric performance of Nb-doped SrTiO3 polycrystals. J. Ceram. Soc. Jpn. 2006, 114, 102–105. [Google Scholar] [CrossRef]
  17. Koumoto, K.; Koduka, H.; Seo, W.S. Thermoelectric properties of single crystal CuAlO2 with a layered structure. J. Mater. Chem. 2001, 11, 251–252. [Google Scholar] [CrossRef]
  18. Park, K.; Ko, K.Y.; Seo, W.-S. Thermoelectric properties of CuAlO2. J. Euro. Ceram. Soc. 2005, 25, 2219–2222. [Google Scholar] [CrossRef]
  19. Tsuboi, N.; Takahashi, Y.; Kobayashi, S.; Shimizu, H.; Kato, K.; Kaneko, F. Delafossite CuAlO2 films prepared by reactive sputtering using Cu and Al targets. J. Phys. Chem. Solids 2003, 64, 1671–1674. [Google Scholar] [CrossRef]
  20. Cai, J.; Gong, H. The influence of Cu/Al ratio on properties of chemical-vapor-deposition-grown p-type Cu-Al-O transparent semiconducting films. J. Appl. Phys. 2005, 98, 033707. [Google Scholar] [CrossRef]
  21. Yanagi, H.; Inoue, S.; Ueda, K.; Kawazoe, H.; Hosono, H.; Hamada, N. Electronic structure and optoelectronic properties of transparent p-type conducting CuAlO2. J. Appl. Phys. 2000, 88, 4159–4163. [Google Scholar] [CrossRef]
  22. Ishiguro, T.; Ishizawa, N.; Mizutani, N.; Kato, M.; Tanaka, K.; Marumo, F. Charge-density distribution in crystals of CuAlO2 with d-s hybridization. Acta Cryst. 1983, B39, 564–569. [Google Scholar] [CrossRef]
  23. Kawazoe, H.; Yasukawa, M.; Hyodo, H.; Kurita, M.; Yanagi, H.; Hosono, H. P-type electrical conduction in transparent thin films of CuAlO2. Nature 1997, 389, 939–942. [Google Scholar] [CrossRef]
  24. Park, K.; Ko, K.Y.; Seo, W.-S. Effect of partial substitution of Ca for Al on the microstructure and high-temperature thermoelectric properties of CuAlO2. Mater. Sci. Eng. B 2006, 129, 1–7. [Google Scholar] [CrossRef]
  25. Park, K.; Ko, K.Y.; Seong, J.K.; Nahm, S. Microstructure and high-temperature thermoelectric properties of polycrystalline CuAl1-xMgxO2 ceramics. J. Euro. Ceram. Soc. 2007, 27, 3735–3738. [Google Scholar] [CrossRef]
  26. Park, K.; Ko, K.Y.; Kwon, H.-C.; Nahm, S. Improvement in thermoelectric properties of CuAlO2 by adding Fe2O3. J. Alloys Compd. 2007, 437, 1–6. [Google Scholar] [CrossRef]
  27. Lali, M.V.; Mestnik-Filho, J.; Carbonari, A.W.; Saxena, R.N. Changes induced by the presence of Zn or Ni impurity at Cu sites in CuAlO2 delafossite. Solid State Commun. 2003, 125, 175–178. [Google Scholar] [CrossRef]
  28. Shibasaki, S.; Kobayashi, W.; Terasaki, I. Transport properties of the delafossite Rh oxide Cu1−xAgxRh1−yMgyO2: Effect of Mg substitution on the resistivity and Hall coefficient. Phys. Rev. B 2006, 74, 235110. [Google Scholar] [CrossRef]
  29. Shannon, R.D.; Prewitt, C.T. Effective ionic radii in oxides and fluorides. Acta Cryst. 1969, B25, 925–946. [Google Scholar] [CrossRef]
  30. Hamada, I.; Katayama-Yoshida, H. Energetics of native defects in CuAlO2. Physica B 2006, 376–377, 808–811. [Google Scholar] [CrossRef]
  31. Ingram, B.J.; González, G.B.; Mason, T.O.; Shahriari, D.Y.; Barnabè, A.; Ko, D.; Poeppelmeier, K.R. Transport and defect mechanisms in cuprous delafossites. 1. Comparison of hydrothermal and standard solid-state synthesis in CuAlO2. Chem. Mater. 2004, 16, 5616–5622. [Google Scholar] [CrossRef]
  32. Wongcharoen, N.; Gaewdang, T. Thermoelectric properties of Ni-doped CuAlO2. Physica Procedia 2009, 2, 101–106. [Google Scholar] [CrossRef]
  33. Ingram, B.J.; Mason, T.O.; Asahi, R.; Park, K.T.; Freeman, A.J. Electronic structure and small polaron hole transport of copper aluminate. Phys. Rev. B 2001, 64, 155114. [Google Scholar] [CrossRef]
  34. Rowe, D.M. General principles and basic considerations. In Thermoelectrics handbook: Macro to Nano; Rowe, D.M., Ed.; CRC Press: Boca Raton, FL, USA, 2006; p. 1. [Google Scholar]
  35. Xu, G.; Funahashi, R.; Shikano, M.; Pu, Q.; Liu, B. High temperature transport properties of Ca3-xNaxCo4O9 system. Solid State Commun. 2002, 124, 73–76. [Google Scholar] [CrossRef]
  36. Liu, M.-S.; Lin, M.C.-C.; Huang, I.-T.; Wang, C.-C. Enhancement of thermal conductivity with CuO for Nanofluids. Chem. Eng. Technol. 2006, 29, 72–77. [Google Scholar] [CrossRef]

