Review

Light Converting Inorganic Phosphors for White Light-Emitting Diodes

1
Department of Chemistry, National Taiwan University, Taipei 106, Taiwan
2
School of Materials Science and Engineering, Hefei University of Technology, Hefei 230009, China
*
Author to whom correspondence should be addressed.
Materials 2010, 3(3), 2172-2195; https://doi.org/10.3390/ma3032172
Submission received: 6 January 2010 / Revised: 23 February 2010 / Accepted: 15 March 2010 / Published: 22 March 2010
(This article belongs to the Special Issue Luminescent Materials)

Abstract

:
White light-emitting diodes (WLEDs) have matched the emission efficiency of florescent lights and will rapidly spread as light source for homes and offices in the next 5 to 10 years. WLEDs provide a light element having a semiconductor light emitting layer (blue or near-ultraviolet (nUV) LEDs) and photoluminescence phosphors. These solid-state LED lamps, rather than organic light emitting diode (OLED) or polymer light-emitting diode (PLED), have a number of advantages over conventional incandescent bulbs and halogen lamps, such as high efficiency to convert electrical energy into light, reliability and long operating lifetime. To meet with the further requirement of high color rendering index, warm light with low color temperature, high thermal stability and higher energy efficiency for WLEDs, new phosphors that can absorb excitation energy from blue or nUV LEDs and generate visible emissions efficiently are desired. The criteria of choosing the best phosphors, for blue (450−480 nm) and nUV (380−400 nm) LEDs, strongly depends on the absorption and emission of the phosphors. Moreover, the balance of light between the emission from blue-nUV LEDs and the emissions from phosphors (such as yellow from Y3Al5O12:Ce3+) is important to obtain white light with proper color rendering index and color temperature. Here, we will review the status of phosphors for LEDs and prospect the future development.

1. Introduction

Solid-state semiconductor lighting technology can be traced as far back as 1962 to the first semiconductor diode laser announced by Hall [1] at General Electric Research Labs in Schenectady, New York, but there was almost no application besides used in numeric displays or indicator lights in past, because the wavelengths produced by semiconductor lasers have generally been longer than 0.7 μm [1]. However, this situation was completely changed with Shuji Nakamura’s invention, who successfully fabricated double-heterostructure InGaN/GaN blue LED chips for the first time in 1993 and later in 1994 succeeded in producing l-cd-brightness high-power blue InGaN/AlGaN LEDs suitable for commercial applications [2,3,4,5,6]. Since the first commercially available white light-emitting diode (LED) was produced by Nichia Corporation in 1996, tremendous progress has been achieved in development of solid-state lighting based on InGaN semiconductors [6,7]. Besides in technique itself, a huge industrial chain has formed around white LEDs, including the upstream of the epitaxial films growth and single crystal diode chips, midstream of white LED preparation, LED packaging materials and accessories, and the downstream of the bulb-type LEDs, digital display and dot matrix display application, etc.
The operation of LEDs is based on spontaneous light emission in semiconductors, which is due to the radiative recombination of excess electrons and holes that are produced by the injection of current. Therefore, LEDs are not limited by the fundamental factors that still existed in conventional incandescent lamp and compact fluorescent lamp [8]. As a result, LED light sources have superior efficiency, lifetime, reliability, which makes it more energy-saving and environmental-friendly for less thermal radiation and no mercury. The organic light emitting diode (OLED) or polymer light-emitting diode(PLED) has a similar principle of operation with LED, but whose application is restricted by the effect of circumstance on organics. Here, we focus on LEDs. Currently, the application of LEDs has been extended from signal indicators initially to automobile light, traffic light, street lighting, landscape decoration, backlight of liquid crystal display (LCD) for TV sets, computers and mobile telephones, et al. Converting phosphors are essential components for LEDs. In this paper, we will review the technique of white light generating and the converting phosphors for LEDs to produce idea light with proper luminescence efficiency, color rendering index and thermal stability.

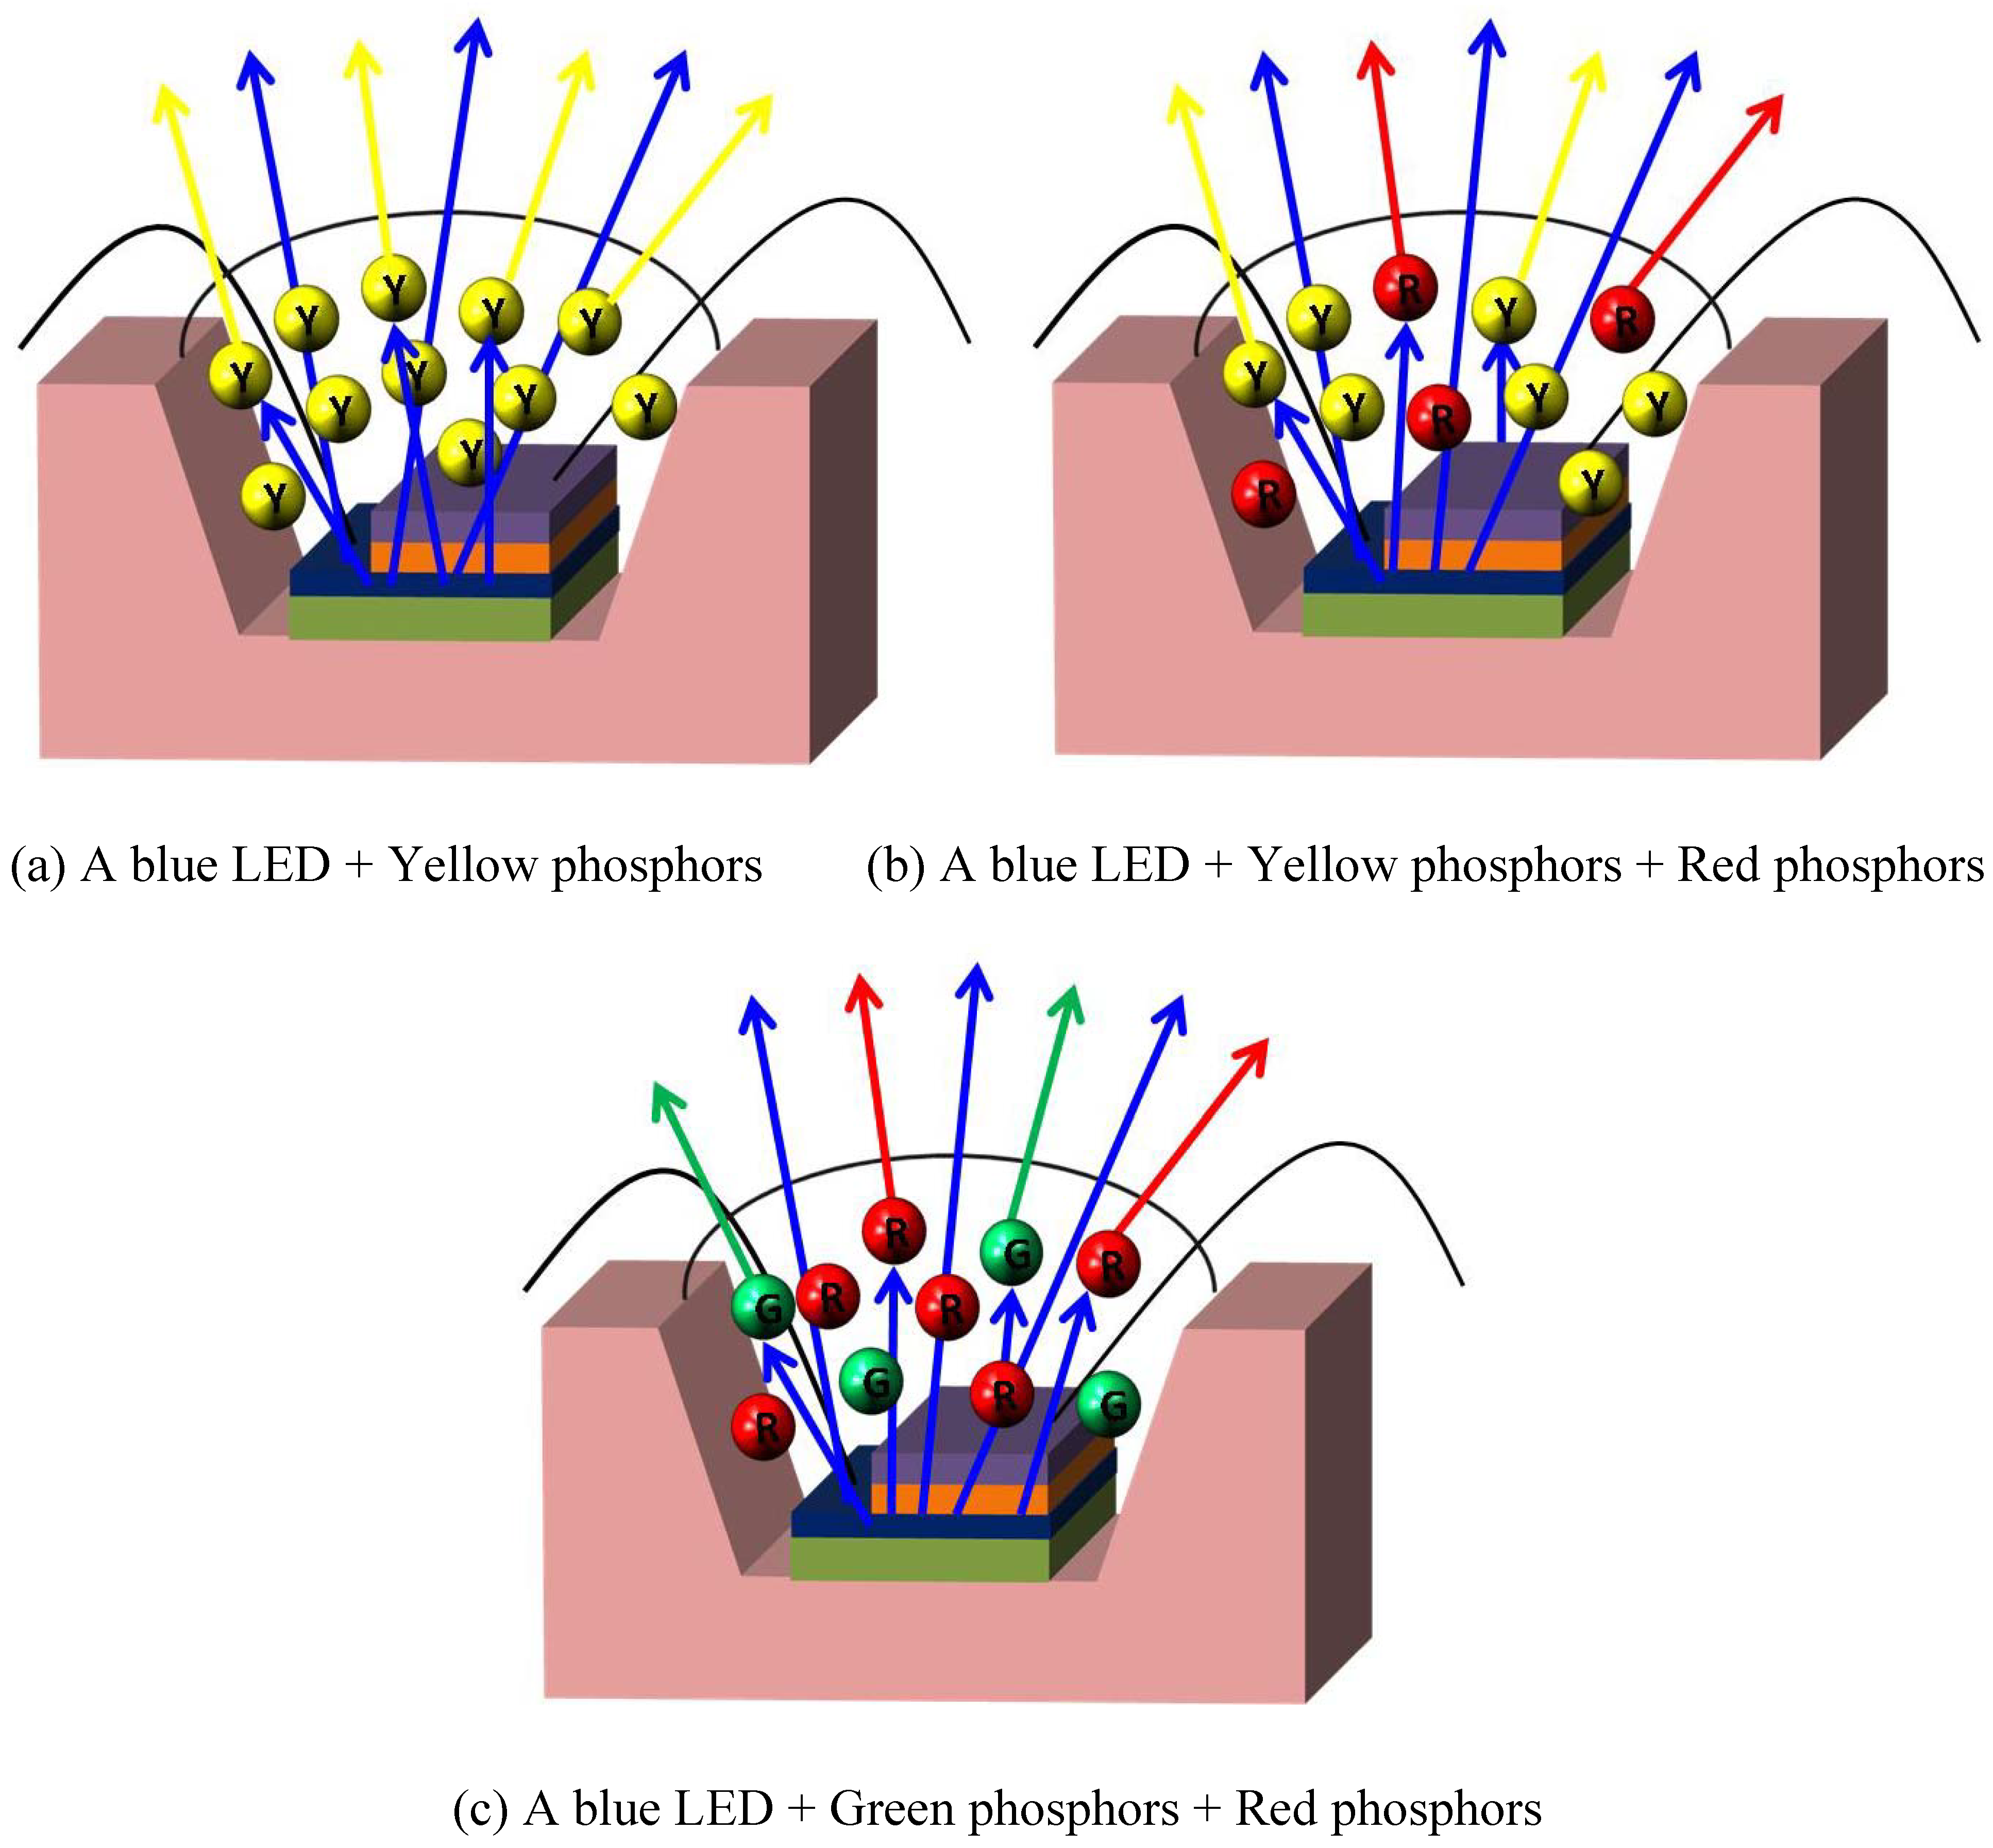
2. Principle of White Light Generating in LEDs

The first commercially available white LED produced by Nichia Corporation was prepared by combining the blue emission of InGaN diode chip with the yellow luminescence from Y3Al5O12:Ce3+ (YAG:Ce3+) phosphor [6]. The chief drawbacks to this YAG based WLEDs are poor color rendering and seriously thermal quenching luminescence. As an alternative, combining red, green, and blue phosphors and near-ultraviolet/ultraviolet (nUV/UV) InGaN diode chips to produce white light is highly favored [9]. From the view point of industrialization, most commercially available white LEDs are prepared by pre-coating phosphors onto blue diode chips, because the luminous efficiency of blue chip based white LEDs is far higher than that of nUV/UV type. According to the phosphors adopted in LEDs, the methods of generating white light can be summarized in three different types. The first is realized by mixing blue emission from a LED diode chip and the yellow luminescence from phosphor particles, as shown in Figure 1(a), whose typical character is highly efficient but with poor color rendering index (Ra). The second is by adding proper red phosphor into the first type, as shown in Figure 1(b), through which the Ra can be improved and luminous efficiency is appropriate. The third one is prepared by combining a blue LED diode chip with red and green phosphors, as shown in Figure 1(c), whose typical character is high Ra but with low efficiency. The thermal stability of LED luminescence depends significantly on phosphors, because heat is produced continuously during LEDs operating. Presently, the phosphors that can be adopted for commercial white LEDs are summarized as following.
Figure 1. Different ways of generating white light with blue LED and phosphors.
Materials 03 02172 g001

3. Converting Phosphors for LEDs

3.1. Yellow phosphors
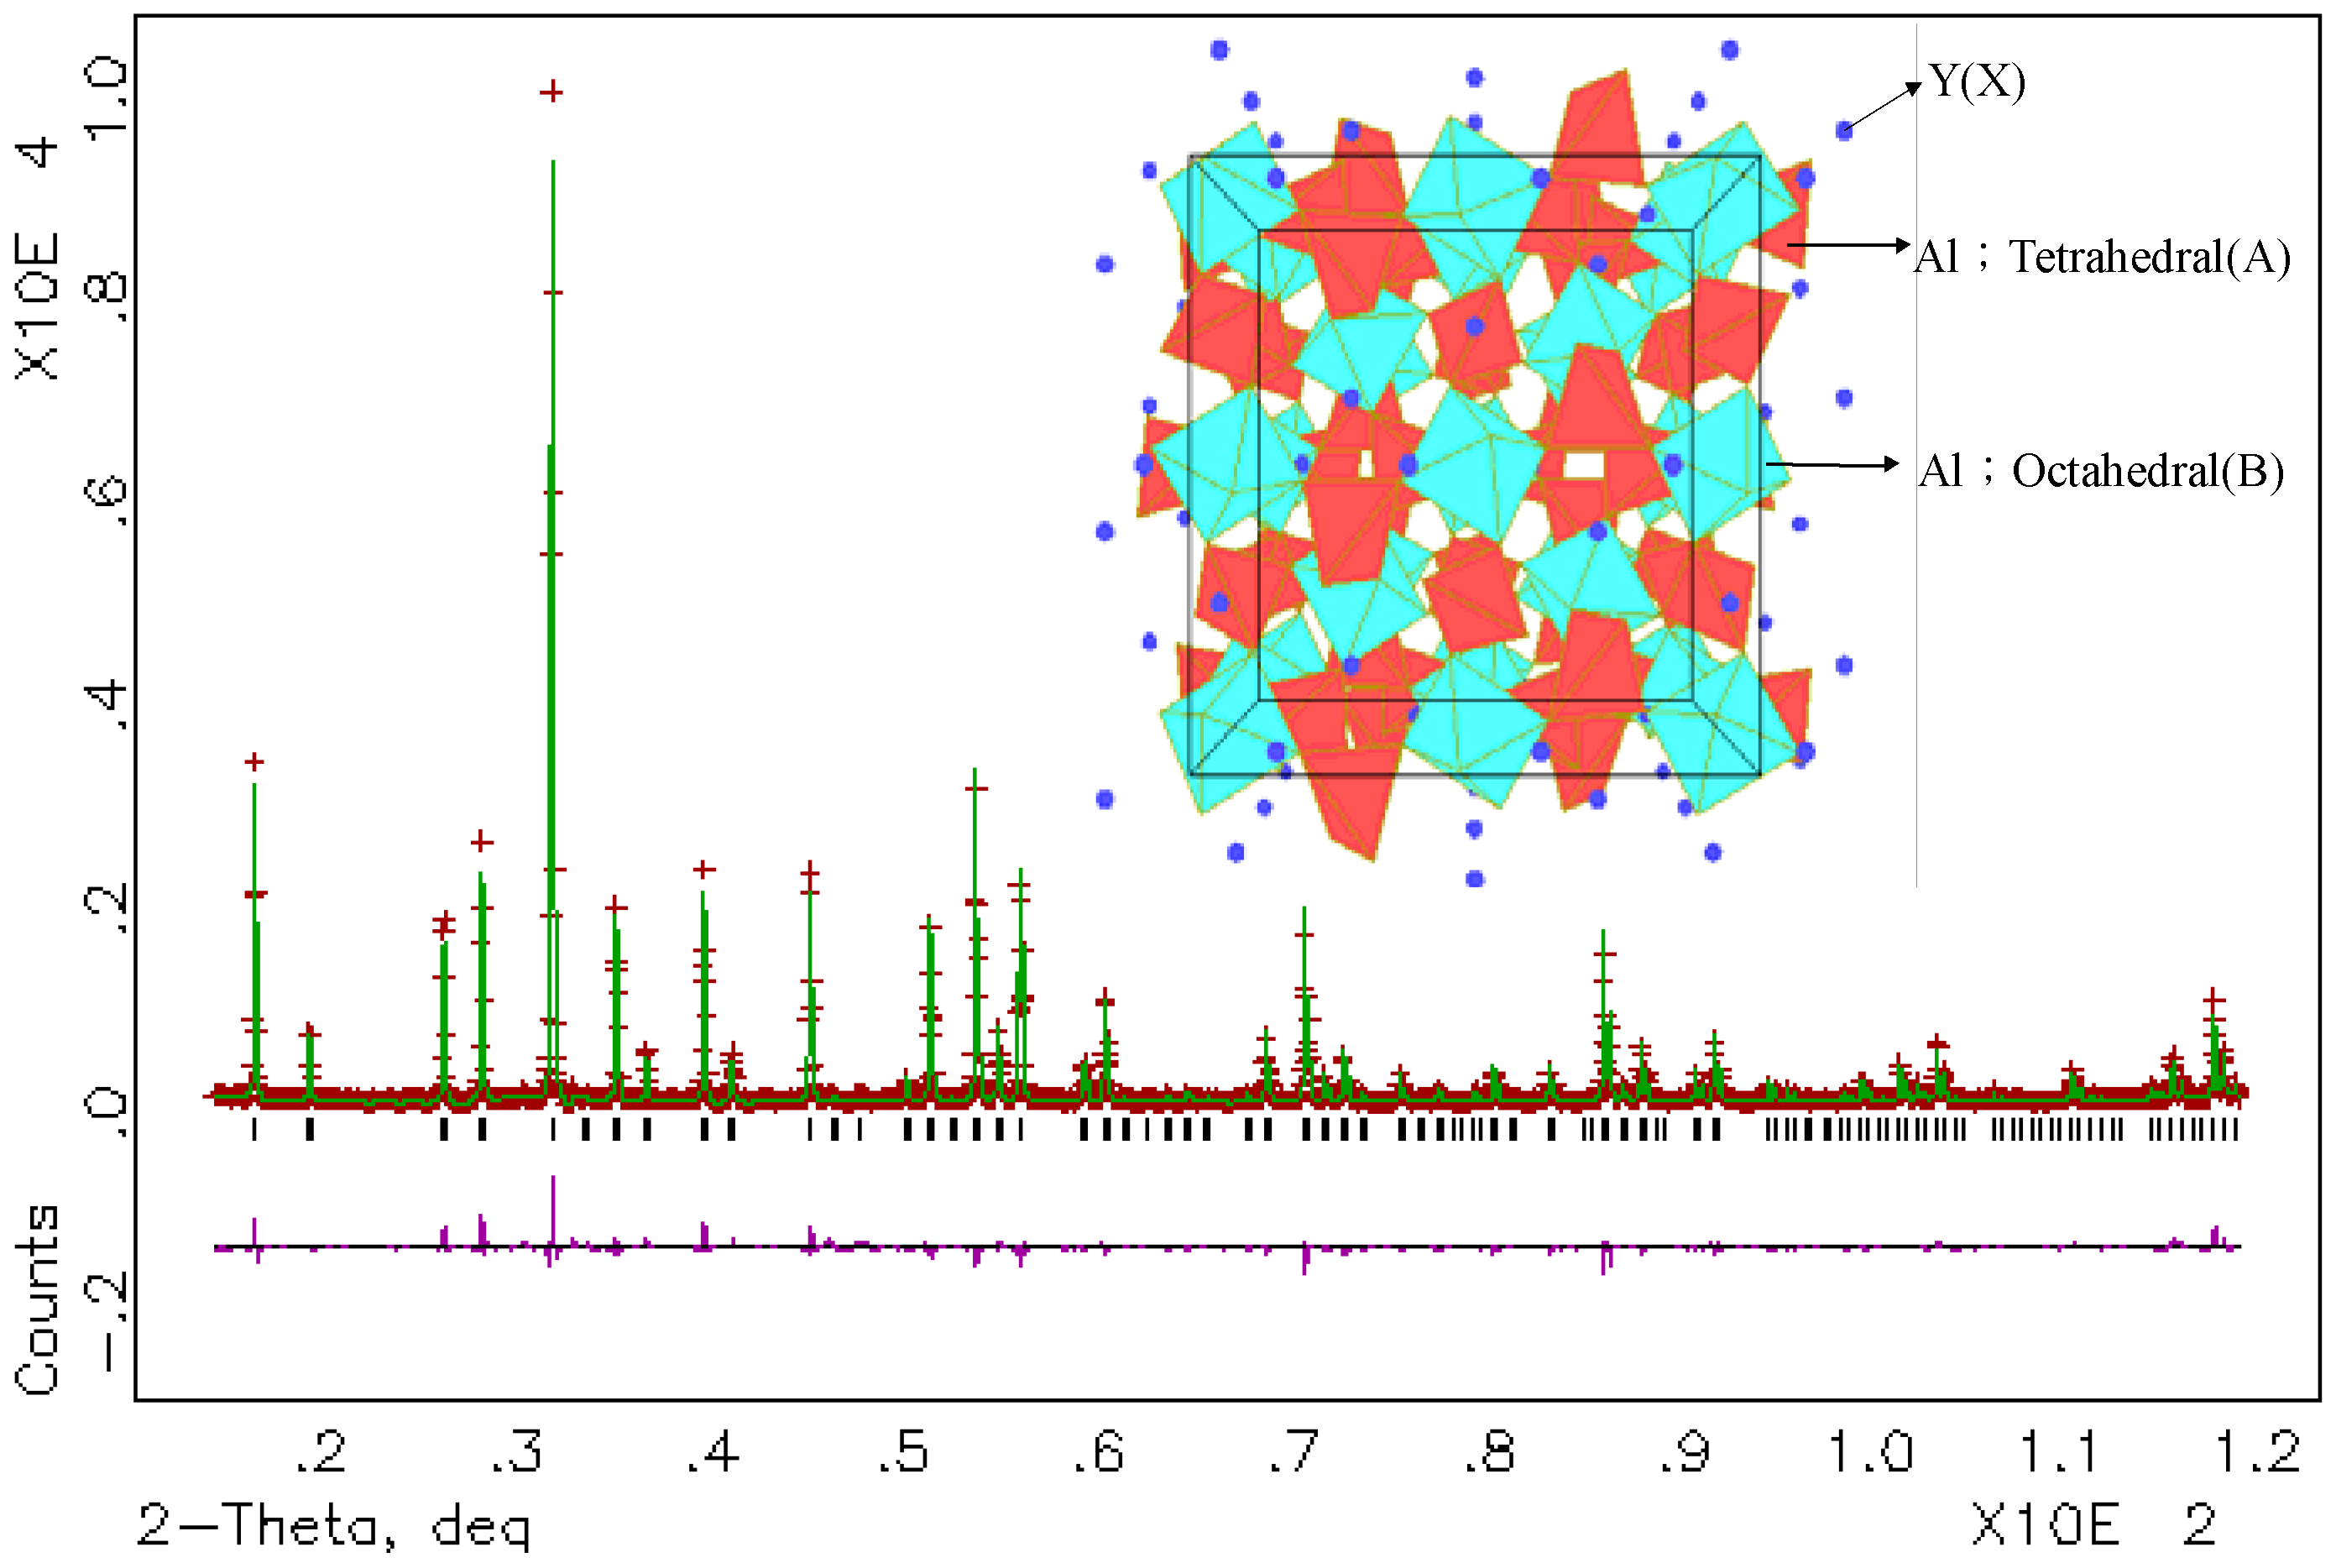
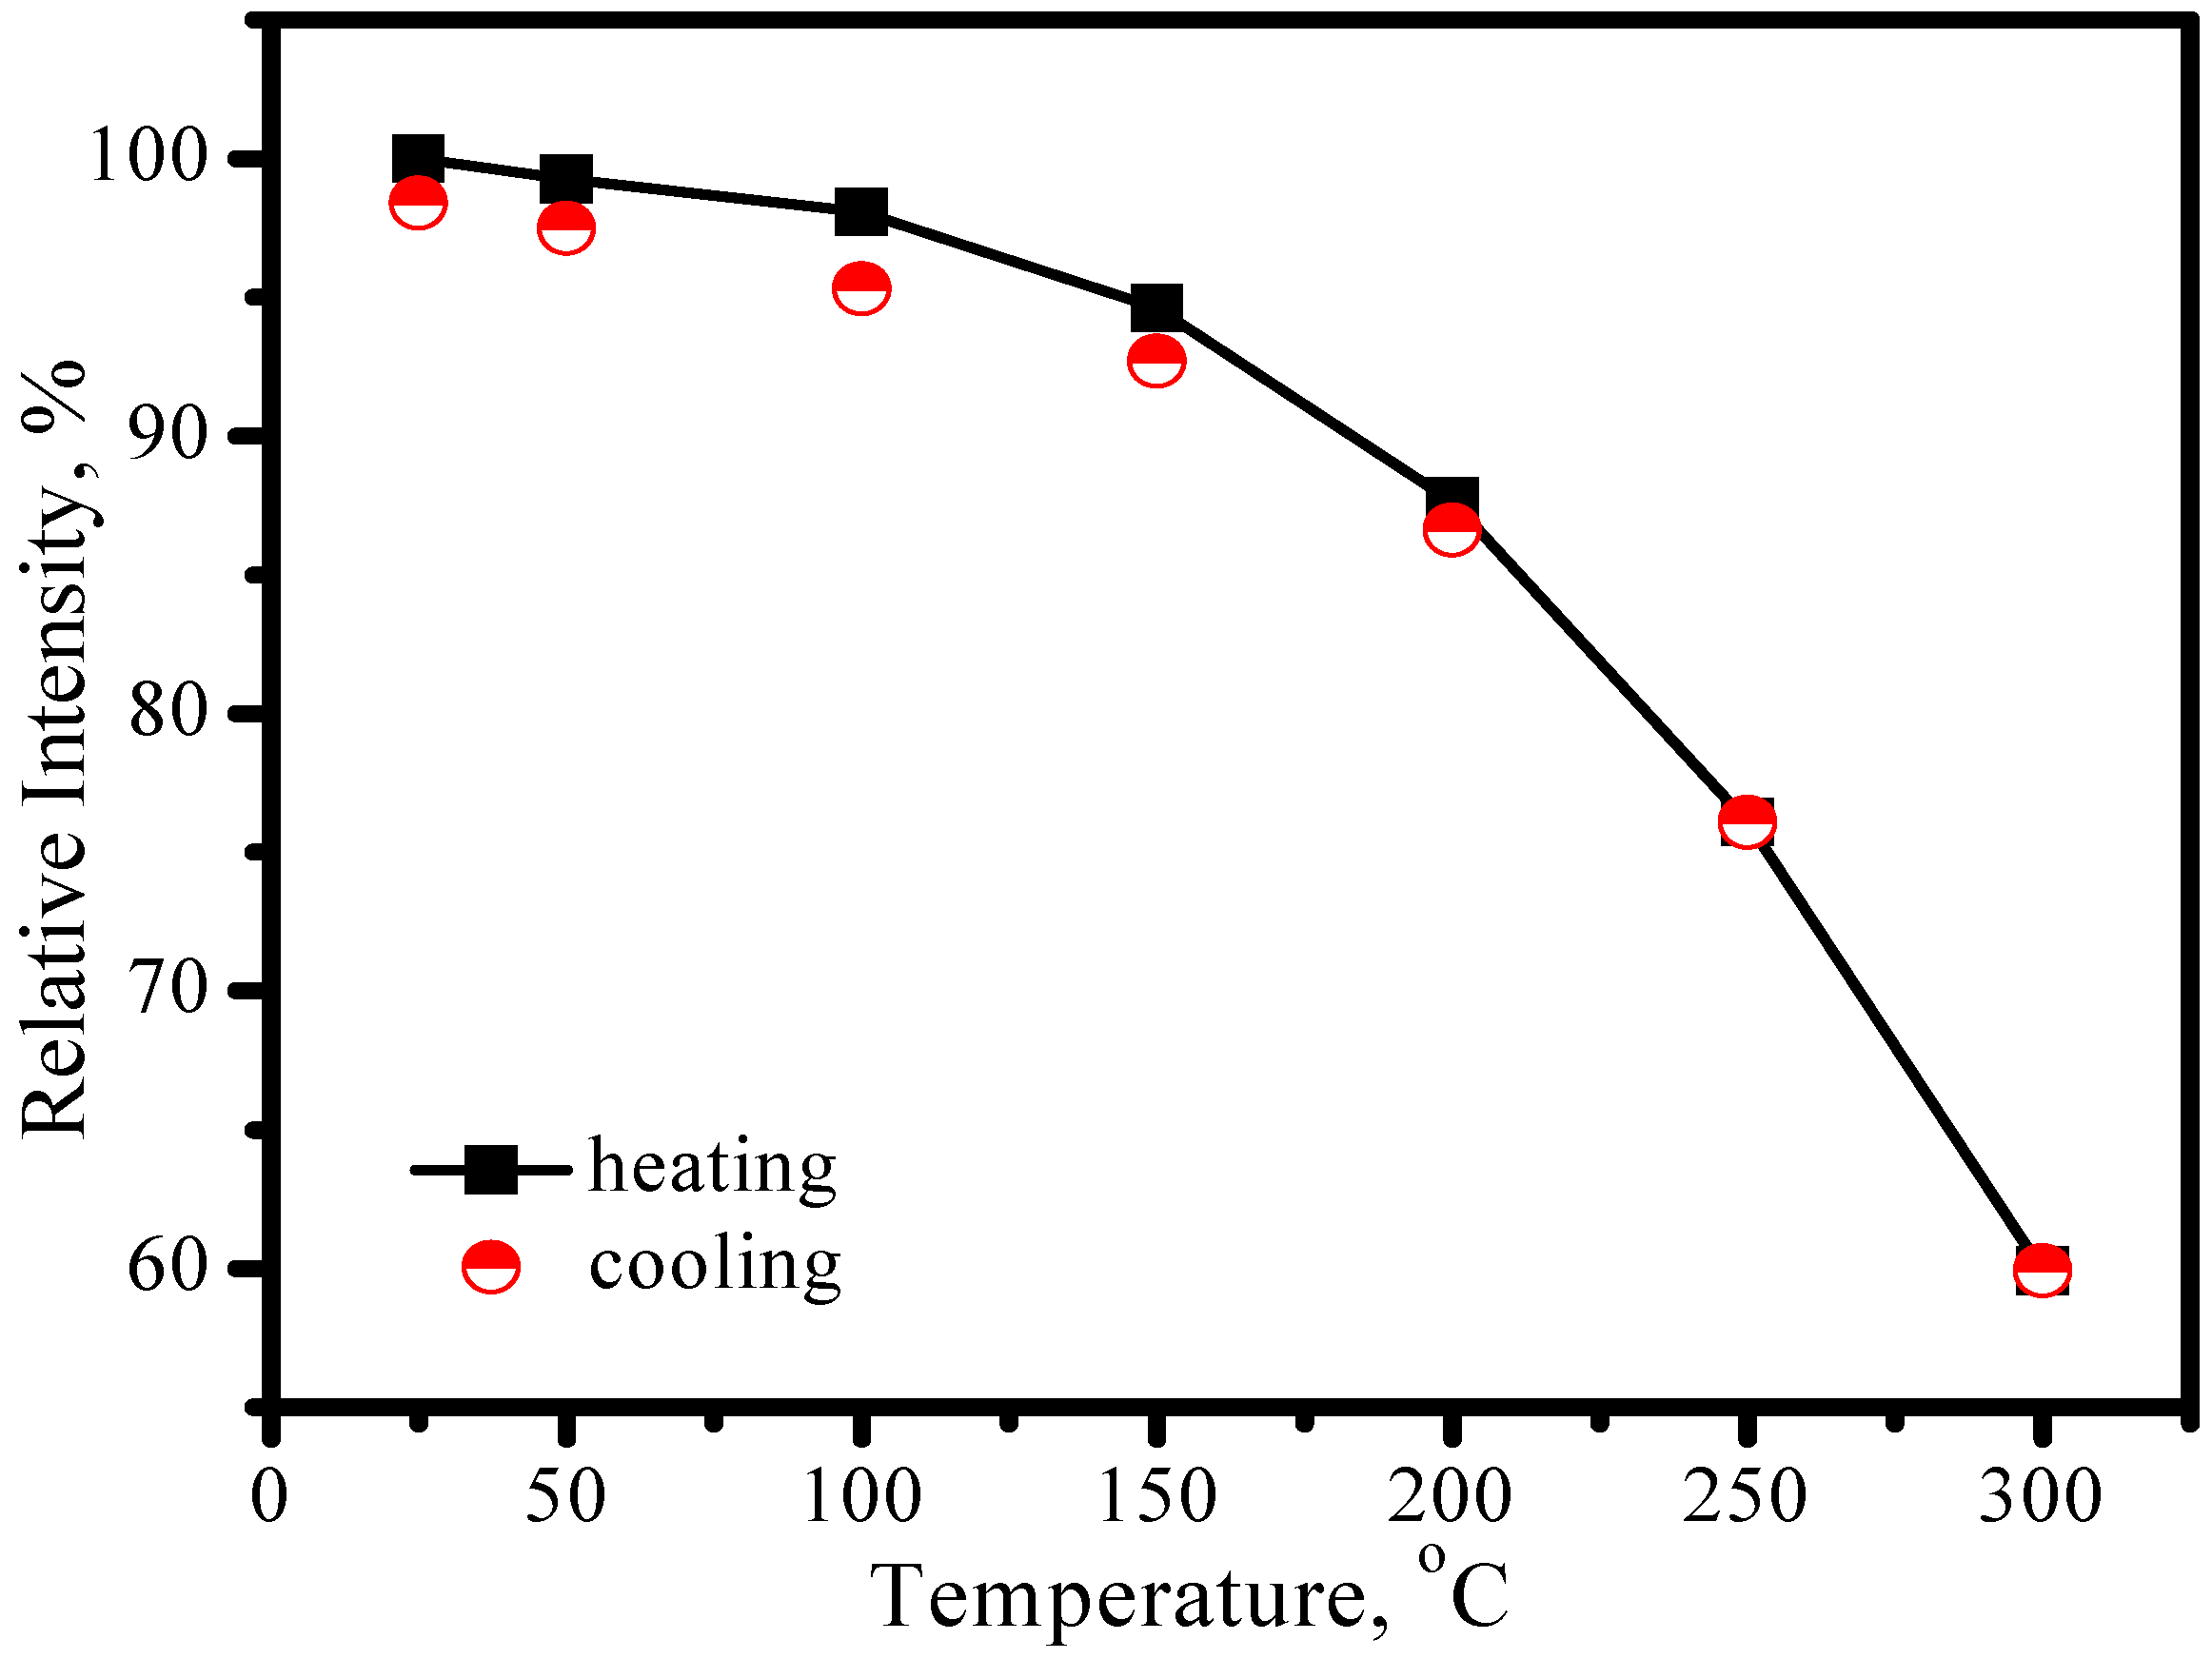
3.1.1. YAG:Ce3+

Cerium-activated yttrium aluminum garnet (YAG:Ce3+) is one of most popular used phosphors to combine with single blue LEDs to generate white light. Usually, pure YAG phase is hard to achieve due to the fact that Y2O3–Al2O3 is a complex system that has two more intermediate compounds with the following composition: perovskite YAlO3 (YAP) and monoclinic Y4Al2O9 (YAM) [10,11]. With sintering temperature increasing, multiple phases transformation was experienced during Y2O3-Al2O3→YAM→YAP→YAG [11]. Synthesized with a solid-state reaction method, YAG phase can be observed at l300 °C, but the single-phase YAG can not be obtained until 1600 °C. Comparatively, single-phase YAG can be achieved at low temperature with a soft-chemical method. As a result, different synthesis methods, for example, sol-gel [12], co-deposition [13], combustion [14], and spray pyrolysis [10], were developed. Figure 2 presents experimental, calculated, and difference results of the XRD refinement of (Y2.93Ce0.07)Al5O12 at room temperature, obtained by using GSAS program [15], whose crystallographic data is shown in table 1. Y3Al5O12 has cubic lattice with a space group of Ia3d (230) and the lattice constants a = b = c = 12.0136(9) Å. The inset in Figure 2 presents the three-dimensional structure of YAG, in which Y occupies the 24(c) site with a dodecahedral (distorted cubic lattice) site and eight coordination numbers. There are two different sites for Al ions—namely, octahedral 16(a) and tetrahedral 24(d) in the lattice [16]. All of the observed peaks satisfy the reflection condition with fitted parameters as χ2 = 2.109, Rp = 10.02%, and Rwp = 13.69%. Therefore, Ce3+ ions replace the ideal sites of Y3+.
Figure 2. Experimental (crosses), calculated (solid line), and difference (bottom) results of XRD refinement of (Y2.93Ce0.07)Al5O12. Inset presents its three-dimensional structure.
Materials 03 02172 g002
Table 1. Crystallographic Data of (Y2.93Ce0.07)Al5O12.
AtomsxyzFractionUiso
Ce0.12500.250.0230.0164(2)
Y0.12500.250.9770.0164(2)
Al00010.0197(7)
Al0.37500.2510.0171(5)
O-0.0298(2)0.0506(2)0.1493(2)10.0172(8)
Space group: Ia-3d (cubic)Reliability factorsInteratomic distances(Å)
Cell parameters:Rp = 10.02%Ce-O2.300(3)
a = 12.0136(9)ÅRwp = 13.69% 2.440(3)
b = 12.0136(9)Åχ2 = 2.109Al-O1.928(3)
c = 12.0136(9)Å 1.772(2)
Figure 3 presents the photoluminescence spectra of (Y2.93Ce0.07)Al5O12, where one broad emission band with peak at nearly 560 nm is observed by exciting with 460 nm and two excitation bands with peak at about 338 and 460 nm are observed upon Ce3+ emission at 560 nm. As shown in Figure 4, a free Ce3+ ion with 4fl electronic configuration has two ground states, namely 2F5/2 and 2F7/2. Once with one electron excited from 4f to 5d, the 5d electron of the exited 4f05d1 configuration forms a 2D term, which is split by spin-orbit coupling and two lower energy levels of 2D3/2 and 2D5/2 states are formed [17,18]. Therefore, the excitation bands peaked at 338 and 460 nm are attributed to 2F5/2 (or 2F7/2)→2D3/2 and 2F5/2 (or 2F7/2)→2D5/2 transition, respectively. Electrons on the higher energy level of 2D5/2 state are unstable, which would relax to 2D3/2 state with electron–phonon interaction. Therefore, the emission band in Figure 3 is attributed to 2D3/22F7/2 or 2F5/2 transition. Because the radial wave function of the excited 5d electron extends spatially well beyond the closed 5s25p6, its states are strongly perturbed by the crystal field. Thus, both the strongest excitation band and the strongest emission band are associated with the lowest-lying 5d state, which is affected by crystal field. According to the configuration-coordinate model, the nonradioactive transition from excited states to ground state increases with an increase of temperature. As a result, the emission peaks of YAG:Ce3+ redshift from 560 to 570 nm as temperature increases from 25 to 300 °C, as shown in Figure 5. Correspondingly, the luminescence intensity decreases by 6% and 41% as temperature increasing from 25 to 150 and 300 °C respectively, as displayed in Figure 6. The luminescence intensity, which is defined as the radiative energy of light source during per unit time in per unit spatial angle and is proportional to the area of emission spectrum, is obtained by integrating emission spectrum in this paper. In Figure 6, the luminescence intensity curve of heating process is almost duplicate with that of cooling process, which indicates the thermal quenching is recoverable or no thermal degradation.
Figure 3. Excitation (λem = 560 nm) and emission (λex = 460 nm) spectra of (Y2.93Ce0.07)Al5O12 phosphor.
Materials 03 02172 g003
Figure 4. Energy-level diagram of YAG:Ce3+ and its excitation (EX) and emission (Em) process. The dashed lines denote the potential process.
Materials 03 02172 g004
Figure 5. Emission spectra of YAG:Ce3+ upon Ce3+ emission at 560 nm measured at different temperature.
Materials 03 02172 g005
Figure 6. Luminescence intensity of YAG:Ce3+ as a function of temperature.
Materials 03 02172 g006

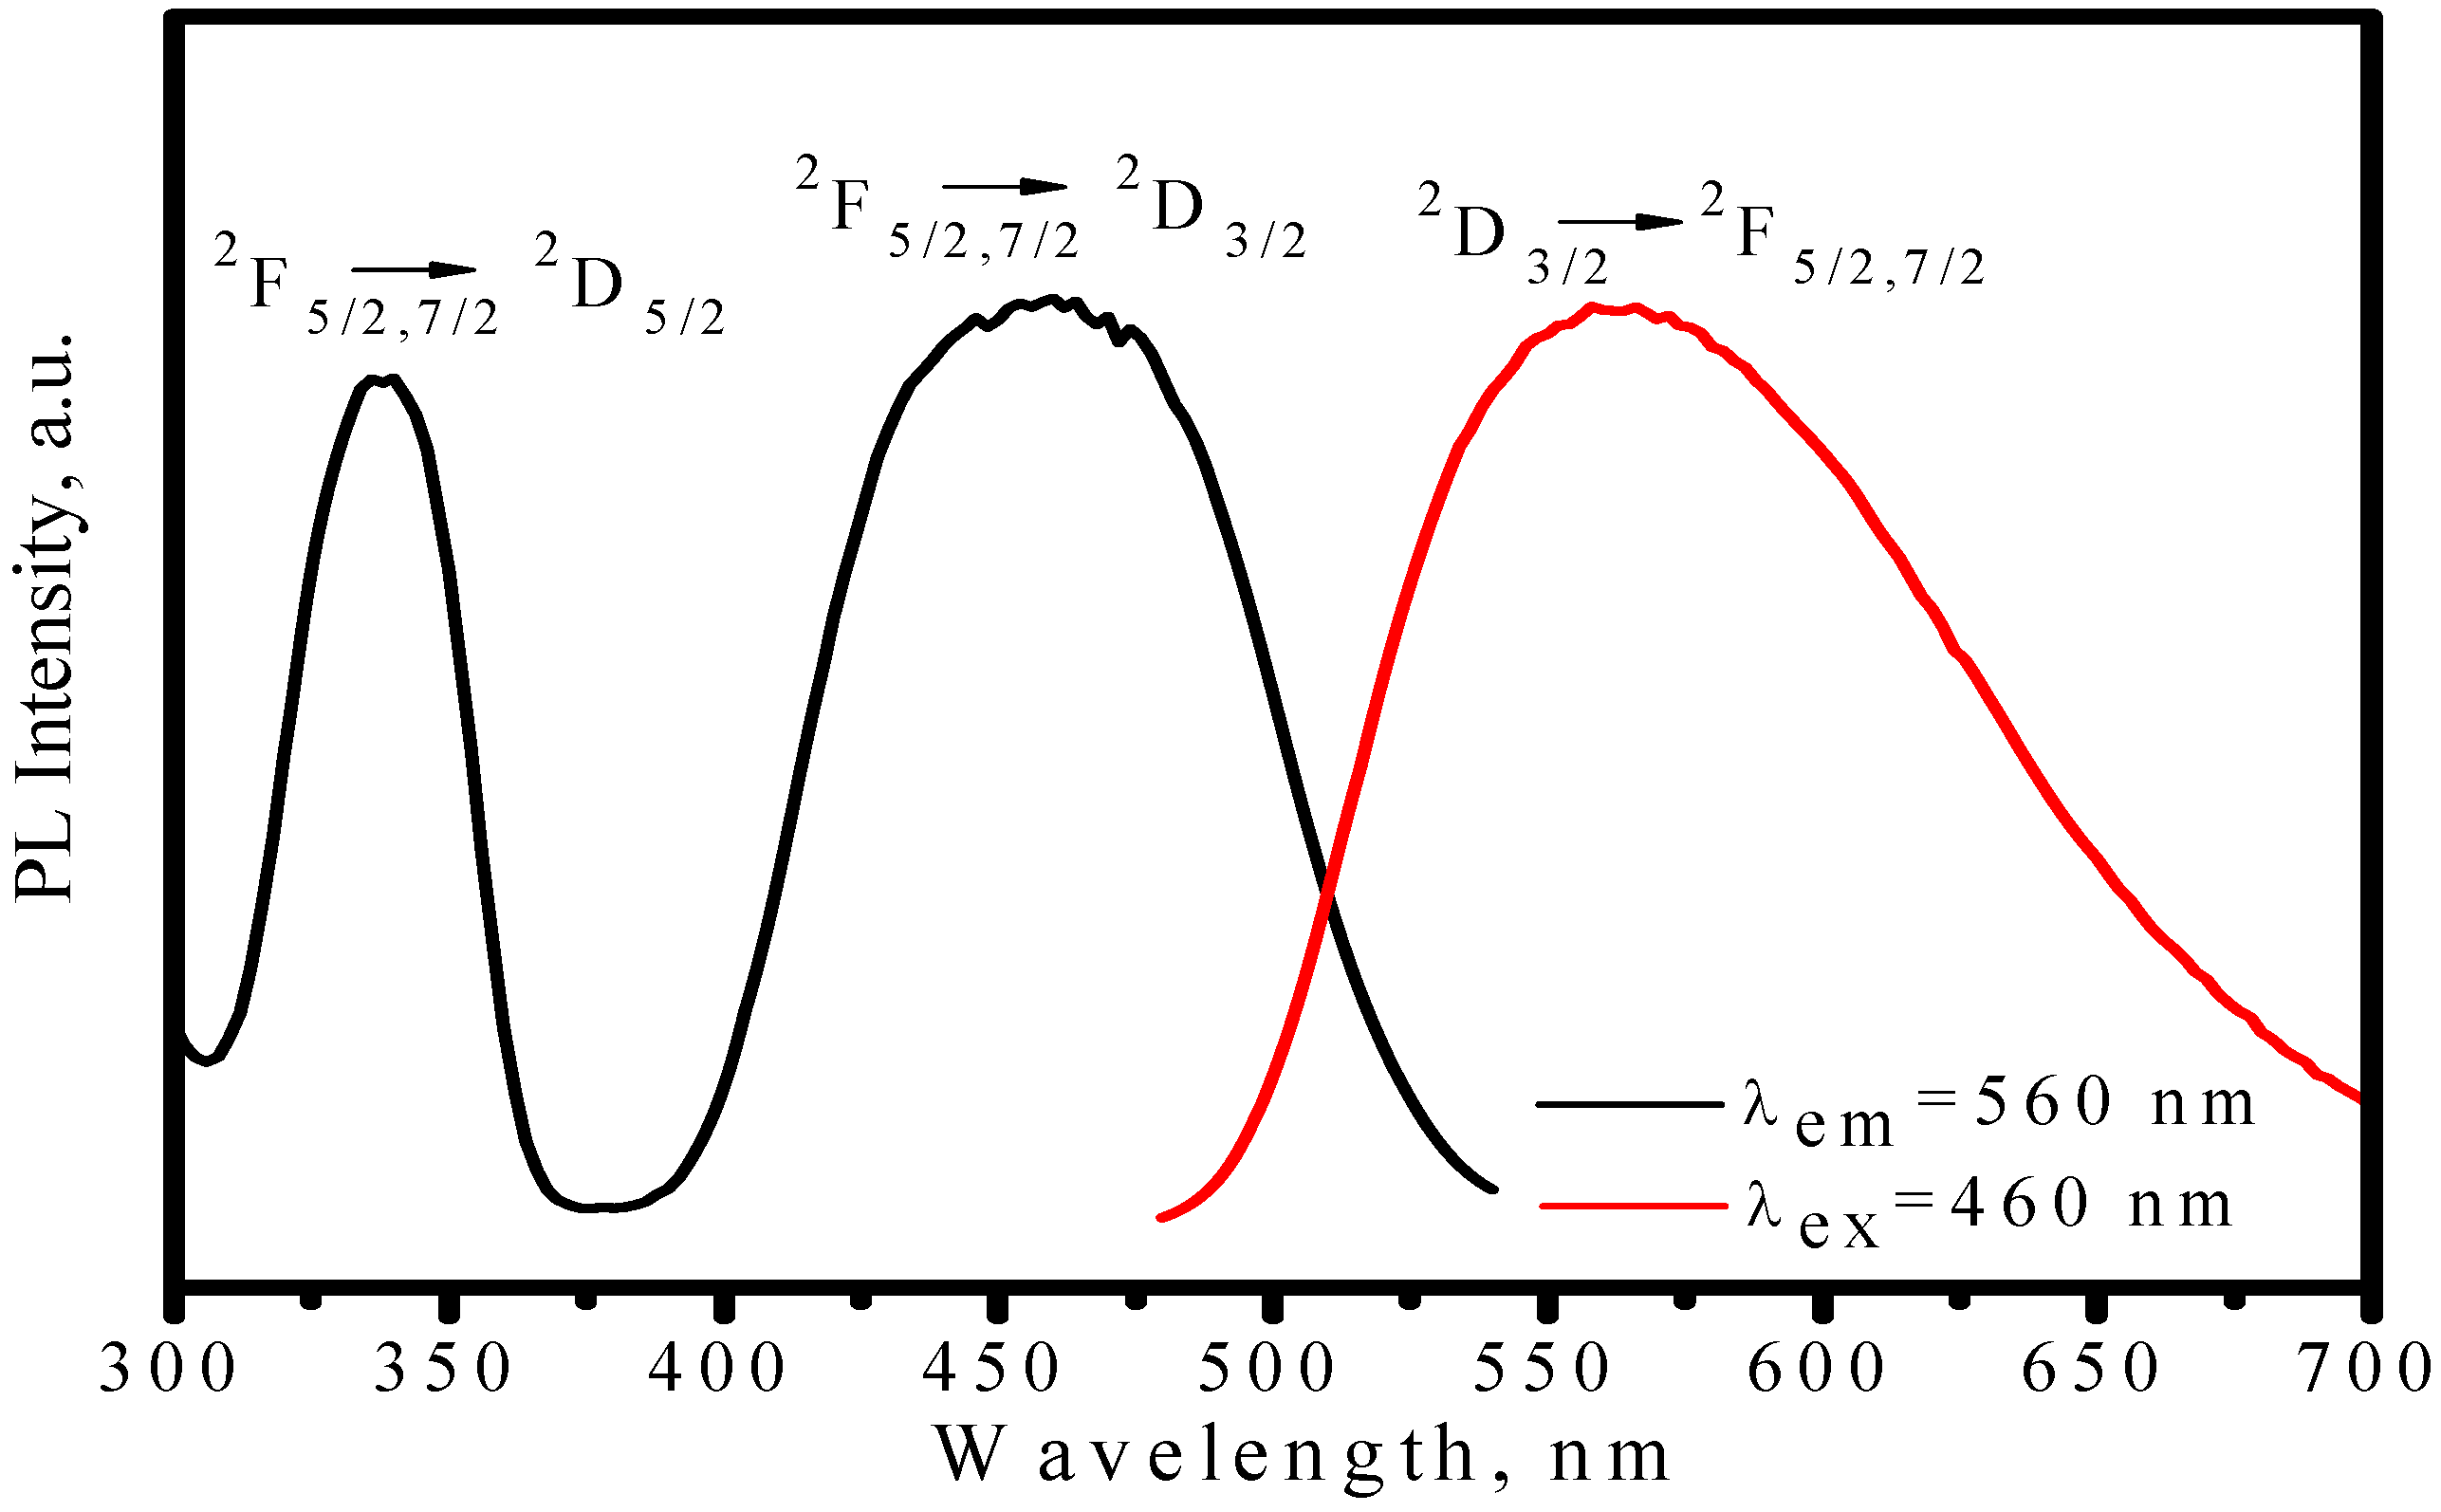
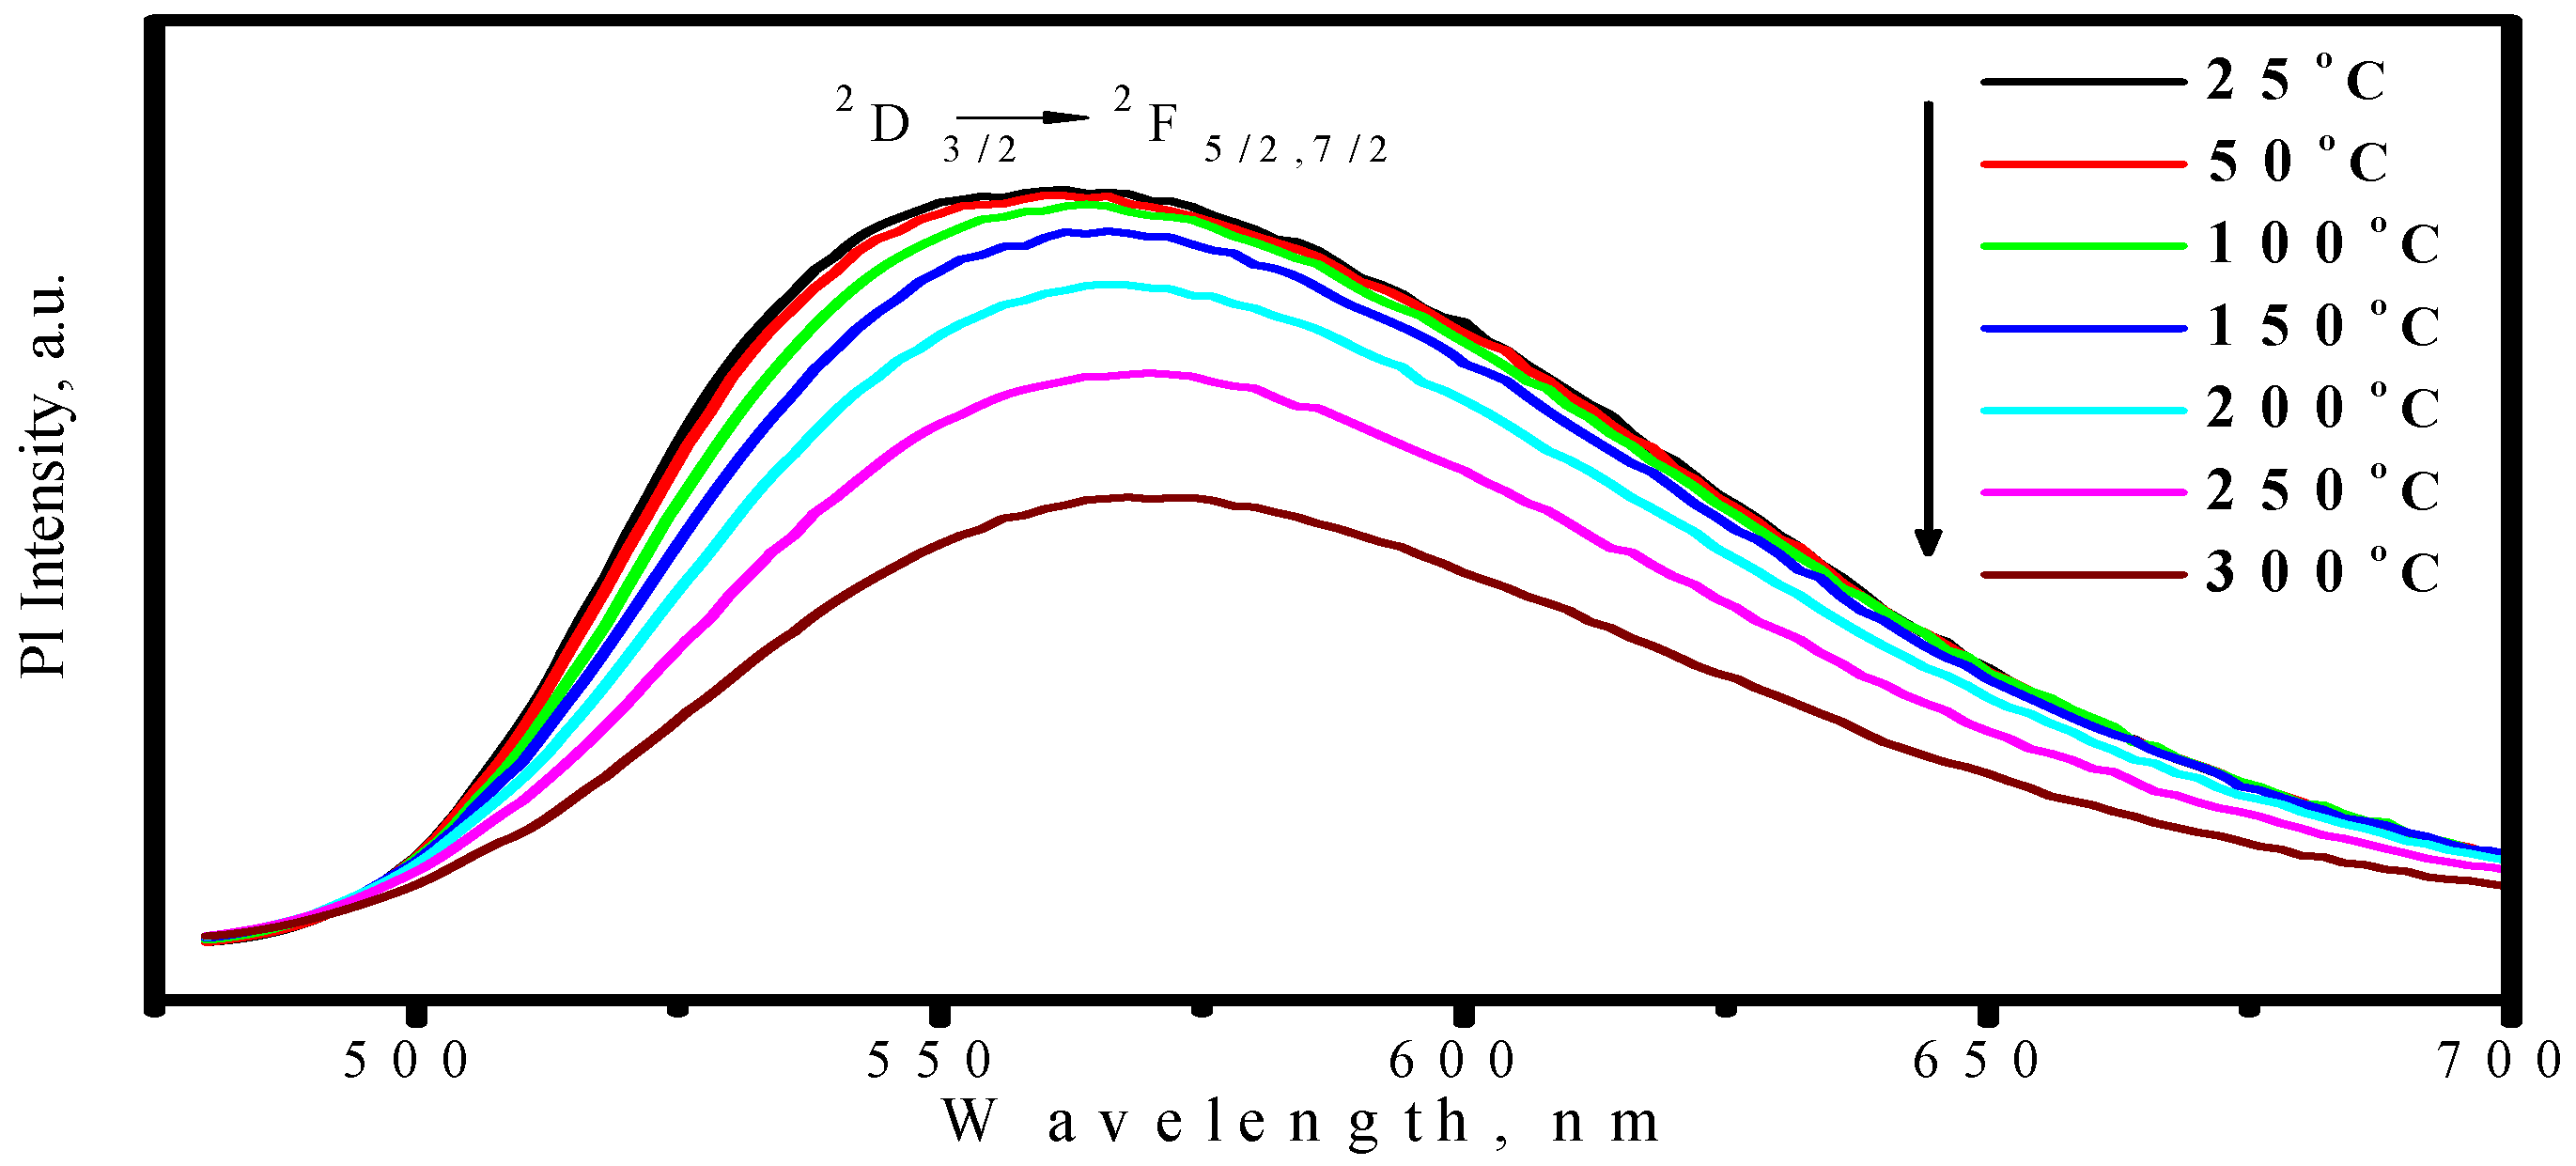
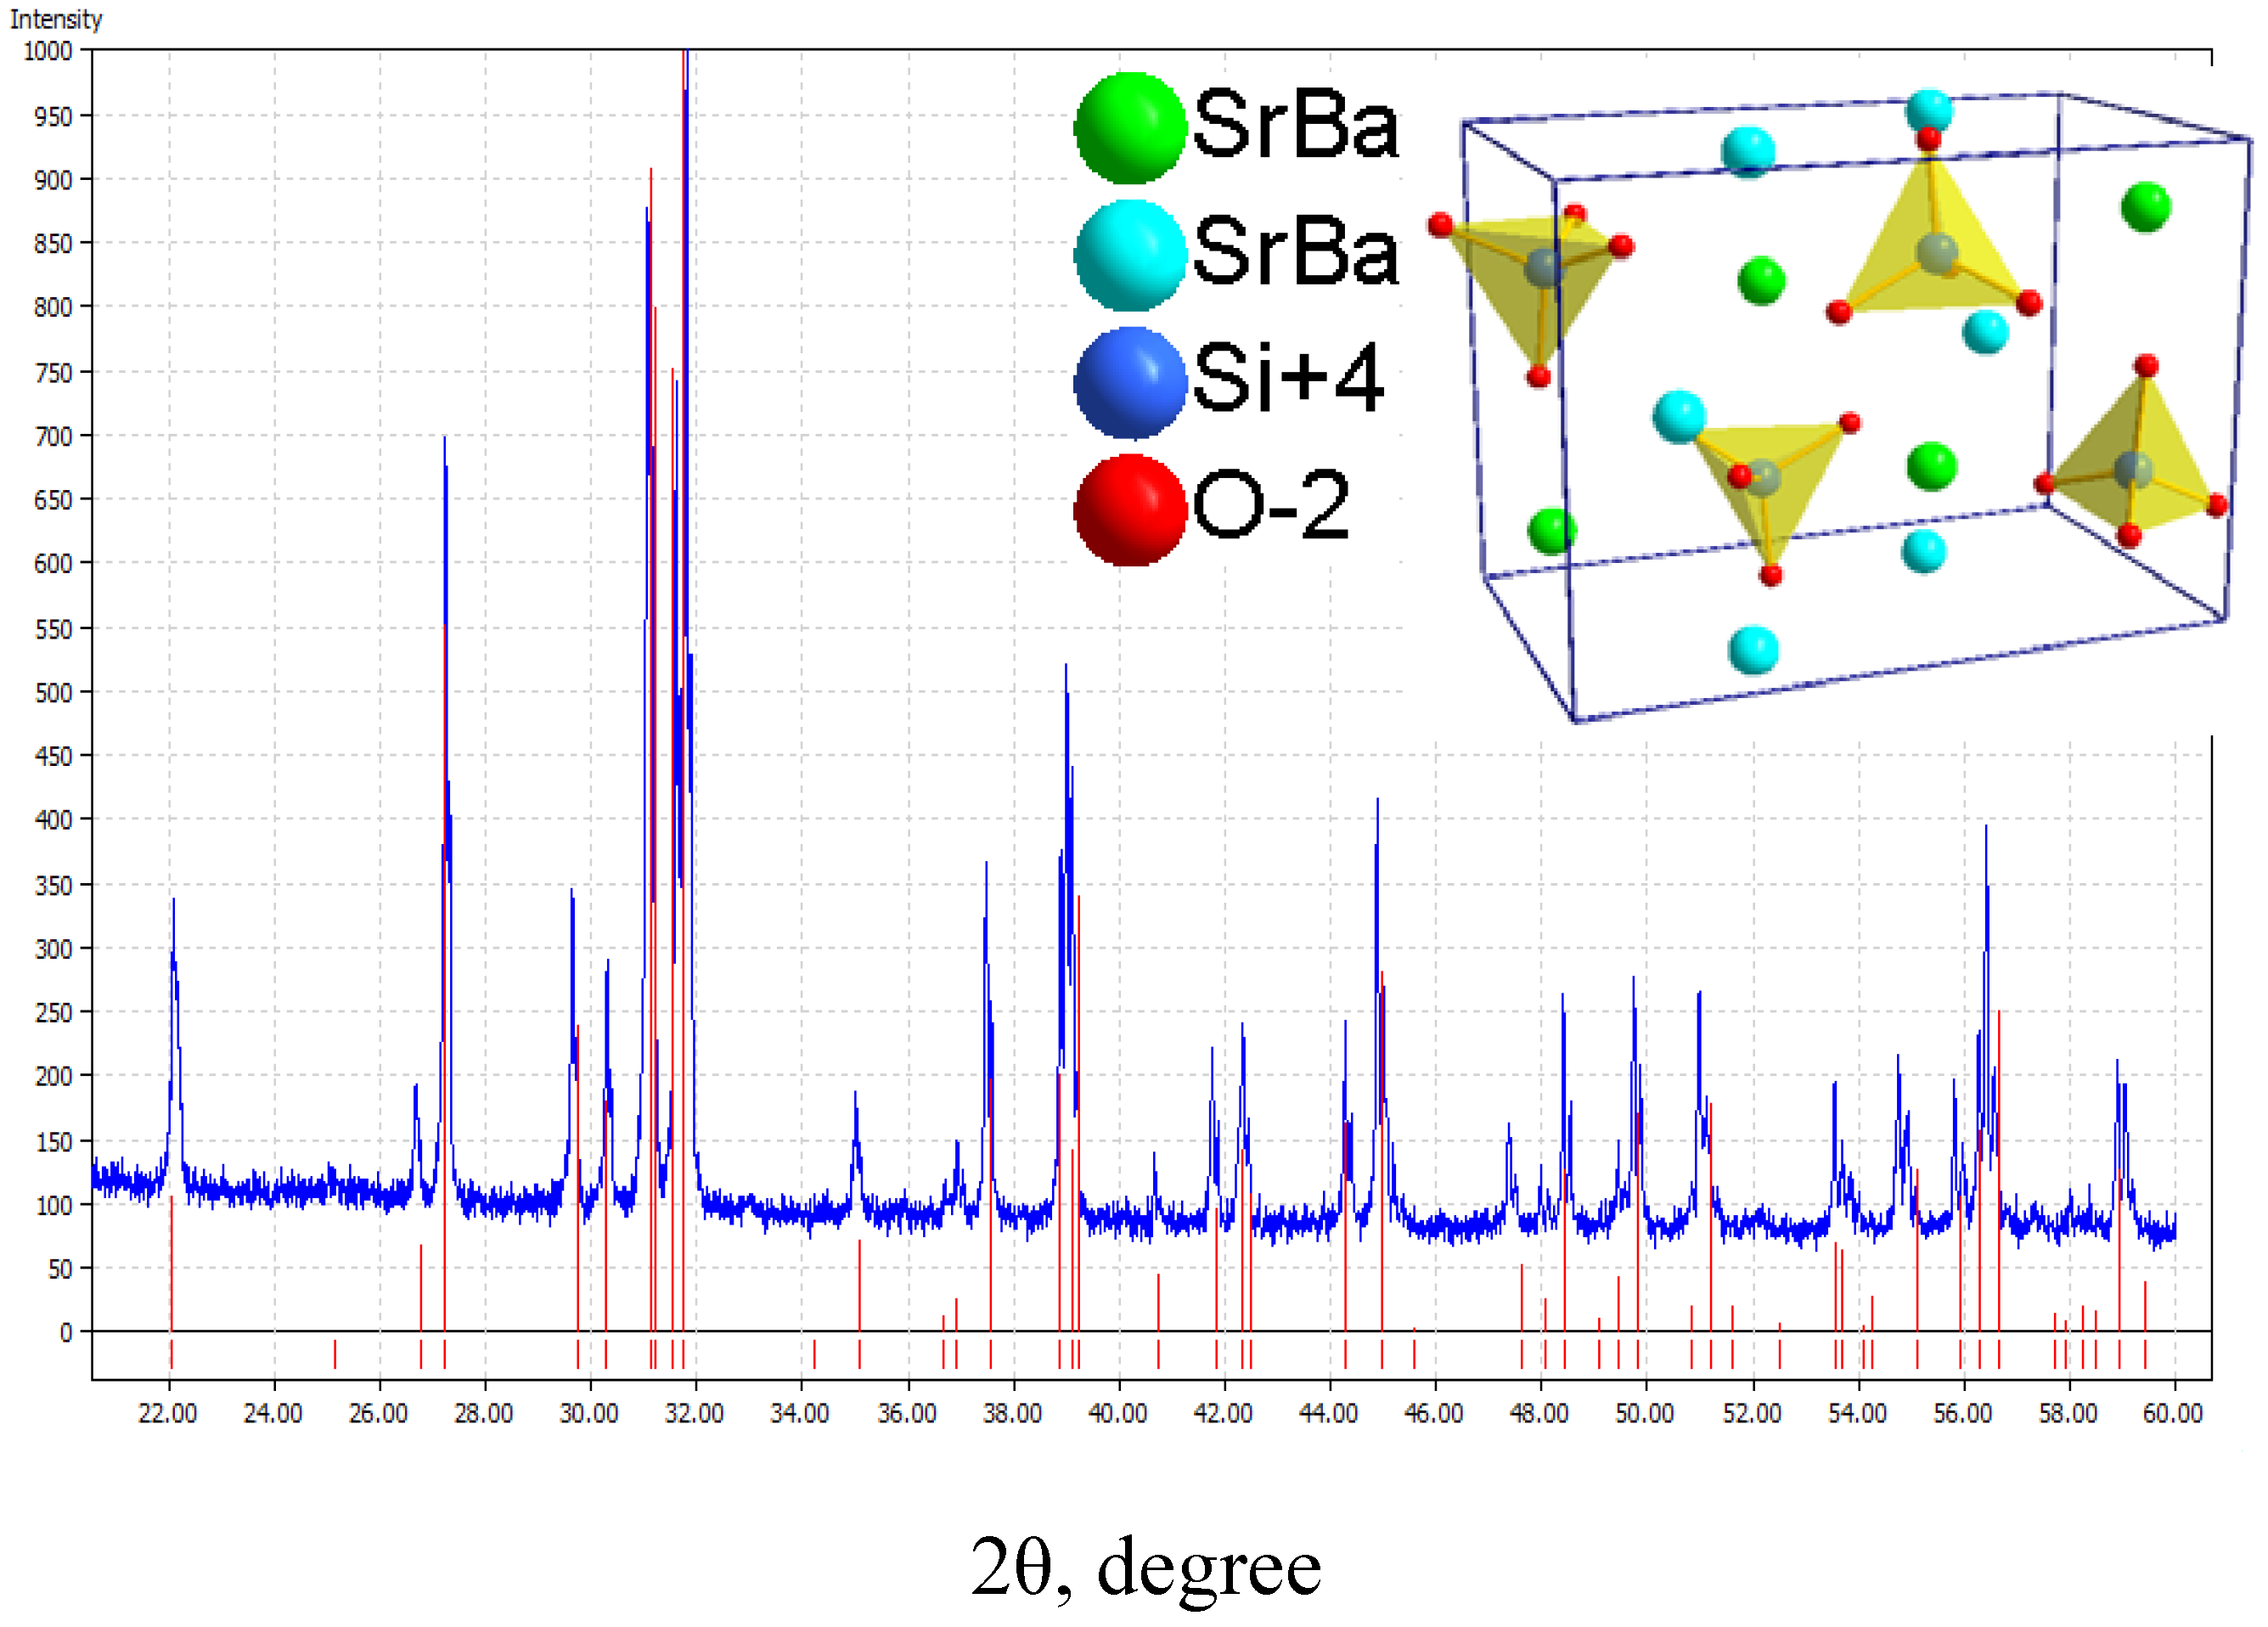
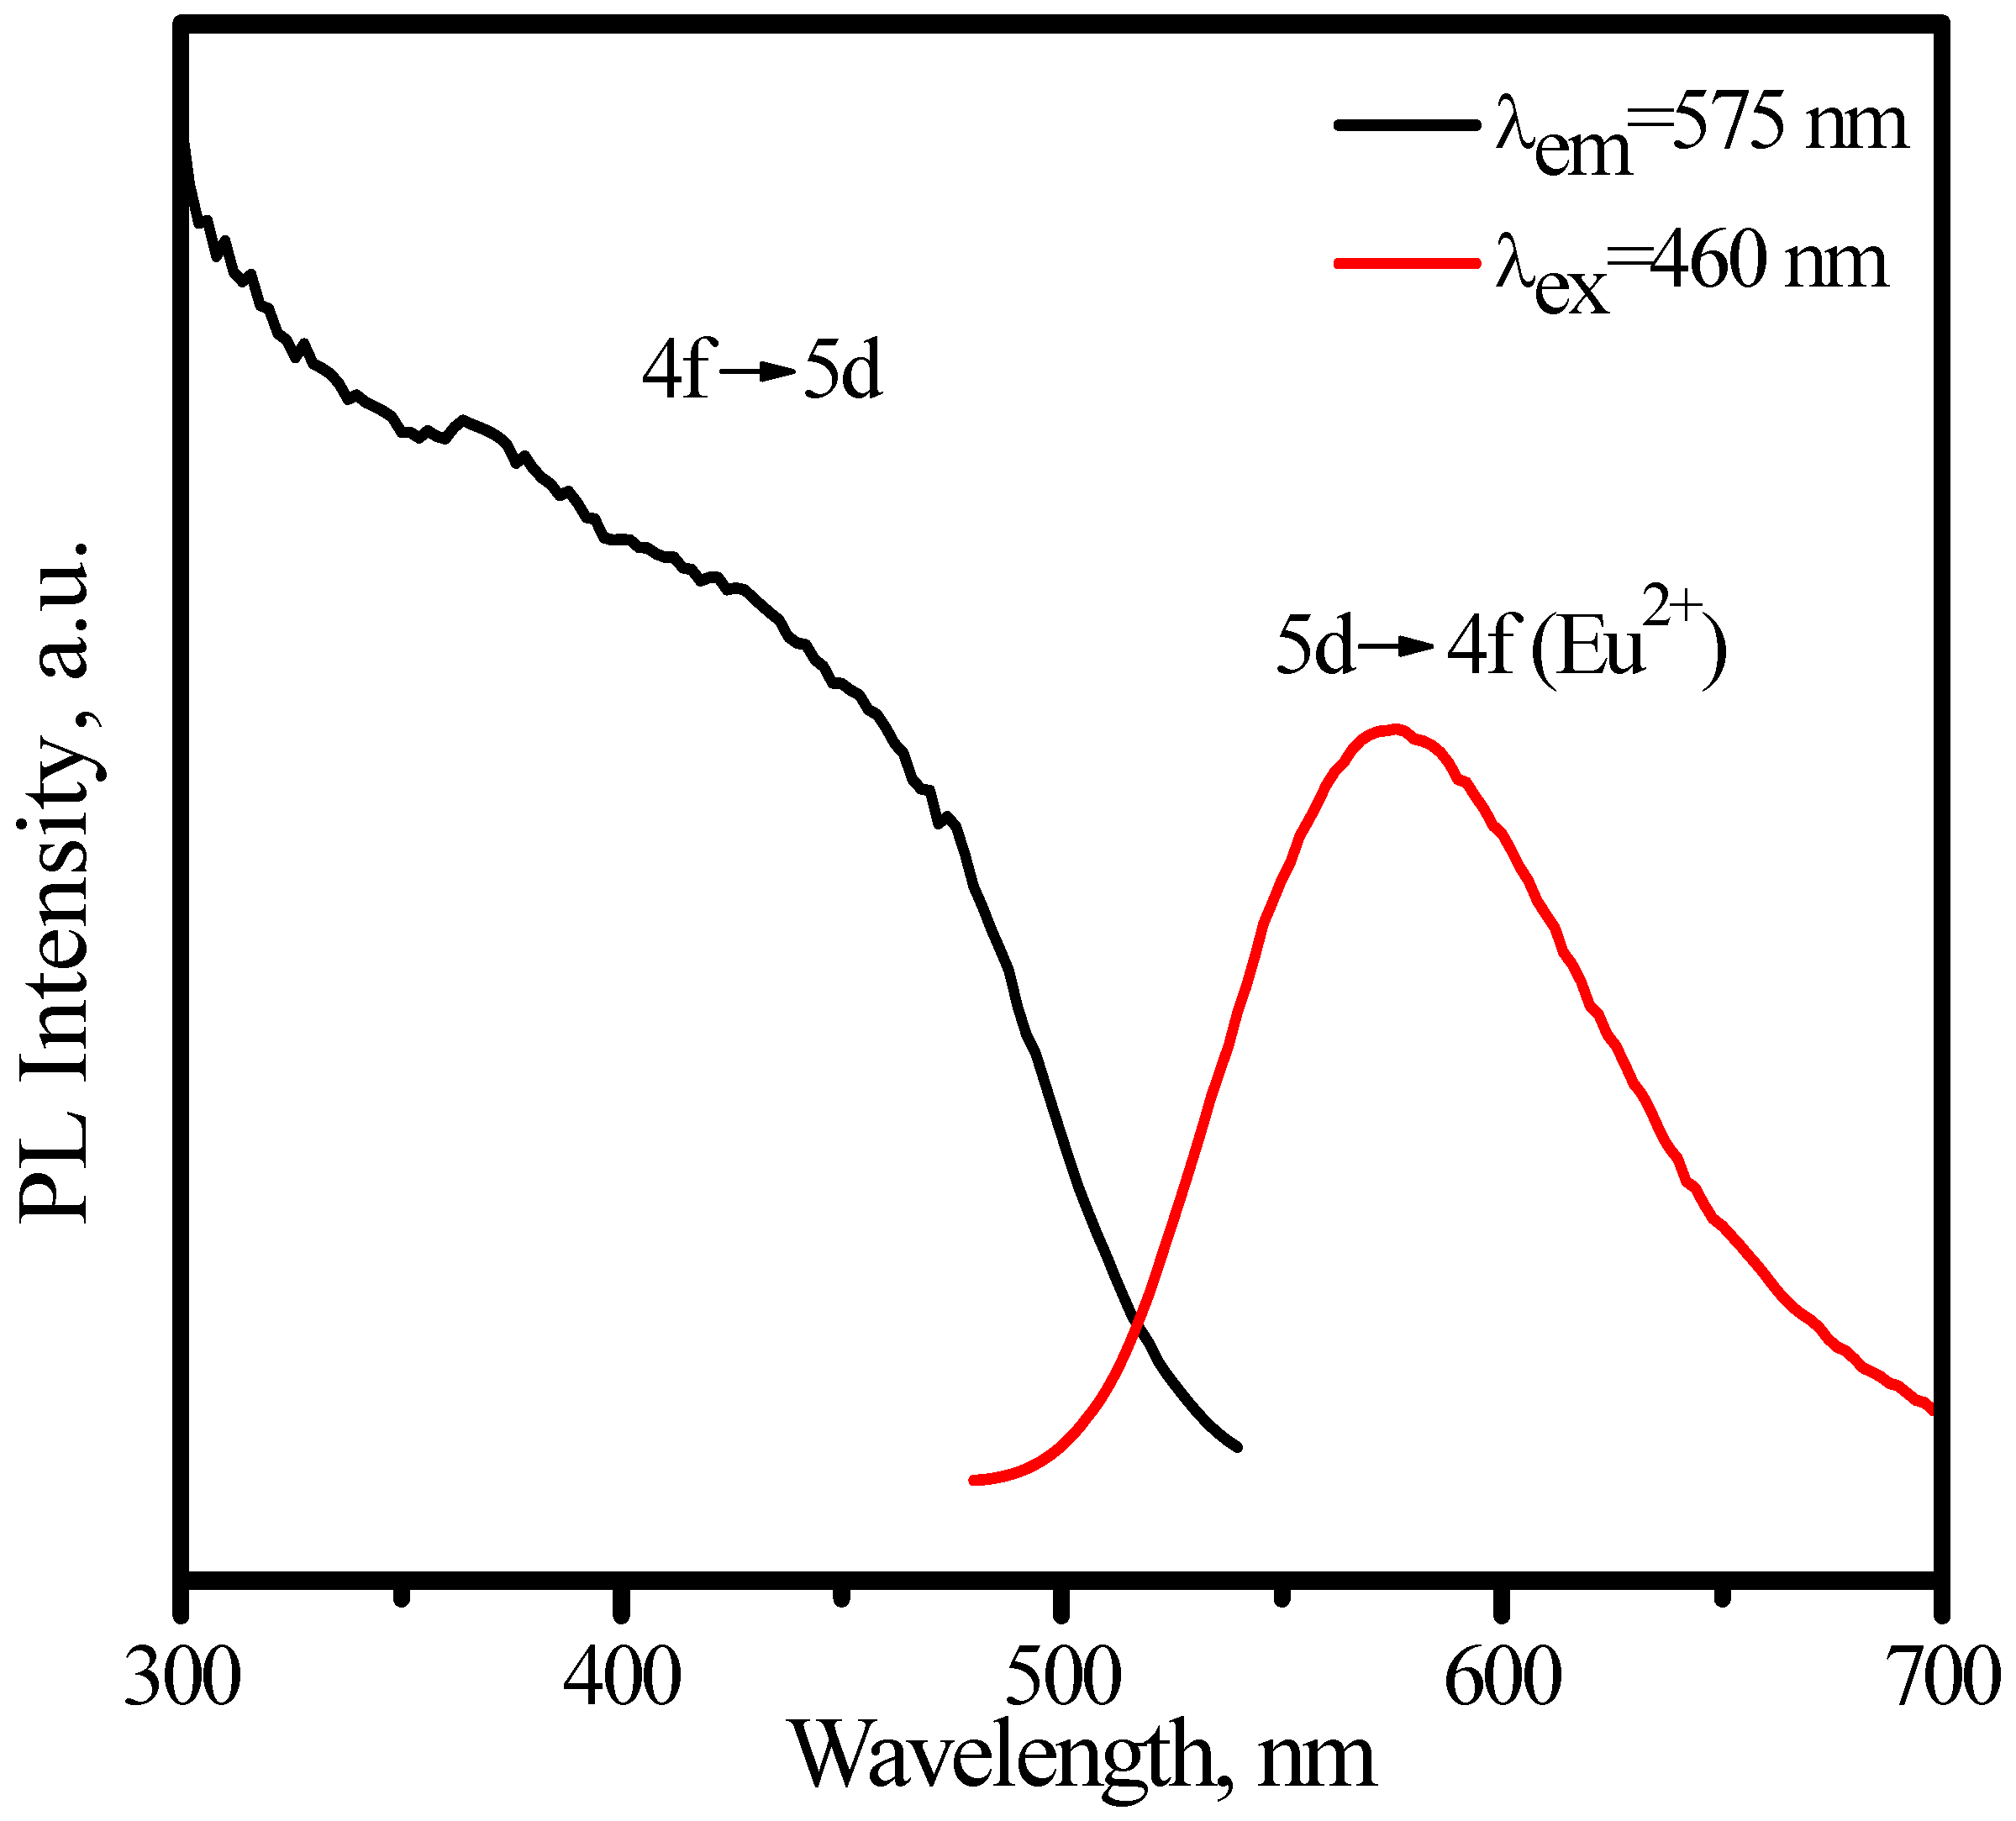
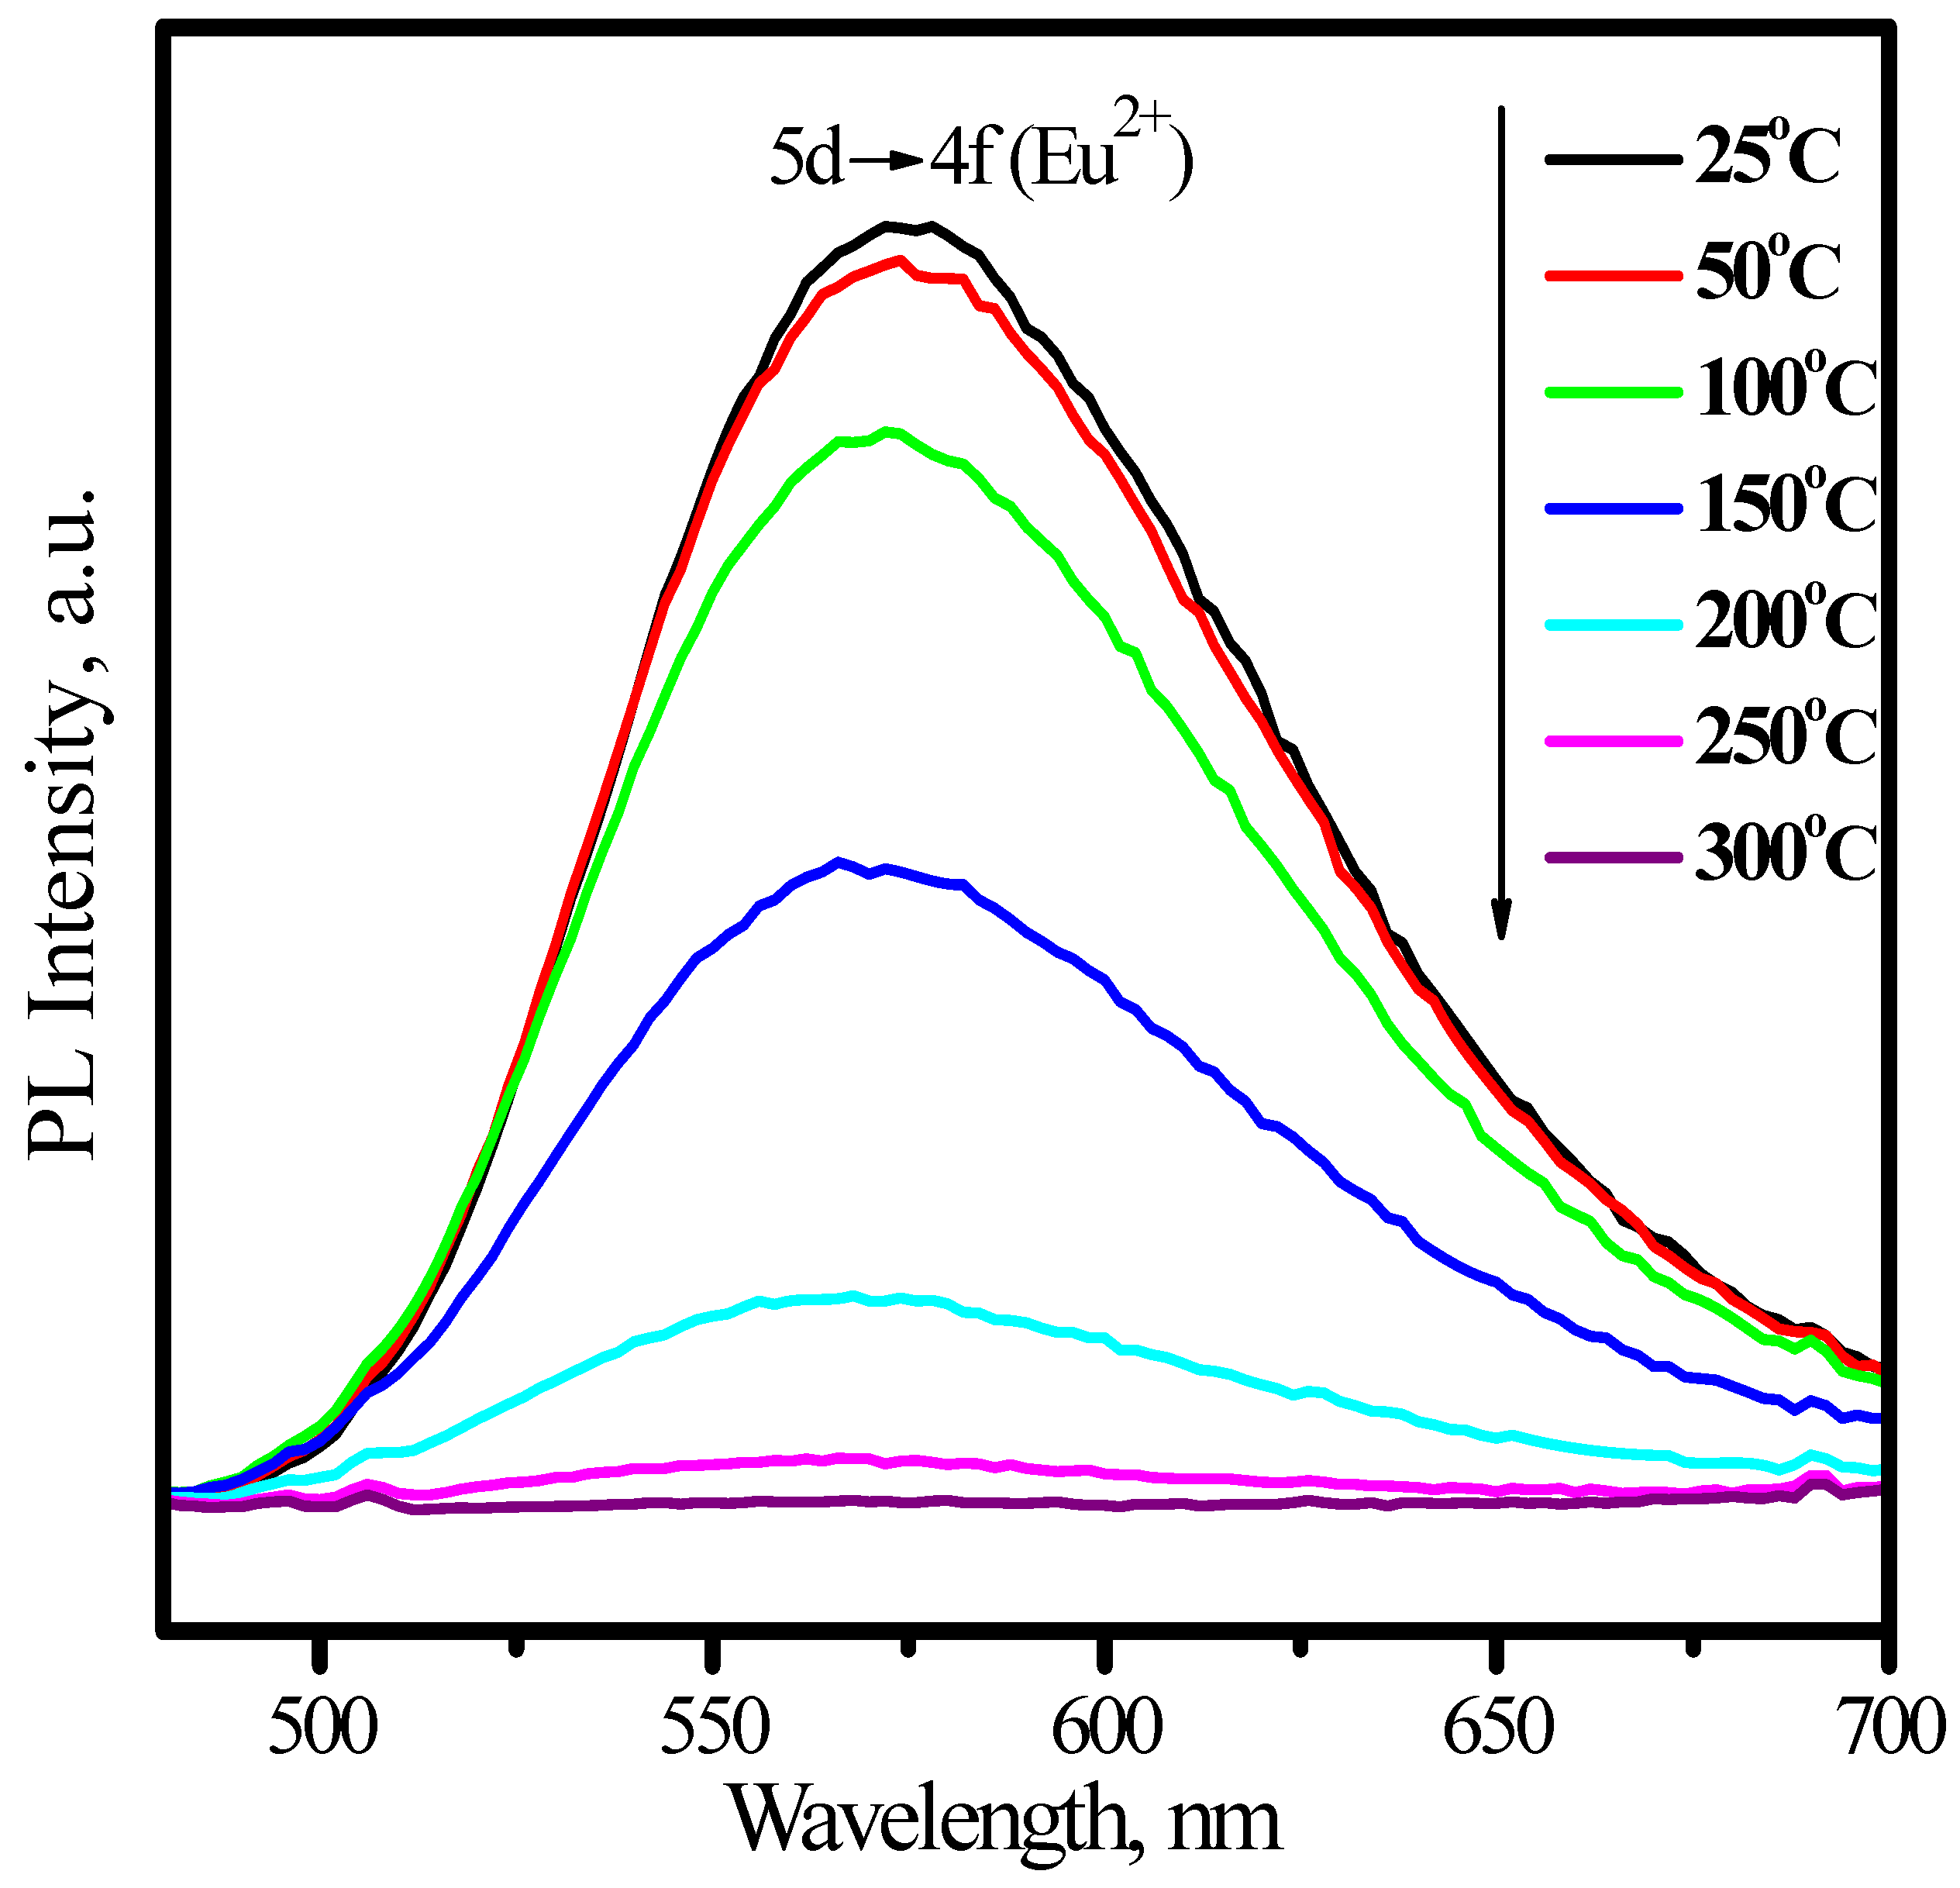
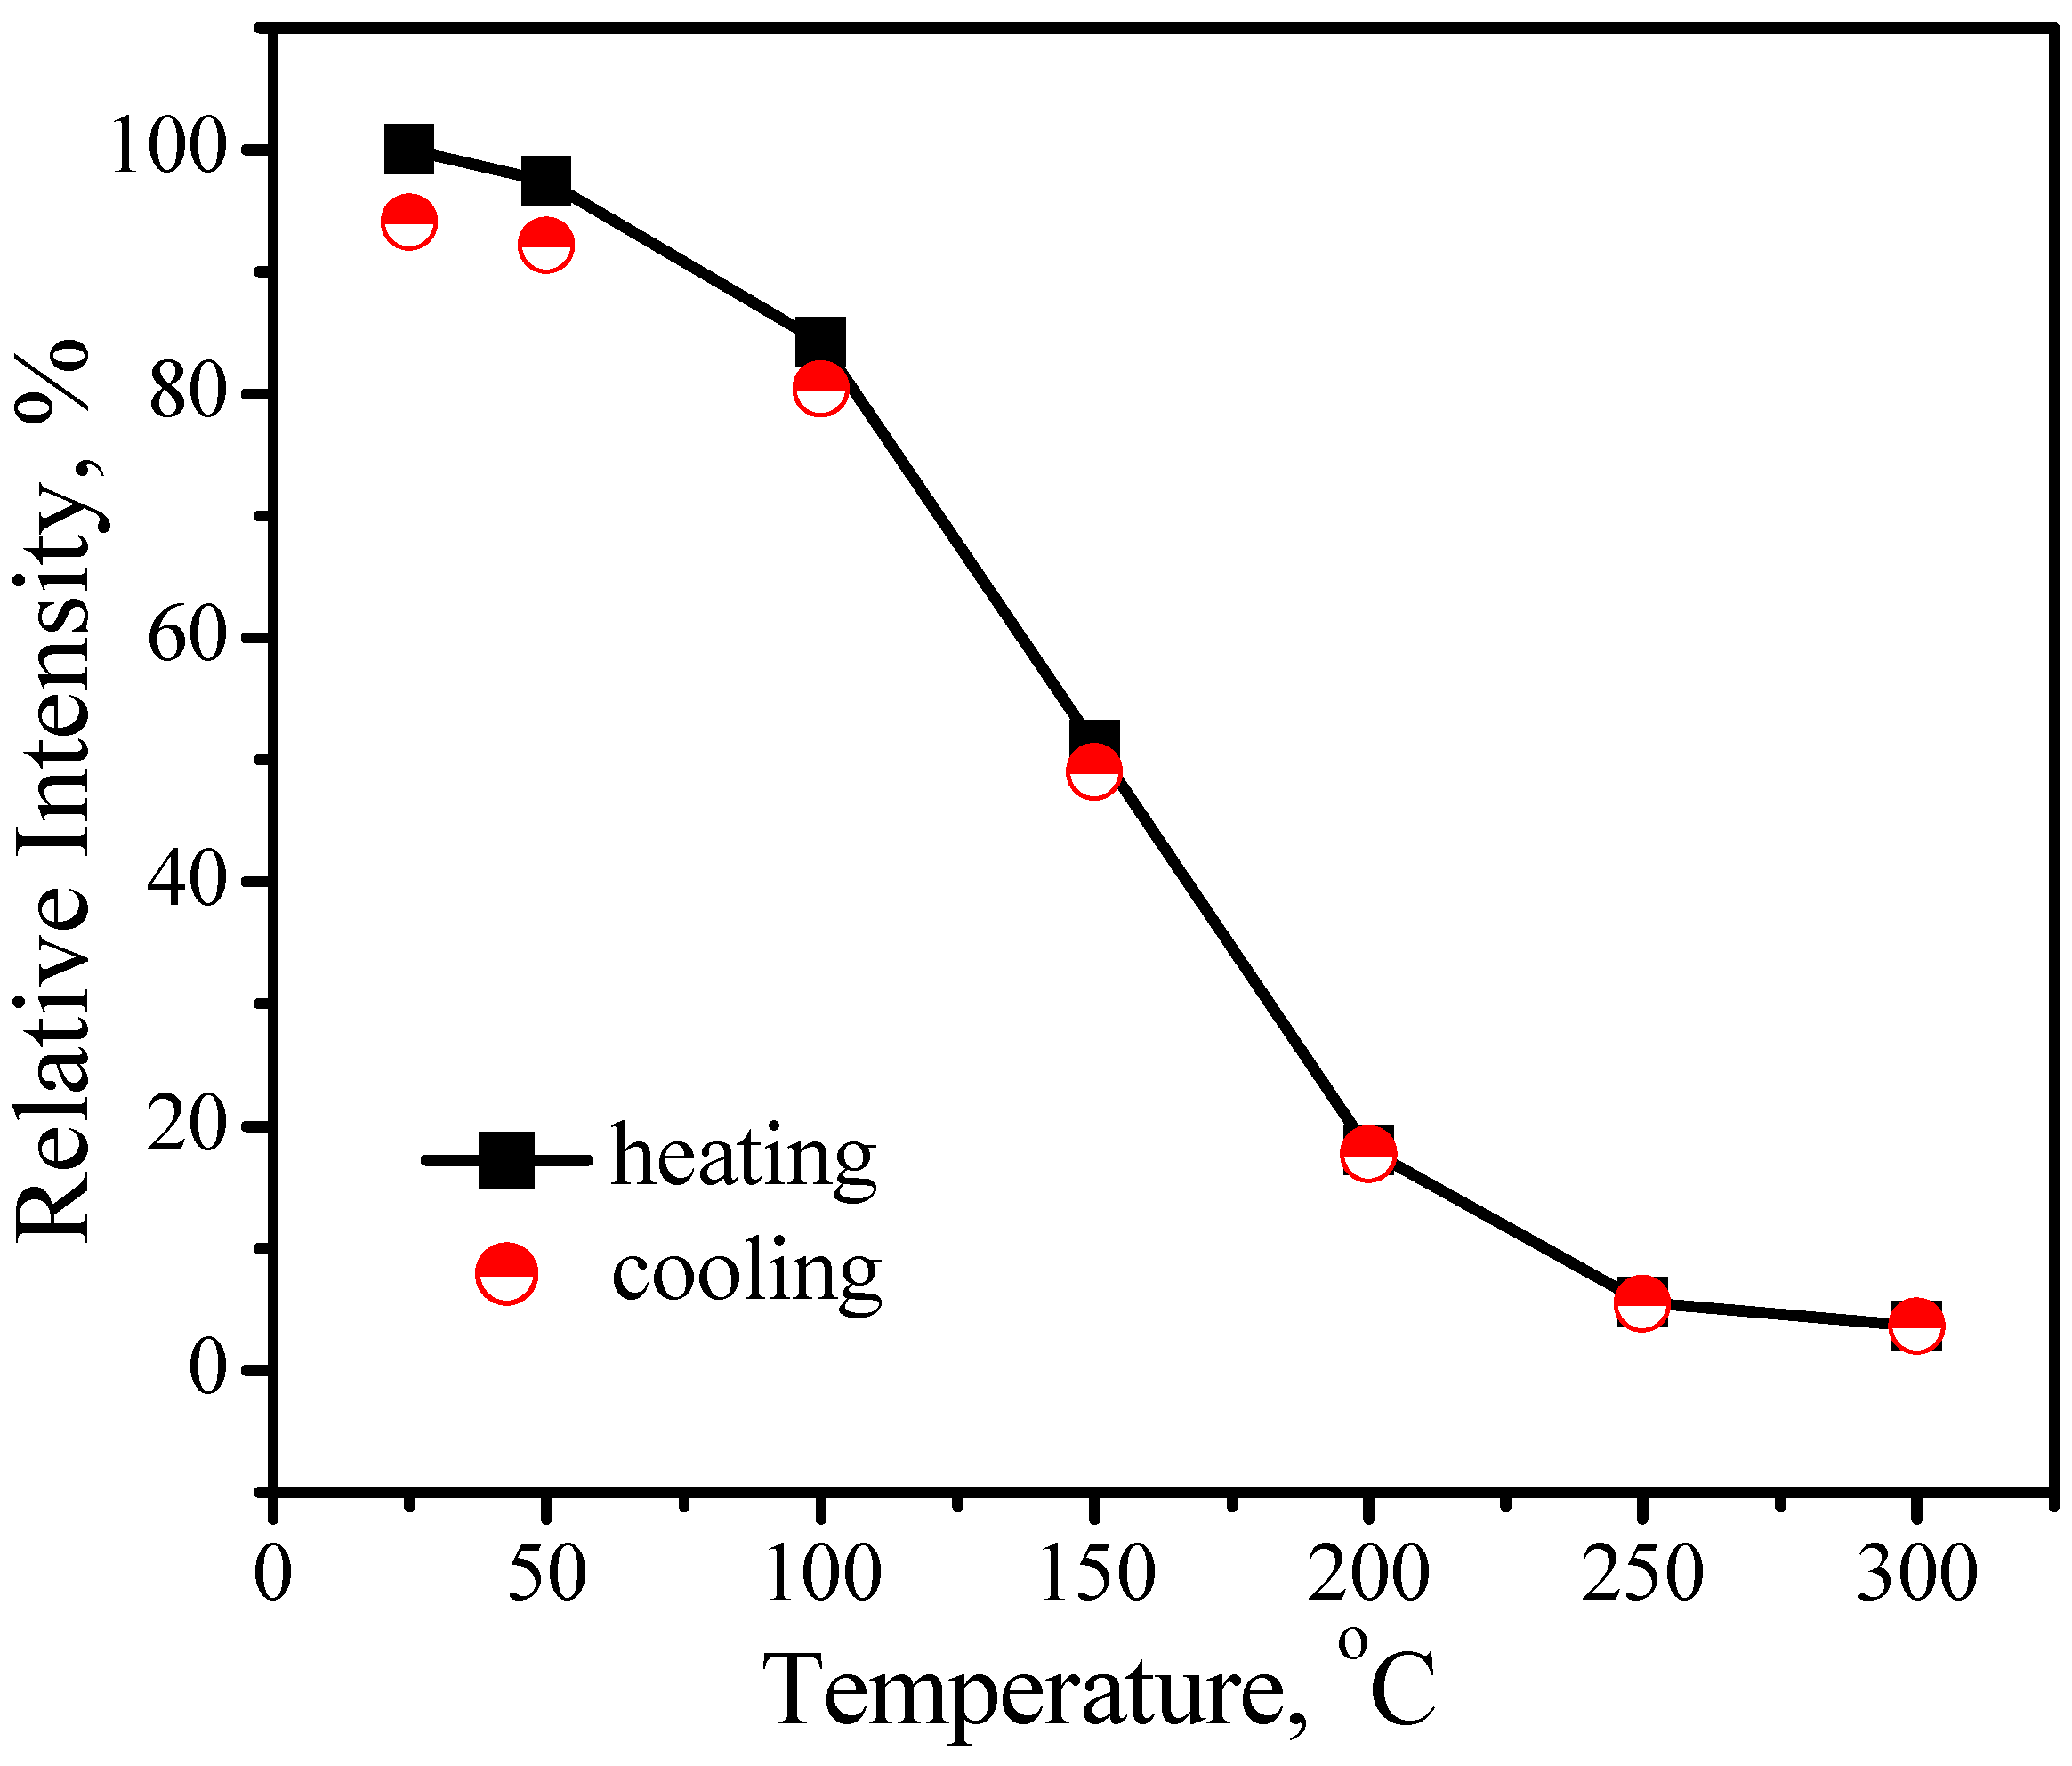
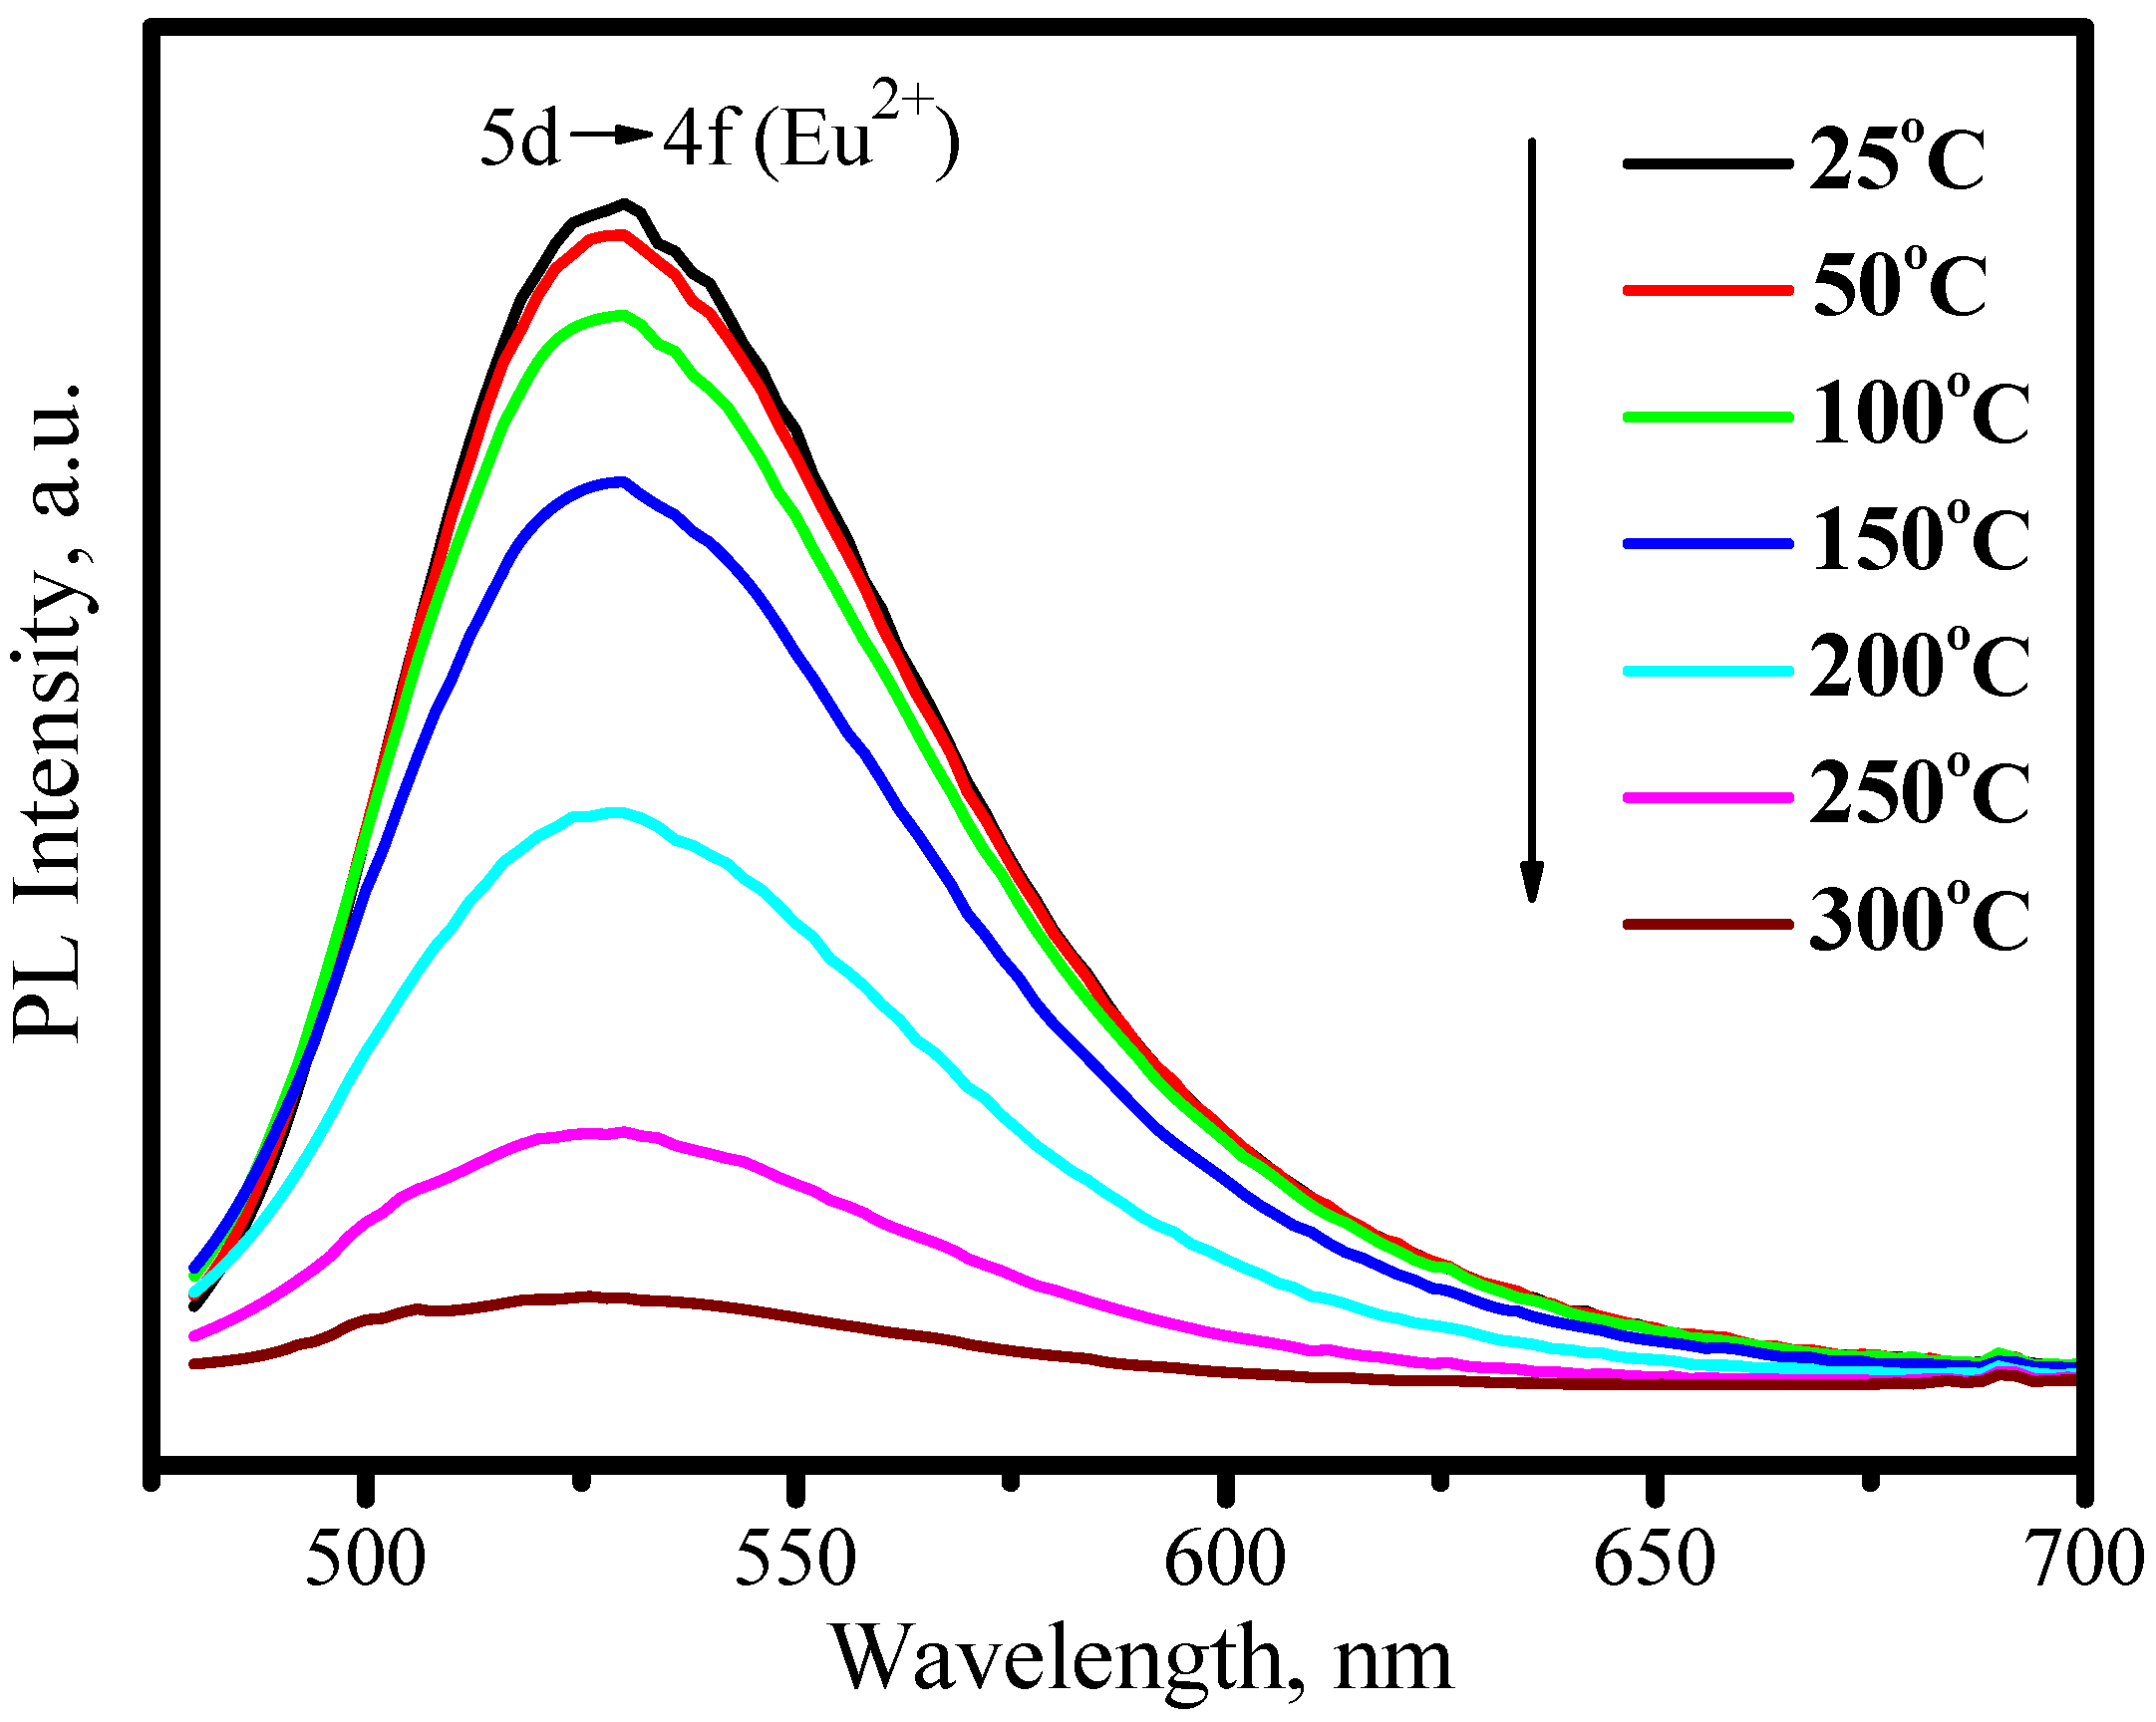
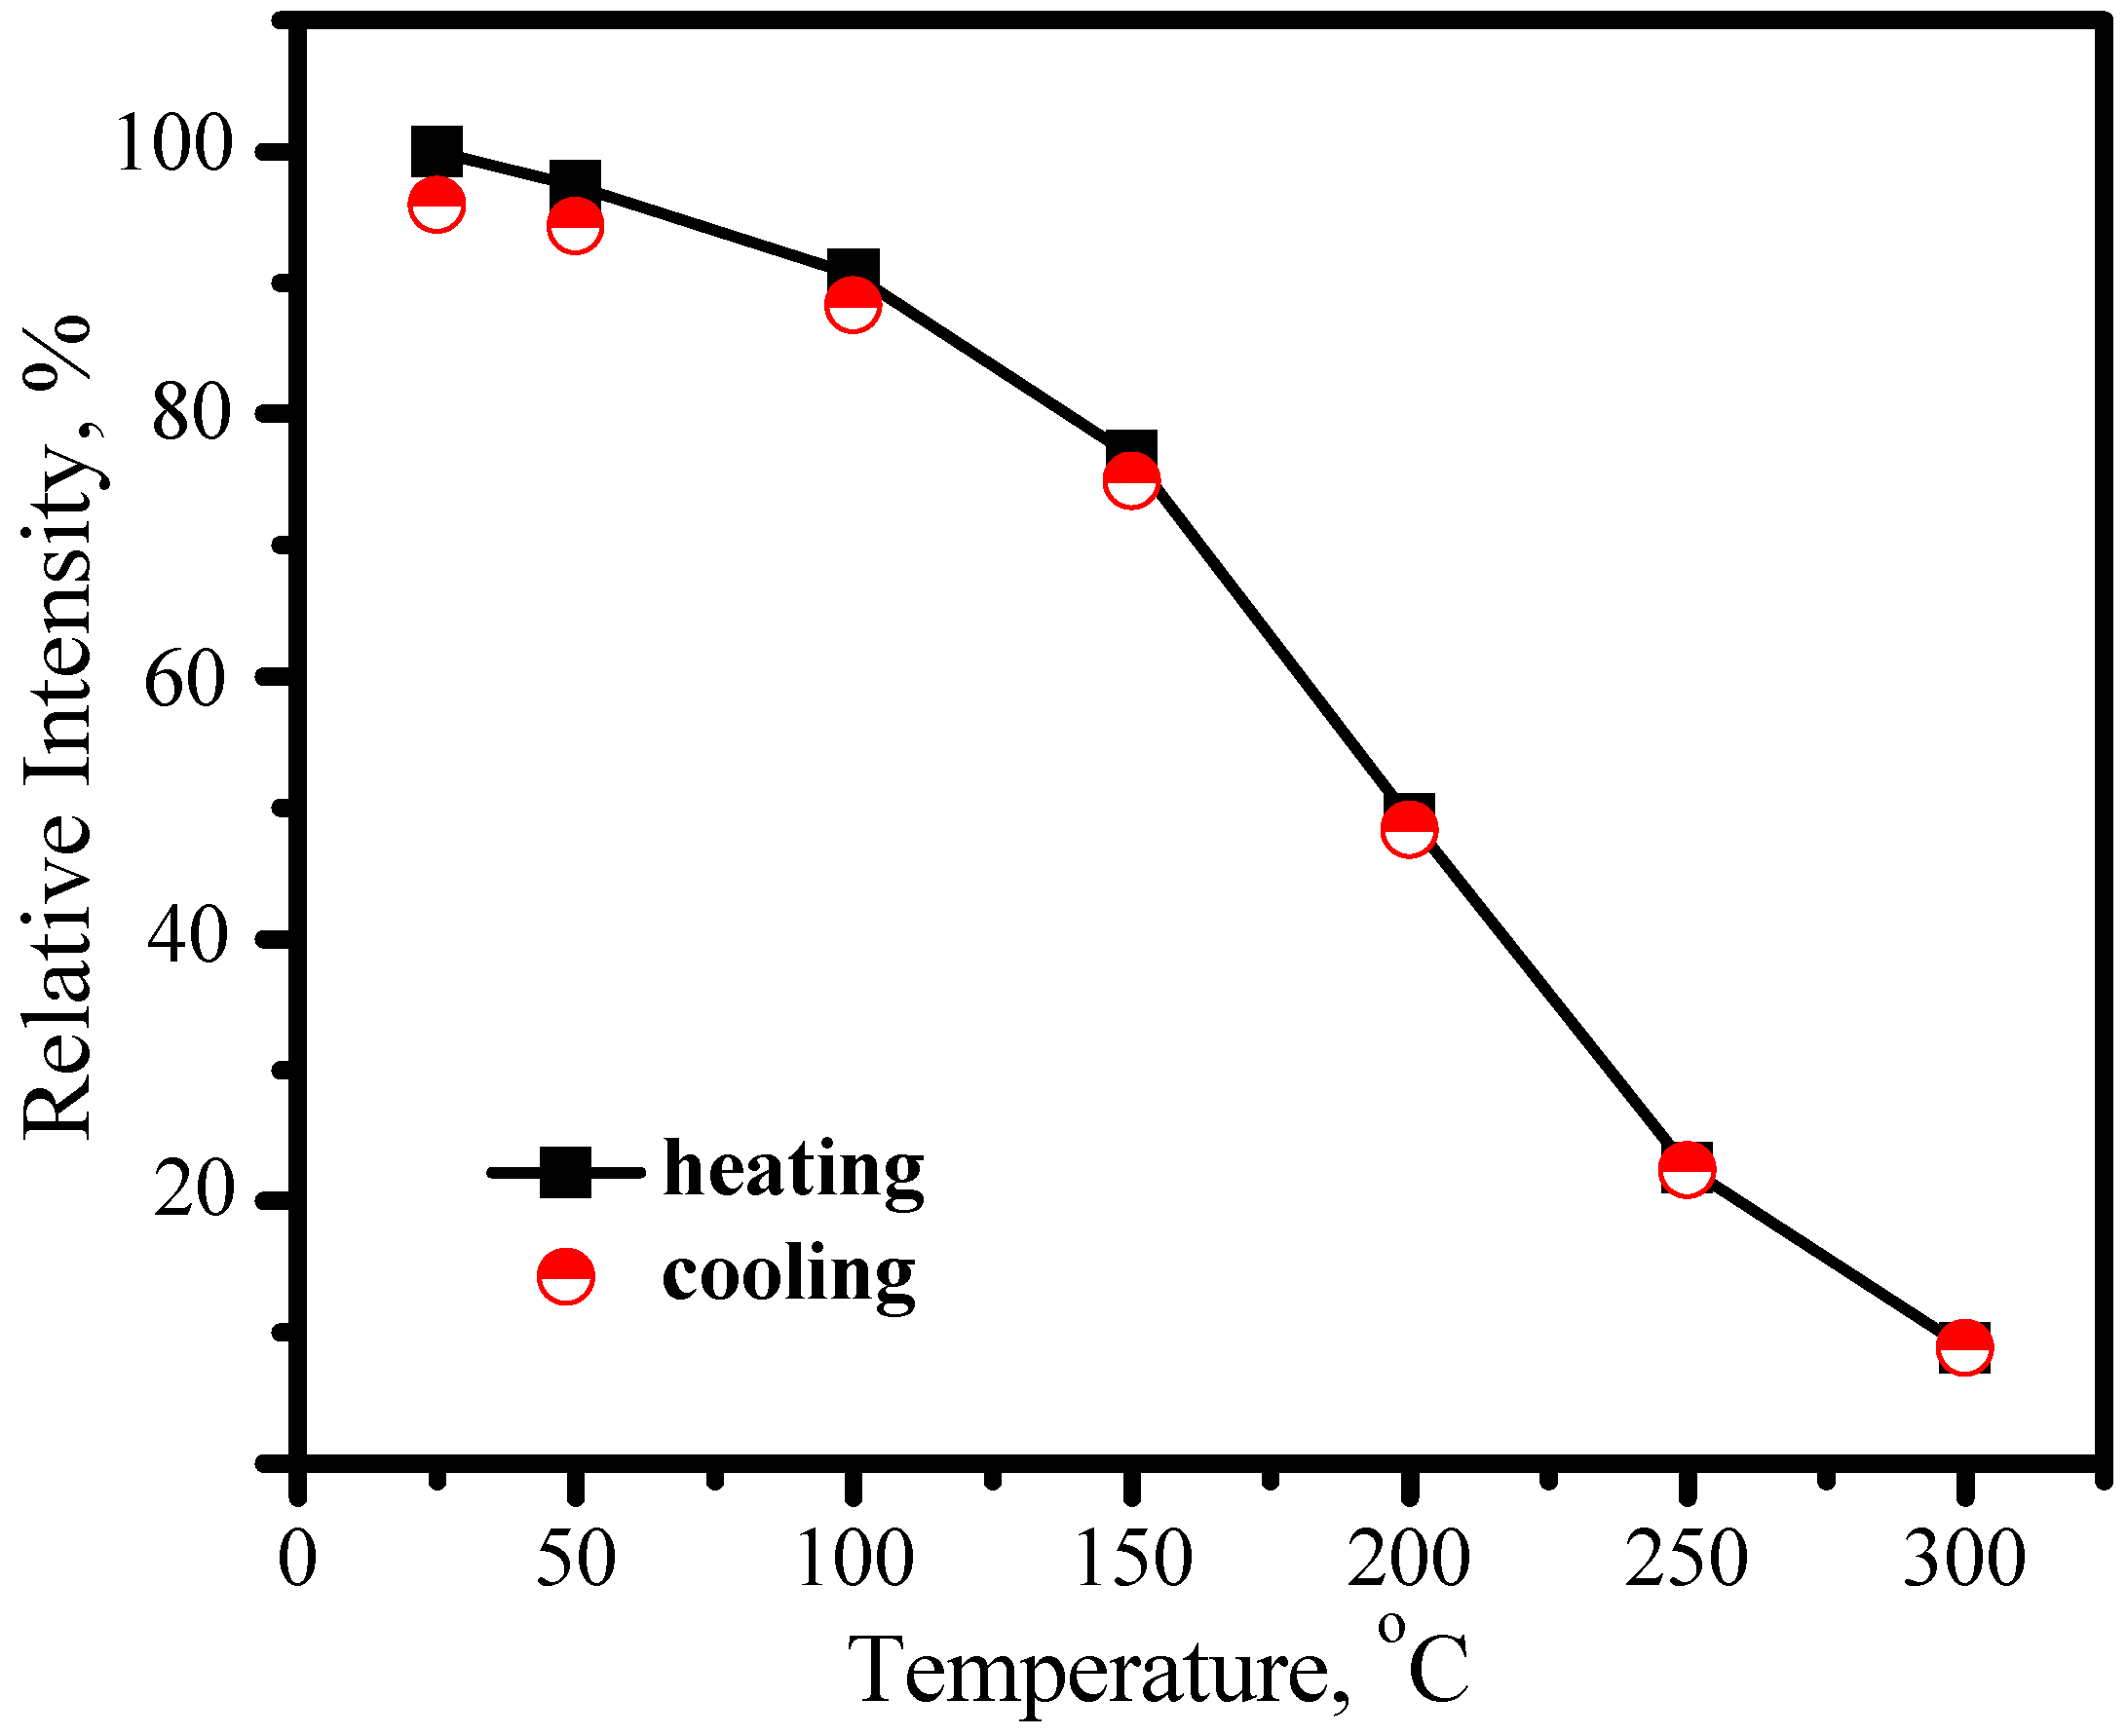
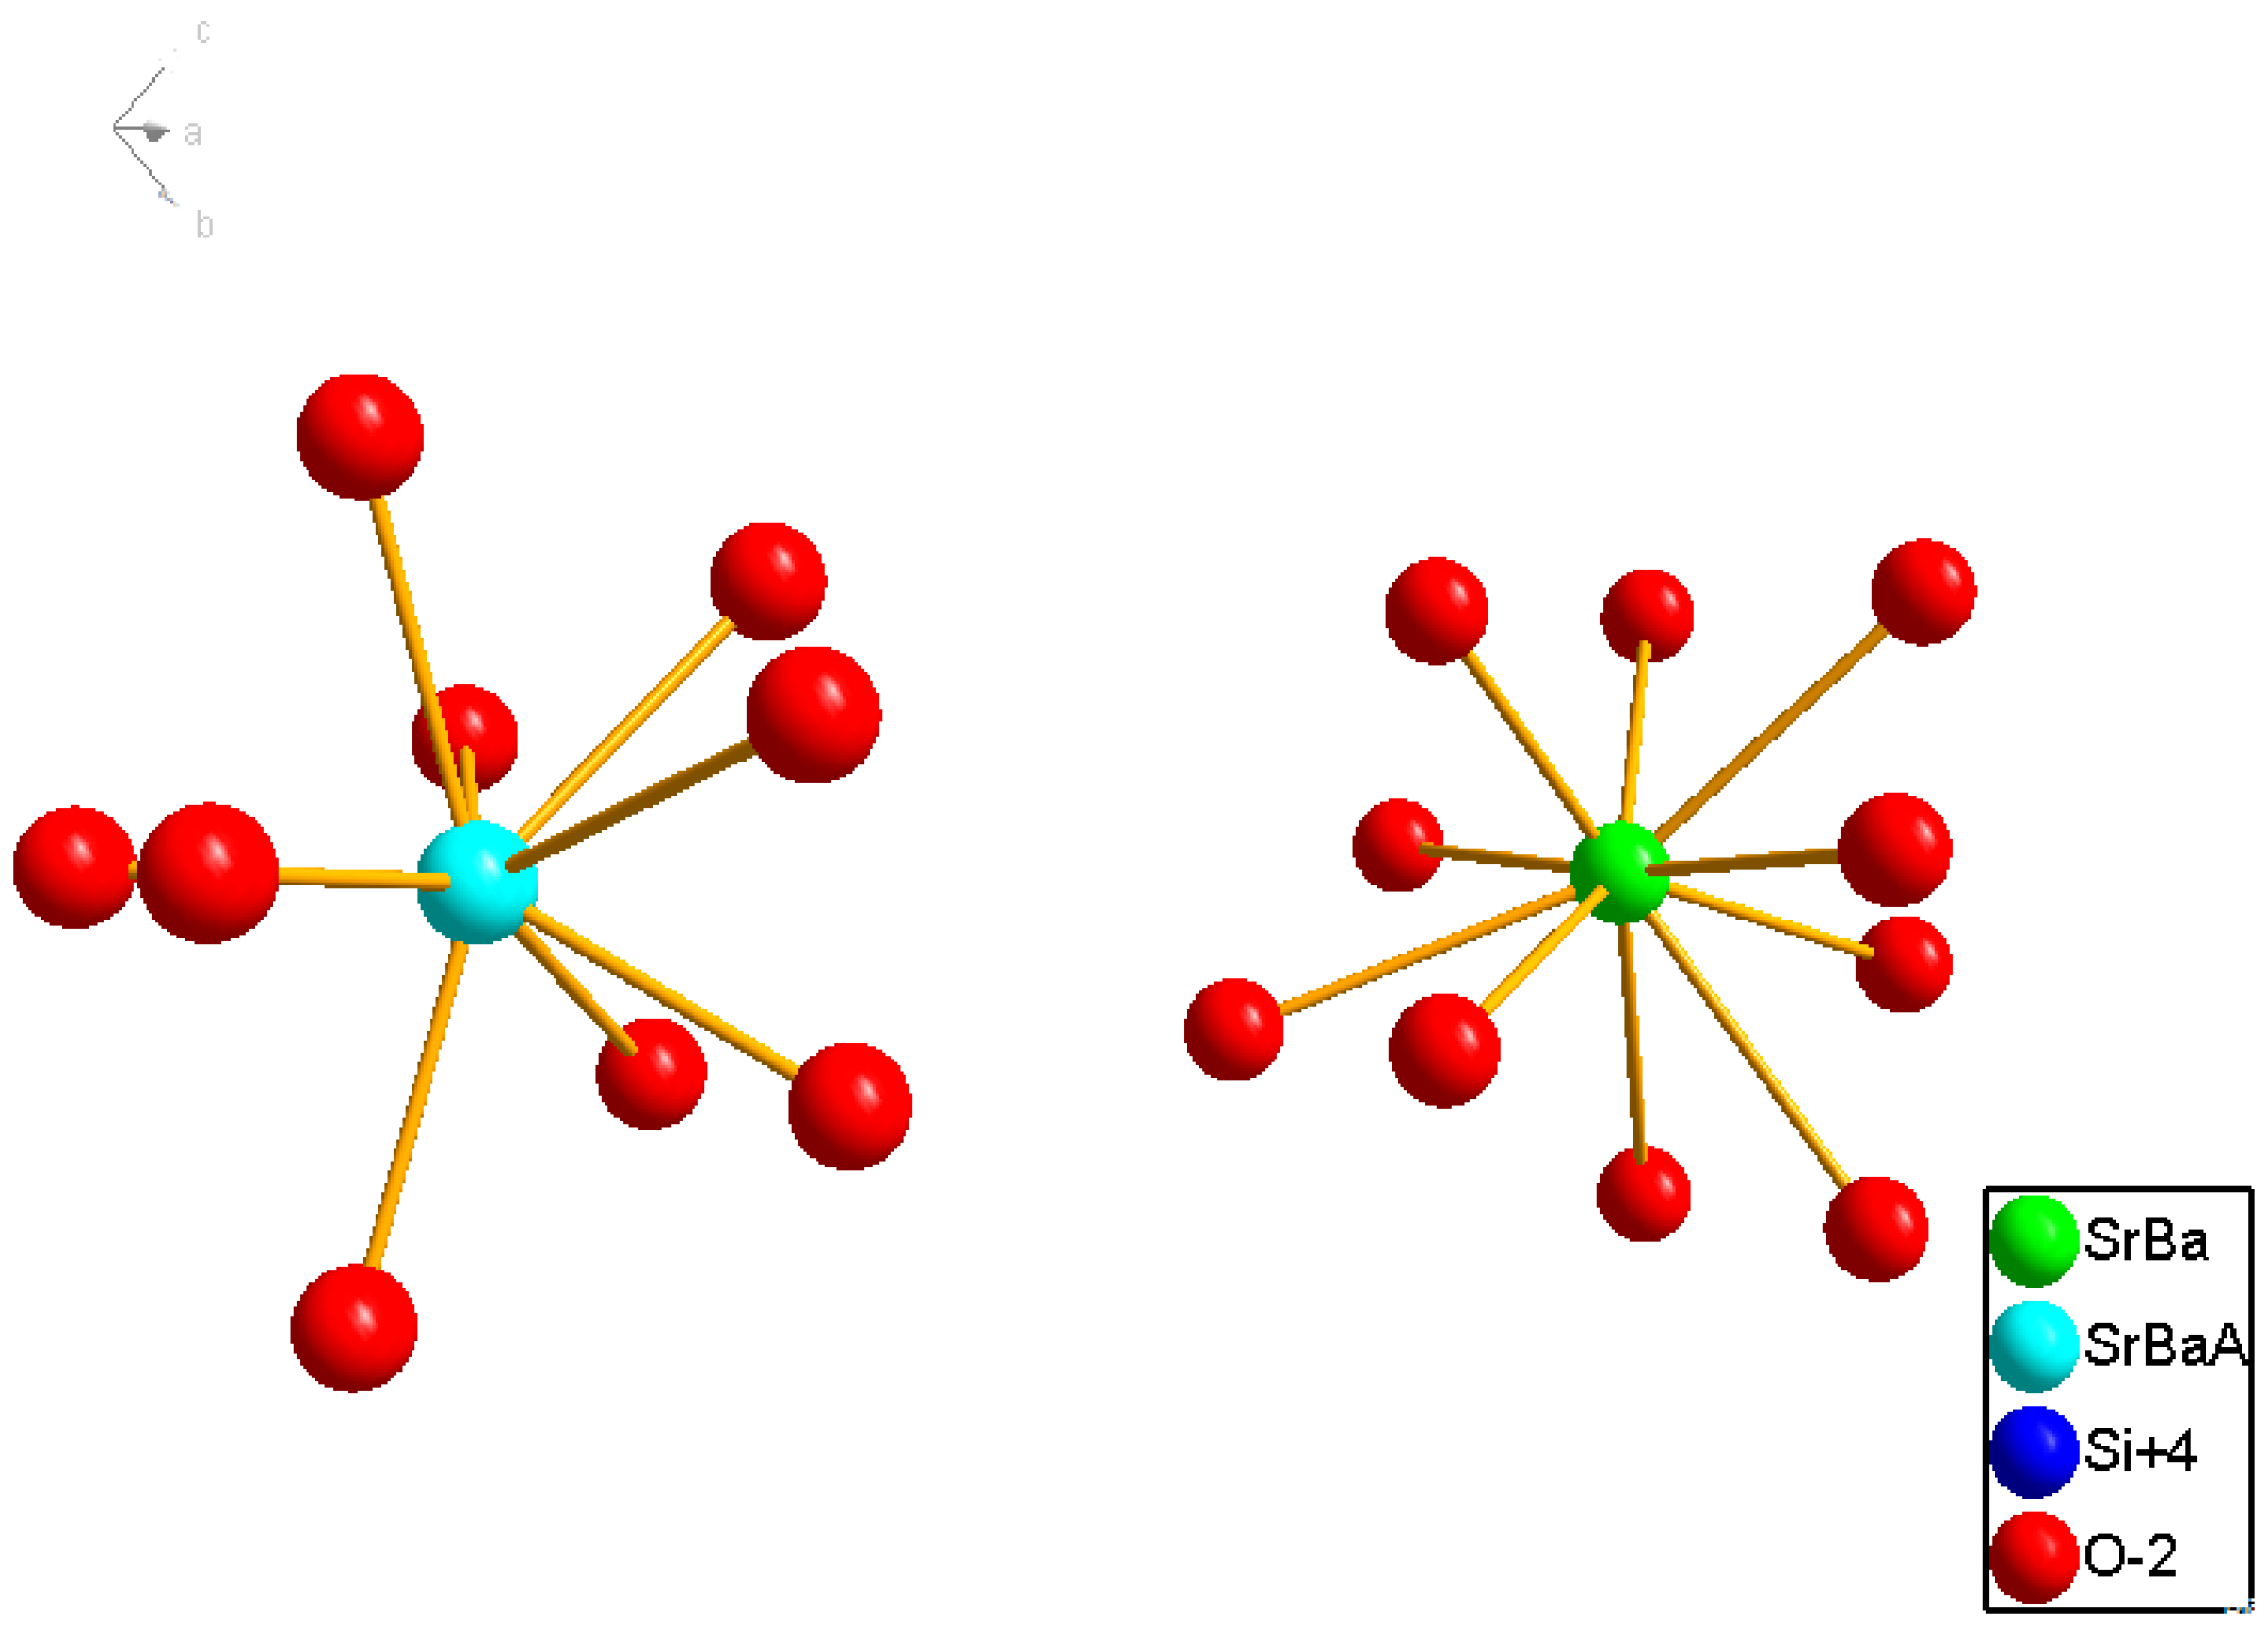
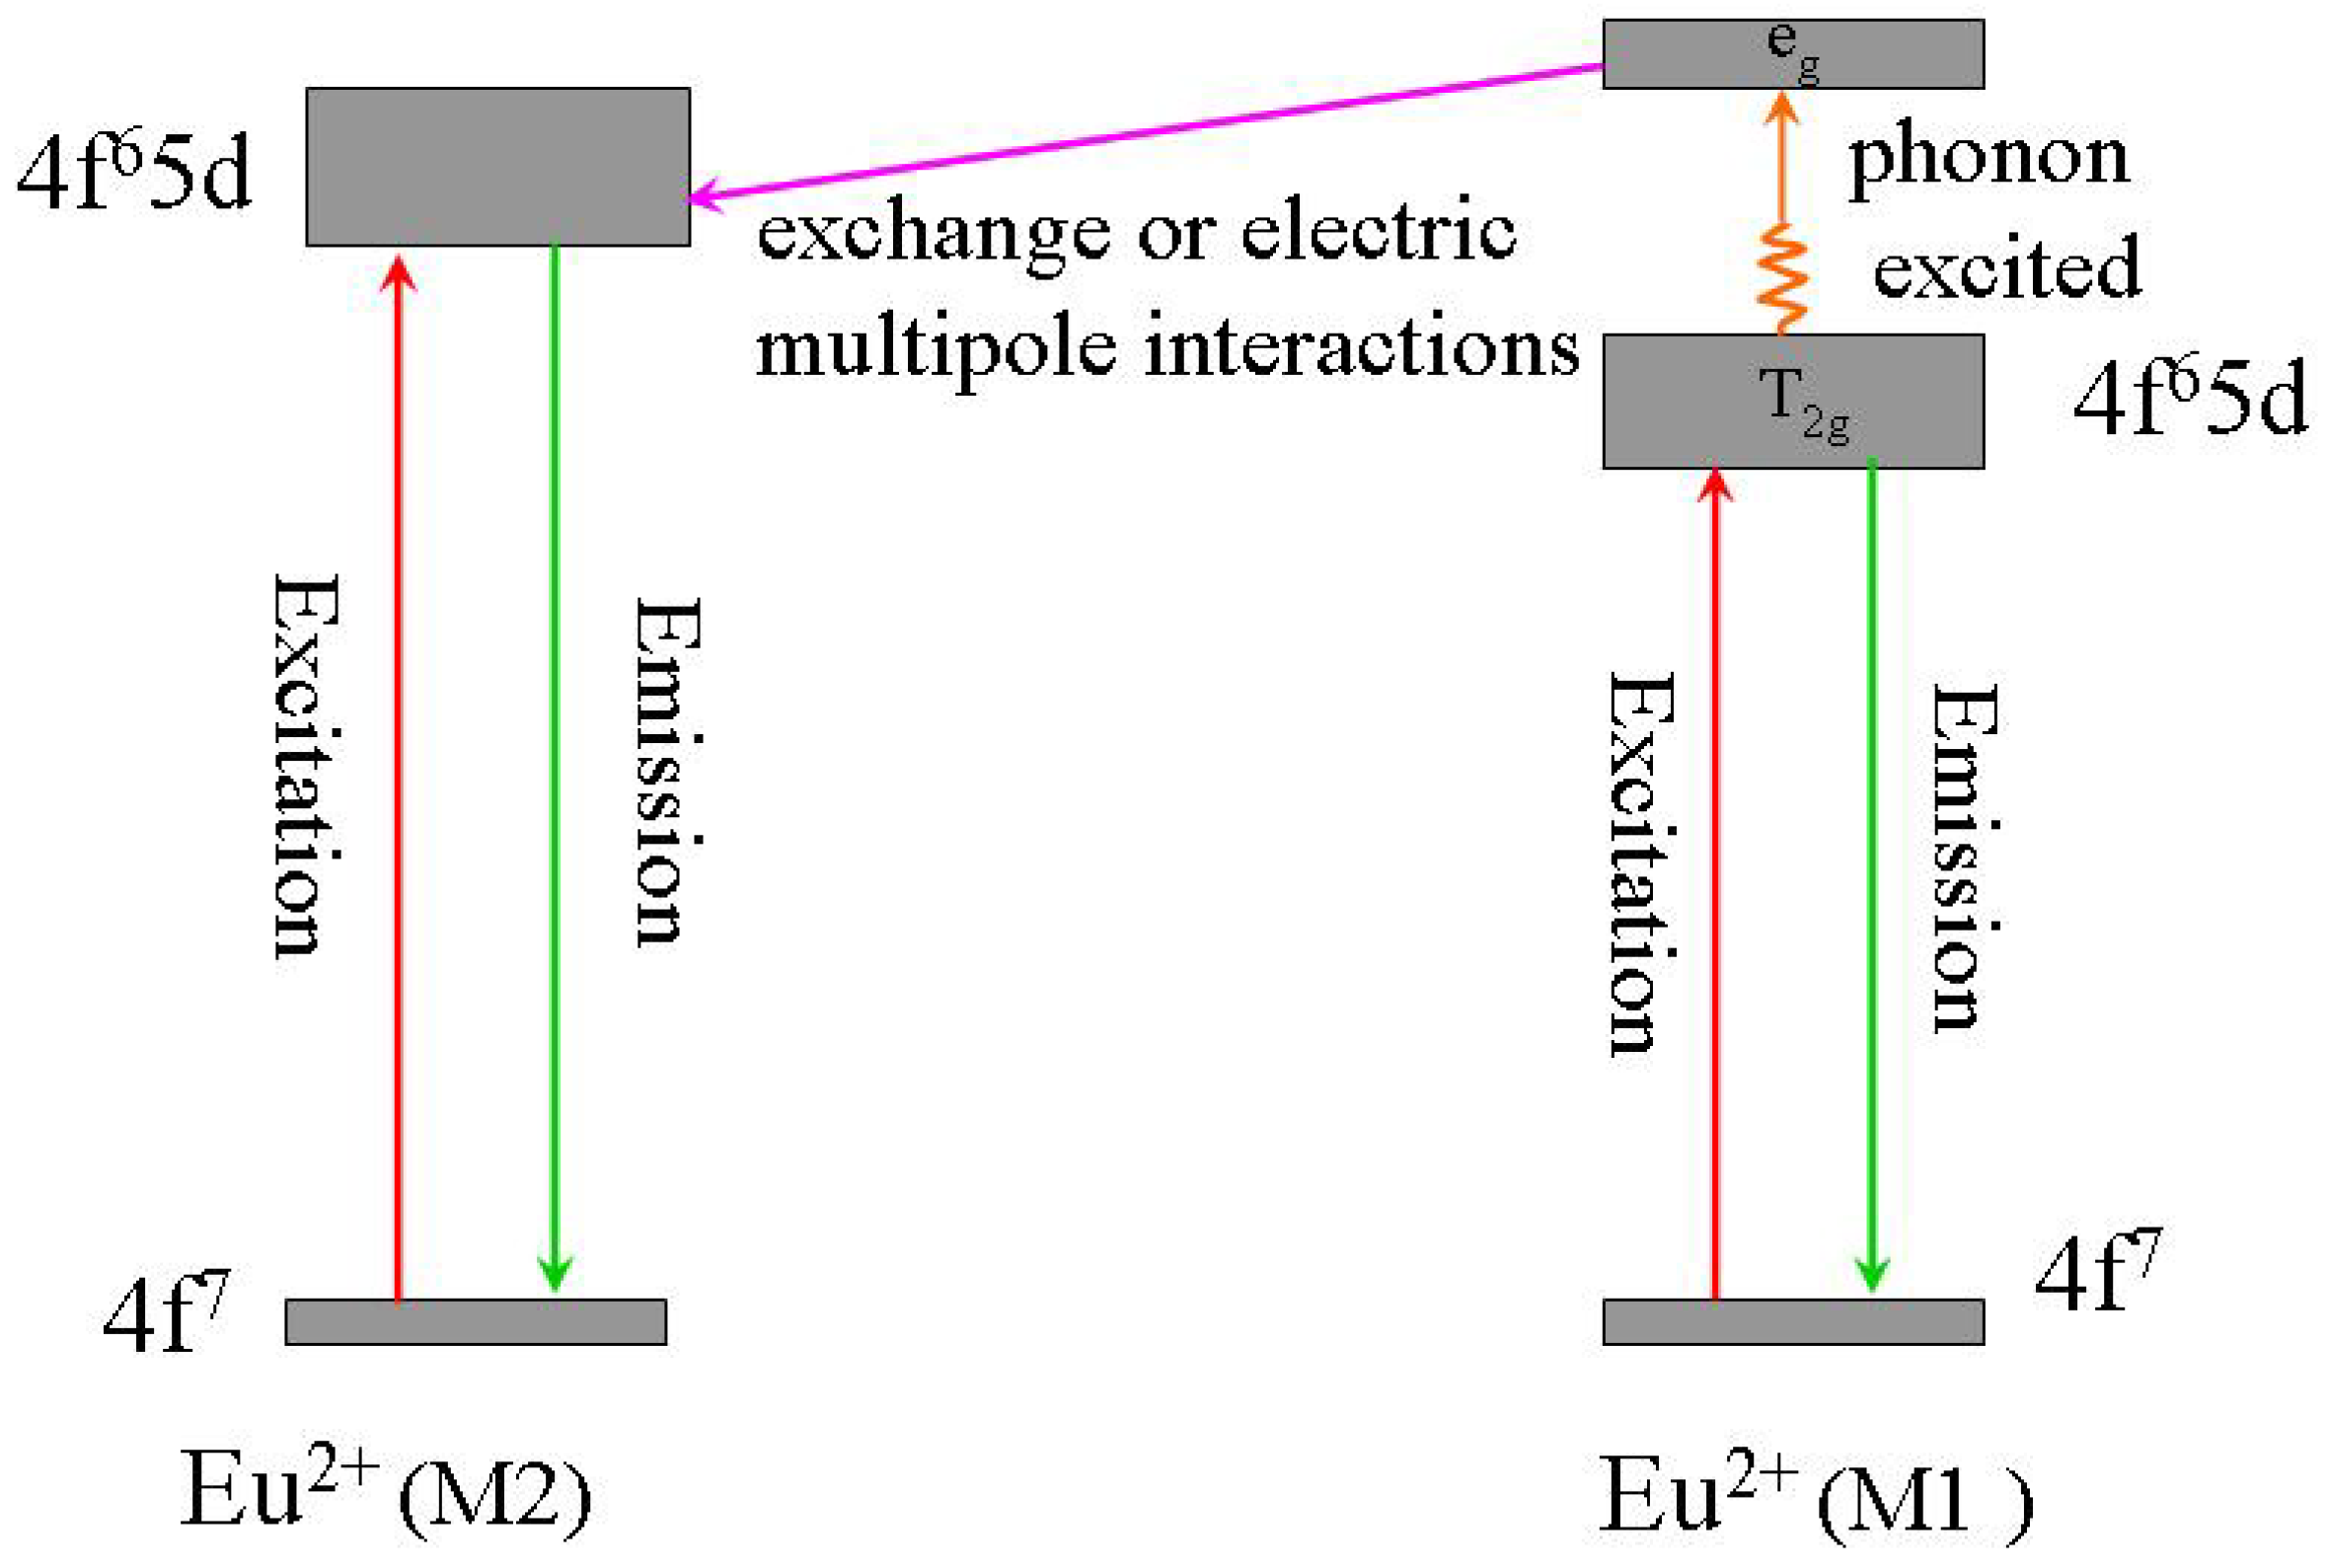
3.1.2. (Sr,Ba)SiO4:Eu2+

Besides YAG:Ce3+, another promising yellow phosphor for LEDs is (Sr1.7Ba0.2Eu0.1)SiO4. The XRD pattern, as shown in Figure 7, displays the same diffraction peaks as orthorhombic (Sr1.9Ba0.1)SiO4 (JCPDS card 76-1631). The red lines denote for the standard peaks of (Sr1.9Ba0.1)SiO4, and the blue line is the measured peaks. Therefore, the nominal composition of (Sr1.7Ba0.2Eu0.1)SiO4 has the same crystal structure with (Sr1.9Ba0.1)SiO4 [19]. As the inset presented in Figure 7, there two types of sites for Sr2+ and Ba2+ ions in (Sr1.9Ba0.1)SiO4 crystal lattice, in which Sr2+ and Ba2+ occupy the same kind of site for with the same valence and nearly radius. The coordination number of the two type of Sr2+ or Ba2+ sites are 9 and 10, as shown in Figure 8.
Figure 7. The XRD pattern of (Sr1.7Ba0.2Eu0.1)SiO4.
Materials 03 02172 g007
Figure 8. Coordination circumstance for two different Sr2+/Ba2+ site in (Sr1.9Ba0.1)SiO4 crystal lattice.
Materials 03 02172 g008
Figure 9 presents the photoluminescence spectra of (Sr1.7Ba0.2Eu0.1)SiO4, where one broad emission band with peak at nearly 575 nm is observed by exciting with 460 nm and one continuous band in the region of 330−500 nm is observed upon Eu2+ emission at 575 nm. Here, the excitation and emission are attributed to f-d transition of Eu2+. The 4f7–4f65d electric dipole transition of Eu2+ is parity-allowed, which make it can emit efficiently. Furthermore, the emission color of Eu2+ varies from blue to red, strongly depending on crystal lattice circumstance, such as covalence, cation size, and the strength of the crystal field. These characters make Eu2+ can coordinate with LED chip to produce white light in a wide range. As the excitation spectra shown in Figure 9, (Sr1.7Ba0.2Eu0.1) SiO4 phosphor can be excited efficiently either by blue or by nUV light from LEDs.
Comparing with YAG:Ce3+, one shortcoming for (Sr1.7Ba0.2Eu0.1)SiO4 phosphor is thermal quenching. Figure 10 presents the emission spectra of (Sr1.7Ba0.2Eu0.1)SiO4 under 460 nm excitation measured at different temperature. According to configuration-coordinate model, emission spectrum usually redshifts along with temperature increasing. What is distinguished for (Sr1.7Ba0.2Eu0.1)SiO4 is that the peak of emission bands blueshift from nearly 575 to 565 nm as temperature increases from 25 to 300 °C. This is caused by the thermally active phonon-assisted tunneling from the excited states of low-energy site to the excited states of high-energy site, as shown in Figure 11. There are two kinds of site for cations in the (Sr1.9Ba0.1)SiO4 crystal lattice, as the inset shown in Figure 9. The doped Eu2+ ions usually prefer the loose environment of site, so that the emission peak of Eu2+ in the low concentration region locates at the higher energy side of the spectrum. As displayed in Figure 12, the luminescence intensity of the (Sr1.7Ba0.2Eu0.1)SiO4 phosphor at 150 and 300 °C are 49% and 4% of its 25 °C value, respectively. Although seriously thermal quenching is observed, the luminescence intensity curve of the heating process is almost duplicate with that of the cooling process, which indicates there is no thermal degradation or the thermal quenching is recoverable.
Figure 9. Excitation (λem = 575 nm) and emission (λex = 460 nm) spectra of (Sr1.7Ba0.2Eu0.1)SiO4.
Materials 03 02172 g009
Figure 10. Emission spectra of (Sr1.7Ba0.2Eu0.1)SiO4 under 460 nm excitation measured at different temperature.
Materials 03 02172 g010
Figure 11. Schematic diagram of the thermal phonon-assisted tunneling of Eu2+ from low-energy site to high-energy site.
Materials 03 02172 g011
Figure 12. Luminescence intensity of (Sr1.7Ba0.2Eu0.1)SiO4 as a function of temperature.
Materials 03 02172 g012

3.2. Green phosphors

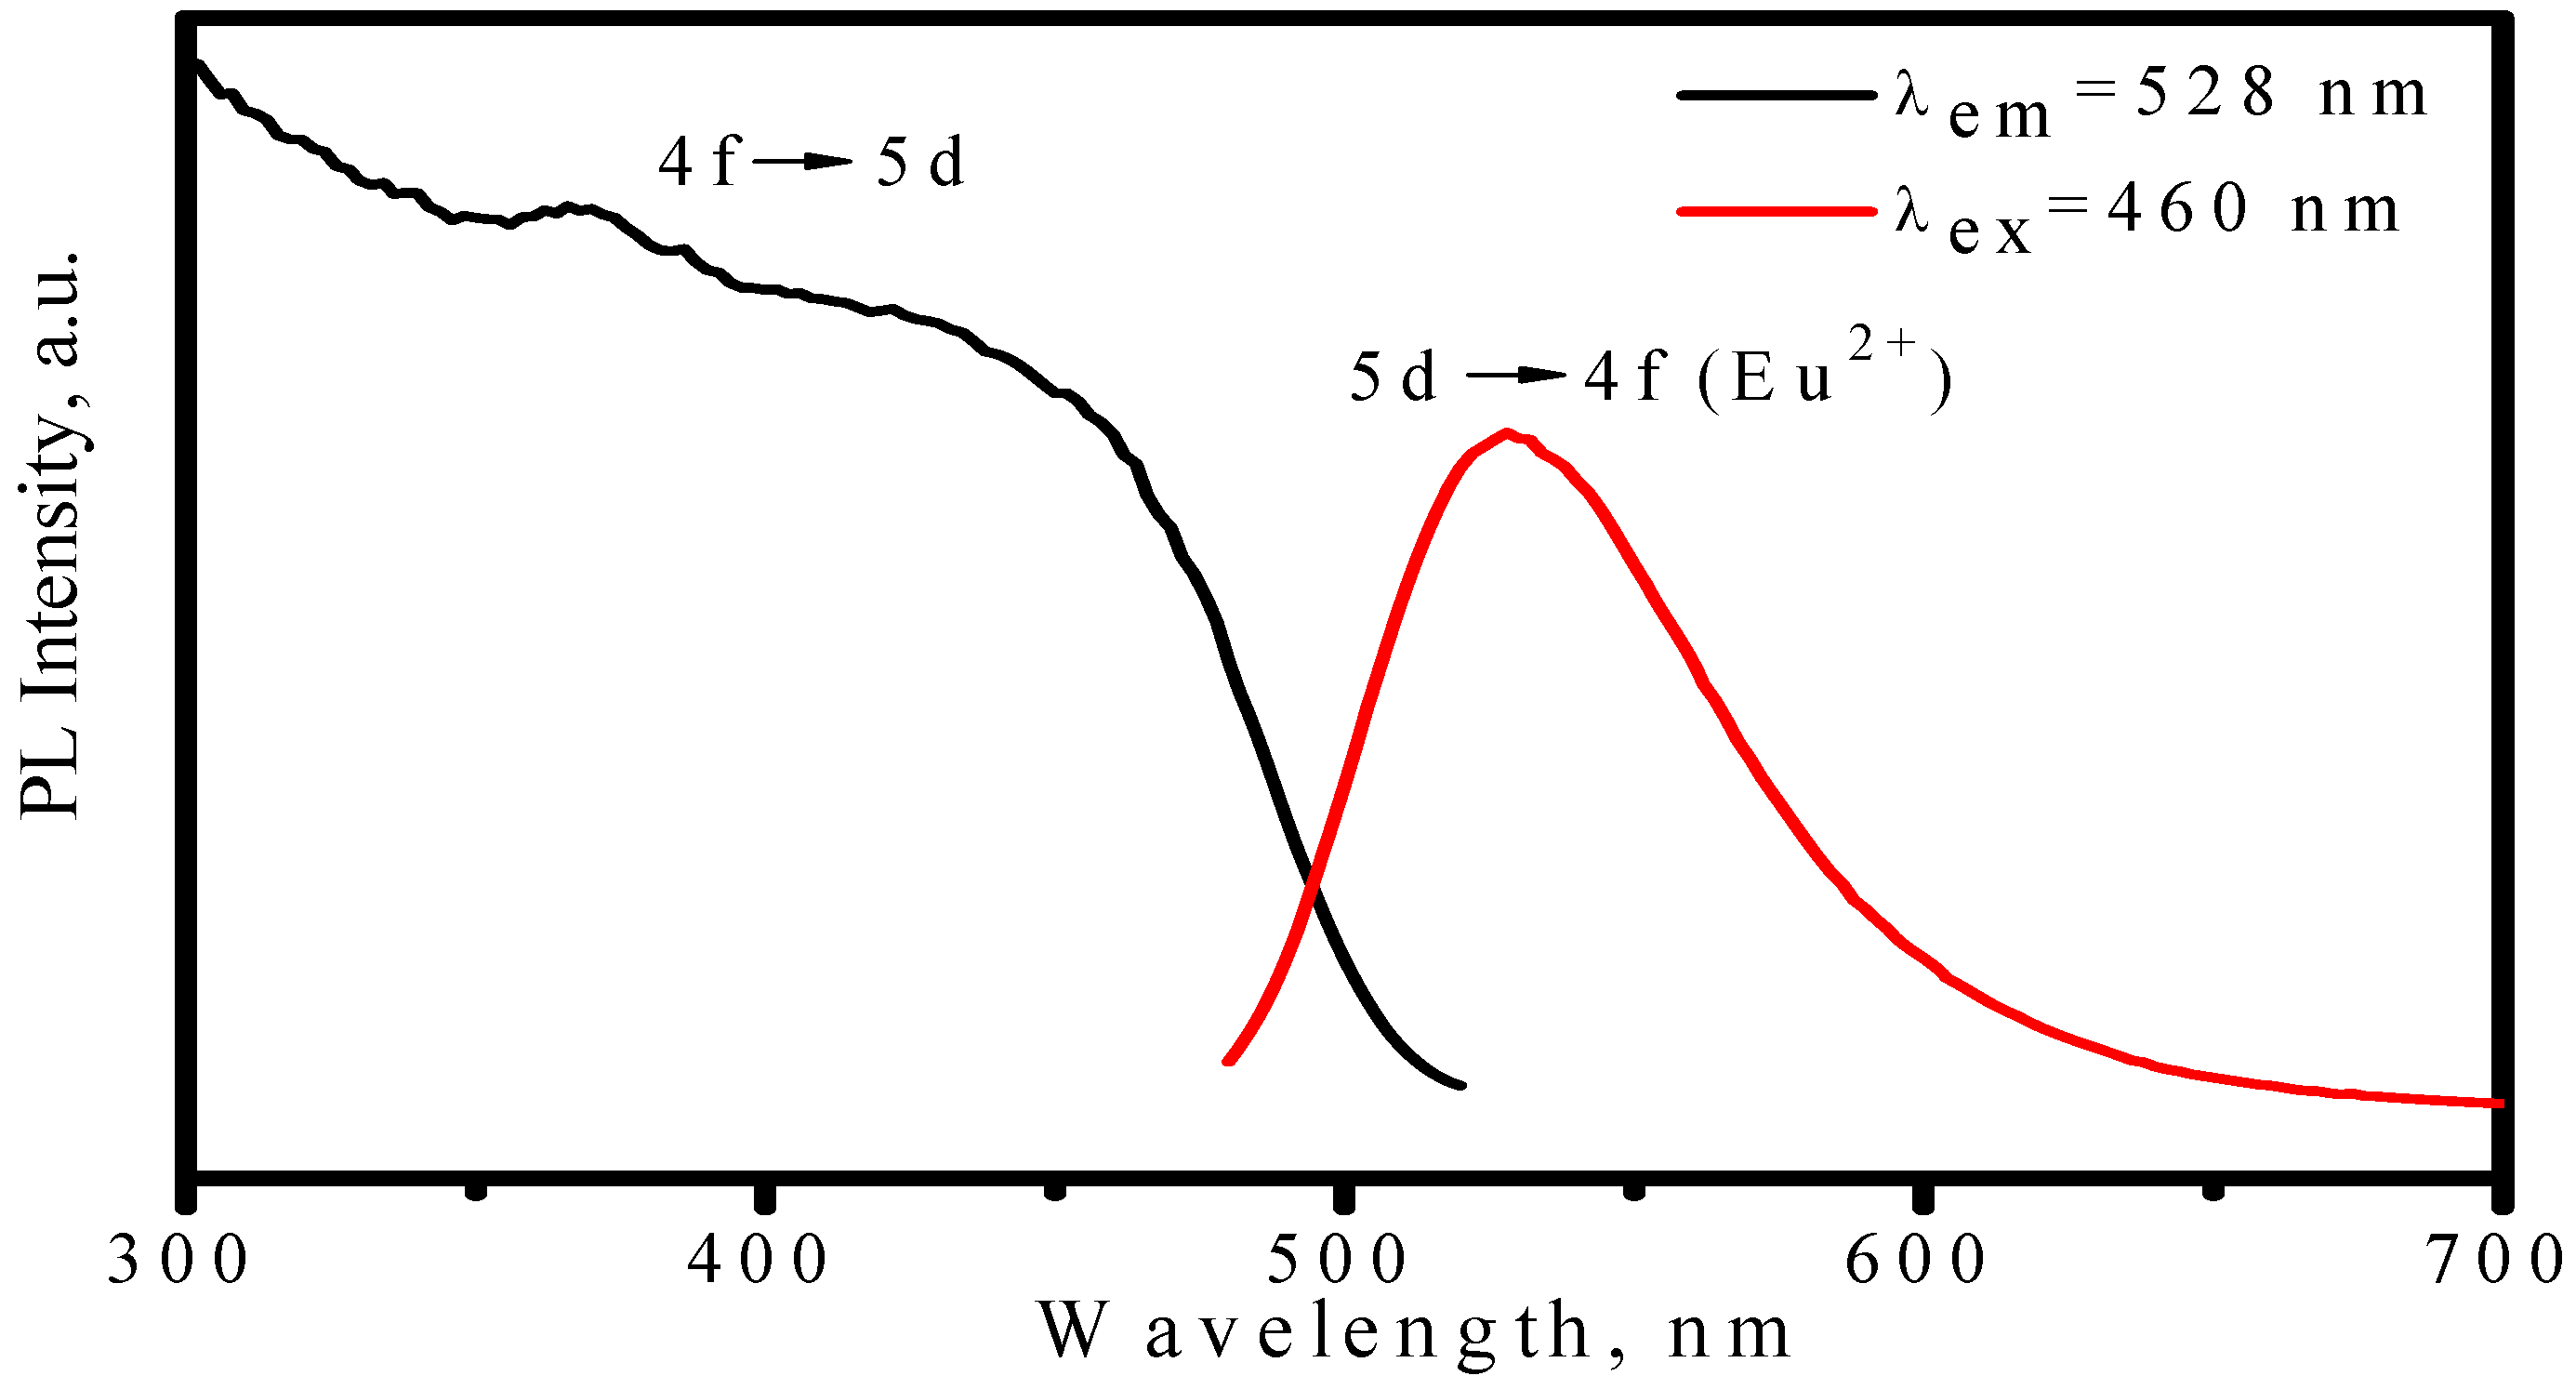
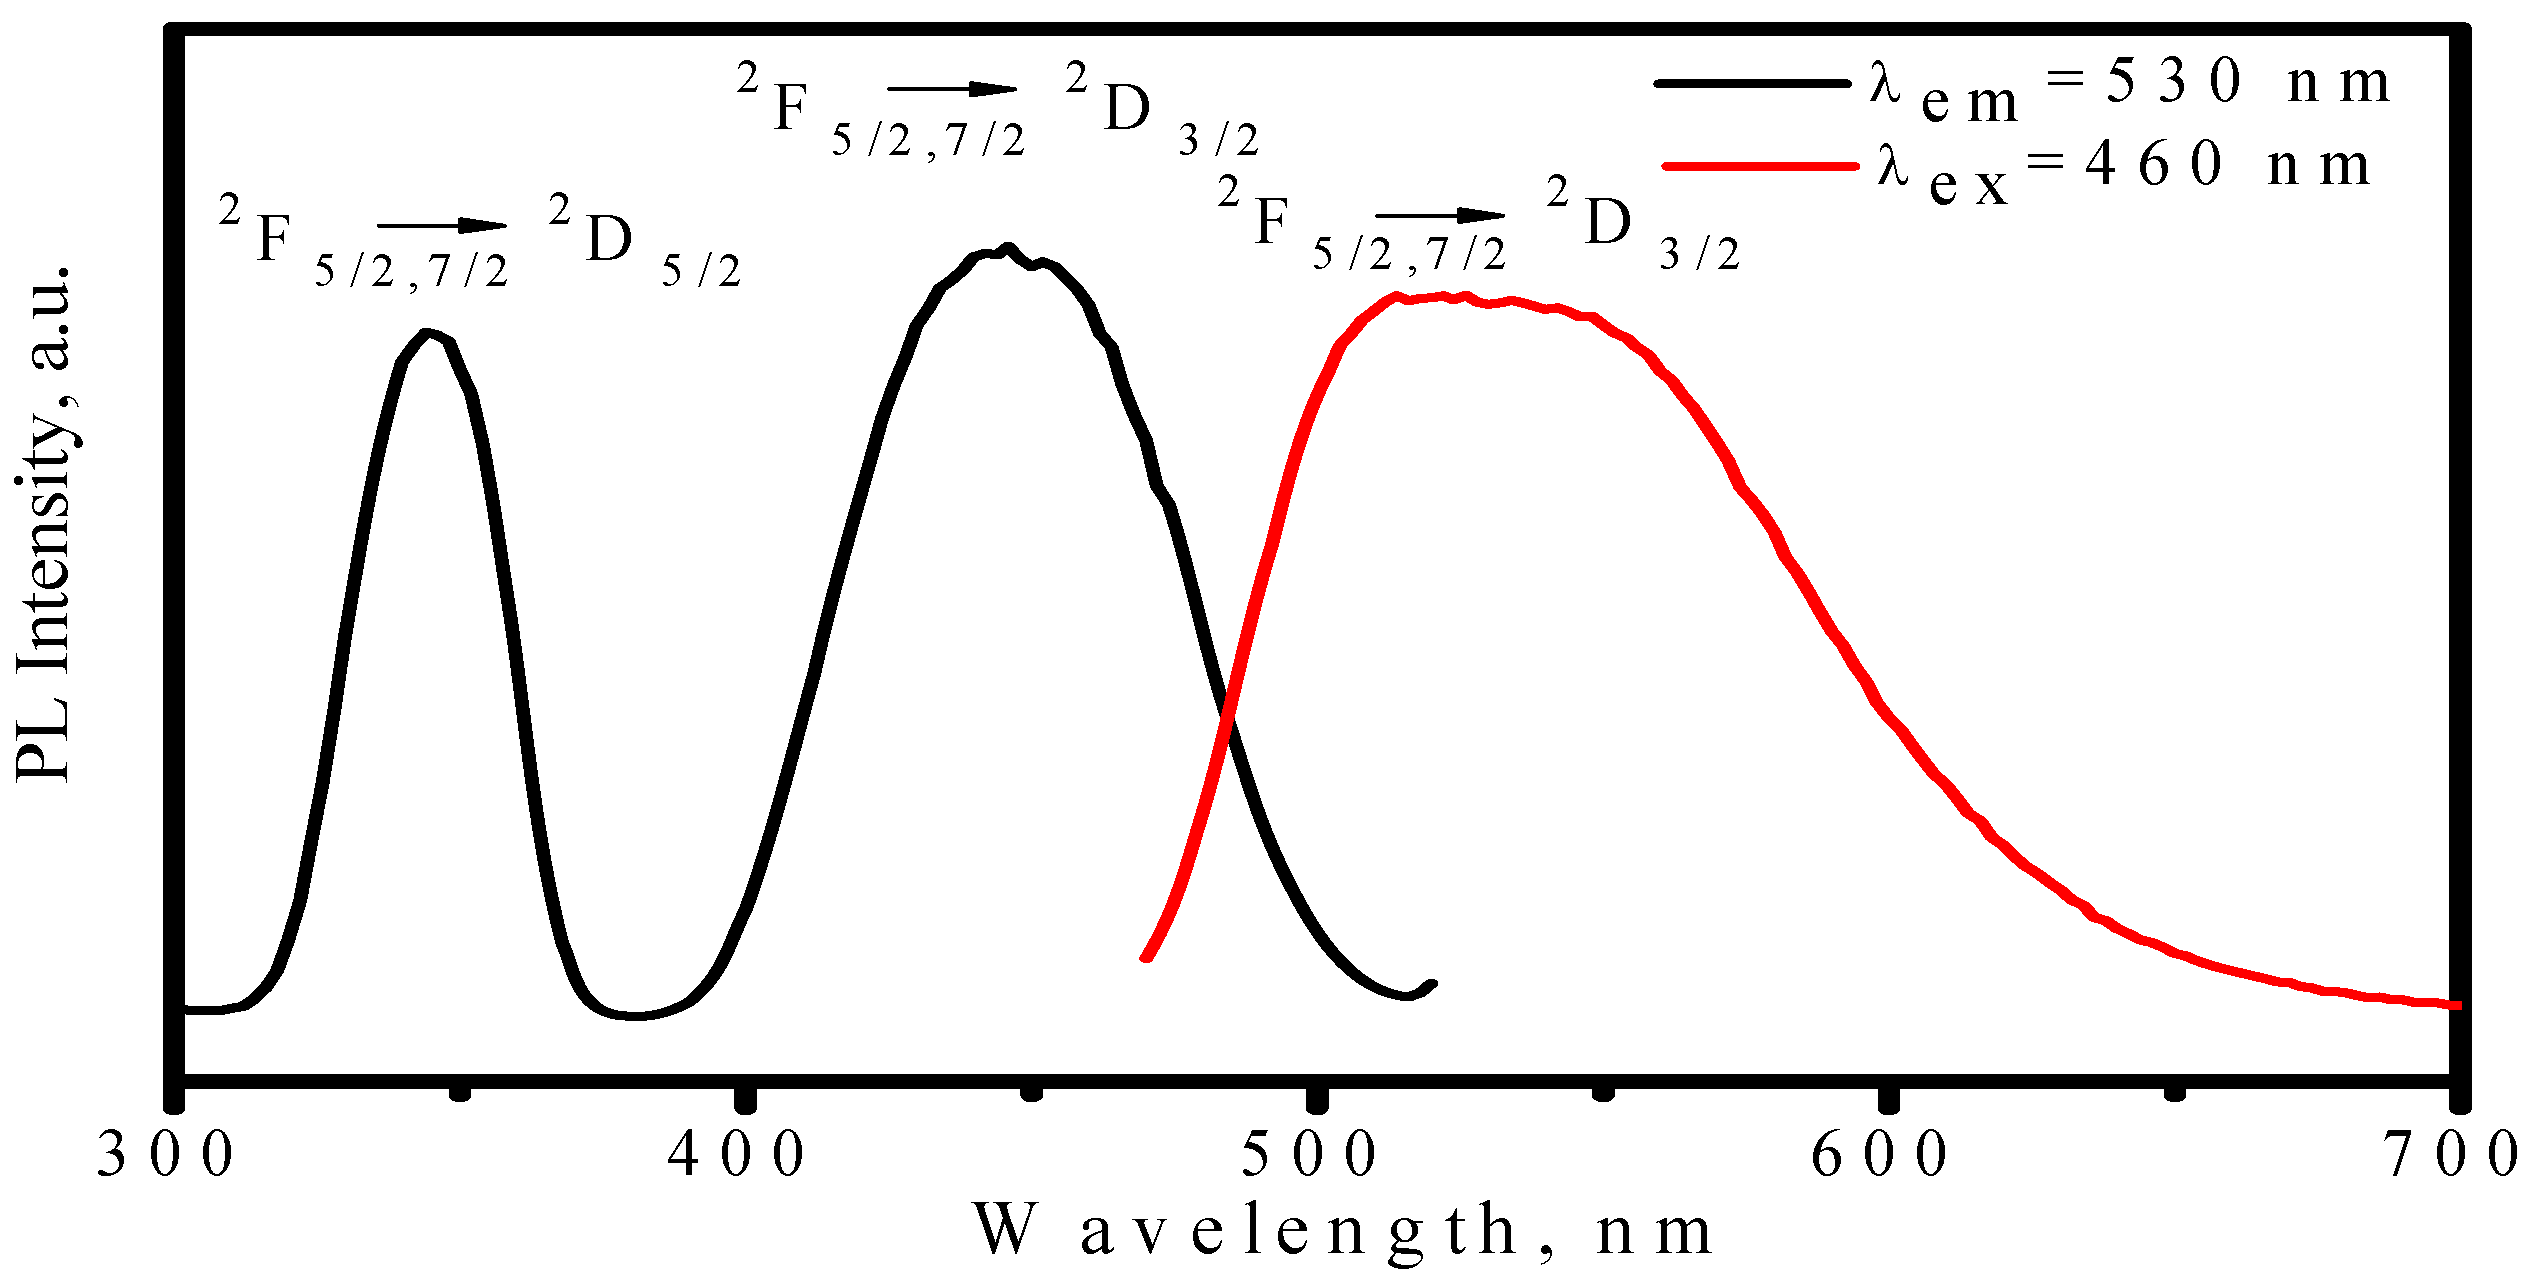
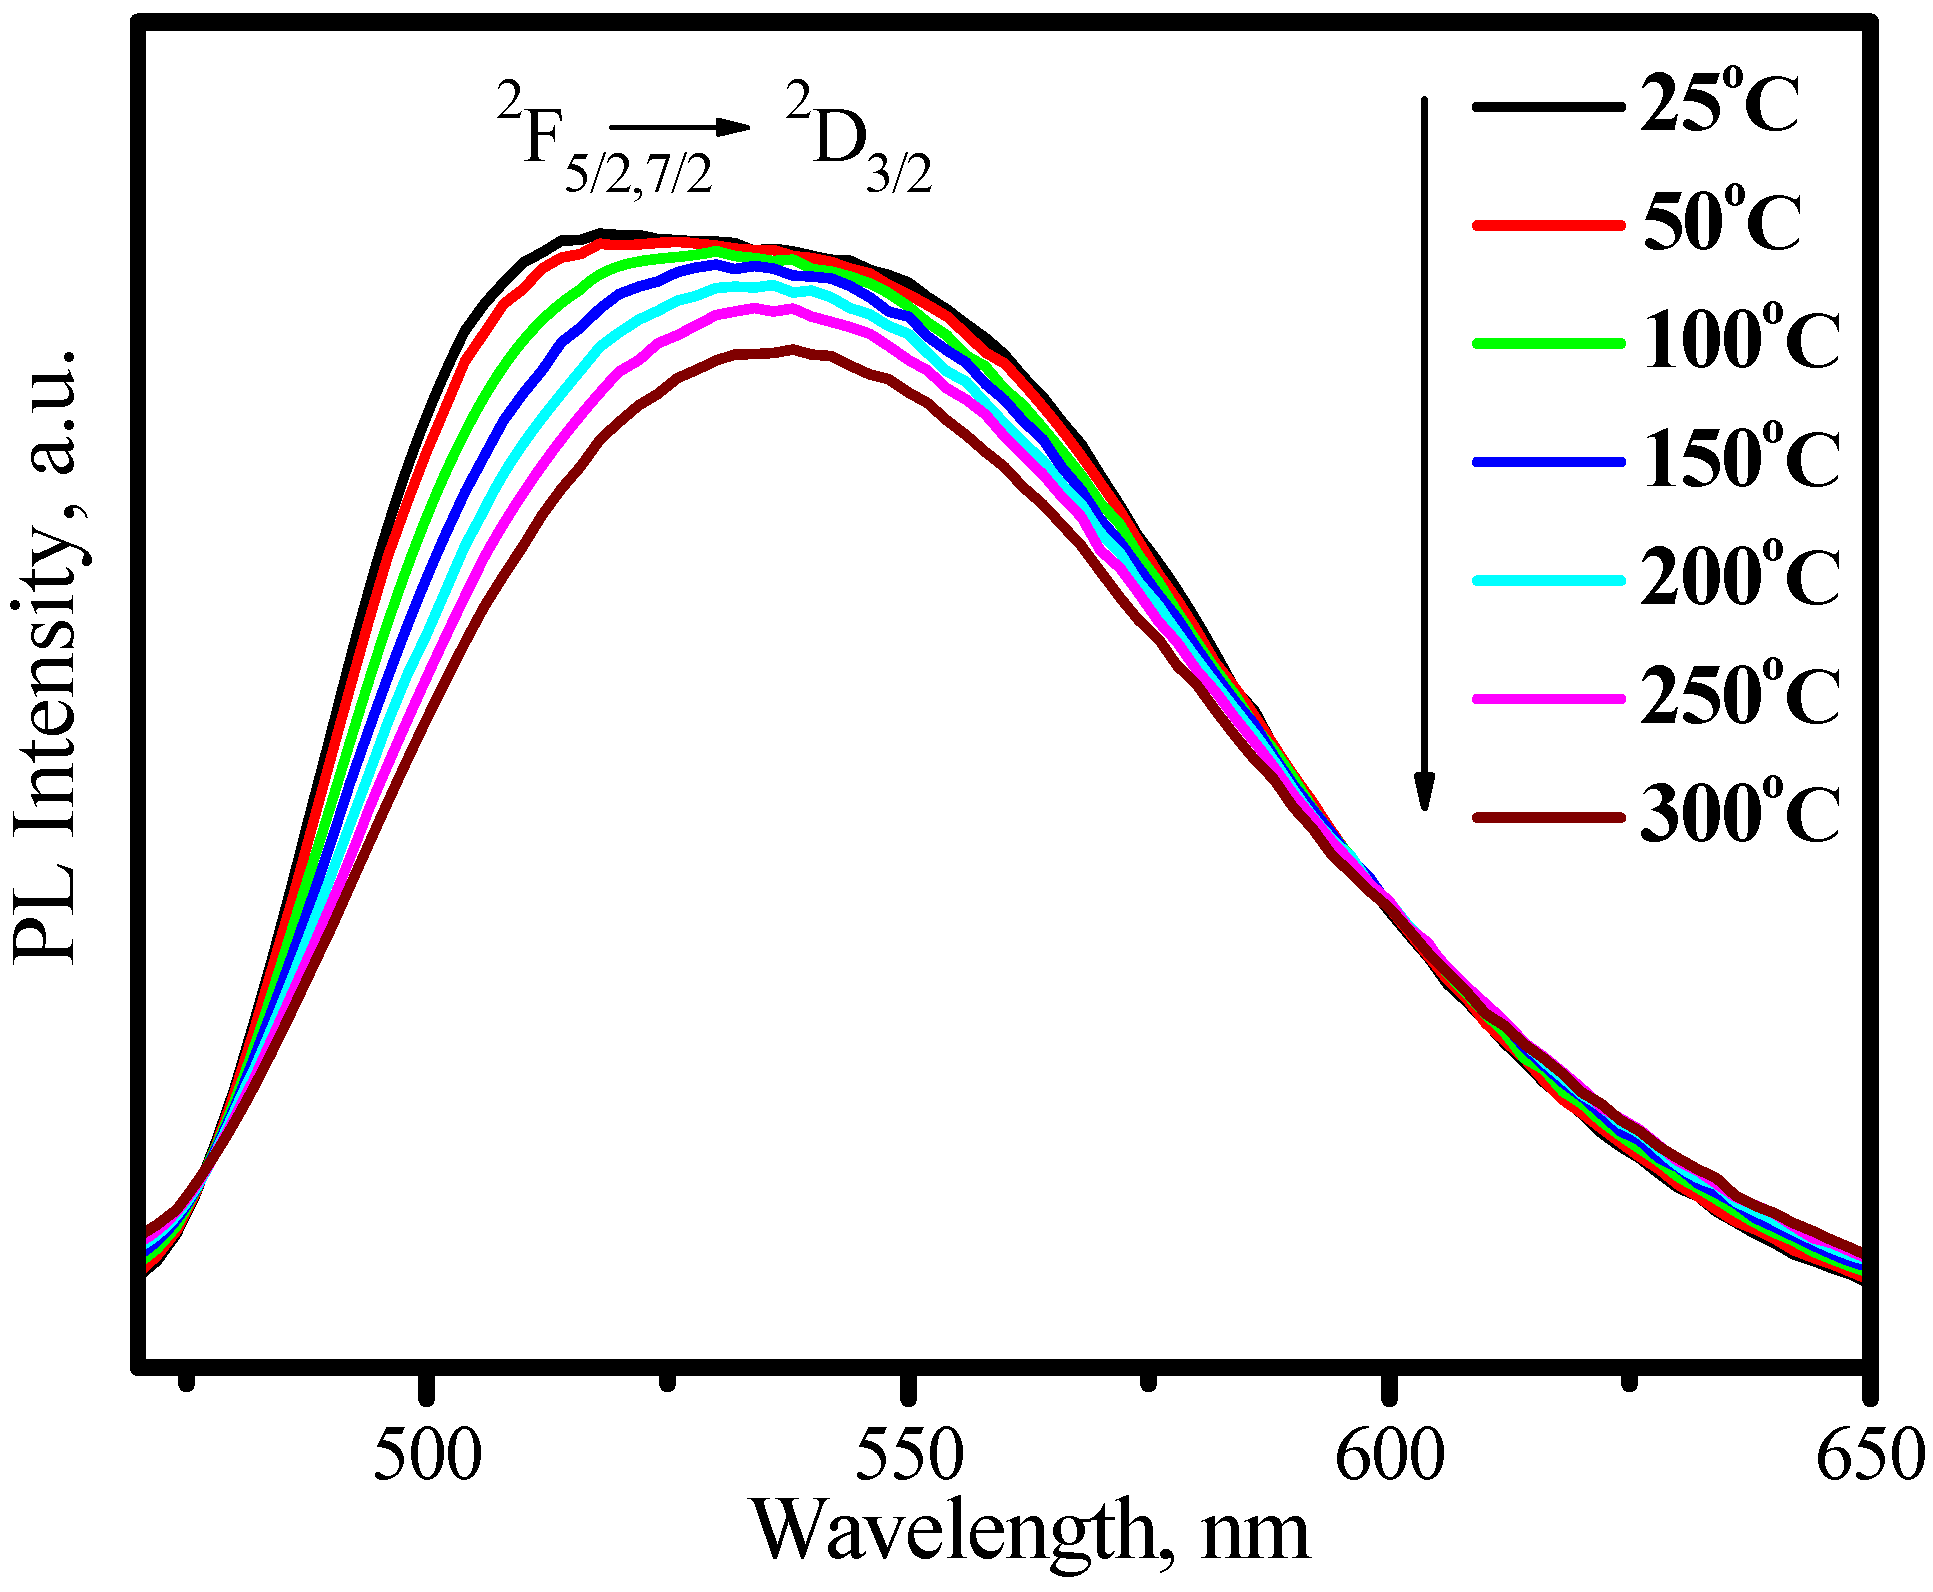
3.2.1. (Ba,Sr)SiO4:Eu2+
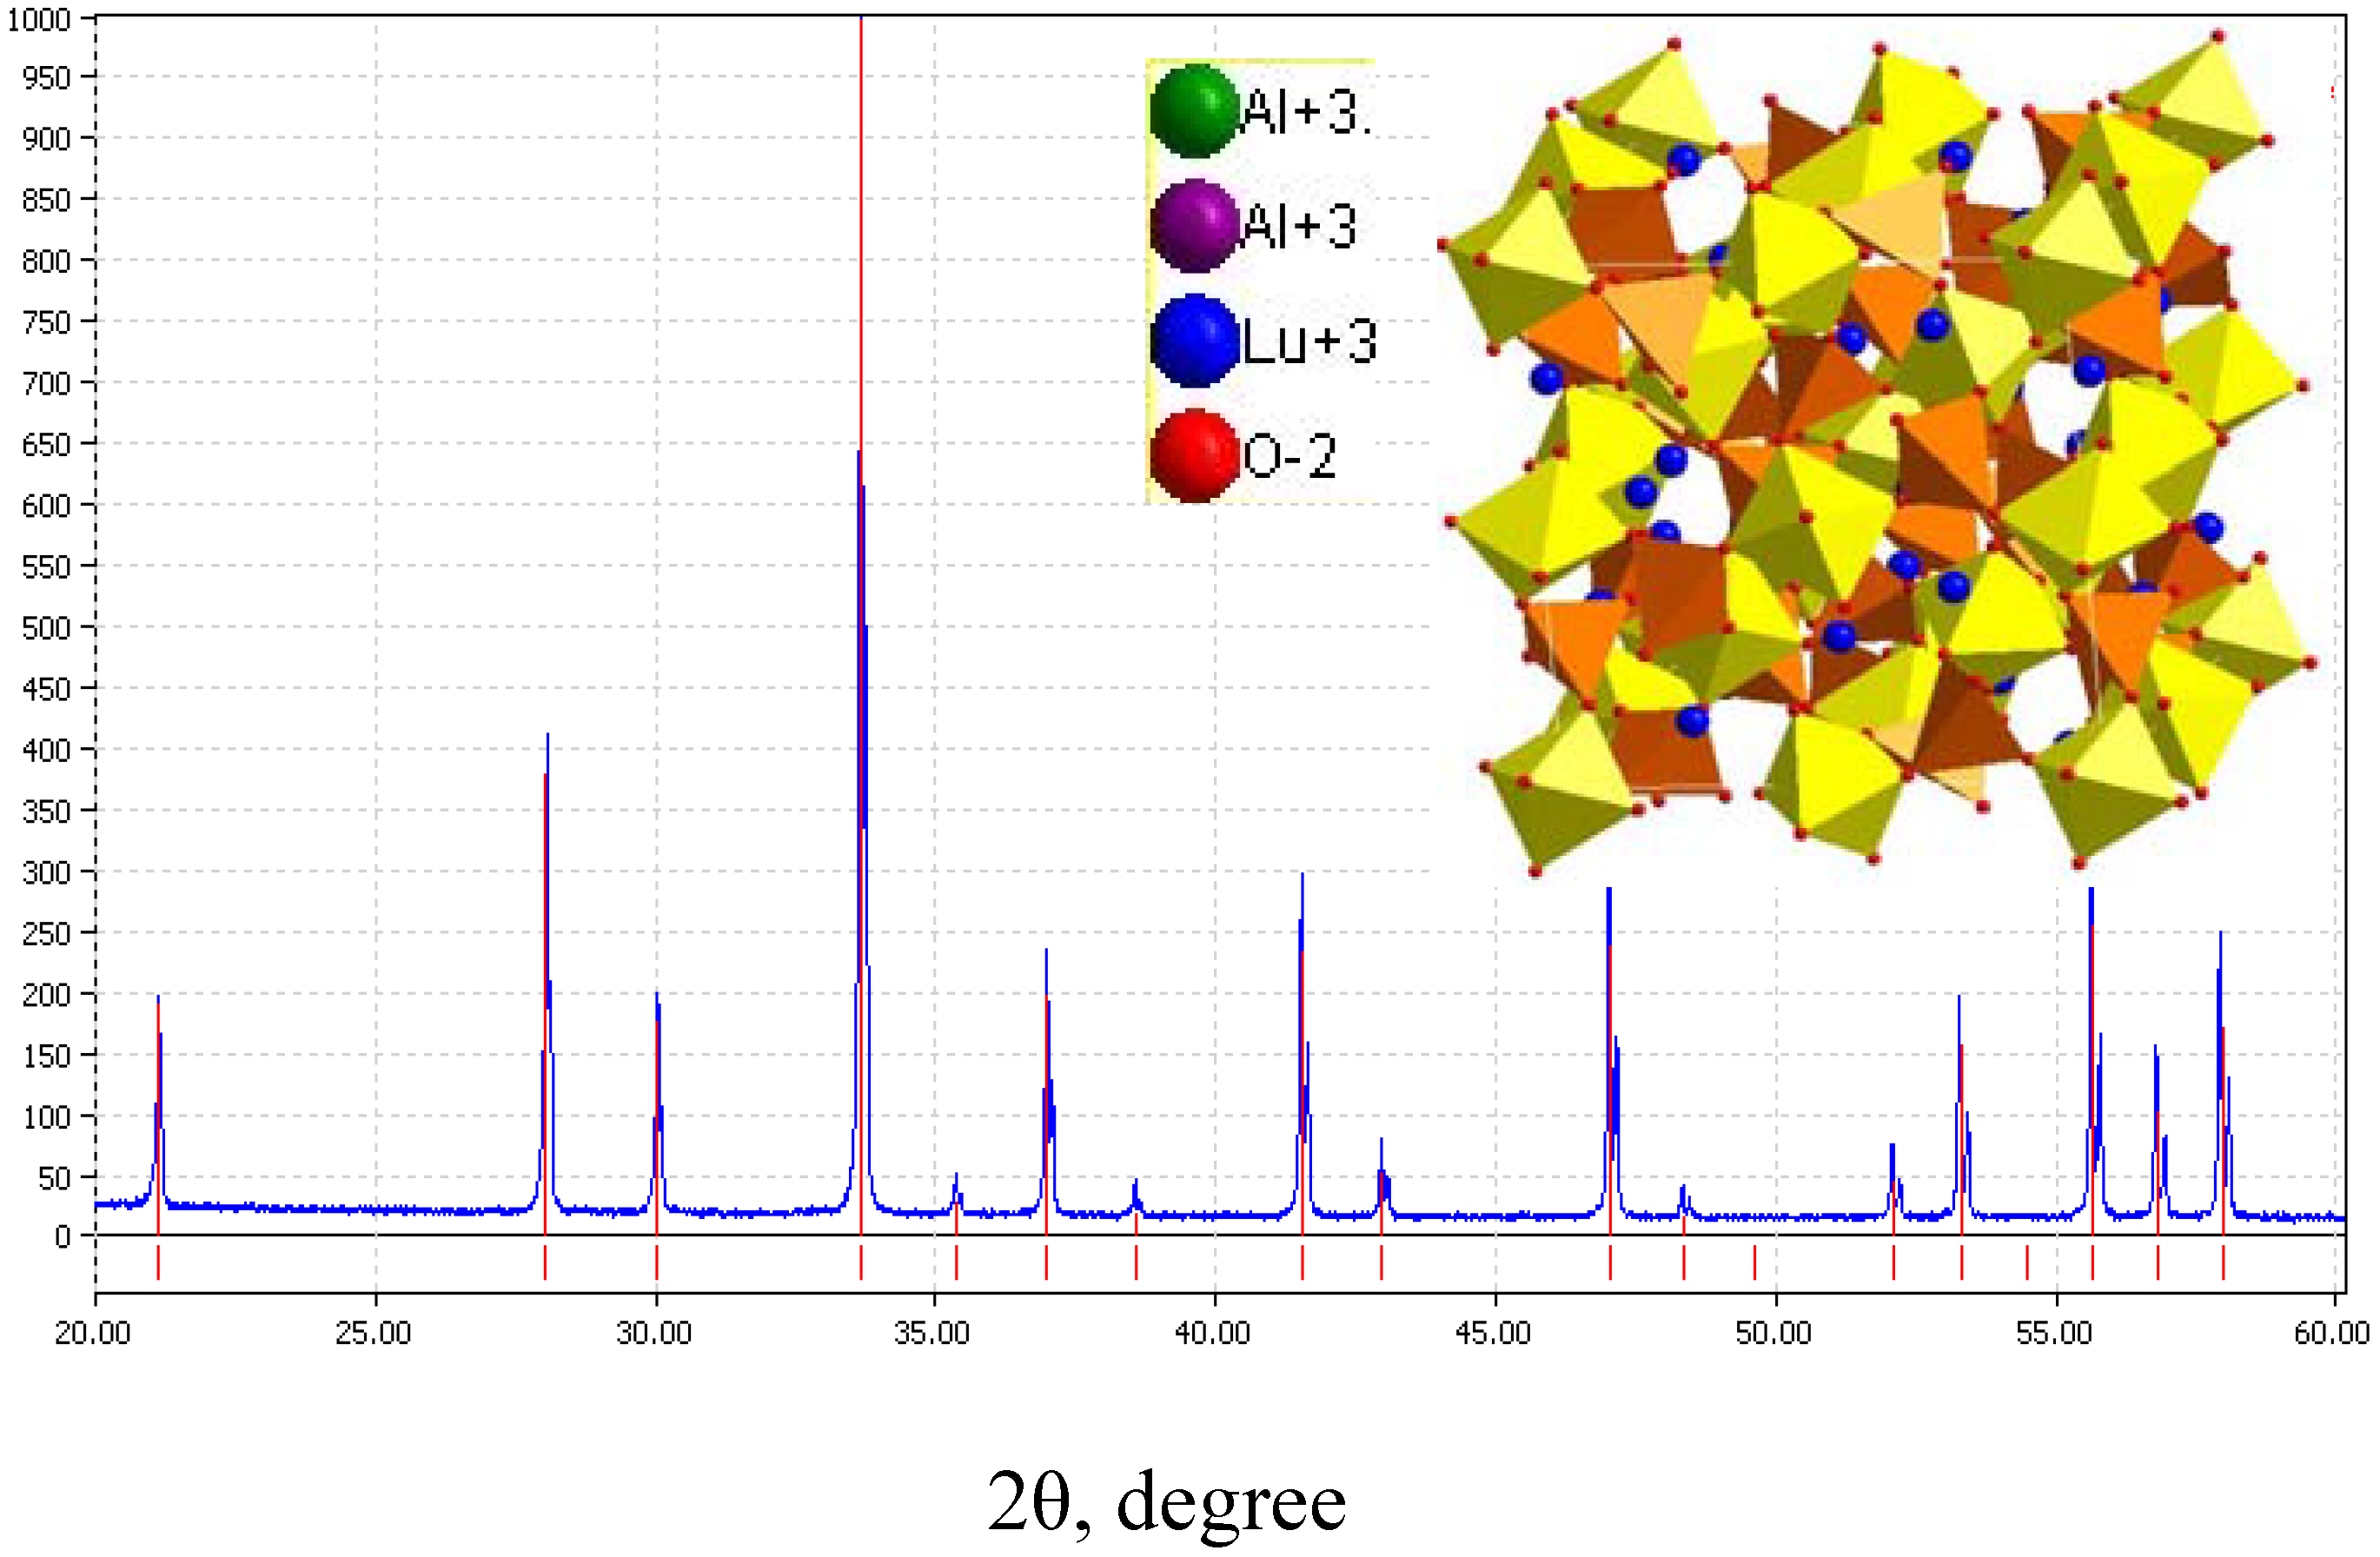
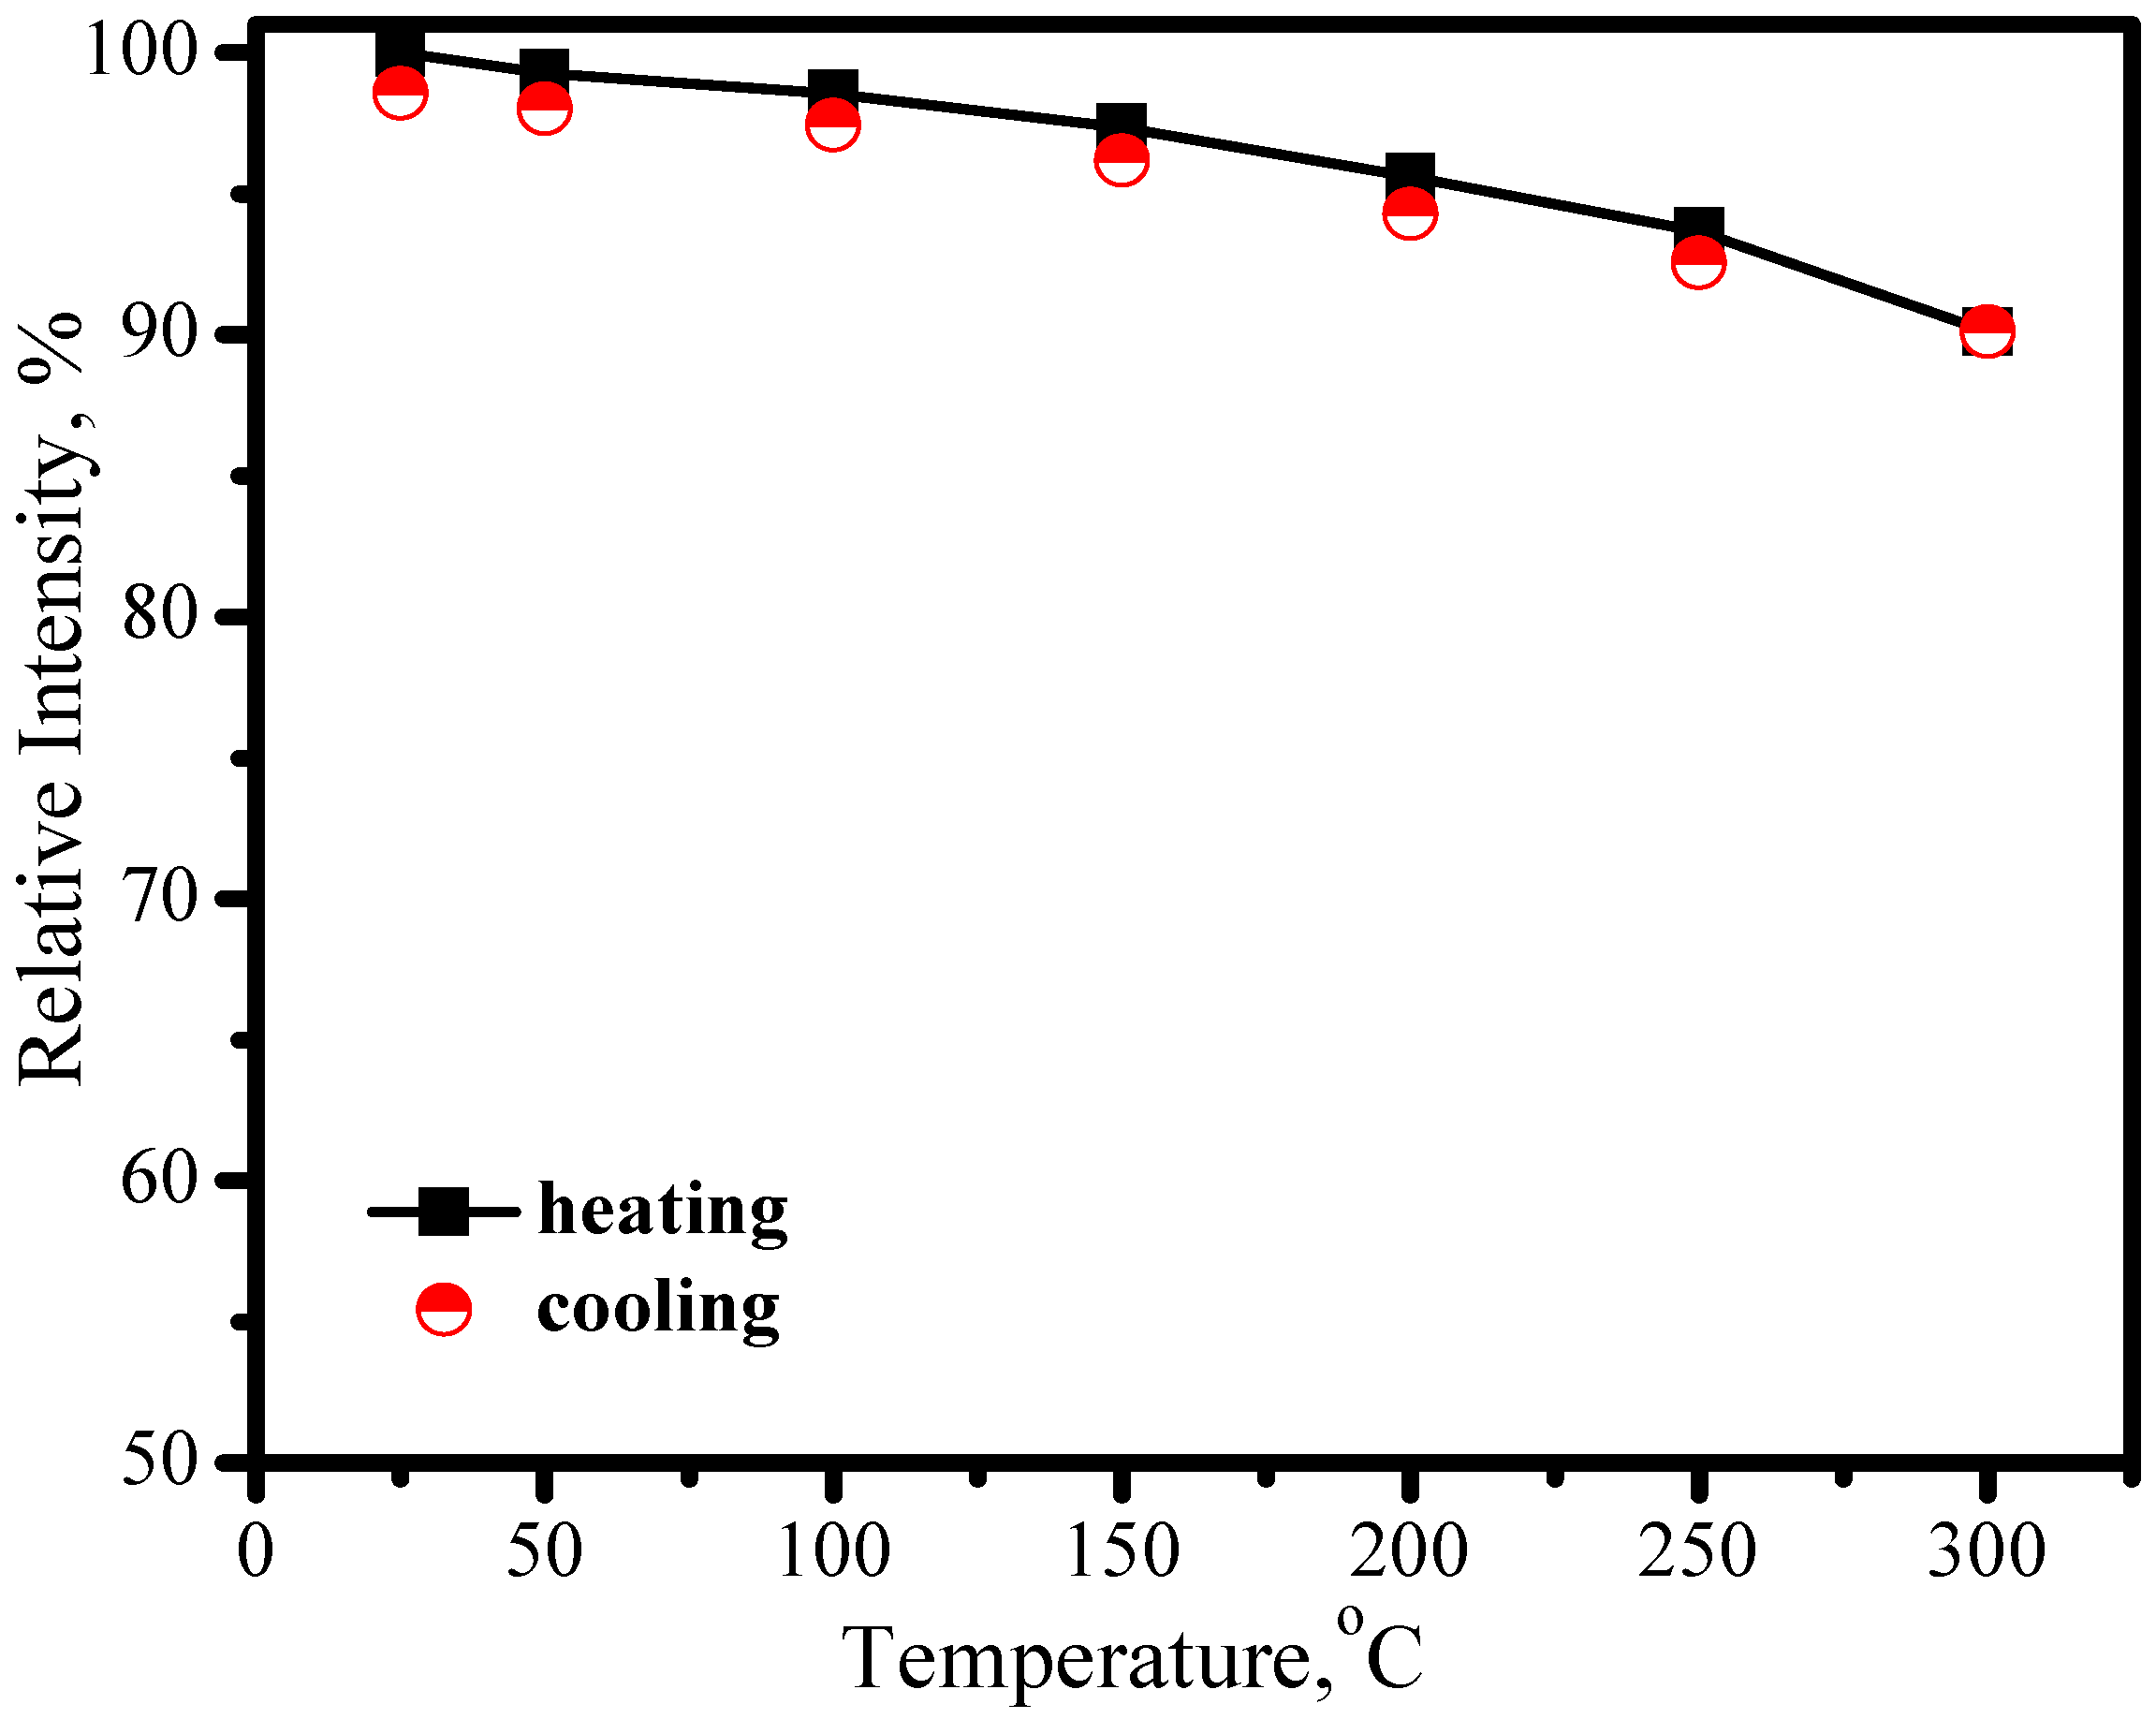
As discussed above, the emission color of Eu2+ depends on host. As for MSiO4: Eu2+ (M = Ca, Sr, Ba) system, different emission colors can be tuned up by tailoring different cations with proper concentration, among which (Ba1.1Sr0.7Eu0.2)SiO4 is a promising green phosphor for LED. (Ba1.1Sr0.7Eu0.2)SiO4 has an isostructure with (Sr1.7Ba0.2Eu0.1)SiO4. Figure 13 presents its emission spectrum by exciting with 460 nm and excitation spectrum by monitoring at 528 nm. The strong green emission band with peak at 528 nm is assigned to 5d→4f transition of Eu2+. The broad continuous band in the region of 300−500 nm, which is attributed to 4f→5d transition of Eu2+, indicates that (Ba1.1Sr0.7Eu0.2)SiO4 phosphor can be excited efficiently either by blue or by nUV light from LEDs. The evident thermal quenching is also observed in (Ba1.1Sr0.7Eu0.2)SiO4 phosphor. As shown in Figure 14, the peak of emission bands blueshift from about 528 nm to 524 nm as temperature increases from 25 to 300 °C. Comparing with Figure 10, this blueshift of emission band is not as large as that yellow emission in (Sr1.7Ba0.2Eu0.1)SiO4, but the luminescence intensity decreases significantly with temperature increasing, as shown in Figure 15. The luminescence intensity at 150 °C and 300 °C is 77% and 9% that of at 25 °C, respectively.
Figure 13. Excitation (λem = 528 nm) and emission (λex = 460 nm) spectra of (Ba1.1Sr0.7Eu0.2)SiO4 phosphor.
Materials 03 02172 g013
Figure 14. Emission spectra of (Ba1.1Sr0.7Eu0.2)SiO4 under 460 nm excitation measured at different temperature.
Materials 03 02172 g014
Figure 15. Luminescence intensity of (Ba1.1Sr0.7Eu0.2)SiO4 as a function of temperature.
Materials 03 02172 g015

3.2.2. LuAG:Ce3+

The emission color of YAG:Ce3+ is yellow, whose properties has been discussed in above. Although Lu3Al5O12 (LuAG) and YAG have similar crystal structure, the emission color of Ce3+ in LuAG host is green, because the parity-allowed 4f l-4f05d1 transition of Ce3+ is also evidently affected by crystal lattice surrounding as similar to Eu2+. LuAG:Ce3+ can also be excited efficiently by the blue emission from LEDs, which make it suitable to be applied in tri-color white LEDs by adding proper red phosphor. Figure 16 presents the XRD pattern of (Lu0.9Ce0.01)3Al5O13, in which the red lines denote for the standard peaks of Lu3Al5O12 (JCPDS card 73-1368) and the blue line is the measured peaks. The inset presents its three-dimensional structure. Figure 16 shows that (Lu0.9Ce0.01)3Al5O13 crystallizes well as cubic with a space group of Ia3d.
Figure 16. XRD pattern of (Lu0.9Ce0.01)3Al5O13.
Materials 03 02172 g016
Figure 17 presents the excitation upon Ce3+ emission at 530 nm and the emission spectrum under 460 nm excitation, in which two broad excitation bands in the region of 310−374 and 386−510 nm and one broad emission band in the region of 470−65 nm are observed. The redshift of the Ce3+ emission band with an increase of temperature was also observed in LuAG host as shown in Figure 18, which is similar to that of YAG:Ce3+, but the thermal stabilities of LuAG:Ce3+ luminescence including emission color and intensity are much better than those of YAG:Ce3+. As presented in Figure 19, the luminescence intensity of the LuAG:Ce3+ at 150 °C and 300 °C are 97% and 91% of its 25 °C value, respectively. The overlap of the luminescence intensity curves during heating and cooling process indicate that the thermal quenching is recoverable. Comparatively, the thermal stability of the green emission of LuAG:Ce3+ is far better than that of (Ba1.1Sr0.7Eu0.2)SiO4. The assignment of the excitation and emission spectra of LuAG :Ce3+ and the mechanisms of emission band redshift as well as the decrease of luminescence intensity with temperature increasing, are similar to the ones performed in YAG :Ce3+.
Figure 17. Excitation (λem = 530 nm) and emission (λex = 460 nm) spectra of (Lu0.9Ce0.01)3Al5O13 phosphor.
Materials 03 02172 g017
Figure 18. Emission spectra of (Lu0.9Ce0.01)3Al5O13 under 460nm excitation measured at different temperature.
Materials 03 02172 g018
Figure 19. Luminescence intensity of (Lu0.9Ce0.01)3Al5O13 as a function of temperature.
Materials 03 02172 g019

3.3. Red phosphors

In recent years, the research on SiN4-based covalent nitrides phosphor, including nitridosilicates, nitridoaluminosilicates, sialons, and nitrides et al, for LEDs has received much more attention. This is because the highly condensed SiN4 -based networks and the high strength of the chemical bonding between the constituent elements result in the extraordinary chemical and thermal stability of nitride materials. Furthermore, the high covalent chemical bonding in nitrides and large crystal field effect of nitrogen anion give rise to a strong nephelauxetic effect (i.e., electron cloud expansion), which will reduce the energy of the excited state of the 5d electrons of the activators (e.g., Eu2+, Ce3+) and correspondingly result in larger excitation/emission wavelengths [20,21,22,23,24]. These characteristics make covalent nitrides to be ideal candidates for LED phosphors. Among all candidates for the red phosphors, M2Si5N8 (M = Ca, Sr, Ba):Eu2+ and MAlSiN3:Eu2+ (M = Ca, Sr) were demonstrated to be high promising potential phosphors for InGaN based white-light LEDs.

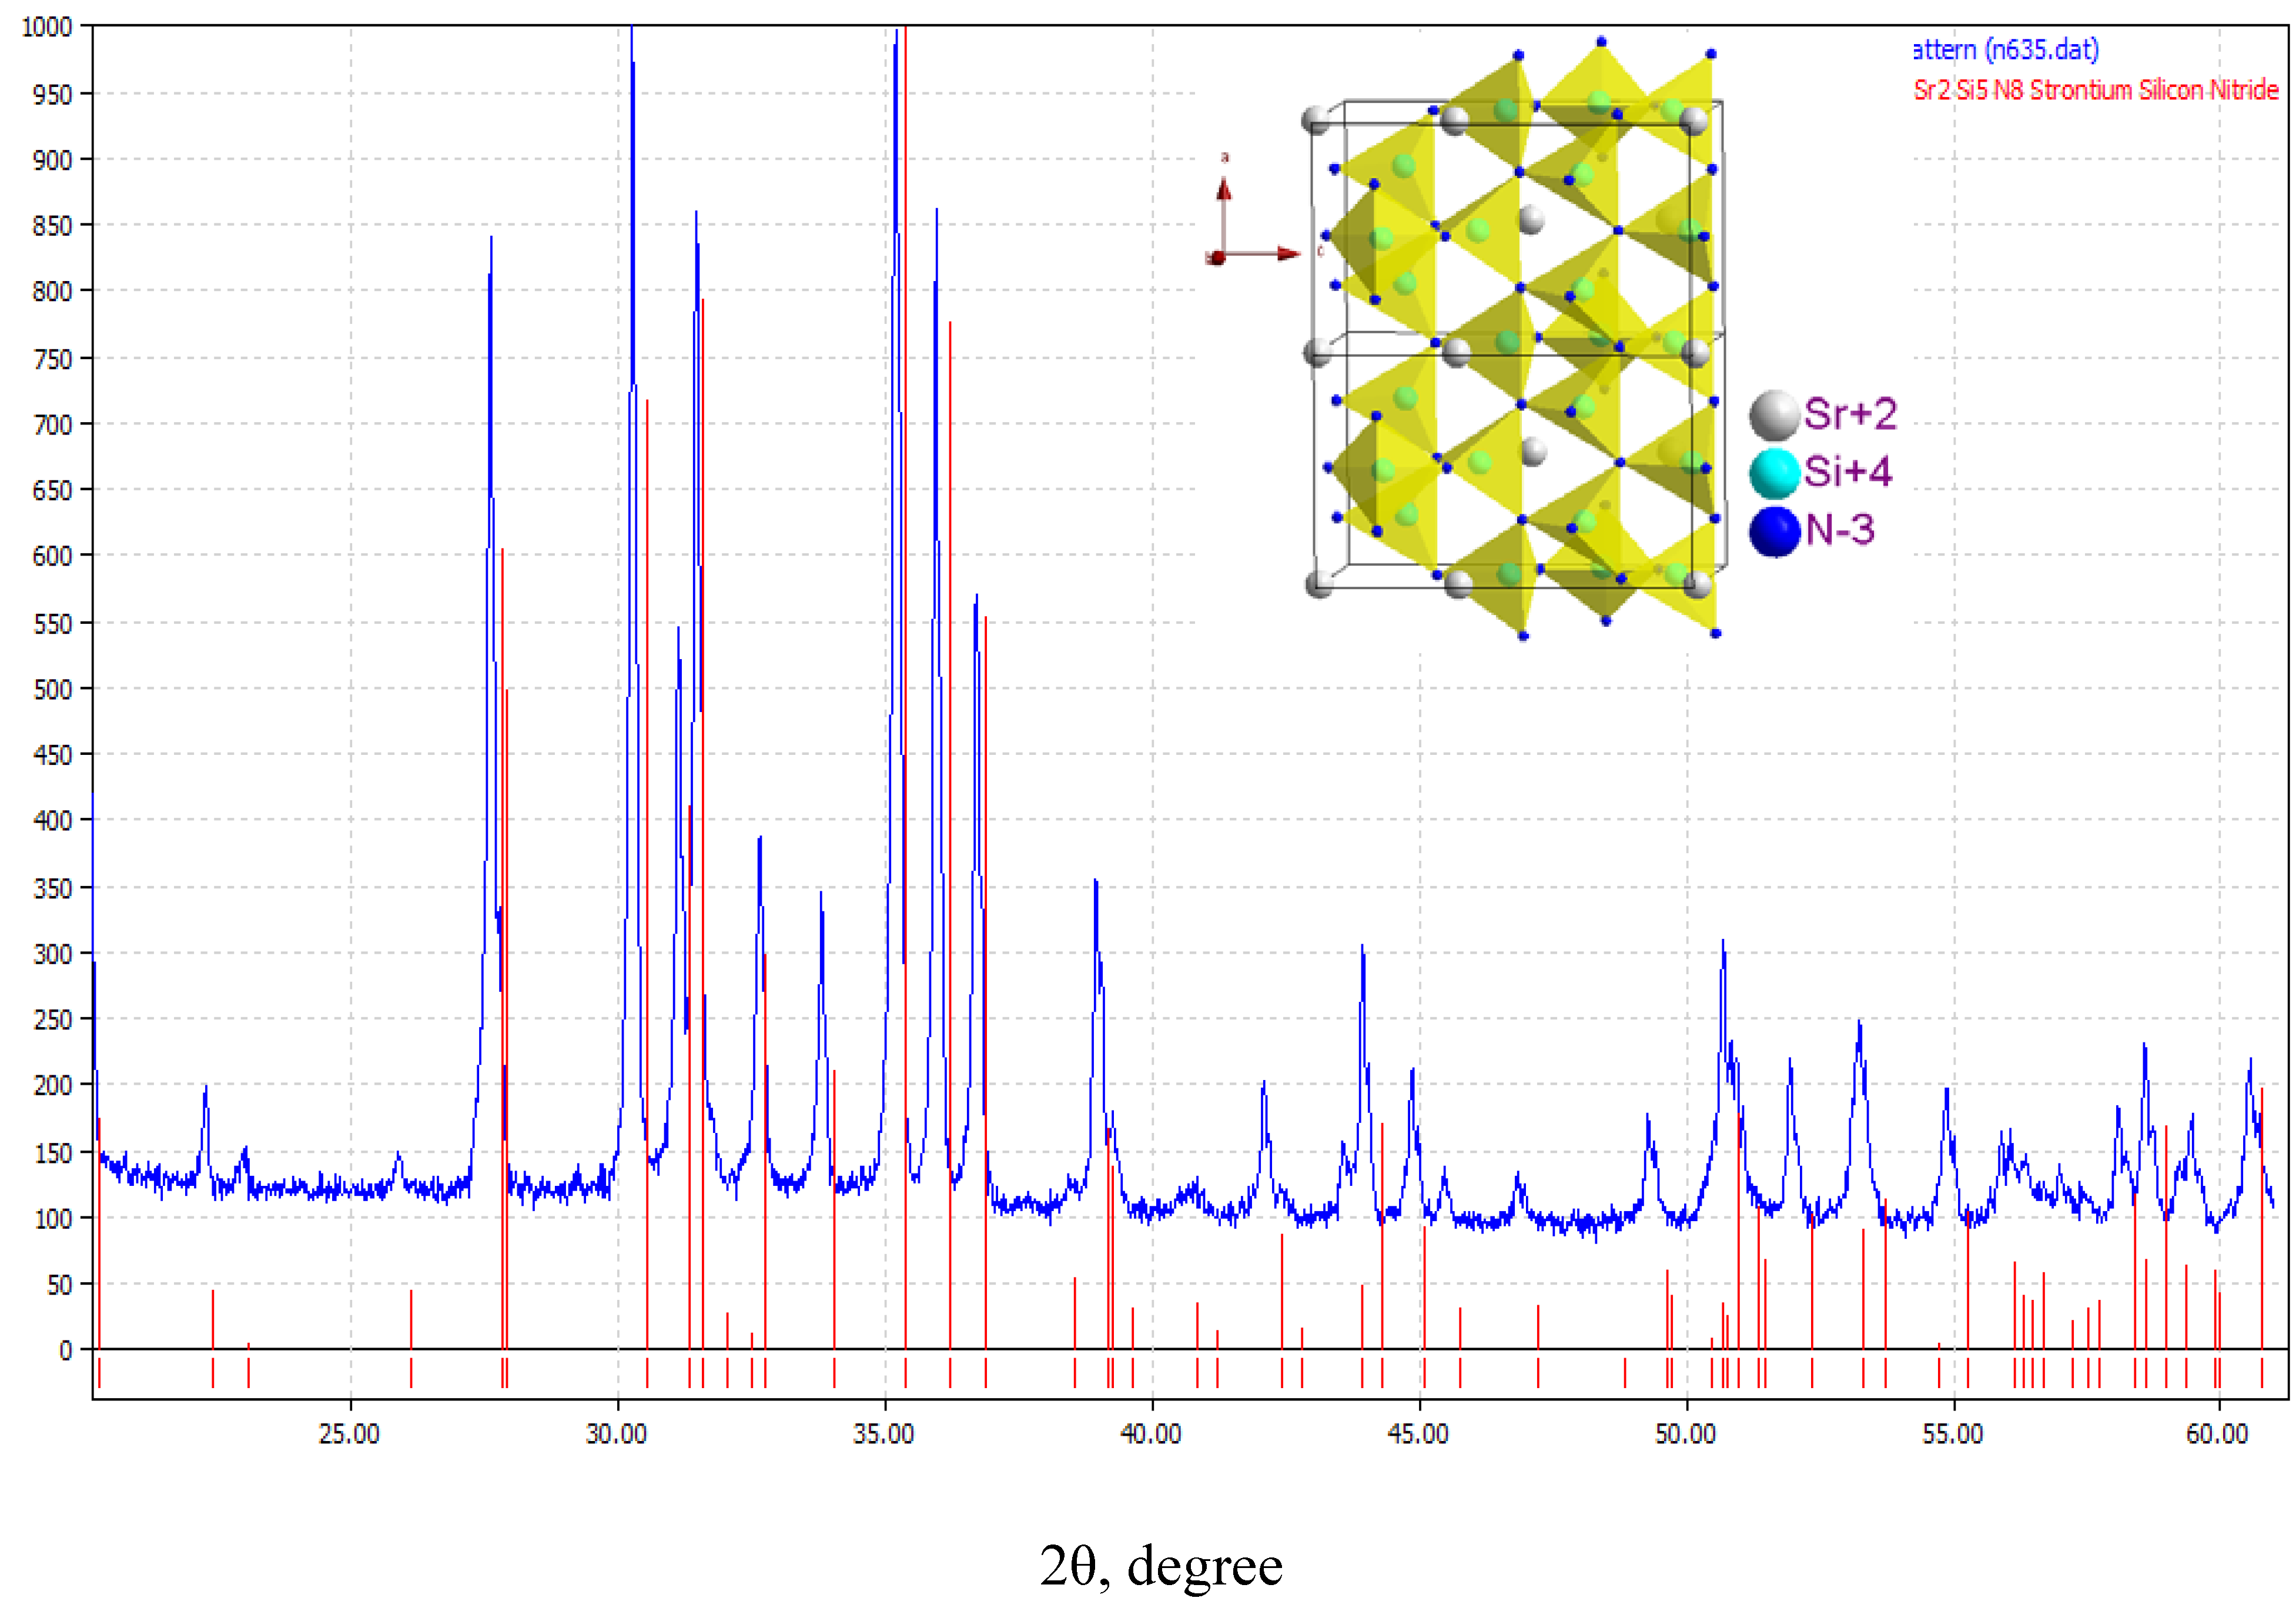
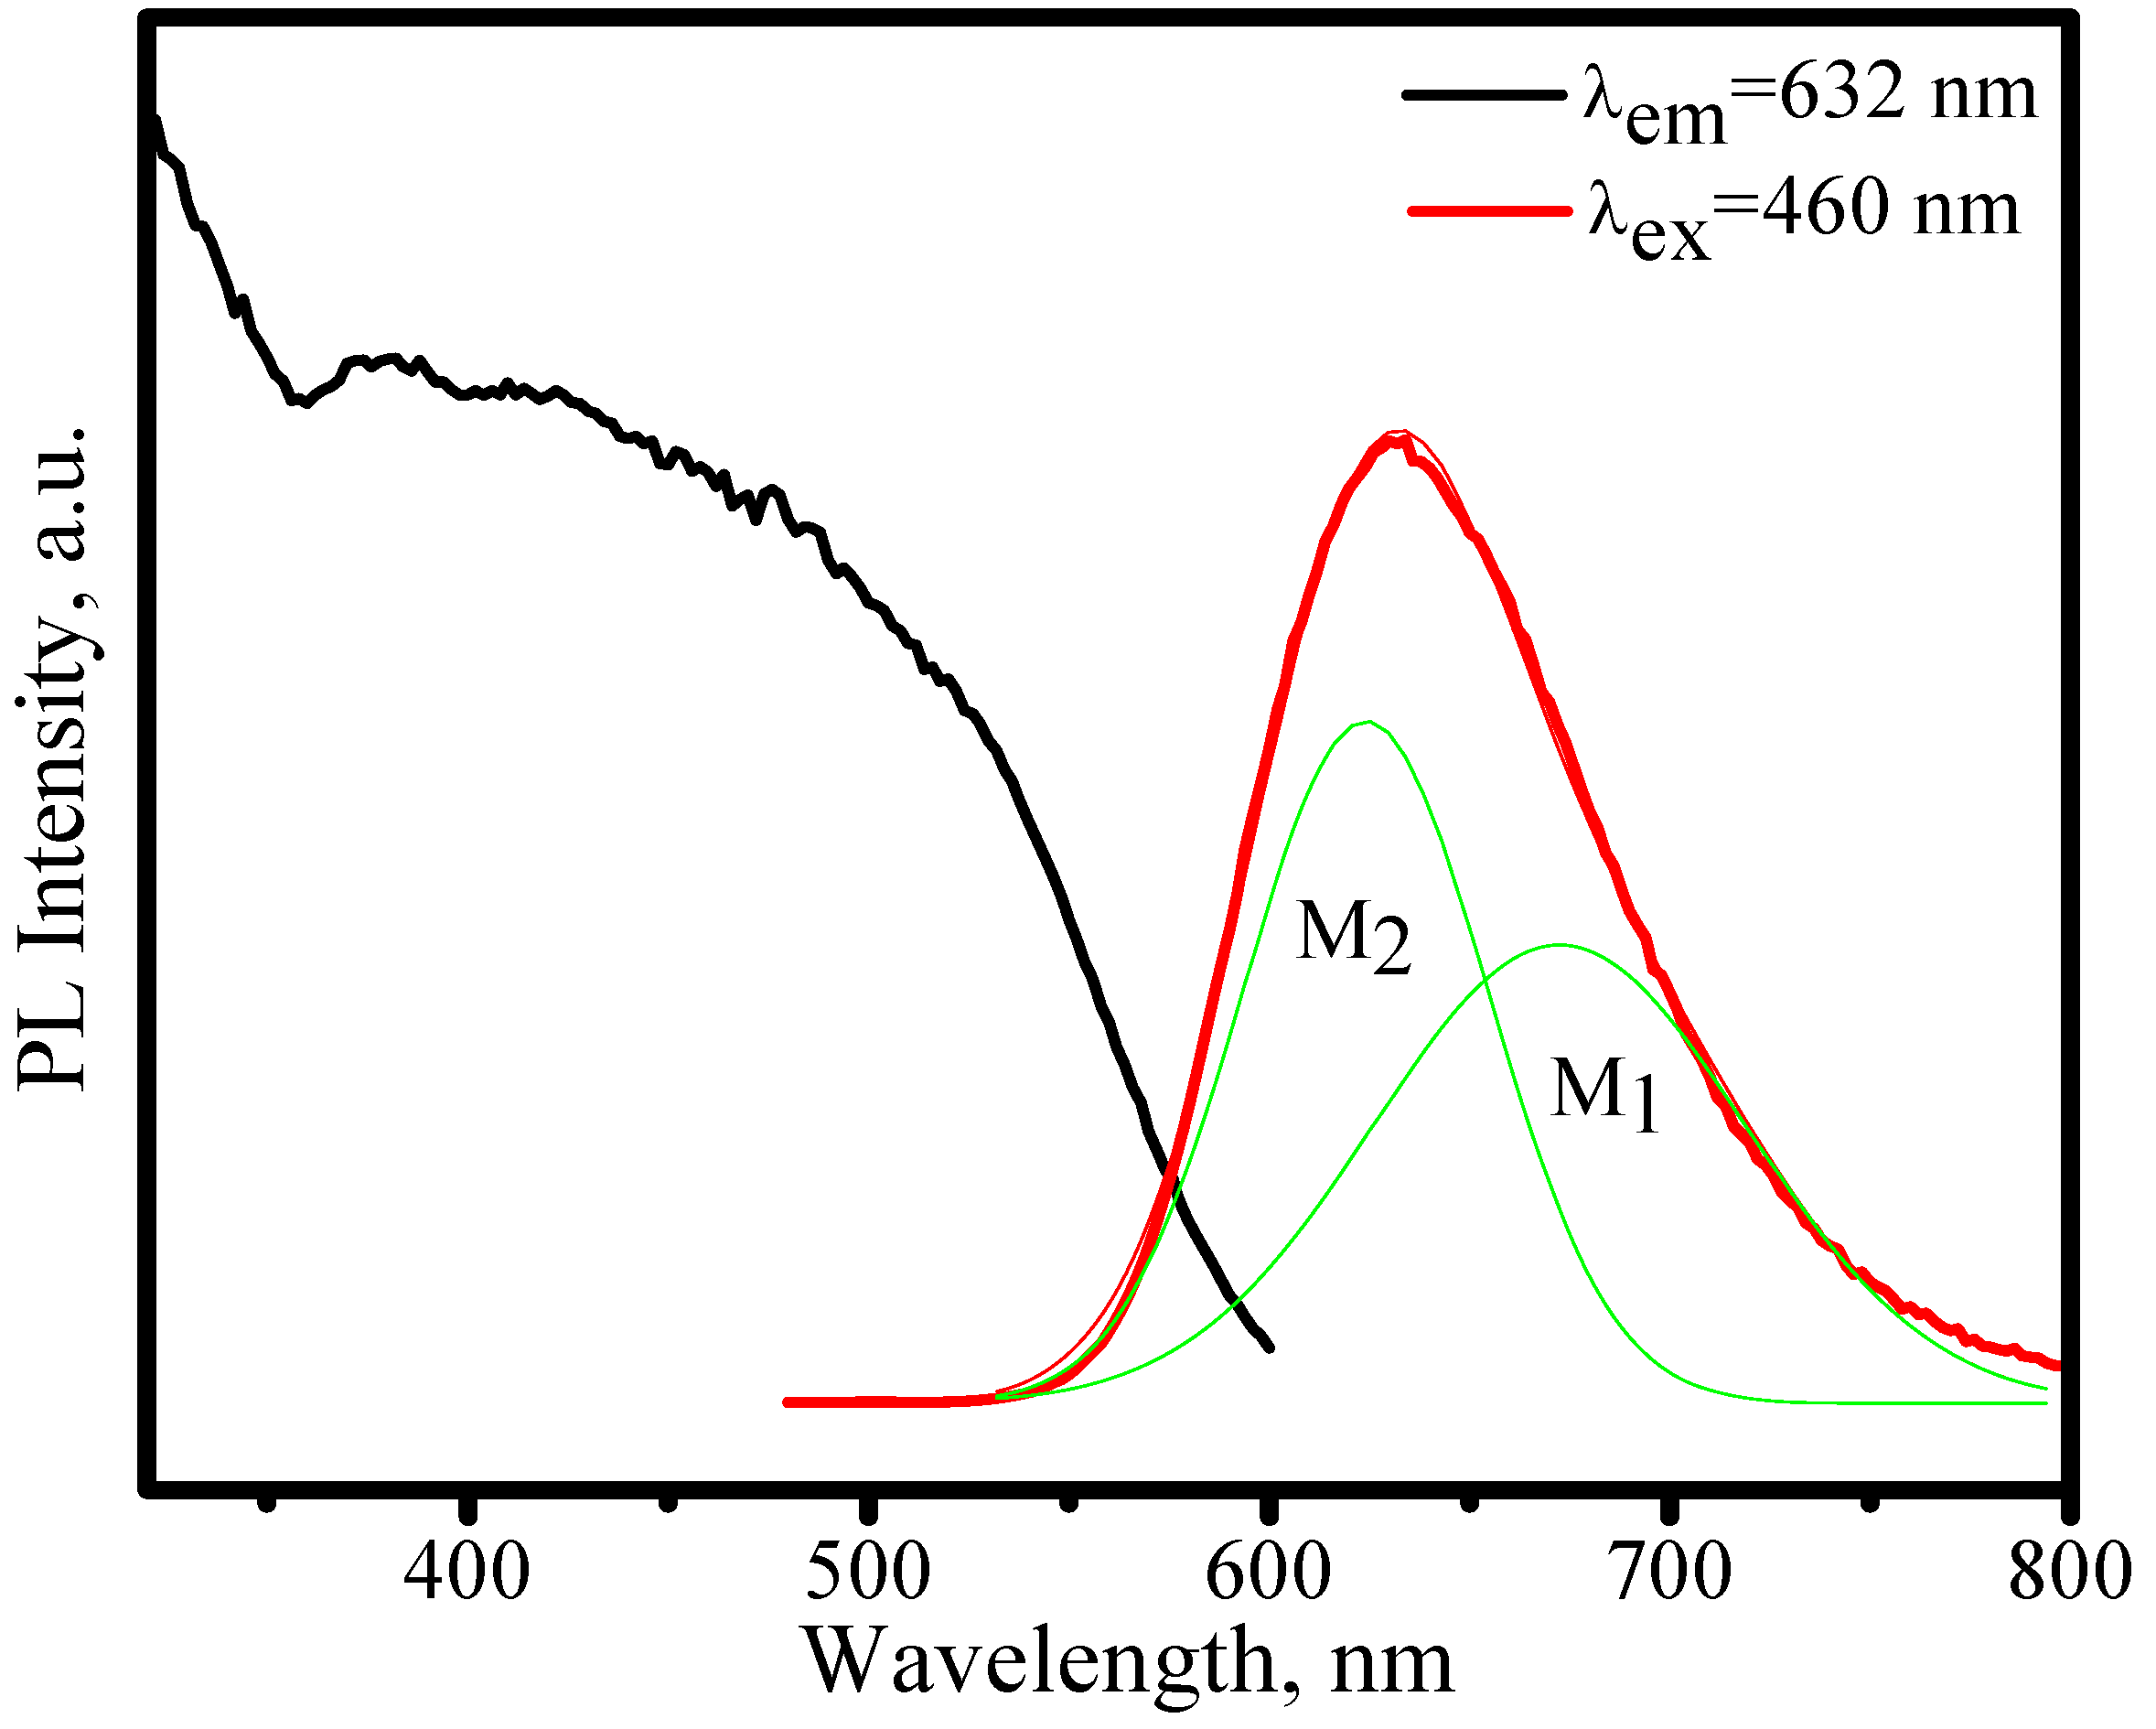
3.3.1. (Sr,Ba)2Si5N8:Eu2+

As for M2Si5N8:Eu2+ (M = Ca, Sr, Ba), they belong to different crystallographic system [25]. The isostructure of Sr2Si5N8 and Ba2Si5N8 have an orthorhombic lattice with the space group of Pmn21, however, Ca2Si5N8 has a monoclinic crystal system with the space group of Cc. The Eu2Si5N8 and M2Si5N8 (M = Sr, Ba) compounds are also isostructural, therefore, Eu2+ ions can be totally incorporated into Sr2Si5N8 and Ba2Si5N8 forming complete solid solutions. However, Eu2+-doped Ca2Si5N8 forms a limited solid solution having a monoclinic lattice. The ideal emission color can be achieved by tuning the nature of M2+ and their concentration. We have achieved an optimized composition as (Sr0.82Ba0.15Eu0.03)2Si5N8, whose XRD pattern is shown in Figure 20. In Figure 20, the red lines denote the standard peaks of Sr2Si5N8 (JCPDS: 85-0101) and the blue line is the measured data. All diffraction peaks blueshift with Ba2+ co-doped into Sr2Si5N8, because the ionic radius of Ba2+ is larger than that of Sr2+ (Ba2+:1.34; Sr2+:1.12). The (Sr0.82Ba0.15Eu0.03)2Si5N8 phosphor was synthesized with high pressure method from the precursors of EuN, Sr3N2, Ba3N2 and Si3N4 in nitrogen atmosphere in our group. The three-dimensional framework structure of Sr2Si5N8 is constructed by corner-sharing SiN4 tetrahedron, as the inset shown in Figure 20, where half the nitrogen atoms are connected to two Si neighbors (N[2]) and the other half have three Si neighbors (N[3]). There are two M sites in M2Si5N8 (M = Sr, Ba) crystal lattice. The N[3] atoms are arranged in corrugated sheets perpendicular to [100]; and the M2+ ions, which are mainly coordinated by N[2] atoms (E-N: 2.60−3.25 Å), are situated in channels along [100] formed by Si6N6 rings [25,26,27,28]. The coordination numbers are 8 and 10 for M1 and M2 sites, respectively [25,26,27,28]. Thus, there would be a large difference in coordination environment (and thus crystal field) for Eu2+ in two different M sites (the mean distance: Sr1–N = 2.865(6) Å versus Sr2–N = 2.928(7) Å; Ba1–N = 2.917(3) Å versus Ba2–N = 2.981(5) Å). However, another viewpoint considers that the coordination number are both 10, just only there are two distinct coordination surroundings for Sr2+, one with an average distance of 3.5 Å and the other 2.969 Å [29]. Despite of the significant controversies over this problem, two types of Sr2+ site are commonly accepted. As expected, two evident emission bands should be observed for the Eu2+ ions occupying two M sites in Sr2Si5N8.
Figure 20. XRD pattern of (Sr0.82Ba0.15Eu0.03)2Si5N8. Inset presents its three-dimensional framework structure.
Materials 03 02172 g020
The emission (λex = 460 nm) and excitation (λem = 632 nm) spectra of (Sr0.82Ba0.15Eu0.03)2Si5N8 are shown in Figure 21. The broad emission band peaked at 632 nm is attributed to 5d→4f transition of Eu2+. The strong excitation band in the region of 300−600 nm, which originates from 4f7→4f65d1 transition of Eu2+, matches perfectly for the blue and nUV LEDs. Therefore, (Sr0.82Ba0.15Eu0.03)2Si5N8 phosphor can down-convert 380−480 nm blue-nUV light from InGaN LEDs into red emission efficiently. After Gaussian deconvolution on an energy scale, the broad emission band in Figure 20 can be well decomposed into two Gaussian components. This phenomenon is more prominent in variable temperature condition.
Figure 21. Emission (λex = 460 nm) and excitation (λem = 632 nm) spectra of (Sr0.82Ba0.15Eu0.03)2Si5N8.
Materials 03 02172 g021
Figure 22 presents the emission spectra of (Sr0.82Ba0.15Eu0.03)2Si5N8 as a function of temperature, in which the emission peaks blueshit from 632 to 618 nm and the asymmetry of spectral configuration becomes more serious as temperature increases from 25 to 300 °C. Thermal quenching is also observed. As shown in Figure 23, the luminescence intensity of (Sr0.82Ba0.15Eu0.03)2Si5N8 at 150 and 300 °C are 87% and 34% of its 25 °C value, respectively
As discussed above, there are tow types site of M2+ in M2Si5N8. Eu2+ has the same valence and slightly smaller ionic radius as M2+ (Eu2+: 1.09, Sr2+: 1.12, and Ba2+: 1.34). Therefore, from the viewpoint of statistical thermodynamics, it is possible for Eu2+ ions to substitute M2+ sites randomly in the M2Si5N8 crystal lattice. It is well know that the crystal field strength, presented as Dq, is inversely proportional to the 5th power of the bond-length R [30].
D q 1 R 5
A shorter bond distance implies a stronger crystal field strength. Accordingly, the decrease of the barycenter of excitation band is much higher with nephelauxetic effect and crystal field on the 4f65d1→4f7 transition of Eu2+ in M2Si5N8. Thus, the high-energy emission, as shown in Figure 22, originates from the Eu2+ ions which occupy loose crystal circumstance with larger Sr-N bond length (M2); and the low-energy emission originates from the Eu2+ ions which occupy compact crystal circumstance with shorter Sr-N bond length (M1). Based on these, the mechanism of the blueshift of emission peaks with temperature increasing can be explained rationally according to the thermal phonon-assisted tunneling model, as shown in Figure 11.
Figure 22. Emission spectra (λex = 460 nm) of (Sr0.82Ba0.15Eu0.03)2Si5N8 under 460 nm excitation measured at different temperature.
Materials 03 02172 g022
Figure 23. Luminescence intensity of (Sr0.82Ba0.15Eu0.03)2Si5N8 under 460 nm excitation as a function of temperature.
Materials 03 02172 g023
Besides configuration-coordinate model, there is no better physical model to elucidate thermal quenching of luminescence, which is adopted here. As revealed in Figure 24, the thermally active phonon-assisted tunneling from the excited states of low-energy (M1) emission band to the excited states of high-energy (M2) emission band in the configuration coordinate diagram increases with an increase of temperature. The energy transfer from the M1 site to M2 site through the phonon-assisted tunneling intersection of S point by overcoming the energy barrier and finally reverts to the ground state to give a shorter wavelength emission. The probability of an electron making the transition via point S is generally described as following relation:
α = s exp ( Δ E K T )
where K in the formula (1) presents the Boltzmann constant and s is the frequency factor. This transition is strongly dependent on the energy barrier ΔE and temperature T. The probability α generally increases with temperature increasing. Additionally, the 4f electron in the excited state crosses the intersection point between the 4f65d and 4f7 states of Eu2+ ion through thermal phonon-assisted tunneling and returns to the ground state nonradiatively. Therefore, the Eu2+ emission peaks blueshift and luminescence intensity decreases with an increase of temperature.
Figure 24. Thermally active phonon-assisted tunneling of Eu2+ from low-energy site to high-energy site in configuration-coordinate diagram.
Materials 03 02172 g024
Notes: GS: ground state; ES: excited state; Ex: excitation; Em: emission; S: energy barrier of excited state compared to ground state; ΔE1 and ΔE2 denote the energy barrier for the transitions of ES1→ES2 and ES2→ES1, respectively.

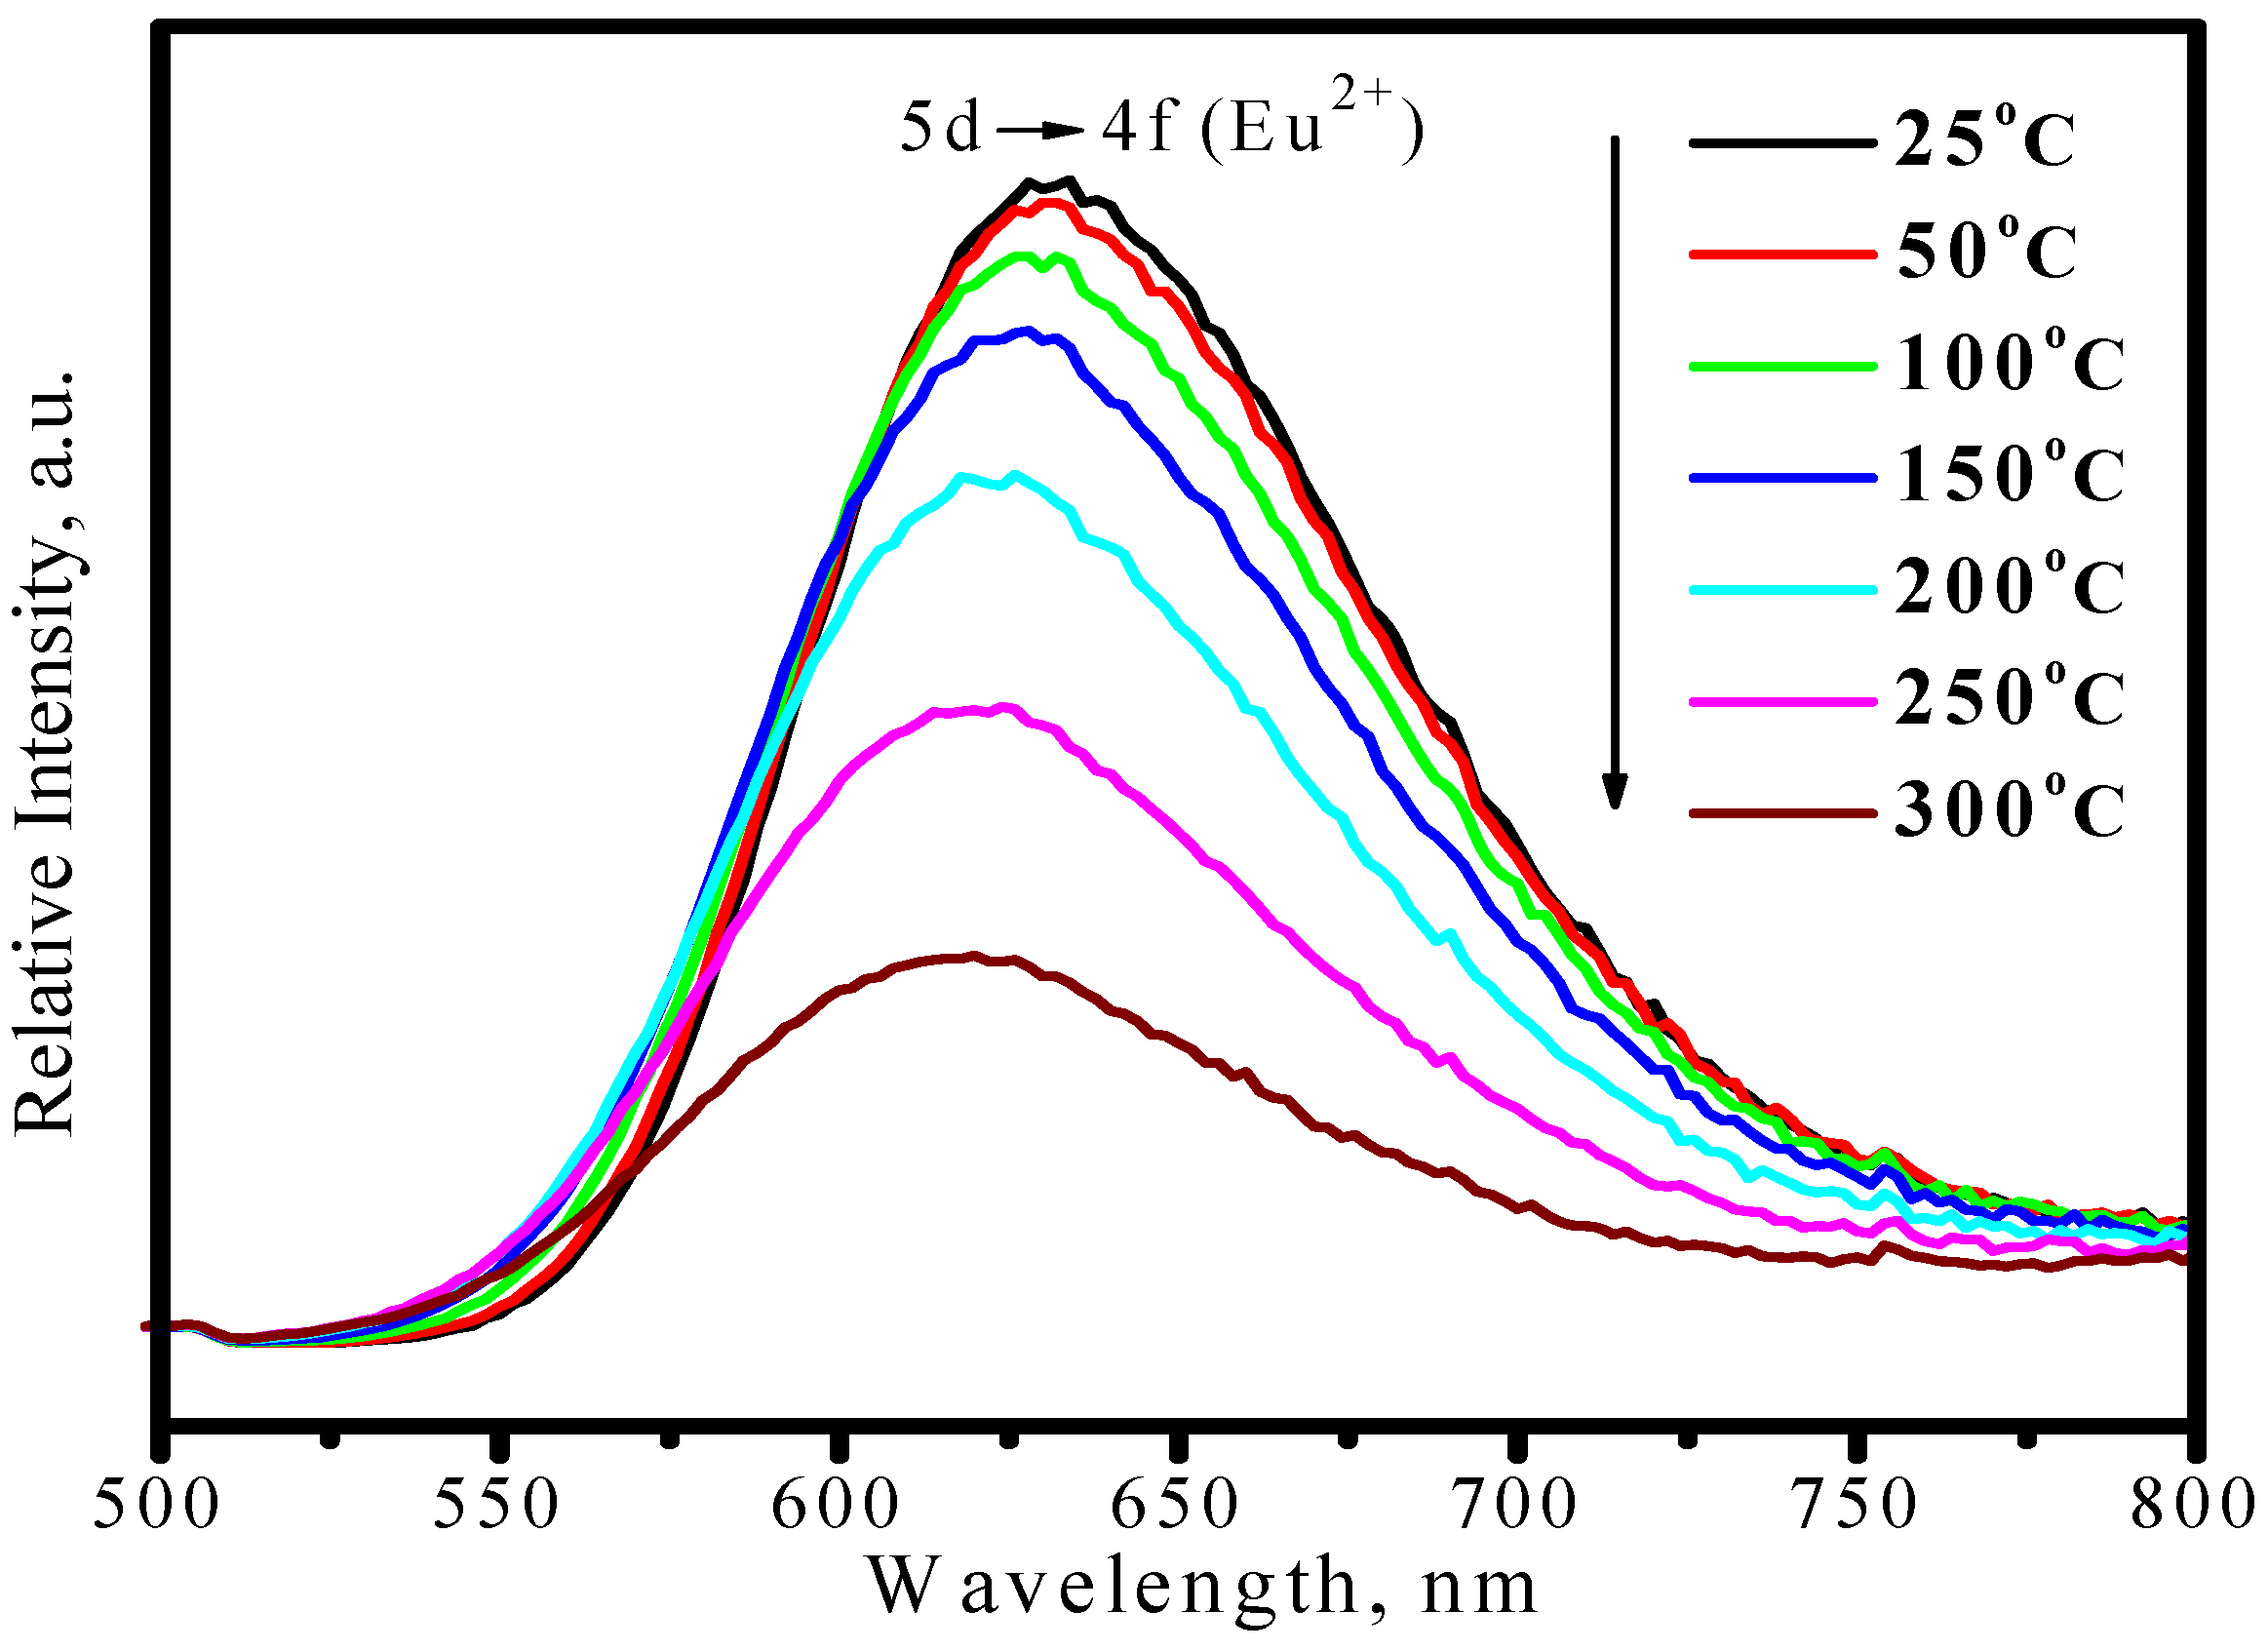
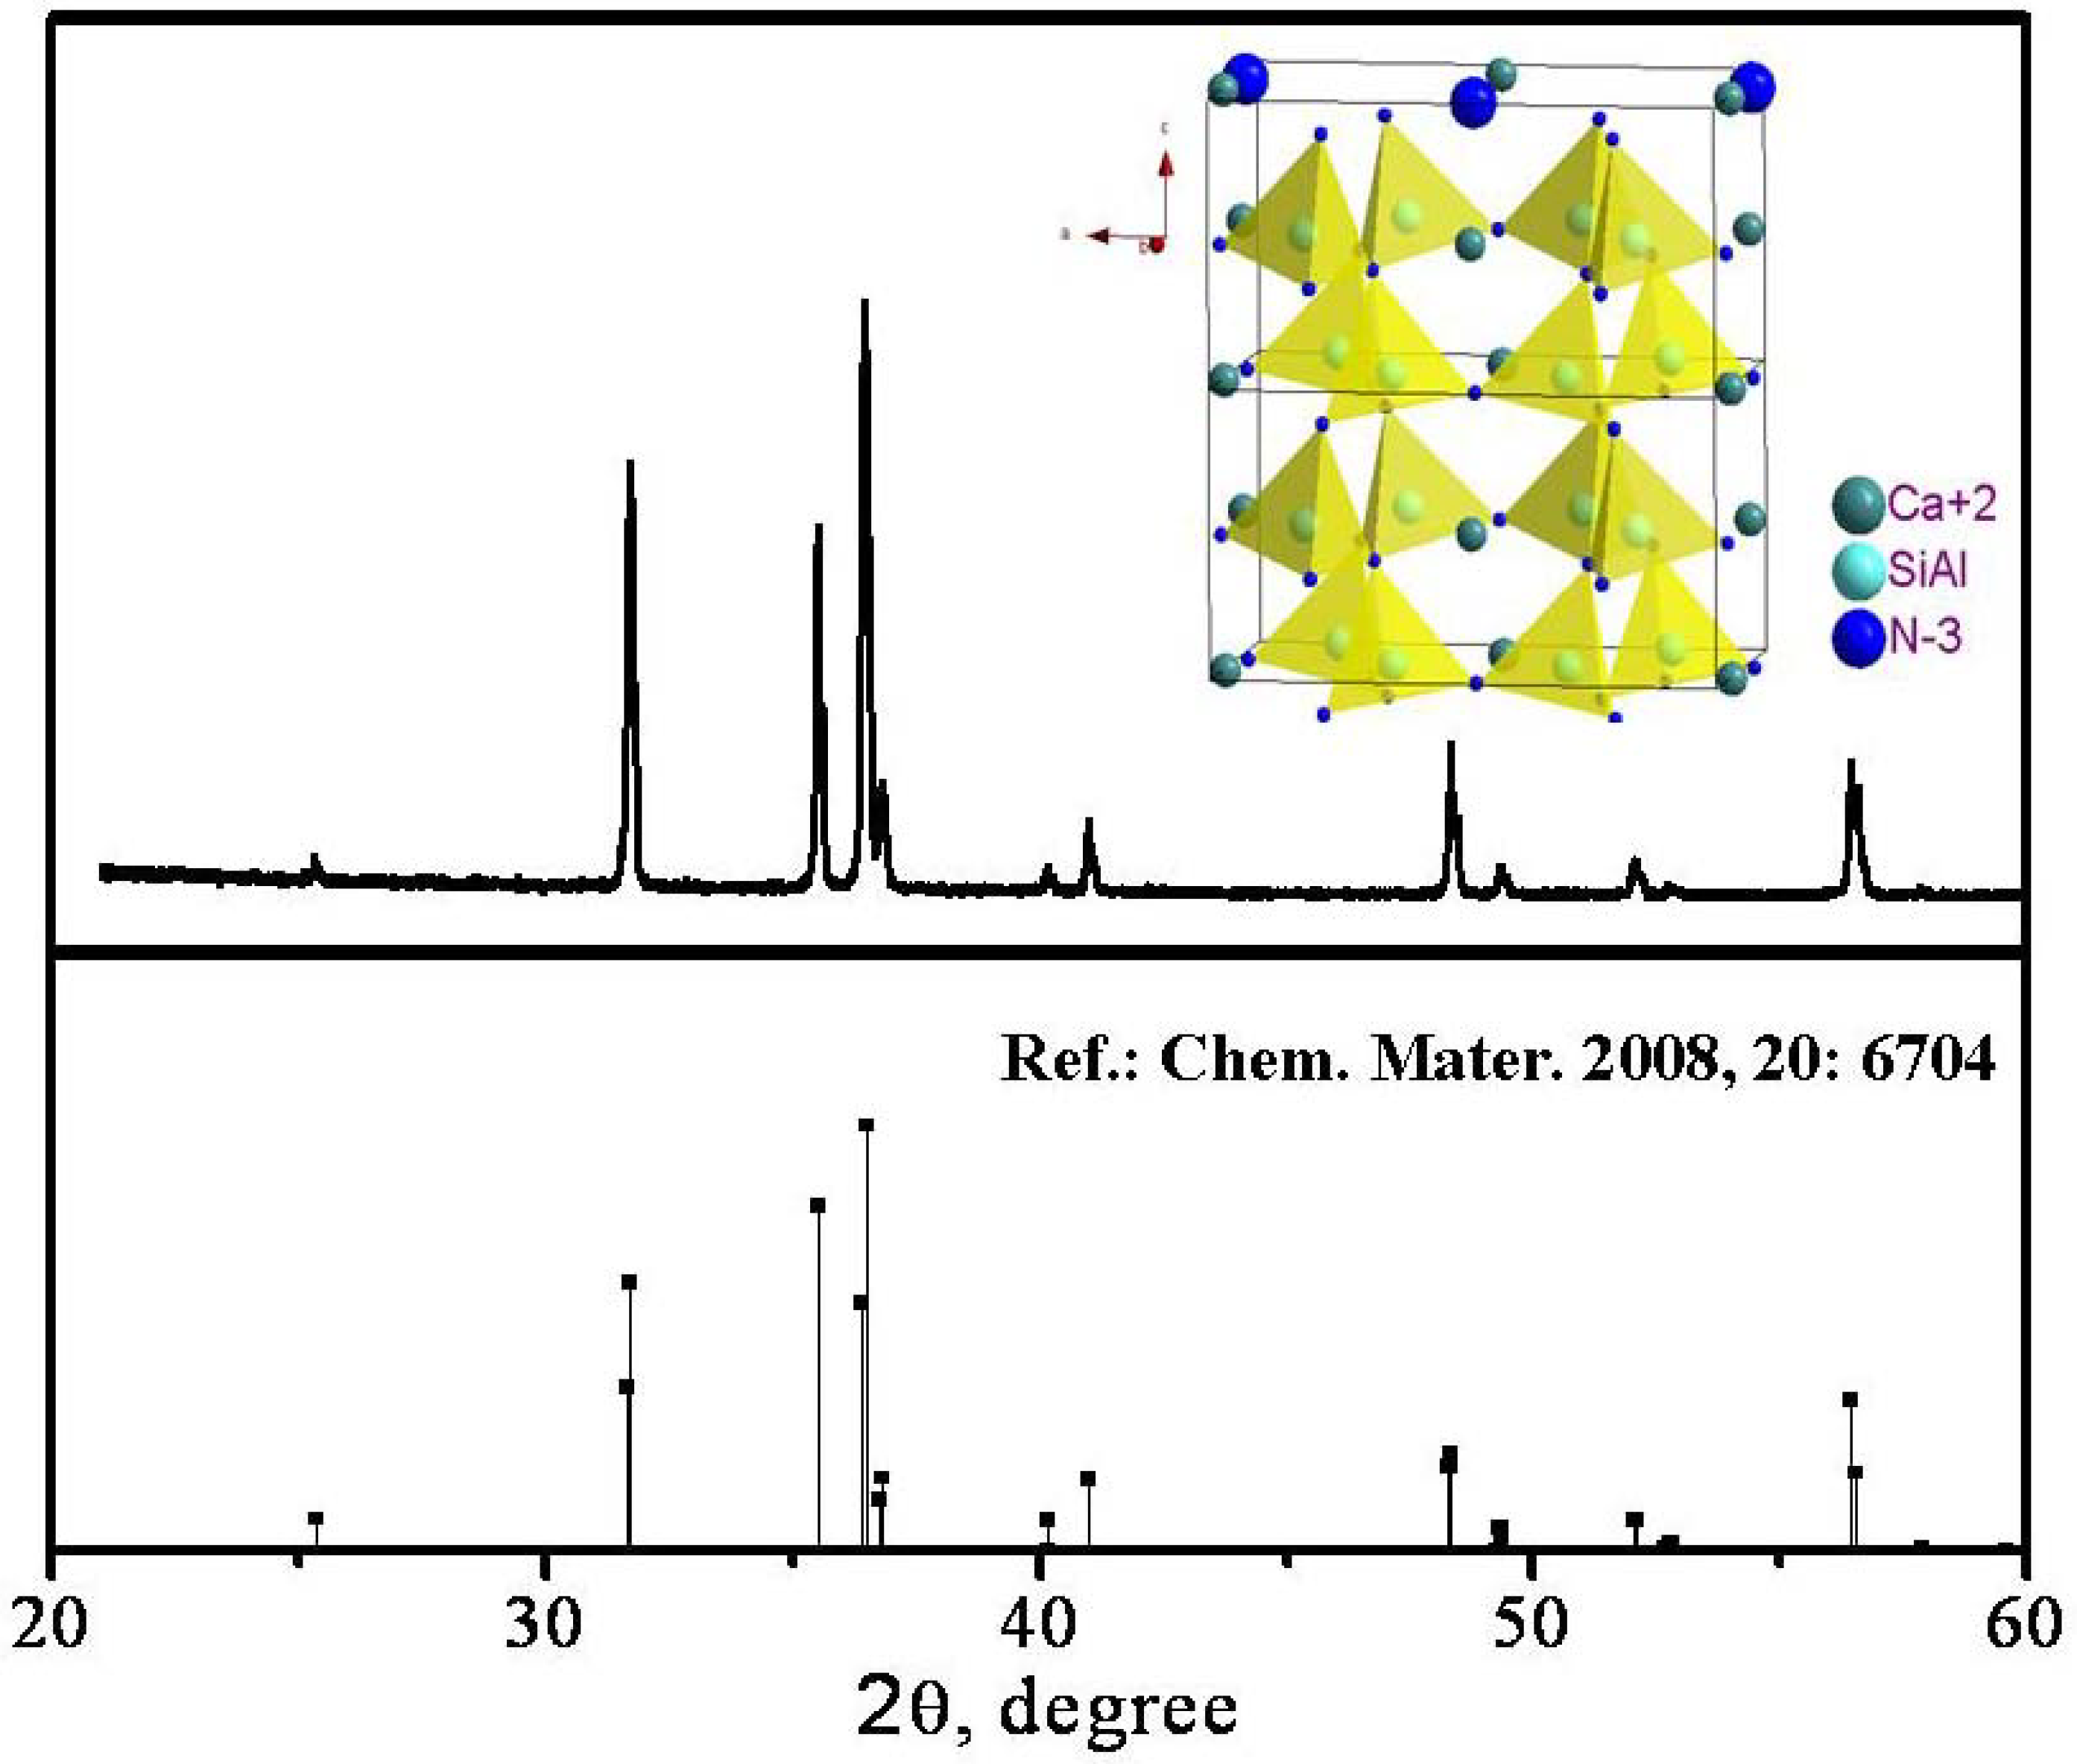
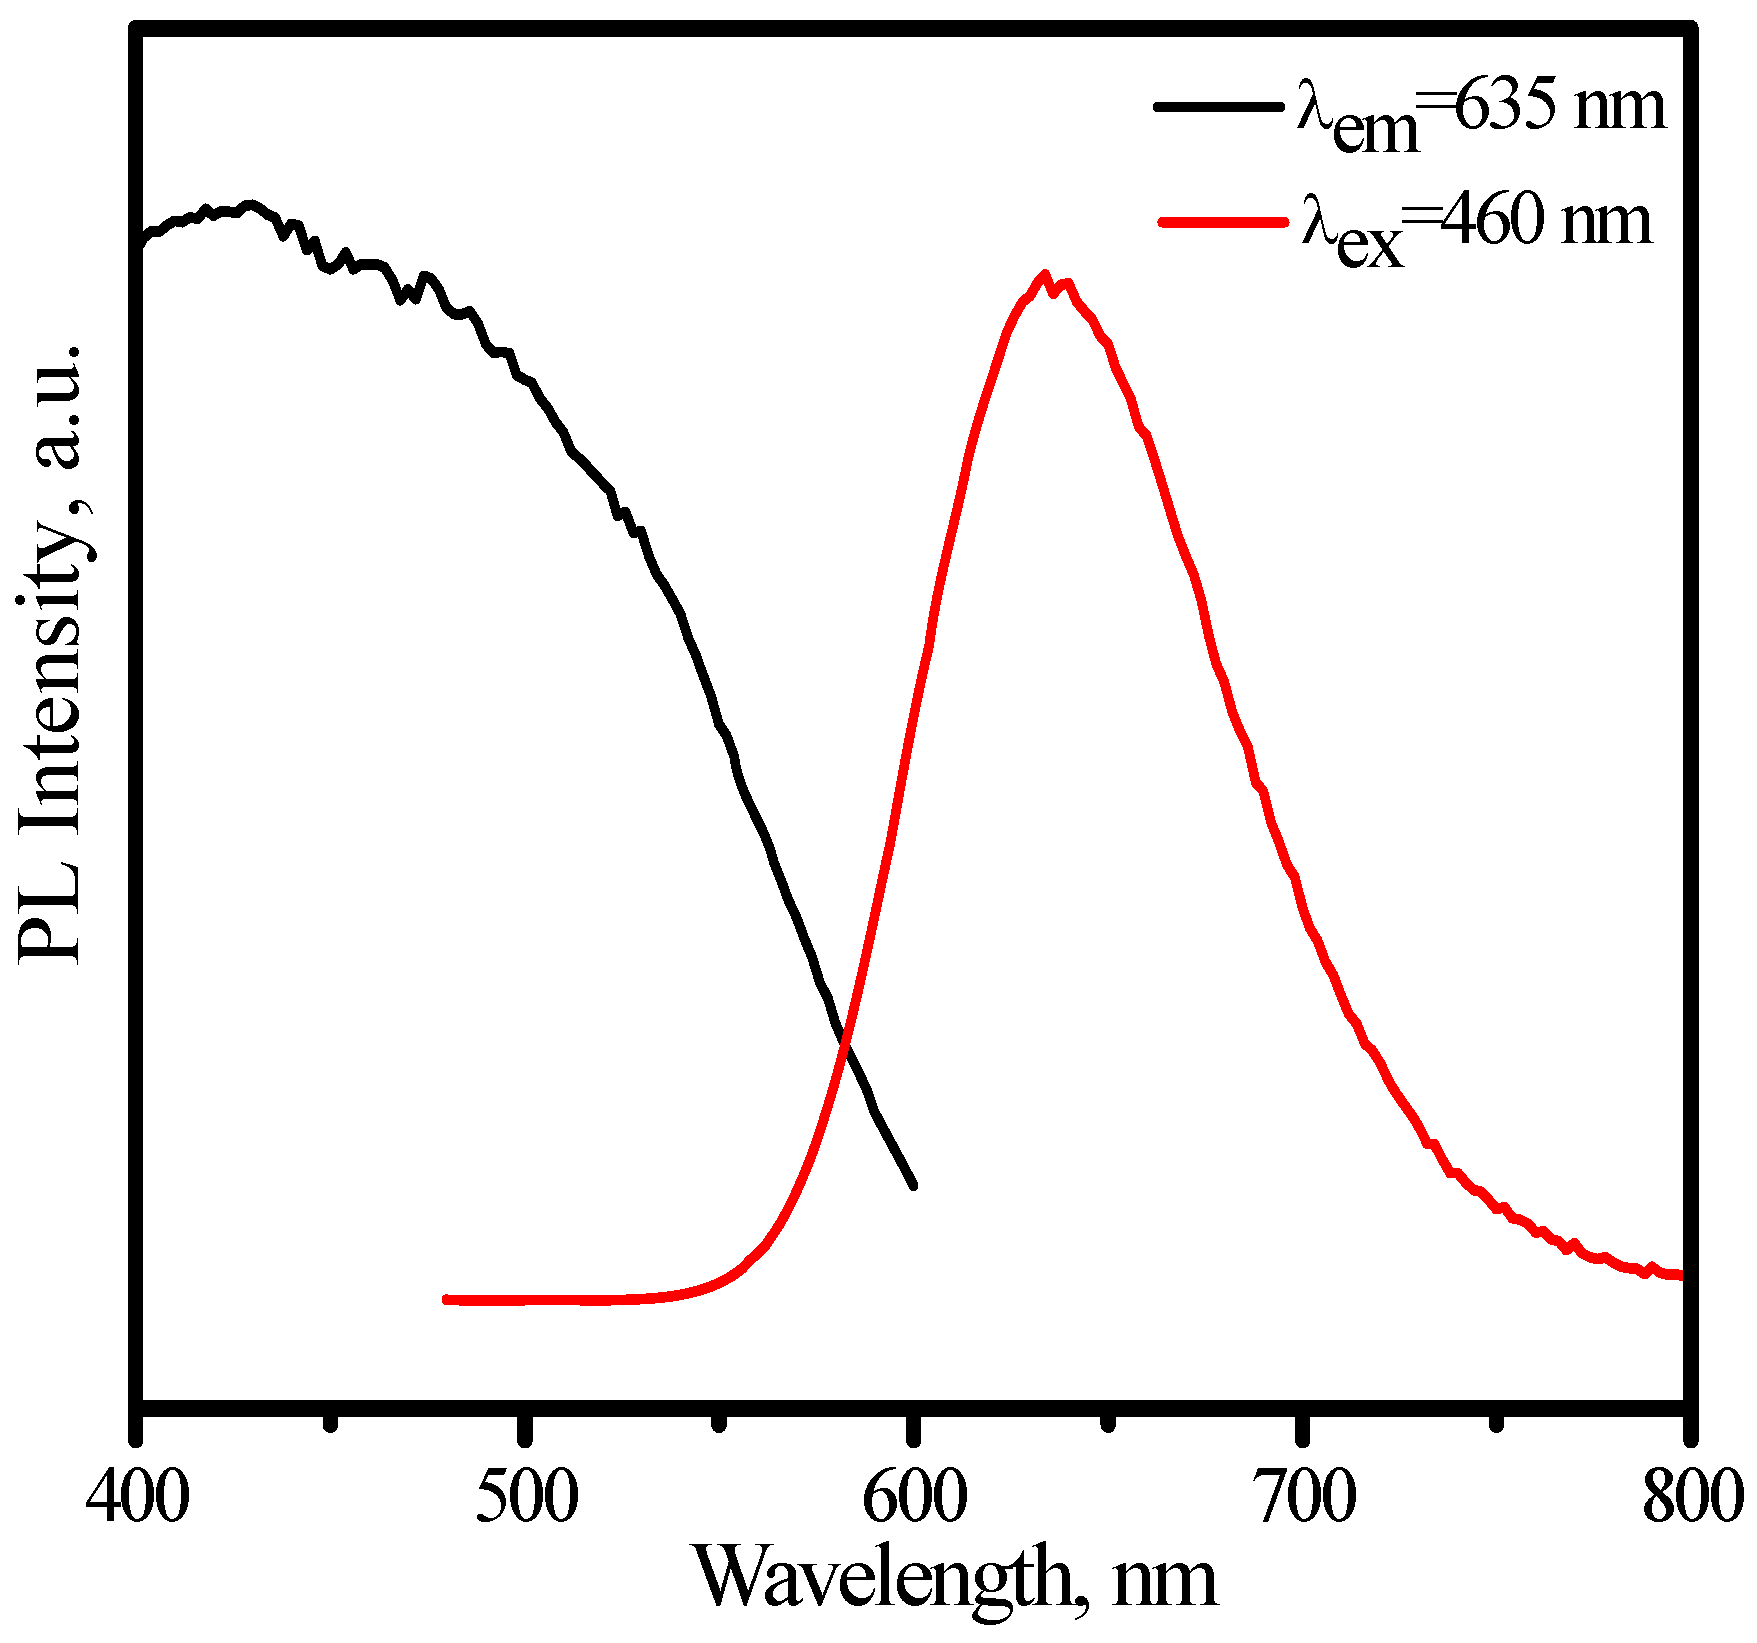
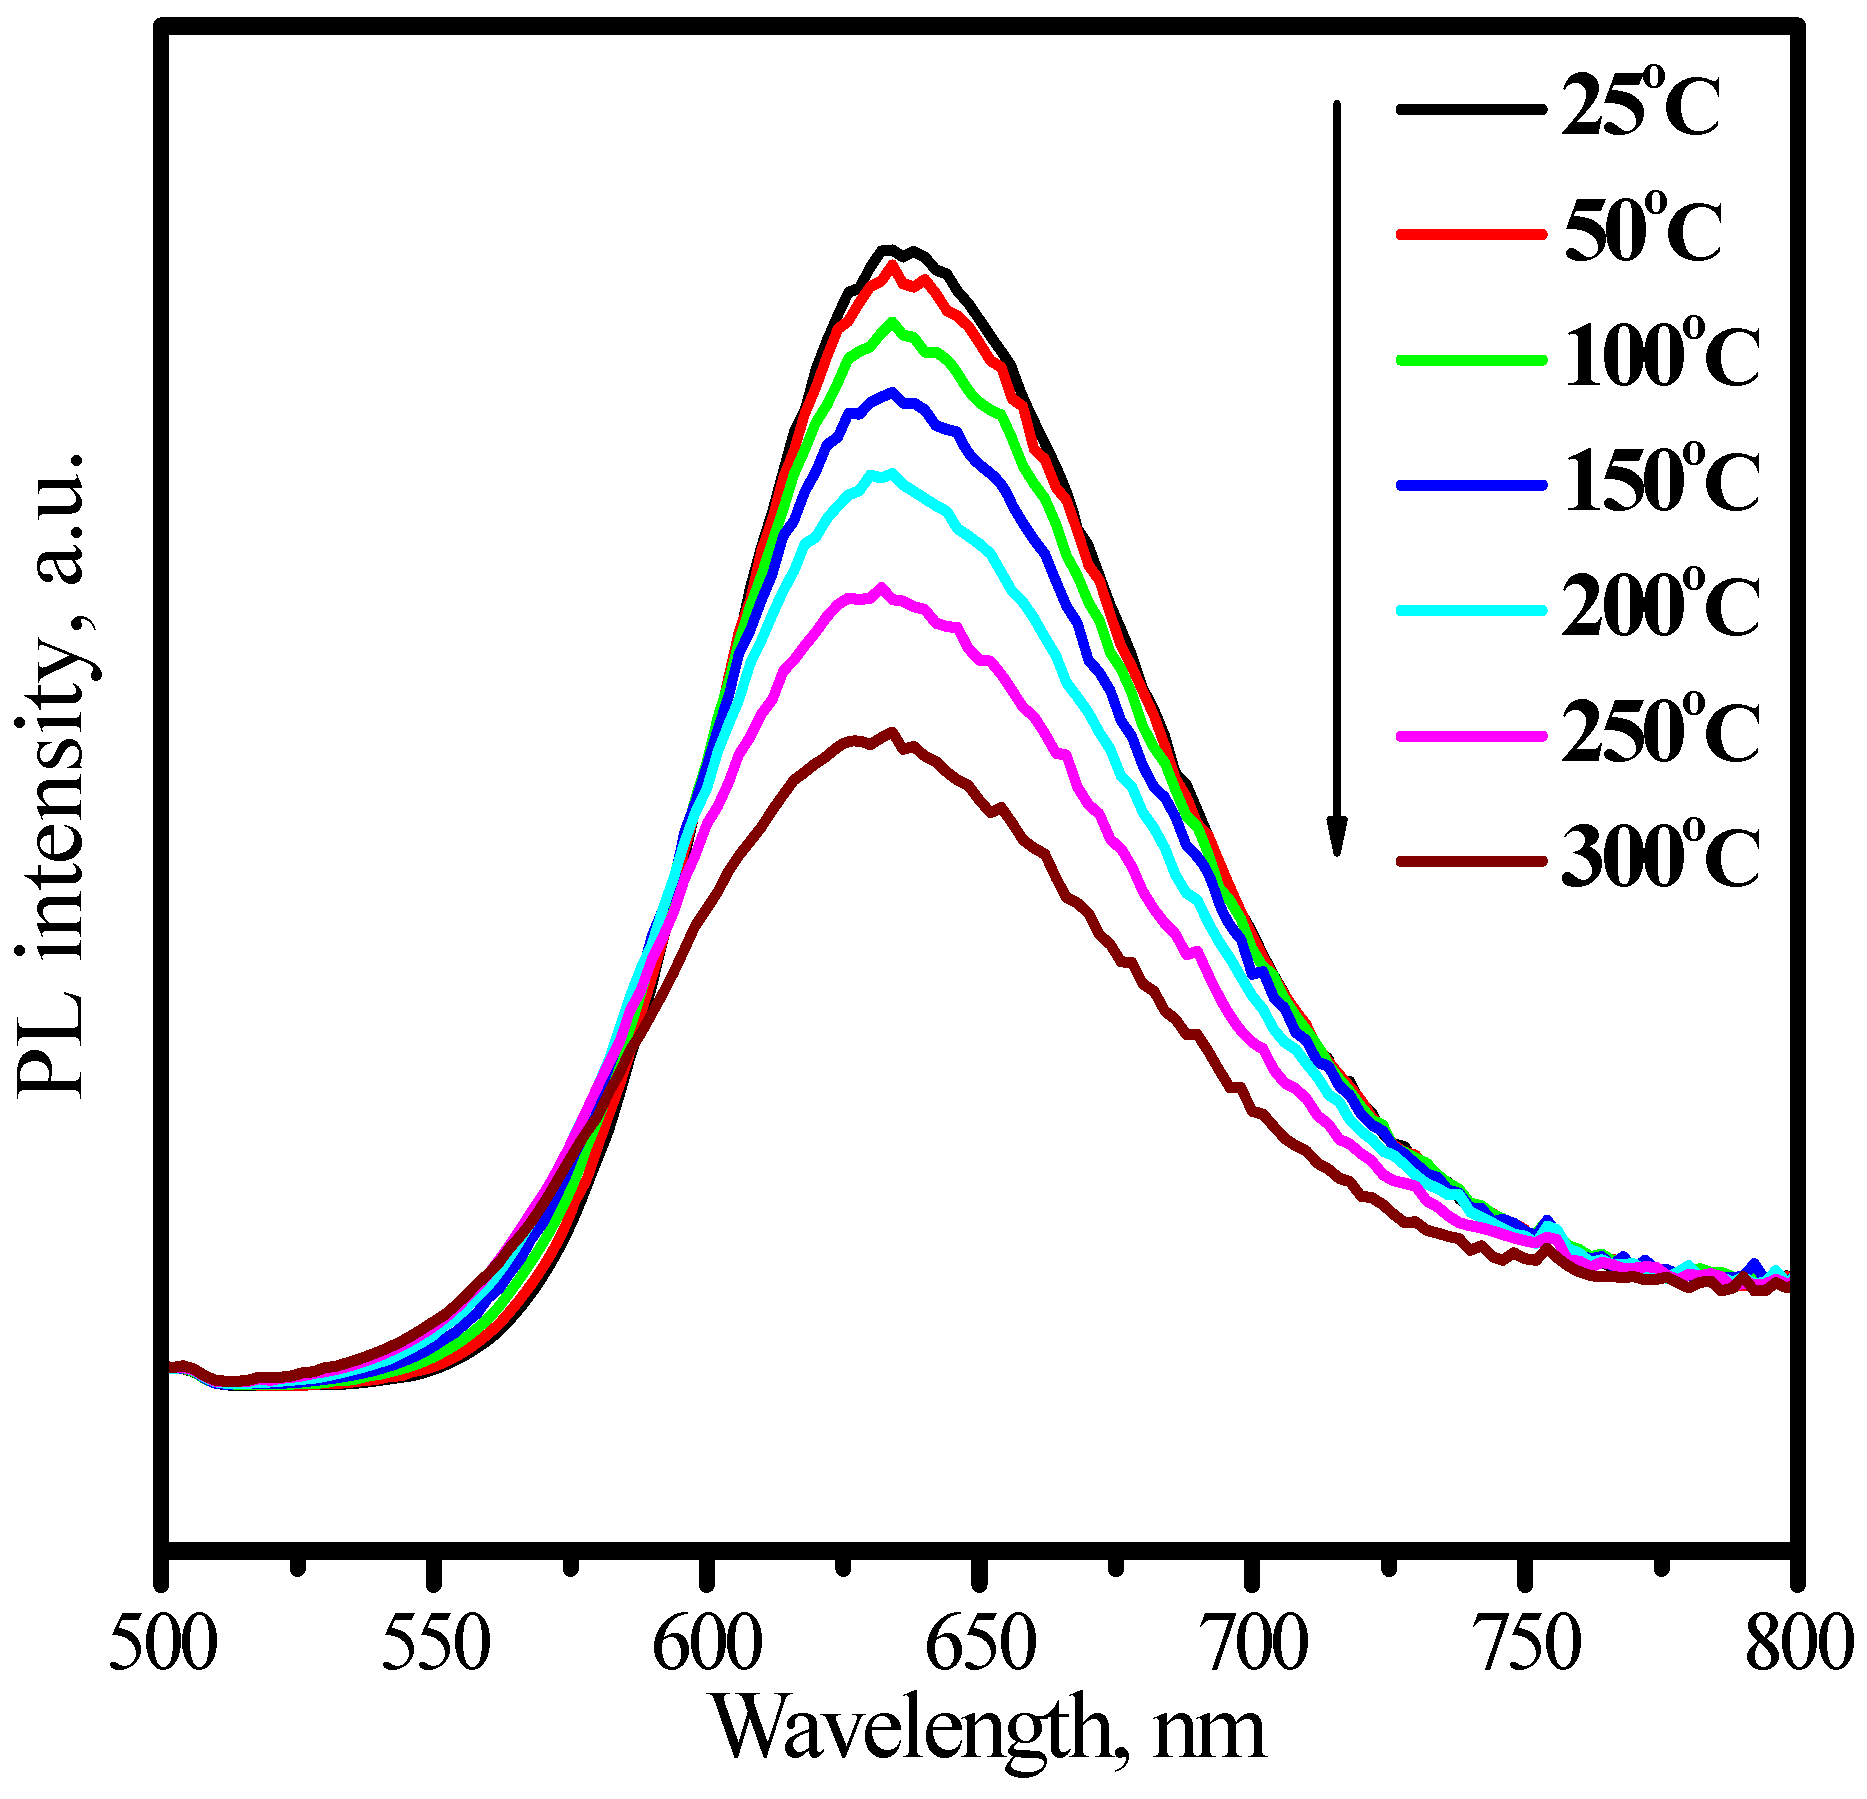
3.3.2. (Sr,Ca)SiAlN3:Eu2+

CaAlSiN3 has an orthorhombic structure with space group of Cmc21 (No. 36) [31,32]. The XRD pattern of (Sr,Ca)SiAlN3 phosphor synthesized in our group is consistent with reference [33], as shown in Figure 25. In accordance with the space group, Al and Si atoms in the crystal distribute randomly at 8b sites. The inset in Figure 25 presents the three-dimensional structure of CaAlSiN3. The tetrahedra of SiN4 and AlN4 form a six-member ring by sharing corner and Ca2+ ion locates in the centre of the ring. The rings consisted of the six tetrahedra form a sheet-A by linking together parallel to the a, b-plane. Another sheet B, which is equivalent to the sheet-A rotated by 21 operation, is overlaid on the sheet-A to form a rigid three dimensional framework. Two-thirds of the N atoms are coordinated with three Si atoms and one-third N atoms are coordinated with two Si atoms. Ca2+ ions are accommodated in cavities in the overlaid planes. The Ca site is coordinated with one N atom at a bond length of 0.2490(5) nm, two at about 0.2405(3) nm, one at about 0.2539(5) nm, and another N atom is located at 0.2586(5) nm separation. Therefore, the Ca site is four-coordinated when only the nearest-neighbor ions are taken into account, but more exactly five-coordinated. With Eu2+ co-doped into CaAlSiN3, unit cell volume is expanded linearly with Eu2+ concentration increasing at least up to 20 mol %, because the radius of Eu2+ ion is larger than that of Ca2+ (Ca2+:0.99; Eu2+:1.09). Therefore, Eu2+ ions should take place of Ca2+ sites in crystal lattice. The emission color and intensity of Eu2+ depends on Eu2+ concentration.
Figure 25. XRD pattern of (Sr,Ca)SiAlN3 phosphor.
Materials 03 02172 g025
According to Uheda’s results [32], the emission intensity reaches maxima when Eu2+ concentration was 1.6% mol, but the wavelength of emission band with a peak at about 650 nm is too long and even some have been out of visible range. Such red emission is difficulty to mix with other emission color to form a good white light. The emission band is blueshifted by co-doping with proper Sr2+ and correspondingly, luminescence intensity is improved. An optimized composition, namely (Sr0.75Ca0.25)0.98SiAlN3:Eu2+0.02, has been obtained in our group.
Figure 26 presents the emission spectrum under 460 nm excitation and the excitation of (Sr0.75Ca0.25)0.98SiAlN3:Eu2+0.02 by monitoring Eu2+ emission at 635 nm. The excitation matches perfectly for the blue and nUV LEDs, which indicates that (Sr0.75Ca0.25)0.98SiAlN3:Eu2+0.02 phosphor can down-convert 380−450 nm blue-nUV light from InGaN LEDs into red emission efficiently. The peak of emission bands blueshift from about 635 to 631 nm with an increase of temperature from 25 to 300 °C, as shown in Figure 27. The thermal quenching is also observed. The luminescence intensity at 150 and 300 °C is 87 and 58% that of at 25 °C, respectively, as shown in Figure 28. From Figure 28, we get to know that the thermal quenching is recoverable for the duplicate curve of heating and cooling process. The mechanism of the blueshift of emission bands and the thermal quenching of luminescence are similar to those of (Sr,Ba)2Si5N8:Eu2+.
Figure 26. Emission (λex = 460 nm) and excitation (λem = 635 nm) spectra of (Sr0.75Ca0.25)0.98SiAlN3:Eu2+0.02.
Materials 03 02172 g026
Figure 27. Emission (λex = 460 nm) spectra of (Sr0.75Ca0.25)0.98SiAlN3:Eu2+0.02 under 460 nm excitation measured at different temperature.
Materials 03 02172 g027
Figure 28. Luminescence intensity of (Sr0.75Ca0.25)0.98SiAlN3:Eu2+0.02 under 460 nm excitation as a function of temperature.
Materials 03 02172 g028

4. Conclusions

In conclusion, the strategies for generating white light by combining light-emitting diodes with converting phosphors and the phosphors that are available for producing white light with different luminescence efficiency and color rendering index properties are summarized in this paper. As shown in Figure 1 and Figure 29, to get white light with high efficiency but with low coloring index, yellow phosphors (such as YAG:Ce3+ or (Sr,Ba)SiO4:Eu2+) combining with blue LEDs are a good choice, which is suitable for the place that requires high brightness but without high requirement of color rendering; to obtain white light with high color rendering index but with low efficiency, green (such as LuAG:Ce3+ or (Ba,Sr)SiO4:Eu2+) and red phosphors (such as (Sr,Ba)2Si5N8:Eu2+ or (Sr,Ca)SiAlN3:Eu2+) combining with blue LEDs are a perfect choice, which is suitable for the place that requires high color rendering but without high requirement of efficiency; to achieve white light with appropriate color rendering index and moderate luminescence efficiency, blue LEDs and yellow phosphor (such as YAG:Ce3+ or (Sr,Ba)SiO4:Eu2+ ) by adding proper red phosphors (such as (Sr,Ba)2Si5N8:Eu2+ or (Sr,Ca)SiAlN3:Eu2+) are a perfect choice, which is suitable for the circumstance where both the effects of color rendering index and efficiency should be taken into account. Additionally, the white light with high color rendering index and low efficiency can also be produced by combining nUV LEDs with tri-color phosphors, but the luminescence efficiency is very lower comparing with blue LEDs. Up to now, however, the converting phosphors that are convenient to combine with blue LEDs to produce white light with high color rendering index and high luminance have not been found, as the interrogation marked in Figure 29. Therefore, the researches on LED phosphors in future will focus on this point.
Figure 29. Strategies for white light generating by combining blue light-emitting diodes with different converting phosphors.
Materials 03 02172 g029

Acknowledgements

The authors would like to thank the National Science Council, Taiwan (Contract Nos. NSC 97-2113-M-002-012-MY3, NSC 97-3114-M-002-005, and NSC 97-3114-M-002), for financially supporting this research. This paper is also supported by Postdoctoral Science Foundation of China (20090450802) and Science Foundation for The Excellent Youth Scholars of Ministry of Education of China (20090111120001).

References and Notes

  1. Henini, M. The blue laser diode: The complete story (2nd and extended edition): S. Nakamura, S. Pearton, G. Fasol; Springer-Verlag Berlin Heidelberg New York, 368 pages, ISBN: 3-540-66505-6. Microelectr. J. 2001, 32, 177. [Google Scholar] [CrossRef]
  2. Kovac, J.; Peternai, L.; Lengyel, O. Advanced light emitting diodes structures for optoelectronic applications. Thin Solid Films 2003, 433, 22–26. [Google Scholar] [CrossRef]
  3. Nakamura, S.; Senoh, M.; Mukai, T. P-GaN/N-InGaN/N-GaN double-heterostructure blue-light-emitting diodes. Jpn. J. App. Phys. 1993, 32, L8–L11. [Google Scholar] [CrossRef]
  4. Nakamura, S. InGaN-based laser diodes (In Japanese). Nikkei Electron. 1994, 602, 93. [Google Scholar]
  5. Nakamura, S.; Mukai, T.; Senoh, M. Candela-class high-brightness InGaN/AlGaN double-heterostructure blue-light-emitting diodes. Appl. Phys. Lett. 1994, 64, 1687–1689. [Google Scholar] [CrossRef]
  6. Nakamura, S.; Fasol, G. The Blue Laser Diode: GaN Based Light Emitters and Lasers; Springer: Berlin, Germany, 1997; p. 216. [Google Scholar]
  7. Liu, J.; Lian, H.; Sun, J.; Shi, C. Characterization and properties of green emitting Ca3SiO4Cl2:Eu2+ powder phosphor for white light-emitting diodes. Chem. Lett. 2005, 34, 1340–1341. [Google Scholar] [CrossRef]
  8. Schubert, E.F.; Kim, J.K. Solid-state light sources getting smart. Science 2005, 308, 1274–11278. [Google Scholar] [CrossRef] [PubMed]
  9. Liu, R.S.; Liu, Y.H.; Bagkar, N.C.; Hu, S.F. Enhanced luminescence of SrSi2O2N2:Eu2+ phosphors by codoping with Ce3+, Mn2+, and Dy3+ ions. Appl. Phys. Lett. 2007, 91, 061119. [Google Scholar] [CrossRef]
  10. Mancic, L.; Marinkovic, K.; Marinkovic, B.A.; Dramicanin, M.; Milosevic, O. YAG:Ce3+ nanostructured particles obtained via spray pyrolysis of polymeric precursor solution. J. Eur. Ceram. Soc. 2010, 30, 577–582. [Google Scholar] [CrossRef]
  11. Li, Y.X.; Min, Y.L.; Zhou, X.Z.; You, X.Z. Coating and stability of YAG:Ce phosphor synthesized using inorganic-organic hybrid gel method. Chin. J. Inorg. Chem. 2003, 19, 1169–1174. [Google Scholar]
  12. Lu, C.H.; Hong, H.C.; Jaganathan, R. Sol–gel synthesis and photoluminescent properties of cerium-ion doped yttrium aluminium garnet powders. J. Mater. Chem. 2002, 12, 2525–2530. [Google Scholar] [CrossRef]
  13. Zhou, Y.; Lin, J.; Yu, M.; Wang, S.B.; Zhang, H.J. Synthesis-dependent luminescence properties of Y3Al5O12:Re3+ (Re = Ce, Sm, Tb) phosphors. Mater. Lett. 2002, 56, 628–636. [Google Scholar] [CrossRef]
  14. Shi, S.K.; Wang, J.Y. Combustion synthesis of Eu3+ activated Y3Al5O12 phosphor nanoparticles. J. Alloys Compounds 2001, 327, 82–86. [Google Scholar] [CrossRef]
  15. Larson, A.C.; Von Dreele, R.B. Generalized Structure Analysis System (GSAS); Los Alamos National Laboratory Report LAUR 86−748; Los Alamos National Laboratory: Los Alamos, NM, USA, 1994. [Google Scholar]
  16. Chiang, C.C.; Tsai, M.S.; Hon, M.H. Luminescent properties of cerium-activated garnet series phosphor: Structure and temperature effects. J. Electrochem. Soc. 2008, 155, B517–B520. [Google Scholar] [CrossRef]
  17. Jacobs, R.R.; Krupke, W.F.; Weber, M.F. Measurement of excited-state-absorption loss for Ce3+ in Y3Al5O12 and implications for tunable 5d→4f rare-earth lasers. Appl. Phys. Lett. 1978, 33, 410–412. [Google Scholar] [CrossRef]
  18. Dong, Y.; Zhou, G.; Xu, J.; Zhao, G.; Su, F.; Su, L.; Zhang, G.; Zhang, D.; Li, H.; Si, J. Luminescence studies of Ce:YAG using vacuum ultraviolet synchrotron radiation. Mater. Res. Bull. 2006, 41, 1959–1963. [Google Scholar] [CrossRef]
  19. Catti, M.; Gazzoni, G.; Ivaldi, G. Structures of twinned β-Sr2SiO4 and of α'-Sr1.9Ba0.1SiO4. Acta Crystallogr. C 1983, 39, 29–34. [Google Scholar] [CrossRef]
  20. Höppe, H.A.; Lutz, H.; Morys, P.; Schnick, W.; Seilmeier, A. Luminescence in Eu2+-doped Ba2Si5N8: Fluorescence, thermoluminescence, and upconversion. J. Phys. Chem. Solids 2000, 61, 2001–2006. [Google Scholar] [CrossRef]
  21. van Krevel, J.W.H.; Hintzen, H.T.; Metselaar, R.; Meijerink, A. Long wavelength Ce3+ emission in Y–Si–O–N materials. J. Alloys Compounds 1998, 268, 272–277. [Google Scholar] [CrossRef]
  22. van Krevel, J.W.H.; van Rutten, J.W.T.; Mandal, H.; Hintzen, H.T.; Metselaar, R. Luminescence properties of terbium-, cerium-, or europium-doped α-sialon materials. J. Solid State Chem. 2002, 165, 19–24. [Google Scholar] [CrossRef]
  23. Xie, R.J.; Mitomo, M.; Uheda, K.; Xu, F.F.; Akimune, Y. Preparation and luminescence spectra of Calcium- and Rare-Earth (R = Eu, Tb, and Pr)-codoped α-SiAlON ceramics. J. Am. Ceram. Soc. 2002, 85, 1229–1234. [Google Scholar] [CrossRef]
  24. Uheda, K.; Takizawa, H.; Endo, T.; Yamane, H.; Shimada, M.; Wang, C.M.; Mitomo, M. Synthesis and luminescent property of Eu3+-doped LaSi3N5 phosphor. J. Lumin. 2000, 87–89, 967–969. [Google Scholar] [CrossRef]
  25. Li, Y.Q.; van Steen, J.E.J.; van Krevel, J.W.H.; Botty, G.; Delsing, A.C.A.; DiSalvo, F.J.; de With, G.; Hintzen, H.T. Luminescence properties of red-emitting M2Si5N8:Eu2+ (M = Ca, Sr, Ba) LED conversion phosphors. J. Alloys Compd. 2006, 417, 273–279. [Google Scholar] [CrossRef]
  26. Huppertz, H.; Schenick, W. Eu2Si5N8 and EuYbSi4N7. The first nitridosilicates with a divalent rare earth metal. Acta Crystallogr. C 1997, 53, 1751–1753. [Google Scholar] [CrossRef]
  27. Duan, C.J.; Otten, W.M.; Delsing, A.C.A.; Hintzen, H.T. Preparation and photoluminescence properties of Mn2+-activated M2Si5N8 (M = Ca, Sr, Ba) phosphors. J. Solid State Chem. 2008, 181, 751–757. [Google Scholar] [CrossRef]
  28. Piao, X.; Horikawa, T.; Hanzawa, H.; Machida, K.I. Characterization and luminescence properties of Sr2Si5N8:Eu2+ phosphor for white light-emitting-diode illumination. Appl. Phys. Lett. 2006, 88, 161908. [Google Scholar]
  29. Sohn, K.S.; Lee, S.; Xie, R.J.; Hirosaki, N. Time-resolved photoluminescence analysis of two-peak emission behavior in Sr2Si5N8:Eu2+. Appl. Phys. Lett. 2009, 95, 121903. [Google Scholar] [CrossRef]
  30. Huang, P.; Cui, C.E; Wang, S. Synthesis and characterization of Sr3Al2O6:Eu2+, Dy3+ phosphors prepared by sol-gel-combustion processing. Chin. Phys. B 2009, 18, 4524. [Google Scholar] [CrossRef]
  31. Uheda, K.; Hirosaki, N.; Yamamoto, Y.; Naito, A.; Nakajima, T.; Yamamoto, H. Luminescence properties of a red phosphor, CaAlSiN3:Eu2+, for white light-emitting diodes. Electrochem. Solid-State Lett. 2006, 9, H22–H25. [Google Scholar] [CrossRef]
  32. Uheda, K.; Hirosaki, N.; Yamamoto, H. Host lattice materials in the system Ca3N2–AlN–Si3N4 for white light emitting diode. Phy. Status Solidi A 2006, 203, 2712–2717. [Google Scholar] [CrossRef]
  33. Li, Y.Q.; Hirosaki, N.; Xie, R.J.; Takeda, T.; Mitomo, M. Yellow-orange-emitting CaAlSiN3:Ce3+ phosphor: Structure, photoluminescence, and application in white LEDs. Chem. Mater. 2008, 20, 6704–6714. [Google Scholar]

