1. Introduction
The quantum cutting (QC) phosphors that convert a photon into two photons with lower energy have been studied because of their application for such purposes as in fluorescent tubes, plasma display panels and solar cells. In 1974, it was reported that a phosphor doped with Pr
3+ ions showed QC, which converted a vacuum ultra violet (VUV) photon into 400 nm (
1S
0→
1I
6,
3P
J) and 480 nm (
3P
0→
3H
4) visible photons [
1,
2]. Since this report, phosphors that show QC from VUV to visible lights have been reported in materials doped with several rare earth ions and rare earth ions pairs, such as Pr
3+ [
1,
2], Gd
3+ [
3], Gd
3+-Eu
3+ [
4]. These phosphors have been studied as a replacement for the Hg discharge and high quantum efficiency phosphors.
Recently, rare earth ions pairs, RE
3+-Yb
3+ (RE = Pr, Tb, Tm) that show visible to near-infrared QC have been reported [
5,
6,
7,
8]. These materials have attracted a great attention because they have potential to enhance efficiency of crystalline silicon (c-Si) solar cells [
9,
10,
11]. The solar cells, which are generally based on photovoltaic effect of semiconductor, can obtain electricity from photons that have energy equal to or higher than the bandgap. However, in the case of higher-energy photons, the excess energy of incident photons is changed into heat. This thermal loss is one of the major reasons that photoelectric conversion efficiency of a single-junction solar cell, even with optimum bandgap for the solar spectrum, is limited up to 29% [
12]. Among the various solar cells ever developed, the c-Si cell is most widely used because of its many practical advantages. Therefore, it has been reported that spectral modification of the solar spectrum is one solution for further improvement of the conversion efficiency. Since the Yb
3+:
2F
5/2→
2F
7/2 emission and sensitivity peak of silicon solar cell overlap each other, these QC materials, which convert a photon in the UV to blue region into 1.2 eV-photons (λ = 1 μm), would be an ideal phosphor for the c-Si cells.
In this study, we prepared oxyfluoride glass doped with Pr3+ and Yb3+ ions. Generally, glass material can be a preferred solution for solar cell applications, because it is transparent in wide wavelength regions, can be used as a cover material and thus can easily substitute for the conventional ones already used widely for the installed modules.
In this paper, the absorption, emission and excitation spectra of the glass were investigated. We examined energy transfer efficiency between Pr3+ and Yb3+ ions, particularly from Pr3+:3PJ and 1D2 to the Yb3+-excited level by in-depth consideration of the emission spectra obtained. Comparing excitation spectra of Yb3+, emission and absorption spectra, as well as energy transfer efficiency, we obtain direct evidence of quantum cutting in the oxyfluoride glass.
2. Experimental
A Pr3+-Yb3+ codoped glass with compositions of 32SrF2-0.1PrF3-2.9YbF3-42SiO2-23Al2O3 and Pr3+-Gd3+ codoped glass with compositions of 32SrF2-xPrF3-(3-x)GdF3-42SiO2-23Al2O3 (x = 0.1, 1) were prepared using SrF2, PrF3, YbF3, GdF3, SiO2, Al2O3 as raw materials. Since the Gd3+ ion is optically inert in the wavelength range of visible to infrared, we will call the Pr3+-Gd3+ codoped glass as “Pr3+ singly doped glass”. All chemical powders had 99.9−99.99% purity. After mixing well in an alumina mortar, 20 g batches were melted in a platinum crucible at 1350 °C for 1.5 h. The melts were poured onto a stainless-steel plate at room-temperature and pressed by another plate. The obtained glass was annealed for 1 h at 500 °C below the glass transition temperature, which was determined by a differential scanning calorimeter, DSC (Rigaku, Thermo plus, DSC8270). The absorption spectrum was measured by using two kinds of absorption spectrometers (Shimadzu UV3600 and FT-IR8400S). The emission spectra in the range of 450−1200 nm were measured with a computer-controlled monochromator (Nikon, G-250) and a Si photodiode (Electro-Optical System Inc., S-025-H) by pumping with a 440 nm laser diode and a 590 nm light monochromatized by a bandpass filter (ASAHI SPECTRA, XBPA590) from a Xenon light source (ASAHI SPECTRA, MAX-302). Luminescence excitation spectrum was measured by using the Xenon light source, the monochromator and the Si photodiode with an 850 nm short-cut filter.
3. Results
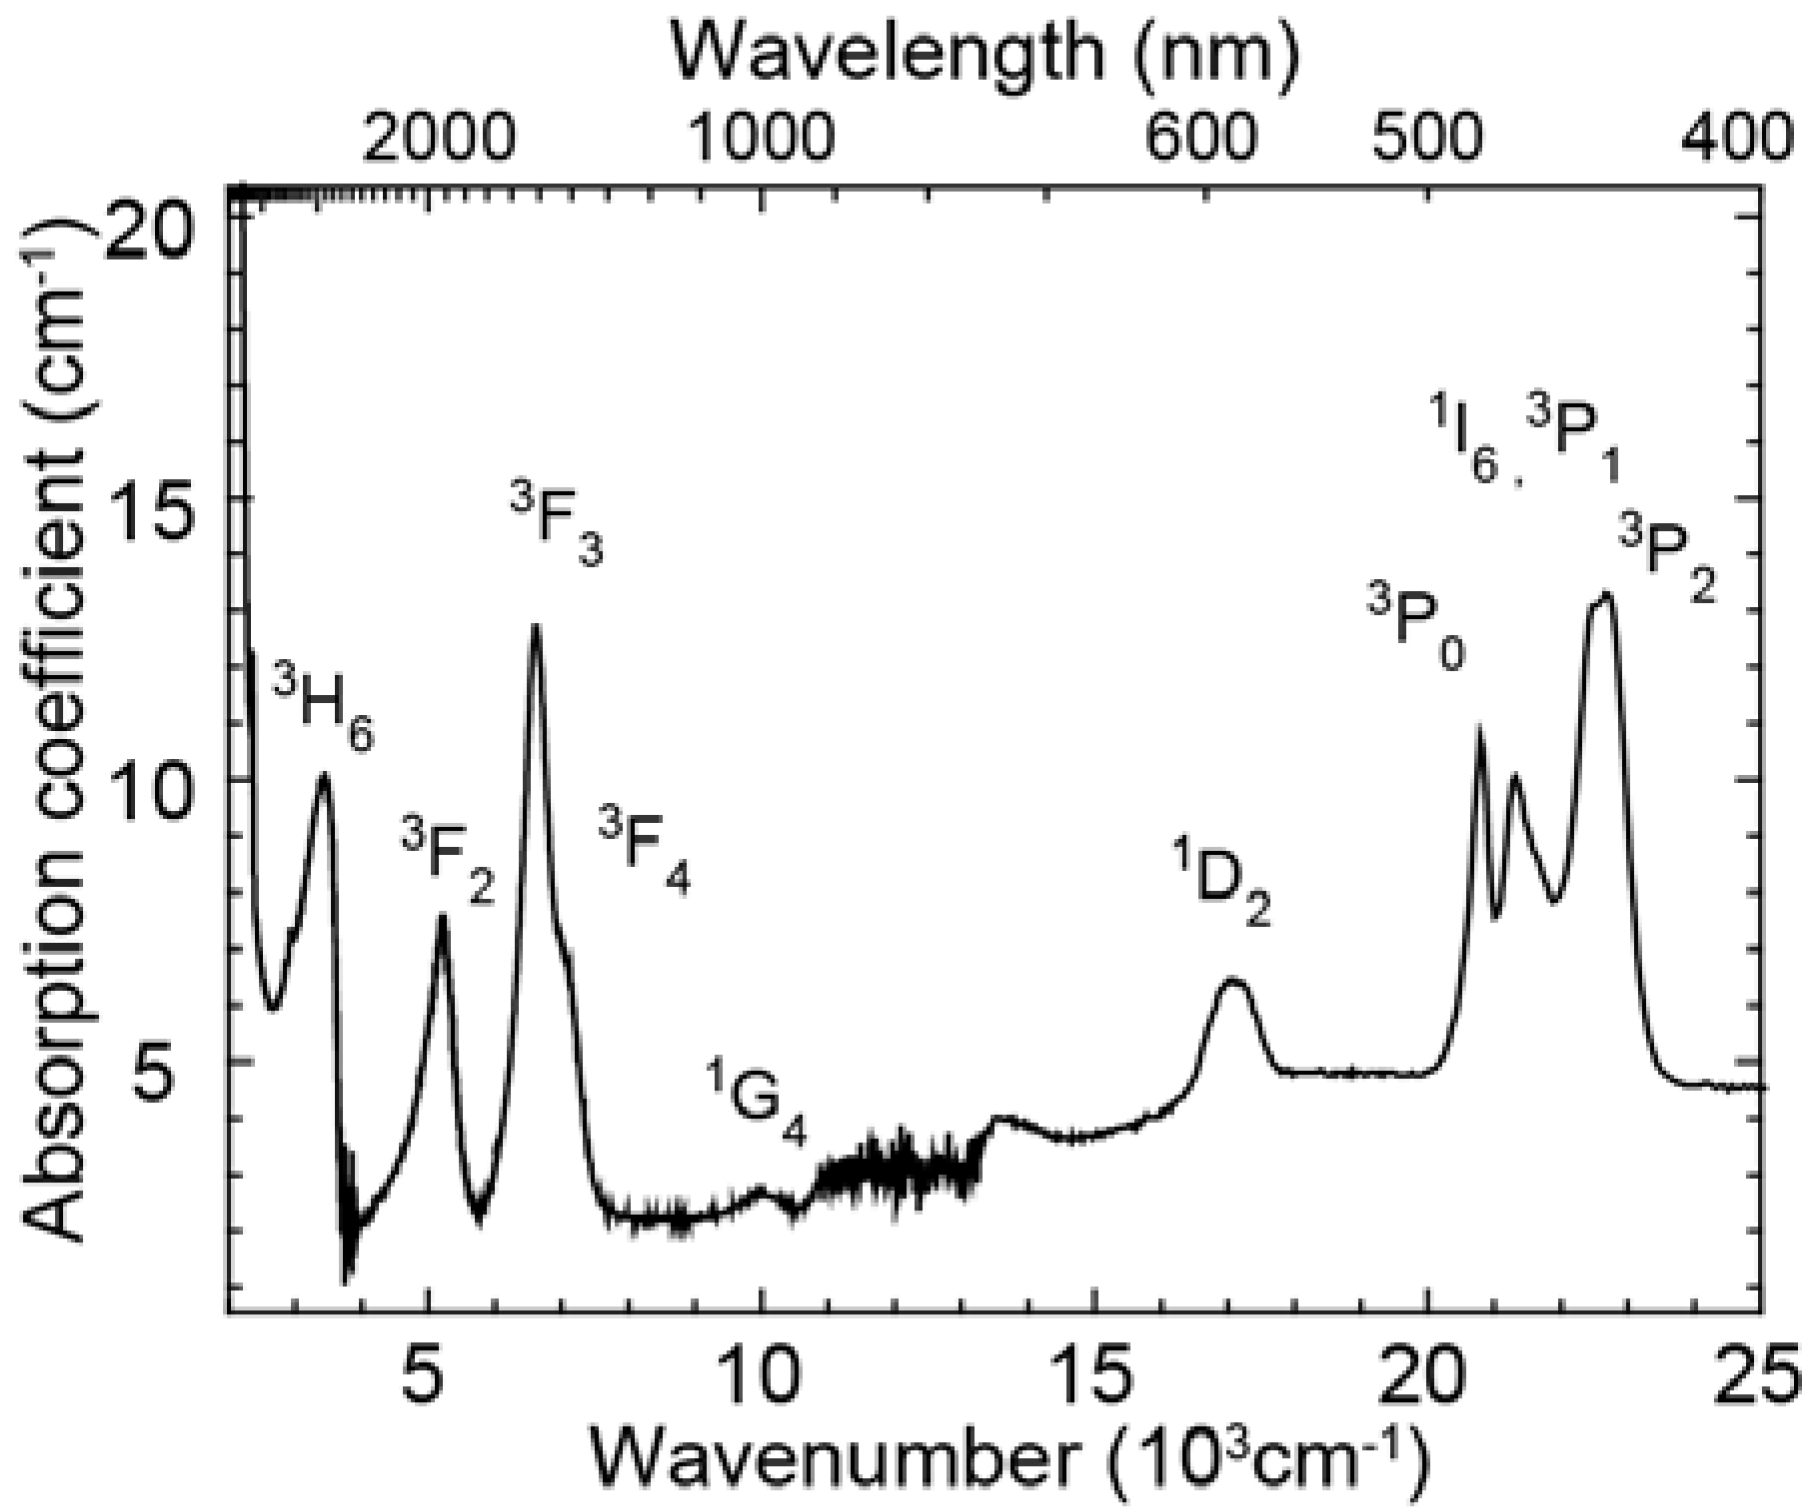
Figure 1 shows the absorption spectrum of the glass doped with Pr
3+ ions. The absorption bands of excited levels,
3H
6,
3F
2,
3F
3,
3F
4,
1G
4,
1D
2,
3P
0,
3P
1,
1I
6,
3P
2 were observed. Overlapping bands around 7000 cm
-1 and 23,000 cm
-1 were deconvoluted into two Gaussian bands by least-square fitting and the energy level values in the glass sample were determined. These absorption peak energy values were used to calculate the energy of Pr
3+ emissions and to carry out the peak assignments. The Pr
3+ singly doped glass has no strong absorption in the range of 500 nm ~ 1100 nm where c-Si solar cells have high conversion efficiency.
Figure 1.
Absorption spectrum of the Pr3+ singly doped oxyfluoride glass (x = 1.0).
Figure 1.
Absorption spectrum of the Pr3+ singly doped oxyfluoride glass (x = 1.0).
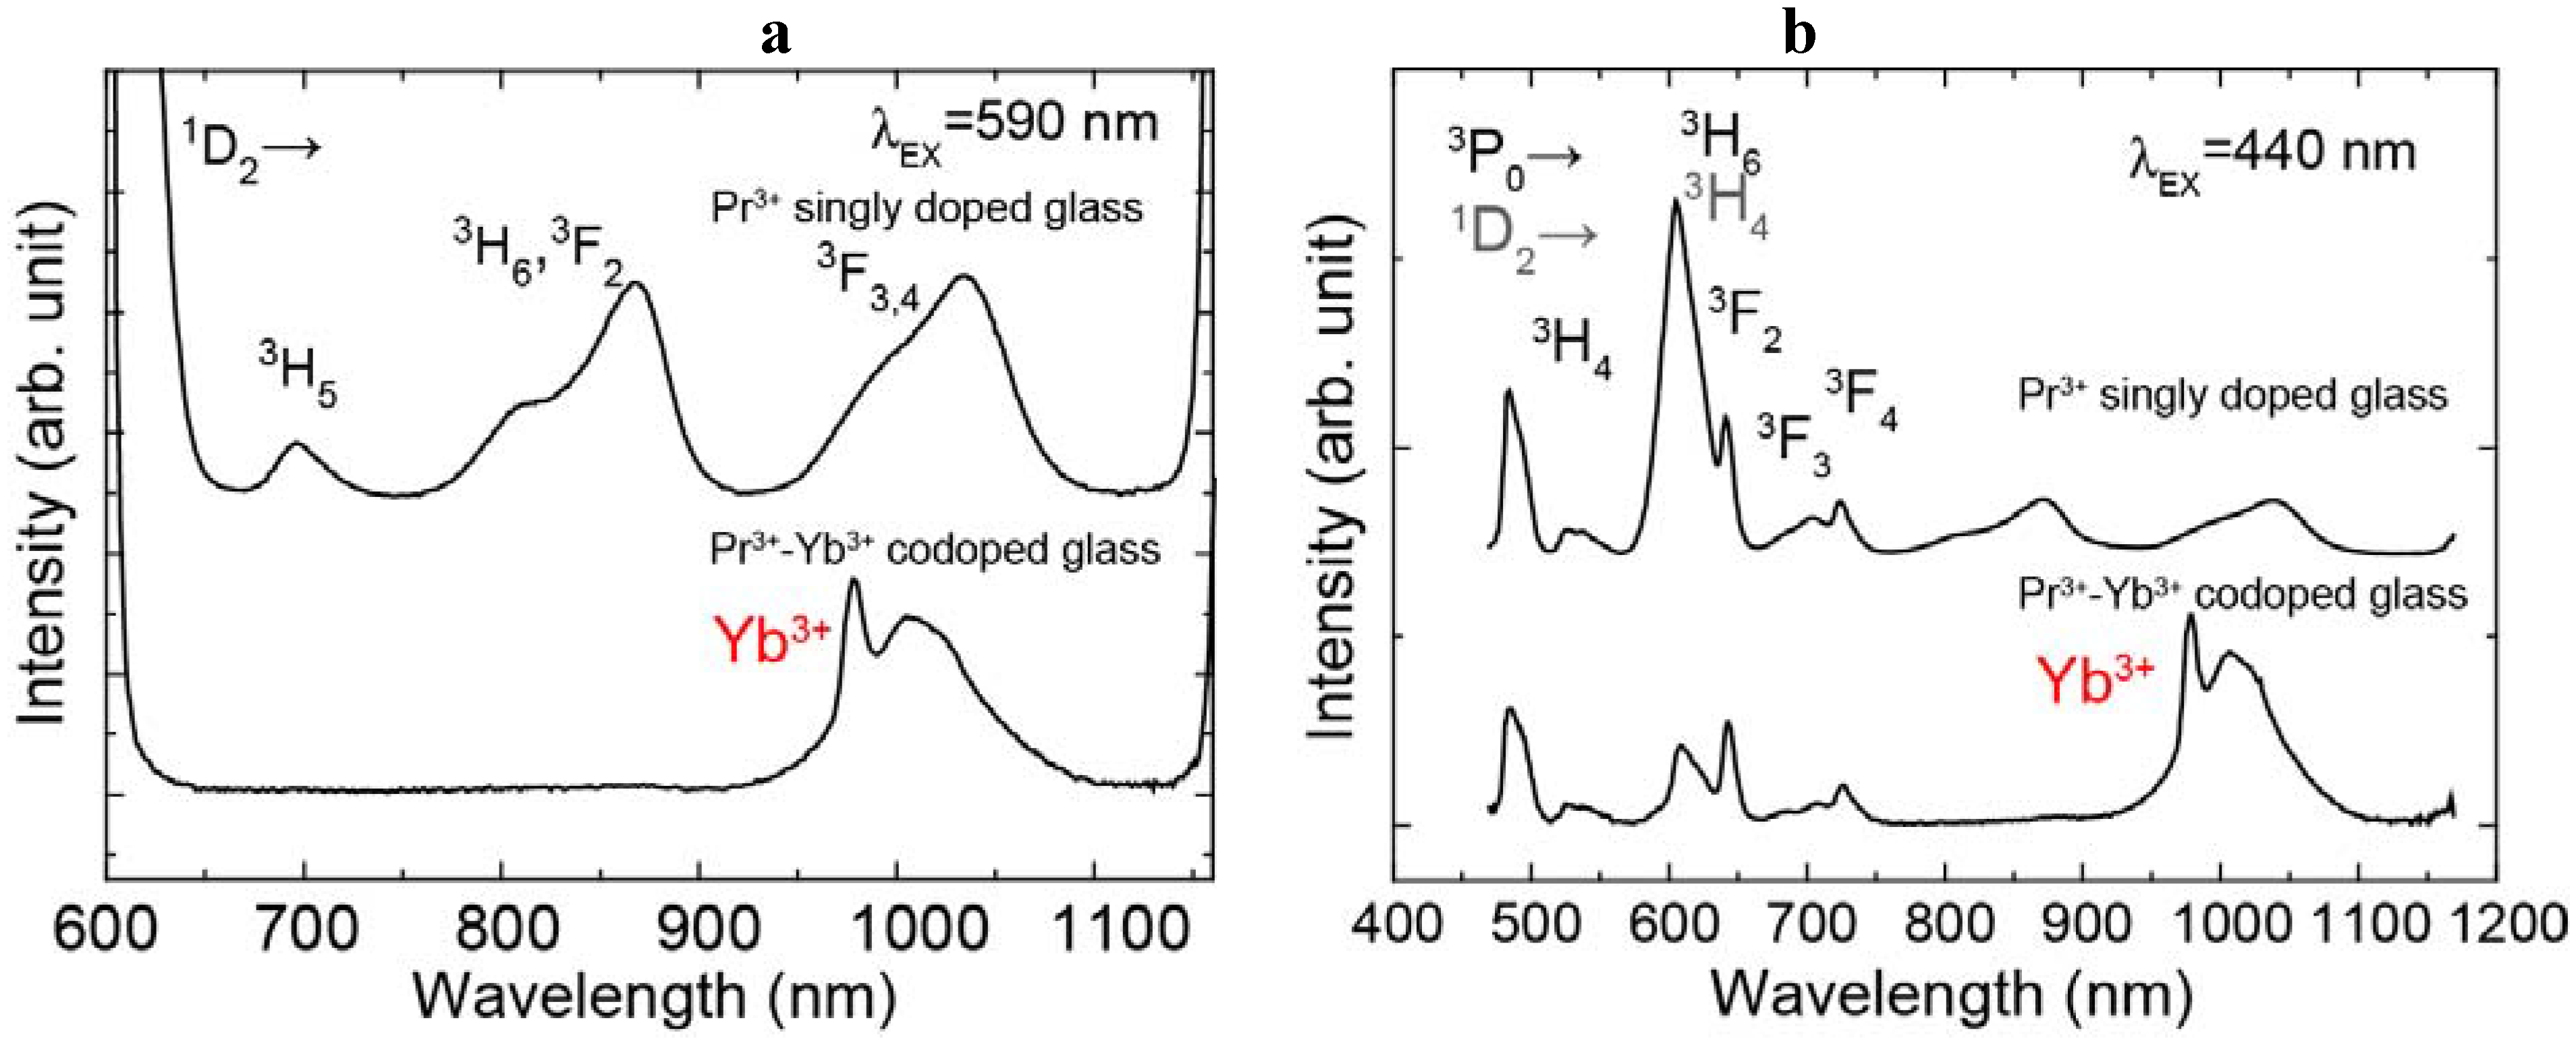
The emission spectra of the Pr
3+ singly doped and the Pr
3+-Yb
3+ codoped samples excited at 440 nm and 590 nm light are shown in
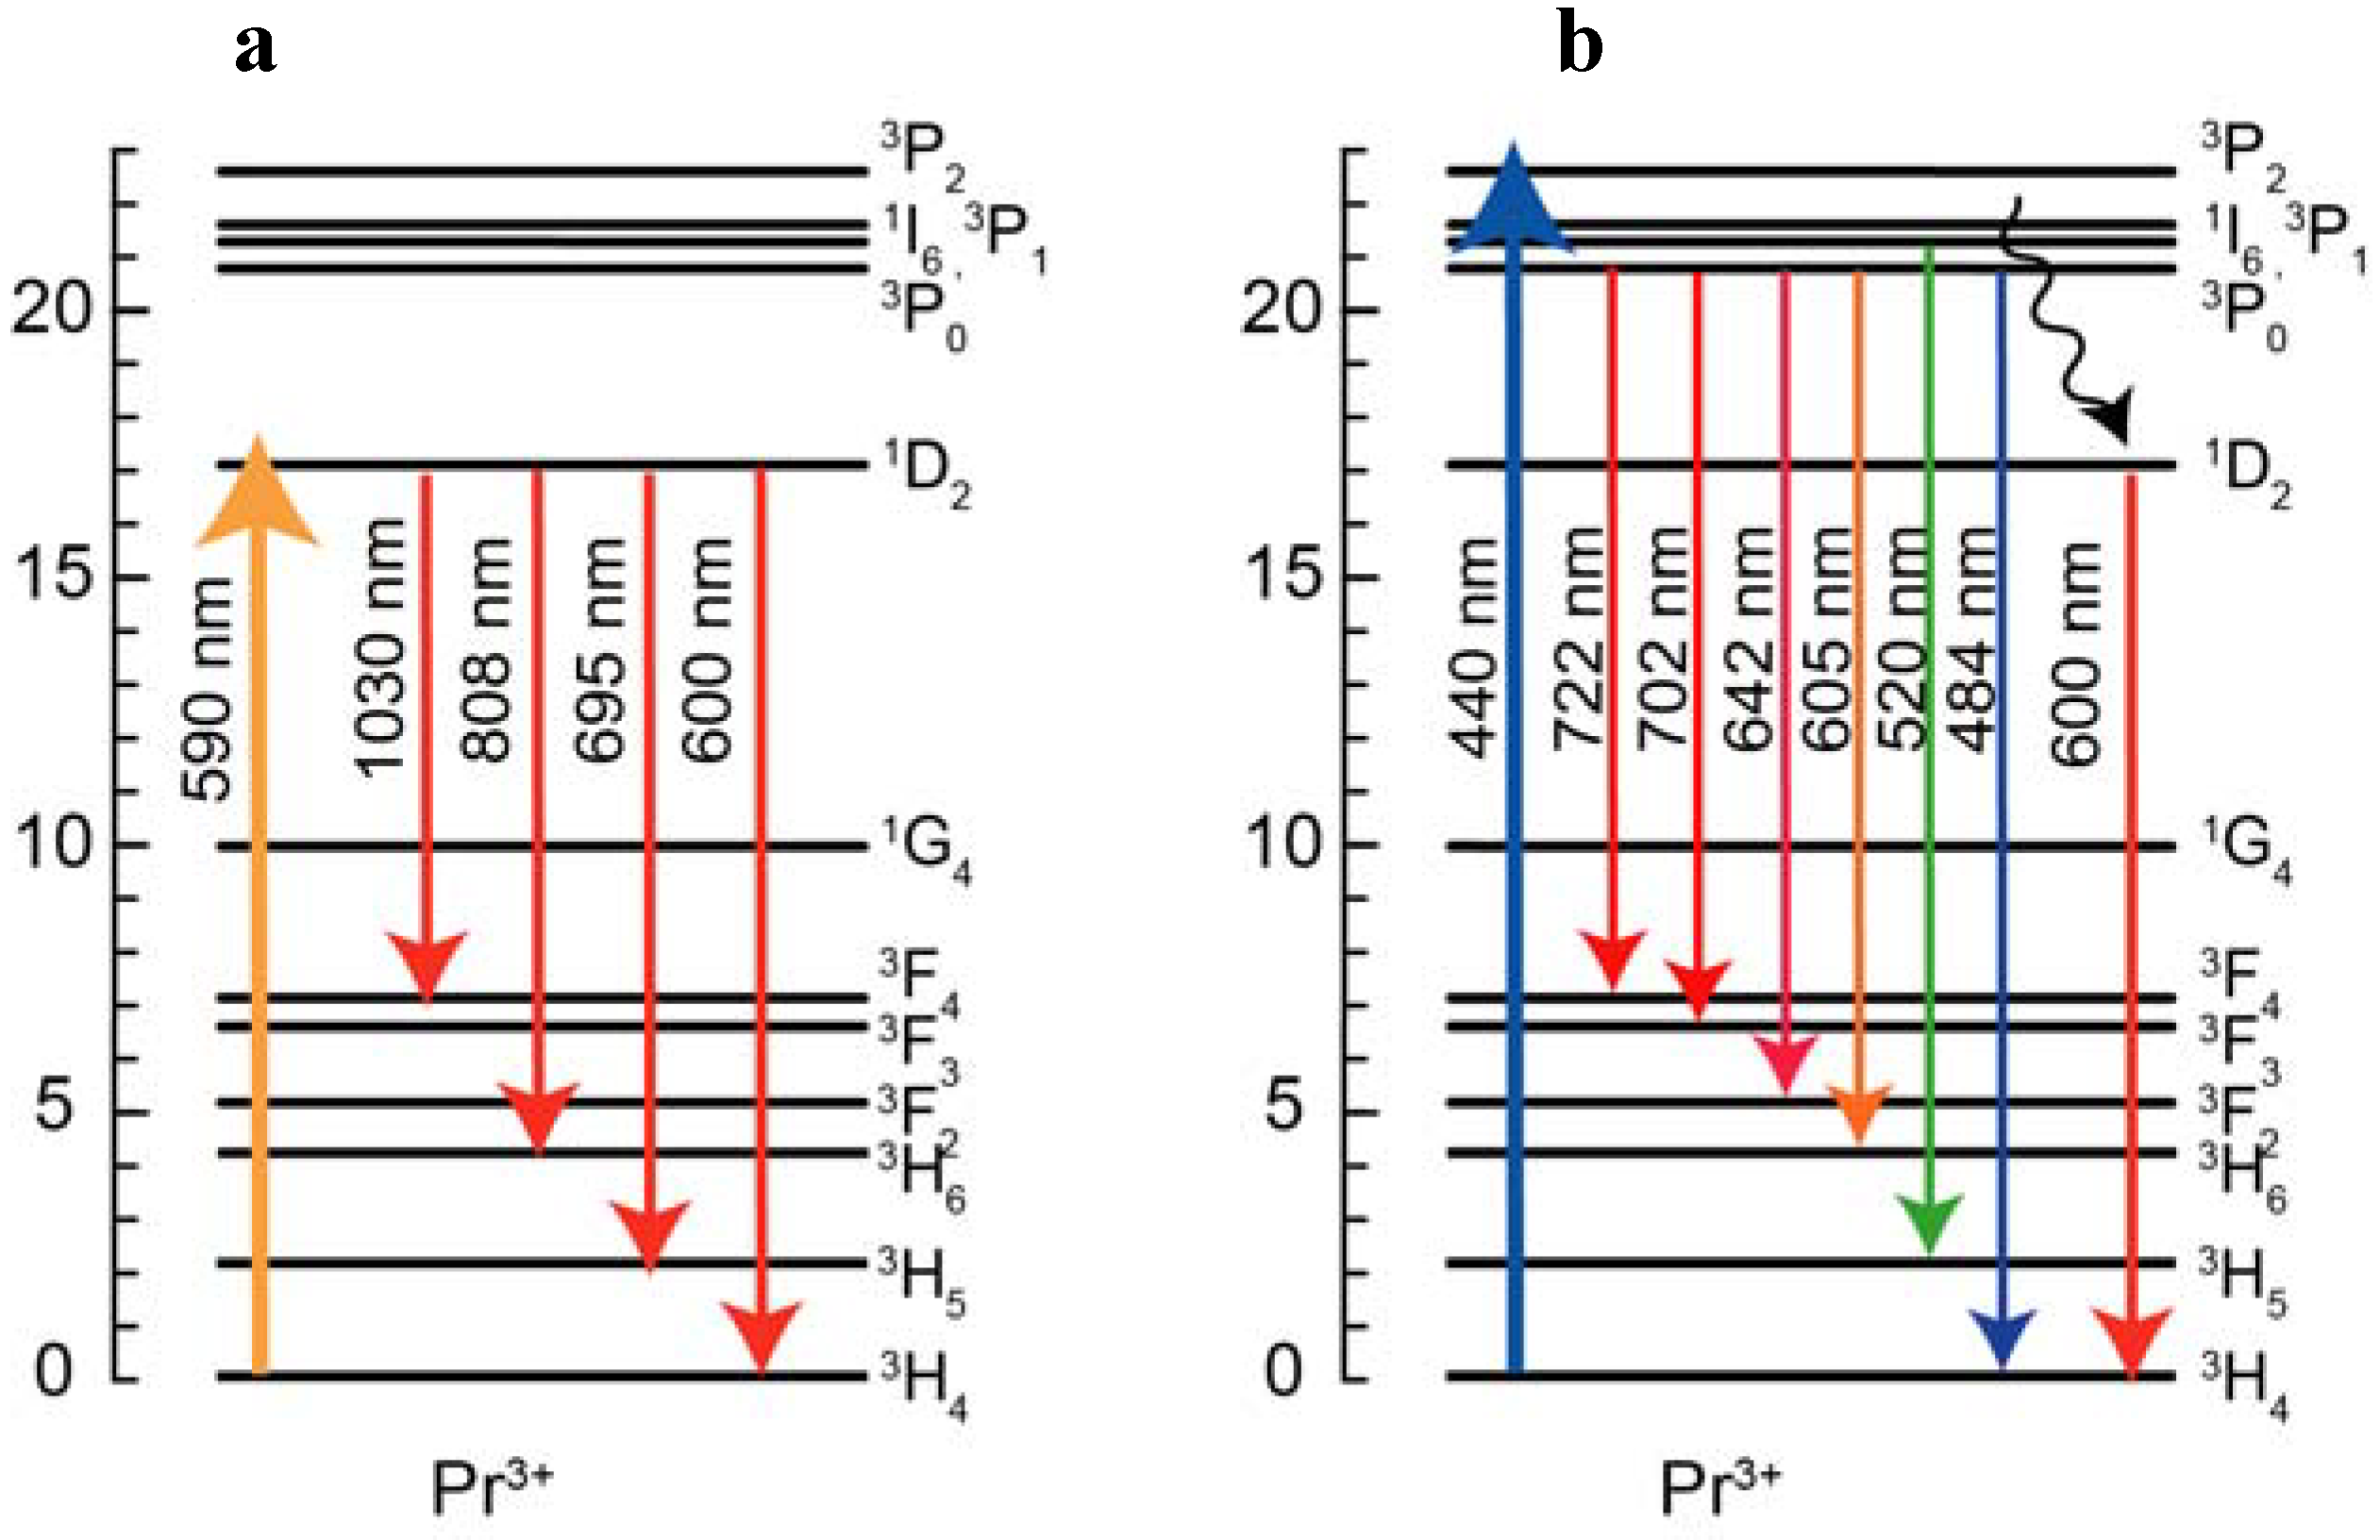
Figure 2 (a) and (b). The energy diagram of Pr
3+ ion and transitions are shown in
Figure 3. The emission spectrum of the Pr
3+ singly doped sample excited at 590 nm showed 695 nm, 808 nm, 1030 nm emissions and these emissions originate from the
1D
2→
3H
5,
1D
2→
3F
2 and
1D
2→
3F
3, 4 transitions, respectively. In the emission spectrum of the Pr
3+ singly doped sample excited at 440 nm, we observed several emissions from Pr
3+:
3P
1 and
3P
0 levels, 484 nm (
3P
0→
3H
4), 520 nm (
3P
1→
3H
4), 605 nm (
3P
0→
3H
6), 642 nm (
3P
0→
3F
2), 702 nm (
3P
0→
3F
3), 722 nm (
3P
0→
3F
4) and also observed emissions from the
1D
2.
The Pr3+-Yb3+ codoped sample showed Yb3+ (2F5/2→2F7/2) emission excited at both 440 nm and 590 nm. Under excitation at 440 nm, the intensity of the Yb3+ emission of the Pr3+-Yb3+ codoped sample was about twice as large as the Pr3+ emissions. We also found that the Pr3+ emission peak around 600 nm of the Pr3+-Yb3+ codoped sample is quite different from that of the singly doped one. Under excitation at 590 nm, we cannot observe Pr3+ emissions in the Pr3+-Yb3+ codoped sample.
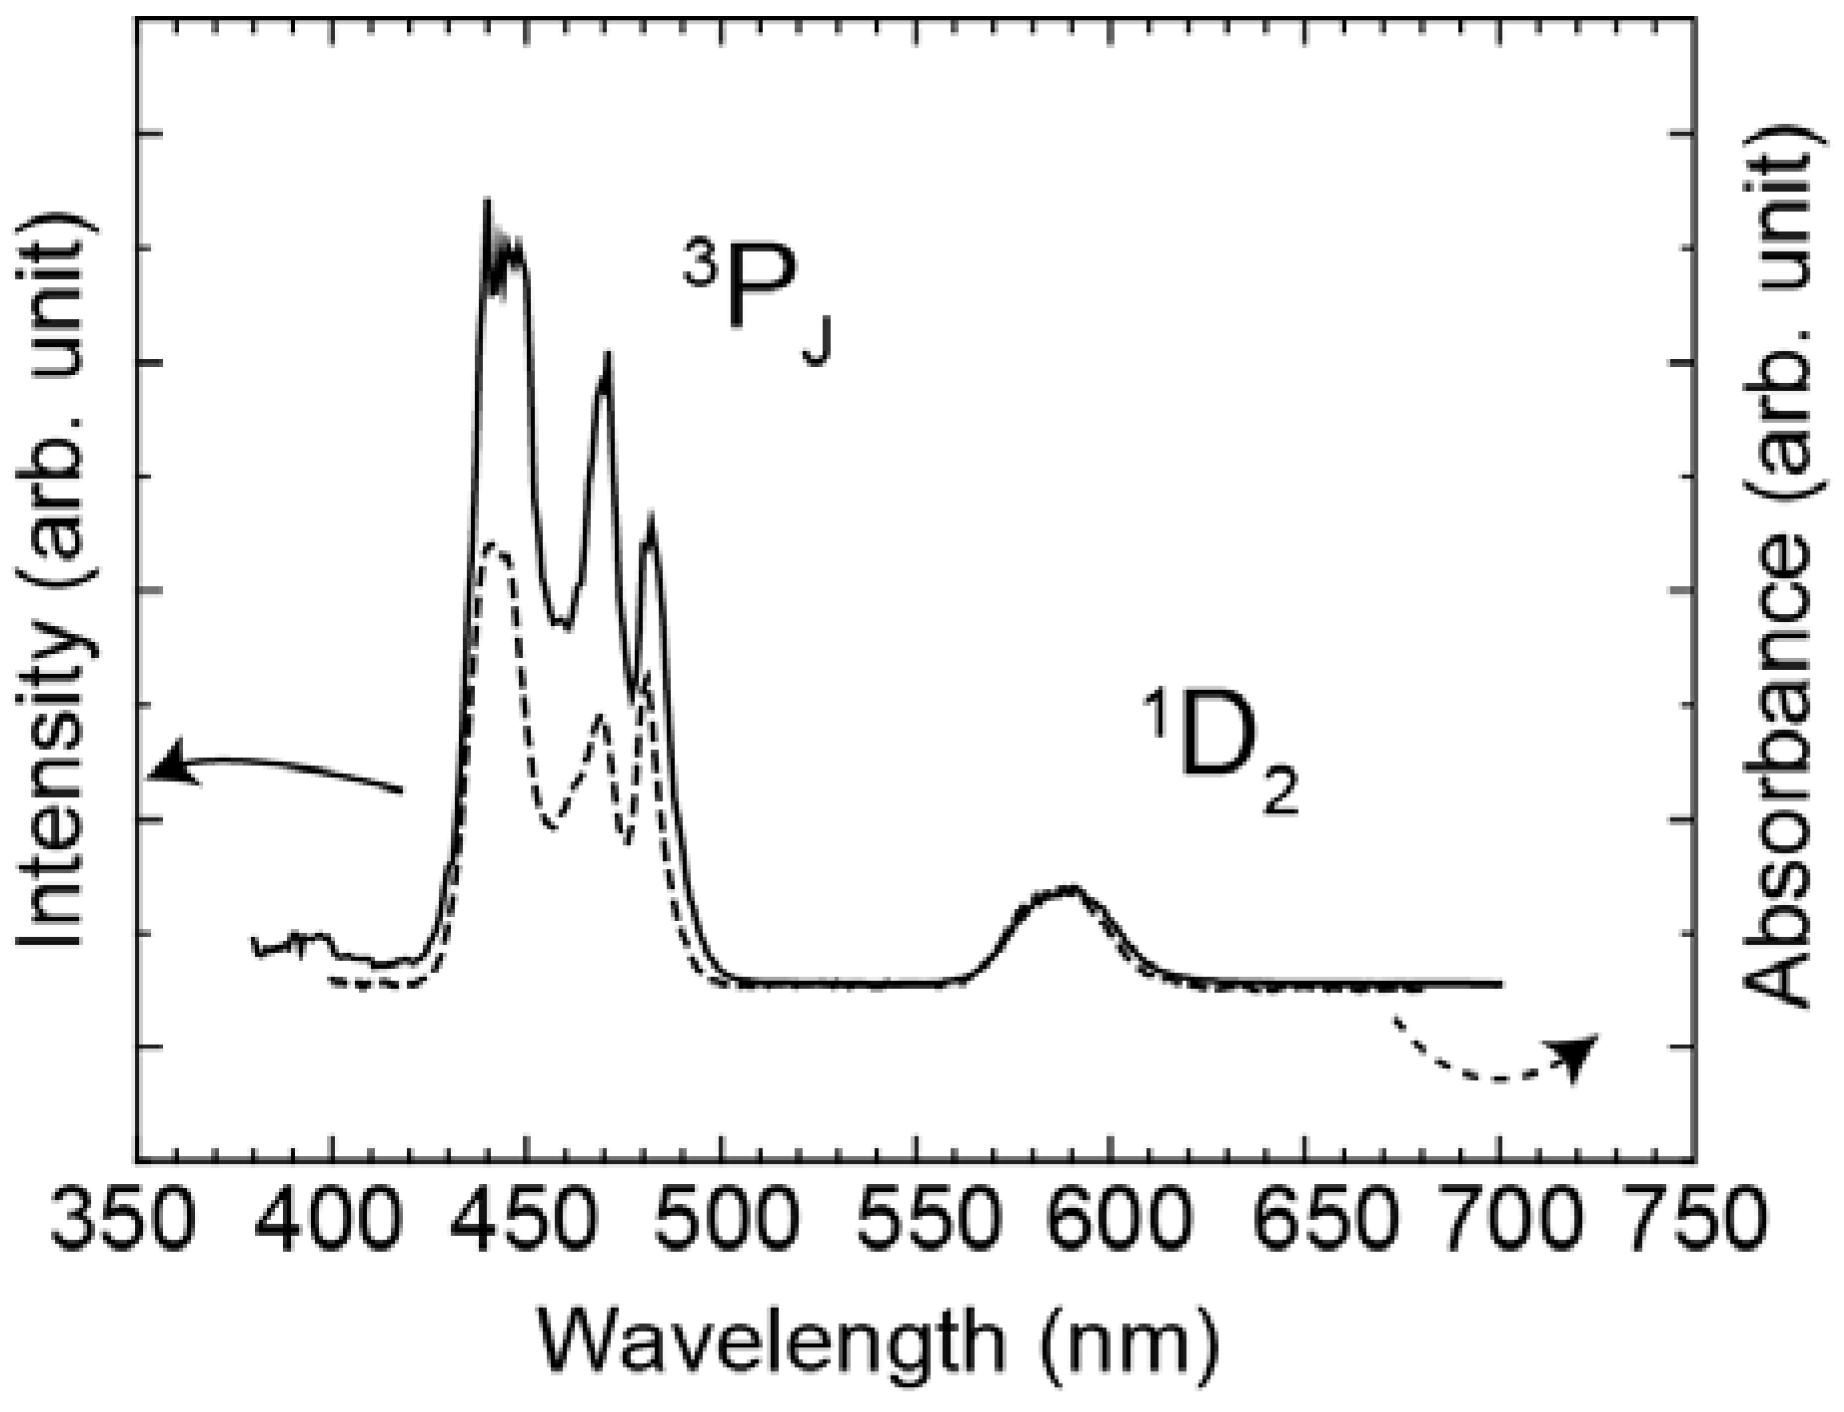
Figure 4 shows the excitation spectrum of Yb
3+ 1μm luminescence of the Pr
3+-Yb
3+ codoped glass and the absorption spectrum of the Pr
3+ singly doped glass. The excitation cross-section ratio of the
1D
2 to the
3P
J band was approximately 1:10 and the absorption cross-section ratio was approximately 1:6.
Figure 2.
Emission spectra of the Pr3+ singly doped and Pr3+-Yb3+ codoped samples excited at (a) 590 nm and (b) 440 nm.
Figure 2.
Emission spectra of the Pr3+ singly doped and Pr3+-Yb3+ codoped samples excited at (a) 590 nm and (b) 440 nm.
Figure 3.
Energy level diagram of Pr3+ with transitions excited at (a) 590 nm and (b) 440 nm.
Figure 3.
Energy level diagram of Pr3+ with transitions excited at (a) 590 nm and (b) 440 nm.
Figure 4.
Excitation spectrum of Yb3+ 1μm luminescence of the Pr3+-Yb3+ codoped glass (solid line) and absorption spectrum of the Pr3+ doped glass (dotted line).
Figure 4.
Excitation spectrum of Yb3+ 1μm luminescence of the Pr3+-Yb3+ codoped glass (solid line) and absorption spectrum of the Pr3+ doped glass (dotted line).
4. Discussion
In the codoped sample, the Pr
3+ concentration is so low (0.1 mol %) that cross relaxation and energy migration processes between Pr
3+ ions can be neglected. As indicated in
Figure 2 (b), the Pr
3+ singly doped glass showed the Pr
3+:
1D
2 emissions. This indicates that multi-phonon relaxation from
3P
0 to
1D
2 occurs in the sample. Taking into account the multi-phonon relaxation from
3P
0 to
1D
2, we find that the emission band around 600 nm is a convolution of two bands, due to transitions of
3P
0→
3H
6 and
1D
2→
3H
4.
Yb
3+ emissions were observed in the Pr
3+-Yb
3+ codoped glass excited at both 440 nm and 590 nm. This result indicates two energy transfers (ET) from Pr
3+ to Yb
3+ ions: (Pr
3+:
3P
0→
1G
4) →(Yb
3+:
2F
5/2←
2F
7/2) and (Pr
3+:
1D
2→
3F
4,
3F
3)→(Yb
3+:
2F
5/2←
2F
7/2), as shown in
Figure 5.
Now, we discuss ET efficiency (η
ET) from Pr
3+ to Yb
3+ ions in the Pr
3+-Yb
3+ codoped sample. ET efficiency (η
ET) can be expressed by the following equation (1),
where A is radiative transition, W
MP is multi-phonon relaxation and W
ET represents ET rate. Since the radiative transitions from Pr
3+:
3P
0 level were observed as indicated in
Figure 2 (b), ET efficiency from Pr
3+:
3P
0 to Yb
3+, η
ET (
3P
0) is less than 100%. On the other hand, as indicated in
Figure 2 (a), no radiative transition of Pr
3+:
1D
2 was observed. Since almost all of
1D
2 emissions were quenched, ET efficiency from Pr
3+:
1D
2 to Yb
3+, η
ET (
1D
2) is close to 100%. Therefore, the η
ET (
1D
2) is higher than the η
ET (
3P
0). The radiative transition, A, for
3P
0 is very likely to be higher than for
1D
2, as the radiative lifetime of the former level is usually shorter than for the latter. This is one reason why the η
ET (
1D
2) is higher than the η
ET (
3P
0). It is likely that in the present system W
MP(
1D
2) is negligible, due to the relatively large energy gap, and for
1D
2 W
ET is larger than A; this makes η
ET (
1D
2) close to 100%. For
3P
0, W
MP is more important due to the smaller gap, and also A is higher, making η
ET (
3P
0) less than 100%.
Excitation spectrum monitoring the Yb
3+ emission and the absorption spectrum are shown in
Figure 4. Area ratio of the
1D
2 band to the
3P
J band in the excitation spectrum was 1:10, while that of the absorption spectrum was 1:6. When we assume that excitation efficiency to Yb
3+ from
3P
J and that from
1D
2 are equivalent, the emission intensity of Yb
3+ ions by excited
3P
J levels is more than 1.6 times as strong as that of the
1D
2 level. In fact, there is the following relation between the
3P
J band and the
1D
2 band: EX (
3P
J)/EX (
1D
2)>1.6, where EX (
3P
J) and EX (
1D
2) are the excitation efficiency of
3P
J and
1D
2, respectively. This is direct evidence of quantum cutting as indicated in
Figure 6. In the case of the ET processes shown in
Figure 5, ETs from both
1D
2 and
3P
0 of Pr
3+ to Yb
3+ are one photon to one photon processes. As previously mentioned, the ET efficiency from
1D
2 (η
ET (
1D
2)) is higher than that from
3P
0 (η
ET (
3P
0)). If the ET occurs as shown in
Figure 5, the excitation efficiency ratio of Yb
3+, EX (
3P
J)/EX (
1D
2) is less than unity. Thus, the one photon-one photon ET process cannot explain the experimental results. There is the possibility of a cooperative three body energy transfer between one excited Pr
3+ and two Yb
3+ ions, as shown in
Figure 6. The ideal one photon to two photon process, EX (
3P
J)/EX (
1D
2) = 2 can be achieved in the case of low nonradiative loss due to slow multi-phonon relaxation from
3P
0 and
1G
4.
Figure 5.
Energy transfer mechanisms of Pr3+ and Yb3+ excited at (a) 590 nm and (b) 440 nm.
Figure 5.
Energy transfer mechanisms of Pr3+ and Yb3+ excited at (a) 590 nm and (b) 440 nm.
Figure 6.
Schematic diagram of quantum cutting between Pr3+ and Yb3+ ions.
Figure 6.
Schematic diagram of quantum cutting between Pr3+ and Yb3+ ions.
