Review

Magnetoelectric Interactions in Lead-Based and Lead-Free Composites

1
Institute of Electronic & Information System, Novgorod State University, 173003 Veliky Novgorod, Russia
2
Center for Energy Harvesting Materials and Systems, Virginia Tech, Blacksburg, VA 24061, USA
*
Author to whom correspondence should be addressed.
Materials 2011, 4(4), 651-702; https://doi.org/10.3390/ma4040651
Submission received: 10 February 2011 / Revised: 15 March 2011 / Accepted: 23 March 2011 / Published: 6 April 2011
(This article belongs to the Special Issue Advances in Ferroelectric & Piezoelectric Materials)

Abstract

:
Magnetoelectric (ME) composites that simultaneously exhibit ferroelectricity and ferromagnetism have recently gained significant attention as evident by the increasing number of publications. These research activities are direct results of the fact that multiferroic magnetoelectrics offer significant technological promise for multiple devices. Appropriate choice of phases with co-firing capability, magnetostriction and piezoelectric coefficient, such as Ni-PZT and NZFO-PZT, has resulted in fabrication of prototype components that promise transition. In this manuscript, we report the properties of Ni-PZT and NZFO-PZT composites in terms of ME voltage coefficients as a function of frequency and magnetic DC bias. In order to overcome the problem of toxicity of lead, we have conducted experiments with Pb-free piezoelectric compositions. Results are presented on the magnetoelectric performance of Ni-NKN, Ni-NBTBT and NZFO-NKN, NZFO-NBTBT systems illustrating their importance as an environmentally friendly alternative.

1. Introduction

The realization of a material with simultaneous presence of strong electric and magnetic order at room temperature, termed ‘multiferroics’, would be a milestone for modern electronics and multifunctional materials. Multiferroic magnetoelectric (ME) materials become magnetized when placed in an electric field, and conversely electrically polarized when placed in a magnetic field. Dielectric polarization of a material under a magnetic field, or an induced magnetization under an electric field, requires the simultaneous presence of long-range ordering of magnetic moments and electric dipoles [1,2,3,4]. These materials offer potential for new generations of sensor, filter, and field-tunable microwave dielectric devices [5].
A suitable combination of two phases can yield the magnetoelectric property, such as combination of piezomagnetic and piezoelectric phases or combination of magnetostrictive and piezoelectric phases which will give rise to ME effect. ME effect can also realized by coupled thermal interaction in pyroelectric–pyromagnetic composites. The ME effect obtained in composites is more than one hundred times that of single–phase ME material such as Cr2O3. Suchtelen and Boomgaard outlined the conceptual points inherent to the ME effect in composites [6,7]. These can be summarized as: (i) Two individual phases should be in equilibrium (ii); Mismatching between grains should not be present (iii); Magnitude of the magnetostriction coefficient of piezomagnetic or magnetostrictive phase and magnitude of the piezoelectric coefficient of the piezoelectric phase must be greater (iv); The accumulated charge must not leak through the piezomagnetic or magnetostrictive phase; and (v) Deterministic strategy for poling of the composites. In spite of the promise of large magnetoelectric (ME) coefficients in elastically coupled nano-composites, experimental investigations for a number of configurations have not yielded values approaching those predicted by continuum mechanics and ab-initio calculations. The understanding of the physical interaction occurring in the composites with multi-dimensional connectivity between the magneto-elastic stresses and elastoelectric fields has not been achieved. The lack of this understanding has limited the ability to achieve the theoretical response of the material by coordinating the local electro-magnetic couplings, via coherent elastic interactions between phases. In these materials the theory predicts the size of the ME coefficient to be more than 5 V/cm.Oe. In order to understand the phenomenon of magnetoelectrics in composites comprised of individual piezoelectric and magnetostrictive phases, it will be important to develop theory and experiments that identify the effect of various physical and mechanical parameters on the magnitude of the magnetoelastic and elastoelectric coupling.
The discrepancy between theoretical and experimental values of ME voltage coefficients can also be attributed to the use of a one-dimensional approach. A series of studies by the authors have attempted to address these issues in their models. The suggested method consists of deriving the effective material parameters of composites and is carried out in two stages. In the first stage, the composite is considered as a structure consisting of piezoelectric and magnetostrictive phases. Further, we consider only (symmetric) extensional deformation in this model and ignore any (asymmetric) flexural deformations of the components that would lead to position dependent elastic constants and the need for perturbation procedures. For the polarized piezoelectric phase with the symmetry ¥m, the following equations can be written for the strain and electric displacement:
pSi = psij pTj + pdki pEk
pDk = pdki pTi + pεkn pEn
where pSi and pTj are strain and stress tensor components of the piezoelectric phase, pEk and pDk are the vector components of the electric field and electric displacement, psij and pdki are compliance and piezoelectric coefficients, and pεkn is the permittivity matrix. The magnetostrictive phase is assumed to have a cubic symmetry and is described by the equations:
mSi = msij mTj + mqki mHk
mBk = mqki mTi + mμkn mHn
where mSi and mTj are strain and stress tensor components of the magnetostrictive phase, mHk and mBk are the vector components of magnetic field and magnetic induction, msij and mqki are compliance and piezomagnetic coefficients, and mμkn is the permeability matrix. Equation (2) may be considered as a linearized equation describing the effect of magnetostriction. Using appropriate boundary conditions, the ME voltage coefficients can be obtained by solving Equations (1) and (2).
In the second stage, the composite is considered to be homogeneous and the behavior is described by:
Si = sijTj + dkiEk + qkiHk
Dk = dkiTi + εknEn + αkn Hn
Bk = qkiTi + αknEn + μknHn
where Si and Tj are strain and stress tensor components, Ek , Dk, Hk, and Bk are the vector components of the electric field, electric displacement, magnetic field and magnetic induction, sij, dki, and qki are effective compliance, piezoelectric and piezomagnetic coefficients, and εkn, μkn and αkn are effective permittivity, permeability and ME coefficient. Effective parameters of the composite are obtained by solving Equation (3) by taking into account solutions of Equations (1) and (2). The mechanical strain and stress for composite and homogeneous material are assumed to be the same and the electric and magnetic vectors are determined by using appropriate boundary conditions. This method has shown considerable success in modeling the response of ME composites.
As an example we illustrate the results obtained on L-T mode ME composites. This case corresponds to polarization field E0 and AC electric field E perpendicular to the sample plane and bias field H0 and AC magnetic field H parallel to the sample plane and the ME coefficient is given as αE,T = αE,31 = E3/H1. In this case, non-zero components of psij, pdki, msij , mqki, sij, dki, qki, αkn are determined by composite symmetry and Equations (1)–(3) are solved for appropriate boundary conditions. The expression obtained for transverse ME voltage coefficient is given below [8]:
α E , 31 = E 3 H 1 = v ( 1 v ) ( q 11 m + q 21 m ) p d 31 ε 33 p ( s 12 m + s 11 m ) v + ε 33 p ( s 11 p + s 12 p ) ( 1 v ) 2 d 31 2 p ( 1 v )
where v is piezoelectric volume fraction. Equation (4) describes the dependence of ME parameters on volume fraction and is used to estimate the ME coupling for some representative systems. For a bilayer of nickel ferrite (NFO) and PZT the measured and calculated values of ME voltage coefficient equal about 240 mV/cm.Oe.
Investigations have revealed the presence of both ferroelectricity and magnetism in a number of materials such as perovskite type BiFeO3, BiMnO3, the boracite family, BaMF4 compounds (M, divalent transition metal ions), hexagonal RMnO3 (R, rare earths), and the rare earth molybdates, but none seem to provide large coupling between them [6,7,9,10,11,12,13,14,15,16,17]. Recently, rare earth manganites such as TbMnO3, DyMnO3, and TbMn2O5 have been reported to exhibit reproducible electric polarization under magnetic fields, however the magnitude of the magnetoelectric (ME) coefficient (unit of V/cm.Oe) is quite small [4,11,18,19,20,21,22,23]. Single phase materials suffer from the drawback that the ME effect is considerably weak even at low temperatures. Better alternatives to single phase materials are ME composites. The composites exploit the product property of the materials (the ME effect is not present in individual phases). Recently, the focus of much research has been on the laminated magnetoelectric composites made by using piezoelectric and magnetostrictive materials [24,25,26,27,28,29,30,31,32,33,34,35,36,37,38,39,40,41,42,43]. In our original work, we reported the results on laminate composites (MLCs) made from the giant magnetostrictive material, Terfenol-D, and relaxor-based piezocrystals Pb(Mg1/3Nb2/3)O3–PbTiO3 (PMN-PT) [44]. Magnetoelectric behavior in laminate composites has now been reported for various material couples including Pb(Zr,Ti)O3 (PZT) or Pb(Mg1/3Nb2/3O3-PbTiO3 (PMN-PT) layers laminated with magnetostrictive Tb1−xDyxFe2−y, Permendur, Ni1−xCoxFe2O4 (i.e., NFO), or Co1−xZnxFe2O4 (i.e., CFO) ones [45,46,47,48,49,50,51,52,53,54,55,56,57,58,59,60]. Recently, Bichurin et al. found a giant enhancement in the magnitude of the bulk composites at the resonance frequency of the samples [61]. A high ME coefficient of 23000 mV/cm.Oe was reported for the samples with 80% PZT-20% Ni Ferrite (~350 kHz, sample diameter 10 mm), an increase by a factor of 600 as compared to the data at low frequency (~1 kHz).
Figure 1 shows some examples of the structures that can be designed using the two phases in thin film and bulk forms. It can be seen from this figure that the possibilities are numerous and there can be several phases (amorphous, ceramic, metal, polymer, etc.), shapes (disk, cylinder, plate, toroid, sphere, etc.), and sizes (number of layers, layer thicknesses, length and width can be varied differently) for obtaining the magnetoelectric properties. It is important to note here that all of these combinations will exhibit ME response with varying degree of magnitude. For n phases the number of connectivity patterns is given as ( n + 3 ) ! / 3 ! n ! , which for two phase composites comes out to be 10, for three phases as 20, and 35 for four phase pattern. Further, in each of these shapes there is the possibility of orienting the polarization along different axes and applying the electric (E) and magnetic (H) fields along different axes. In addition there are several choices for materials depending on magnetostriction constant, resistivity, permeability, permittivity, piezoelectric strain and voltage constant, sintering temperature, and chemical reactivity (Magnetostrictive-MnFe2O4, CoFe2O4, NiFe2O4, ZnFe2O4, YFe5O12, SmFe5O12, YIG, Terfenol-D, Metglas 2605SC, Ni, Co, etc.; Piezoelectric-PZT, BaTiO3, PMN-PT, PVDF, SrBi4Ti4O15, (Na0.5K0.5)NbO3) etc.).
Figure 1. Schematics of the magnetoelectric composites illustrating the multiple possibilities (a) self-assembled nano-pillar structures; (b) layer by layer deposition; (c) deposition accompanied by masking and patterning; (d) three phase deposition for gradient materials; (e) particles dispersed in a polymer matrix; (f) lamination; (g) checkerboard arrangement; (h) sintered particulates; and (i) variation in poling, applied field direction and measuring electrodes.
Materials 04 00651 g001
Pb(Zr,Ti)O3 (PZT) based ceramics have excellent dielectric and piezoelectric properties and are currently the dominant material system for actuators, sensors and resonators. However, the Pb element in these materials presents an environmental problem. Thus, the research is now focused on finding an alternative for PZT’s. In the past two decades, several publications and patents have reported on lead-free piezoelectrics. Out of all the possible choices, (Na,K)NbO3 (NKN) based ceramics (e.g., solid solution of NKN-LiNbO3 [62], NKN-LiTaO3 [63], NKN-LiSbO3 [64], NKN-Li(Nb, Ta, Sb)O3 [65], NKN-BaTiO3 [66], NKN-SrTiO3 [67,68], and NKN-CaTiO3 [69]) have received considerable attention mainly for two reasons: (i) piezoelectric properties exist over a wide range of temperature, and (ii) there are several possibilities for substitution and additions. An interesting possibility arises from the fact that if one can find a high piezoelectric performance lead–free ceramics and combine it with magnetostrictive material with high piezo-magnetic coefficient to achieve environment friendly magnetoelectric materials with desired sensitivity.
We have conducted extensive studies on phase transitions, synthesis, and piezoelectric/dielectric properties of (1 − x)(Na0.5K0.5)NbO3-xBaTiO3 ceramics (0.0 ≤ x ≤ 1.0). This system exhibits three phase transition regions corresponding to orthorhombic, tetragonal, and cubic phases. The composition 0.95(Na0.5K0.5)NbO3-0.05BaTiO3, which lies on boundary of orthorhombic and tetragonal phase, was found to exhibit excellent piezoelectric properties. The properties of this composition were further improved by addition of various additives making it suitable for multi-layer actuator application. The composition 0.06(Na0.5K0.5)NbO3-0.94BaTiO3 was found to lie on the boundary of tetragonal and cubic phase. This composition exhibited the microstructure with small grain size and excellent dielectric properties suitable for multi-layer ceramic capacitor application. In the next section, we summarize the progress made in the field of lead-free piezoelectric materials.

2. Progress on Lead–Free Piezoelectric Materials

Most of the investigated lead-free piezoelectric systems are based on Na0.5Bi0.5TiO3 (NBT) and K0.5Na0.5NbO3 (NKN) compositions. This section briefly describes the progress made on these two lead-free piezoelectric materials.

2.1. NBT-BT Lead-Free Piezoelectric

Na0.5Bi0.5TiO3 (NBT) was discovered by Smolenskii [70] in 1961. It was reported that NBT is a relaxor ferroelectric with diffuse phase transition from rhombohedral to tetragonal phase between 200 °C and 320 °C and from tetragonal to cubic phase at 540 °C [71,72,73,74]. The region between 200–320 °C has been subject of intense discussions related to the existence of antiferroelectric phase. Some researchers have suggested coexistence of rhombohedral and tetragonal phases in this temperature range with polar nano regions [75]. However in a recent work, in situ temperature dependent TEM studies showed phase transition from ferroelectric rhombohedral to anti-ferroelectric orthorhombic phase proceeded via an antiferroelectric modulated phase consisting of orthorhombic sheets in a rhombohedral matrix in the temperature range from 200–300 °C. A second phase transition from O-T phase occurs near 320 °C, which corresponds to the antiferroelectric/paraelectric phase transition.
The solid solution of NBT with various tetragonal compounds has been investigated including K1/2Bi1/2TiO3 (KBT), BaTiO3, CaTiO3, SrTiO3 and PbTiO3 [76,77,78,79]. Takenaka et al. [79] presented the phase diagram of NBT-BT showing the existence of a morphotropic phase boundary (MPB). The longitudinal piezoelectric constant (d33) for NBT-6% BT composition was found to be 125 pC/N along with k33 of 55% and loss tangent factor of 1.3%. However, Curie temperature (Tc) and ferroelectric to anti-ferroelectric transition temperature (Td, also referred as depoling temperature) decreased at MPB. In comparison to lead-based perovskites, NBT has higher elastic modulus (~110 GPa vs. 70 GPa) and lower density (6 g/cm3) which makes it favorable for light-weight actuation applications [76]. Modification with BiScO3 and BiFeO3 lead to increment in Tc of NBT and NBT-BT up to 400 °C together with an improvement of remnant polarization (Pr) [80,81,82]. Li et al. [83] have reported the dielectric and piezoelectric response of (1 − x)(Na0.5Bi0.5)TiO3-xNaNbO3 ceramics. The samples in composition range of 0.01 to 0.02 were found to exhibit d33 ~80–88 pC/N. In recent work, effect of Na non-stochiometry in Bi0.5Na0.5-xTiO3 ceramics was investigated [84] The grain size was found to decrease with increase in Na non-stoichiometry. However, d33 was increased from 74 pC/N (Td ~190 °C) at x = 0.0 to 91 pC/N (Td ~112 °C) at x = 3.5 and then dropped with further Na deficiency. The effect of bismuth excess on NBT-BT ceramics near MPB and compositions with x ≤ 0.505 was positive leading to large Pr ~37.5 − 41.1 µC/cm2 and d33 ~171–176 pC/N at RT with moderate depoling temperature (Td) ~85 °C [85]. Wang et al. [86] have studied (0.95 − x)(Bi1/2Na1/2)TiO3-x(Bi1/2K1/2)TiO3-0.05BaTiO3; x = 0–20 mol% compositions and specimen with x = 5 mol% were found to exhibit d33 ~148 pC/N, kp~34 %, kt~49.2 % and Td ~125 °C. However, these modifiers also increased the magnitude of coercive field (Ec) which makes the poling difficult. Generally, Ec and Td are lower in doped materials, however cobalt doping was found to enhance Td by 20 °C [87,88]. High piezoelectric properties in these Bi based compounds is always accompanied with the lowering of Td as shown in Figure 2. Lower Td leads to unstable domains which are easy to switch and hence give rise to higher piezoelectric constant [87]. Li doping of 4 at% in NBT-BT has been found to improve the piezoelectric coefficient as d33 = 176 pC/N, k33 = 0.6 and Td = 171 °C [89]. In order to further improve the piezoelectric response without lowering the depoling temperature (Td) various researchers have used reactive template (RTGG) and template (TGG) grain growth method [90,91,92,93,94,95] to texture the ceramics. The <100>c textured 0.94NBT-0.06BaTiO3 ceramics was found to exhibit d33 ~241 pC/N, kp ~41.2 % and kt ~66.5% at RT with Td ~115 °C.
Investigations on growth of lead-free single crystals in NBT-BT systems has shown that near MPB compositions are congruently melting and can be grown by flux growth [96] and top seeded solution growth (TSSG) method [97]. Recently, longitudinal piezoelectric constant (d33) as high as 457 pC/N with k33 ~68.5 % was reported on Mn doped NBT-BT single crystal grown by TSSG method. Piezoelectric properties of various NBT-based materials are listed in Table 1 along with other prominent lead-free piezoelectric materials. In order to demonstrate practical feasibility, Chen et al. [98] investigated high frequency ultrasonic transducers with NBT-BT lead-free single crystal as the active element. The (001) oriented NBTBT crystal was found to exhibit a thickness mode electromechanical coupling coefficient kt of ~0.52 and low clamped dielectric constant of ~80.
Figure 2. Variation of the piezoelectric constant and transition temperature (ferroelectric to antiferroelectric phase mentioned as depolarization temperature) as a function of BaTiO3 concentration in NBT–BT system.
Materials 04 00651 g002
Recently, giant electric field induced strain (~0.45%) was observed in (1 − x − y) (Bi0.5Na0.5)TiO3-xBaTiO3-y(K0.5Na0.5)NbO3ceramics [99,100,101]. The MPB composition 0.94(Bi0.5Na0.5)TiO3-0.06(BaTiO3) exhibited field induced ferroelectricity and remained ferroelectric after field removal [102]. On addition of KNN, these ceramics were found to exhibit giant strain due to the full recovery of original dimensions for every electric cycle [103]. It turned out that addition of KNN lowered the transition temperature (Td) [104]. Moreover, large electric field-induced strain in BNT-BT-KNN was attributed to a field induced transition from the antiferroelectric to the ferroelectric phase and explained in terms of change in the unit cell volume.

2.2. NKN Based Lead-Free Piezoelectric

Potassium sodium niobate (NaxK(1−x)NbO3), is considered a promising lead-free piezoelectric material with high Curie temperature exhibiting ferroelectric properties over a wide temperature range. It is well known that the composition corresponding to 0.5/0.5 in the NaNbO3–KNbO3 system, abbreviated as NKN, has the maximum in the piezoelectric properties. NKN undergoes a structural phase transformation sequence on cooling of paraelectric Cubic (C) ~ 415 C o ferroelectric Tetragonal (T) ~ 210 C o ferroelectric Orthorhombic (O) ~ 150 C o ferroelectric Rhombohedral (R). The T→O boundary is known as the polymorphic phase boundary (PPB) to designate its difference with the MPB. The PPB of KNN solutions is nearly independent of x, remaining unchanged in temperature for 0 < x < 1. This is in distinct contrast to the MPB for PZT, which is nearly independent of temperature, and fixed near x = 0.5. Figure 3 (a) and (b) shows the radial mode electromechanical coupling factor (kp) and mechanical quality factor (Qm) as a function of temperature for NKN. It can be clearly seen from this figure that piezoelectric properties remain almost constant until the FEt phase appears at 180 °C. The magnitude of kp at room temperature is of the order of 0.456 and Qm is around 234. Since in this system the high temperature phase (FEt) is also ferroelectric there is no danger of depoling on exceeding the transition temperature. This provides a considerable advantage over the competing NBT-KBT and NBT-BT systems and for this reason KNN ceramics are the most promising high piezoelectric nonlead system.
Figure 3. Temperature dependence of piezoelectric properties for KNN. (a) Radial mode coupling factor and (b) Mechanical quality factor.
Materials 04 00651 g003
NKN ceramics are difficult to sinter and exhibit poor aging characteristics in air. The volatile nature of constituent materials gives rise to phase instability at high temperature, as above 1100 °C alkali deficiency may result in formation of secondary phase exhibiting abnormal grain growth [105]. Hot pressed specimens have been found to show dense microstructure with theoretical density higher than 99% leading to higher coupling constant (~0.48) and d33 value (~160 pC/N) as compared to ceramics processed through conventional sintering [106,107,108]. Spark plasma sintering [109,110] has also been shown to provide high relative density of 98%, however d33 value was nominal with a magnitude in the vicinity of 158 pC/N.
Piezoelectric properties of NKN based ceramics are a function of orthorhombic (O) to tetragonal (T) phase transition [111]. Ahn et al. [111] performed Rietveld and powder diffraction analysis to establish correlation between piezoelectric response, fraction of O and T phases, and NKN ratio for three different systems of (K,Na)NbO3-BaTiO3 (NKN-BT) NKN-LiNbO3 (LN), and (K,Na,Li)NbO3 (KNLN)-BT. It was found that higher piezoelectric properties in NKN based ceramics correlates with higher fraction of T phase and NKN ratio, where maximum piezoelectric properties are found in T-rich phase region with fraction of 70% and NKN ratio of 0.95. Several researchers [112,113] have studied the effect of the Na/K ratio in NKN system in order to improve the piezoelectric properties. Guo et al. [62] have studied the effect of Li-doping on piezoelectric properties of NKN by synthesizing the samples Lix(Na0.5K0.5)(1 − x)NbO3(NKLN), for x varying between 0.0 to 0.2. A sharp peak in piezoelectric properties (d33 ~235 pC/N, kp ~44 %) was observed in the composition range of 0.05 < x < 0.07. Temperature dependent dielectric response of optimum composition revealed shifting of Tc and To-t in opposite directions. Zhao et al. [114] reported that Li-modified NKN ceramics exhibit orthorhombic to tetragonal phase transition, which is similar to morphotropic phase boundary (MPB) and hence exhibit high piezoelectric constant (d33~314 pC/N). Zhang et al. [115] substituted 0.058 mole % of Li+ on A-site while B-site was substituted with Sb5+ in range of 2–8 mol % resulting in drastic shifting of To–t to 60 °C. However, piezo-response was improved to d33 ~298 pC/N with kp ~34.5%. Zhang et al. [64] in an extension of this work, synthesized the composition (Na0.5K0.5Nb)(1−x) (LiSb)xO3 with x = 0.048–0.056. The composition with x = 0.052 was found to exhibit optimum piezoelectric properties (d33 ~286, and kp ~0.51). This improvement in electromechanical properties was attributed to lowering of To–t transition temperature. Some of the significant NKN based piezoelectric materials has been summarized in Table 1.
Table 1. Dielectric and piezoelectric properties of the prominent lead-free systems.
Materials d33kpk33TcTo–t/TdReference
BaTiO31900.360.51150[116]
BT-BCN3300.43 80--[117]
NBT-KBT-LBT2160.401 350160[118]
NBT-KBT-BT1830.3670.619290100[119]
NBT-xBT; x = 6–8%122–1760.21–0.36 225–22890–105[87,120,121,122,123,124]
NBT-6BT+7.5L2080.368 26085[125,126]
NBT-6BT-2NKN30 260 [100,101]
NBT-20KBT (MPB)140–1900.27–0.35 280–300130–170[127,128,129,130,131,132]
(K0.5Na0.5)NbO3 (H.P.)1270.460.6420 [107,108]
(K0.5Na0.5)NbO3800.350.51420195[133]
NKN-Li (7%)2400.450.64460~20[134]
NKN-LF4(Textured)4100.61-25325[91,135]
NKN-SrTiO3 (5%)2000.37-27727[67,68]
NKN-LiTaO3 (5%)2000.36-43055[63]
NKN-LiNbO3 (6%)2350.42-46070[62]
NKN-LiSbO3 (5%)2830.50-39245[64]
In past years, we have extensively analyzed the sintering and grain growth processes in PPB systems. The microstructures of the compositions close to PPB were investigated in order to clarify the sintering behavior of the KNN based lead-free ceramics. Figure 4 illustrates the schematic diagram of our sintering model. The changes in the microstructure are shown as a function of temperature. Figure 5 shows the SEM images of the specimens sintered at various temperatures for the composition 0.995(K0.48Na0.48Li0.04)NbO3-0.005BaTiO3 (KLNN-BT). It has been shown before that KNN based ceramics exhibit cuboidal grains in the sintered microstructure. However, we found that the PPB composition ceramics rather consist of stacked structure of plate-like grains as schematically depicted in Figure 4 and experimentally observed in Figure 5. The rapid grain growth seen in this system was quantified by tracing the formation of liquid phase. These liquid phases are related to the formation of K3Li2Nb5O15 phase and Na-deficient KNLN-BT based phase formed by Na2O evaporation. The liquid phase redistributes between the plates under the influence of capillary stress gradients. The grain growth could be modeled by Ostwald ripening.
Figure 4. Schematic diagrams of sintering model as a function of temperature in KNLN-BT based ceramics.
Materials 04 00651 g004
Figure 5. SEM images of the specimens sintered at various temperatures in KNLN-BT ceramics: (a) 950 °C; (b) 980 °C; (c) 1030 °C; and (d) 1080 °C.
Materials 04 00651 g005
Recently in ABO3 type perovskite, an interesting trend between atomic weight ratio of A and B sites (Rw = WA/WB) and piezoelectric constant (d33) was demonstrated irrespective of tolerance factor (Ft) [136]. Most of the piezoelectric compositions were shown to exhibit large response when RW for A-site heavy perovskites and 1/RW for B-site heavy perovskites was higher than 2.0. Using this rule, KNN-based [0.99(K0.48Na0.48Li0.04)(Nb1−xSbx)O3 − 0.01BaTiO3] composition with d33 of 294 pC/N was designed.
Various researchers have grown KNN based single crystals. Pure KNN single crystals exhibited d33 ~160 pC/N [137] and Mn doped KNN single crystals were reported to possess d33 ~270 pC/N, To–t ~193 °C and Tc ~416 °C [137,138]. Recently, K0.5Na0.5NbO3-LiNbO3 (KKN-LN) single crystals were grown using Bridgeman technique by Xu et al. [139]. These KNN-LN single crystals exhibit d33 ~405 pC/N and kt ~61% with Tc ~428 °C. However, composition fluctuation in single crystal is a critical issue and also their growth process is not cost-effective. Therefore, texturing of ceramics is gaining prominence as a potential alternative to single crystal. Saito et al. [91] reported that Li+, Ta5+ and Sb5+ substituted <001> oriented KNN exhibits d33 ~416 pC/N, but these substitutions shifts PPT from 200 °C to near room temperature (RT) giving rise to temperature dependent behavior. Recently, Chang et al. [140] reported that textured (K0.5Na0.5)(Nb0.97Sb0.3)O3 piezoelectric ceramics exhibits d33 ~208–218 pC/N, kp ~0.64%, To–t ~160 °C and Tc ~352 °C, which was superior than random KNN based ceramics of same composition.

3. Modeling of Piezoelectric Materials

3.1. Single Domain Approximation in Computing the Piezoelectric Coefficients of Ferroelectrics

To explain the physical properties and ferroelectric transitions, the Landau-Ginsburg-Devonshire (LGD) phenomenological approach was successfully used. The free energy expansion coefficients are usually determined from experimental data on permittivity and spontaneous polarization. For this purpose, the first principle calculations are used. However, a more complete expansion of free energy density is necessary to estimate the physical parameters of some single crystals in a wide temperature range.
The main objective of this work is to investigate the influence of ferroelectric composition on dielectric and piezoelectric parameters. We consider PbTiO3, BaTiO3, LiTaO3, KNbO3, (Na0.5 K0.5)NbO3, and Na0.5Bi0.5TiO3-BaTiO3. We use the most appropriate expansions of free energy density to calculate the needed parameters.

3.1.1. Lead Titanate

Free energy density of a ferroelectric is defined by the expression:
F = Ff + Fe + Fes + FE,
where Ff is the ferroelectric ordering energy, Fe is elastic energy, Fes is electrostriction energy, and FE is the ferroelectric’s energy in an external electric field. The equilibrium polarization is assumed to be directed along the Z-axis. Using sixth order expansion for polarization components, the ferroelectric ordering energy takes the form:
F f = a 1 P 3 2 + a 11 P 3 4 + a 111 P 3 6
where P is polarization, a1, . , a111 are the dielectric stiffness coefficients. Elastic energy is defined as:
F e = c 11 2 ( S 1 2 + S 2 2 + S 3 2 ) + c 12 ( S 1 S 2 + S 1 S 3 + S 2 S 3 )
where Si is the strain tensor component, c11 and c12 are the stiffness coefficients. Electrostriction energy can be written as follows:
F e s = q 11 S 3 P 3 2 q 12 ( S 1 + S 2 ) P 3 2 ,
where q11 и q12 are the electrostriction coefficient. Ferroelectric’s energy in an applied electric field has the following form:
FE = −P3 E3
where E is the external electric field. Strain tensor components can be calculated by using the boundary conditions for mechanically free sample as:
{ F S 1 = 0 , F S 3 = 0 , F S 3 = 0
Solving the set of equations (10) for strain components yields:
{ S 1 = P 3 2 ( c 12 q 11 + c 11 q 12 ) 2 c 12 2 + c 11 c 12 + c 11 2 , S 2 = P 3 2 ( c 12 q 11 + c 11 q 12 ) 2 c 12 2 + c 11 c 12 + c 11 2 , S 3 = ( q 11 c 11 2 c 12 q 12 + c 12 q 11 ) P 3 2 2 c 12 2 + c 11 c 12 + c 11 2 .
Substituting the found expressions (11) into Equation (5) results in the following equation:
F = a 1 P 3 2 + b P 3 4 + a 111 P 3 6 E 3 P 3 ,
where
b = 2 a 11 c 11 2 + 2 c 11 a 11 c 12 c 11 q 11 2 2 c 11 q 12 2 + 4 q 12 c 12 q 11 q 11 2 c 12 4 a 11 c 12 2 2 ( c 11 + 2 c 12 ) ( c 11 c 12 ) .
It follows from Equation (12) that taking into account the boundary conditions for mechanically free sample results in re-normalization of ferroelectric stiffness coefficient for fourth order of polarization in the ferroelectric energy density. To find the equilibrium polarization of the sample, one should use the following equation:
F P 3 = E 3 .
where F is defined by Equation (12). The solution of Equation (13) has the form:
P 3 = 3 b 3 b 2 3 a 111 a 1 a 111 3
Thus, the solution of Equations (10) and (13) enables finding of the equilibrium polarization and strain components that appear in Equation (5). Piezoelectric coefficients can be determined by using the equations for strains:
d i k = S i P k χ k k ,
where χ k k = ( 2 F P k 2 ) 1 is dielectric susceptibility and, Si are determined by Equation (11). Using Equations (15) and (11) we can find:
d 33 = 2 P 3 ( 2 q 12 c 12 c 11 q 11 c 12 q 11 ) ( 2 c 12 2 c 11 2 c 11 c 12 ) ( 2 a 1 + 12 b P 3 2 + 30 a 111 P 3 4 ) ,
d 31 = 2 P 3 ( c 11 q 12 c 12 q 11 ) ( 2 c 12 2 c 11 2 c 11 c 12 ) ( 2 a 1 + 12 b P 3 2 + 30 a 111 P 3 4 ) ,
The permittivity can be found from the following equation:
ε 33 = ( 2 F P 3 2 ) 1 + ε 0
As an example, the parameters of lead titanate are estimated at room temperature Т = 25 °С. For calculations, the following coefficients were used in the free energy density function (in SI units) [141]: a1 = 3.8 × 10⁵ (Т − 479), a11 = −7.3 × 10⁷, a111 = 2.6 × 10⁸, c11 = 1.746 × 10¹¹, c12 = 7.94 × 10¹⁰, q11 = 1.203 × 10¹⁰, q12 = −1.878 × 10⁹. According to our estimates, d31 = −11 × 1012 m/V, d33 = 22 × 1012 m/V, ε330 = 75, Р3 = 1.5 С/m2. Experimentally measured piezoelectric coefficient is equal d33 = 25 × 1012 m/V [142] that is in agreement with calculated data.

3.1.2. Barium Titanate

In an attempt to calculate the physical parameters of barium titanate using the ferroelectric energy density in the form of Equation (6), we obtained poor estimates that did not match the experimental data. Therefore, the expression for free energy density was expanded to eighth order for modeling the dielectric and piezoelectric parameters of barium titanate as:
F f = a 1 P 3 2 + a 11 P 3 4 + a 111 P 3 6 + a 1111 P 3 8
where a1111 is the dielectric stiffness coefficient of eighth order. Performing the calculations similar to above enables reducing Equation (5) to the form:
F = a 1 P 3 2 + b P 3 4 + a 111 P 3 6 + a 1111 P 3 8 E 3 P 3 ,
where b is defined by Equation (12). Based on Equation (13), the equilibrium polarization can be reduced to following form:
P 3 = 1 2 3 a 1111 ( r 1 3 ( 8 b a 1111 3 a 111 2 ) r 1 3 a 111 ) 1 2
where
r 1 = { 108 a 1111 ( b a 111 2 a 1 a 1111 ) 27 a 111 3 + 12 3 [ 32 b 3 a 1111 9 b 2 a 111 2 108 a 1 a 1111 ( b a 111 a 1 a 1111 ) + 27 a 1 a 111 3 ] 1 2 a 1111 } 1 3 .
Using Equation (15), the piezoelectric coefficients can be derived as:
d 33 = 2 P 3 ( 2 q 11 c 11 c 12 q 11 2 c 12 q 12 ) ( c 11 c 12 2 c 12 2 + c 11 2 ) ( 2 a 1 + 12 b P 3 2 + 30 a 111 P 3 4 + 56 a 1111 P 3 6 ) ,
d 31 = 2 P ( c 12 q 11 + c 11 q 12 ) ( c 11 c 12 2 c 12 2 + c 11 2 ) ( 2 a 1 + 12 b P 3 2 + 30 a 111 P 3 4 + 56 a 1111 P 3 6 ) ,
Numerical estimates for dielectric and piezoelectric parameters were carried out at room temperature Т = 25 °С. These estimates depend on following coefficients that enter the expression for free energy density [143]: a1 = 4.124 × 10⁵ (T − 115), a11 = 5.328 × 10⁸, a111 = 1.294 × 10⁹, a1111 = 3.863 × 10¹⁰, c11 = 1.755 × 10¹¹, c12 = 8.464 × 10¹⁰, q11 = 1.203 × 10¹⁰, q12 = −1.878 × 10⁹. The calculated values are listed below: d31 = −37 × 10−12 m/V, d33 = 95 × 10−12 m/V, ε330 = 189, Р3 = 0.26 С/m2. The obtained estimates are in full agreement with measurement data which were reported recently [144]: d31 = −29.4 × 10⁻¹² m/V, d33 = 86.3 × 10⁻¹² m/V, ε330 = 188, Р3 = 0.26 С/m2.

3.1.3. LiTaO3

LiNbO3 and LiTaO3 belong to the 3m point group. Denoting the crystallographic uniaxial directions as the z-axis, the free-energy expansion is given as:
F = a 1 P 3 2 2 + a 2 P 3 4 4 + b 1 S 3 2 + b 2 ( S 1 + S 2 ) 2 + + b 3 ( ( S 1 S 2 ) 2 S 6 2 ) + b 4 S 3 ( S 1 + S 2 ) + b 5 ( S 4 2 + S 5 2 ) + + b 6 ( ( S 1 S 2 ) S 4 + S 5 S 6 ) + g 1 ( S 1 + S 2 ) P 3 2 + g 2 S 3 P 3 2
where bi and gi are stiffness and electrostriction coefficients. Equilibrium strain components take the form for free sample as:
S 4 = 0 , S 6 = 0 , S 5 = 0 , S 2 = ( 2 b 1 g 1 + g 2 b 4 ) P 3 2 2 ( b 4 2 4 b 1 b 2 ) , S 3 = ( b 4 g 1 + 2 g 2 b 2 ) P 3 2 b 4 2 4 b 1 b 2 , S 1 = ( 2 b 1 g 1 + g 2 b 4 ) P 3 2 2 ( b 4 2 b 1 b 2 ) .
Substituting Equation (25) into Equation (24) yields:
F = a 1 P 3 2 + a 0 P 3 4 ,
where a 0 = a 2 b 4 2 4 g 1 g 2 b 4 + 4 b 1 g 1 2 4 a 2 b 1 b 2 + 4 b 2 g 2 2 b 4 2 4 b 1 b 2 .
Equation (26) enables to find the equilibrium polarization:
P 3 = a 1 a 0
Then the expressions for piezoelectric coefficients are as follows:
d 33 = 2 P 3 ( b 4 g 1 2 b 2 g 2 ) ( b 4 2 4 b 1 b 2 ) ( a 1 + 3 a 0 P 3 2 ) , d 31 = ( 2 b 1 g 1 b 4 g 2 ) P 3 ( b 4 2 4 b 1 b 2 ) ( a 1 + 3 a 0 P 3 2 ) .
For numerical estimation we used the following LGD potential coefficients for LiTaO3: a1 = 0.1256 × 10¹⁰, b1 = 0.1355 × 10¹², b2 = 0.6475 × 10¹¹, b3 = 0.4925 × 10¹¹, b4 = 0.74 × 10¹¹, b5 = 0.48 × 10¹¹, b6 = −0.12 × 10¹¹, g1 = −0.202 × 10⁹, g2 = 0.1317 × 10¹⁰, a2 = 0.5043 × 10¹⁰. The calculated values were found to be: d31 = 1.0 × 10⁻¹² m/V, d33 = −2.5 × 10⁻¹² m/V, ε330 = 46, Р3 = 0.5 С/m2.

3.1.4. KNbO3

To perform the thermodynamic analysis of KNbO3, polarization was assumed to be P = (P3, 0, P3) for the rhombohedral phase which is stable at room temperature. In this case, the ferroelectric ordering energy takes the following form under stress-free condition [145,146,147,148]:
F f = 2 a 1 P 3 2 + ( 2 a 11 + a 12 ) P 3 4 + 2 ( a 111 + a 112 ) P 3 6 + ( 2 a 1111 + 2 a 1112 + a 1122 ) P 3 8
One can see that Equation (29) is similar to Equation (19) and differs from the latter in renormalized coefficients. Taking this into account, we can calculate the spontaneous polarization components and dielectric susceptibility as:
χ k i = ( 2 F P k P i ) 1
When the cell axis is along the pseudocubic direction, the spontaneous strains can be expressed as:
S 11 = Q 11 P 1 2 + Q 12 ( P 2 + P 3 2 ) ; S 22 = Q 11 P 2 2 + Q 12 ( P 1 2 + P 3 2 ) ; S 33 = Q 11 P 3 2 + Q 12 ( P 2 2 + P 1 2 ) ;
where Q11 and Q12 are the electrostrictive coefficients. Finally, the piezoelectric coefficients can be found from Equation (15). The energy expansion coefficients used for estimates (in SI units) were as follows: a1 = 4.273 × 10⁵(T − 377), a11 = 6.36 × 10⁸, a12 = 9.66 × 10⁸, a111 = 2.81 × 10⁹, a112 = −1.99 × 10⁹, a123 = 6.03 × 10⁹, a1111 = 1.74 × 10¹⁰, a1112 = 5.99 × 10⁹, a1122 = 2.50 × 10¹⁰, a1123 = −1.17 × 10¹⁰, Q11 = 0.12, Q12 = −0.053, Q44 = 0.052. The calculated values are at room temperature were: Ps = 0.45 С/m2, ε330 = 55, ε220 = 160, ε110 = 1000, d31 = 3.4 × 10⁻¹² m/V, d32 = −24.3 × 10⁻¹² m/V, d33 = 27.4 × 10⁻¹² m/V.
Table 2. Dielectric stiffness coefficients used for estimates (in SI units).
CoefficientsPbTiO3BaTiO3LiTaO3KNbO3(Na,K)NbO3Na0.5Bi0.5TiO3-BaTiO3
a13.8 × 105 (Т − 479)4.124 × 10⁵ (T − 115)1.256 × 1094.273 × 105 (T − 377)
a11 (a2)−7.3 × 1075.328 × 1085.043 × 1096.36 × 108
a12 9.66 × 10⁸
a1112.6 × 1081.294 × 109 2.81 × 10⁹
a112 −1.99 × 10⁹
a123 6.03 × 10⁹
a1111 3.863 × 10¹⁰ 1.74 × 10¹⁰
a1112 5.99 × 10⁹
a1122 2.50 × 10¹⁰
a1123 −1.17 × 10¹⁰
Table 3. Calculated dielectric and piezoelectric parameters (in SI units).
BPbTiO3BaTiO3LiTaO3KNbO3(Na,K)NbO3Na0.5Bi0.5TiO3-BaTiO3
TheoryObser-vationTheoryObser-vationTheoryObser-vationTheoryObser-vationTheoryObser-vationTheoryObser-vation
Ps (С/m2)1.5 0.260.260.5 0.450.42
ε33075 18918846 55
ε220 160
ε110 1000
d31 (10−12m/V)−11 −37−29.41.0 3.49.8
d32 (10−12m/V) −24.3−22.3
d33 (10−12m/V)22259586.3−2.5 27.429.3
Dielectric stiffness coefficients and calculated dielectric parameters for some piezoelectric materials have been summarized in Table 2 and Table 3. One can conclude that substitution of Pb by Ba in PbTiO3 enables higher values of permittivity and piezoelectric coupling coefficients. LiTaO3 and KNbO3 are characterized by weaker piezoelectric coupling. In summary, electrical parameters of lead-based and lead-free piezoelectrics such as the polarization, dielectric permittivity and piezoelectric coefficients can be determined using the Equations (14), (15) and (18) and experimental dielectric stiffness coefficients.

3.2. Theory of Ferroelectric Solid Solutions (Generalized Lattice Model) [149,150,151,152]

One of the most common methods for modifying the physical properties is by introduction of some impurities into ferroelectric compounds. Thus, the theoretical and experimental investigations of ferroelectric solid solutions are very attractive. There are a few different approaches to address the problem of theoretically modeling the ferroelectric solid solutions. Most popular approaches are based on density functional method, quantum chemical calculation and phenomenological thermodynamic models (such as Landau-Ginsburg-Devonshire model). This section contains application of the lattice model to ferroelectric solid solution. This model permits all calculations in analytical form with satisfactory resemblance to experimental data.
Let us consider ferroelectric solid solution as a lattice with two kinds of dipoles distributed over the sites. Suppose the energy of two dipoles located in sites R i and R j has the following form:
U i j = α , γ Q α γ ( R i R j ) ( D α ( R i ) D γ ( R j ) ) n α ( R i ) n γ ( R j ) ,
where n α ( R i ) is a dichotomous random variable with values 1 and 0 : it is equal to 1 if site R i contains a particle of α -th component, and 0 otherwise.
These variables n 1 ( R i ) and n 2 ( R i ) obey the relation:
n 1 ( R i ) + n 2 ( R i ) = 1 ,
their mean values are:
< n 1 ( R i ) > = c 1 ,    < n 2 ( R i ) > = c 2 ,    c 1 + c 2 = 1
where c 1 , c 2 are component’s concentrations in the solution.The functions Q α γ ( R ) in lattice models are long-range interaction potentials with cutting on short distances. A system of dipoles in presence of an external electric field E has the following Hamiltonian:
H = 1 2 i , j α , γ Q α γ ( R i R j ) ( D α ( R i ) D γ ( R j ) ) n α ( R i ) n γ ( R j ) i , α ( E D α ( R i ) ) n α ( R i ) .
In self-consistent field approximation for the long-range parts interactions this Hamiltonian can be transformed to following form:
H = α { i ( E α eff D α ( R i ) ) n α ( R i ) } = α H ˜ α eff ,
where
E α eff = E + 1 2 < j , γ Q α γ ( R i R j ) D γ ( R j ) n γ ( R j ) > .
The second term 1 2 < j , γ Q α γ ( R i R j ) D γ ( R j ) n γ ( R j ) > in this formula is the local effective field due to all the dipoles at point R i for dipole of α -th kind (in general case the effective fields for the components are not identical).

3.2.1. Effective Fields

To evaluate Equation (37) one should find the mean values < n γ ( R j ) > under the sum over j , γ sign. In general case these mean values depend on the correlations between component distributions, but in the effective field approximation these mean values depend on concentrations of the components:
< n γ ( R j ) > = c γ .
As a result we have the following expression for effective field
E α eff = E + 1 2 γ Q α γ (0) < D γ > c γ ,
where
Q α γ (0) = j Q α γ ( R i R j ) = j Q α γ ( R j )
(the last relation holds by virtue of translation invariance of crystal).

3.2.2. Generating Functional and Polarization of Solution

Generating functional (i.e., the partition function a system at an external field presence) in effective field approximation has the following form:
Z = 1 N 1 ! N 2 ! [ i , α d Ω i , α 4 π ] e x p [ β i , α ( E α eff D α ( R i ) ) n α ( R i ) ] ,
where d Ω i , α is a solid angle infinitesimal element in spherical coordinates ( D α , θ i , ϕ i )
d Ω i , α = s i n θ i d θ i d ϕ i ,
β =1/ T , T is absolute temperature in energetic units, N 1 and N 2 are numbers of the dipoles.
The multiple integral (41) is a product of the same type integrals
d Ω 4 π e x p [ β E eff D c o s θ ] = sinh ( β E eff D ) β E eff D ,
therefore generating functional in mean field approximation can be evaluated easily
Z = 1 N 1 ! N 2 ! [ sinh ( β E 1 eff D 1 ) β E 1 eff D 1 ] N 1 [ sinh ( β E 2 eff D 2 ) β E 2 eff D 2 ] N 2 .
Hence we find the system polarization (i.e dipole moment per volume unit) as:
P = 1 V β l n Z E = { N 1 V [ coth ( β E 1 eff D 1 ) 1 ( β E 1 eff D 1 ) ] D 1 + N 2 V [ coth ( β E 2 eff D 2 ) 1 ( β E 2 eff D 2 ) ] D 2 } .
Thus, full polarization of binary solid solution contains two contributions related to both of the components, but these contributions are mutually dependent via the effective fields. Therefore the components contributions into polarization are not additive.

3.2.3. Mean Value of a Single Particle Dipole Moment in Effective Field

Mean value of a single particle dipole moment in external field E defined as:
< D > = e β H 1 D c o s θ d Ω 1 e β H 1 d Ω 1 ,
and has well known result [153,154,155]:
< D > = D L ( β D E ) ,
where
L ( z ) = [ coth ( z ) 1 z ]
is the Langevin function, H 1 is the Hamiltonian of single dipole with moment D in external field E
H 1 = ( E D ) .
For one-component the system of expressions (37) has a simple form
E eff = E + 1 2 Q (0) < D >,
Substitution E eff instead of E into formula (43) leads to transcendent equation with respect to < D > . It is well known this equation has a nontrivial solution < D > 0 at T < T c .

3.2.4. Polarization of Solid Solution

System of equations for mean values < D 1 > and < D 2 > of dipole moments of the solution components follows from relation (45):
{ < D 1 > = D 1 [ coth ( β D 1 { E + 1 2 γ Q 1 γ (0) < D γ > c γ } ) 1 β D 1 { E + 1 2 γ Q 1 γ (0) < D γ > c γ } ] < D 2 > = D 2 [ coth ( β D 2 { E + 1 2 γ Q 2 γ (0) < D γ > c γ } ) 1 β D 2 { E + 1 2 γ Q 2 γ (0) < D γ > c γ } ] .
Note the connection between < D 1 > and < D 2 > realize via non-diagonal elements of matrix Q α γ (0) only. It is clear that the solution { < D 1 >,< D 2 > } of this system of equations depends on the temperature, the external field, and all of the matrix elements Q α γ (0) . To solve this system we should know the parameters of the physical system, i.e., matrix elements Q α γ (0) . These elements should be find using some experimental data.
Solution of system (51) with respect to < D 1 > , < D 2 > permits to find polarization of the system as function of external field E
P = N V [ c 1 < D 1 > + c 2 < D 2 > ]
and consequently the susceptibility χ of this system:
χ = N V [ c 1 < D 1 > E + c 2 < D 2 > E ]
The Langevin function L ( z ) contains two terms. The first term is a transcendent function, the second is an algebraic function. Both of them have a singularity at z =0 . These circumstances complicate search of the solution. Therefore, the Langevin function should be approximated by some more suitable function with correct asymptotic behavior at z 0 and z . In the capacity of such approximation we shall use the following function
L ( z ) 2 π arctan ( π z 6 ) .
Note, this approximation is well not only for the Langevin function, but also for its derivative
L ' ( z ) 12 36 + π 2 z 2 .
This approximation for the Langevin function permits to simplify the system of Equations (51)
< D α > = 2 D α π arctan ( π β D α 6 [ E + 1 2 γ Q α γ (0) < D γ > c γ ] ) ,    ( α =1,2).

3.2.5. Parameters of the Components

Some of the parameters D α and Q α α (0) of solution can be find from experimental data of the components. Equation (56) for a pure component ( c α = 1, c γ | γ α =0 ) have the following form
< D α > = 2 D α π arctan ( π β D α 6 { E + 1 2 Q α α (0) < D α > } ) .
This equation describes connection between external field E and mean value of dipole moment D α . Critical temperature can find from condition existence of nontrivial solution (i.e., < D α > 0 ) in external field vanishing E = 0 . Graphical analysis of Equation (57) leads to following connection between critical temperature T c α and the model parameters
( D α ) 2 Q α α (0) 6 = T c α .
Differentiating both of sides of Equation (57) with respect to E
< D α > E = 12 β ( D α ) 2 36 + ( π β D α ) 2 [ E + 1 2 Q α α (0) < D α > ] 2 ( 1 + 1 2 Q α α (0) < D α > E ) ,
we find derivate
< D α > E = 12 β ( D α ) 2 [ 36 + ( π β D α ) 2 [ E + 1 2 Q α α (0) < D α > ] 2 ] 6 β Q α α (0) ( D α ) 2 .
Eliminating Q α α (0) from the last equation with account (58), we obtain susceptibility of the pure ferroelectrics:
χ = N α V < D α > E = N α V 12 β ( D α ) 2 { 36 ( 1 T c T ) + ( π T ) 2 [ E D + 3 T c < D α > D α ] 2 } .
At E = 0 the susceptibility have a singularity in vicinity of the critical point T c .

3.2.6. Susceptibility of Solid Solution

After differentiating both sides of each equation in (56) over E we obtain a system of linear algebraic equations for < D α > E :
< D α > E = 12 β ( D α ) 2 36 + ( π β D α ) 2 [ E + 1 2 γ Q α γ (0) c γ < D γ > ] 2 ( 1 + 1 2 γ Q α γ (0) c γ < D γ > E ) .
This system have the following short form:
{ ( 1 A 1 B 11 ) < D 1 > E A 1 B 12 < D 2 > E = A 1 ; A 2 B 21 < D 1 > E + ( 1 A 2 B 22 ) < D 2 > E = A 2 ,
where
A α = 12 β ( D α ) 2 36 + ( π β D α ) 2 [ E + 1 2 γ Q α γ (0) c γ < D γ > ] 2 ,
and
B α γ = 1 2 Q α γ (0) c γ .
Hence we have for < D 1 > E and < D 2 > E :
{ < D 1 > E = A 1 ( 1 A 2 B 22 + A 2 B 12 ) 1 A 1 B 11 A 2 B 22 + A 1 A 2 [ B 11 B 22 B 12 B 21 ] , < D 2 > E = A 2 ( 1 A 1 B 11 + A 1 B 21 ) 1 A 1 B 11 A 2 B 22 + A 1 A 2 [ B 11 B 22 B 12 B 21 ] .
This system of equations will be used for the critical point finding.

3.2.7. Critical Points of Solid Solutions and Model Parameters

The solution susceptibility (53) in the critical point has a singularity due to vanishing denominators in right hand sides of (66)
1 A 1 B 11 A 2 B 22 + A 1 A 2 [ B 11 B 22 B 12 B 21 ] =0.
This equation takes place under the conditions
{ E =0; < D 1 > = < D 1 >=0.
The second of these conditions due to the polarization vanishing at T > T c .
Substituting expressions (64) and (65) with conditions (68) account into Equation (67), we obtain the quadratic equation with respect to critical temperature T
T 2 ( D 1 ) 2 Q 11 (0) c 1 + ( D 2 ) 2 Q 22 (0) c 2 6 T + c 1 c 2 36 ( D 1 ) 2 ( D 2 ) 2 [ Q 11 (0) Q 22 (0) Q 12 (0) Q 21 (0) ] =0.
Discriminant of this equation in relation to symmetry property of the matrix Q α γ (0) is non-negative
D ˜ = [ ( D 1 ) 2 Q 11 (0) c 1 ( D 2 ) 2 Q 22 (0) c 2 ] 2 + 4 c 1 c 2 ( D 1 ) 2 ( D 2 ) 2 Q 12 (0) Q 11 (0) 0,
therefore this equation has two real solutions.
Two variants are possible depending on the quantity Q sign
Q = Q 11 (0) Q 22 (0) Q 12 (0) Q 21 (0) .
Q 0 . In this case one of the solutions is positive, and the second solution is negative. The positive solution has a physical sense as the Curie temperature, the negative solution has not any physical sense.
Q >0 . In this case both of the solutions are positive. A physical interpretation of this case can be clarified after temperature analysis of the Equations (56)’s solutions. Thus, at condition Q >0 two-component ferroelectric solid solution has two critical points.
Note that the critical points of solutions depends on such combinations dipole moments D α and interatomic potentials Q α γ (0)
G α γ = Q α γ (0) D α D γ .
Transform the equation (65) using these combinations
T 2 G 11 ( 1 x ) + G 22 x 6 T + x (1 x ) 36 [ G 11 G 22 G 12 G 21 ] =0,
where x = c 2 is second component concentration, c 1 =1 x .
Let us introduce a new parameter
G = G 11 G 22 G 12 G 21
and consider a general way of the model parameters G 11 , G 22 , G finding by the method of least squares.
Let us introduce the function f ( G , G 11 , G 22 , T , x )
f ( G , G 11 , G 22 , T , x ) = T 2 G 11 ( 1 x ) + G 22 x 6 T + x (1 x ) 36 G
and find the parameters G , G 11 , G 22 by means of the function F ( G , G 11 , G 22 ) minimization:
F ( G , G 11 , G 22 ) = i f 2 ( G , G 11 , G 22 , T i , x i ) = min ,
where T i , x i are the experimental points. As a result, system of equations for the model parameters G , G 11 , G 22 finding has the following form:
{ F ( G , G 11 , G 22 ) G =0; F ( G , G 11 , G 22 ) G 11 =0; F ( G , G 11 , G 22 ) G 22 =0.
After parameters G , G 11 , G 22 finding it is possible to perform research of the Curie temperature as function of solution composition.

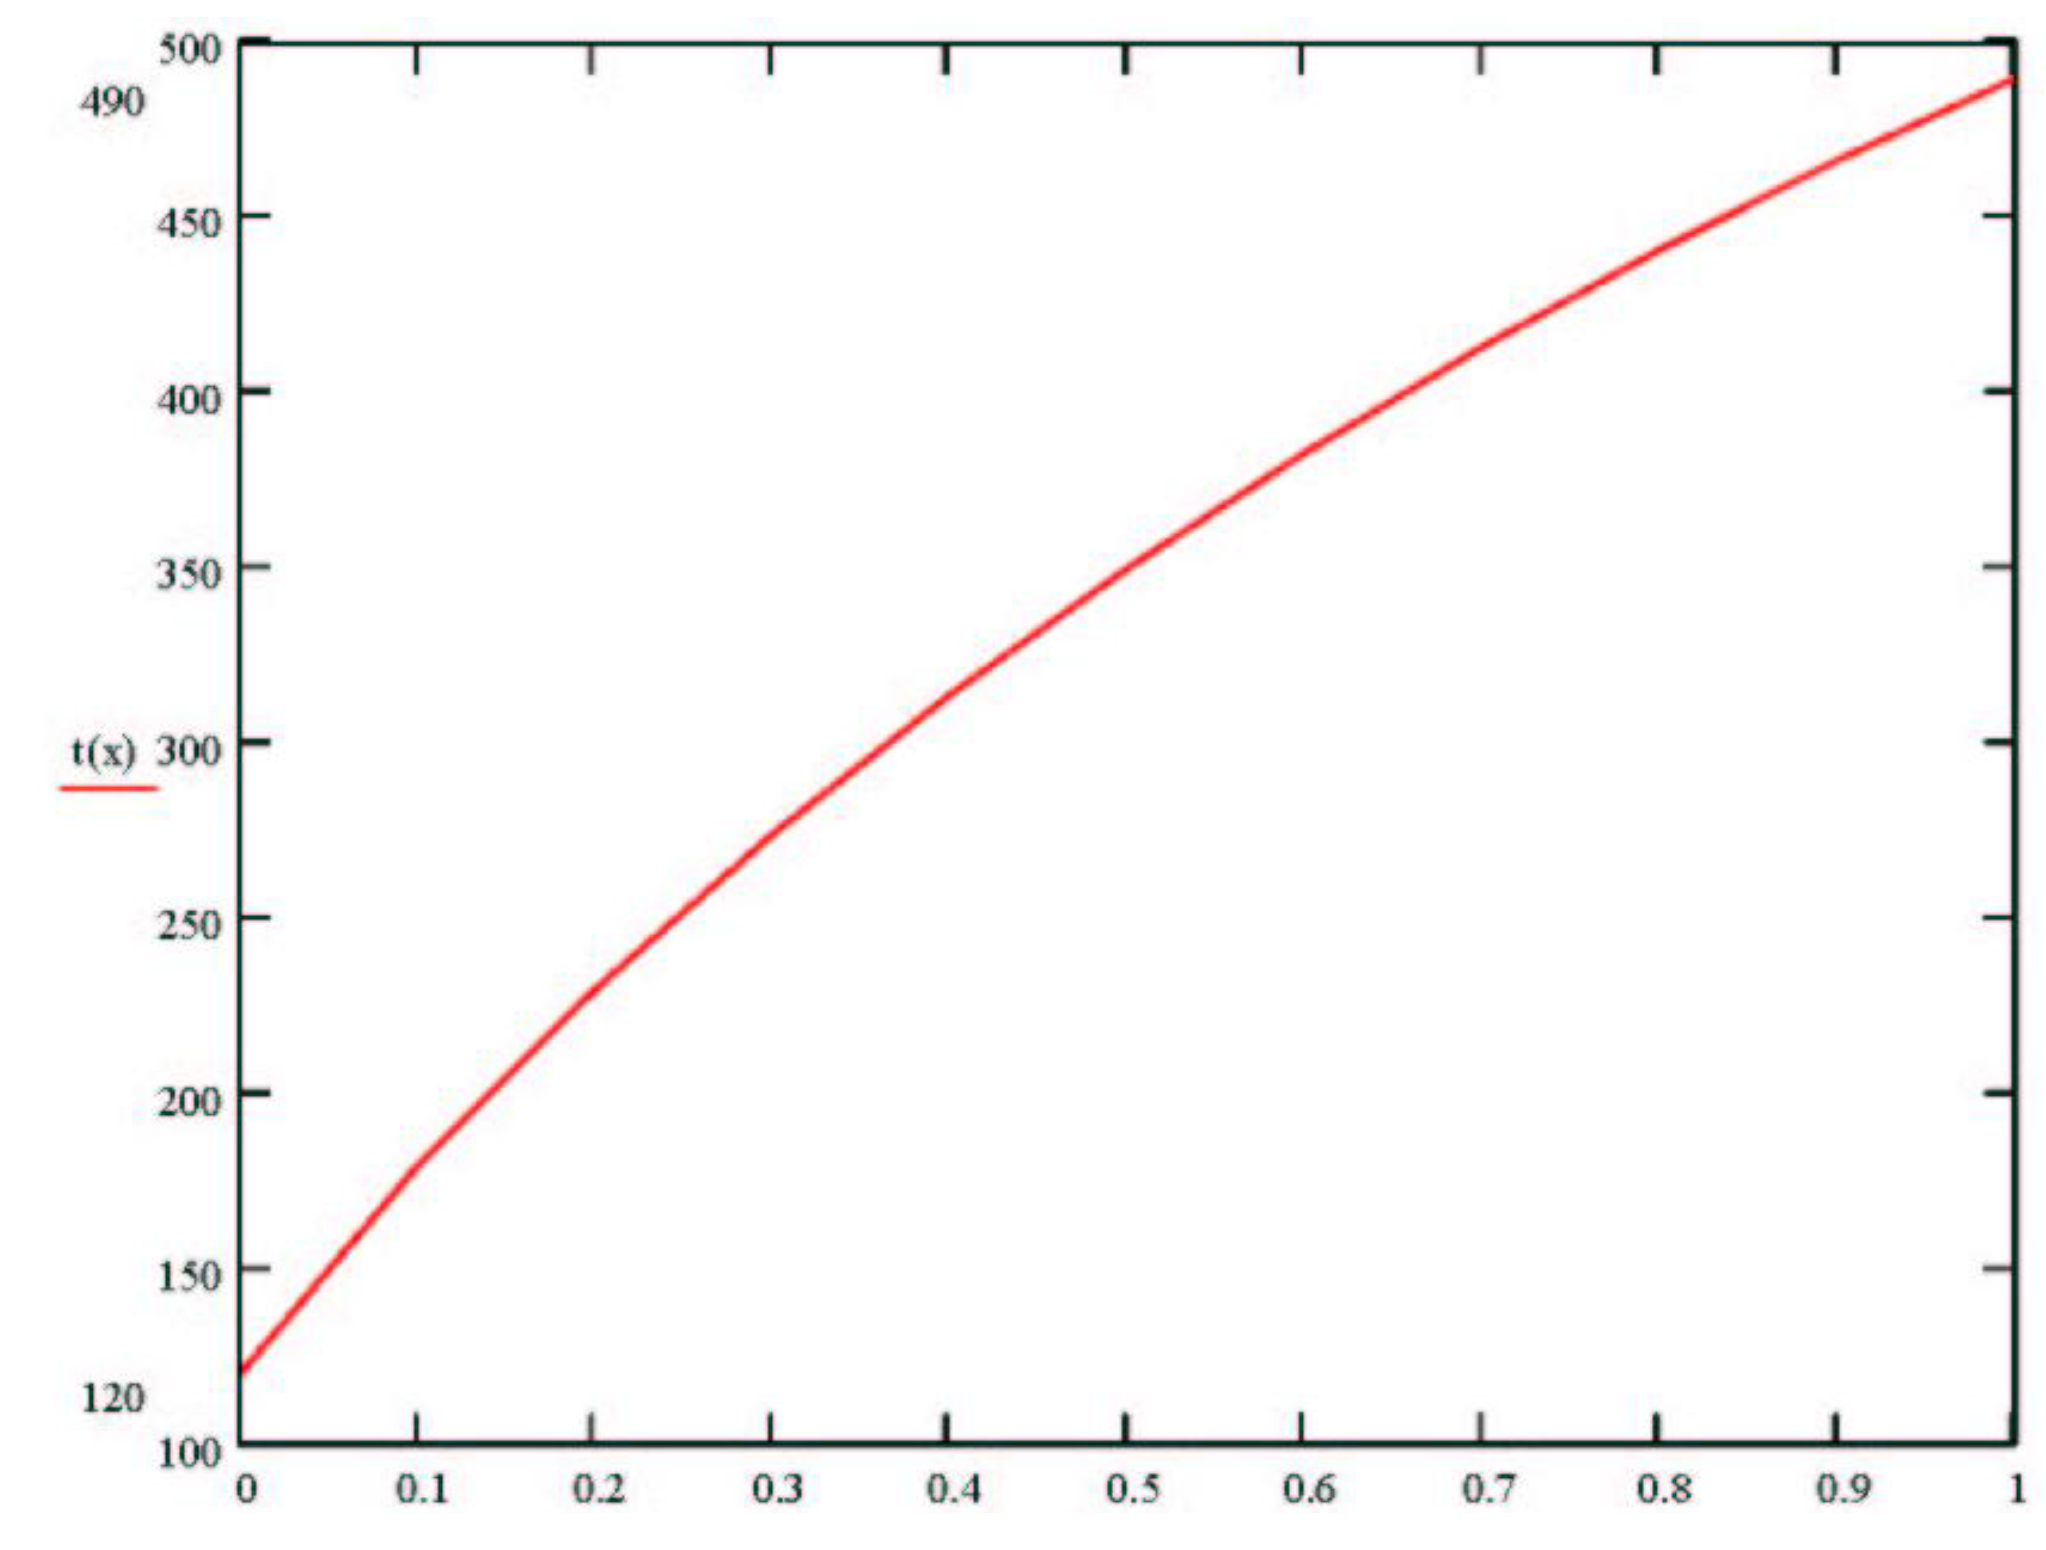
3.2.8. System Ba1−xPbxTiO3

There are the experimental data for Curie temperature of the system Ba1−xPbxTiO3 at concentrations 0 ≤ x ≤ 1 [153,154,155,156,157]. The part of the measurement results presented in the Table 4.
Table 4. Curie temperatures as a function of composition of Ba1−xPbxTiO3.
x00.5 1.0
T(x)393 K 623 K 763 K
The first line contains the concentration of PbTiO3 in the system, the second line contains the corresponding Curie temperatures. Results of the parameters G 11 , G 22 , G calculations are:
{ G 11 =2358 K G 22 =4578 K ; G = 4.043 10 6 K 2 .
Results of these parameters using Curie temperatures of the solutions are presented in Figure 6. These results are in close agreement with experimental data.
Figure 6. Calculated dependence of the Curie temperature of the system Ba1-xPbxTiO3.
Materials 04 00651 g006
Thus, the lattice model with effective field approximation for long-range parts of the interatomic potentials can be used for description of the ferroelectric solid solutions. But, the essential restriction of the model should be noted: this approach in the present form can be realized in the case of similarity of the crystal structures of the solid solution components only. Otherwise the method should be modified.

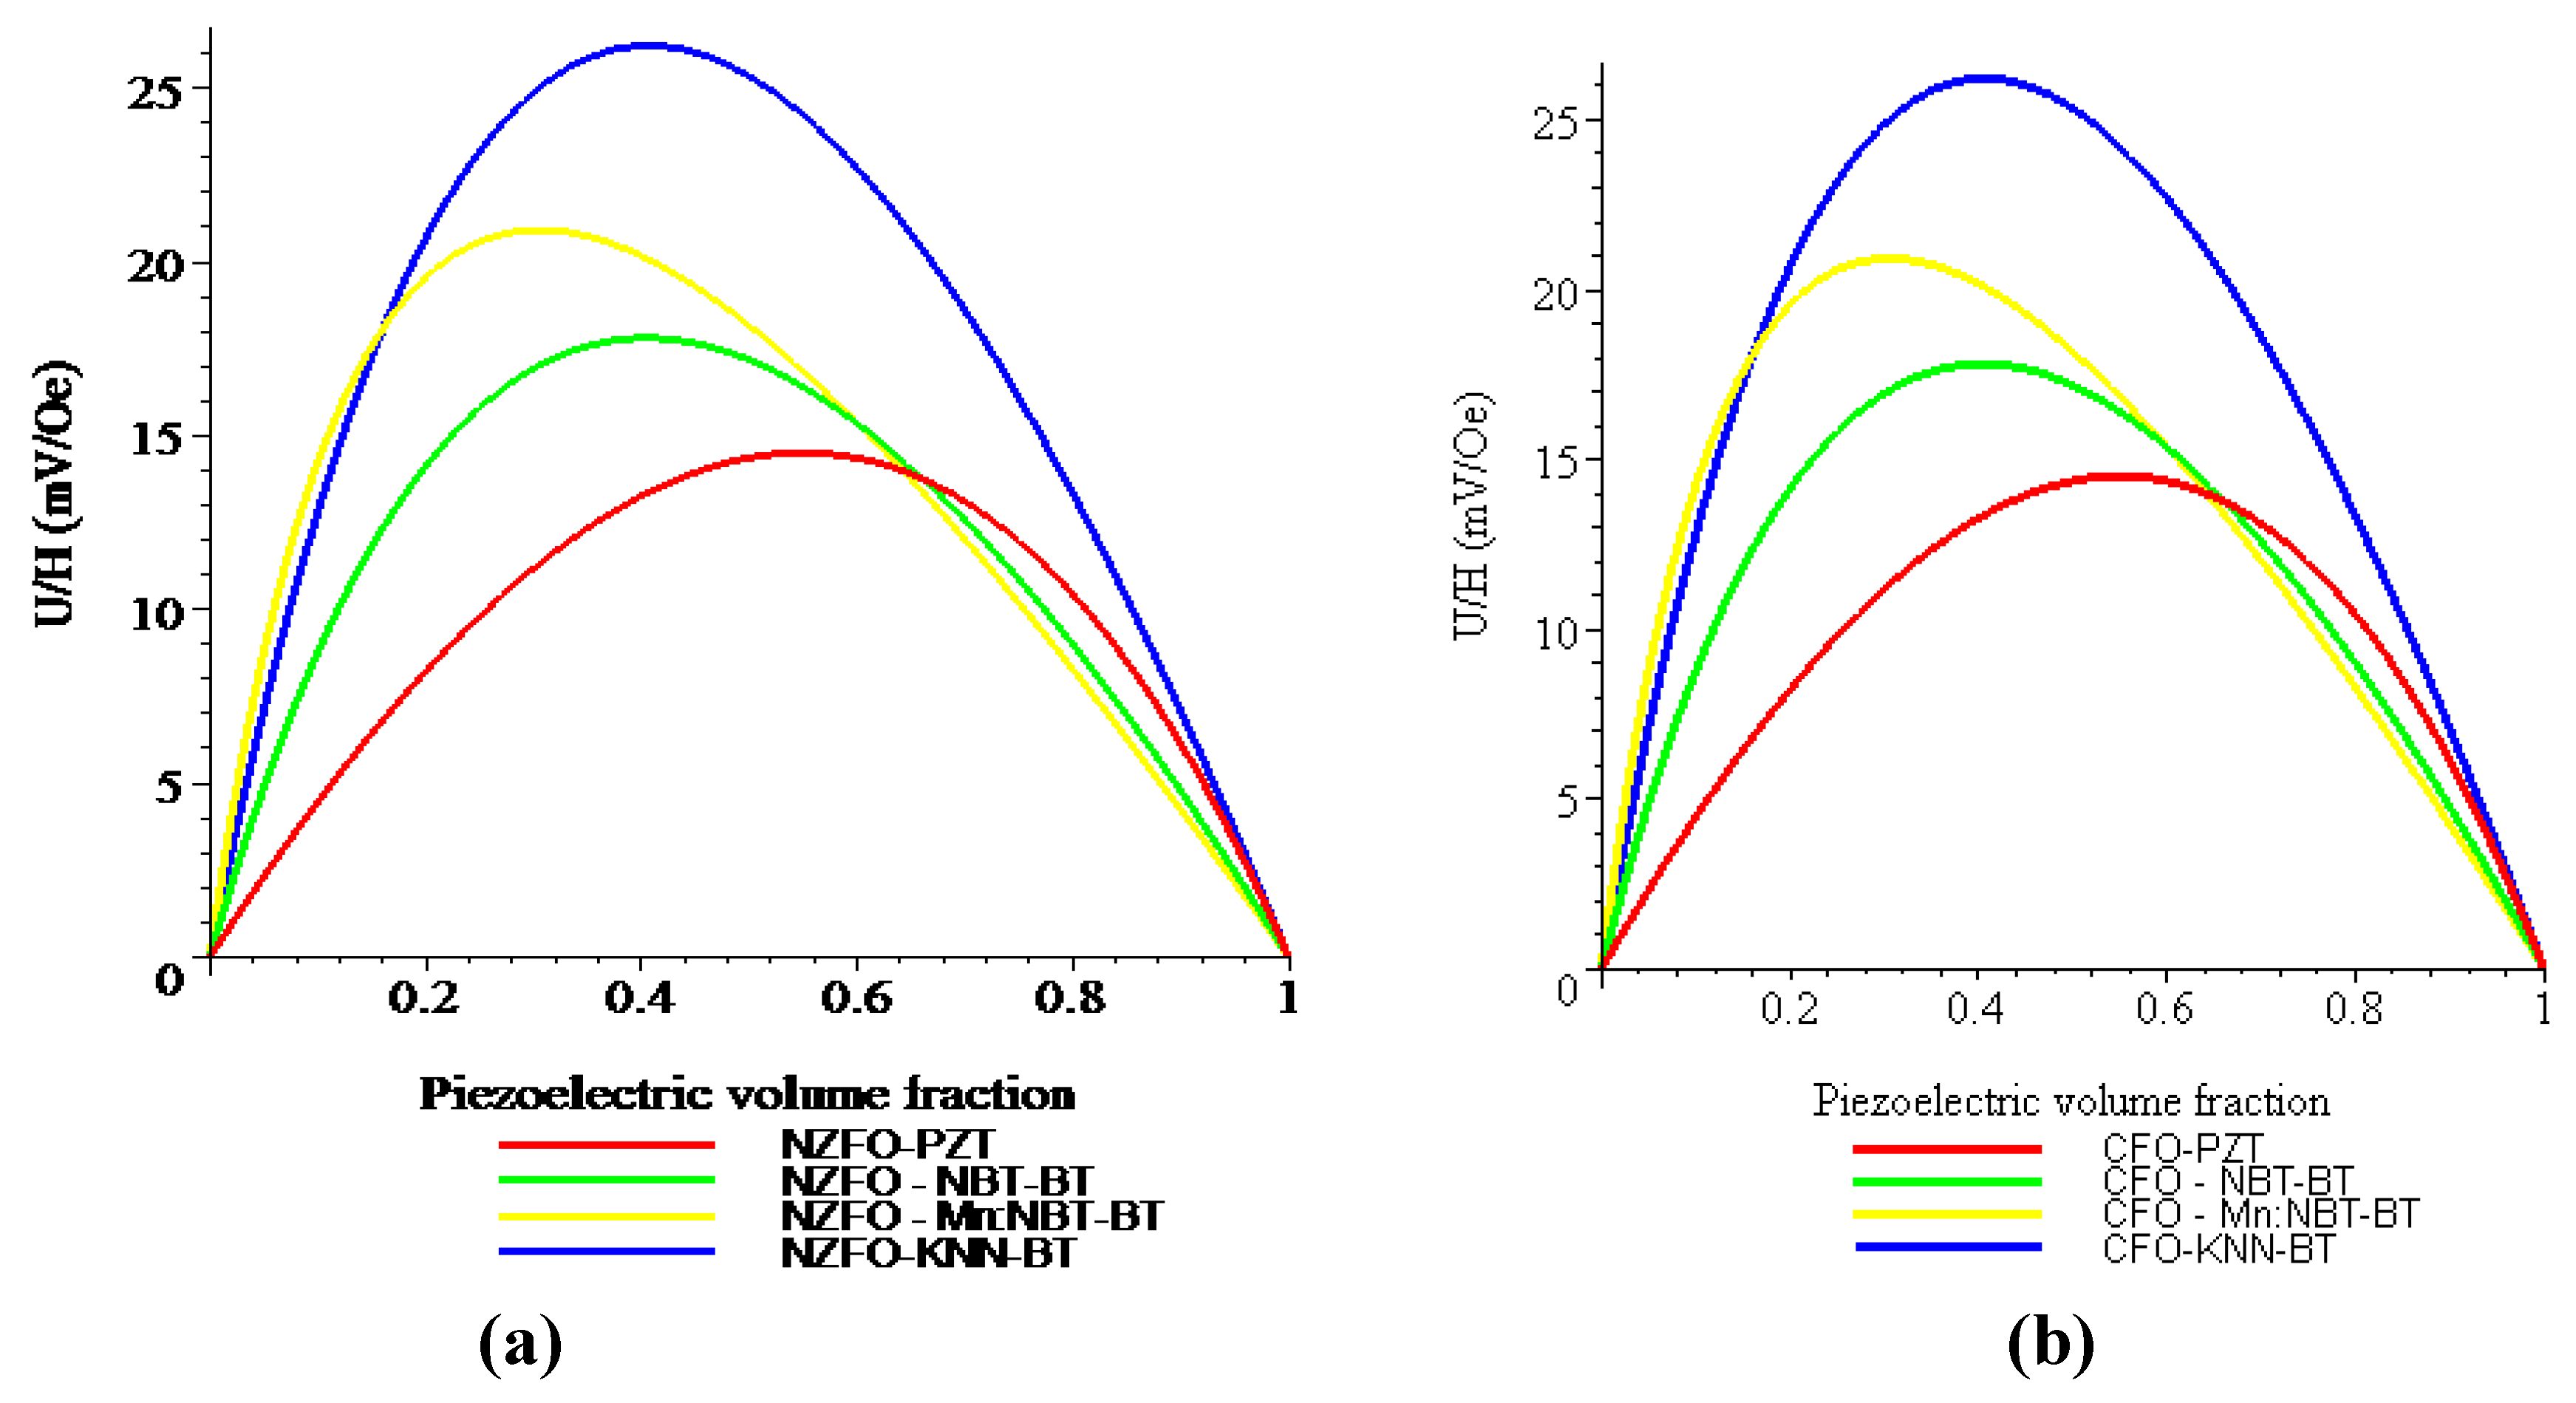
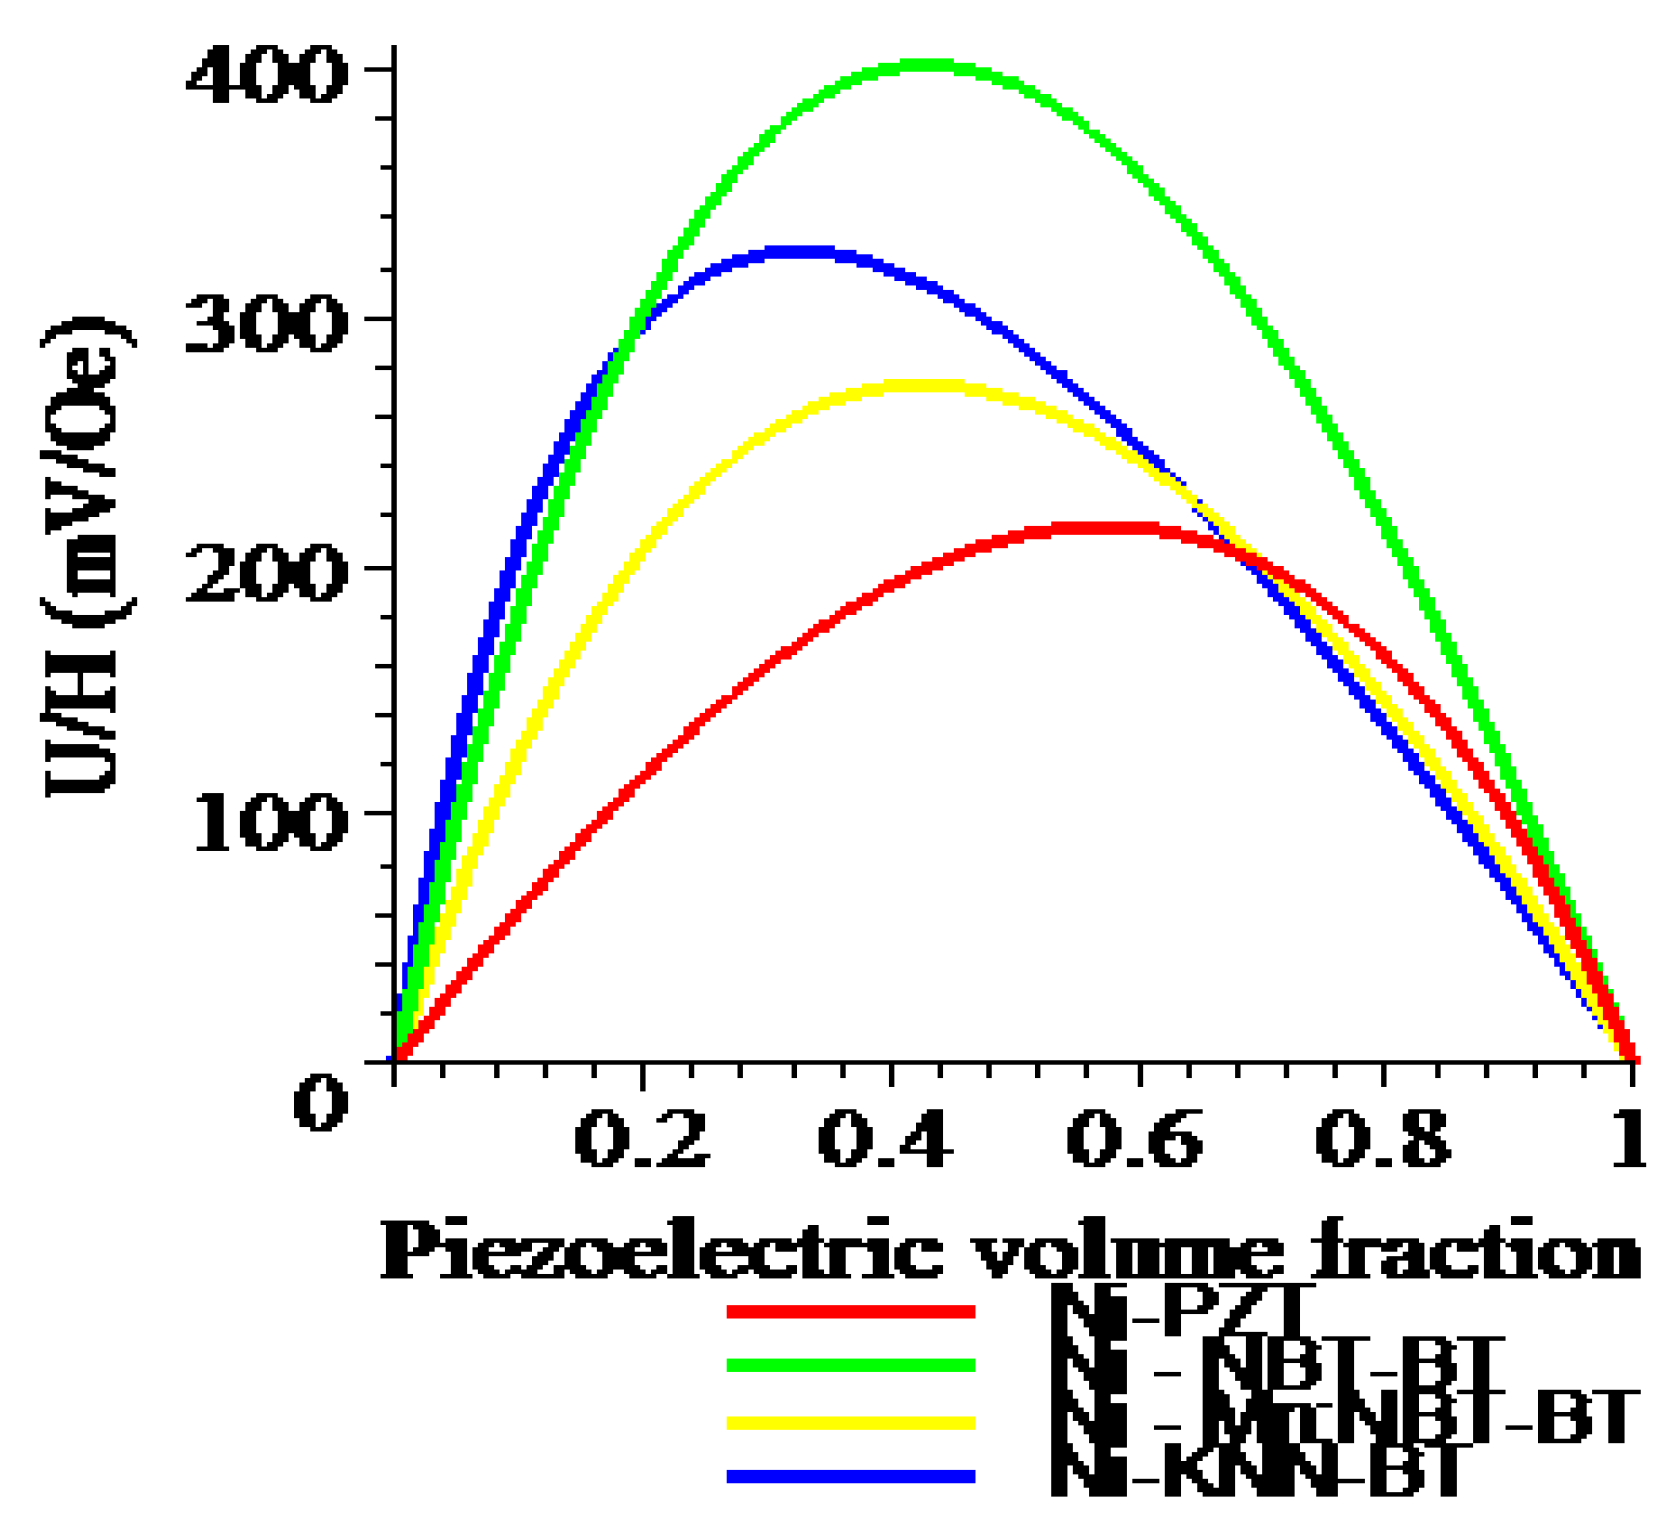
4. Modeling of Magnetoelectric Composites

The theory for 3-0 composites is based on the cubic model of composite [158,159]. The sample is assumed to consist of cubes. Dimensions of sample are supposed to be small compared with wave-lengths of AC fields used in the measurements. One, therefore, needs to obviously analyze only one of the units to describe the whole sample. For a unit cube, Equations (79) and (80) are described. The boundary conditions consist in force balance and equality of medium displacement on the boundaries. Using Equations (79) and (80) and boundary conditions enables one to obtain ME voltage coefficient numerically. Calculations show that the peak longitudinal ME voltage coefficient for 3-0 connectivity reaches 4000 mV/cm Oe and is three times higher than the transverse coefficient when the poling direction is perpendicular to the bias magnetic field. In case of 0-3 connectivity the peak longitudinal ME voltage coefficient equals 900 mV/cm Oe. In a real composite sample, the internal units are clamped by neighboring ones. Taking into account the clamping effect caused by surrounding unites cubes leads to significant decreasing of ME voltage coefficients.
PZT volume fraction dependence of transverse ME voltage coefficients is shown in Figure 7 for the sample in which internal units are assumed to be clamped by neighboring ones.
Figure 7. Piezoelectric volume fraction dependence of ME voltage coefficient for 3–0 and 0–3 composites of NZFO-PZT and NZFO-KNNBT.
Materials 04 00651 g007
Further, we consider only symmetric extensional deformation in this model and ignore any asymmetric flexural deformations of the layers that would lead to a complex solving procedure. Our consideration is based on the following equations that can be written for the polarized piezoelectric phase with the symmetry ∞m for the strain and electric displacement:
pSi = psij pTj + pdki pEk
pDk = pdki pTi + pεkn pEn
where pSi and pTj are strain and stress tensor components of the piezoelectric phase, pEk and pDk are the vector components of electric field and electric displacement, psij and pdki are compliance and piezoelectric coefficients, and pεkn is the permittivity matrix.
The magnetostrictive phase is assumed to have a cubic symmetry and is described by the equations:
mSi = msij mTj+mqkimHk
where mSi and mTj are strain and stress tensor components of the magnetostrictive phase, mHk and are the vector components of magnetic field, msij and mqki are compliance and piezomagnetic coefficients.
The layers are assumed to be perfectly coupled at the interface and we use the following boundary conditions:
v pTi + (1 − v)mTi = 0 and pSi = mSi for i=1, 2,
where v is PZT volume fraction.
Equations (79)–(81) yield the expression for ME voltage coefficient for longitudinal fields’ orientation as:
α E 33 = E 3 H 3 = 2 μ 0 v ( 1 v ) d 31 p q 31 m { 2 d 31 2 p ( 1 v ) + ε 33 p [ ( s 11 p + s 12 p ) ( v 1 ) v ( s 11 m + s 12 m ) ] } × [ ( s 11 p + s 12 p ) ( v 1 ) v ( s 11 m + s 12 m ) ] { [ μ 0 ( v 1 ) μ 33 m v ] [ v ( s 12 m + s 11 m ) ( s 12 p + s 12 p ) ( v 1 ) ] + 2 q 31 2 m v 2 }
where Ek and Hk are vector components of the electric and magnetic field; sij is an compliance coefficient; dki is a piezoelectric coefficient; qki is a piezomagnetic coefficient; εkn is permittivity.
For transverse fields’ orientation, the following expression can be obtained for ME voltage coefficient:
α E , 31 = E 3 H 1 = v ( 1 v ) ( q 11 m + q 21 m ) d 31 p ε 33 p ( s 12 m + s 11 m ) v + ε 33 p ( s 11 p + s 12 p ) ( 1 v ) 2 d 31 2 p ( 1 v )
As an example, numerical estimates are made for bilayers of NZFO, cobalt freite (CFO) or Ni and PZT or lead-free ferroelectrics. Using the zinc-substituted nickel ferrite is dictated by fact that when Zn is substituted in nickel ferrite, the room temperature q varies linearly with increasing Zn concentration x for x < 0.3 [160]. The material parameters used for theoretical estimates are listed in Table 5. Calculations of magnetically induced voltage are for the sample thickness of 1 mm.
Table 5. Material parameters (compliance coefficient s, piezomagnetic coupling q, piezoelectric coefficient d, and permittivity ε) for NZFO, CFO, Ni, PZT and lead-free ferroelectrics [161,162] used for theoretical estimates.
Materials11 (10−12 m2/N)s12 (10−12 m2/N)q11 (10−12 m/A)q12 (10−12 m/A) d31 (10−12 m/V)d33 (10−12 m/V)ε330
PZT17.3−7.22--−1754001750
NBT-BT7.3−3.2--−1402802000
Mn:NBT-BT7.3−3.2 −2424834000
NKN-BT5.55−1.04 −1102251058
NZFO6.5−2.4−1050210 -
CFO6.5−2.4−1880556
Ni4.9−1.5−4140570
Figure 8 shows the piezoelectric volume fraction dependence of ME voltage coefficient for NZFO-PZT, NZFO-MBT-BT, NZFO-Mn:MBT-BT, and NZFO-NKN-BT and for CFO-PZT, CFO-MBT-BT, CFO-Mn:MBT-BT, and CFO-NKN-BT for longitudinal fields’ orientation.
One can see from Figure 8 and Figure 9 that the transverse ME voltage coefficient considerably exceeds the longitudinal one that is attributed to a reduction in the internal magnetic field due to finite magnetic permeability of ferrite and demagnetizing fields for longitudinal fields’ orientation. The stronger piezomagnetic coupling for CFO (see Table 5) results in increased ME coefficients compared to NZFO. Figure 10 and Figure 11 show the futher increase of ME effect at the replacement of ferrites by a Ni phase.
Figure 8. Piezoelectric volume fraction dependence of longitudinal magnetoelectric (ME) voltage coefficient for bilayers of NZFO and piezoelectrics (a) and CFO and piezoelectrics (b).
Materials 04 00651 g008
Figure 9. Piezoelectric volume fraction dependence of transverse ME voltage coefficient for bilayers of NZFO and piezoelectrics (a) and CFO and piezoelectrics (b).
Materials 04 00651 g009
Figure 10. Piezoelectric volume fraction dependence of longitudinal ME voltage coefficient for a bilayer of Ni and piezoelectrics.
Materials 04 00651 g010
Figure 11. Piezoelectric volume fraction dependence of transverse ME voltage coefficient for a bilayer of Ni and piezoelectrics.
Materials 04 00651 g011
The above theory is for samples that are free of any external mechanical force. Now we consider bilayers that are clamped perpendicular to the plane of the bilayer, along direction 3. The compliance of the clamp system is represented by sc33, with zero compliance for rigidly clamped samples and infinite compliance for unclamped samples. As an example, we consider ME coupling in a clamped bilayer for transverse field orientation. The boundary conditions for the clamped sample become T1 = 0, T2= 0, and T3 = sc33 T3. The transverse ME voltage coefficient is determined by the expression (84)
α E , 31 = α 31 ( s 33 + s c 33 ) d 33 q 33 ε 33 ( s 33 + s c 33 ) d 33 2
where α33, s33, d33, q33, and ε33 are ME susceptibility, effective compliance, piezoelectric and piezomagnetic coefficients, and permittivity of composite [8]. The numerical estimate of ME coupling is presented in Figure 12 for free and rigidly clamped bilayers of PZT and NZFO. One can see from Figure 12 that clamping the sample reduced ME coupling by half.
Figure 12. PZT volume fraction dependence of ME voltage coefficient for free and rigidly clamped bilayers of NZFO and PZT for transverse fields’ orientation.
Materials 04 00651 g012

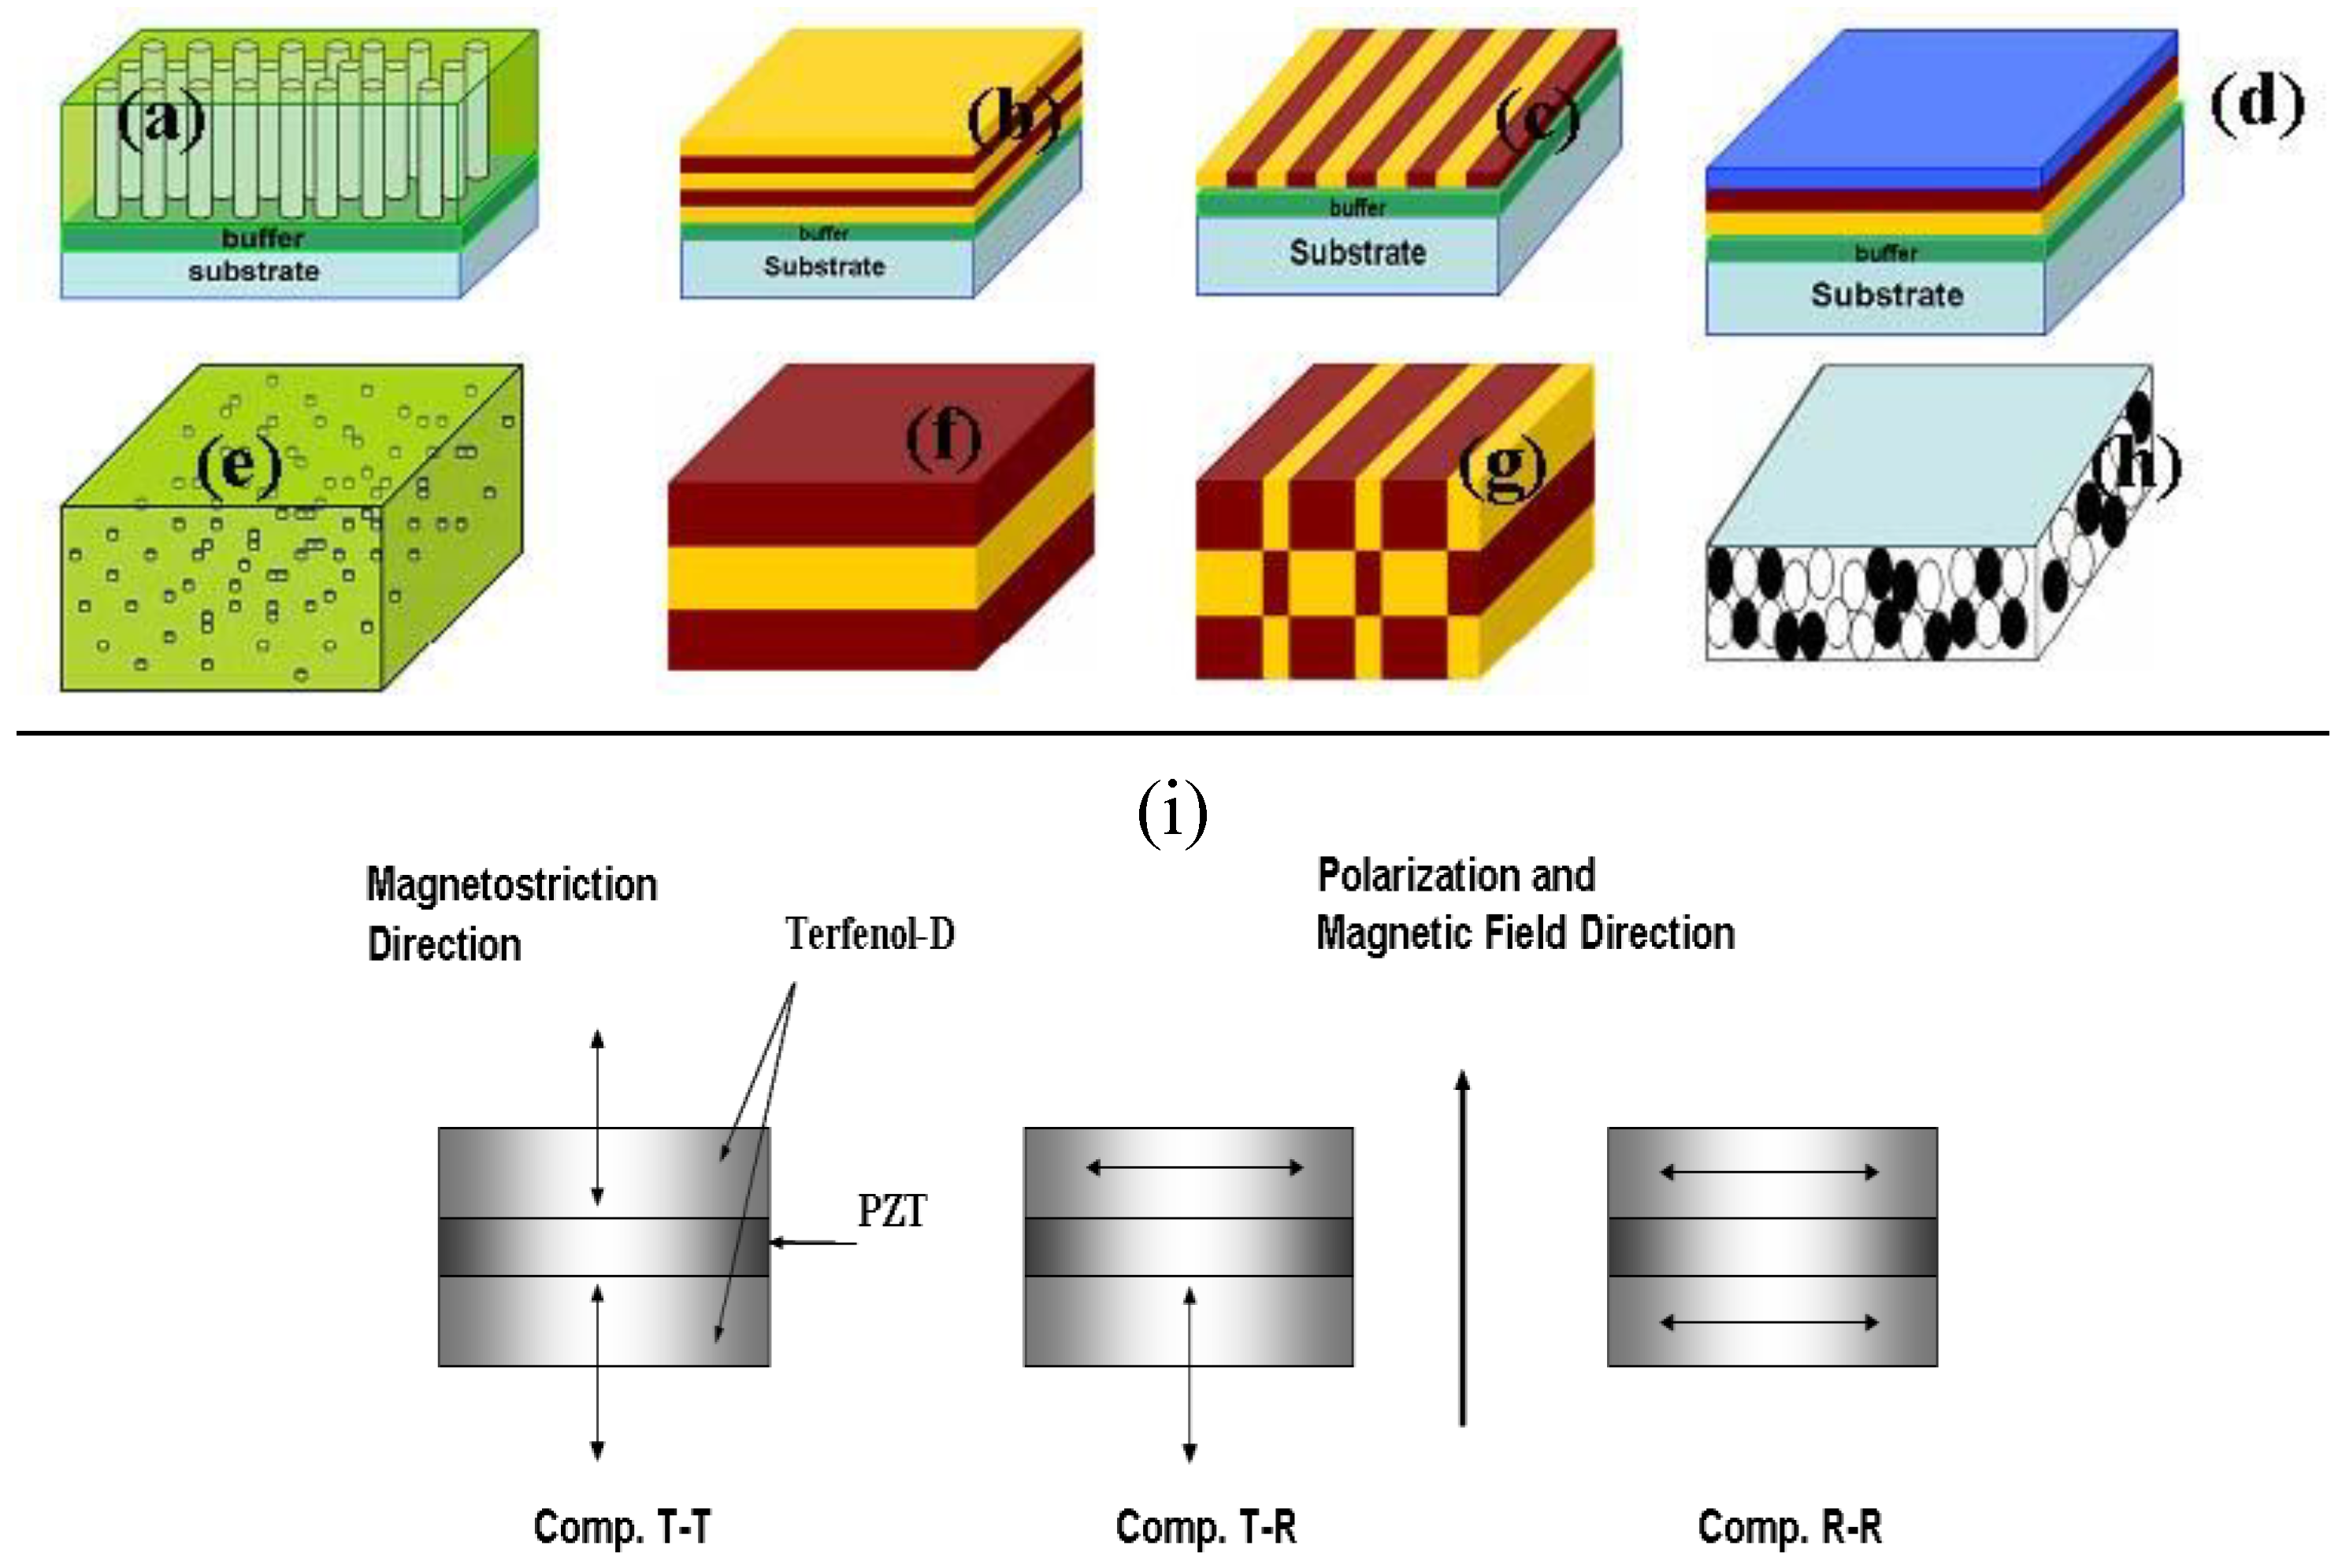
5. Data on Magnetoelectric Response in 3-0, 2-2, and 1-3 Composites

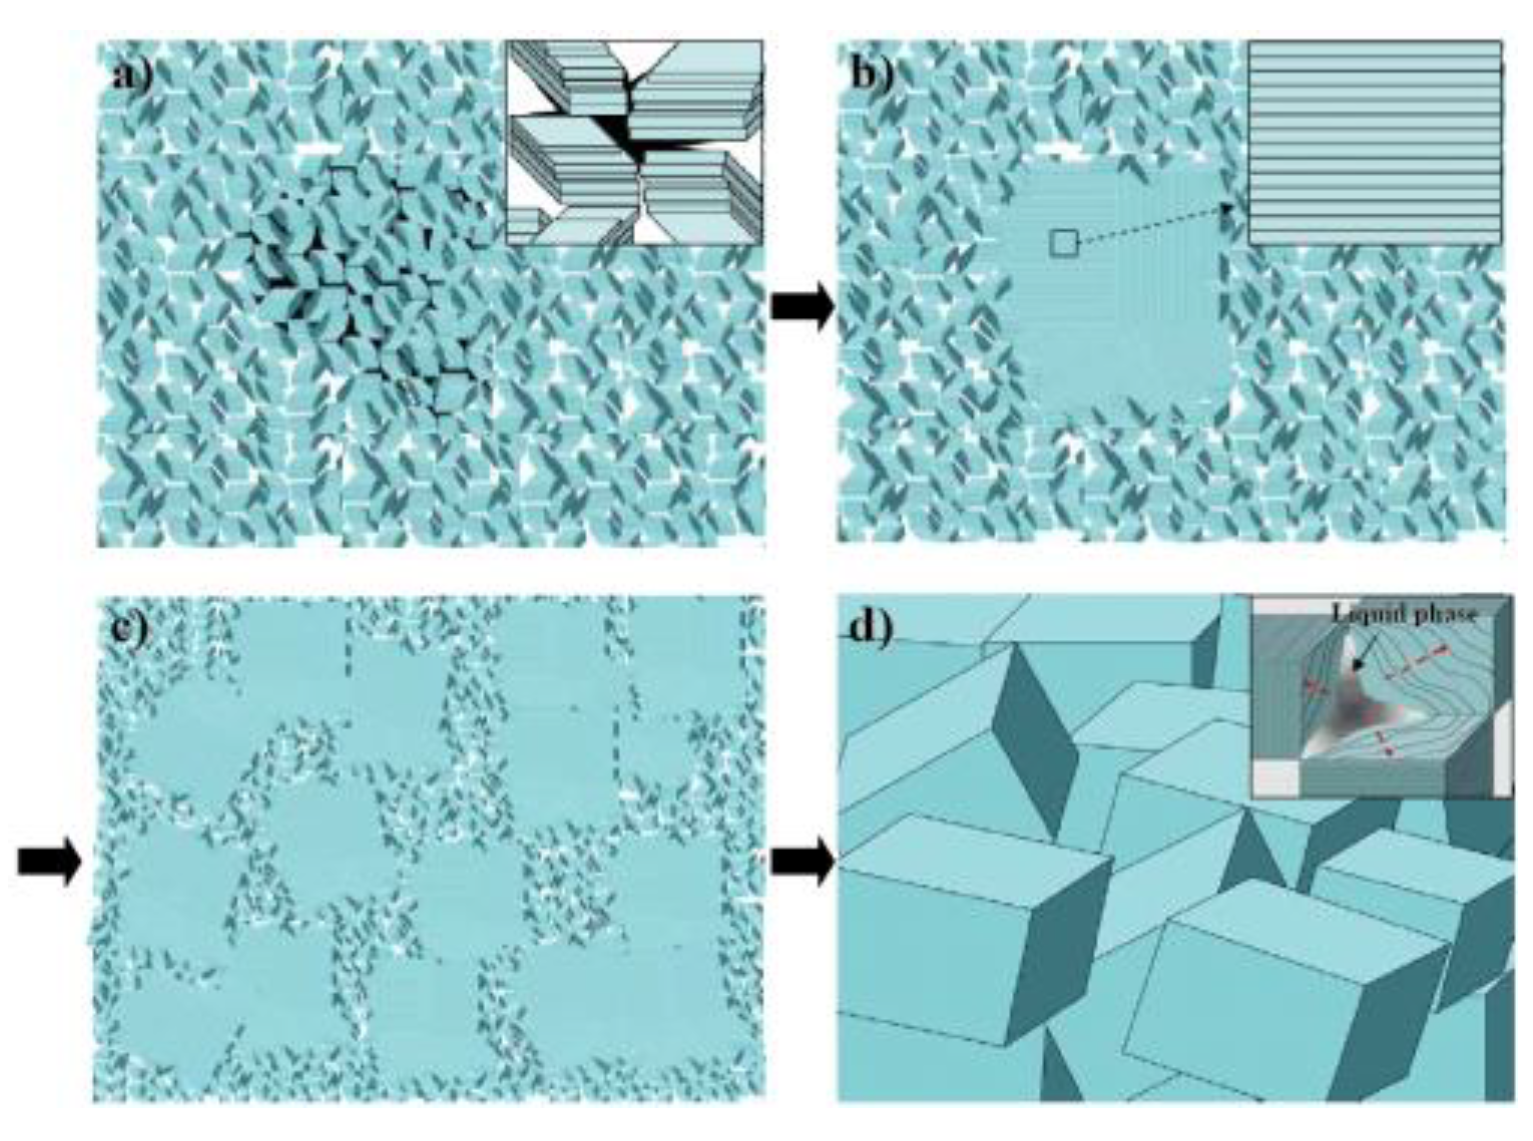
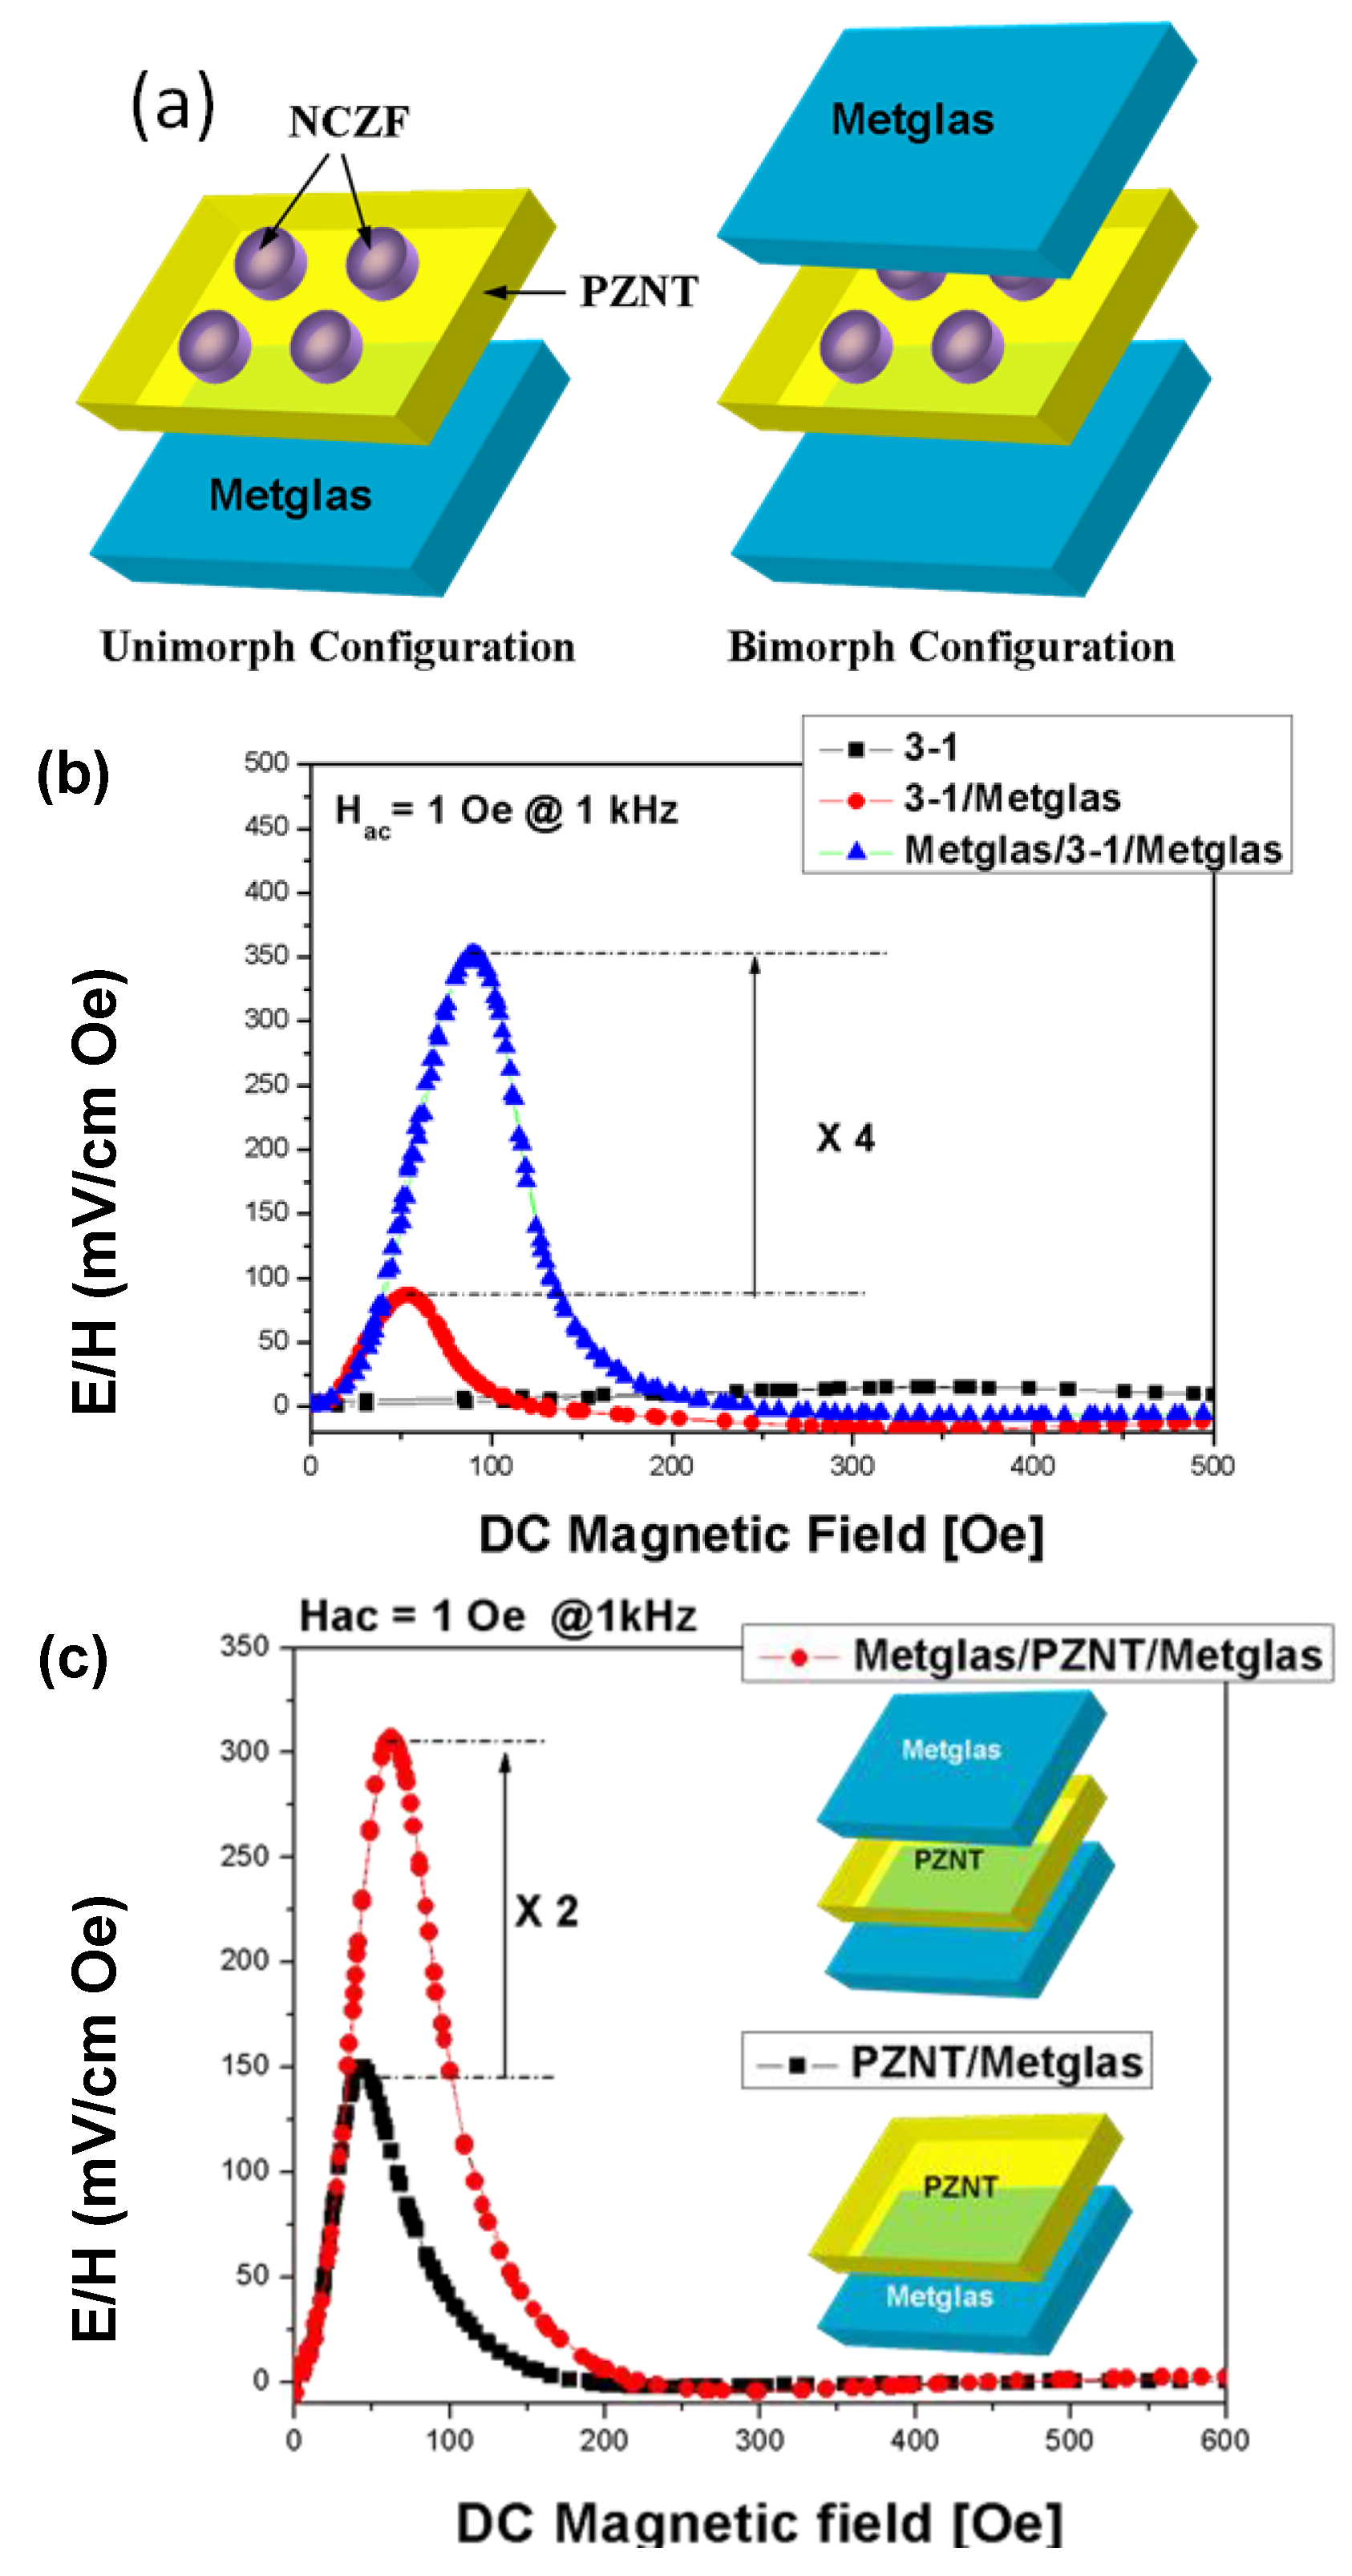
5.1. ME Effect in Sintered Composites

Magnetoelectric composite materials consisting of piezoelectric and magnetostrictive phases respond to both electric and magnetic field. The composites exploit product property and various synthesis techniques can be adopted to combine two different phases depending upon the crystal symmetry, lattice parameters and physical state. The presence of piezoelectric and magnetostrictive phases in the same material provides the opportunity to develop a voltage gain device operating on the following principle. An applied AC magnetic field induces strain in the magnetostrictive phase which is transferred onto the piezoelectric phase in an elastically coupled system. The piezoelectric phase produces the electric charge in proportion to the applied strain. Figure 13 summarizes the magnitude of ME coefficient reported for in situ and particulate sintered composites [12,24,163,164,165,166]. It can be immediately noticed that multi-layer laminates with inter-digital electrodes provide the highest magnitude of ME coefficient. Figure 13 also shows the interface microstructure in Pb(Zr,Ti)O3-(Ni,Zn)Fe2O4 (PZT-NZF) composites with bilayer geometry with no intermediate electrodes. By tuning the concentration of ionic dopants it is possible to achieve dense interfacial structures which can compensate for the lattice mismatch between the perovskite and spinel. However, diffusion of Zn and Cu ions into piezoelectric phase and Pb ions into magnetostrictive phase limits the magnitude of maximum achievable ME coupling. The diffusion length in Figure 13 is of the order of 15–20 μm with synthesis temperatures in the range of 1100 °C. In particulate composites there is additional problem limiting the magnitude of ME coupling, namely 3D connectivity of magnetic phase which for smaller piezoelectric grain sizes can be noticeable. It is now well understood that ME coefficient in particulate composites can be tailored to their maximum magnitude by synthesizing high piezoelectric voltage coefficient “g” and high piezoelectric strain coefficient “d” phase surrounded by low magnetic coercivity and high magnetization magnetostrictive phase. Additional constraint is imposed by the equivalence of mechanical impedance.
Figure 13. Magnetoelectric coefficient for various bulk sintered composites.
Materials 04 00651 g013
Figure 14(a) and (b) shows the variations in ME coupling with varying piezoelectric grain size in 3–0 particulate Pb(Zr0.52Ti0.48)O3 (PZT)-Ni0.8Zn0.2Fe2O4 (NZF) composites [167]. It was found that as the piezoelectric phase grain size increases the overall resistivity, piezoelectric, dielectric and ferroelectric property of the composite increases and saturates above 600 nm. Below 200 nm average grain size, piezoelectric and dielectric properties decrease rapidly. The size effect of magnetic phase was small. In addition to diffusion, the main problem limiting the magnitude of ME coupling was found to be 3D connectivity of the magnetic phase, which for smaller piezoelectric grain sizes can be noticeable.
Figure 14. Magnetoelectric responses as a function of (a) DC bias field and (b) grain size of PZT.
Materials 04 00651 g014
In layered composites the connectivity is limited to the region near the interface. For thin film systems, this may form the significant fraction of the overall system. Self-assembled microstructures (such as eutectic decomposition and strain minimization) suffer from the drawback that ferroelectric polarization is reduced in the system due to formation of mechanical twins, thus exhibiting low magnitude of ME coupling. BaTiO3-CoFe2O4 (BTO-CFO) system particulate composite with eutectic composition were reported by Echigoya et al. [163]. Even though the phase distribution occurs with high periodicity and interface exhibits crystallographic orientation relationships, the magnitude of ME coupling remains low. The orientation relationships between phases in eutectic decomposition of BTO-CFO can be expressed as: (i) for hcp BaTiO3: (111)CFO//(00.1)BTO and (110)CFO//(11.0)BTO; and (ii) for tetra/cubic BaTiO3: (001)CFO//(001)BTO and (100)CFO//(100) BTO.
High magnetostrictive coefficients are obtained in the compounds of the type R–T where R is rare earth and T is the transition metal, however these materials have poor resistivity and are chemically reactive. Thus, the choice for the magnetostrictive phase in grown / sintered composites narrows down to the spinel ferrites. In the spinel ferrites, the spontaneous magnetization corresponds to the difference between the sublattice magnetizations associated with the octahedral and tetrahedral sites. Results have shown enhanced magnitude of the ME coefficient for Ni0.8Zn0.2Fe2O4 (NZF) and Co0.6Zn0.4Fe2O4 (CZF). In the nickel zinc ferrite solid solution (Ni1−xZnxFe2O4) as x is increased Zn2+ replaces Fe3+ in the tetrahedral sites and Fe3+ fills the octahedral sites emptied by Ni2+. The net magnetization of nickel zinc ferrite is proportional to 5(1 + x) + 2(1 − x) − 0(x) − 5(1 − x) = 2 + 8x. Thus, the magnetic moment as a function of the Zn content increases until there are so few Fe3+ ions remaining in tetrahedral sites that the superexchange coupling between tetrahedral and octahedral sites breaks down. Figure 15 shows our results on the PZT-NZF and PZT-CZF composites. It can be seen from this figure that CZF is a hard magnetic phase, requires higher DC bias, has lower remanent magnetization and results in larger reduction of the ferroelectric polarization as compared to NZF. On the other hand, a high increase in the resistivity of the Ni-ferrites is obtained by doping with Co. Further, the sintering of Ni-ferrites has been found to be simpler with the PZT matrix due to low temperatures and adequate grain growth.
Figure 15. Comparison of magnetic properties for PZT-NZF and PZT-CZF.
Materials 04 00651 g015
In particulate-sintered composites consisting of random distribution of magnetostrictive particles, there is excessive cross-diffusion of ions across the interface. Recently, it was shown in Cu-modified nickel zinc ferrite (NCZF)–PZNT composites that Cu ions diffuse into PZNT while Pb ions diffuse into NCZF. This cross-diffusion lowers the magnitude of magnetostrictive constant and piezoelectric voltage constant. Another drawback of particulate-sintered composites is connectivity of the ferrite particles which lowers the overall resistivity and reduces the poling voltage. However, by confining the distribution of NFO along the grain boundaries and controlling the fraction of such boundaries, higher poling voltage can be applied. Figure 16(a) and (b) shows the simulation of the magnetic field pattern when the ferrite particles and ferrite plates are placed in between the strong DC magnetic field. The magnetic field pattern clearly reveals that the plates are able to reach the saturation state for a given applied magnetic field while dispersed particle do not because the flux line originating from the particles shield the response. This data provides another explanation for the experimentally observed fact that magnetoelectric response of the sintered in situ composites is lower than the layered ones. The field in textured nanocomposite can be enhanced by coupling with the external layers.
Recent results by Grossinger et al. on composite consisting of 50% cobalt ferrite-50% barium titanate in core-shell structure show giant increase in ME coefficient as compared to randomly dispersed composites [168]. The results were analyzed in terms of coupling coefficient k, given as kpar = λparpar/dH, where λpar represents the longitudinal magnetostriction, H is the applied magnetic field, and d is the effective sample thickness. It was shown that the magnitude of ME coefficient increases with k which is higher for core-shell structure. These results are consistent with our own data which shows that core-shell Pb(Zr,Ti)O3 (PZT)-NiFe2O4 (NFO) particulate nanocomposites provide higher magnitude of ME coefficient. In our case, core-shell composites were synthesized through high pressure sintering which resulted in good interface bonding and effective strain transfer across the interface [169]. The microstructure in Figure 17, which has a resemblance to core-shell structure, can provide effective elastic coupling between the magnetostrictive and piezoelectric phases. The magnitude of magnetostriction coefficient, λpar, and k will be higher for the NFO-ordered phase distribution along the grain boundaries due to texturing and phase separation.
Figure 16. Magnetic field patterns (a) when the ferrite particles are placed between the magnets; and (b) when ferrite plates are placed.
Materials 04 00651 g016
Figure 17. Transmission electron microscope images of PZT-NFO core-shell composite synthesized by high pressure compaction sintering: (a) Bright field (b) Dark field.
Materials 04 00651 g017
The lead-free 3-0 ME composites have been studied using three types of piezoelectric materials based on: (i) K0.5Na0.5NbO3, (ii) Na0.5Bi0.5TiO3, and (iii) BaTiO3. BaTiO3-CoFeO4 (BTO-CFO) lead-free composites were reported by Boomgaard et al. in 1978 and were found to exhibit ME coefficient of 130 mV/cm∙Oe [13]. After that, several studies have been conducted on lead-free ME composites but the magnitude of ME coefficient was found to be below 100 mV/cm∙Oe in off-resonance conditions because of the poor piezoelectric properties of lead-free materials. Recently, lead-free 3-0 ME composites of (1 − x) [0.948 K0.5Na0.5NbO3–0.052 LiSbO3] − x Ni0.8Zn0.2Fe2O4 (KNNLS-NZF) with island–matrix structure have been studied by Yang et al. [170]. Figure 18 shows that the ME voltage coefficient was found to maximize in the 0.7 KNNLS–0.3 NZF sintered at 1060 °C and the optimum DC bias representing the maximum ME voltage coefficient decreased with increase in mole fraction of NZF in the composites. From the result in Figure 18(a), it can be also seen that the island-matrix system is a promising structure to use wide range of magnetic values with high ME effect.
Figure 18. (a) ME coefficient and (b) Hbias for (1 − x) KNNLS–x NZF composites.
Materials 04 00651 g018

5.2. ME Effect in 2-2 Composites

A 2-2 connectivity refers to a bilayer consisting of piezoelectric and magnetostrictive phases [8]. The leakage problem due to high concentration of ferrite and low resistivity in the ferroelectric ceramic matrix can be eliminated through laminate structure as shown in Figure 19. However, high temperature co-firing process for the piezoelectric and ferrite ceramic layers is a big challenge due to difference in shrinkage rate, thermal expansion mismatch, and interdiffusion and/or chemical reactions between the two ceramic layers during the sintering process at high temperature. These composites also exhibit much larger anisotropy as compared to particulate composites.
Figure 19. Schematic diagram of ME trilayer composites with two-type configurations.
Materials 04 00651 g019
Figure 20 summarizes the magnitude of ME coefficient reported for 2-2 laminate composites in off-resonance conditions. In general, 2-2 laminate ME composites, three types of magnetostrictive mateirals have been used: (i) ferrite, (ii) Terfenol-D, and (iii) Metglas. Various ferrite oxides in Table 6 are available to co-sinter with piezoelectric matrix and were found to exhibit different magnetostrictions due to their varying magnetic properties [171]. Terfenol-D has the largest magnetostriction of 1400 × 10−6 with low permeability, while Metglas has extremely high relative permeability of >40,000 and thus is an quite attractive magnetostrictive material in low field ME sensors [172]. Detailed research has been performed by the authors exploring the 2-2 connectivity of the ME composites in the form of bilayers, trilayers and multilayers of piezoelectric and magnetostrictive materials. Islam et al. have synthesized PZT-NCZF bilayer and NCZF-PZT-NCZF trilayer using co-firing technique. We found a high ME coefficient on the order of ~500 mV/cm·Oe in trilayer structures [164]. Lead-free 2-2 laminate ME composites of BaTiO3 (BT) / (Ni0.8Zn0.2)Fe2O4 (NZFO) also were synthesized by co-firing and the magnitude of ME voltage coefficient reached saturation at DC bias of 1000 Oe with maximum magnitude of 152 mV/cm Oe [173]. Dong et al. have studied several multilayered ME configurations by using materials PZT, Terfenol D and Metglas and have reported quite high ME coefficients on the order of 10 V/cm·Oe in resonance condition [30,32,33,38]. Among bulk multiferroic composites, the composites consisting of giant magnetostrictive alloy Tb1–xDyxFe2 (Terfenol-D) and piezoelectric Pb(Zr,Ti)O3 (PZT), exhibiting high magneto and electromechanical energy densities respectively, are the most attractive due to their giant ME response [33,34,38,174,175]. Recent research by Park et al. reported the maximum ME coefficient of 5150 mV/cm∙Oe in off-resonance condition by combining PZT-PMN, Metglas, and Terfenol-D [176].
Table 6. Magnetostrictions for ferrite oxides.
Material λ s ( × 10 6 )
MnFe2O4−5
Fe3O440
CoFe2O4−110
MgFe2O4−6
Li0.5Fe2.5O4−8
NiFe2O4−26
CuFe2O4−9
YFe5O12−2
SmFe5O123.3
DyFe5O121.46
EuFe5O129.48
Our study on texturing in 2-2 laminate composites shows that the cofired ME trilayer consisting of (Ni0.6Cu0.2Zn0.2)Fe2O3 (NCZF) and 0.85Pb(Zr0.52Ti0.48)O3-0.15Pb(Zn1/3Nb2/3)O3 (PZT–PZN) with partial texturing was found to exhibit 67 % improvement in magnitude of ME coefficient than that of trilayer with random orientation [177]. The textured PZT-PZN composites with high tetragonality were found to possess 44% improvement in d33 and 44–50% enhancement in dielectric constant. Park et al. reported ME responses in 2-2 laminate composites consisting of Pb(Zn1/3Nb2/3)x(Zr0.5Ti0.5)1−xO3 (PZNT) and Metglas [178]. These laminates were fabricated by stacking 20 layers of Metglas on one-side of PZNT plate for type I and both-side of PZNT plate for type II composites as shown in Figure 21. The ME voltage coefficients were found to be 62 mV/cm Oe at DC bias of 215 Oe for type I and 73 mV/cm Oe at DC bias of 570 Oe. Dimensionally gradient bimorph structure has been designed for wide operating range of frequency and Hbias [179]. The ME behavior was found to be dependent on both shape and dimension of laminates such that the bimorph laminates with asymmetric H shape were found to exhibit flat ME responses by merging different dimensional ME responses under wide ranges of Hbias = 60−215 Oe and f = 7−22 kHz, respectively. Our results have laid the foundation for design of the magnetic field sensors exhibiting wide frequency and DC bias operating range.
Figure 20. Magnetoelectric coefficient for 2-2 laminate composites in off-resonance conditions.
Materials 04 00651 g020
Figure 21. (a) Schematic diagram and (b) ME voltage coefficients for PZNT/Metglas bilayer and Metglas/PZNT/Metglas trilayer laminates.
Materials 04 00651 g021
Recently, we have measured the ME voltage coefficients for 2-2 lead-free ME laminates given as Ni/NKNLS / Ni, Ni/NBTBT/Ni, and Metglas/NBTBT/Metglas. These lead-free ME laminates were fabricated by embedding piezoelectric layers between magnetostrictive layers of Ni plates or Metglas. The lead-free laminates with Ni in Figure 22 (a) and (b) were found to exhibit high ME coefficients of 300 and 80 mV/cm·Oe at Hbias = 100 and 200 Oe, respectively. On the other hand, the laminates with Metglas shown in Figure 22 (c) show the maximum ME coefficient of 47 mV/cm·Oe below 30 Oe due to the high permeability of Metglas.
Figure 22. ME voltage coefficients for 2-2 trilayer laminates of (a) Ni/NKNLS/Ni; (b) Ni/NBTBT/Ni; and (c) Metglas/NKNLS/Metglas.
Materials 04 00651 g022
Figure 23. Longitudinal piezoelectric strain coefficient for (1 − x) KNNLS–x NZF composites as a function of atomic ratio of Fe/Nb. ME coefficient for (1 − x)KNNLS-xNZF / Ni / (1 − x)KNNLS-xNZF bending mode laminates: (a) x = 0.1; (b) x = 0.2; and (c) x = 0.3. Fe (white color) mapping images for (1 − x)KNNLS-xNZF composites: (d) x = 0.1; (e) x = 0.2; and (f) x = 0.3.
Materials 04 00651 g023
Effect of loss factors on dynamic ME response in 2-2 laminates has been reported by Cho et al. [180]. It was shown that the magnitude of ME sensitivity is dependent on intensive dielectric and piezoelectric loss in sub-resonance conditions but dominantly dependent on extensive mechanical loss in resonance conditions. We have designed ME laminate composites given as Pb(Zr,Ti)O3-Pb(Mg1/3Nb2/3)O3 single crystal/Terfenol-D/Metglas for high sensitivity and found ME coefficient of 5 V/cm Oe at 1 kHz with DC magnetic sensitivity of 500 nT and 1 μT [176]. Recently, we have reported self-biased ME response, which is defined as remnant ME coefficient at zero H bias, in 2-2 ME laminate composites consisting of both one-phase piezoelectric and two-phase magnetostrictive layers with electric connection for bending [181]. The ME hysteresis was found to be dependent on both magnetic interaction and bending effect, and various shapes of ME hysteresis could be obtained in off-resonance and resonance conditions. Recently, the material and structural effects on self-biased ME responses was realized by changing material composition, so that one could control the shape of ME hysteresis which can be promising for applications in low-field/high sensitive magnetic sensors and electrically, tuned memory devices as shown in Figure 23 [170].

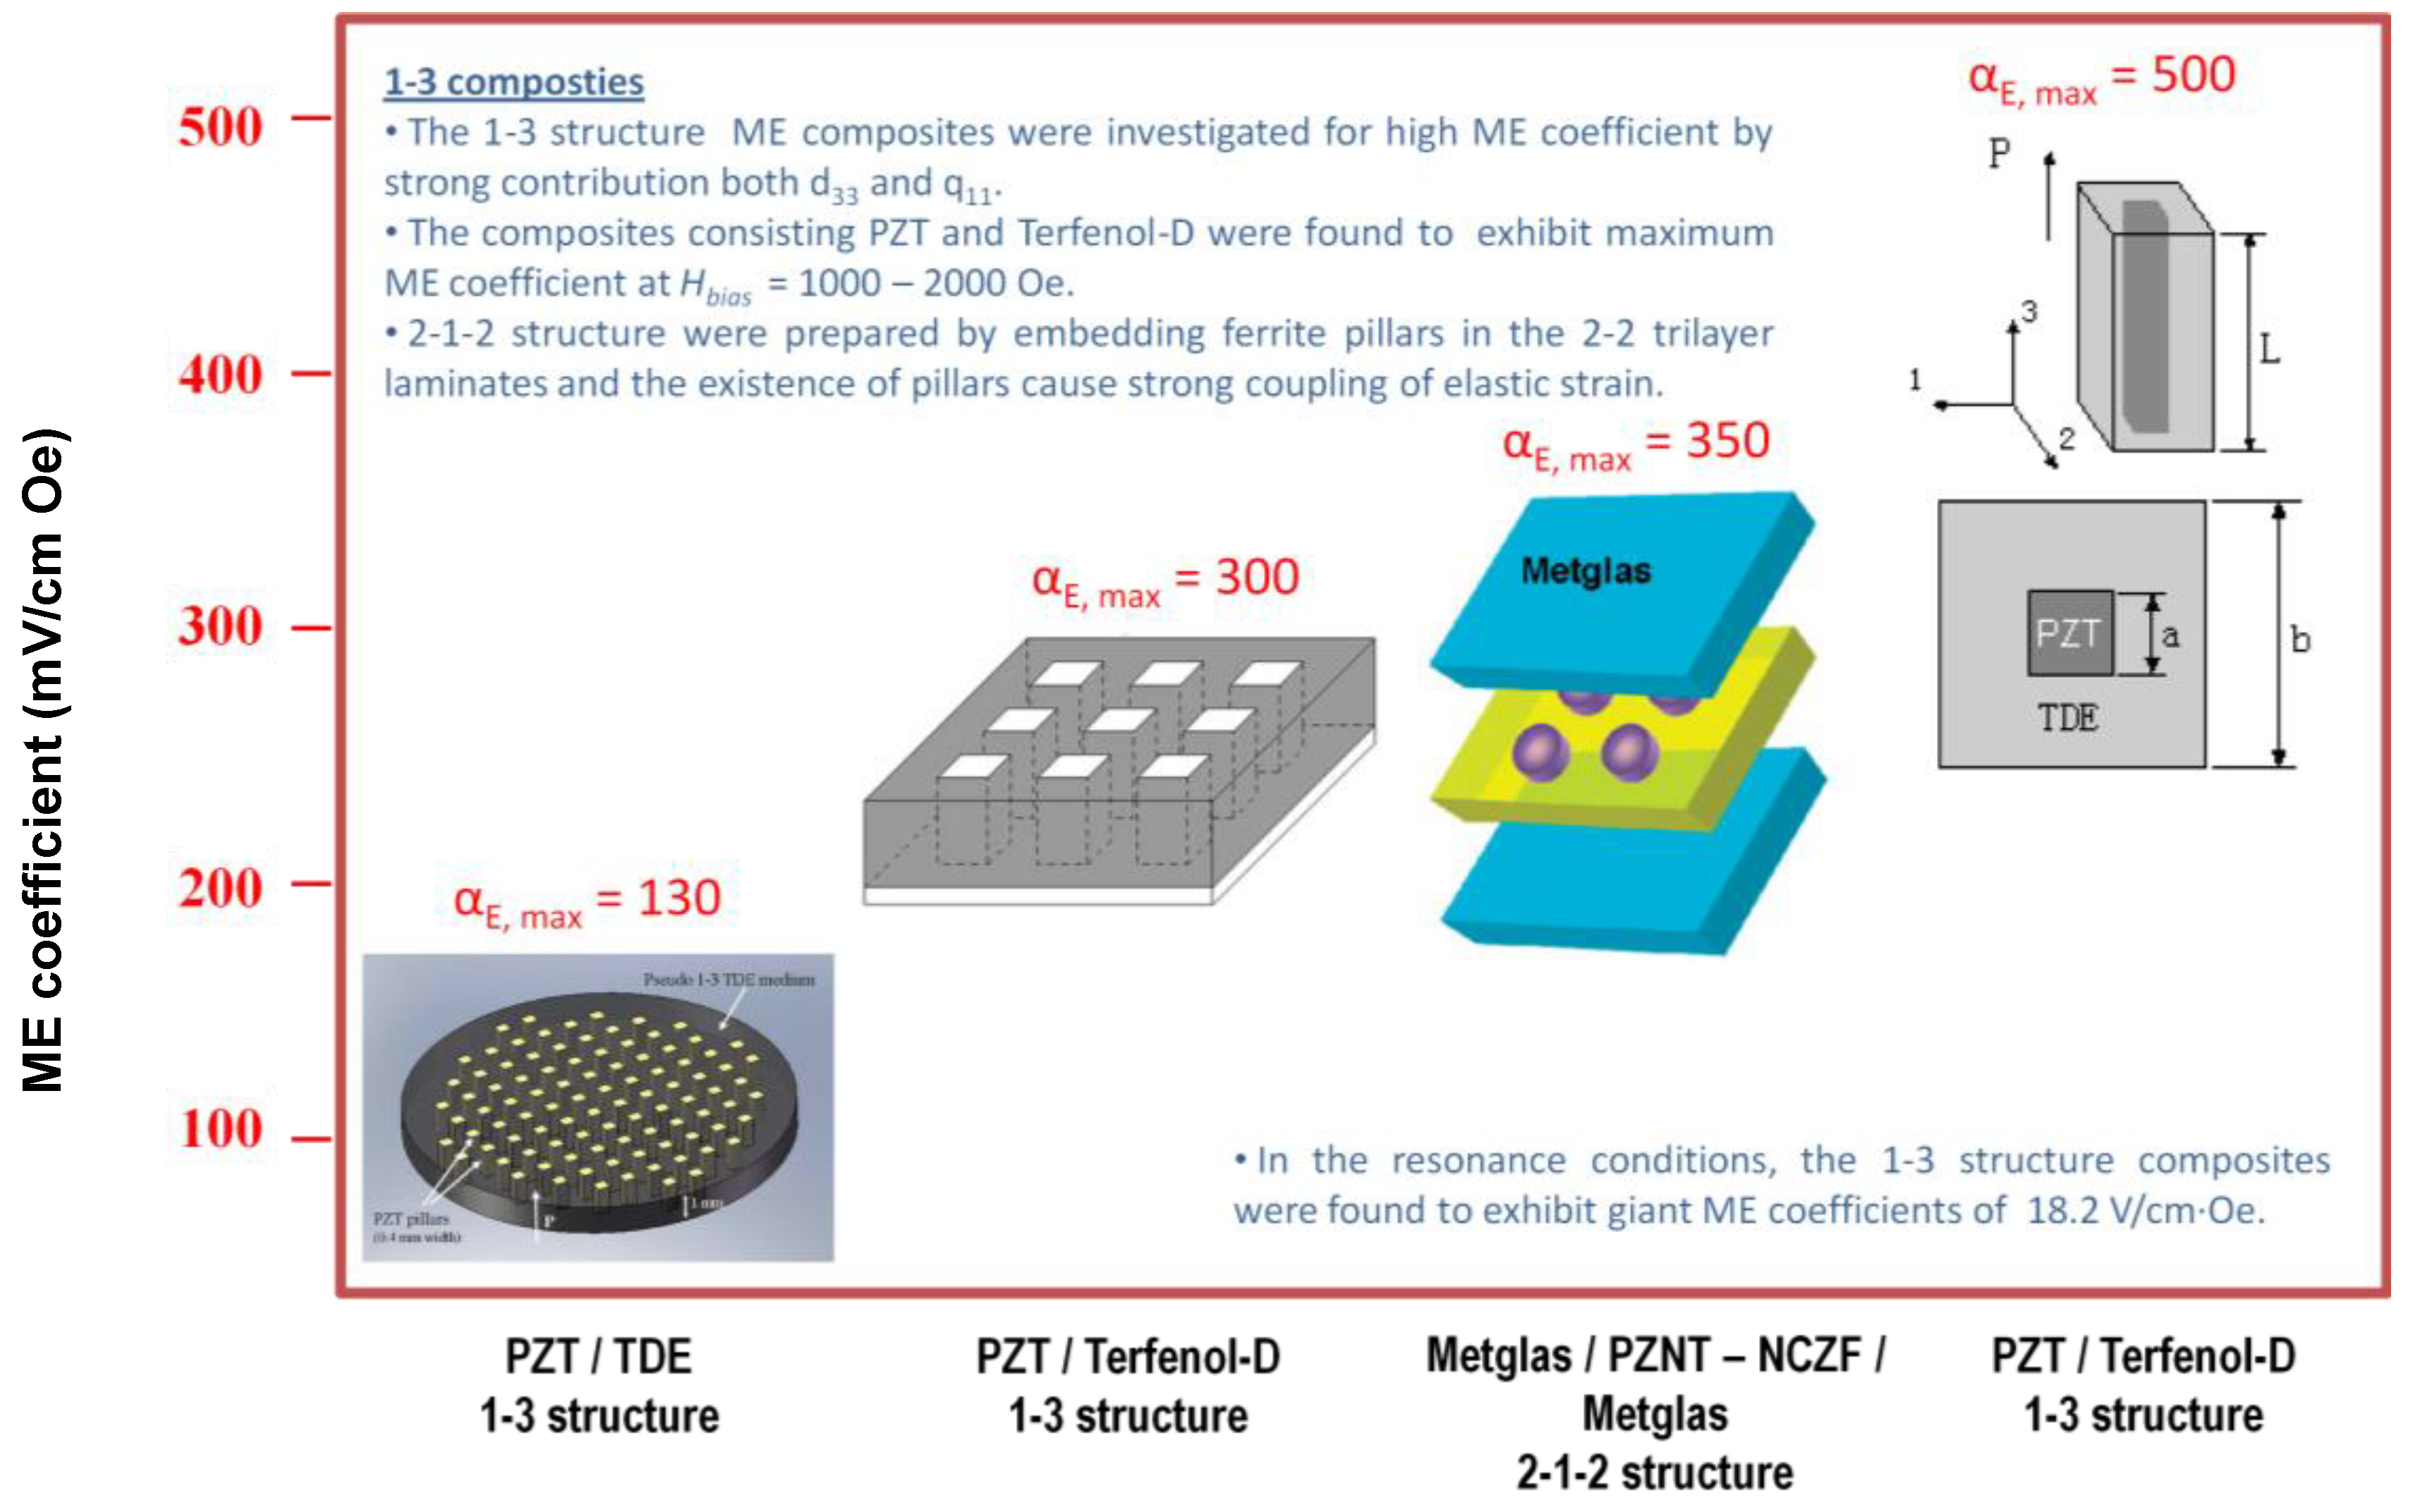
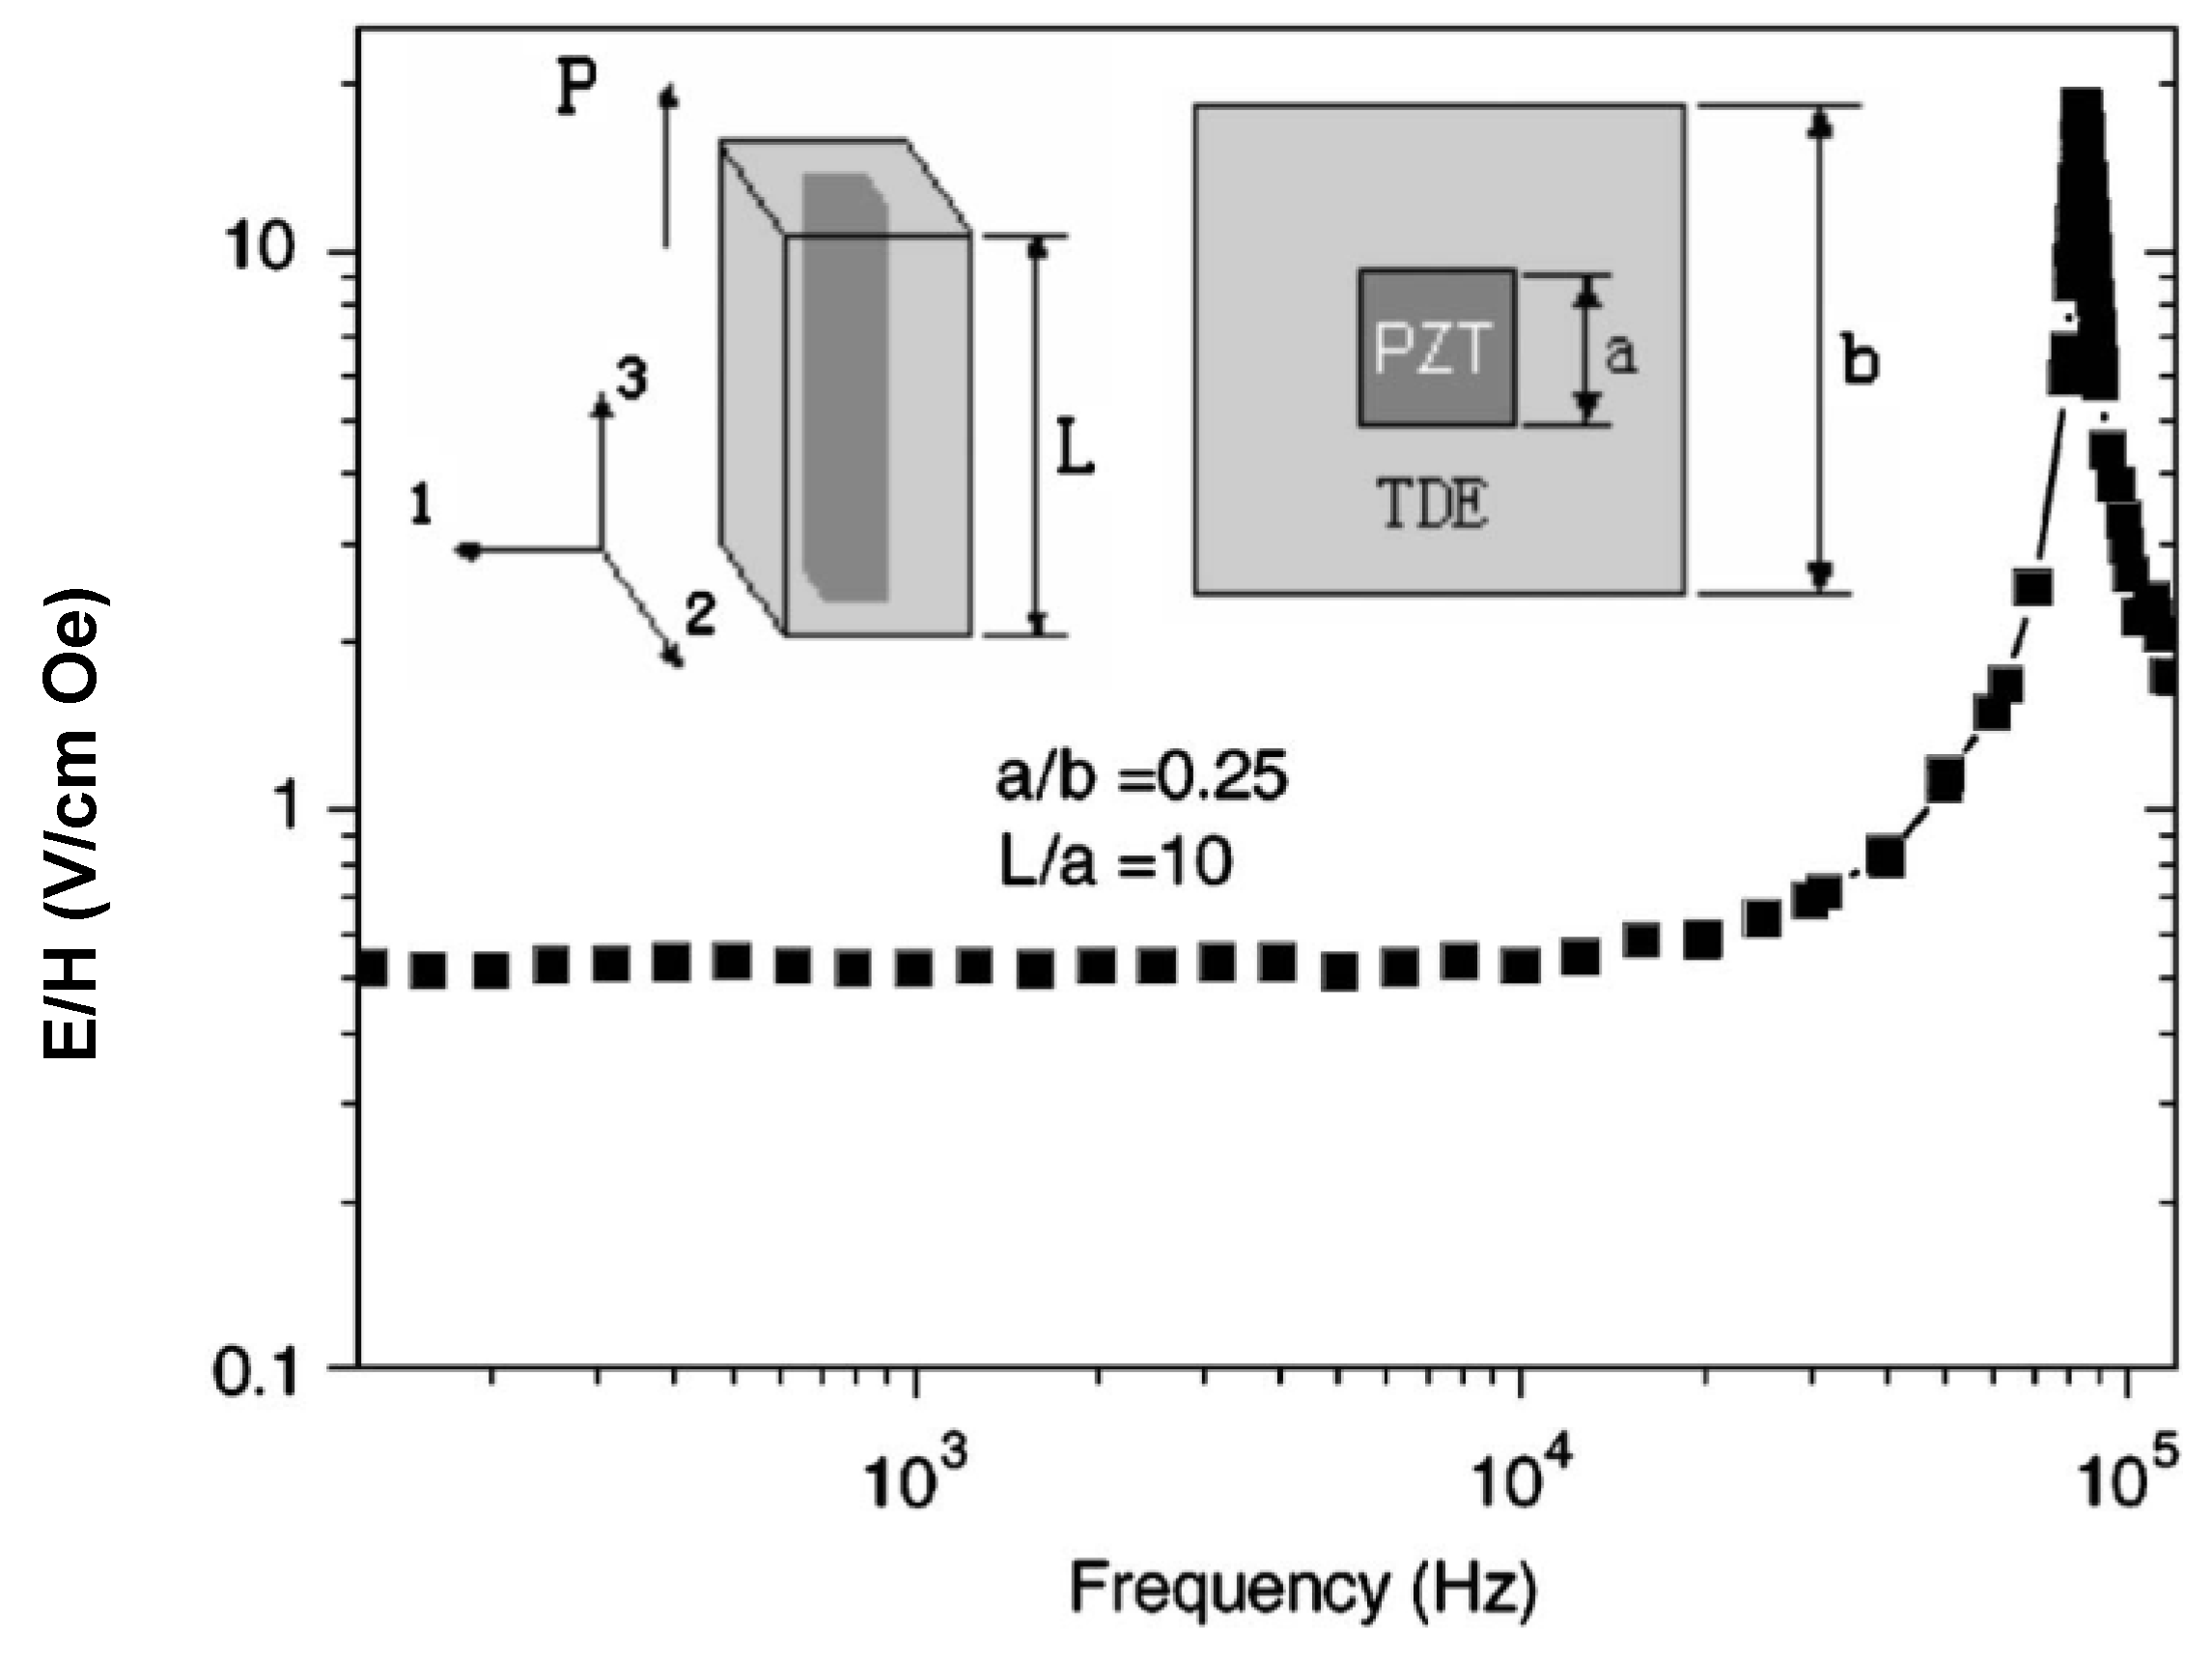
5.3. ME Effect in 1-3 Composites

The ME coupling in 1-3 structure is considerably stronger than in 2-2 structure. In fact, ME effect in a 2-2 composite is determined by piezoelectric coefficient d31 and piezomagnetic coefficient q11 + q12. For a 1-3 structure, the determining contribution arises from d33 and q11 since the stress components along the cylinders axis substantially exceed other components. Piezoelectric and piezomagnetic coefficients d33 and q11 are known to be about two times greater compared than d31 and q11 + q12. In case of 3-0 composite, the observed decrease in ME coupling strength is caused by clamping the internal units of cubic model by neighboring ones. Clamping restricts the strains of composite and reduces the induced voltage across the piezoelectric phase. Figure 24 summarizes the magnitude of ME coefficient reported for 1-3 composites in off-resonance conditions.
Figure 24. Magnetoelectric coefficient for 1-3 composites in off-resonance conditions.
Materials 04 00651 g024
Several reports have been published in literature in order to achieve magnetic and magnetoelectric nanowires/nanocomposites exhibiting 1–3 mode. The development of the soft mold process allows for the preparation of fine scale 1–3 composites with PZT rods of different size, shape and spacing, which can be used as ultrasonic transducers for frequencies 55 MHz [182]. Ma et al. showed a single period of 1-3-type structured ME composite as shown in Figure 25. The experimental results demonstrated that the coupling interaction between the PZT rod and TDE medium can generate much larger ME response. Especially at high frequency where the electromechanical resonance appears, the composite shows a giant ME effect. This single period 1-3-type composite presents a size-dependent ME response, Figure 24 indicates that micro/nano ME pillars with large ME response can be obtained and promises future micro-ME devices. Lam et al. reported frequency response of 1-3 ME composites consisting of Pb(Zr,Ti)O3 (PZT) rods embedded in a matrix of Terfenol-D/epoxy (TDE) [183]. The composites were found to exhibit maximum ME coefficient of 130 mV/cm·Oe at 1 kHz and the resonance shifts to lower frequency with increase in bias field. Also, the pseudo 1-3 ME composite consisting of PZT rod array and Terfenol-D/epoxy matrix were reported by Shi et al. [184] and the magnetoelectric coefficients were found to be 300 mV/cm·Oe at off-resonance frequency and 4500 mV/cm·Oe at resonant frequency.
Figure 25. Frequency dependence of the ME coefficients for the small ME composite rod with a/b = 0.25 and L/a = 1 mm.
Materials 04 00651 g025
We consider a structure consisting of piezoelectric and magnetostrictive coaxial cylinders. Both cylinders are assumed to be ideally bonded together. Such a system is an example of 1-3 composite. For the sake of simplicity, we consider a poled state in both the piezoelectric and magnetostrictive phases with the poling directed along the axis of cylinders (z axis). The applied ac magnetic field is also assumed to be directed along z axis. As a result, the induced electric field also has the same direction. How to solve the problem of ME coupling in a 3-1 or 1-3 magnetostrictive-piezoelectric nanocomposite on a substrate is described in our previous work [185]. To adapt that model to the structure to be considered, we ignore the substrate clamping and lattice mismatch effect. Taking into account the axial symmetry of structure, the elastostatic equation is written in cylindrical coordinates system:
T r r r + 1 r ( T r r T θ θ ) = 0.
Transferring Equations (79) and (80) to cylindrical coordinates and expressing the stress tensor component in terms of strain tensor component, one can substitute the found expressions into Equation (85). As a result, the following equation can be obtained for the radial displacement ur that defines strain components Srr=∂ur/∂r and Sθθ=ur/r for both phases:
2 u r r 2 + 1 r u r r u r r 2 = 0.
The boundary conditions in this case have the form:
pur =0 at r=0,
pur = mur and pTr = mTr at r = pR
mTr = 0 at r = mR
pSzz = mSzz,
0 R p T z z p r d r = R p R m T z z m r d r
where pR and mR are radii of piezoelectric and piezomagnetic phases. Equations (79), (86), (87) and open circuit condition D3 = 0 constitute a closed system and can be numerically solved for ME voltage coefficient αE,33. Estimates are shown in Figure 26 for NZFO-PZT, NZFO-MBT-BT, NZFO-Mn:MBT-BT, and NZFO-NKN-BT structures with sample thickness of 1 mm. It should be noted that the PZT volume fraction dependence of ME voltage coefficient for a 3–1 composite is similar to that of 1-3 composite in Figure 24.
Figure 26. Piezoelectric volume fraction dependence of ME voltage coefficient for 1–3 composites of NZFO-PZT, NZFO-NBTBT, NZFO-Mn:NBTBT, and NZFO-NKNBT.
Materials 04 00651 g026
In our study on 2-1-2 ME laminate composites having configuration of Metglas/0.2Pb(Zn1/3Nb2/3)O3-0.8Pb(Zr0.5Ti0.5)O3(PZNT)/Metglas with ferrite pillars embedded in the PZNT phase [186]. The piezoelectric layer with composition PZNT consisted of co-fired (Ni0.6Cu0.2Zn0.2)Fe2O3 (NCZF) pillars as shown in Figure 27 (a). The 2-1-2 composite was found to exhibit the ME coefficient of 352 mV/cm·Oe which is 15% higher magnitude than that for 2-2 laminate composites by effective coupling in the 2-1-2 structure as shown in Figure 27 (b) and (c). The result shows the existence of NCNF pillars in 2-1-2 laminates causes strong coupling of elastic strain.
Figure 27. (a) Schematic diagrams of unimorph and bimorph configurations; (b) ME coefficient of 3-1 composite depending on the laminations: 3-1/Metglas and Metglas/3-1/Metglas; (c) ME coefficient of typical 2-2 composites based on PZNT and Metglas: unimorph and bimorph configurations.
Materials 04 00651 g027

6. Conclusions

In this manuscript, we report the ME characterization of composites based on magnetostrictive NZFO or Ni and piezoelectric PZT and lead-free ferroelectrics. The piezoelectric volume fraction dependence of ME coefficients is calculated using the physical parameters of composite components. In order to overcome the problem of toxicity of Pb, we conducted experiments with Pb-free piezoelectric compositions illustrating their importance as an environment friendly alternative. To estimate the piezoelectric parameters of lead-free materials, we used the thermodynamic LGD approach and generalized lattice model of ferroelectric solid solutions. It has been shown that composites based on lead-free ferroelectrics can exhibit the ME couling that is at least not weaker compared to leaded materials.

Acknowledgments

The authors gratefully acknowledge the financial support from National Science Foundation and Office of Basic Energy Science, Department of Energy, Russian Foundation for Basic Research (project No. 08-02-91359-SNF_a), Program of Russian Ministry of Education and Science “Scientific and pedagogical personnel of innovative Russia” on 2009–2013, Project of Russian Ministry of Education and Science-Section 2.1.2-Fundamental researches in technical sciences (Project No.11324), and Department of Chemistry and Material Science of Russian Academy of Sciences.

References

  1. Van Suchetelen, J. Product Properties: A new application of composite materials. Philips Res. Rep. 1972, 27, 28–37. [Google Scholar]
  2. Smolenskii, G.; Ioffe, V.A. Communication No. 71. Colloque Int. du Magnetisme Grenoble 1958, 71–75.
  3. Astrov, D.N.; Aleshin, B.I.; Zorin, R.V.; Drobyshev, L.A. On spontaneous magnetoelectric effect. Sov. Phys. JETP 1968, 28, 1123–1127. [Google Scholar]
  4. Fiebig, M. Revival of the magnetoelectric effect. J. Phys.-D-Appl. Phys. 2005, 38, R123–R152. [Google Scholar] [CrossRef]
  5. Bichurin, M.I.; Petrov, V.M.; Petrov, R.V.; Kapralov, G.N.; Kiliba, Y.V.; Bukashev, F.I.; Smirnov, A.Y.; Tatarenko, A.S. Magnetoelectric microwave devices. Ferroelectrics 2002, 280, 377–384. [Google Scholar]
  6. Nan, C.W.; Bichurin, M.I.; Dong, S.X.; Viehland, D.; Srinivasan, G. Multiferroic magnetoelectic composites: Historical perspective, status, and future directions. J. Appl. Phys. 2008, 103, 031101:1–031101:35. [Google Scholar]
  7. Hornreich, R.M. The magnetoelectric effect: Some likely candidates. Solid State Commun. 1969, 7, 1081–1085. [Google Scholar] [CrossRef]
  8. Bichurin, M.I.; Petrov, V.M.; Srinivasan, G. Theory of low-frequency magnetoelectric coupling in magnetostrictive-piezoelectric bilayers. Phys. Rev. B 2003, 68, 054402:1–054402:13. [Google Scholar]
  9. Fischer, E.; Gorodetsky, G.; Hornreich, R.M. A new family of magnetoelectric materials: A2M4O9 (A = Ta, Nb; M = Mn, Co). Solid State Commun. 1972, 10, 1127–1132. [Google Scholar] [CrossRef]
  10. Suryanarayana, S.V. Magnetoelectric interaction phenomena in materials. Bull. Mater. Sci. 1994, 17, 1259–1270. [Google Scholar] [CrossRef]
  11. Srinivas, A.; Kim, D.W.; Hong, K.S.; Suryanarayana, S.V. Study of magnetic and magnetoelectric measurements in bismuth iron titanate ceramic-Bi8Fe4Ti3O24. Mater. Res. Bull. 2004, 39, 55–61. [Google Scholar] [CrossRef]
  12. Van den Boomgaard, J.; Terrell, D.R.; Born, R.A.; Giller, H.F. An in situ grown eutectic magnetoelectric composite material. Mater. Sci. 1974, 9, 1705–1709. [Google Scholar] [CrossRef]
  13. Van den Boomgaard, J.; Born, R.A. Sintered magnetoelectric composite-material BaTiO3-Ni(Co,Mn)Fe2O4. J. Mater. Sci. 1978, 13, 1538–1548. [Google Scholar] [CrossRef]
  14. Dai, Y.R.; Bao, P.; Zhu, J.S.; Wan, J.G.; Shen, H.M.; Liu, J.M. Internal friction study on CuFe2O4/PbZr0.53Ti0.47O3 composites. J. Appl. Phys. 2004, 96, 5687–5690. [Google Scholar] [CrossRef]
  15. Ruette, B.; Zvyagin, S.; Pyatakov, A.P.; Bush, A.; Li, J.F.; Belotelov, V.I.; Zvezdin, A.K.; Viehland, D. Magnetic-field-induced phase transition in BiFeO3 observed by high-field electron spin resonance: Cycloidal to homogeneous spin order. Phys. Rev. B 2004, 69, 064114:1–064114:7. [Google Scholar]
  16. Kadomtseva, A.M.; Zvezdin, A.K.; Popov, Y.F.; Pyatakov, A.P.; Vorobev, G.P. Space-time parity violation and magnetoelectric interactions in antiferromagnets. JETP Lett-Engl. Tr. 2004, 79, 571–581. [Google Scholar] [CrossRef]
  17. Wang, J.; Neaton, J.B.; Zheng, H.; Nagarajan, V.; Ogale, S.B.; Liu, B.; Viehland, D.; Vaithyanathan, V.; Schlom, D.G.; Waghmare, U.V.; Spaldin, N.A.; Rabe, K.M.; Wuttig, M.; Ramesh, R. Epitaxial BiFeO3 multiferroic thin film heterostructures. Science 2003, 299, 1719–1722. [Google Scholar] [CrossRef]
  18. Kimura, T.; Goto, T.; Shintani, H.; Ishizaka, K.; Arima, T.; Tokura, Y. Magnetic control of ferroelectric polarization. Nature 2003, 426, 55–58. [Google Scholar] [CrossRef]
  19. Fiebig, M.; Lottermoser, T.; Frohlich, D.; Goltsev, A.V.; Pisarev, R.V. Observation of coupled magnetic and electric domains. Nature 2002, 419, 818–820. [Google Scholar] [CrossRef]
  20. Ederer, C.; Spaldin, N.A. Magnetoelectrics-A new route to magnetic ferroelectrics. Nat. Mater. 2004, 3, 849–851. [Google Scholar] [CrossRef]
  21. Hur, N.; Park, S.; Sharma, P.A.; Ahn, J.S.; Guha, S.; Cheong, S.W. Electric polarization reversal and memory in a multiferroic material induced by magnetic fields. Nature 2004, 429, 392–395. [Google Scholar] [CrossRef]
  22. Lottermoser, T.; Lonkai, T.; Amann, U.; Hohlwein, D.; Ihringer, J.; Fiebig, M. Magnetic phase control by an electric field. Nature 2004, 430, 541–544. [Google Scholar] [CrossRef]
  23. Van Aken, B.B.; Palstra, T.T.; Filippetti, A.; Spaldin, N.A. The origin of ferroelectricity in magnetoelectric YMnO3. Nat. Mate. 2004, 3, 164–170. [Google Scholar] [CrossRef]
  24. Srinivasan, G.; DeVreugd, C.P.; Flattery, C.S.; Laletsin, V.M.; Paddubnaya, N. Magnetoelectric interactions in hot-pressed nickel zinc ferrite and lead zirconante titanate composites. Appl. Phys. Lett. 2004, 85, 2550–2552. [Google Scholar] [CrossRef]
  25. Ryu, J.; Priya, S.; Uchino, K.; Kim, H.E. Magnetoelectric effect in composites of magnetostrictive and piezoelectric materials. J. Electroceram. 2002, 8, 107–119. [Google Scholar] [CrossRef]
  26. Srinivasan, G.; Rasmussen, E.T.; Hayes, R. Magnetoelectric effects in ferrite-lead zirconate titanate layered composites: The influence of zinc substitution in ferrites. Phys. Rev. B 2003, 67, 014418:1–014418:10. [Google Scholar]
  27. Srinivasan, G.; Rasmussen, E.T.; Levin, B.J.; Hayes, R. Magnetoelectric effects in bilayers and multilayers of magnetostrictive and piezoelectric perovskite oxides. Phys. Rev. B 2002, 65, 134402:1–134402:7. [Google Scholar]
  28. Ryu, J.; Carazo, A.V.; Uchino, K.; Kim, H.E. Magnetoelectric properties in piezoelectric and magnetostrictive laminate composites. Jpn. J. Appl. Phys. 2001, 40, 4948–4951. [Google Scholar] [CrossRef]
  29. Laletin, V.M.; Padubnaya, N.; Srinivasan, G.; Devreugd, C.P. Frequency dependence of magnetoelectric interactions in layered structures of ferromagnetic alloys and piezoelectric oxides. Appl. Phys. A-Mat. Sci. Process. 2004, 78, 33–36. [Google Scholar] [CrossRef]
  30. Dong, S.X.; Zhai, J.Y.; Li, J.F.; Viehland, D. Small DC magnetic field response of magnetoelectric laminate composites. Appl. Phys. Lett. 2006, 88, 082907:1–082907:2. [Google Scholar]
  31. Dong, S.X.; Li, J.F.; Viehland, D. Longitudinal and transverse magnetoelectric voltage coefficients of magnetostrictive/piezoelectric laminate composite: Theory. IEEE T. Ultrason. Ferroelectr. 2003, 50, 1253–1261. [Google Scholar] [CrossRef]
  32. Dong, S.X.; Li, J.F.; Viehland, D. Circumferentially magnetized and circumferentially polarized magnetostrictive/piezoelectric laminated rings. J. Appl. Phys. 2004, 96, 3382–3387. [Google Scholar] [CrossRef]
  33. Dong, S.X.; Cheng, J.R.; Li, J.F.; Viehland, D. Enhanced magnetoelectric effects in laminate composites of Terfenol-D/Pb(Zr,Ti)O-3 under resonant drive. Appl. Phys. Lett. 2003, 83, 4812–4814. [Google Scholar] [CrossRef]
  34. Dong, S.X.; Li, J.F.; Viehland, D. A longitudinal-longitudinal mode TERFENOL-D/Pb(Mg1/3Nb2/3)O33-PbTiO3 laminate composite. Appl. Phys. Lett. 2004, 85, 5305–5306. [Google Scholar] [CrossRef]
  35. Dong, S.X.; Zhai, J.Y.; Xing, Z.P.; Li, J.F.; Viehland, D. Extremely low frequency response of magnetoelectric multilayer composites. Appl. Phys. Lett. 2005, 86, 102901:1–102901:3. [Google Scholar]
  36. Zhai, J.Y.; Xing, Z.P.; Dong, S.X.; Li, J.F.; Viehland, D. Detection of pico-Tesla magnetic fields using magneto-electric sensors at room temperature. Appl. Phys. Lett. 2006, 88, 062510:1–062510:3. [Google Scholar]
  37. Dong, S.X.; Li, J.F.; Viehland, D. Vortex magnetic field sensor based on ring-type magnetoelectric laminate. Appl. Phys. Lett. 2004, 85, 2307–2309. [Google Scholar] [CrossRef]
  38. Dong, S.X.; Li, J.F.; Viehland, D.; Cheng, J.; Cross, L.E. A strong magnetoelectric voltage gain effect in magnetostrictive-piezoelectric composite. Appl. Phys. Lett. 2004, 85, 3534–3536. [Google Scholar] [CrossRef]
  39. Dong, S.X.; Li, J.F.; Viehland, D. Longitudinal and transverse magnetoelectric voltage coefficients of magnetostrictive/piezoelectric laminate composite: Experiments. IEEE T. Ultrason. Ferroelectr. 2004, 51, 794–799. [Google Scholar] [CrossRef]
  40. Dong, S.X.; Zhai, J.Y.; Bai, F.M.; Li, J.F.; Viehland, D.; Lograsso, T.A. Magnetostrictive and magnetoelectric behavior of Fe-20 at. % Ga/Pb(Zr,Ti)O-3 laminates. J. Appl. Phys. 2005, 97, 103902:1–103902:6. [Google Scholar]
  41. Dong, S.X.; Zhai, J.Y.; Wang, N.G.; Bai, F.M.; Li, J.F.; Viehland, D.; Lograsso, T.A. Fe-Ga/Pb(Mg1/3Nb2/3)O3-PbTiO3 magnetoelectric laminate composites. Appl. Phys. Lett. 2005, 87, 222504:1–222504:3. [Google Scholar]
  42. Jia, Y.M.; Or, S.W.; Chan, H.L.; Zhao, X.Y.; Luo, H.S. Converse magnetoelectric effect in laminated composites of PMN-PT single crystal and Terfenol-D alloy. Appl. Phys. Lett. 2006, 88, 242902:1–242902:3. [Google Scholar]
  43. Wan, J.G.; Liu, J.M.; Wang, G.H.; Nan, C.W. Electric-field-induced magnetization in Pb(Zr,Ti)O3/Terfenol-D composite structures. Appl. Phys. Lett. 2006, 88, 182502:1–182502:3. [Google Scholar]
  44. Ryu, J.; Priya, S.; Uchino, K.; Viehland, D.; Kim, H. High magnetoelectric properties in 0.68Pb(Mg1/3Nb2/3)O3-0.32PbTiO3 single crystal and Terfenol-D laminate composite. J. Korean Ceram. Soc. 2002, 39, 813–817. [Google Scholar] [CrossRef]
  45. Babu, S.N.; Bhimasankaram, T.; Suryanarayana, S.V. Magnetoelectric effect in metal-PZT laminates. Bull. Mater. Sci. 2005, 28, 419–422. [Google Scholar] [CrossRef]
  46. Laletin, V.M.; Paddubnaya, N.; Srinivasan, G.; De Vreugd, C.P.; Bichurin, M.I.; Petrov, V.M.; Filippov, D.A. Frequency and field dependence of magnetoelectric interactions in layered ferromagnetic transition metal-piezoelectric lead zirconate titanate. Appl. Phys. Lett. 2005, 87, 222507:1–222507:3. [Google Scholar]
  47. Nan, C.W.; Liu, L.; Cai, N.; Zhai, J.Y.; Ye, Y.; Lin, Y.H.; Dong, L.J.; Xiong, C.X. A three-phase magnetoelectric composite of piezoelectric ceramics, rare-earth iron alloys, and polymer. Appl. Phys. Lett. 2002, 81, 3831–3833. [Google Scholar] [CrossRef]
  48. Shi, Z.; Nan, C.W.; Liu, J.M.; Filippov, D.A.; Bichurin, M.I. Influence of mechanical boundary conditions and microstructural features on magnetoelectric behavior in a three-phase multiferroic particulate composite. Phys. Rev. B 2004, 70, 134417:1–134417:6. [Google Scholar]
  49. Dong, S.X.; Zhai, J.Y.; Bai, F.M.; Li, J.F.; Viehland, D. Push-pull mode magnetostrictive/piezoelectric laminate composite with an enhanced magnetoelectric voltage coefficient. Appl. Phys. Lett. 2005, 87, 062502:1–062502:3. [Google Scholar]
  50. Dong, S.X.; Li, J.F.; Viehland, D. Giant magneto-electric effect in laminate composites. IEEE T. Ultrason. Ferroelectr. 2003, 50, 1236–1239. [Google Scholar] [CrossRef]
  51. Dong, S.X.; Li, J.F.; Viehland, D. Magnetoelectric coupling, efficiency, and voltage gain effect in piezoelectric-piezomagnetic laminate composites. J. Mater. Sci. 2006, 41, 97–106. [Google Scholar] [CrossRef]
  52. Cai, N.; Zhai, J.Y.; Nan, C.W.; Lin, Y.; Shi, Z. Dielectric, ferroelectric, magnetic, and magnetoelectric properties of multiferroic laminated composites. Phys. Rev. B 2003, 68, 224103:1–224103:7. [Google Scholar]
  53. Corral-Flores, V.; Bueno-Baques, D.; Carrillo-Flores, D.; Matutes-Aquino, J.A. Enhanced magnetoelectric effect in core-shell particulate composites. J. Appl. Phys. 2006, 99, 08J503:1–08J503:3. [Google Scholar]
  54. Mazumder, S.; Bhattacharyya, G.S. Synthesis and characterization of in situ grown magnetoelectric composites in the BaO-TiO-FeO-CoO system. Ceram. Int. 2004, 30, 389–392. [Google Scholar] [CrossRef]
  55. Lupeiko, T.G.; Lopatin, S.S.; Lisnevskaya, I.V.; Zvyagintsev, B.I. Magnetoelectric composite-materials based on lead-zirconate-titanate and nickel ferrite. Inorg. Mater-Engl. Tr. 1994, 30, 1353–1356. [Google Scholar]
  56. Patankar, K.K.; Patil, S.A.; Sivakumar, K.V.; Mahajan, R.P.; Kolekar, Y.D.; Kothale, M.B. AC conductivity and magnetoelectric effect in CuFe1.6Cr0.4O4-BaTiO3 composite ceramics. Mater. Chem. Phys. 2000, 65, 97–102. [Google Scholar] [CrossRef]
  57. Yang, P.; Zhao, K.; Yin, Y.; Wan, J.G.; Zhu, J.S. Magnetoelectric effect in magnetostrictive/piezoelectric laminate composite Terfenol-D/LiNbO3 [(zxtw)-129°/30°]. Appl. Phys. Lett. 2006, 88, 172903:1–172903:3. [Google Scholar]
  58. Jia, Y.M.; Zhao, X.Y.; Luo, H.S.; Or, S.W.; Chan, H.L. Magnetoelectric effect in laminate composite of magnets/0.7Pb(Mg1/3Nb2/3)O3-0.3PbTiO3 single crystal. Appl. Phys. Lett. 2006, 88, 142504:1–142504:3. [Google Scholar]
  59. Zhao, K.; Chen, K.; Dai, Y.R.; Wan, J.G.; Zhu, J.S. Effect of martensitic transformation on magnetoelectric properties of Ni2MnGa/PbZr0.52Ti0.48O3 composite. Appl. Phys. Lett. 2005, 87, 162901:1–162901:3. [Google Scholar]
  60. Shi, Z.; Nan, C.W.; Zhang, J.; Cai, N.; Li, J.F. Magnetoelectric effect of Pb(Zr,Ti)O3 rod arrays in a (Tb,Dy)Fe2 /epoxy medium. Appl. Phys. Lett. 2005, 87, 012503:1–012503:3. [Google Scholar]
  61. Bichurin, M.I.; Filippov, D.A.; Petrov, V.M.; Laletin, V.M.; Paddubnaya, N.; Srinivasan, G. Resonance magnetoelectric effects in layered magnetostrictive-piezoelectric composites. Phys. Rev. B 2003, 68, 132408:1–132408:4. [Google Scholar]
  62. Guo, Y.P.; Kakimoto, K.; Ohsato, H. Phase transitional behavior and piezoelectric properties of (Na0.5K0.5)NbO3-LiNbO3 ceramics. Appl. Phys. Lett. 2004, 85, 4121–4123. [Google Scholar] [CrossRef]
  63. Guo, Y.P.; Kakimoto, K.; Ohsato, H. (Na0.5K0.5)NbO3-LiTaO3 lead-free piezoelectric ceramics. Mater. Lett. 2005, 59, 241–244. [Google Scholar] [CrossRef]
  64. Zang, G.Z.; Wang, J.F.; Chen, H.C.; Su, W.B.; Wang, C.M.; Qi, P.; Ming, B.Q.; Du, J.; Zheng, L.M. Perovskite (Na0.5K0.5)1−x(LiSb)xNb1−x O3 lead-free piezoceramics. Appl. Phys. Lett. 2006, 88, 212908:1–212908:3. [Google Scholar]
  65. Ming, B.Q.; Wang, J.F.; Qi, P.; Zang, G.Z. Piezoelectric properties of (Li, Sb, Ta) modified (Na,K)NbO3 lead-free ceramics. J. Appl. Phys. 2007, 101, 054103:1–054103:4. [Google Scholar]
  66. Ahn, C.W.; Park, H.Y.; Nahm, S.; Uchino, K.; Lee, H.G.; Lee, H.J. Structural variation and piezoelectric properties of 0.95(Na0.5K0.5)NbO3-0.05BaTiO3 ceramics. Sensor. Actuator. A Phys. 2007, 136, 255–260. [Google Scholar] [CrossRef]
  67. Wang, R.P.; Xie, R.J.; Hanada, K.; Matsusaki, K.; Bando, H.; Itoh, M. Phase diagram and enhanced piezoelectricity in the strontium titanate doped potassium-sodium niobate solid solution. Phys. Status. Solidi. A Appl. Mat. 2005, 202, R57–R59. [Google Scholar] [CrossRef]
  68. Wang, R.P.; Xie, R.J.; Hanada, K.; Matsusaki, K.; Bando, H.; Sekiya, T.; Itoh, M. Phase diagram of the (Na0.5K0.5)NbO3-ATiO3 solid solution. Ferroelectrics 2006, 336, 39–46. [Google Scholar] [CrossRef]
  69. Park, H.Y.; Cho, K.H.; Paik, D.S.; Nahm, S.; Lee, H.G.; Kim, D.H. Microstructure and piezoelectric properties of lead-free (1-x)(Na0.5K0.5)NbO3-xCaTiO3 ceramics. J. Appl. Phys. 2007, 102, 124101:1–124101:5. [Google Scholar]
  70. Smolenskii, G.A.; Isupov, V.A.; Agranovskaya, A.I.; Krainik, N.N. New ferroelectrics complex composition—IV. Sov. Phys. Solid State 1961, 2, 2651–2654. [Google Scholar]
  71. Jones, G.O.; Thomas, P.A. Investigation of the structure and phase transitions in the novel A-site substituted distorted perovskite compound Na0.5Bi0.5TiO3. Acta. Crystallogr. B Struct. Sci. 2002, 58, 168–178. [Google Scholar] [CrossRef]
  72. Suchainicz, J.; Roleder, K.; Kania, A.; Handerek, J. Electrostrictive Strain and Pyroeffect in the Region of Phase Coexistence in Na0.5Bi0.5TiO3. Ferroelectrics 1998, 77, 107–110. [Google Scholar]
  73. Roleder, K.; Suchainicz, J.; Kania, A. Time-dependence of electric permittivity in Na0.5Bi0.5TiO3 single-crystals. Ferroelectrics 1989, 89, 1–5. [Google Scholar] [CrossRef]
  74. Suchainicz, J. Investigations of the Phase Transitions in Na0.5Bi0.5TiO3. Ferroelectrics 1995, 172, 455–458. [Google Scholar] [CrossRef]
  75. Tu, C.S.; Huang, S.H.; Ku, C.S.; Lee, H.Y.; Chien, R.R.; Schmidt, V.H.; Luo, H. Phase coexistence and Mn-doping effect in lead-free ferroelectric (Na1/2Bi1/2 )TiO3 crystals. Appl. Phys. Lett. 2010, 96, 062903:1–062903:3. [Google Scholar]
  76. Takenaka, T.; Maruyama, K.; Sakata, K. (Bi1/2Na1/2)TiO3-BaTiO3 system for lead-free piezoelectric ceramics. Jpn. J. Appl. Phys. 1991, 30, 2236–2239. [Google Scholar] [CrossRef]
  77. Kuharuangrong, S.; Schulze, W. Compositional modifications of 10-percent-Pb-doped Bi0.5Na0.5TiO3 for high-temperature dielectrics. J. Amer. Ceram. Soc. 1995, 78, 2274–2278. [Google Scholar] [CrossRef]
  78. Elkechai, O.; Manier, M.; Mercurio, J.P. Na0.5Bi0.5TiO3-K0.5Bi0.5TiO3 (NBT-KBT) system: A structural and electrical study. Phys. Status. Solidi. A-Appl. Res. 1996, 157, 499–506. [Google Scholar] [CrossRef]
  79. Takenaka, T.; Sakata, K.; Toda, K. Piezoelectric properties of (Bi1/2Na1/2)TiO3-based ceramics. Ferroelectrics 1990, 106, 375–380. [Google Scholar] [CrossRef]
  80. Marchet, P.; Boucher, E.; Dorcet, V.; Mercurio, J.P. Dielectric properties of some low-lead or lead-free perovskite-derived materials: Na0.5Bi0.5TiO3-PbZrO3, Na0.5Bi0.5TiO3-BiScO3 and Na0.5Bi0.5TiO3-BiFeO3 ceramics. J. Eur. Ceram. Soc. 2006, 26, 3037–3041. [Google Scholar] [CrossRef]
  81. Nagata, H.; Takenaka, T. Lead-free piezoelectric ceramics of (Bi1/2Na1/2)TiO3-1/2(Bi2O3 center dot Sc2O3) system. Jpn. J. Appl. Phys. Pt. 1 1997, 36, 6055–6057. [Google Scholar] [CrossRef]
  82. Nagata, H.; Koizumi, N.; Kuroda, N.; Igarashi, I.; Takenaka, T. Lead-free piezoelectric ceramics of (Bi1/2Na1/2)TiO3-BaTiO3-BiFeO3 system. Ferroelectrics 1999, 229, 273–278. [Google Scholar] [CrossRef]
  83. Li, Y.M.; Chen, W.; Zhou, J.; Xu, Q.; Sun, H.; Xu, R.X. Dielectric and piezoelecrtic properties of lead-free (Na0.5Bi0.5)TiO3-NaNbO3 ceramics. Mater. Sci. Eng. B-Solid State M. 2004, 112, 5–9. [Google Scholar] [CrossRef]
  84. Sung, Y.S.; Kim, J.M.; Cho, J.H.; Song, T.K.; Kim, M.H.; Chong, H.H.; Park, T.G.; Do, D.; Kim, S.S. Effects of Na nonstoichiometry in (Bi0.5Na0.5+x)TiO3 ceramics. Appl. Phys. Lett. 2010, 96, 022901:1–022901:3. [Google Scholar]
  85. Xu, Q.; Huang, D.P.; Chen, M.; Chen, W.; Liu, H.X.; Kim, B.H. Effect of bismuth excess on ferroelectric and piezoelectric properties of a (Na0.5Bi0.5)TiO3-BaTiO3 composition near the morphotropic phase boundary. J. Alloys Compounds 2009, 471, 310–316. [Google Scholar] [CrossRef]
  86. Wang, X.X.; Tang, X.G.; Chan, H.L. Electromechanical and ferroelectric properties of (Bi1/2Na1/2)TiO3-(Bi1/2K1/2)TiO3-BaTiO3 lead-free piezoelectric ceramics. Appl. Phys. Lett. 2004, 85, 91–93. [Google Scholar] [CrossRef]
  87. Chu, B.J.; Chen, D.R.; Li, G.R.; Yin, Q.R. Electrical properties of Na1/2Bi1/2TiO3-BaTiO3 ceramics. J. Eur. Ceram. Soc. 2002, 22, 2115–2121. [Google Scholar] [CrossRef]
  88. Xu, Q.; Chen, M.; Chen, W.; Liu, H.X.; Kim, B.H.; Ahn, B.K. Effect of CoO additive on structure and electrical properties of (Na0.5Bi0.5)(0.93)Ba0.07TiO3 ceramics prepared by the citrate method. Acta Mater. 2008, 56, 642–650. [Google Scholar] [CrossRef]
  89. Takenaka, T.; Nagata, H.; Hiruma, Y. Phase transition temperatures and piezoelectric properties of (Bi1/2Na1/2)TiO3- and (Bi1/2K1/2)TiO3-based bismuth perovskite lead-free ferroelectric ceramics. IEEE T. Ultrason. Ferroelectr. 2009, 56, 1595–1612. [Google Scholar]
  90. Messing, G.L.; Trolier-McKinstry, S.; Sabolsky, E.M.; Duran, C.; Kwon, S.; Brahmaroutu, B.; Park, P.; Yilmaz, H.; Rehrig, P.W.; Eitel, K.B.; Suvaci, E.; Seabaugh, M.; Oh, K.S. Templated grain growth of textured piezoelectric ceramics. Crit. Rev. Solid State Mat. Sci. 2004, 29, 45–96. [Google Scholar] [CrossRef]
  91. Saito, Y.; Takao, H.; Tani, T.; Nonoyama, T.; Takatori, K.; Homma, T.; Nagaya, T.; Nakamura, M. Lead-free piezoceramics. Nature 2004, 432, 84–87. [Google Scholar] [CrossRef]
  92. Yilmaz, H.; Messing, G.L.; Trolier-McKinstry, S. (Reactive) templated grain growth of textured sodium bismuth titanate (Na1/2Bi1/2TiO3-BaTiO3) ceramics-I processing. J. Electroceram. 2003, 11, 207–215. [Google Scholar] [CrossRef]
  93. Yan, Y.K.; Zhou, H.P.; Zhao, W.; Liu, D. Fabrication and electrical properties of textured Na1/2Bi1/2TiO3-BaTiO3 ceramics by reactive-templated grain growth. J. Electroceram. 2008, 21, 246–250. [Google Scholar] [CrossRef]
  94. Motohashi, T.; Kimura, T. Development of texture in Bi0.5Na0.5TiO3 prepared by reactive-templated grain growth process. J. Eur. Ceram. Soc. 2007, 27, 3633–3636. [Google Scholar] [CrossRef]
  95. Tani, T.; Kimura, T. Reactive-templated grain growth processing for lead free piezoelectric ceramics. Adv. Appl. Ceram. 2006, 105, 55–63. [Google Scholar] [CrossRef]
  96. Babu, J.B.; Madeswaran, G.; He, M.; Zhang, D.F.; Chen, X.L.; Dhanasekaran, R. Inhomogeneity issues in the growth of Na1/2Bi1/2TiO3-BaTiO3 single crystals. J. Cryst. Growth 2008, 310, 467–472. [Google Scholar] [CrossRef]
  97. Sun, R.; Zhang, Q.; Fang, B.; Jiao, J.; Li, X.; Zhao, X.; Lin, D.B.; Wang, D.; Luo, H. Dielectric, electromechanical coupling properties of Mn-doped Na0.5Bi0.5TiO3-BaTiO3 lead-free single crystal. Appl. Phys. A-Mat. Sci. Process. 2011, 103, 199–205. [Google Scholar]
  98. Chen, Y.; Jiang, X.P.; Luo, H.S.; Dai, J.Y.; Chan, H.L. High-frequency ultrasonic transducer fabricated with lead-free piezoelectric single crystal. IEEE T. Ultrason. Ferroelectr. 2010, 57, 2601–2604. [Google Scholar] [CrossRef]
  99. Zhang, S.T.; Kounga, A.B.; Aulbach, E.; Ehrenberg, H.; Rodel, J. Giant strain in lead-free piezoceramics Bi0.5Na0.5TiO3-BaTiO3-K0.5Na0.5NbO3 system. Appl. Phys. Lett. 2007, 91, 112906:1–112906:3. [Google Scholar]
  100. Zhang, S.T.; Kounga, A.B.; Aulbach, E.; Granzow, T.; Jo, W.; Kleebe, H.J.; Rodel, J. Lead-free piezoceramics with giant strain in the system Bi0.5Na0.5TiO3-BaTiO3-K0.5Na0.5NbO3. I. Structure and room temperature properties. J. Appl. Phys. 2008, 103, 034107:1–034107:8. [Google Scholar]
  101. Zhang, S.T.; Kounga, A.B.; Aulbach, E.; Jo, W.; Granzow, T.; Ehrenberg, H.; Rodel, J. Lead-free piezoceramics with giant strain in the system Bi0.5Na0.5TiO3-BaTiO3-K0.5Na0.5NbO3. II. Temperature dependent properties. J. Appl. Phys. 2008, 103, 034108:1–034108:7. [Google Scholar]
  102. Daniels, J.E.; Jo, W.; Rodel, J.; Jones, J.L. Electric-field-induced phase transformation at a lead-free morphotropic phase boundary: Case study in a 93%(Bi0.5Na0.5)TiO3-7% BaTiO3 piezoelectric ceramic. Appl. Phys. Lett. 2009, 95, 032904:1–032904:3. [Google Scholar]
  103. Jo, W.; Granzow, T.; Aulbach, E.; Rodel, J.; Damjanovic, D. Origin of the large strain response in (K0.5Na0.5)NbO3-modified (Bi0.5Na0.5)TiO3-BaTiO3 lead-free piezoceramics. J. Appl. Phys. 2009, 105, 094102:1–094102:5. [Google Scholar]
  104. Tan, X.; Aulbach, E.; Jo, W.; Granzow, T.; Kling, J.; Marsilius, M.; Kleebe, H.J.; Rodel, J. Effect of uniaxial stress on ferroelectric behavior of (Bi1/2Na1/2)TiO3-based lead-free piezoelectric ceramics. J. Appl. Phys. 2009, 106, 044107:1–044107:7. [Google Scholar]
  105. Yang, R.Y.; Lin, M.H.; Lu, H.Y. Core-shell structures in pressureless-sintered undoped Pb(Fe2/3W1/3)O3 ceramics. Acta Mater. 2001, 49, 2597–2607. [Google Scholar] [CrossRef]
  106. Egertonand, L.; Bieling, C.A. Isostatically hot-pressed sodium-potassium niobate transducer material for ultrasonic devices. Amer. Ceram. Soc. Bull. 1968, 47, 1151–1156. [Google Scholar]
  107. Jaeger, R.E.; Egerton, L. Hot pressing of potassium-sodium niobate. J. Amer. Ceram. Soc. 1962, 45, 209–213. [Google Scholar] [CrossRef]
  108. Haertling, G.H. Properties of hot pressed ferroelectric alkali niobate ceramics. J. Amer. Ceram. Soc. 1967, 50, 329–330. [Google Scholar] [CrossRef]
  109. Wu, J.G.; Xiao, D.Q.; Wang, Y.Y.; Zhu, J.G.; Yu, P.; Jiang, Y.H. Compositional dependence of phase structure and electrical properties in (K0.42Na0.58)NbO3-LiSbO3 lead-free ceramics. J Appl. Phys. 2007, 102, 114113:1–114113:5. [Google Scholar]
  110. Li, J.F.; Wang, K.; Zhang, B.P.; Zhang, L.M. Ferroelectric and piezoelectric properties of fine-grained Na0.5K0.5NbO3 lead-free piezoelectric ceramics prepared by spark plasma sintering. J. Amer. Ceram. Soc. 2006, 89, 706–709. [Google Scholar] [CrossRef]
  111. Ahn, C.W.; Park, C.S.; Viehland, D.; Nahm, S.; Kang, D.H.; Bae, K.S.; Priya, S. Correlation between phase transitions and piezoelectric properties in lead-free (K,Na,Li)NbO3-BaTiO3 ceramics. Jpn. J. Appl. Phys. 2008, 47, 8880–8883. [Google Scholar] [CrossRef]
  112. Tennery, V.J.; Hang, K.W. Thermal and X-ray diffraction studies of the NaNbO3-KNbO3 system. J. Appl. Phys. 1968, 39, 4749–4753. [Google Scholar] [CrossRef]
  113. Wu, L.; Zhang, J.L.; Wang, C.L.; Li, J.C. Influence of compositional ratio K/Na on physical properties in (KxNa1−x)NbO3 ceramics. J. Appl. Phys. 2008, 103, 084116:1–084116:5. [Google Scholar]
  114. Zhao, P.; Zhang, B.P.; Li, J.F. High piezoelectric d(33) coefficient in Li-modified lead-free (Na,K)NbO3 ceramics sintered at optimal temperature. Appl. Phys. Lett. 2007, 90, 242909:1–242909:3. [Google Scholar]
  115. Zhang, Q.; Zhang, B.P.; Li, H.T.; Shang, P.P. Effects of Sb content on electrical properties of lead-free piezoelectric [(Na0.535K0.480)0.942Li0.058](Nb1−xSbx)O3 ceramics. J. Alloys Compounds 2010, 490, 260–263. [Google Scholar] [CrossRef]
  116. Kusumoto, K. Dielectric And piezoelectric properties Of Nanbo3-BaTiO3-SrTiO3 Ceramics. In Proceedings of the Applications of Ferroelectrics, ISAF 2007, Sixteenth IEEE International Symposium, Nara, Japan, 27–31 May 2007; pp. 686–687. [CrossRef]
  117. Maurya, D.; Ahn, C.W.; Zhang, S.; Priya, S. High dielectric composition in the system Sn-modified (1−x)BaTiO3-xBa(Cu1/3Nb2/3)O3, x = 0.025 for multilayer ceramic capacitor. J. Amer. Ceram. Soc. 2010, 93, 1225–1228. [Google Scholar]
  118. Yuan, Y.; Zhang, S.R.; Zhou, X.H.; Liu, J.S. Phase transition and temperature dependences of electrical properties of [Bi0.5 (Na1−x−yKxLiy)0.5]TiO3 ceramics. Jpn. J. Appl. Phys. 2006, 45, 831–834. [Google Scholar] [CrossRef]
  119. Takenaka, T.; Nagata, H. Current status and prospects of lead-free piezoelectric ceramics. J. Eur. Ceram. Soc. 2005, 25, 2693–2700. [Google Scholar] [CrossRef]
  120. Chen, M.; Xu, Q.; Kim, B.H.; Ahn, B.K.; Ko, J.H.; Kang, W.J.; Nam, O.J. Structure and electrical properties of (Na0.5Bi0.5)(1−x)BaxTiO3 piezoelectric ceramics. J. Eur. Ceram. Soc. 2008, 28, 843–849. [Google Scholar] [CrossRef]
  121. Xu, C.G.; Lin, D.M.; Kwok, K.W. Structure, electrical properties and depolarization temperature of (Bi0.5Na0.5)TiO3-BaTiO3 lead-free piezoelectric ceramics. Solid State Sci. 2008, 10, 934–940. [Google Scholar]
  122. Zhou, D.X.; Li, H.; Gong, S.P.; Hu, Y.X.; Han, K. Sodium bismuth titanate-based lead-free piezoceramics prepared by aqueous gelcasting. J. Amer. Ceram. Soc. 2008, 91, 2792–2796. [Google Scholar] [CrossRef]
  123. Oh, T.; Kim, M. Phase relation and dielectric properties in (Bi1/2Na1/2)(1−x)BaxTiO3 lead-free ceramics. Mater. Sci. Eng. B Solid State M. 2006, 132, 239–246. [Google Scholar]
  124. Gomah-Pettry, J.R.; Said, E.; Marchet, P.; Mercurio, J.P. Sodium-bismuth titanate based lead-free ferroelectric materials. J. Eur. Ceram. Soc. 2004, 24, 1165–1169. [Google Scholar]
  125. Lin, D.B.; Kwok, K.W.; Chan, H.L. Structure and electrical properties of Bi0.5Na0.5TiO3-BaTiO3-Bi0.5Li0.5TiO3 lead-free piezoelectric ceramics. Solid State Ionics 2008, 178, 1930–1937. [Google Scholar]
  126. Lin, D.M.; Xiao, D.Q.; Zhu, J.G.; Yu, P. Piezoelectric and ferroelectric properties of lead-free [Bi1−y(Na1−x−yLix)]0.5BayTiO3 ceramics. J. Eur. Ceram. Soc. 2006, 26, 3247–3251. [Google Scholar] [CrossRef]
  127. Yang, Z.; Liu, B.; Wei, L.; Hou, Y. Structure and electrical properties of (1−x)Bi0.5Na0.5TiO3−xBi0.5K0.5TiO3 ceramics near morphotropic phase boundary. Mater. Res. Bull. 2008, 43, 81–89. [Google Scholar] [CrossRef]
  128. Yoshii, K.; Hiruma, Y.; Nagata, H.; Takenaka, T. Electrical properties and depolarization temperature of (Bi1/2Na1/2)TiO3-(Bi1/2K1/2)TiO3 lead-free piezoelectric ceramics. Jpn. J. Appl. Phys. Pt 1 2006, 45, 4493–4496. [Google Scholar] [CrossRef]
  129. Zhao, S.C.; Li, G.R.; Ding, A.L.; Wang, T.B.; Yin, Q.R. Ferroelectric and piezoelectric properties of (Na, K)0.5Bi0.5TiO3 lead free ceramics. J. Phys.-D-Appl. Phys. 2006, 39, 2277–2281. [Google Scholar] [CrossRef]
  130. Zhang, Y.R.; Li, J.F.; Zhang, B.P. Enhancing electrical properties in NBT-KBT lead-free piezoelectric ceramics by optimizing sintering temperature. J. Amer. Ceram. Soc. 2008, 91, 2716–2719. [Google Scholar] [CrossRef]
  131. Hiruma, Y.; Yoshii, K.; Nagata, H.; Takenaka, T. Phase transition temperature and electrical properties of (Bi1/2Na1/2)TiO3-(Bi(1/2)A(1/2))TiO3 (A=Li and K) lead-free ferroelectric ceramics. J. Appl. Phys. 2008, 103, 084121:1–084121:7. [Google Scholar]
  132. Oh, T. Dielectric relaxor properties in the system of (Na1−xKx)(1/2)Bi1/2TiO3 ceramics. Jpn. J. Appl. Phys. Pt. 1 2006, 45, 5138–5143. [Google Scholar] [CrossRef]
  133. Egerton, L.; Dillon, D.M. Piezoelectric and Dielectric properties of ceramics in the system of Potassium sodium niobate. J. Amer. Ceram. Soc. 1959, 42, 438–442. [Google Scholar] [CrossRef]
  134. Hollenstein, E.; Davis, M.; Damjanovic, D.; Setter, N. Piezoelectric properties of Li- and Ta-modified (K0.5Na0.5)NbO3 ceramics. Appl. Phys. Lett. 2005, 87, 182905:1–182905:3. [Google Scholar]
  135. Lang, S.B.; Zhu, W.Y.; Cross, L.E. Piezoelectric and pyroelectric properties of (K0.5Na0.5)(1−x)(Nb1−yTay)O3 ceramics. Ferroelectrics 2006, 336, 15–21. [Google Scholar] [CrossRef]
  136. Ahn, C.W.; Maurya, D.; Park, C.S.; Nahm, S.; Priya, S. A generalized rule for large piezoelectric response in perovskite oxide ceramics and its application for design of lead-free compositions. J. Appl. Phys. 2009, 105, 114108:1–114108:6. [Google Scholar]
  137. Lin, D.B.; Li, Z.R.; Zhang, S.; Xu, Z.; Yao, X. Dielectric/piezoelectric properties and temperature dependence of domain structure evolution in lead free (K0.5Na0.5)NbO3 single crystal. Solid State Commun. 2009, 149, 1646–1649. [Google Scholar] [CrossRef]
  138. Lin, D.B.; Li, Z.R.; Zhang, S.; Xu, Z.; Yao, X. Influence of MnO2 doping on the dielectric and piezoelectric properties and the domain structure in (K0.5Na0.5)NbO3 single crystals. J. Amer. Ceram. Soc. 2010, 93, 941–944. [Google Scholar]
  139. Xu, G.S.; Yang, D.F.; Chen, K.; Payne, D.A.; Carroll, J.F. Growth, domain dynamics and piezoelectric properties of some lead-free ferroelectric crystals. J. Electroceram. 2010, 24, 226–230. [Google Scholar] [CrossRef]
  140. Chang, Y.F.; Poterala, S.F.; Yang, Z.P.; Trolier-McKinstry, S.; Messing, G.L. <001> textured (K0.5Na0.5)(Nb0.97Sb0.03)O3 piezoelectric ceramics with high electromechanical coupling over a broad temperature range. Appl. Phys. Lett. 2009, 95, 232905:1–232905:3. [Google Scholar]
  141. Pertsev, N.A.; Zembilgotov, A.G.; Tagantsev, A.K. Effect of mechanical boundary conditions on phase diagrams of epitaxial ferroelectric thin films. Phys. Rev. Lett. 1998, 80, 1988–1991. [Google Scholar] [CrossRef]
  142. Morelli, A.; Venkatesan, S.; Kooi, B.J.; Palasantzas, G.; De Hosson, J.T. Piezoelectric properties of PbTiO3 thin films characterized with piezoresponse force and high resolution transmission electron microscopy. J. Appl. Phys. 2009, 105, 064106:1–064106:6. [Google Scholar]
  143. Petraru, A.; Pertsev, N.A.; Kohlstedt, H.; Poppe, U.; Waser, R.; Solbach, A.; Klemradt, U. Polarization and lattice strains in epitaxial BaTiO3 films grown by high-pressure sputtering. J. Appl. Phys. 2007, 101, 114106:1–114106:8. [Google Scholar]
  144. Li, Y.L.; Cross, L.E.; Chen, L.Q. A phenomenological thermodynamic potential for BaTiO3 single crystals. J. Appl. Phys. 2005, 98, 064101:1–064101:4. [Google Scholar]
  145. Liang, L.Y.; Li, Y.L.; Chen, L.Q.; Hu, S.Y.; Lu, G.H. Thermodynamics and ferroelectric properties of KNbO3. J. Appl. Phys. 2009, 106, 104118:1–104118:9. [Google Scholar]
  146. Matsubara, M.; Yamaguchi, T.; Sakamoto, W.; Kikuta, K.; Yogo, T.; Hirano, S. Processing and piezoelectric properties of lead-free (K,Na)(Nb,Ta)O3 ceramics. J. Amer. Ceram. Soc. 2005, 88, 1190–1196. [Google Scholar] [CrossRef]
  147. Matsubara, M.; Yamaguchi, T.; Kikuta, K.; Hirano, S. Sinterability and piezoelectric properties of (K,Na)NbO3 ceramics with novel sintering aid. Jpn. J. Appl. Phys. Pt. 1 2004, 43, 7159–7163. [Google Scholar] [CrossRef]
  148. Lim, J.B.; Zhang, S.; Jeon, J.H.; Shrout, T.R. (K,Na)NbO3-based ceramics for piezoelectric hard lead-free materials. J. Amer. Ceram. Soc. 2010, 93, 1218–1220. [Google Scholar]
  149. Zakharov, A.Yu.; Bichurin, M.I. Generalized Lattice Model of Multi-Component Systems with Internal Degrees of Freedom-I General Consideration, 9 September 2008; 17, arXiv:0809.1495v1 [cond-mat.stat-mech].
  150. Zakharov, A.Yu.; Bichurin, M.I. Lattice models in condensed matter theory. Nanostruct. Math. Phys. Model. 2010, 2, 25–53. (In Russian) [Google Scholar]
  151. Zakharov, A.Yu.; Bichurin, M.I. Generalized lattice model of multi-component systems with internal degrees of freedom—II Quasiequilibrium States. Cornell University Library: Ithaca, NY, USA, 5 October 2009; 12, arXiv:0910.0861v1 [cond-mat.stat-mech]. [Google Scholar]
  152. Zakharov, A.Yu.; Bichurin, M.I.; Priya, S. On the Theory of Ferroelectric Solid Solutions. Cornell University Library: Ithaca, NY, USA, 2 December 2010; 7, arXiv:1012.0594v1 [cond-mat.mtrl-sci].
  153. Debye, P. Polar Molecules, 1st ed.; Lancaster Press Inc: Lancaster, PA, USA, 1929; pp. 1–172. [Google Scholar]
  154. Brown, W.F., Jr. Dielectrics. In Handbuch der Physik, 1st ed.; Flügge, S., Ed.; Springer-Verlag: Berlin, Germany, 1956; Volume XVII, Chapter 1; pp. 1–326. [Google Scholar]
  155. Fröhlich, H. Theory of Dielectrics: Dielectric Constant and Dielectric Loss, 1st ed.; Clarendon Press: London, UK, 1958; pp. 1–180. [Google Scholar]
  156. Shirane, G.; Suzuki, K. On the phase transition in barium-lead titanate. J. Phys. Soc. Jpn. 1951, 6, 274–278. [Google Scholar] [CrossRef]
  157. Landolt, H.; Börnstein, R. Numerical Data and Functional Relationships in Science and Technology—New Series, Group III, Condensed Matter, Electrical Properties, Ferroelectrics and Related Substances, Oxides, 1st ed.; Springer-Verlag: Berlin, Germany, 2002; Volume 36A1, pp. 1–588. [Google Scholar]
  158. Petrov, V.M.; Bichurin, M.I.; Laletin, V.M.; Paddubnaya, N.; Srinivasan, G. Modeling of magnetoelectric effects in ferromagnetic/piezoelectric bulk composites. In Proceedings of the 5th International Conference on Magnetoelectric Interaction Phenomena in CrystalsMEIPIC-5, Sudak, Ukraine, 21–24 September 2003. arXiv:cond-mat/0401645.
  159. Harshe, G.; Dougherty, J.P.; Newnham, R.E. Theoretical modelling of 3-0/0-3 magnetoelectric composites. Int. J. Appl. Electromagn. Mat. 1993, 4, 161–171. [Google Scholar]
  160. Landolt, H.; Börnstein, R. Numerical Data and Functional Relationships in Science and Technology—New Series, Group III, Crystal and Solid State Physics, 1st ed.; Springer-Verlag: Berlin, Germany, 1970; Volume 4B, pp. 1–779. [Google Scholar]
  161. Ahn, C.W.; Maurya, D.; Park, C.S.; Nahm, S.; Priya, S. A generalized rule for large piezoelectric response in perovskite oxide ceramics and its application for design of lead-free compositions. J. Appl. Phys. 2009, 105, 114108:1–114108:6. [Google Scholar]
  162. Ahn, C.W.; Choi, C.H.; Park, H.Y.; Nahm, S.; Priya, S. Dielectric and piezoelectric properties of (1−x)(Na0.5K0.5)NbO3−xBaTiO3 ceramics. J. Mater. Sci. 2008, 43, 6784–6797. [Google Scholar] [CrossRef]
  163. Echigoya, J.; Hayashi, S.; Obi, Y. Directional solidification and interface structure of BaTiO3-CoFe2O4 eutectic. J. Mater. Sci. 2000, 35, 5587–5591. [Google Scholar] [CrossRef]
  164. Islam, R.A.; Priya, S. Large magnetoelectric coefficient in Co-fired Pb (Zr0.52Ti0.48)O3-Pb(Zn1/3Nb2/3)O3-Ni0.6Cu0.2Zn0.2Fe2O4 trilayer magnetoelectric composites. J. Mater. Sci. 2008, 43, 2072–2076. [Google Scholar] [CrossRef]
  165. Islam, R.A.; Ni, Y.; Khachaturyan, A.G.; Priya, S. Giant magnetoelectric effect in sintered multilayered composite structures. J. Appl. Phys. 2008, 104, 044103:1–044103:5. [Google Scholar]
  166. Islam, R.A.; Rong, C.B.; Liu, J.P.; Priya, S. Effect of gradient composite structure in cofired bilayer composites of Pb(Zr0.56Ti0.44)O3-Ni0.6Zn0.2Cu0.2Fe2O4 system on magnetoelectric coefficient. J. Mater. Sci. 2008, 43, 6337–6343. [Google Scholar] [CrossRef]
  167. Islam, R.A.; Priya, S. Effect of piezoelectric grain size on magnetoelectric coefficient of Pb(Zr0.52Ti0.48)O3-Ni0.8Zn0.2Fe2O4 particulate composites. J. Mater. Sci. 2008, 43, 3560–3568. [Google Scholar] [CrossRef]
  168. Grossinger, R.; Duong, G.V.; Sato-Turtelli, R. The physics of magnetoelectric composites. J. Magn. Magn. Mater. 2008, 320, 1972–1977. [Google Scholar] [CrossRef]
  169. Bedekar, V.; Poudyal, N.; Rong, C.B.; Liu, J.P.; Kim, C.U.; Priya, S. Improved magnetoelectric properties of piezoelectric-magnetostrictive nanocomposites synthesized using high-pressure compaction technique. J. Mater. Sci. 2009, 44, 2162–2166. [Google Scholar] [CrossRef]
  170. Yang, S.C.; Park, C.S.; Cho, K.H.; Priya, S. Self-biased magnetoelectric response in three-phase laminates. J. Appl. Phys. 2010, 108, 093706:1–093706:6. [Google Scholar]
  171. Priya, S.; Islam, R.A.; Dong, S.X.; Viehland, D. Recent advancements in magnetoelectric particulate and laminate composites. J. Electroceram. 2007, 19, 147–164. [Google Scholar]
  172. Zhai, J.Y.; Xing, Z.P.; Dong, S.X.; Li, J.F.; Viehland, D. Magnetoelectric laminate composites: An overview. J. Amer. Ceram. Soc. 2008, 91, 351–358. [Google Scholar] [CrossRef]
  173. Islam, R.A.; Priya, S. Magnetoelectric properties of the lead-free cofired BaTiO3-(Ni0.8Zn0.2)Fe2O4 bilayer composite. Appl. Phys. Lett. 2006, 89, 152911:1–152911:3. [Google Scholar]
  174. Nan, C.W.; Li, M.; Huang, J.H. Calculations of giant magnetoelectric effects in ferroic composites of rare-earth-iron alloys and ferroelectric polymers. Phys. Rev. B 2001, 63, 144415:1–144415:9. [Google Scholar]
  175. Ruy, J.; Priya, S.; Carazo, A.V.; Uchino, K.; Kim, H.E. Effect of the magnetostrictive layer on magnetoelectric properties in lead zirconate titanate/terfenol-d laminate composites. J. Amer. Ceram. Soc. 2001, 84, 2905–2908. [Google Scholar] [CrossRef]
  176. Park, C.S.; Cho, K.H.; Arat, M.A.; Evey, J.; Priya, S. High magnetic field sensitivity in Pb(Zr,Ti)O3-Pb(Mg1/3Nb2/3)O3 single crystal/Terfenol-D/Metglas magnetoelectric laminate composites. J. Appl. Phys. 2010, 107, 094109:1–094109:4. [Google Scholar]
  177. Islam, R.A.; Priya, S. ME response of cofired trilayer magnetoelectric composites with partial texturing. J. Mater. Sci. 2009, 44, 5935–5938. [Google Scholar] [CrossRef]
  178. Park, C.S.; Ahn, C.W.; Ryu, J.; Yoon, W.H.; Park, D.S.; Kim, H.E.; Priya, S. Design and characterization of broadband magnetoelectric sensor. J. Appl. Phys. 2009, 105, 094111:1–094111:6. [Google Scholar]
  179. Park, C.S.; Ahn, C.W.; Yang, S.C.; Priya, S. Dimensionally gradient magnetoelectric bimorph structure exhibiting wide frequency and magnetic dc bias operating range. J. Appl. Phys. 2009, 106, 114101:1–114101:5. [Google Scholar]
  180. Cho, K.H.; Park, C.S.; Priya, S. Effect of intensive and extensive loss factors on the dynamic response of magnetoelectric laminates. Appl. Phys. Lett. 2010, 97, 182902:1–182902:3. [Google Scholar]
  181. Yang, S.C.; Park, C.S.; Cho, K.H.; Priya, S. Self-biased magnetoelectric response in three-phase laminates. J. Appl. Phys. 2010, 108, 093706:1–09706:6. [Google Scholar]
  182. Gebhardt, S.; Schonecker, A.; Steinhausen, R.; Seifert, W.; Beige, H. Quasistatic and dynamic properties of 1-3 composites made by soft molding. J. Eur. Ceram. Soc. 2003, 23, 153–159. [Google Scholar] [CrossRef]
  183. Lam, K.H.; Lo, C.Y.; Chan, H.L. Frequency response of magnetoelectric 1-3-type composites. J. Appl. Phys. 2010, 107, 093901:1–093901:5. [Google Scholar]
  184. Shi, Z.; Nan, C.W.; Zhang, J.; Ma, J.; Li, J.F. Magnetoelectric properties of multiferroic composites with pseudo-1-3-type structure. J. Appl. Phys. 2006, 99, 124108:1–124108:5. [Google Scholar]
  185. Petrov, V.M.; Srinivasan, G.; Bichurin, M.I.; Gupta, A. Theory of magnetoelectric effects in ferrite piezoelectric nanocomposites. Phys. Rev. B 2007, 75, 224407:1–224407:6. [Google Scholar]
  186. Park, C.S.; Ahn, C.; Priya, S. Enhanced magnetoelectric properties in three-phase composites with 2-1-2 connectivity. Phil. Mag. 2010, 90, 4443–4452. [Google Scholar] [CrossRef]

