2.1. Nature of Electronic Defects
The CZ technique allows growing large single crystals pieces for industrial applications but is very constraining in terms of growth atmosphere because of oxidation of the Ir crucible. As the Floating-Zone technique (FZ) does not require any crucible, it is better suited for testing different atmospheres even though only small crystals can be obtained.
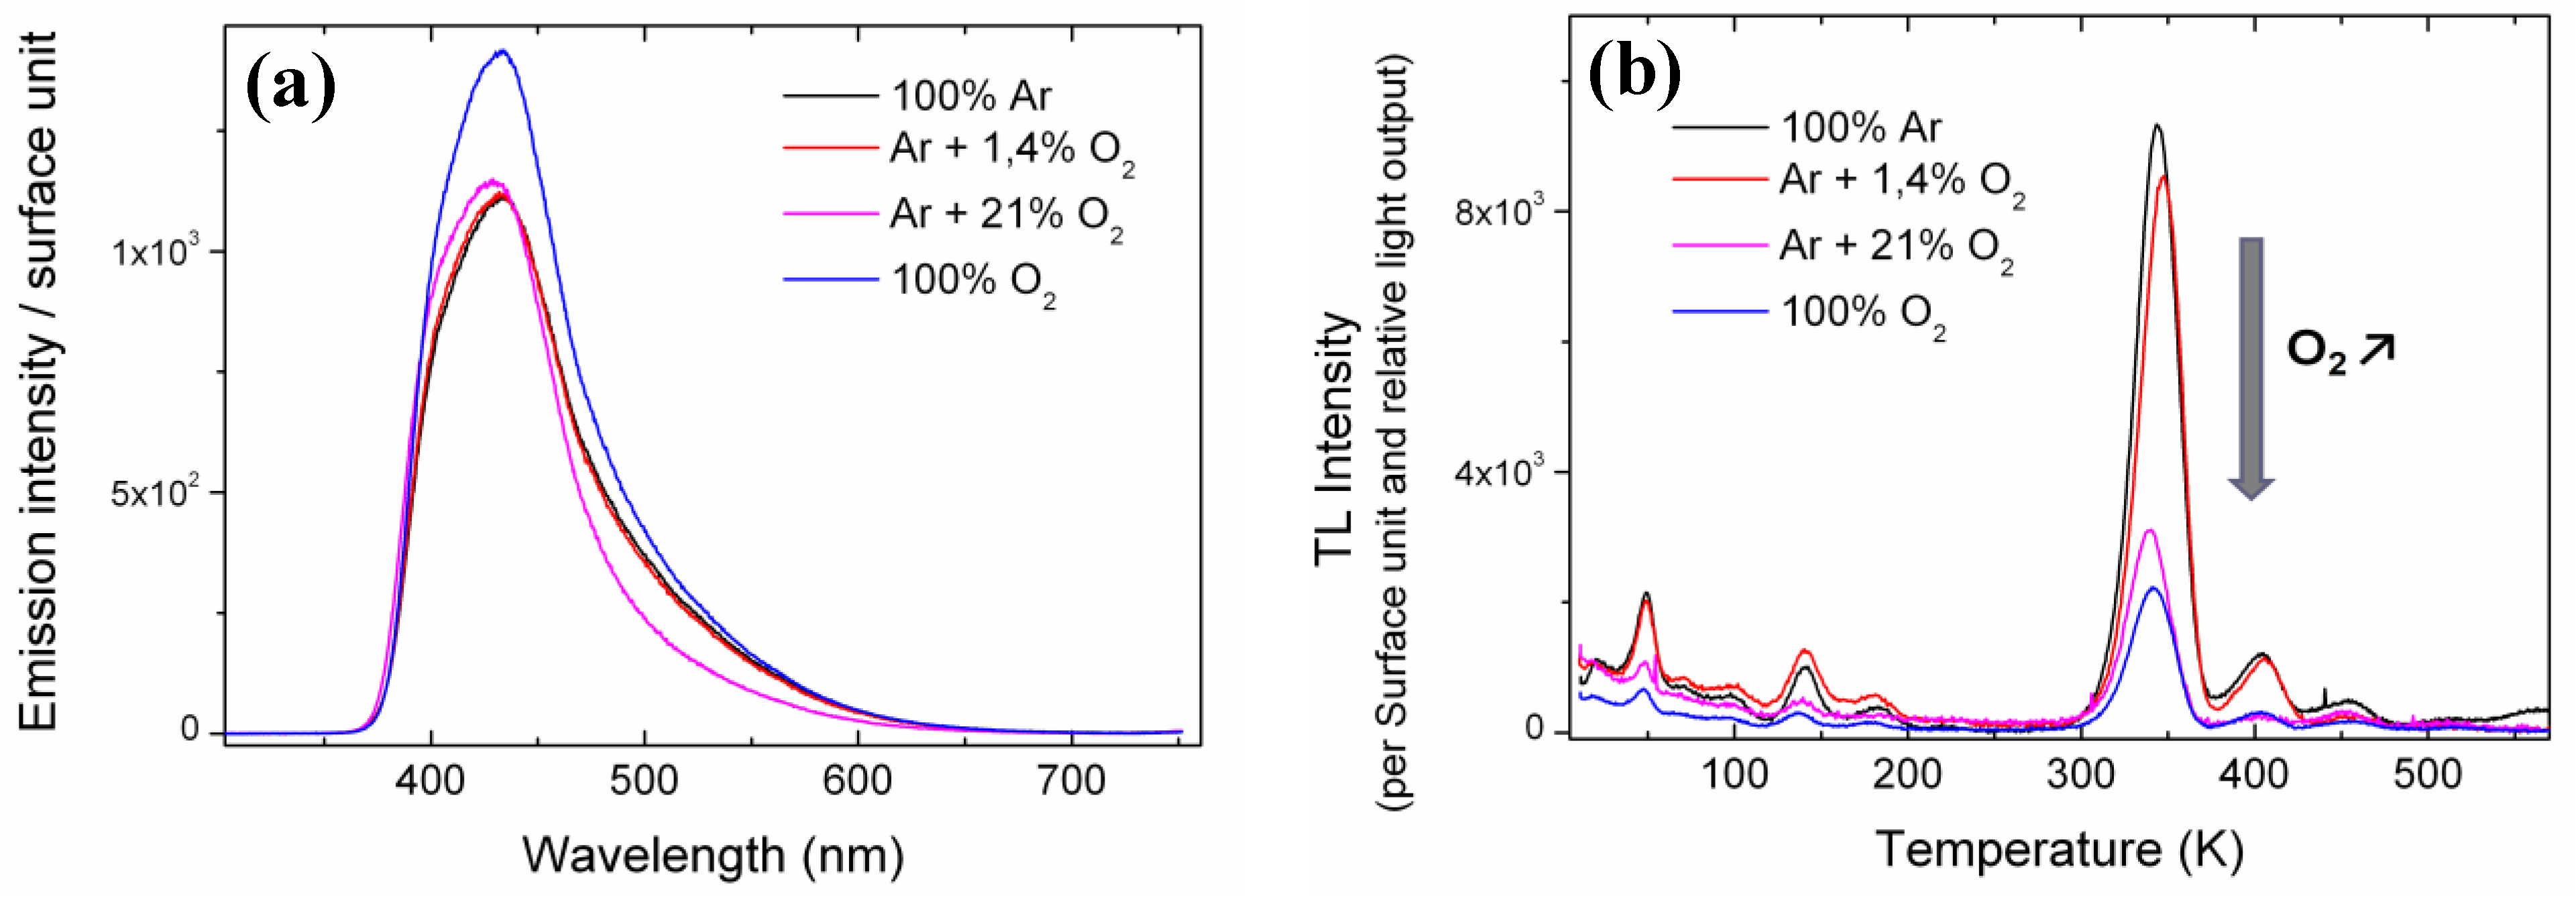
For each LYSO:Ce sample grown by the FZ technique, XRL emission spectra were first collected at room temperature (RT) and are shown in
Figure 1(a), where the emission amplitude is given per surface unit. The four samples show different luminescence intensity depending on their growth atmosphere. Crystals grown with no oxygen, 1.4% oxygen, or 21% oxygen show lower luminescence than the 100% O
2 grown crystal. Their relative light output (LO) was calculated by integrating the emission spectra over the 300–700 nm range and are 0.82, 0.82, 0.77 and 1, respectively. The 21% O
2 sample has a lower relative LO due to differences in its emission spectrum, particularly a weaker contribution around 500 nm. Emission in this wavelength range is ascribed to Ce
3+ emission in the second crystallographic site (Ce
2) of LYSO [
10]. No explanation has yet been found to explain this difference.
Figure 1.
(a) Emission spectra under X-Ray excitation at room temperature (RT) of the Floating-Zone technique (FZ) grown samples. The relative light output (LO) calculated by integrating the emission spectra on the 300–700 nm range are 0.82, 0.82, 0.77 and 1 for 100% Ar, Ar + 1.4% O2, Ar + 21% O2 and 100% O2 growth atmospheres, respectively. (b) Thermoluminescence (TL) glow curves of the four LYSO:Ce single crystals grown with different oxygen containing atmospheres. All curves are normalized to sample surface and relative LO for comparison. The arrow refers to increasing oxygen content in the growth atmosphere.
TL was then performed on the four LYSO:Ce single crystals. The corresponding glow curves are given in
Figure 1(b). TL intensities correspond to the integrated emission spectra over the 300–700 nm range. In order to compare the glow curves of all samples, TL intensities were normalized to the sample surface and relative LO previously calculated. For all glow curves, at least five TL peaks can be detected below 250 K. The most intense ones are peaking at 49, 140 and 182 K. At temperatures above 250 K four peaks are present at 347, 404, 454 and 509 K. A fifth peak at 567 K is only found for the crystals grown with 100% Ar, and its relation to oxygen content will be discussed in the second part of this work. All four samples show TL peaks at the same temperatures but with different intensity. Two groups can be distinguished: samples with important TL intensity and samples with about three times less TL. As all glow curves were previously normalized to their relative LO, the TL decrease cannot be ascribed to luminescence quenching. The crystals grown with the highest oxygen content
i.e., 21% and 100% oxygen are the ones with the lowest TL intensity whereas crystals grown with 1.4% or no oxygen show higher TL signal. Furthermore, there is a monotonous decrease of the TL intensity with increasing oxygen content in the growth atmosphere. This shows that trapping defects in LYSO that are involved in TL are directly linked to the oxygen content in the crystal. More precisely they are related to an oxygen deficiency in the material: the less oxygen in the growth atmosphere, the more intense the TL. These results bring a first substantial proof of the nature of the electronic defects responsible for the main TL peaks in LYSO:Ce
i.e., oxygen vacancies as it had been suggested in earlier works [
11,
12].
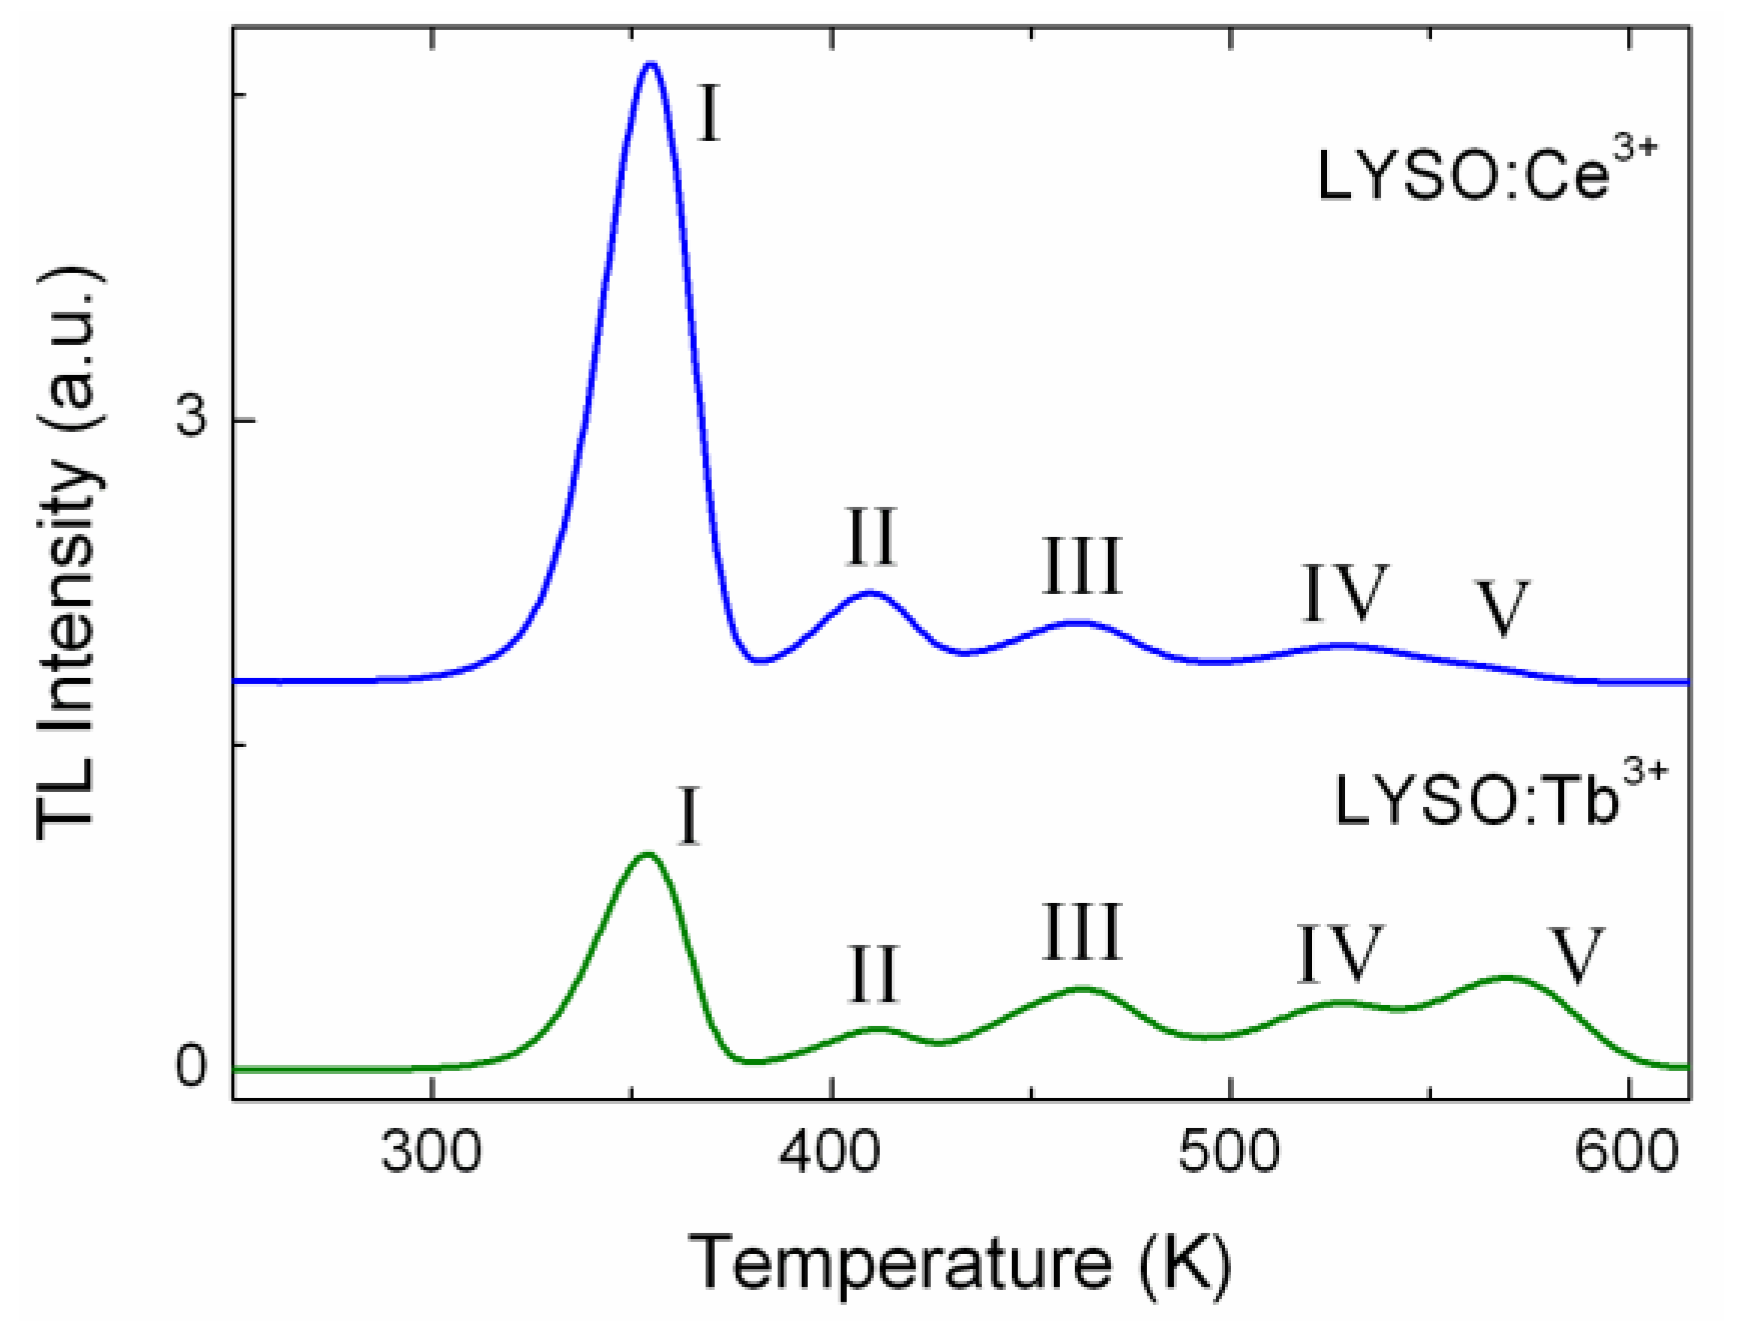
The comparison of the nature of the defects in LYSO:Ce and LYSO:Tb was also investigated by TL. LYSO:Tb shows low light yield (12,000 Photons/MeV) compared to LYSO:Ce (30,000 Photons/MeV).
Figure 2 shows their respective glow curves from 250 K to 620 K. Both samples show five peaks at similar temperatures (±3 K): 354, 410, 462, 524 and 569 K. For Ce-doped LYSO the last peak is very weak, thus the temperature value is given for LYSO:Tb. The comparison with the TL glow curves of the FZ grown samples reveals they all show the same peaks above 250 K, except for the last peak which is not always present. Small differences in temperature for each peak are ascribed to thermal lag due to the set-up. The TL peaks above 250 K will be identified as peak I to peak V in the order of increasing peak temperature.
Figure 2 shows that for Ce and Tb-doped LYSO, the TL peaks above 250 K are at similar temperatures but show different relative intensities. Hence this result suggests that the nature of the corresponding traps does not depend on the doping ion, the latter may just influence their relative concentrations. This confirms the identification of oxygen vacancies as responsible for the main TL peaks.
Figure 2.
TL glow curves of LYSO:Ce and LYSO:Tb single crystals. Both samples are 10 × 10 × 1 mm3 with the largest faces polished. Heating rate was set to 20 K/min.
Figure 2.
TL glow curves of LYSO:Ce and LYSO:Tb single crystals. Both samples are 10 × 10 × 1 mm3 with the largest faces polished. Heating rate was set to 20 K/min.
The characteristic properties of each trap were calculated for both LYSO:Ce and LYSO:Tb. For comparison, TL glow curves need to be corrected for their respective thermal quenching. In LYSO:Ce the emission spectra correspond to Ce
3+ 5
d1-4
f transitions. It was shown by Feng
et al. [
13] that thermally induced ionization of the Ce
3+ 5
d1 state can be followed by a delayed radiative recombination of the escaped electron with Ce
4+ centers. Thus, ionization of the 5
d1 state does not necessarily lead to luminescence quenching. By taking this into account, it is necessary to figure out whether the delayed recombination process has to be considered to correct TL glow curves. As the TL measurements were performed with a 2 s aperture, we have to consider this delayed process and take into account the whole emission, also called steady-state emission by Feng
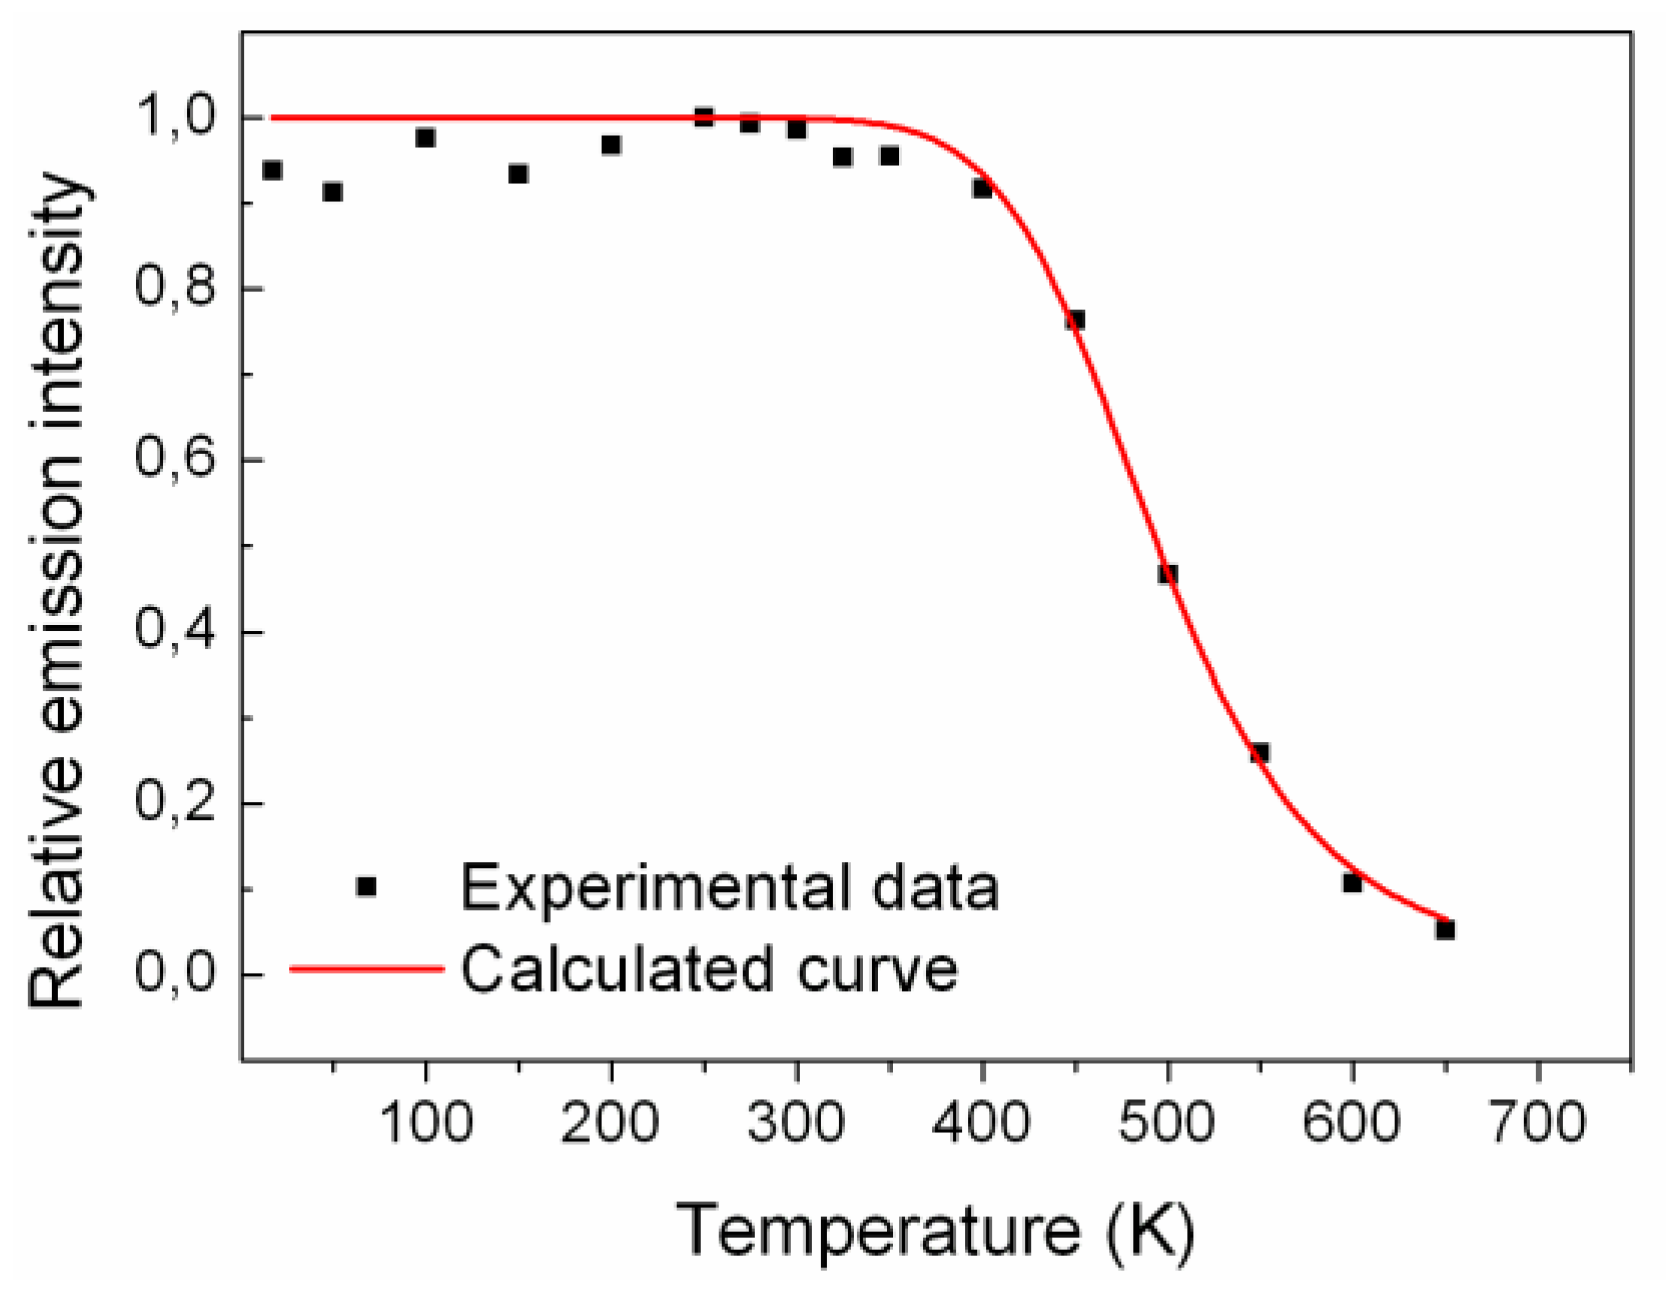
et al. The evolution of the emission intensity with temperature was measured from 650 K to 10 K under X-ray excitation and is shown in
Figure 3. For each temperature (every 50 K) the emission spectrum was integrated over the 300–700 nm range. The data were then fitted using the Mott-Gurney formula (Equation (1)):
where k
r and k
n are the probabilities or radiative and nonradiative transitions from the Ce
3+ excited state to the ground state, respectively, and k = Boltzmann’s constant = 8.617 × 10
−5 eV/K. As these measurements take both the prompt and delayed radiative recombination processes into account, the numerical interpolation given by Equation 1 (see
Figure 3) can be used to correct the TL glow curve. The calculated parameters were: E
QT = 0.47 ± 0.05 eV, and
: 69,958 ± 8,301. As the delayed luminescence process is included, the calculated values for E
QT and
cannot be compared to that published in other works [
14].
Figure 3.
Temperature dependence of the light output for LYSO:Ce determined from integrated emission spectra. The curve is the fit to Equation (1).
Figure 3.
Temperature dependence of the light output for LYSO:Ce determined from integrated emission spectra. The curve is the fit to Equation (1).
For Tb doped LYSO, the emission is only composed of the Tb3+ 4f-4f lines with maximum emission at 545 nm. As 4f electrons are quite insensitive to crystal field variations, and lattice vibrations (weak electron-phonon coupling), 4f-4f transitions usually show no thermal extinction. Hence LYSO:Tb glow curve was not corrected.
TL glow curves were then fitted using Kitis
et al. equations given in refs [
15,
16]. Each peak was first fitted with both 1st and 2nd order kinetic equations to determine which one was most suitable. It was found that the five TL peaks show first order kinetic as described by Equation (2). This was also shown in a previous work by Vedda
et al. [
12] but only for the peaks I to IV, peak V being ascribed to 2nd order kinetic and only present for LYSO but not for LSO [
12]. The whole glow curve was then fitted by the sum of five 1st order kinetic peaks, namely peaks I, II, III, IV and V. The values for the temperature at peak maximum: T
m,i and the intensity I
i with I = 1 to 5 were taken from the experimental data. Each glow curve was fitted with five parameters corresponding to the energy or trap depth: E
i, i = 1 to 5.
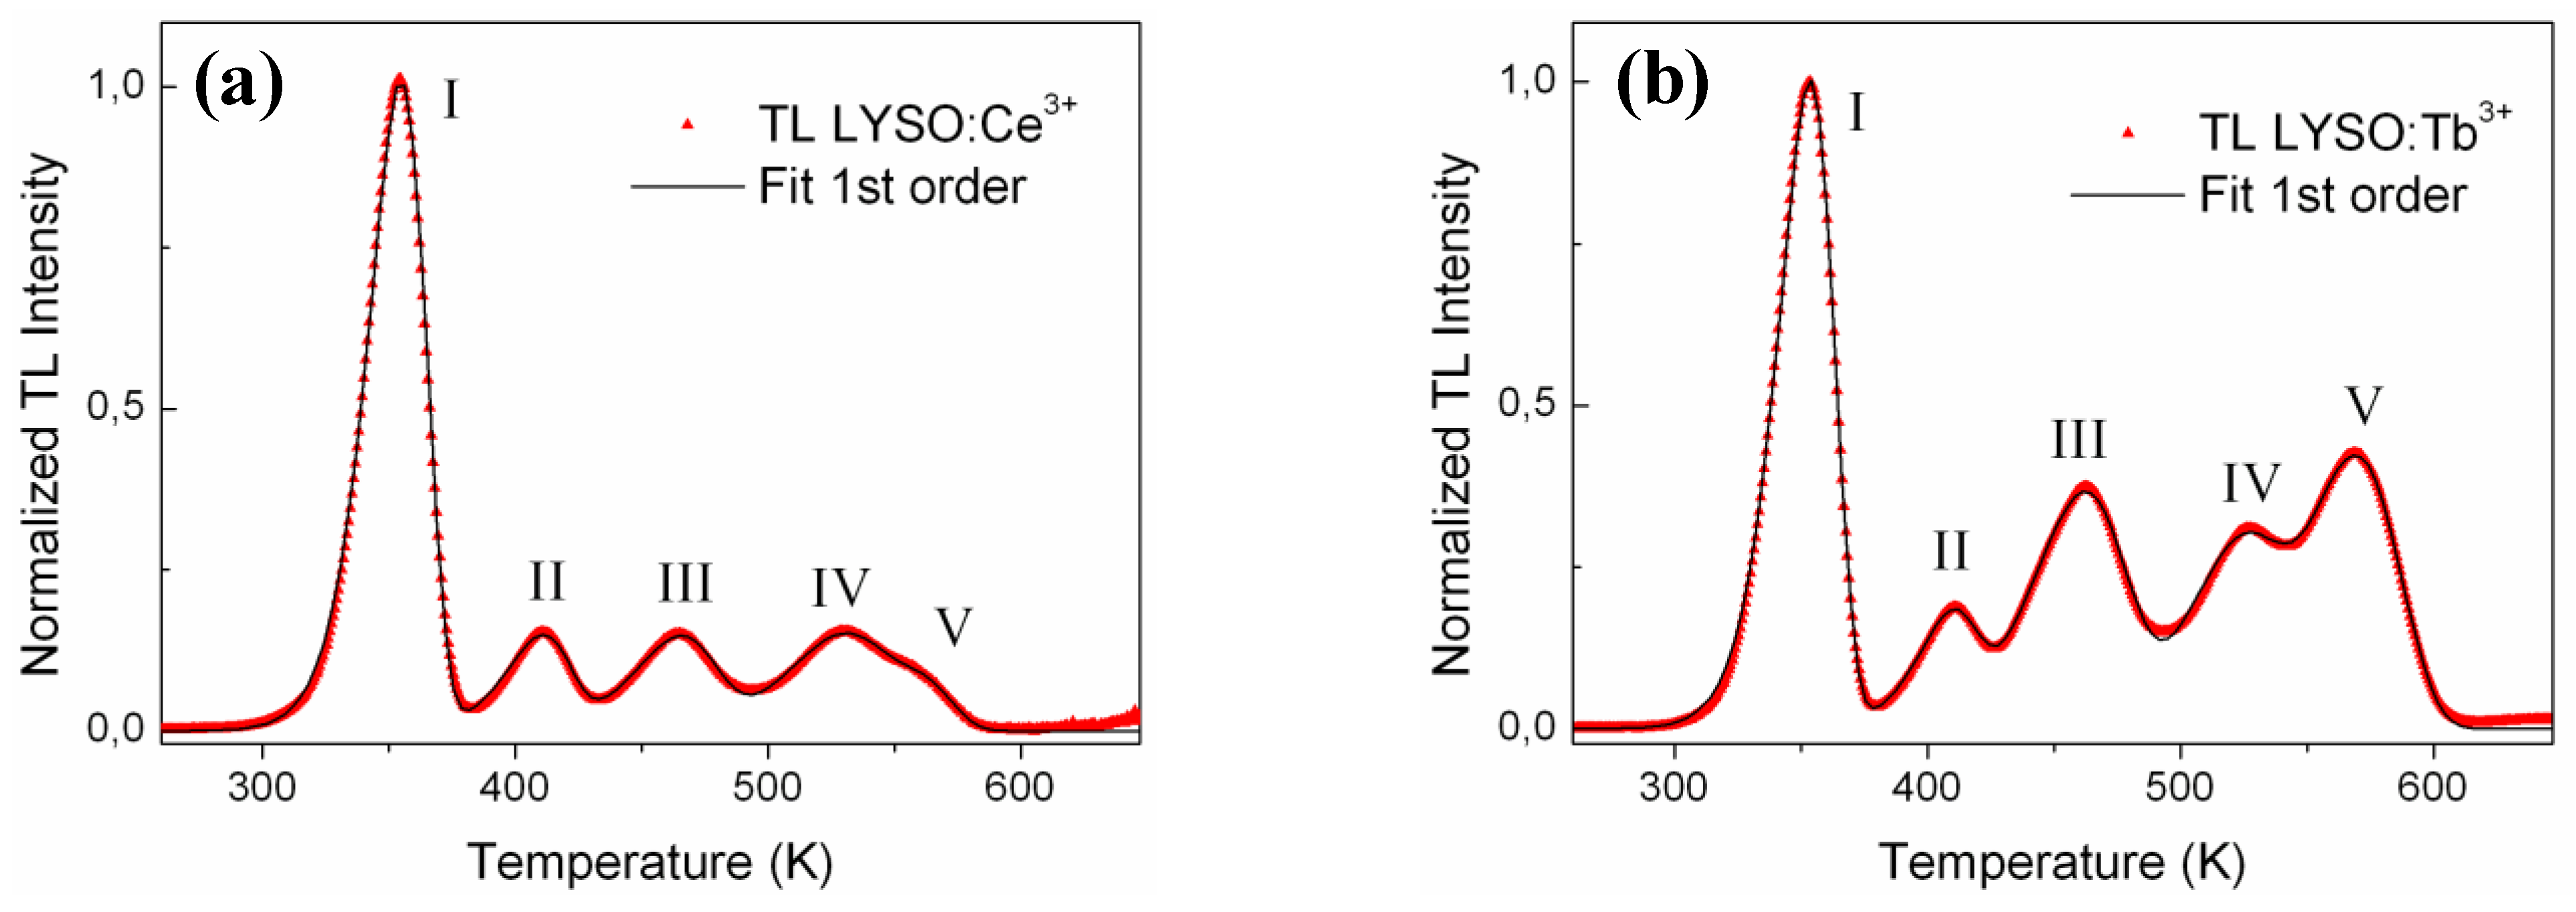
Figure 4(a) and
Figure 4(b) show the corrected glow curves and the fitting curves for LYSO:Ce and LYSO:Tb, respectively. The iterative Levenberg-Marquardt fitting algorithm was applied in the 250–620 K range and yielded to a R² value greater than 0.999. The most relevant parameters for the corresponding traps (
i.e., E and T
m) are given in
Table 1. The frequency factor
s was calculated using Equation (3) and is also given in
Table 1 for each trap.
with
and
where β is the heating rate = 0.33 K/s.
Figure 4.
Corrected TL glow curves (
![Materials 04 01224 i001]()
) and fitting curves (—) of (
a) LYSO:Ce and (
b) LYSO:Tb samples. Each curve is fitted with five 1st order kinetic peaks.
Figure 4.
Corrected TL glow curves (
![Materials 04 01224 i001]()
) and fitting curves (—) of (
a) LYSO:Ce and (
b) LYSO:Tb samples. Each curve is fitted with five 1st order kinetic peaks.
Table 1.
Trap parameters E, Tm and s for the fitted glow curves of LYSO:Ce and LYSO:Tb. All peaks are characteristic of first order kinetic.
Table 1.
Trap parameters E, Tm and s for the fitted glow curves of LYSO:Ce and LYSO:Tb. All peaks are characteristic of first order kinetic.
| | LYSO:Ce | LYSO:Tb |
| TL peak | E (eV) | Tm (K) | s (s−1) | E (eV) | Tm (K) | s (s−1) |
| I | 0.941 ± 0.002 | 354 | 7.0 × 10¹¹ ± 2.9 × 10⁹ | 0.963 ± 0.002 | 353 | 1.5 × 10¹² ± 6.1 × 10⁹ |
| II | 1.14 ± 0.02 | 410 | 2.7 × 10¹² ± 9.1 × 10¹⁰ | 1.21 ± 0.02 | 408 | 2.5 × 10¹³ ± 7.8 × 10¹¹ |
| III | 1.12 ± 0.02 | 464 | 2.9 × 10¹⁰ ± 1.0 × 10⁹ | 0.981 ± 0.006 | 461 | 9.2 × 10⁸ ± 1.1 × 10⁷ |
| IV | 1.24 ± 0.04 | 526 | 1.3 × 10¹⁰ ± 9.2 × 10⁸ | 1.28 ± 0.02 | 520 | 4.7 × 10¹⁰ ± 1.3 × 10⁹ |
| V | 1.70 ± 0.41 | 558 | 4.8 × 10¹³ ± 3.1 × 10¹³ | 1.38 ± 0.01 | 569 | 2.8 × 10¹⁰ ± 5.3 × 10⁸ |
All calculated traps depths are found to be around 1–2 eV which is consistent with the literature [
12,
17]. For Ce-doped LYSO calculated errors are less than 0.04 eV for peaks I to IV and 0.4 eV for peak V due to weaker intensity. For the Tb-doped sample all energy values have an error of less than 0.02 eV. According to the values given in
Table 1 the trap depths in LYSO:Ce and LYSO:Tb only differ from less than 0.15 eV (peak V is not taken into account due to the lack of precision). Hence we assume that both compositions have similar trap depth. Larger differences are observed for the frequency factor
s. This parameter is characteristic of the trap-to-emitting center transfer efficiency. As proposed by Vedda
et al. we assume a thermally activated tunneling transfer from the traps in an excited state to the luminescent centers [
12]. As
s depends exponentially on the distance
r between the trap and the center, and as Ce
3+ is 8% larger than Tb
3+, the trap-to-center distances are not expected to be the same in both materials. Thus
s may vary with the dopant by up to one order of magnitude when
r increases by 10%. These calculations confirm our previous assessment: electron traps in LYSO corresponding to peaks above 250 K just depend on the matrix and not on the dopant. Hence, traps located above 250 K are clearly ascribed to oxygen vacancies. Unlike the results previously published by Vedda
et al. [
12], the calculated trap depths are not all equal. This difference can be explained by the different environment of all the oxygens, especially for LYSO where two possible neighboring cations are possible,
i.e., Lu and Y. Concerning TL peaks below 250 K, their dependence on the oxygen content during the growth (
Figure 1(b)) also suggests that they are related to oxygen vacancies. Nevertheless, the origins of these shallow traps are not yet well established.
The formation of oxygen vacancies can be understood from the crystalline structure of the LYSO host. It is made of SiO
4 tetrahedra linked to one rare earth (RE = Lu/Y). The RE occupy two different sites, namely RE
1 and RE
2 with 7 and 6 neighboring oxygens, respectively. Five different oxygen sites are distinguished: O
1 to O
4 are related to SiO
4 polyhedra whereas O
5 is not bonded to silicon and is solely linked to Lu/Y, thus forming [O-RE
4] tetrahedra.
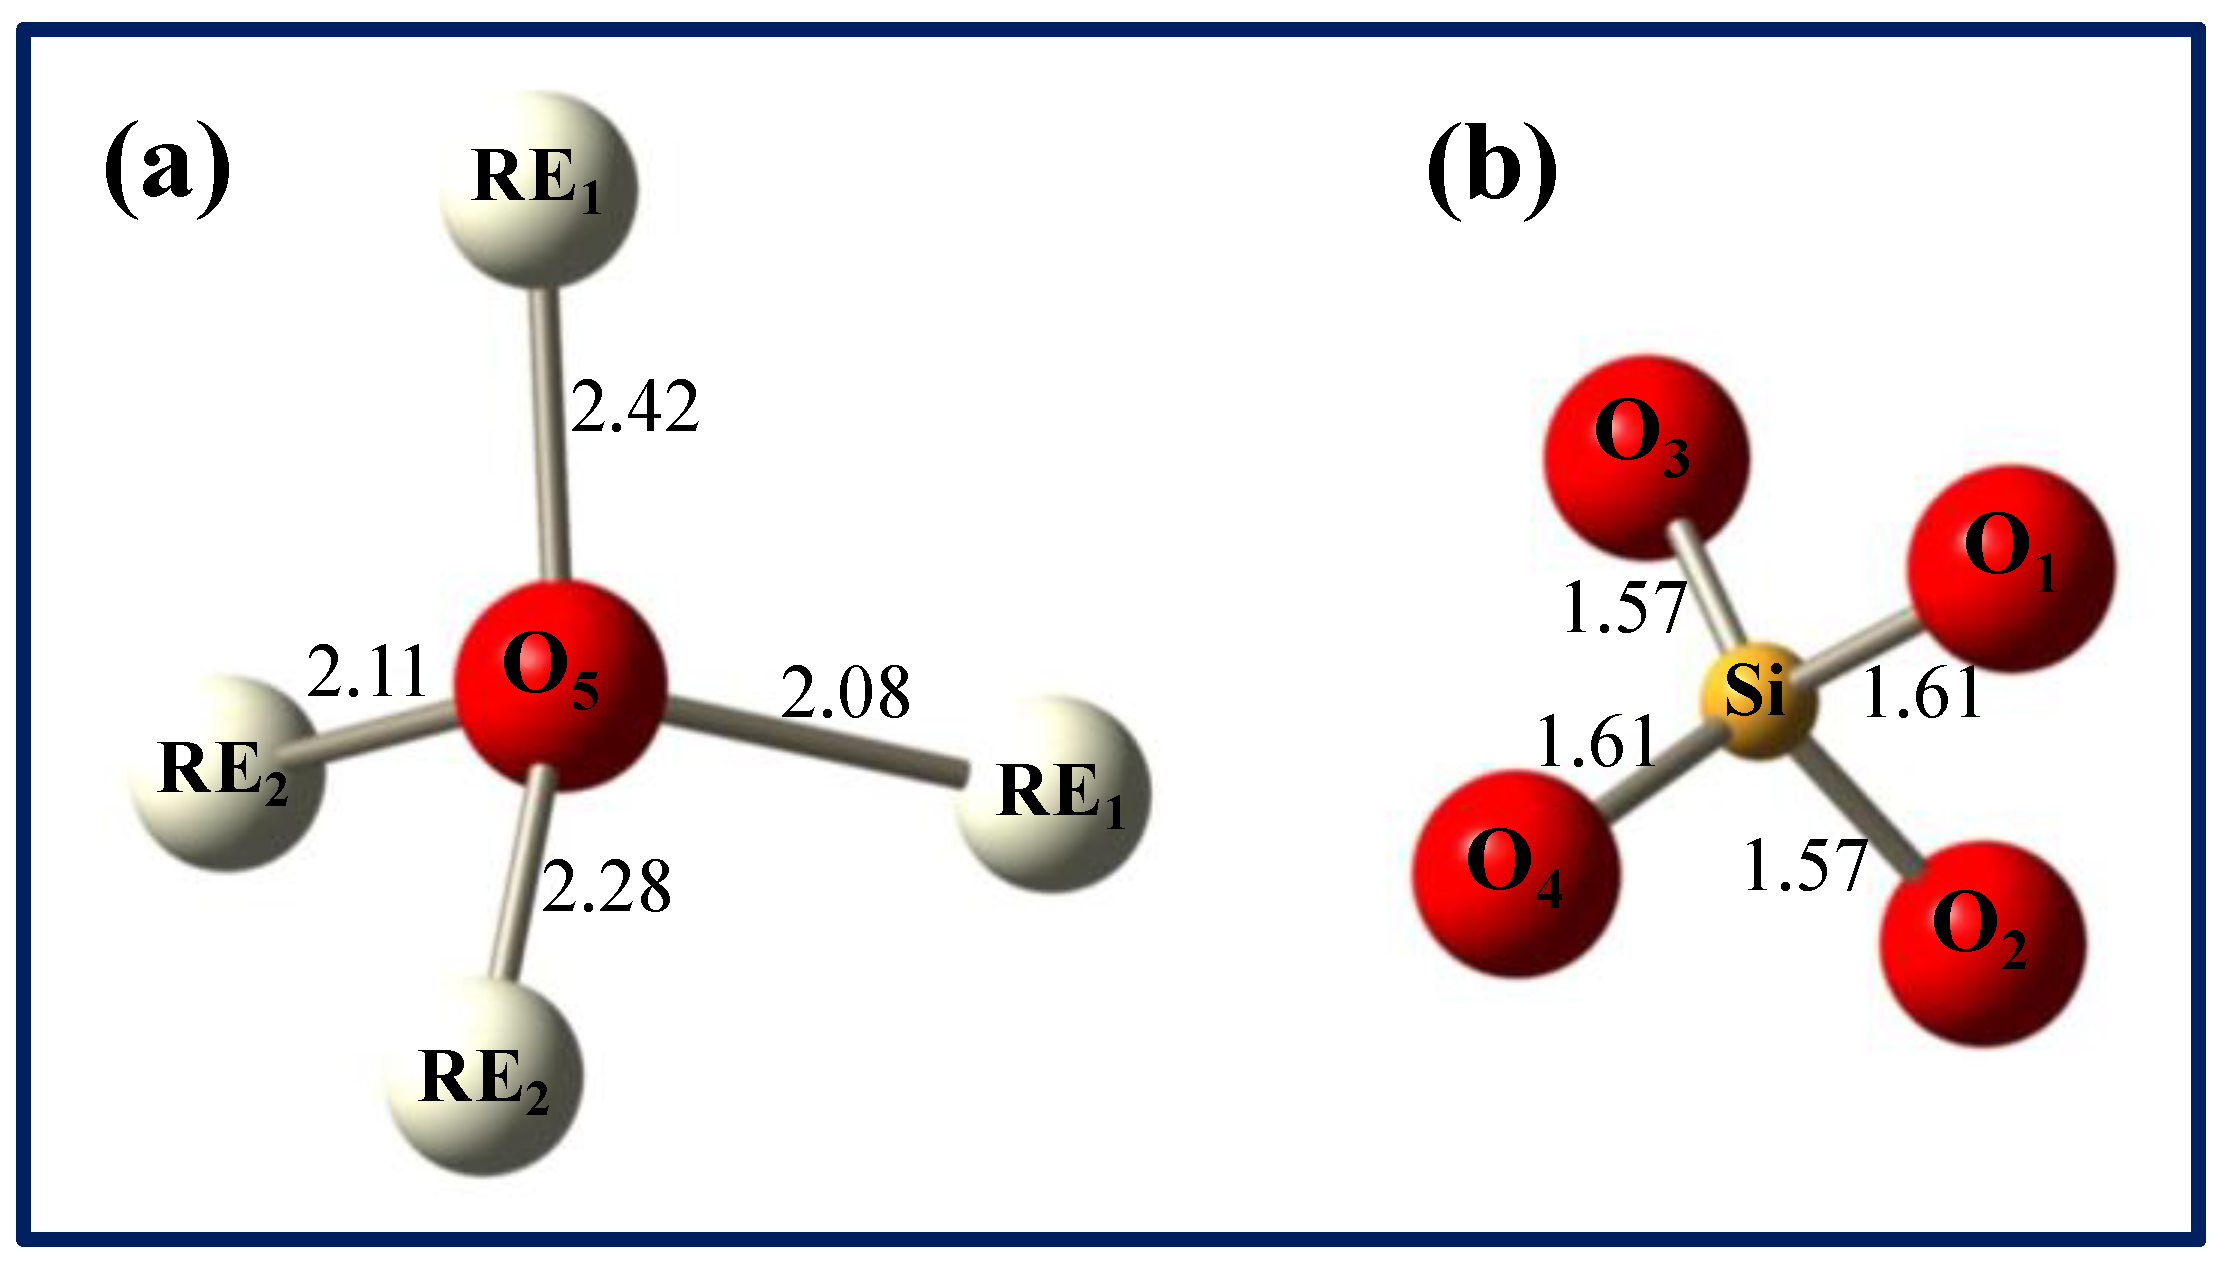
Figure 5 shows the environment of the different oxygen atoms with the main bonding distances in LYSO with 10% Y [
18]. Oxygen vacancies can be created during CZ growth due to low oxygen content in the furnace atmosphere. It was shown that vacancies of the fifth oxygen (O
5) have the lowest formation energy and that doubly positive charged vacancies are energetically favorable [
19]. Thus,
vacancies (in Kröger-Vink notation) are the most likely defects, which act as electron traps.
Figure 5.
Environment of the five oxygen atoms in the LYSO lattice (distances in Å): non-silicon bound O5 (a) and SiO4 tetrahedron (b). RE stands for Lu3+/Y3+ atoms and distances are a mean value of Lu-O and Y-O distances.
Figure 5.
Environment of the five oxygen atoms in the LYSO lattice (distances in Å): non-silicon bound O5 (a) and SiO4 tetrahedron (b). RE stands for Lu3+/Y3+ atoms and distances are a mean value of Lu-O and Y-O distances.
The scintillation mechanism occurring during XRL is first the trapping of a hole by Ce3+ forming temporary Ce4+, followed by the capture of a free electron resulting in Ce3+ in an excited state, noted (Ce3+)*. The latter de-excites radiatively giving a blue photon characteristic of the 5d1-4f transition. For TL, during the sample irradiation at low temperature, holes are trapped at Ce centers and electrons are trapped at oxygen vacancies. When the irradiation is stopped and the sample is being heated electrons progressively de-trap and recombine at Ce centers, leading to Ce3+ 5d1-4f emission.
The localization of the oxygen vacancies is an interesting question to understand the TL mechanism, since it was shown to be a thermally assisted tunneling process by Vedda
et al. [
12]. We propose that they are mainly created in the proximity to the doping RE ions. A first indication that vacancies are localized near the dopants comes from the fact that both Ce
3+ and Tb
3+ replace cations of smaller size (
i.e., Lu
3+ and Y
3+). A deformation of the lattice is thus expected and could be absorbed on shorter distances by the creation of vacancies around the dopant. Secondly, Clabau
et al. claim that anion vacancies tend to settle in the vicinity of the dopant ions due to efficient delocalization of their electronic density on the surroundings [
20]. This is explained by the lower ionization potential of Ce
3+ with respect to that of host cations Lu
3+ and Y
3+. Thus Ce
3+ has a tendency to attract anion vacancies in its surrounding. According to these arguments it seems reasonable to assume that oxygen vacancies are located close to the dopant ions. Nevertheless, vacancies in the very first coordination sphere of Ce
3+ are not expected. Indeed, Electron Paramagnetic Resonance studies on LSO:Ce by Pidol
et al. did not show any additional splitting for Ce
3+ (other than the two sites Ce
1 and Ce
2) as would be expected if an oxygen vacancy was located next to the dopant for some Ce
3+ ions [
10]. An oxygen vacancy in the first coordination sphere of Ce
3+ would lead to a perturbed EPR spectrum due to important changes in the orientation of the g tensor axes. Furthermore, as all O
5 are not equidistant from the RE sites, all V
O5 are not magnetically equivalent and additional splitting would be present. Another justification that oxygen vacancies are not located in the first coordination sphere of Ce
3+ is the unchanged luminescence characteristics. Otherwise, the local crystal field would be dramatically impacted and the emission would be red-shifted. Consequently, we propose that the introduction of Ce
3+ in the host lattice is accompanied by oxygen vacancies in its surrounding, but not as first neighbors. As electron tunneling in such materials is not expected to be efficient over distances >10 Å [
21], oxygen vacancies evidenced in TL must be located within a few interatomic distances from Ce
3+.
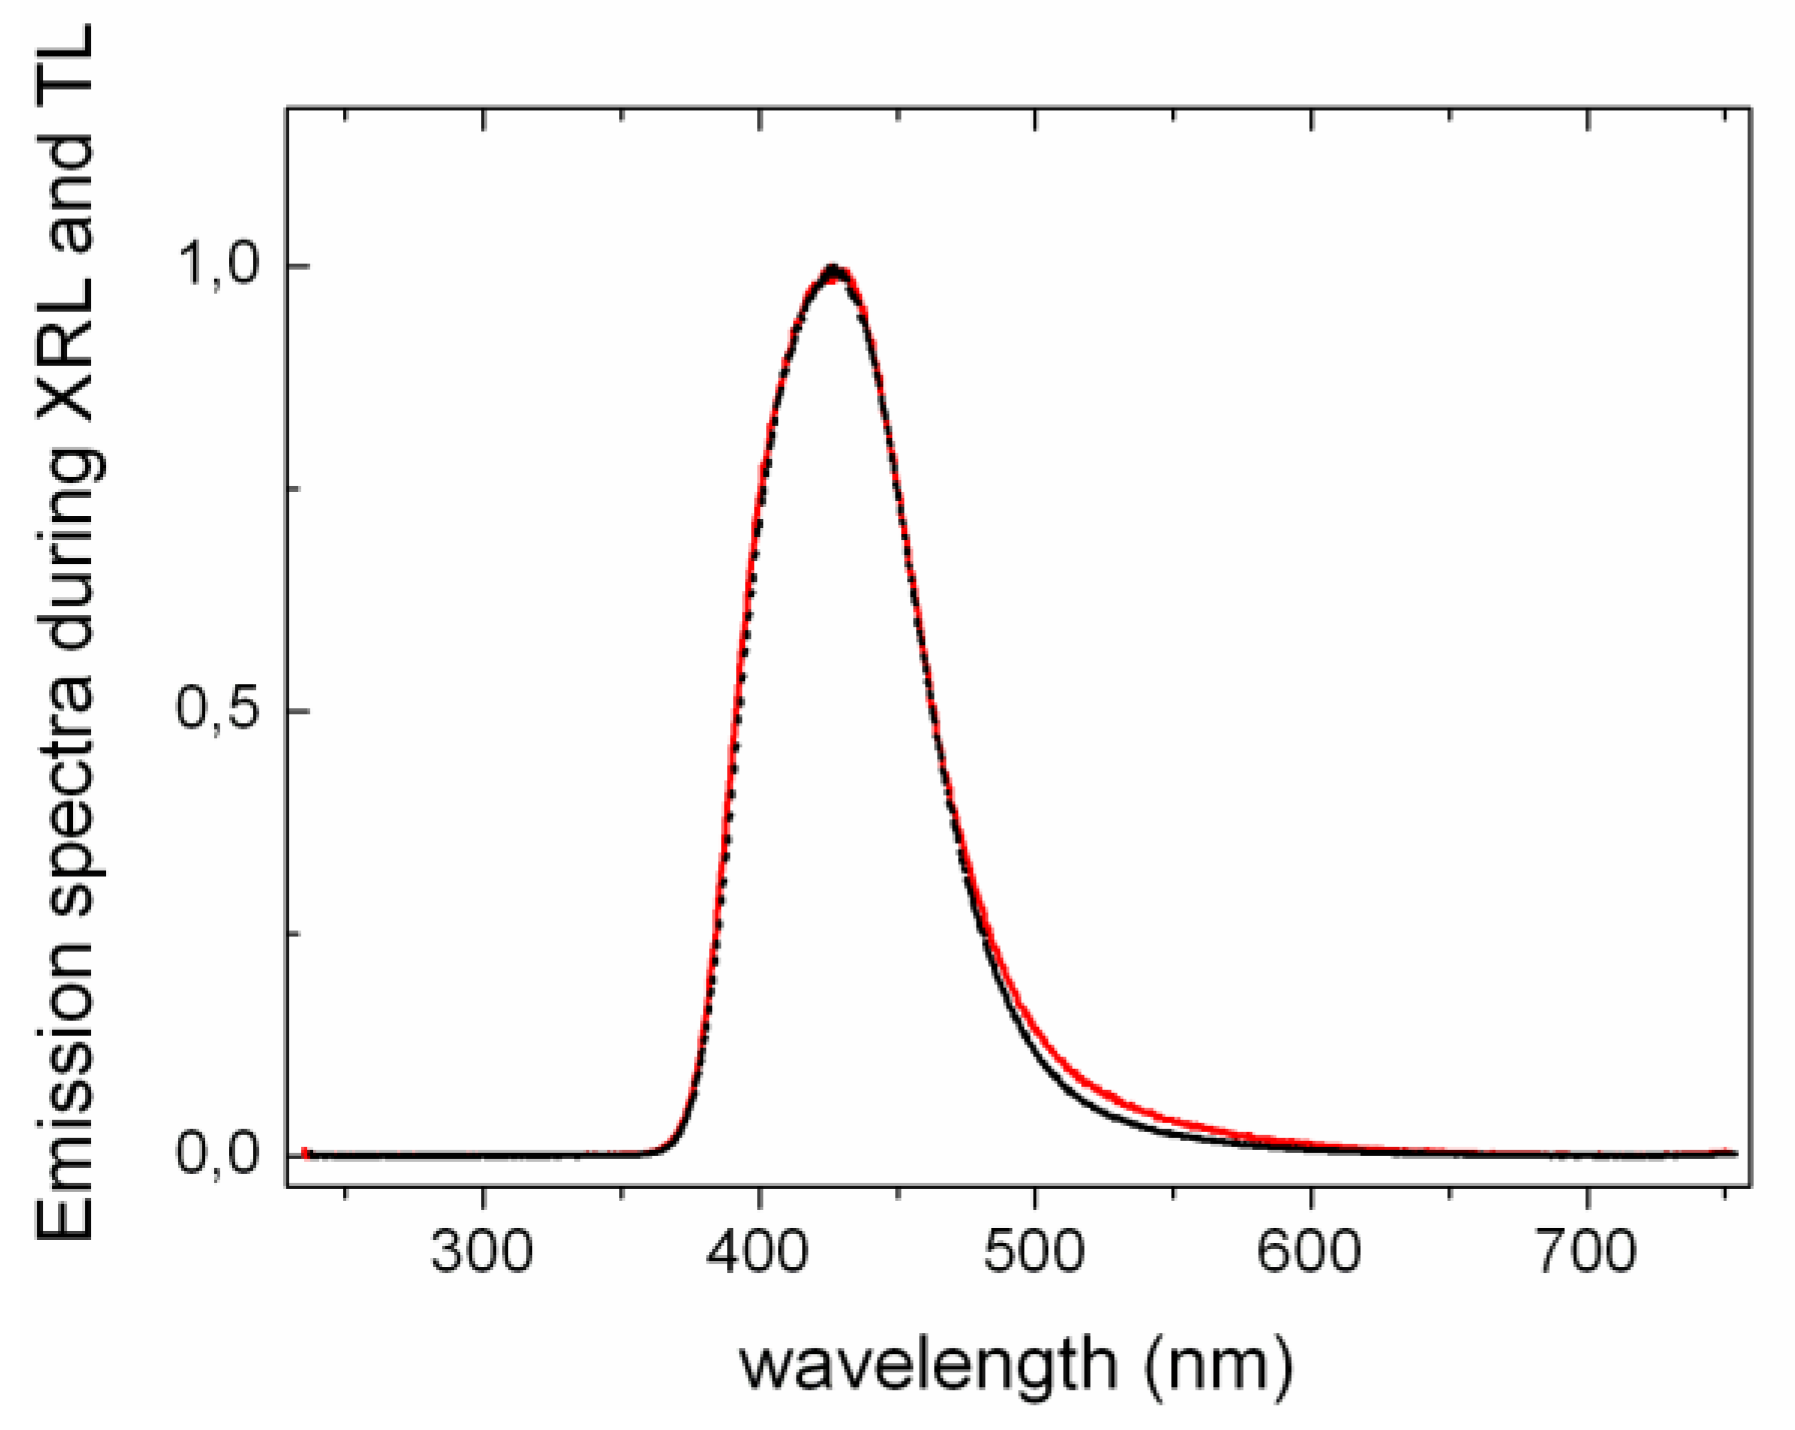
Furthermore it is interesting to compare the shape of TL and XRL emission spectra as depicted in
Figure 6 for LYSO:Ce. Assuming a thermally activated tunneling recombination as discussed in ref. [
12], TL is the consequence of electron detrapping in the neighborhood of the doping ions. On the contrary, XRL involves excitation of the luminescent centers via bandgap excitation and therefore originates from all Ce
3+ ions and not only those close to electronic traps
i.e., oxygen vacancies. Anionic vacancies around the dopant are expected to influence the local crystal field and therefore to affect the energy of the 5
d-4
f transitions. Nevertheless, as Ce
3+ 5
d-4
f transitions have a strong electron-phonon coupling, the small induced crystal field perturbations will hardly modify the emission spectrum. Consequently, XRL and TL emission spectra appear identical as shown in
Figure 6. This is also consistent with the identical emission spectra of LYSO:Ce during photoluminescence and radioluminescence obtained by Feng
et al. [
13].
Figure 6.
Normalized emission spectra of Ce-doped LYSO during TL (dashed black line) and XRL (continuous red line) measurements. All spectra were measured at 370 K. LYSO:Ce shows Ce3+ 5d-4f emission. The resolution is different due to larger slit opening during TL measurement.
Figure 6.
Normalized emission spectra of Ce-doped LYSO during TL (dashed black line) and XRL (continuous red line) measurements. All spectra were measured at 370 K. LYSO:Ce shows Ce3+ 5d-4f emission. The resolution is different due to larger slit opening during TL measurement.
It is difficult to estimate the amount of electron traps in our materials, even by integrating TL glow curves which underestimates this amount. Oxyorthosilicates with electronic trap density of 10
18 traps/cm
3 were shown to be efficient materials for storage devices [
22]. For PET application, this density is much lower, and 10
15–10
17 traps/cm
3 seems to be a reasonable approximation [
23]. If we only consider O
5 oxygens, which are believed to be the main sites of oxygen vacancies, the LYSO lattice contains 10
22 oxygen/cm
3. Thus considering 10
15–10
17 oxygen vacancies per cm
3 leads to one O
5 vacancy out of 10
7–10
5 O
5, which is a reasonable assessment for vacancy creation. Furthermore, by taking the example of Ce-doped LYSO with initial concentration of 0.22 at%, Glow Discharge Mass Spectrometry gives a final amount of 250 wt/ppm Ce in the crystal which corresponds to 10
18 Ce/cm
3. For each Ce with neighboring oxygen vacancies, the ones which participate to TL, we define a so-called close vicinity which contains the vacancies and which is in a radii of about 10 Å around the dopant.
The first part of this work gave strong arguments that oxygen vacancies are the main electronic defects in LYSO single crystals. These vacancies act as electron traps and may play different roles depending on their depth. Shallow traps (represented by TL peaks below RT) should have a negative impact on response time as they create intermediate steps for the charge carriers [
24]. Deeper traps (TL peaks above RT) are responsible for the important afterglow in LYSO:Ce but may also impact the light yield during the application. Indeed, thermal energy required to empty high temperature traps will not be reached at RT [
25]. Thus it is of primary interest to find efficient ways to reduce the amount of traps in LYSO,
i.e., to reduce the number of oxygen vacancies [
11,
26]. From an application point of view, CZ growth is the most efficient way to produce large LYSO pieces. FZ technique was used as a tool to experiment different growth atmospheres. The following results have been obtained on LYSO:Ce single crystals grown by CZ.
2.2. Effects of Annealing Treatments
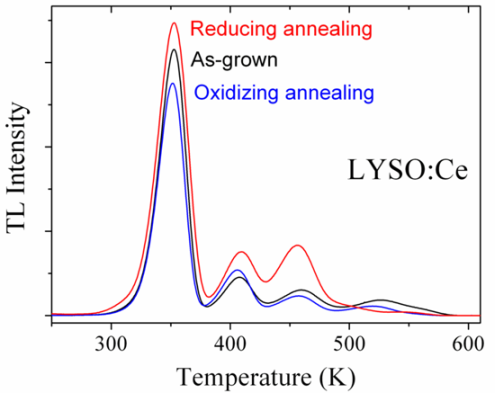
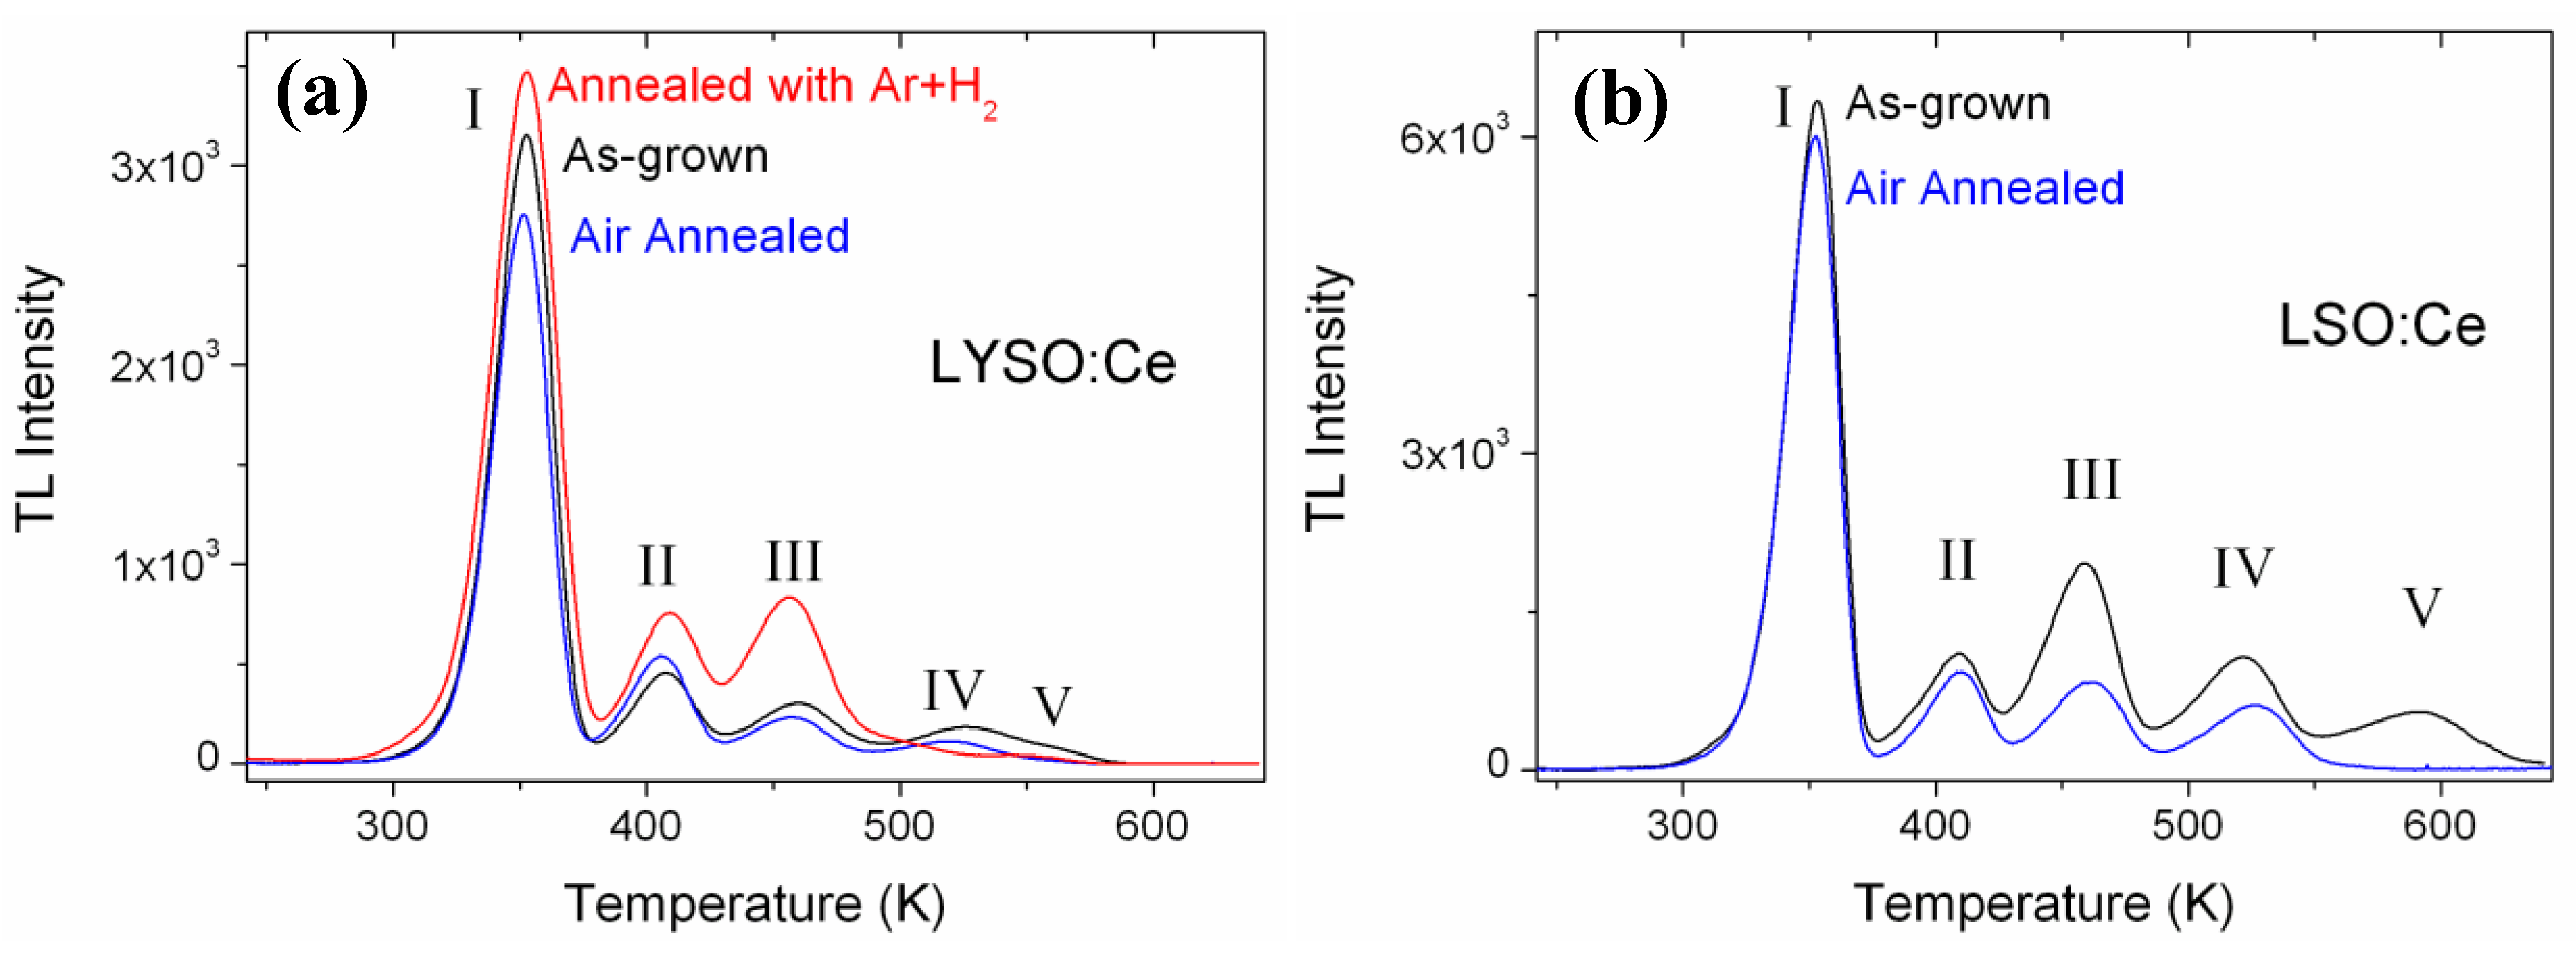
As oxygen vacancies were identified to be the main electron traps in oxyorthosilicates, the effect of annealing treatment was investigated. One 10 × 10 × 1 mm LYSO:Ce single crystal was annealed in air at 1,500 °C for 48 hours and characterized by TL. The comparison of its TL glow curve with that of an as-grown sample is shown in
Figure 7(a). Another crystal with the same geometry was annealed with Ar + 5% H
2 at 1,200 °C for 12 hours. The glow curves are not corrected for thermal quenching but all TL intensities are normalized to the sample surface and relative LO. For these three samples, the respective LO were measured to be 1 (as-grown crystal), 1.16 (after air annealing) and 0.85 (after reducing annealing).
We found an improvement of the LO after air annealing in line with the increase already reported for LYSO:Ce by Chai
et al. [
27]. Here the decrease of the LO with the reducing treatment is explained by the increase of oxygen vacancies that are either quenching centers or deep traps centers. TL measurements reveal that the sample annealed in a reducing atmosphere shows more TL intensity, except for peaks IV and V. More oxygen vacancies are therefore created with an additional treatment in reducing conditions. On the contrary, the air annealed sample shows less TL intensity, except for peak II at 410 K. However, the reduction of the TL intensity following air annealing is rather weak. As a comparison, larger annealing effect is observed for peaks II to V in LSO:Ce (shown in
Figure 7(b)). It seems that the reduction of oxygen vacancies is more efficient in LSO:Ce than in LYSO:Ce sample. The decrease of TL in LSO:Ce is in agreement with the data reported by Ding
et al. [
28], where a TL decrease of about 40% was observed for a LSO:Ce crystal annealed in air at 1,400 °C for 10 h. The greater decrease of TL in LSO:Ce compared to LYSO:Ce may be explained by a more important initial defect concentration as peak II to V were more important relatively to peak I in the LSO sample. Hence the improvement that can be obtained by an air annealing treatment is greater when defects are initially more important, whatever the nature of the host (LSO or LYSO).
Figure 7.
TL glow curves of: (a) LYSO:Ce single crystals as-grown, after reducing annealing and after air annealing; (b) LSO:Ce as-grown and after air annealing. For comparison, all TL intensities are normalized to the sample surface and to their respective light output.
Figure 7.
TL glow curves of: (a) LYSO:Ce single crystals as-grown, after reducing annealing and after air annealing; (b) LSO:Ce as-grown and after air annealing. For comparison, all TL intensities are normalized to the sample surface and to their respective light output.
One particular point is important to notice concerning peak V in
Figure 7(b). Although the corresponding traps are emptied at the highest temperature (580–600 K), they are the first defects to disappear following air annealing. We have also observed that air annealing at lower temperature (1,200 °C) is sufficient to suppress peak V without impacting any other peak. The analogy can also be made with FZ grown samples where peak V only appears when no oxygen is present in the growth atmosphere (100% Ar). This can be explained as follows. From a kinetic point of view, traps corresponding to peak V require the highest energy to be emptied (TL), but from a thermodynamic point of view they are the less stable as they disappear easily with annealing. Dorenbos
et al. [
17] and Vedda
et al. [
12] proposed a thermally activated tunneling trap-to-center mechanism for TL in LSO:Ce. The defects being of same nature (
i.e., oxygen vacancies), each trap has the same energy depth, but differs from the others by its frequency factor that is related to the trap-to-luminescent center distance as discussed above. Consequently the highest temperature peaks correspond to the oxygen vacancies at the longer distances from the Ce
3+ center. Hence we found that vacancies close to Ce
3+ (lower temperature TL peaks) will hardly diffuse out of the lattice during annealing due to important constraints and stabilization by Ce
3+ electronic delocalization. On the contrary, vacancies at longer distances from Ce
3+ (higher temperature TL peaks) will be the first ones to disappear during oxidizing annealing. Peak V is the perfect example, but we have also observed this effect for the other peaks. In a recent work [
12] it was proposed that peak V is only visible in LYSO, while LSO only displays four TL peaks. Here we show that this is not the case. The presence of a peak V in orthosilicates (LYSO, LSO, YSO) is rather correlated to the history of the crystal. Peak V is missing if the crystal is grown with enough oxygen, as for FZ grown samples with 1.4%, 21% and 100% oxygen. For CZ grown samples where very low oxygen content is required, oxidizing post-treatment allows filling oxygen vacancies corresponding to peak V. TL is thus also an efficient tool to determine whether or not a crystal has been annealed in an oxidizing atmosphere.


 ) and fitting curves (—) of (a) LYSO:Ce and (b) LYSO:Tb samples. Each curve is fitted with five 1st order kinetic peaks.

