The Hardness and Strength Properties of WC-Co Composites


Center for Energetic Concepts Development, Department of Mechanical Engineering, University of Maryland, College Park, MD 20742, USA
Materials 2011, 4(7), 1287-1308; https://doi.org/10.3390/ma4071287
Submission received: 8 June 2011
/
Revised: 4 July 2011
/
Accepted: 6 July 2011
/
Published: 14 July 2011
(This article belongs to the Special Issue Hard Materials: Advances in Synthesis and Understanding)
Abstract
:The industrially-important WC-Co composite materials provide a useful, albeit complicated materials system for understanding the combined influences on hardness and strength properties of the constituent WC particle strengths, the particle sizes, their contiguities, and of Co binder hardness and mean free paths, and in total, the volume fraction of constituents. A connection is made here between the composite material properties, especially including the material fracture toughness, and the several materials-type considerations of: (1) related hardness stress-strain behaviors; (2) dislocation (viscoplastic) thermal activation characterizations; (3) Hall-Petch type reciprocal square root of particle or grain size dependencies; and (4) indentation and conventional fracture mechanics results. Related behaviors of MgO and Al2O3 crystal and polycrystal materials are also described for the purpose of making comparisons.
1. Introduction
Previously, Armstrong and Cazacu [1] have presented an analysis of the hardness and indentation fracture mechanics (IFM) properties reported for a number of WC-Co materials and as related to comparative measurements made on alumina materials. Use was made of a continuum mechanics description of cracking with an associated plastic zone at the crack tip and, which analysis when combined with a Hall-Petch (H-P) description of an inverse square root of grain size dependence for the crack-free fracture stress, provided a relationship for the combined effects of crack size, grain size and plastic zone size on measurements of the fracture mechanics stress intensity, KC:
KC = σK[πc]1/2 = α'Ks1/2[σ0C + kCℓ−1/2]
In Equation (1), σK is the applied stress, c is an appropriate pre-crack size, α'K is a numerical factor that is equal to (8/3π) for the mode I, plane strain, fracture mechanics stress intensity, K1c; s is the plastic zone size at the crack tip; σ0C is the friction stress for dislocation movement within a crack-initiating dislocation pile-up; kC is the corresponding pile-up stress intensity; and, ℓ is the effective material grain size [2].
In the present article, the hardness and strength properties of the WC-Co system are further reviewed with regards to the background plasticity and cracking measurements leading to the application of Equation (1) to the fracture mechanics properties of a number of WC-Co materials. Elastic, plastic and cracking measurements are presented on a hardness stress-strain basis for alumina crystals and polycrystals and, especially, these same type measurements made on MgO crystals are also described with regard to the thermally-activated viscoplastic properties of dislocations and their role in crack initiations. In this regard, MgO, which is an important “ductile ceramic” whose dislocation mechanics based deformation and cracking behaviors have been extensively investigated, provides a useful connecting link with the somewhat lesser known deformation and cracking properties of Al2O3 crystals and even less so of WC crystals; see, for example, the review article on ceramic crystal deformations in Dislocations in Solids [3].
2. Hardness Stress-Strain Measurements
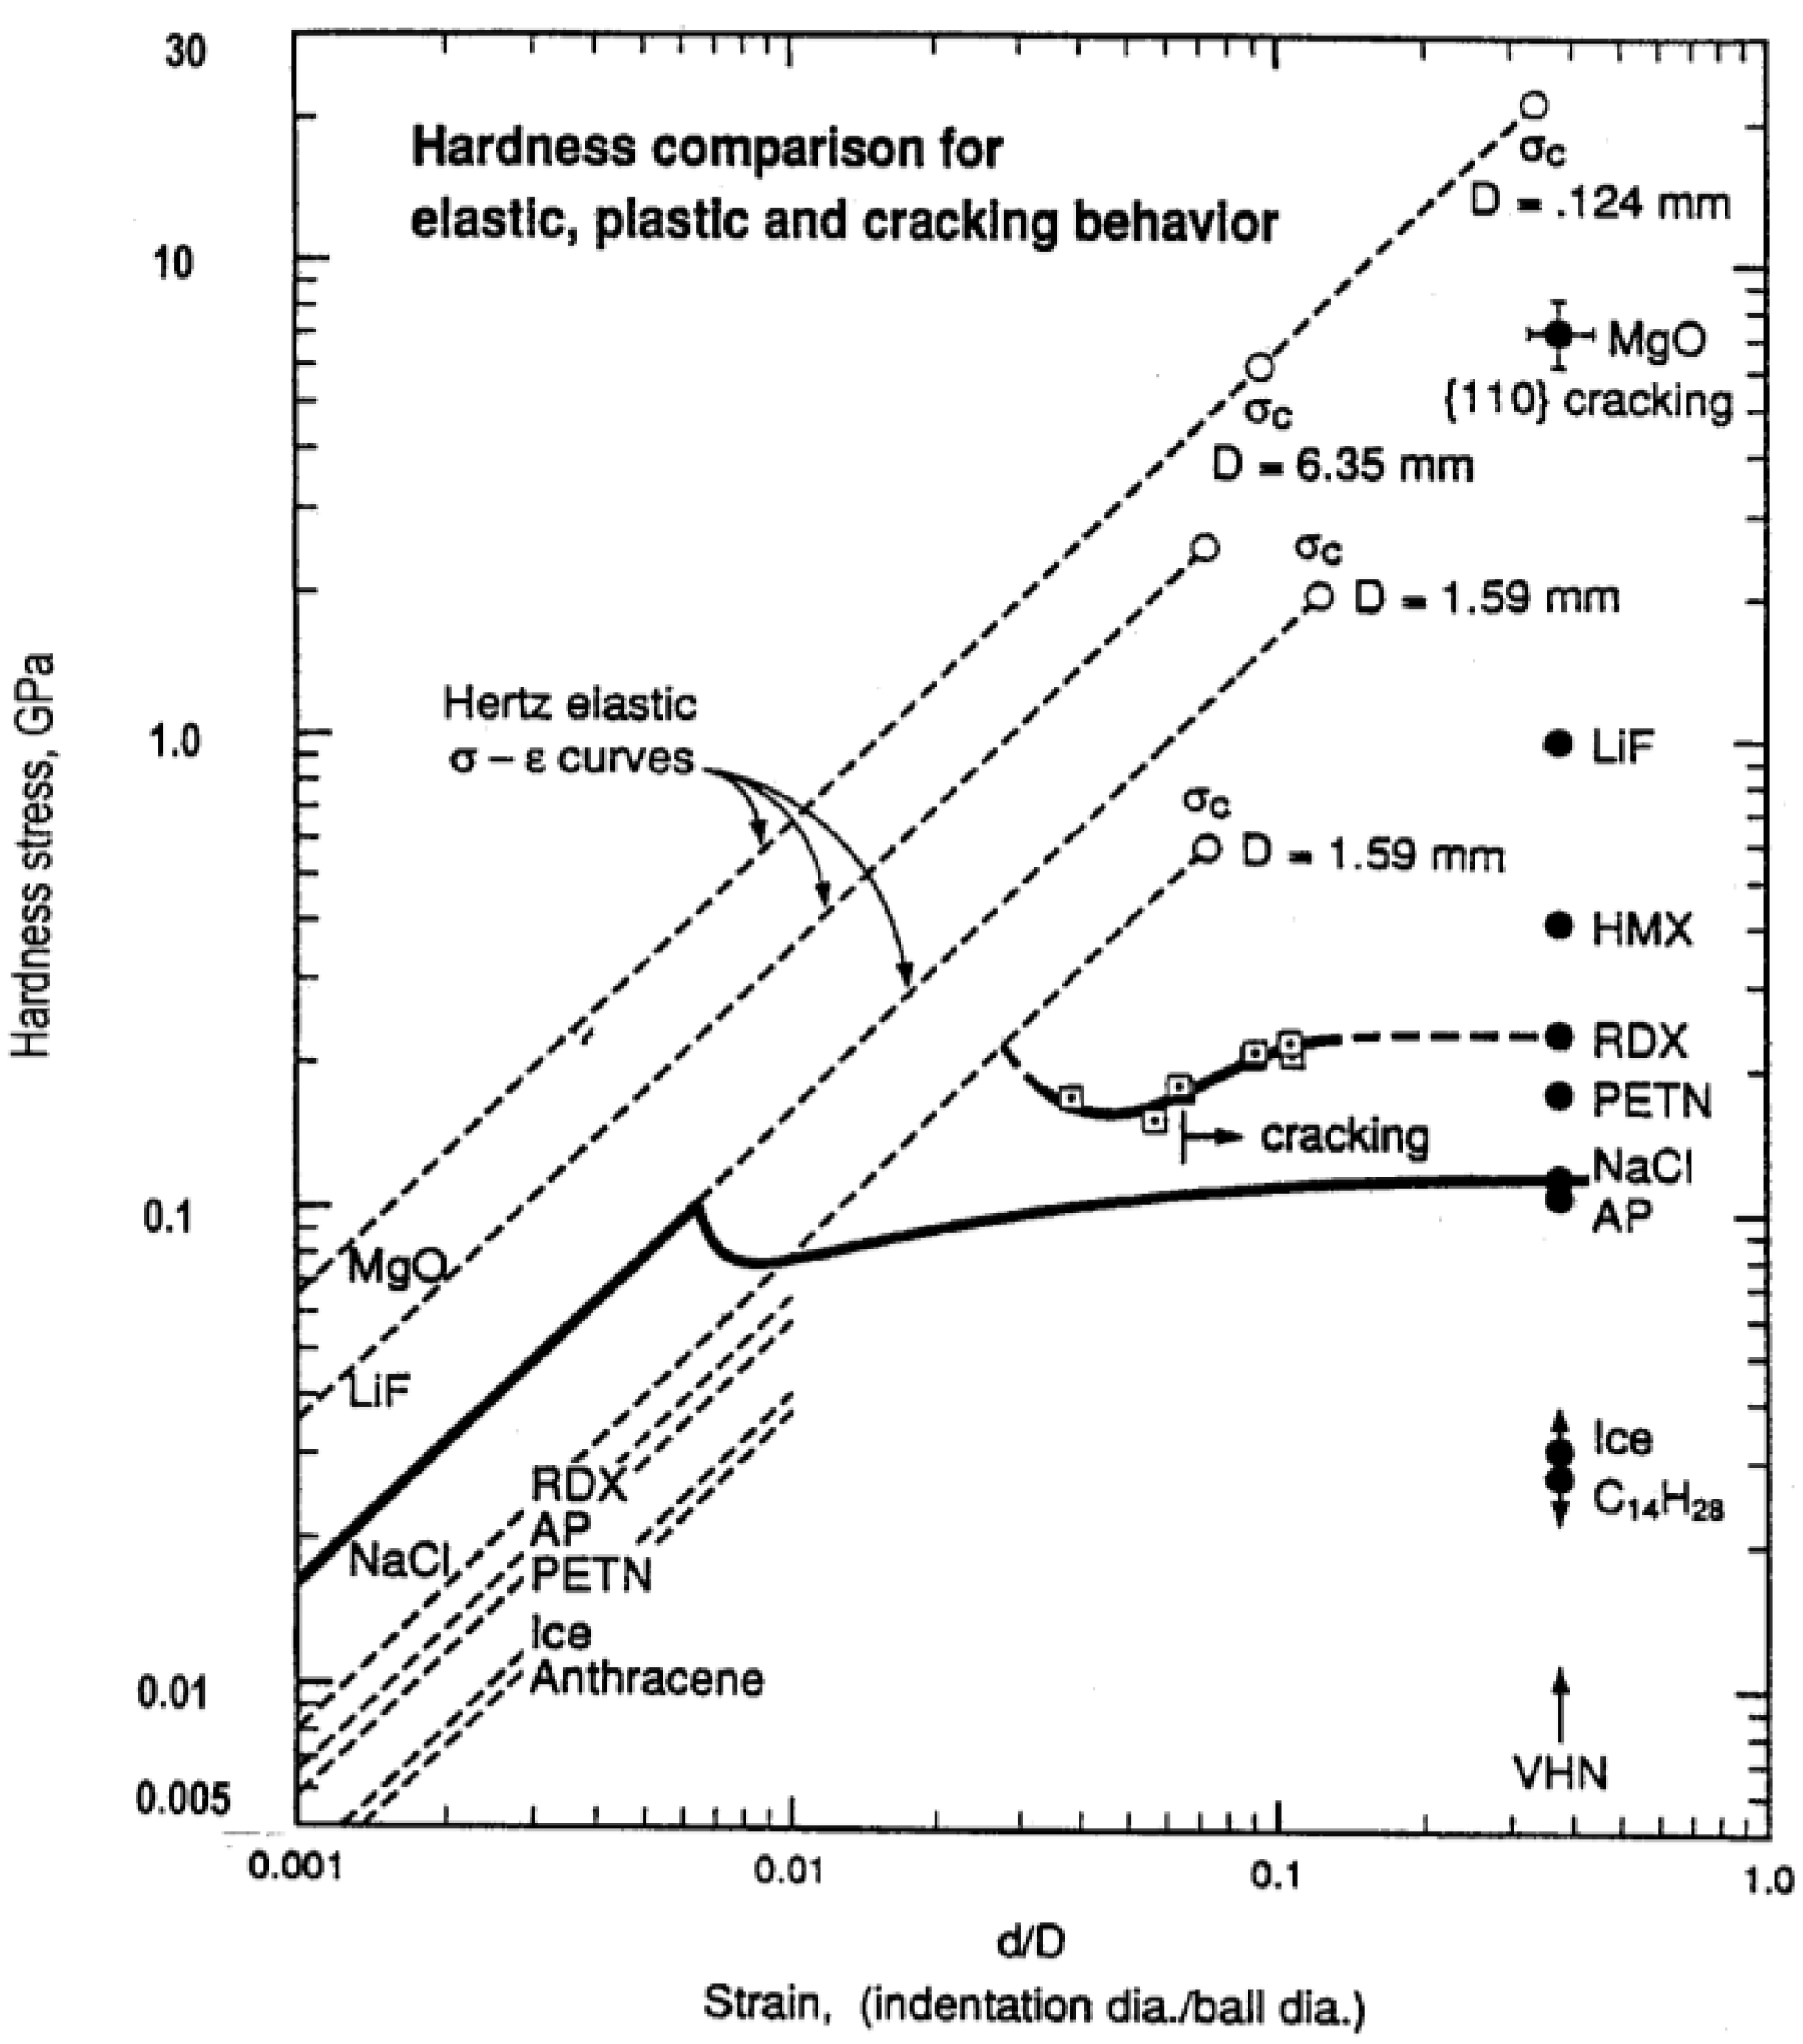
To start, Figure 1 shows a comparison of the hardness properties of MgO crystals relative to the hardness properties of a number of other ceramic-like energetic crystals and of several other generally “softer” crystals [4].
Figure 1.
Elastic, plastic, and cracking hardnesses compared on an effective stress-strain basis for MgO and related crystals [4].
Figure 1.
Elastic, plastic, and cracking hardnesses compared on an effective stress-strain basis for MgO and related crystals [4].

In Figure 1, the hardness stress is expressed as the mean pressure on a surface-projected contact area of diameter, d, obtained under a spherical ball indenter having diameter, D. The effective strain is expressed as (d/D). The hardness stress under load may be determined for elastic loading by measuring the penetration depth, he, and determining de in accordance with the relationship de = [2heD]1/2. For plastic straining, d = 2[h(D − h)]1/2, that is determined on the basis of the ball being rigid, and for which d is observed to be unchanged during unloading, at least, for d > de.
The solid and dashed linear dependencies of hardness stress, σH, on (d/D) are given in Figure 1 as determined from the Hertz relation
σH = (4/3π){[(1 − νS2)/ES] + [(1 − νB2)/EB]}−1(de/D) = (4/3π)Er(de/D) = (4/3π)Er(2he/D)1/2
In Equation (2), νS, ES and νB, EB are the Poisson’s ratio and Young’s modulus for the specimen and ball, respectively. In Figure 1, νB and EB were taken as 0.28 and 204 GPa, respectively, for a steel ball indenter for both the dashed lines and the linear part of the continuous loading curve shown for the NaCl crystal result. The last equality in Equation (2) involving he, establishes a direct determination of σH in a continuous loading curve obtained with a nanoindentation tester for which D can have been measured separately or determined by fit to the measured curve of displacement dependence on the applied load. In Figure 1, diamond pyramid hardness test results are plotted for the listed materials at a representative value of (d/D) = 0.375. At the terminal values of a number of the Hertz-type lines, various points are identified, with associated D values, for the cracking stresses, σC, determined on an indentation fracture mechanics (IFM) basis from the relationship:
σC = {4ESγ'/[πD(1 − νS2)(κ12 + κ22)]}1/2(d/D)−1/2
In Equation (3), γ' is the crack surface energy and the dimensionless factor (κ12 + κ22) = 2.5 × 10⁻⁵, as described for indentation fracture mechanics measurements made on silicon crystals [5]. For the terminal dashed line of the MgO crystal, the D = 0.124 mm value was determined from the average indentation diagonal length of the diamond pyramid indentations. For the dashed MgO line, νS was taken as 0.181 and ES, as 312 GPa.
The usefulness of Figure 1 is demonstrated in one case by the comparison of adjacent Hertzian lines and indentation measurements that are shown for NaCl and RDX (cyclotrimethylenetrinitramine) crystals. The comparison reveals that RDX is relatively compliant in its elastic deformation while being plastically hard and, because of its lower σC value, brittle. The respective characteristics are explained for RDX in terms of its molecular bonding, difficulty of dislocation motion, and lower surface energy for cracking. On the basis of such results, the plastic flow of crystals cannot be gauged in terms of a constant ratio of hardness and elastic modulus. Another consideration to be noted for the plotted MgO and RDX crystal results is that cracking has occurred at lower plastic hardness values than the elastic IFM value; and this occurs because of the role of dislocation pile-ups in initiation of cleavage cracking [6]. More is to be said about this in the present review. For MgO, the close proximity of the Hertzian elastic loading curve to the plastic indentation measurements enables the understanding of the exaggerated shapes shown in residual diamond pyramid indentations that, for example, are concave-shaped when the indenter sides are aligned parallel to <100> directions on an (001) crystal surface and have a convex shape for <110> aligned indenter sides [7].
3. Hardness Comparisons of MgO, Al2O3 and WC Crystals
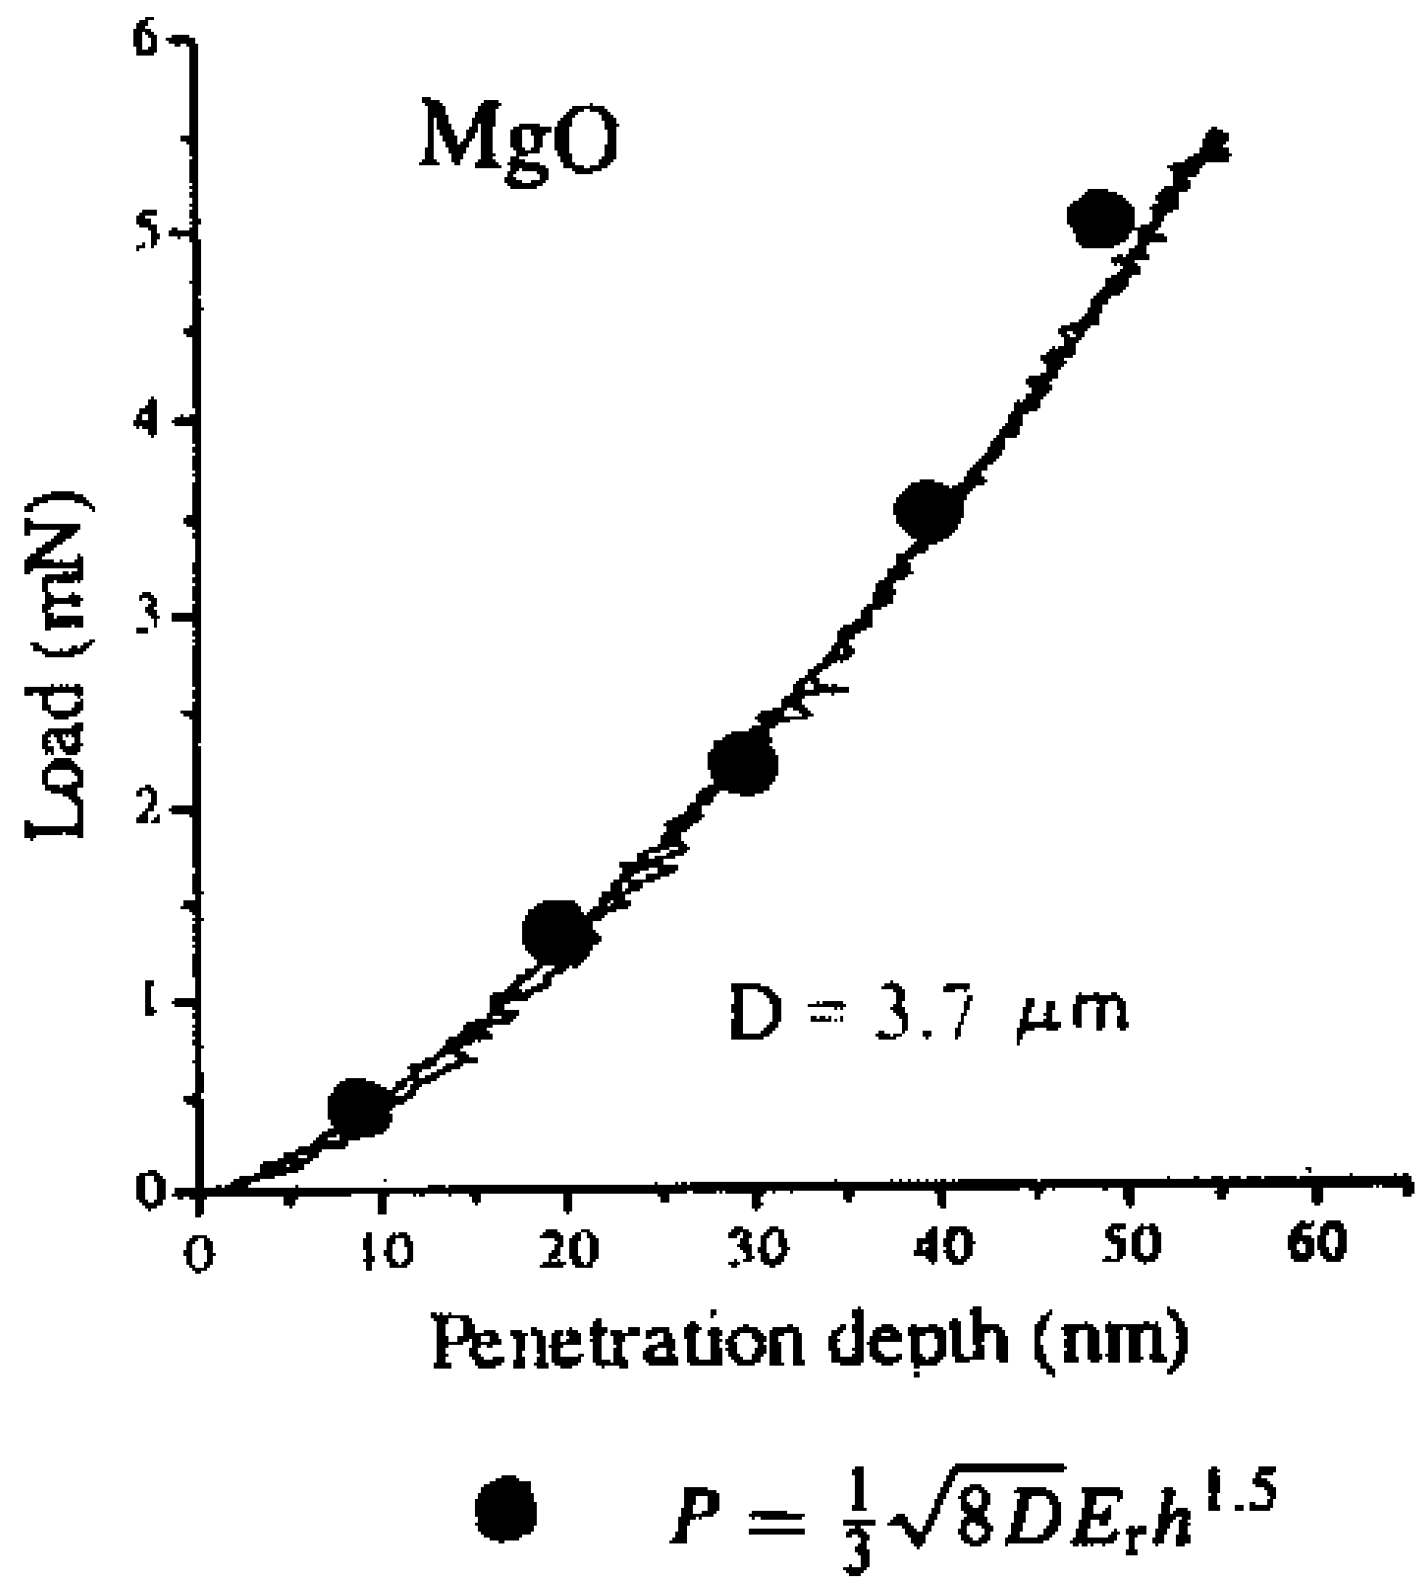
An important advantage of the load and displacement sensitivities of modern nanoindentation hardness testers is that the initial material elastic deformation responses of the type indicated in Figure 1 are able to be easily measured in a continuously recorded load-deformation curve.
In Figure 2 and Figure 3, νB and EB were taken as 0.068 and 1145 GPa for a diamond indenter. As shown in the legend within Figure 2, the MgO elastic curve was fitted with a relatively large value of D = 3700 nm. For the Al2O3 result in Figure 3, D was reported as 408 nm and νS and ES were taken as 0.235 and 425 GPa, respectively. Otherwise, in any test in which D would be measured separately, as was done for macro-scale continuous indentation measurements made on lignin and solid and porous aluminum materials, estimations could be made of νS and ES values.
Figure 2.
The load/unload response of an indented (001) MgO crystal surface [8] and points fitted to the listed Hertzian relation for load and penetration depth [9].

Figure 3.
The elastic load/unload response of an indented (0001) Al2O3 crystal surface [10].
Figure 3.
The elastic load/unload response of an indented (0001) Al2O3 crystal surface [10].
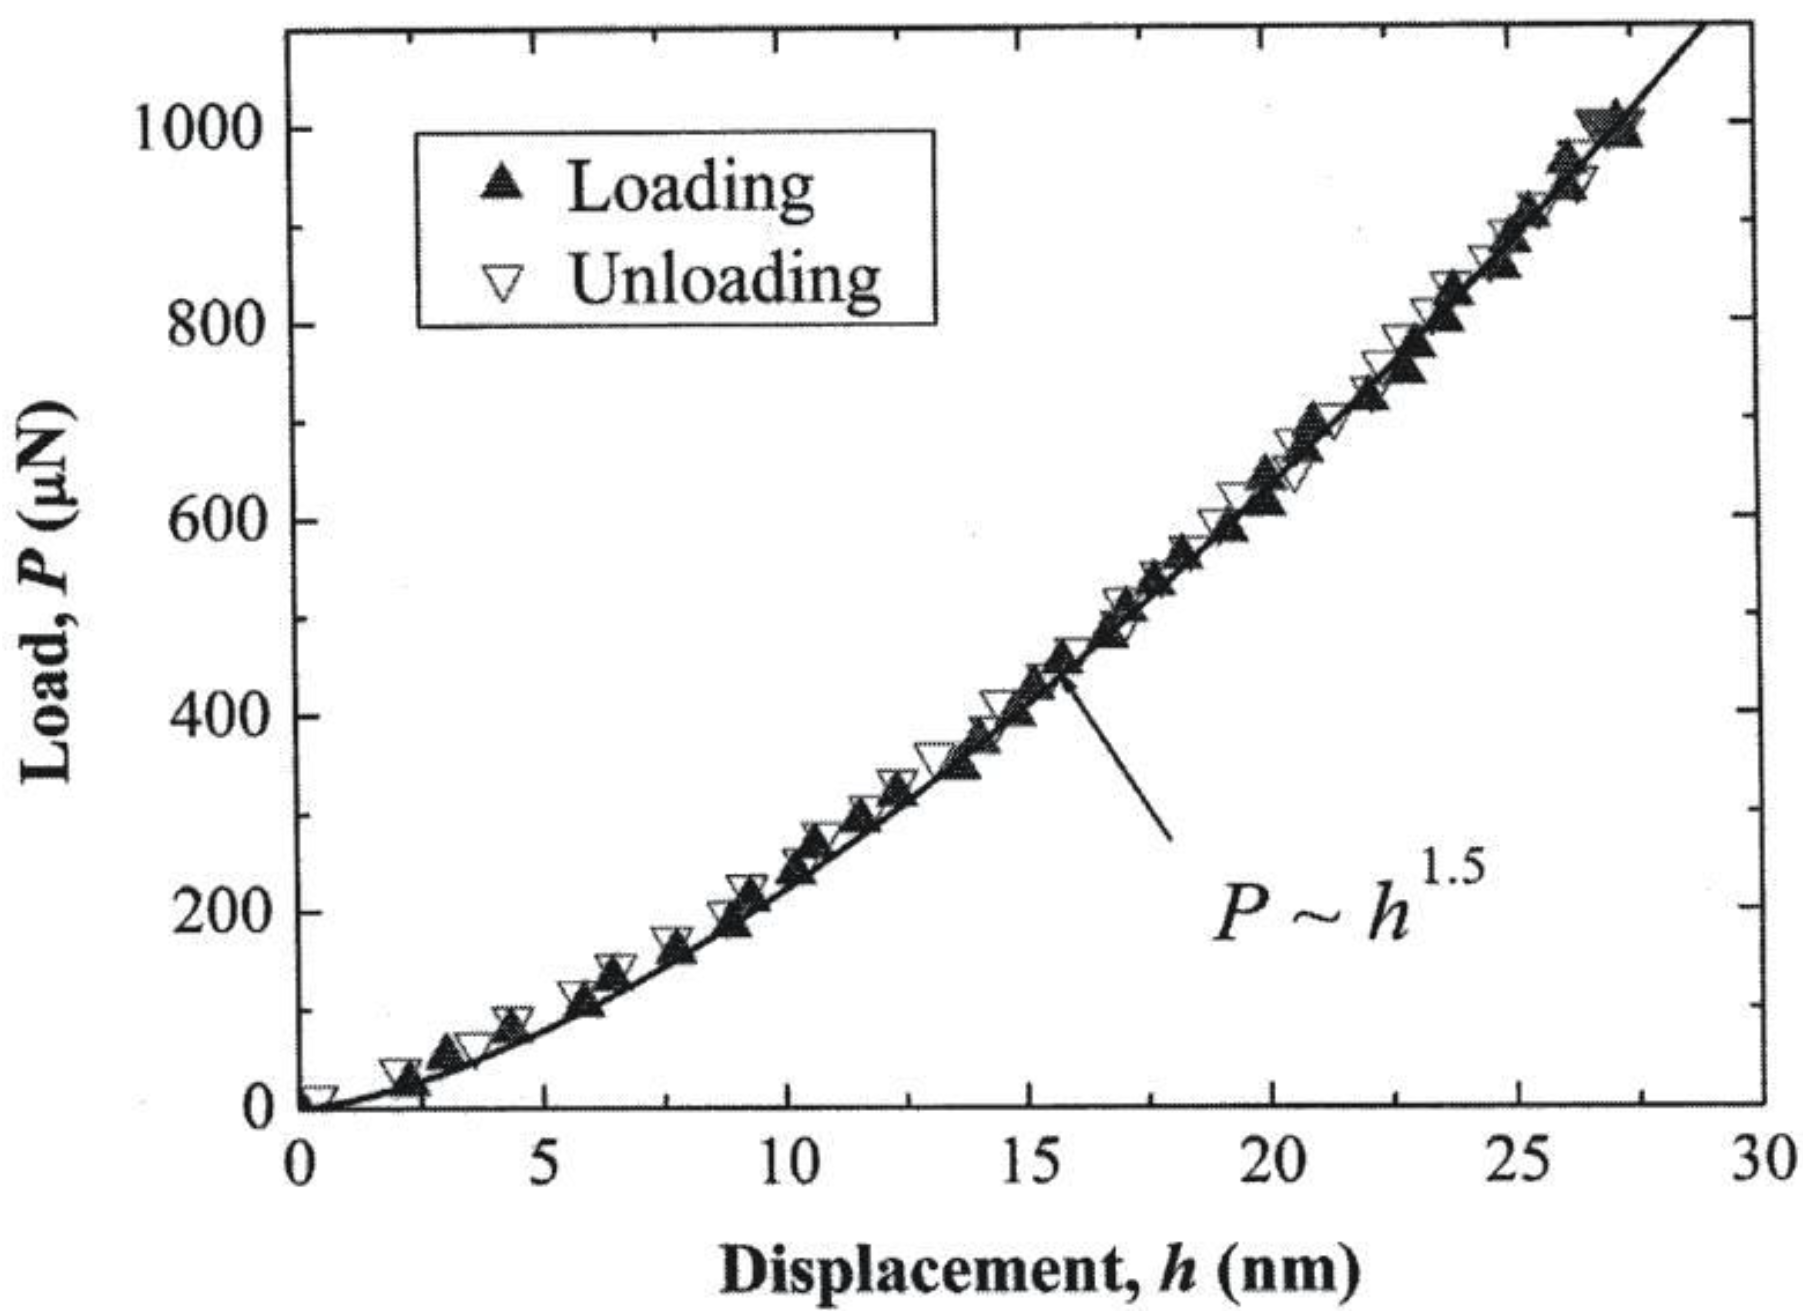
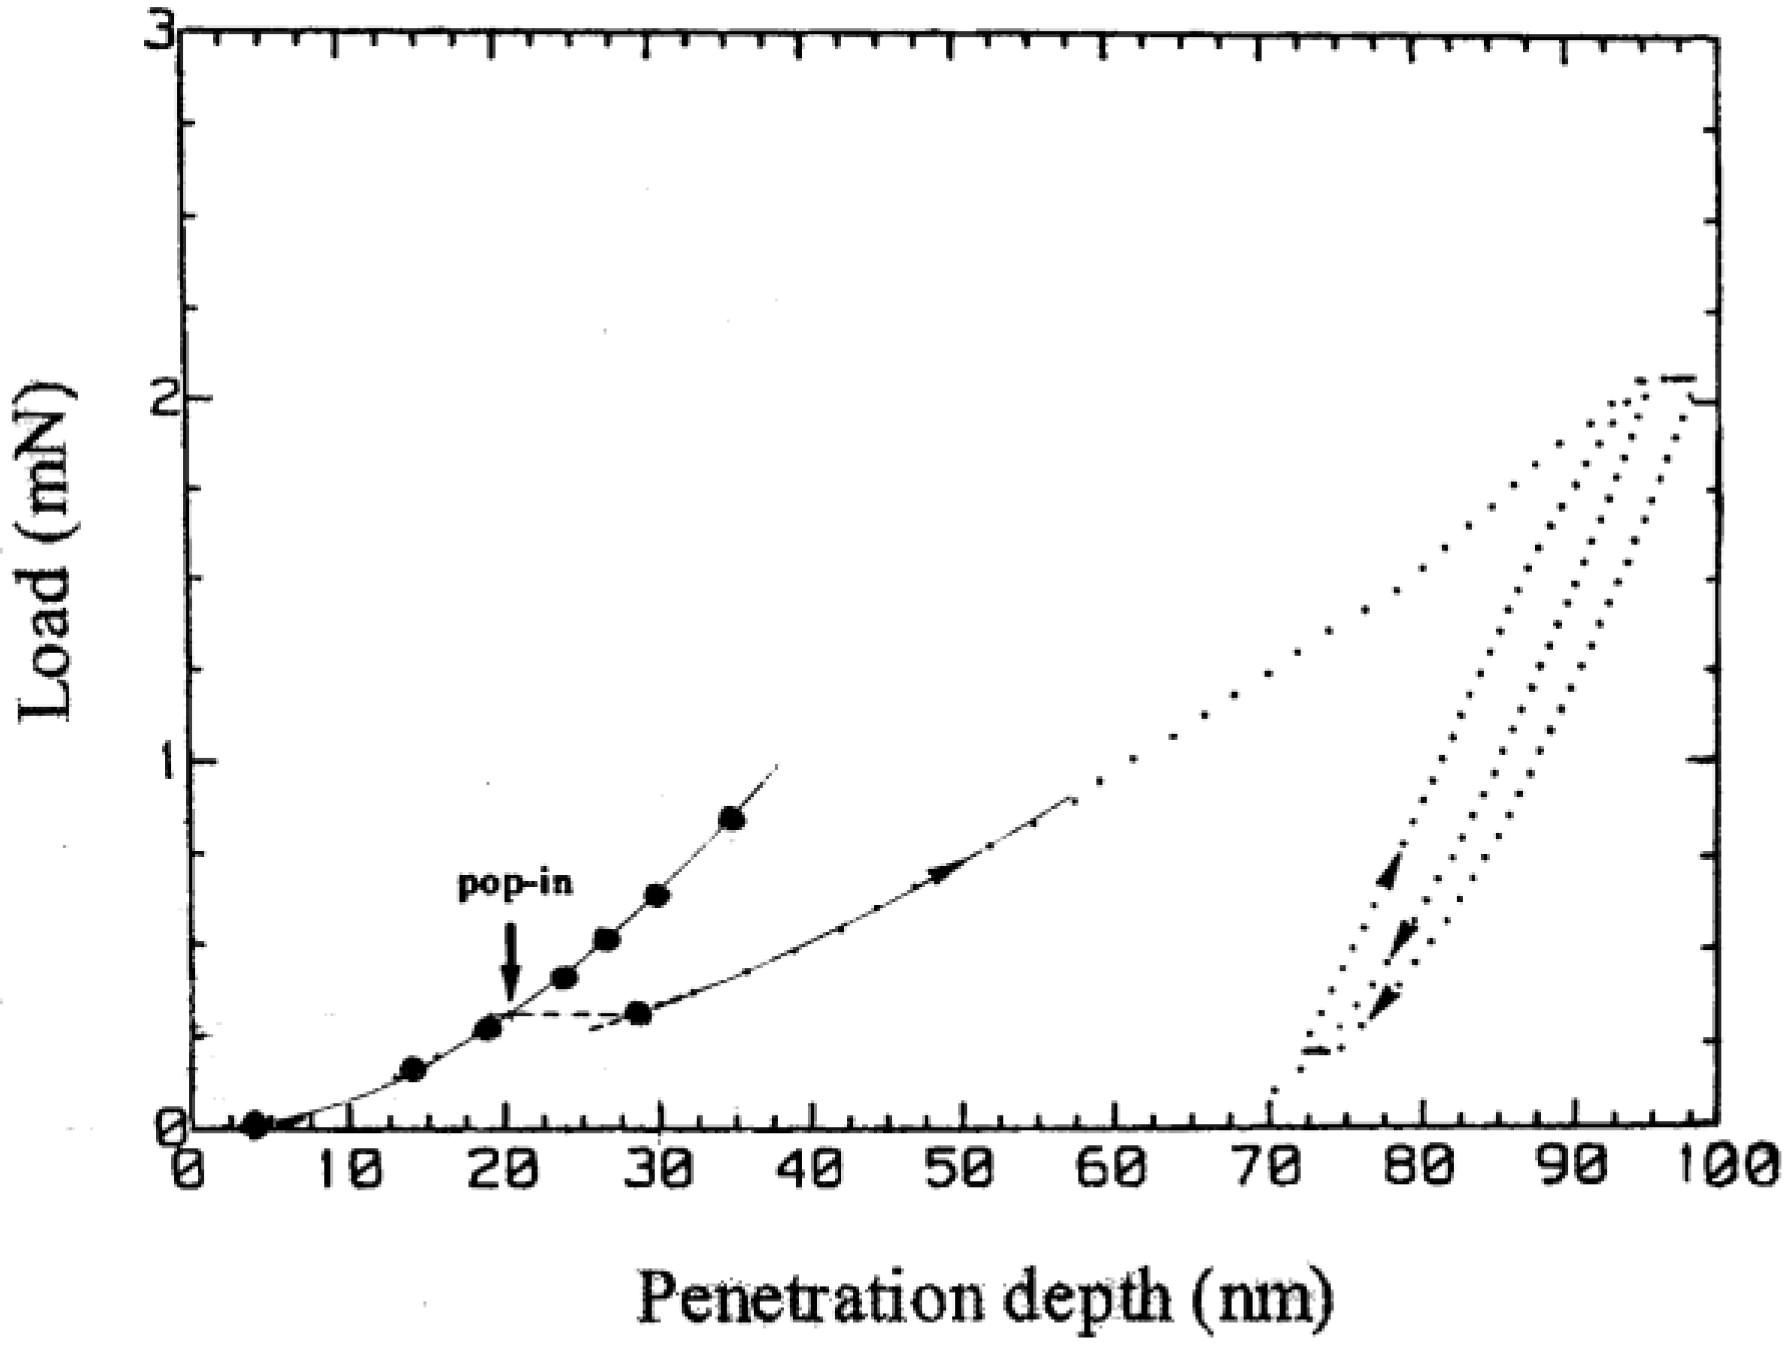
The totally elastic nanoindentation result in Figure 3 compares favorably with an earlier description of the elastic portion of a similar test result on an Al2O3 crystal that was carried into the plastic regime [9,11,12] Figure 4 shows the elastic fit applied to one such loading curve reported for another indented MgO (001) crystal surface [13,14]. In this case, D was determined to be much smaller at 400 nm compared to that determined for the separately reported elastic result in Figure 2. The consequence of the different D values on the two overall loading curve results is easily discernable in the plastic deformation and unloading results, for example, in exhibiting a much steeper unloading curve after plastic deformation for the smaller D curve [14]. Thus, by comparison of the two MgO curves shown here, a much greater (d/D) strain is achieved at the same penetration depth with a smaller D.

The characteristic “pop-in” displacement for initiation of plastic flow is well-marked in Figure 4, and, furthermore, the ensuing continuation of the deformation curve is associated with the lesser dependence of load on penetration depth during the progress of plastic deformation. On the other hand, the unloading and reloading curves illustrate the essentially elastic deformation behavior associated with the flattening or re-indentation occurring at the base of the residual plastic indentation. Figure 5 shows the effective MgO stress strain curve determined for the combined elastic and plastic behavior in Figure 4. In this case, beginning from the onset of plastic deformation signaled by the pop-in displacement, the total h measurement is taken to be given by the rigid ball result.
The linear Hertzian and subsequent plastic deformation segment shown in Figure 5 for MgO applies for the initial elastic loading curve of Figure 4. The dashed load drop segment applies for the pop-in displacement and the follow-on solid curve for increase in hardness stress with increase in deformation, now from a yielded lower hardness level, corresponds to the full extent of the loading curve measurement in Figure 4 taken to the point of unloading at (d/D) = 0.83. The open circle point with indicated limits for typical values of microhardness measurements on MgO crystals and generally involving {110} cracking is the same point shown in Figure 1. The occurrence of higher plastic hardness values for the nanoindentation test result of Figure 4 are typically characterized as an “indentation size effect”, ISE, that occurs for hardness indentations made at smaller contact dimensions. The ISE is associated with the observation that the nucleation and propagation of dislocations and cracks depend on their effective size-scales and distributions, especially at sub-micron dimensions.
More limited hardness results are shown in Figure 5 for the Al2O3 and WC hardness stress-strain results but the points that are shown have their own interesting characteristics for comparison with the MgO results. For the Al2O3 stress-strain result, the solid elastic line extending to the top triangular point, covers the recorded deformation up to the onset of pop-in deformation and was determined from the reported elastic loading measurements [10]. The lower (solid) triangular points are hardness measurements selected from a larger number of plastic hardness values reported in the same investigation. The reported measurements, obtained with a Berkovich (triangular) indenter system and plotted here at a (d/D) value of 0.42, were calculated by performing load/unload measurements at various points along the plastic deformation curve and utilizing an effective plastic area function importantly adjusted for the elastic unloading. Such results are to be compared with the open triangle point, which is a representative hardness value of 2700 kgf/mm2 that has been reported for the conventional diamond pyramid microhardness of Al2O3 crystals [15], and thus is in reasonable agreement with expectation of the ISE effect. An extreme ISE effect or difficulty in accounting for the true indenter tip geometry would seem to be required in order to explain in-situ nanoindentation hardness values of 150–170 GPa for the WC phase and 20–40 GPa for the Co binder phase in a WC-Co composite material [16].
Figure 5.
Comparative hardness stress-strain dependencies for MgO [4,13], Al2O3 [10,15] and WC [15,17] crystals; in the latter case, only reference crystal (open square) and Hall-Petch type (filled square) micro-hardness values are plotted for comparison with the dashed Hertzian line.

In Figure 5, the (left-side) WC hardness results have been shifted so as to provide clarity for the dashed Hertzian line and the associated hardness points. In this case, the open square point is a representative diamond pyramid hardness value of 1630 kgf/mm2, also obtained from reference [15] (p. 134). The other (solid) square points have a quite different origin that relates to the main purpose of the present review. These points were determined in accordance with the following H-P type of hardness relation that was utilized to quantitatively account for the hardness properties measured for WC crystal or grain constituents in the WC-Co composite system [17]:
H = H0 + kHd−1/2
In the H-P model description of Equation (4), H0 is taken as an average hardness for a WC crystal particle over all possible orientations, kH is the hardness microstructural stress intensity for breakout of a slip band stress concentration from within an average WC particle, and d is the average diameter of a particle. The value of H0 = 1382 kgf/mm2 plotted in Figure 5 from the reported H-P measurements compares favorably with the reported conventional microhardness measurement. As will be subsequently reviewed here, the higher hardness values plotted in the figure correspond to hardness determinations obtained from Equation (4) with kH = 23.1 kgf/mm2 and indicated particle sizes of 1.0 and 0.3 µm. A comparison of the conventional hardness measurements for WC and Al2O3 shows that the ambient temperature hardness of WC is lower—but that is not the full story! As will be seen below, issues of single crystal versus polycrystal plasticity and a role for Hall-Petch type grain size dependencies are to be involved.
4. Dislocation Mechanics and Thermal Activation
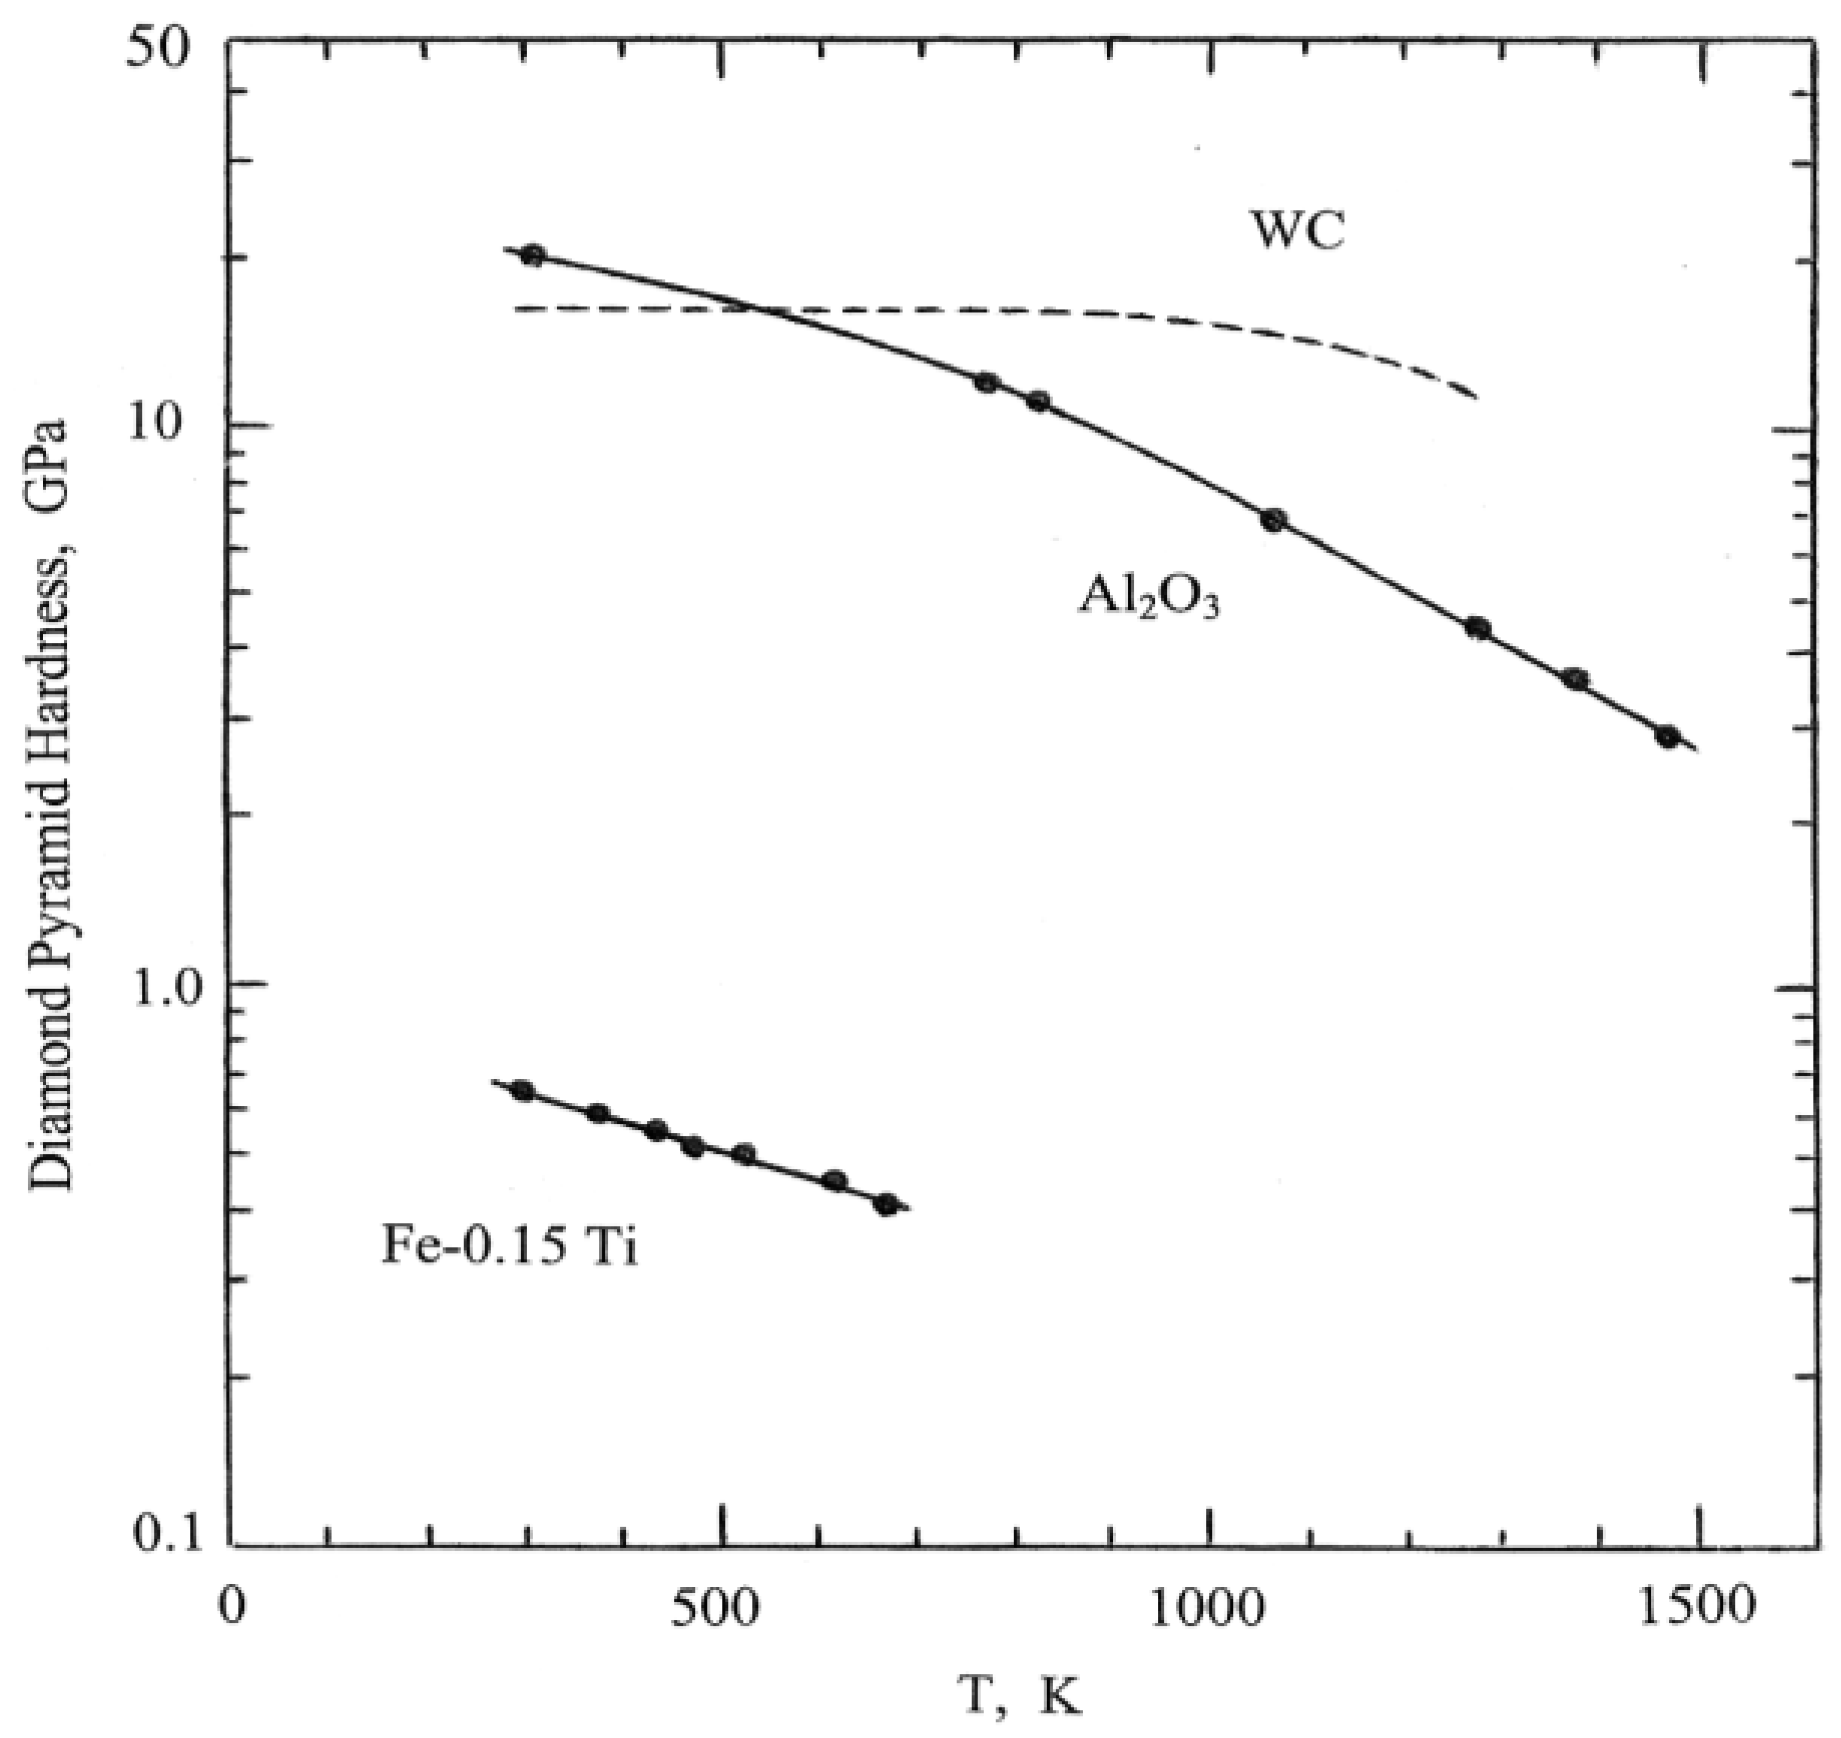
A particular advantage of WC in WC-Co composites is that the strength of the carbide particles is maintained at higher temperatures. Figure 6 shows a comparison of the temperature dependencies for polycrystalline WC and, apparently, for single crystal sapphire (Al2O3) materials as obtained from temperature dependent hardness results reported in reference [15] (p. 135 and p. 185). The results may be compared with similar measurements reported for the hardness of other WC and WC-Co materials in reference [18], in which a detailed description is given of the experimental aspects of performing the measurements. The much lower “hot hardness” of an “interstitial-free” Fe-0.15Ti alloy material is also shown in Figure 6 for comparison with a metal system [19]. Viewed at rising temperatures, the comparison demonstrates that the higher hardness of WC becomes essentially temperature independent at ~1000 K while the hardness of Al2O3 is lower than that of WC until rising above it at ~500 K. Such leveling off of either the hardness or plastic flow strength of materials at effectively lower temperatures is not unusual and is generally explained in terms of the temperature dependent part of the strength property being governed by thermally-activated dislocation motion and the leveling of strength. This is accounted for either in terms of a change in atomic coordination occurring in the cores of dislocations akin to a chemical phase change or, in other instances, by the hardness being governed by the initiation of cracking, say, as for a type of ductile-brittle transition.
Beyond the difficulty of performing hardness tests at elevated temperatures, there is the problem of interpretation of the measurements in the same manner as done for the naturally separated plastic yield and strain hardening properties of crystals or polycrystals in conventional tensile or compression tests performed as a function of temperature and strain rate. No hardness results are presented in the dislocation-based review of ceramic crystal properties given in [3]. And such temperature measurements that are shown, for example, for the critical resolved shear stresses for plastic flow of MgO crystals on both the easy {110} and more difficult {100} slip systems are at stress levels significantly lower than the conventional hardness levels, for example, respective shear stresses of ~0.02 and ~2.0 GPa are estimated for results presented at ambient temperature. A useful reference for the higher temperature deformation of MgO in compression is [20]. On the other hand, measurement of the model dislocation parameters proposed to gauge the thermally-activated mechanisms involved in the viscoplastic behavior of MgO and similar ceramic materials appear to behave similarly to those proposed for metals. A higher intrinsic friction of thermally activated flow in a ceramic crystal has been reported [3,21]. One such relevant parameter in the thermal activation model is the dislocation activation volume, v*, that, although measured in volumetric dimensions, is actually an activation area multiplied by a dislocation Burgers vector and is evaluated as
v* = kT[∂ln(dγ/dt)/∂τTh]T
In Equation (5), k is Boltzmann’s constant, (dγ/dt) is the plastic shear strain rate, τTh is the thermal component of the total applied shear stress, and T is absolute temperature. In many cases, v* is found to depend inversely on τTh and the consequence is that the thermal component of stress shows a logarithmic dependence on temperature as confirmed in [3]. Figure 7 shows an additional compilation for MgO crystals of reported v* measurements obtained in the listed investigations [22,23,24] spanning a range of bend test, hardness and shock plate-impact test results.
Figure 7.
The activation volume characterization of thermally-activated dislocation motion [22,23,24].
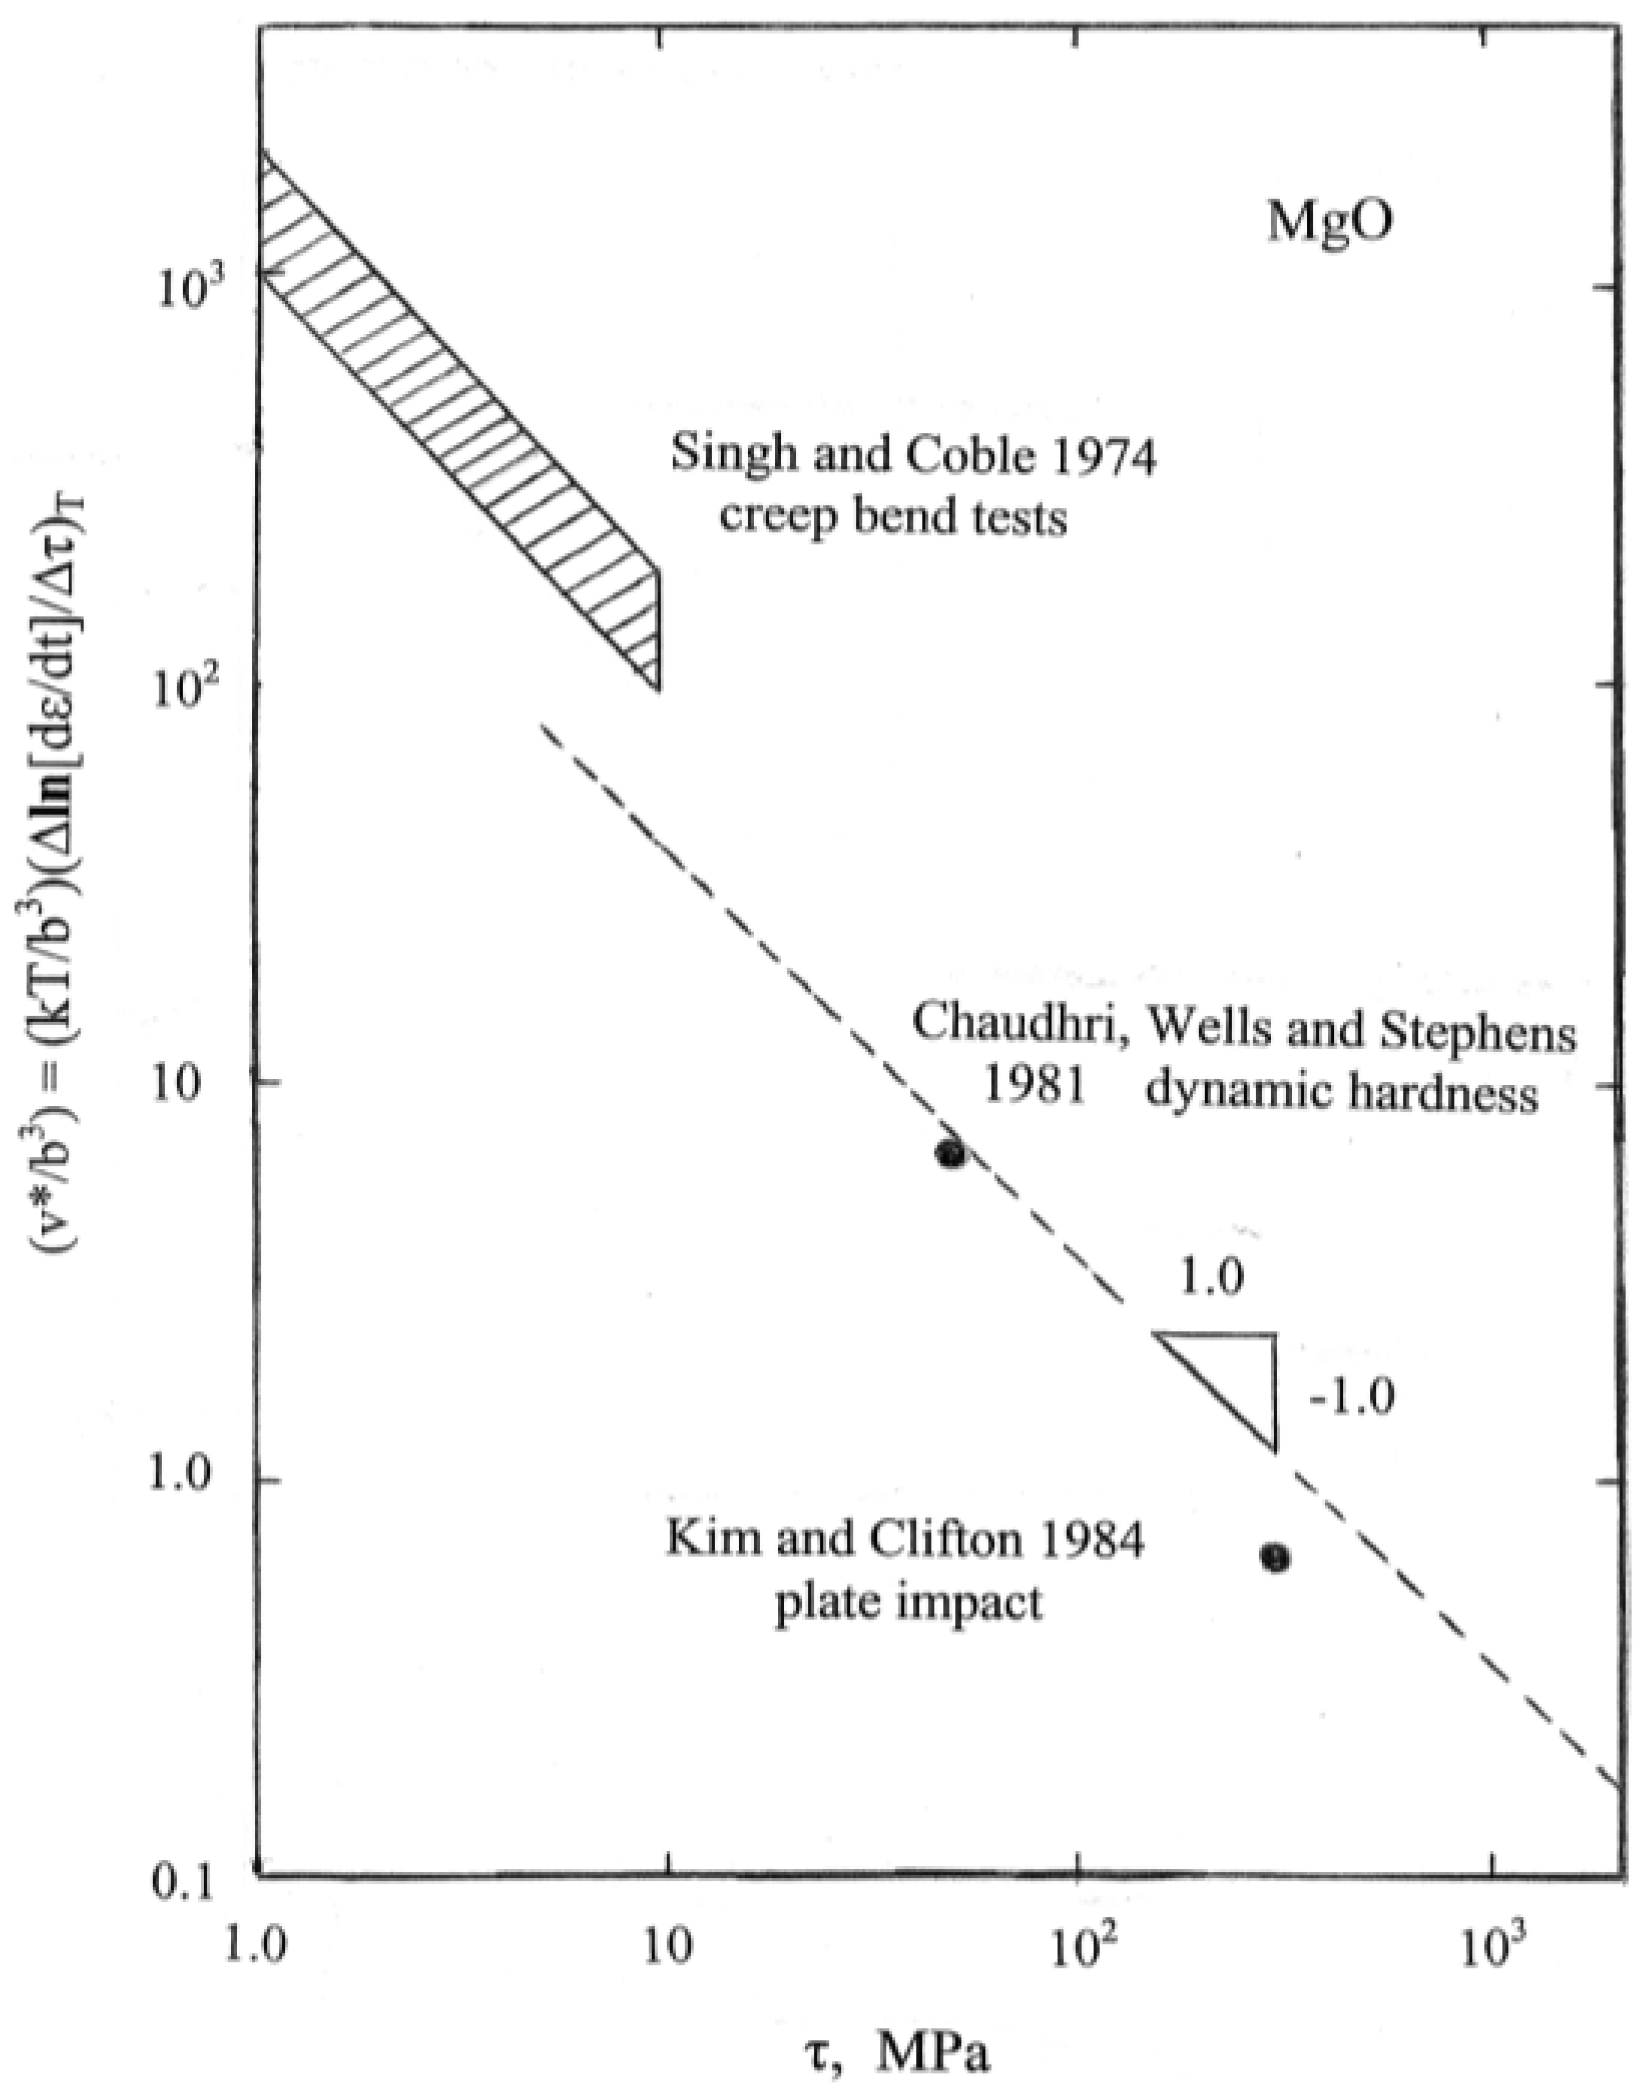
In Figure 7, the topmost cross-hatched area covers an extensive range of experimental etch pitting measurements made of dislocation velocities in MgO crystals at ambient, 373 and 423 K temperatures, all consistent with a logarithmic dependence of flow stress on temperature. The smallest value of (v*/b3) in Figure 7 was obtained from tabulated results presented in reference [24]. The magnitude of (v*/b3) = 0.65 relates to similar values reported for the shock-induced deformation properties of copper and iron materials [25]. Of greater interest is the transformed dynamic hardness point in Figure 7 that was obtained from important high rate ball impact measurements reported at strain rates of ~7 × 10⁴ and ~2 × 10⁵ s−1, as shown below in the compilation of MgO hardness results of Figure 8 [23,26,27]. In this case, a multiplying factor of (1/35) has been employed to obtain an effective shear stress from the dynamic hardness result, as previously estimated [15] (p.11), presumably to connect an appropriate average of the above-mentioned resolved shear stresses for easy {110} and more difficult {100} slip in MgO to the measured microhardness level of ~700 kgf/mm2 (~6.9 GPa) shown in Figure 1 and Figure 5.
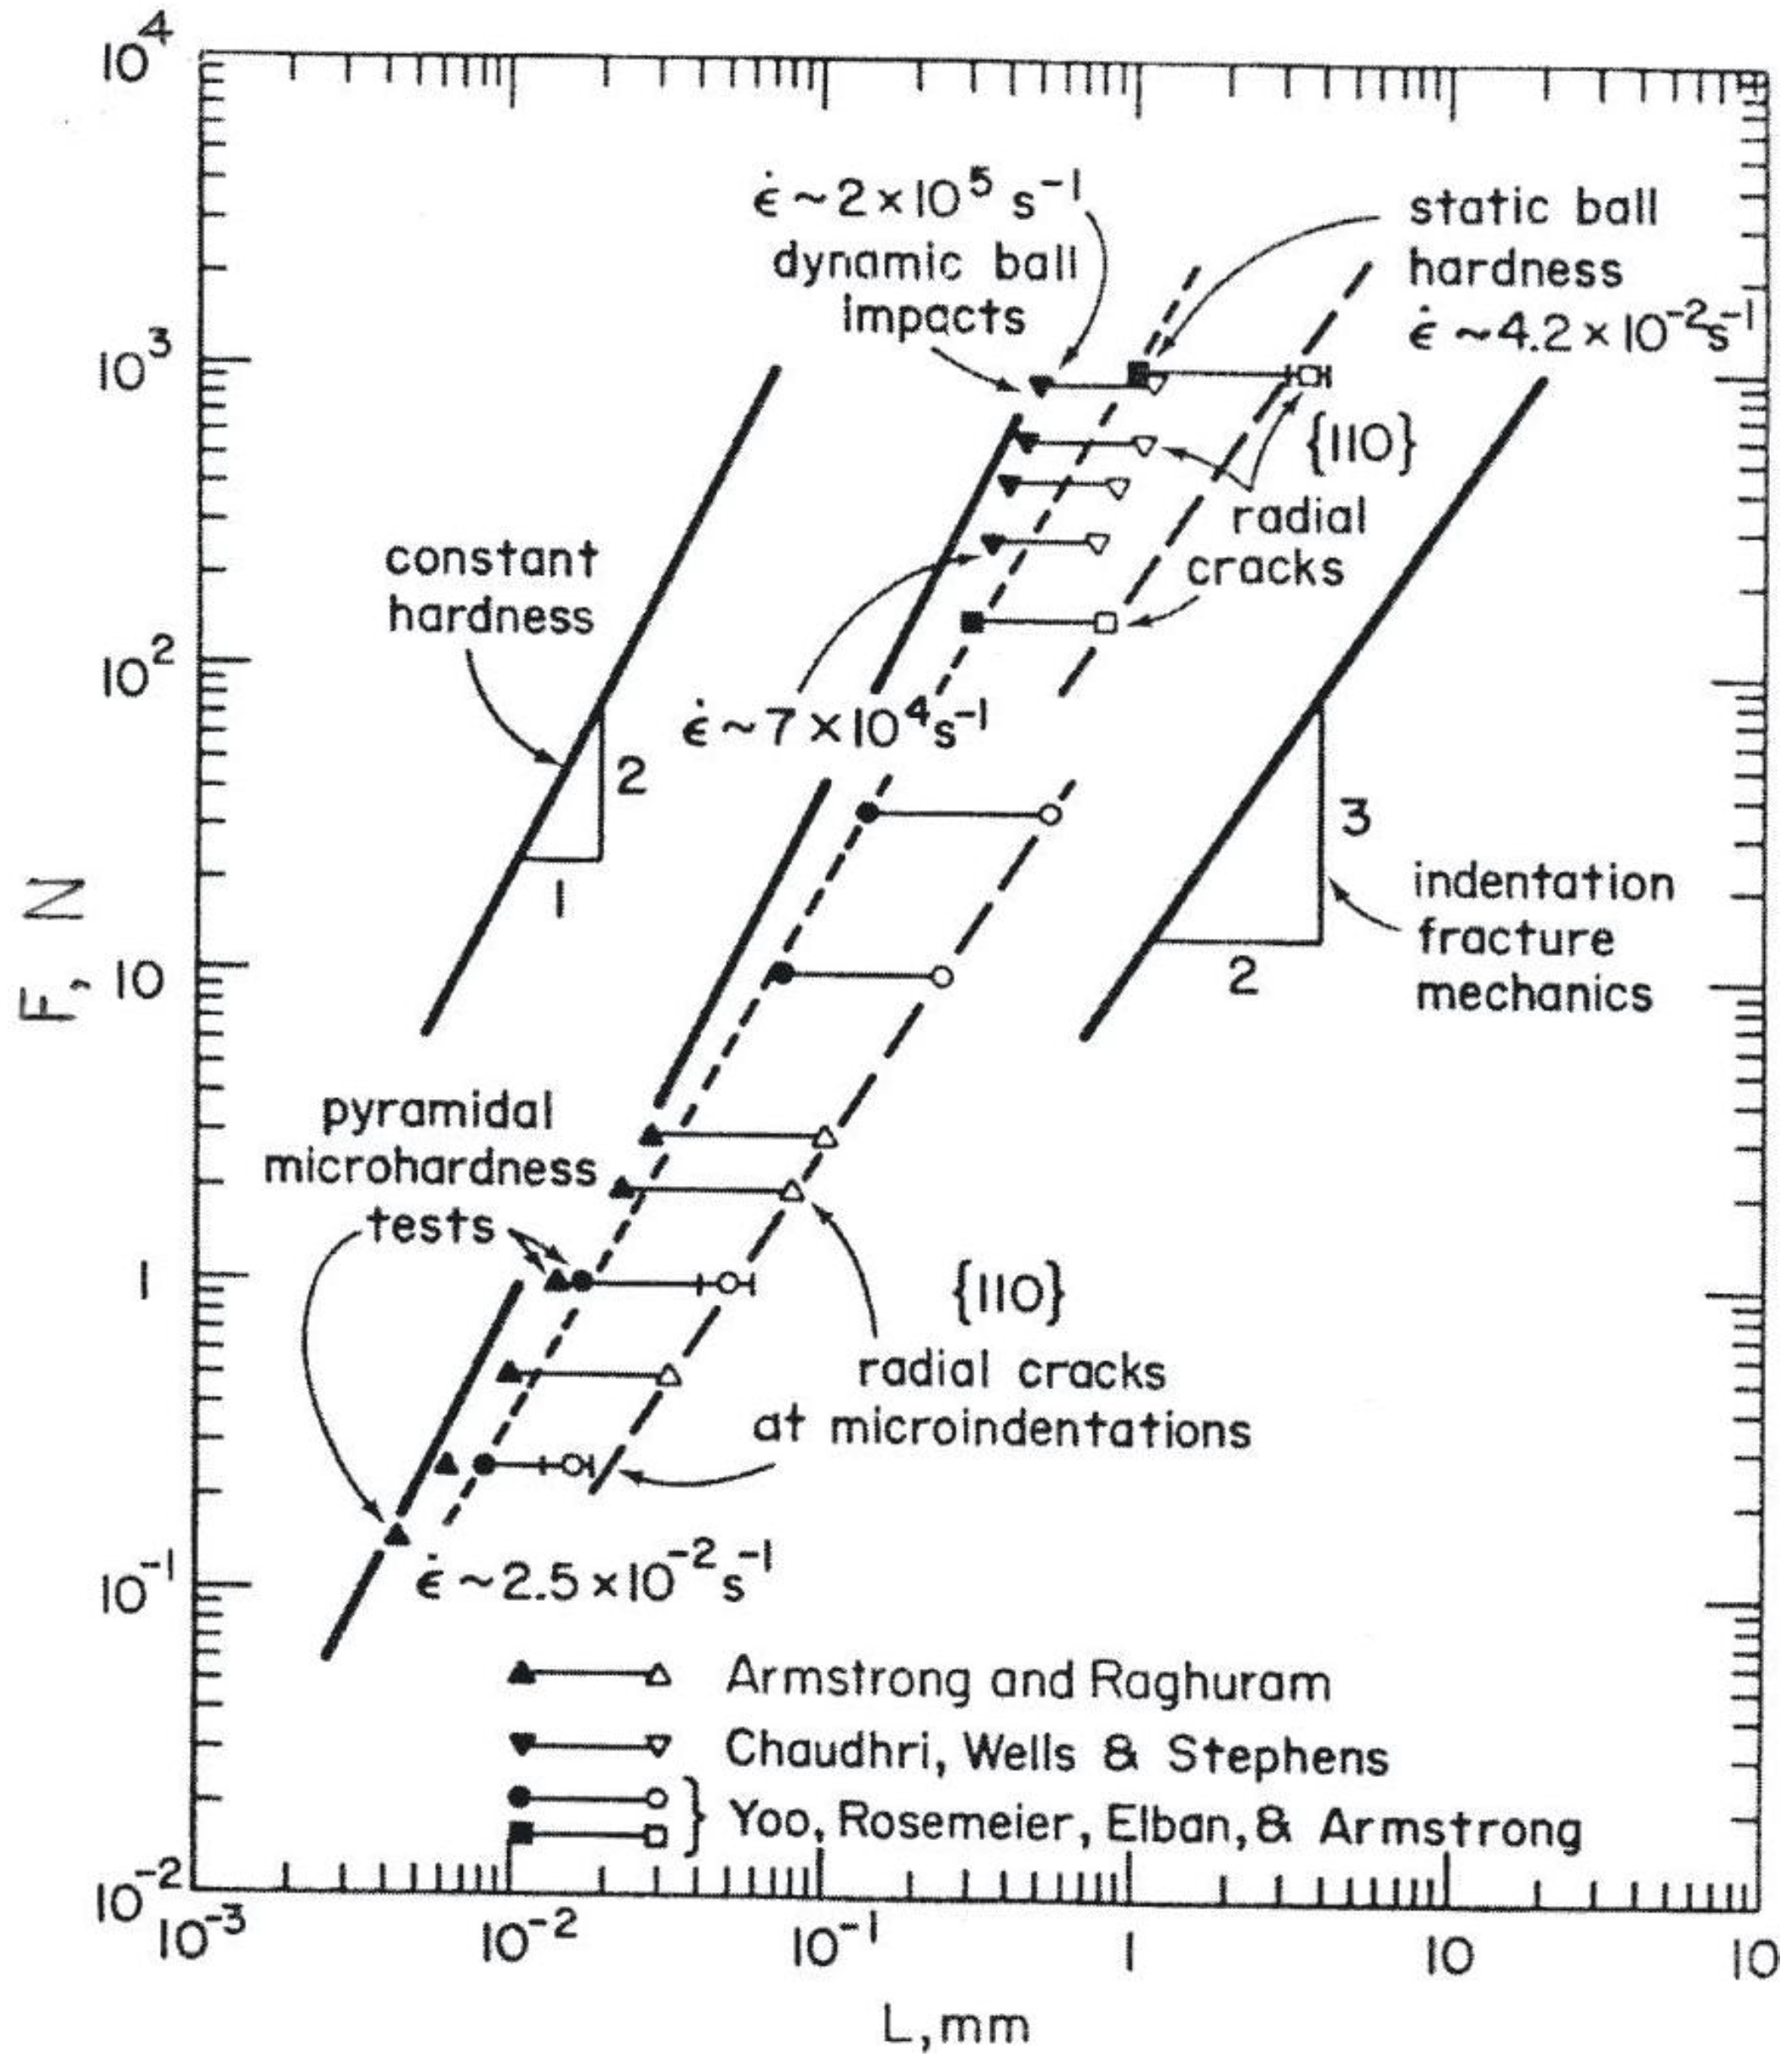
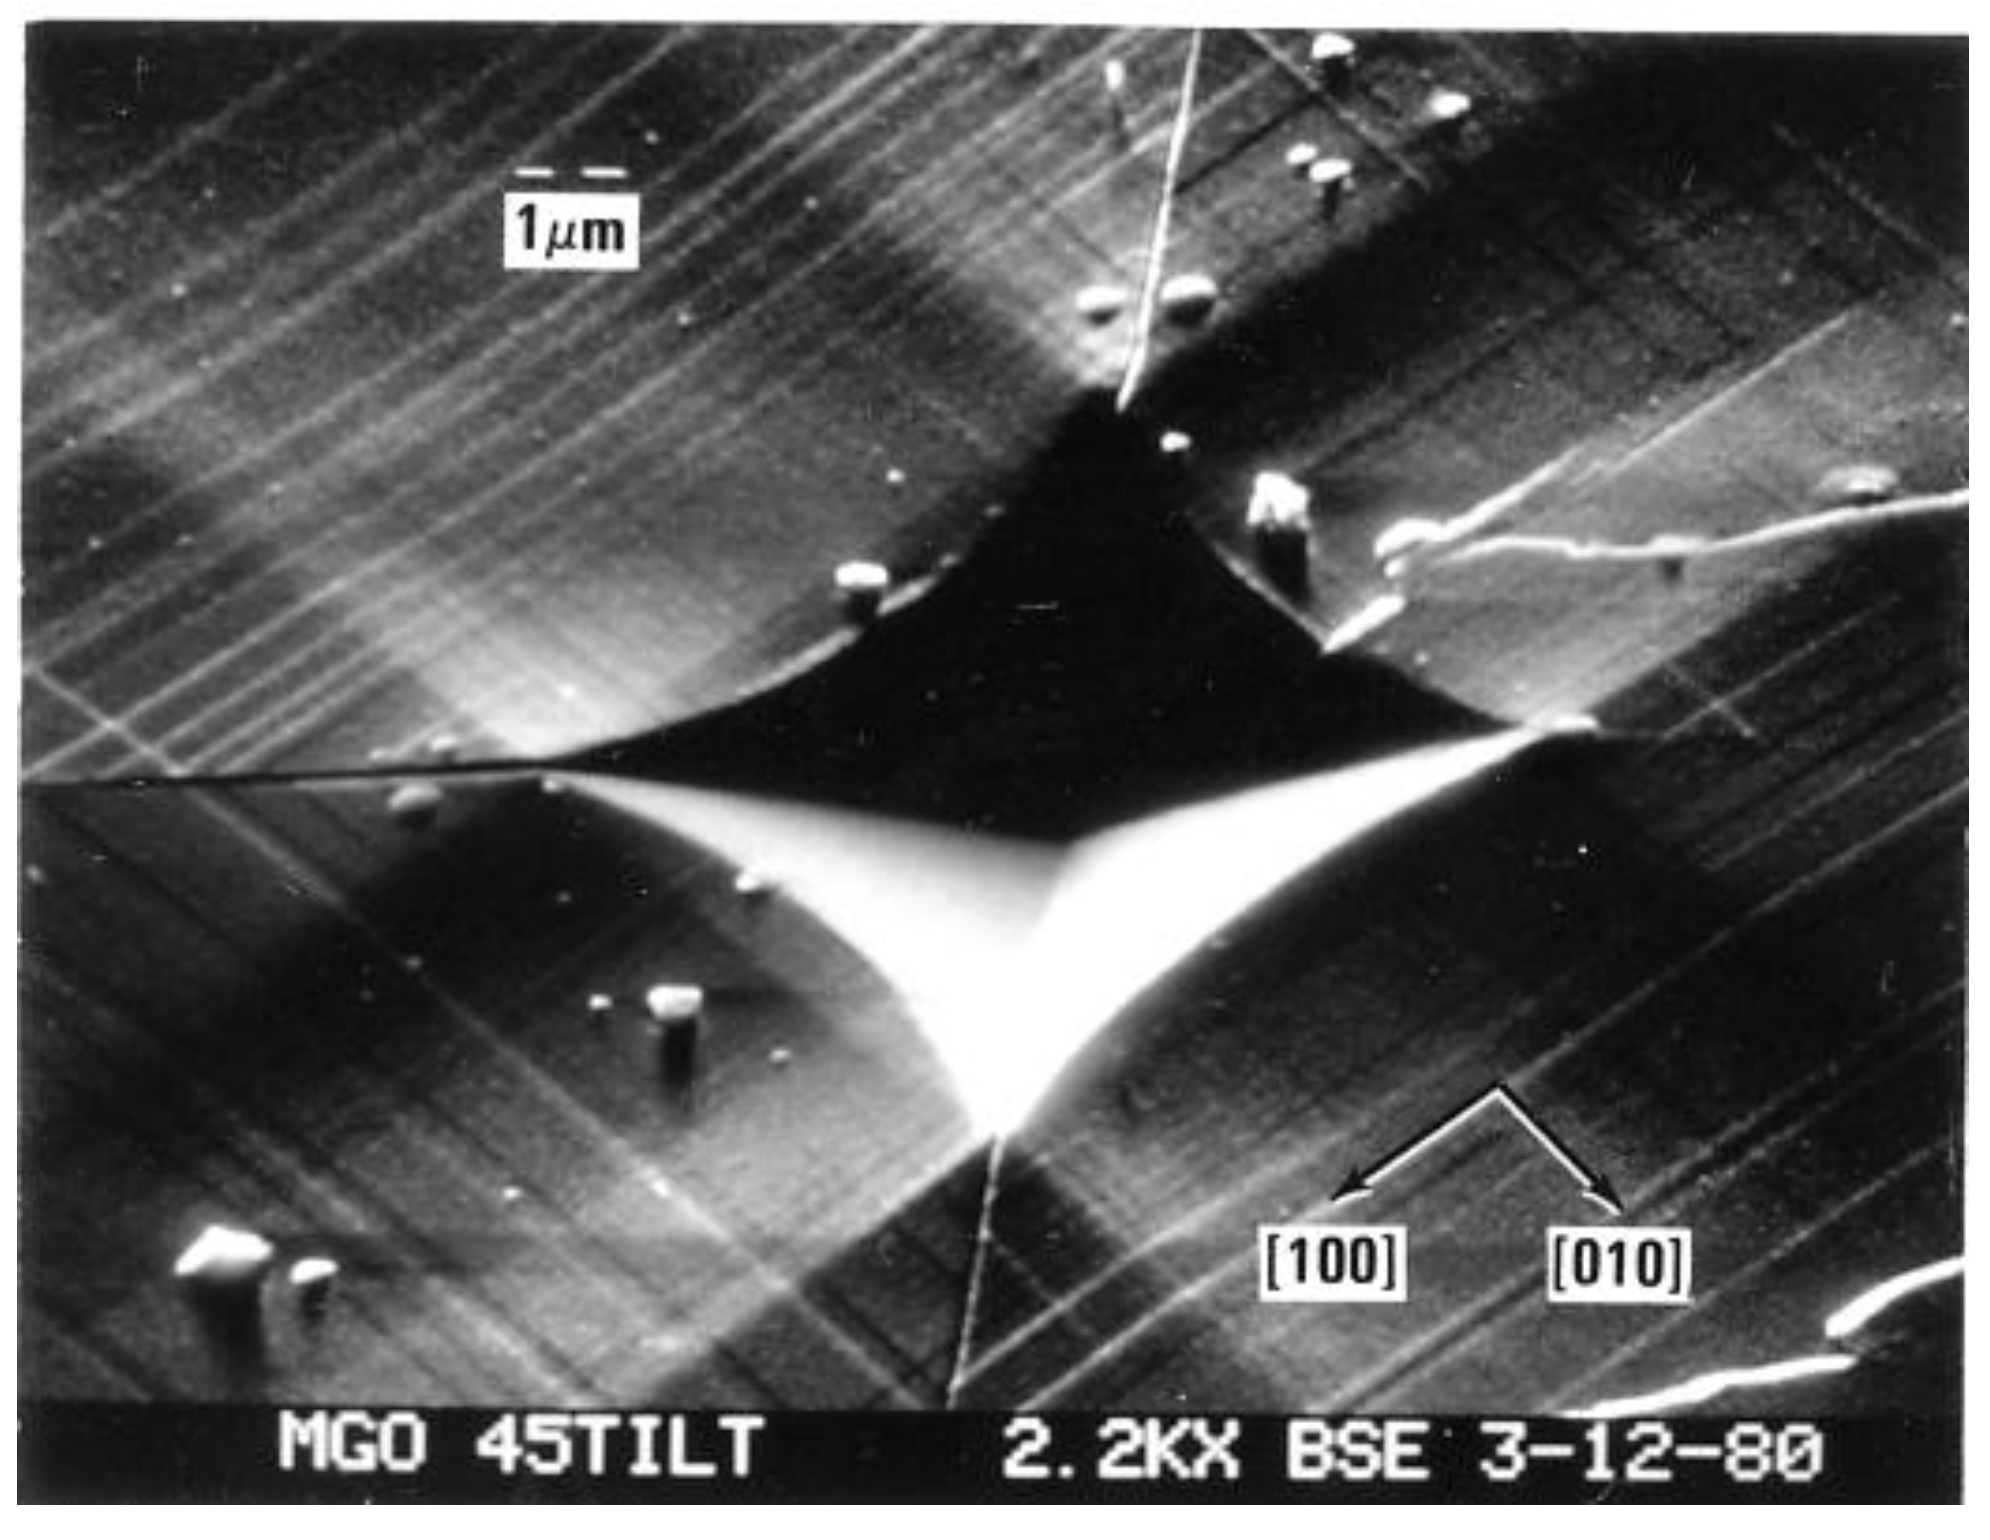
Also in Figure 8, the lower (triangle and circle) microhardness load values shown to have been applied to the various MgO crystals are plotted against both the residual diamond pyramid indentation diagonal lengths and the crack-tip-to-crack-tip lengths that were recorded across the indentations; the higher (inverted triangle and square) points are plotted against the residual ball diameters and associated similar crack diameters. The figure brings attention to the importance of cracking during indentation on reducing the hardness of at least certain types of crystals and, in this case to particularly reducing the hardness of MgO crystals. Figure 9, in turn, is a representative close-up scanning electron micrograph [7,28] of such cracking behavior at a [100]-aligned diamond pyramid indentation put into an MgO (001) crystal surface.
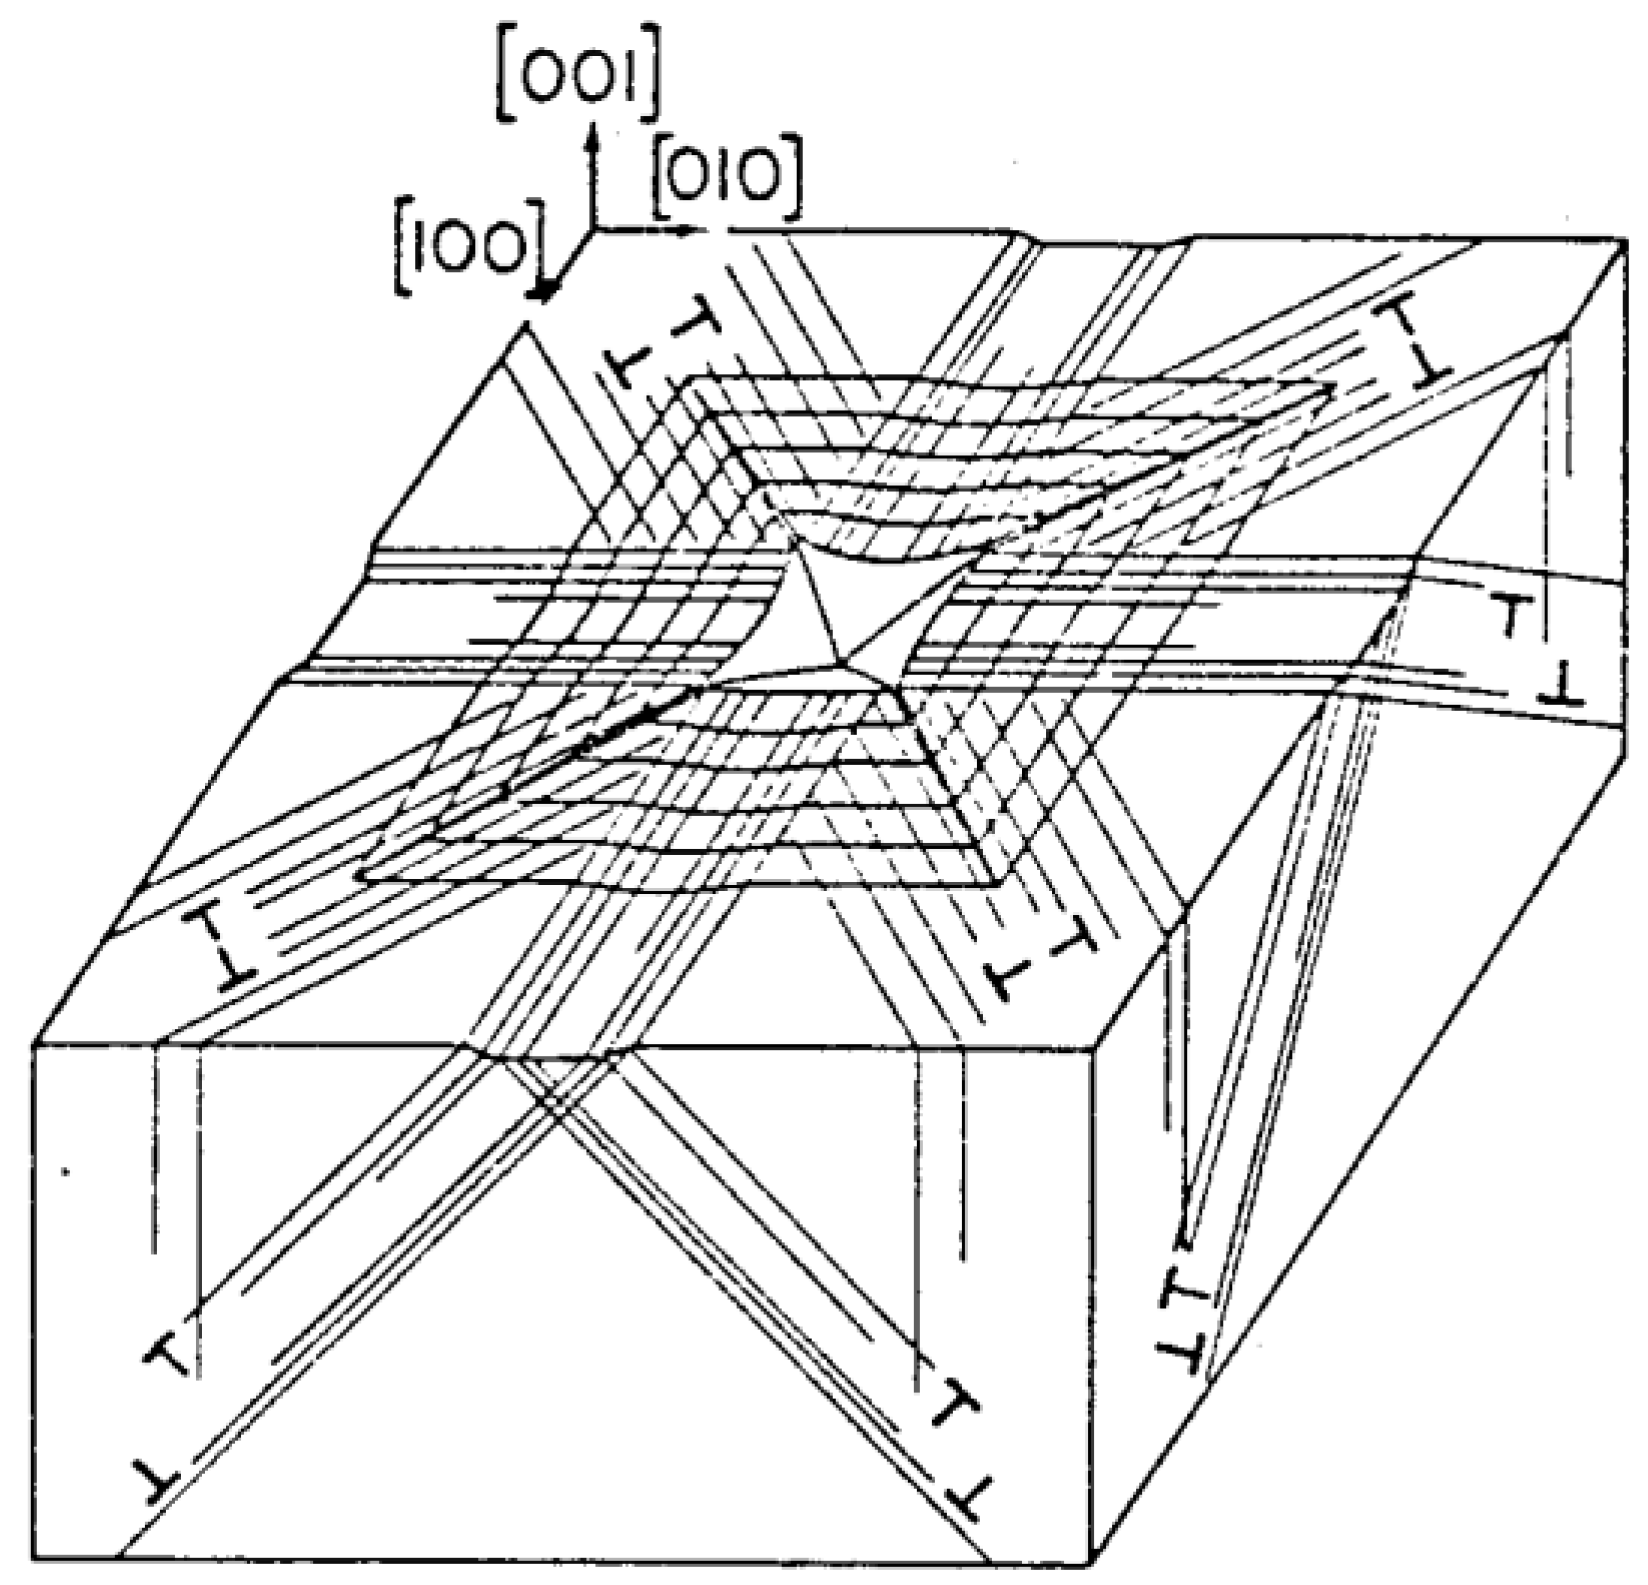
Figure 9 and its schematic representation in Figure 10 connect, firstly, with the above-mentioned difficulty of relating hardness and shear stresses in ceramic-type crystals. Generally, in such crystals there are relatively few deformation systems to accommodate imposed deformations. Early-on in an MgO microhardness test, sessile type dislocation reactions are produced at inclined <111> type directions of volume accommodating {110} slip plane intersections and lead to dislocation pile-ups forming and producing cracks both on the (110) and (−110) planes containing the [00-1] loading direction. The stress concentrations appear to require slip on the second less-favored {111} slip systems for strain relief otherwise, as observed in Figure 9, cracking must occur across the energetically less favored {110} planes. Another important feature is that the primary indentation-forming dislocation slip spreads across the (001) crystal surface by the dislocations carrying their downward displacements in a screw orientation, so producing the “troughs” running outward from the central indentation. The latter result is uniquely tied to the crystal dislocation model for the material deformation behavior.

Figure 10.
Schematic dislocation model of slip lines and {110} cracking in MgO [7].
Figure 10.
Schematic dislocation model of slip lines and {110} cracking in MgO [7].

5. The Hardness of WC-Co and Al2O3 Materials
Such dislocation description as given above, especially involving dislocation pile-ups generating sufficient local internal stress concentrations so as to produce cracking is central to establishment of the Hall-Petch type dependence given for the hardness stress in Equation (4). In this regard, Figure 11 gives a comparison of temperature results in terms of the single crystal orientation-dependent Knoop hardness [18].
Figure 11.
The Knoop hardness of single crystal and polycrystal WC and WC-Co alloy [18]; measurements at 9.81 N load. LD in the figure legend stands for the indenter long diagonal.
Figure 11.
The Knoop hardness of single crystal and polycrystal WC and WC-Co alloy [18]; measurements at 9.81 N load. LD in the figure legend stands for the indenter long diagonal.
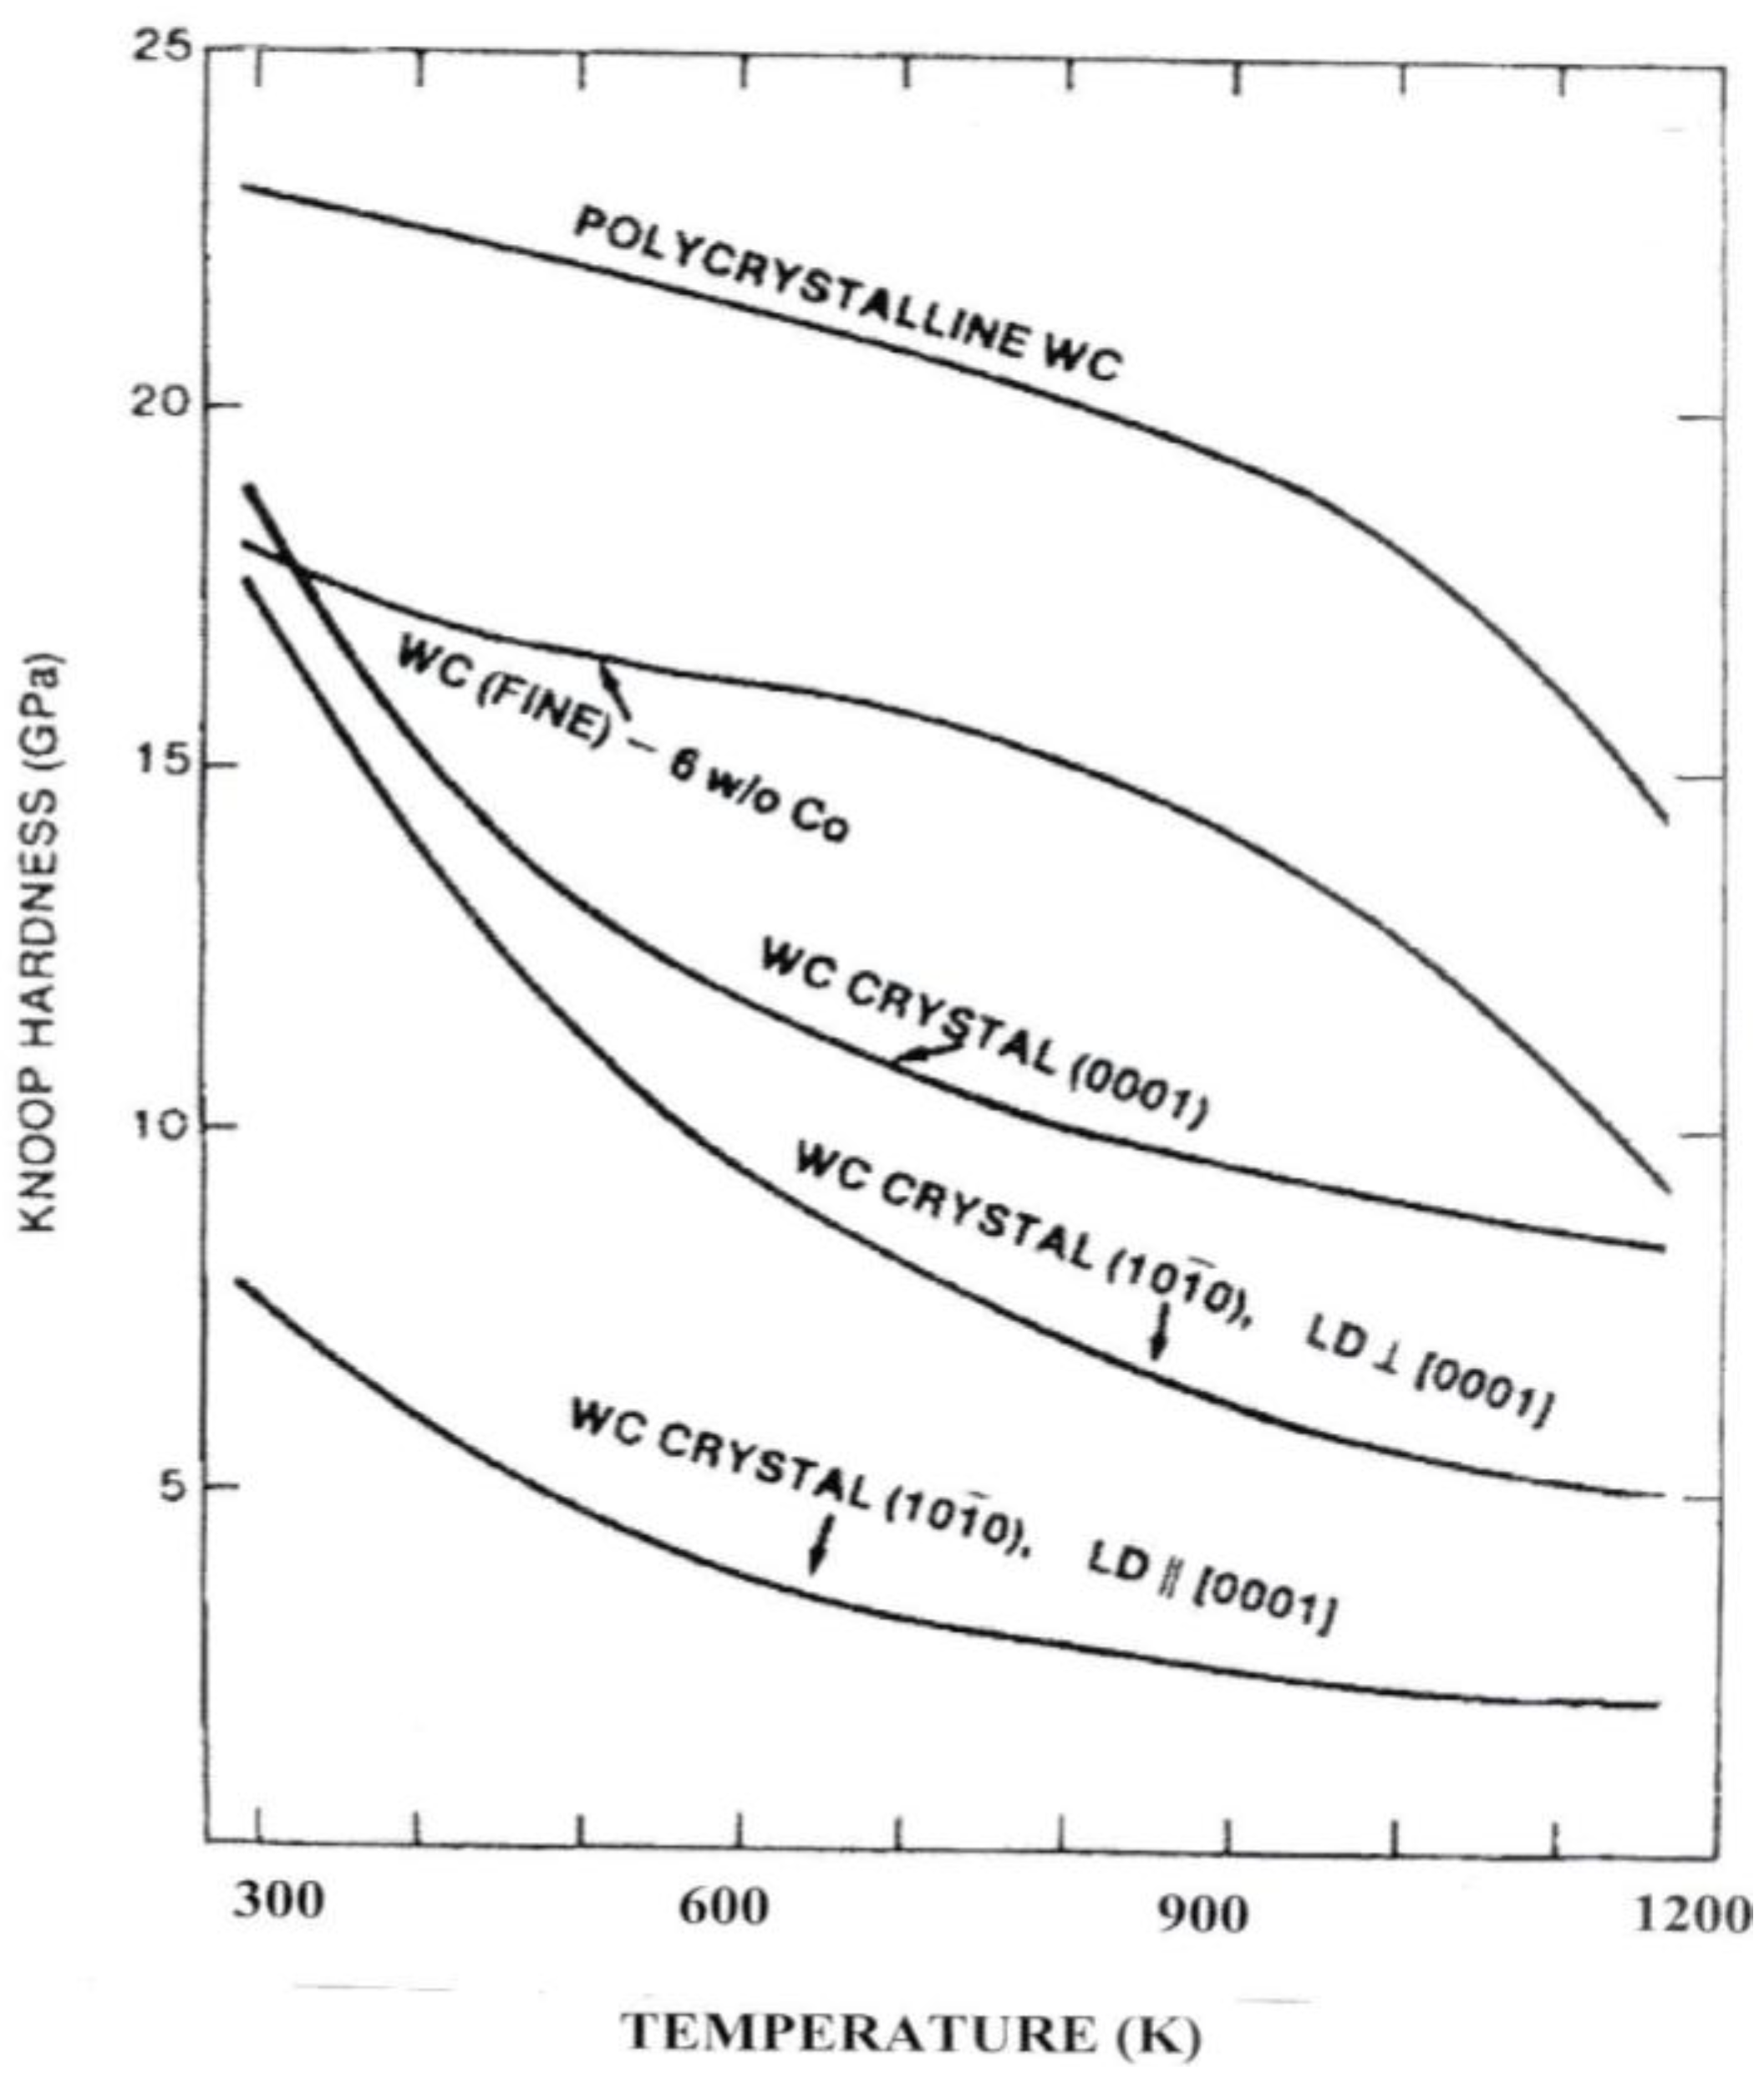
Figure 11, while demonstrating the usefulness of the exaggerated 7:1 Knoop indenter shape for differentiating crystallographic influences on the interpenetrating hexagonal close-packed (0001) and two directions on (10–10) surfaces of WC crystals, makes clear the distinction between single crystal hardness and the (crystal) particle size dependence of polycrystal WC and WC-Co composite material. The result for the higher polycrystal and polyphase hardnesses in the figure demonstrates that it is the H-P kH that provides the added hardness of both materials over the single crystal values, at least in the temperature range shown in Figure 11. Very importantly, the result is in agreement with the description given above for the limited availability of slip systems observed for the MgO crystal hardness deformation and cracking results. The limited slip system availability is responsible for the significant H-P kH value measured for WC and WC-Co materials. Such is the case too for polycrystal hcp metals [29]. Recent assessment of the ambient temperature case for polycrystalline Mg has involved estimation of a pile-up stress on the easy {0001} slip system at a shear stress of 0.3 MPa generating a local shear stress of 40 MPa for prism slip at grain boundaries [30]. Other Knoop H-P measurements have been reported for the Hall-Petch type hardness at larger grain sizes of Al2O3 materials [31]. More will be presented on this issue in connection with H-P results for Al2O3 and for the presence of a contiguity parameter, C, that provides a measure of the influence that WC-to-WC particle contacts in the WC-Co system have on hardness.
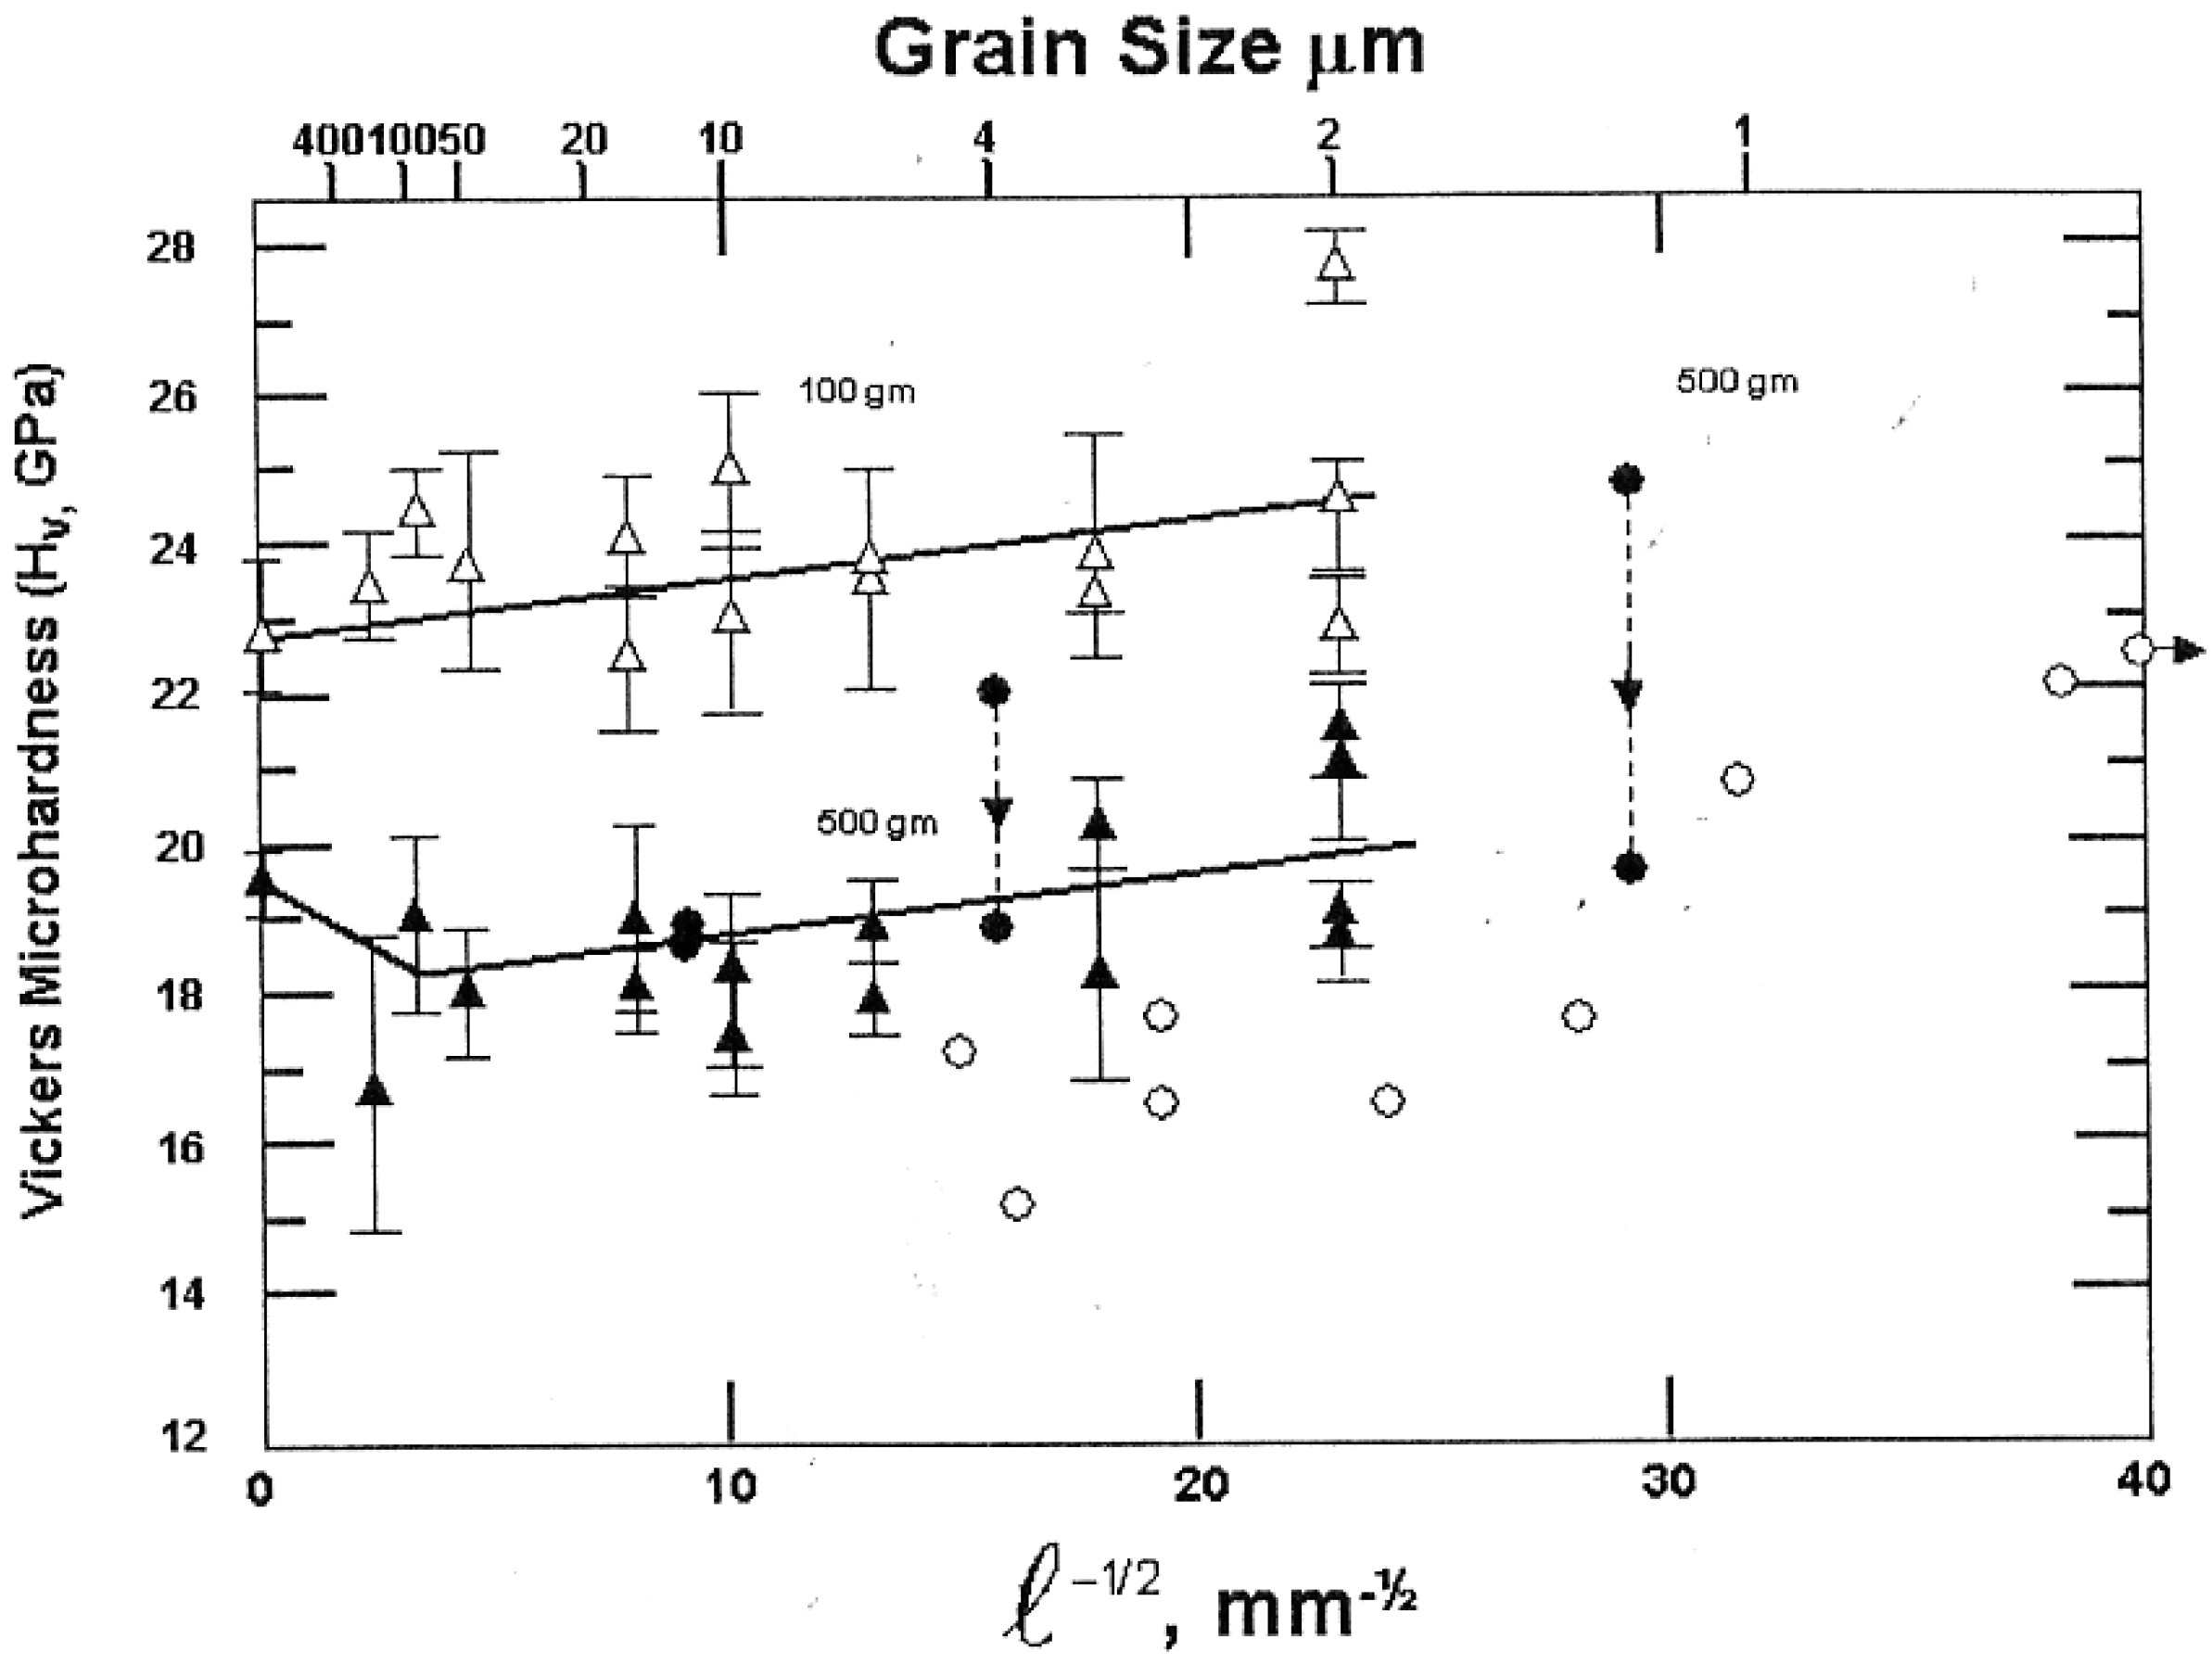
The preceding comments are not made to minimize the difficulty of reliably determining any H-P dependence in a ceramic system. For example, extensive results reported for the grain size dependence of hardness for Al2O3 materials relate to the issue as shown in Figure 12. In the figure that has been adapted from [32], the open circle points are from [33] and closed points from [34]; see also [35]. The raised level of microhardness measurements obtained at 100 g load, as compared to 500 g, are a result of the ISE; and, the scatter of measurements occurs mostly because of material porosity but at least in part because of the influence of elastic recovery on the residual indentation shapes [7,28], as mentioned also for the MgO elastic and plastic hardness strains shown in Figure 1. A further complication is a role for cracking when it occurs, as shown in Figure 9 with model description in Figure 10. A similar compilation of hardness results has been reported for other Al2O3 materials [36].

Figure 13 shows, first for a range of compositions of WC-Co composite materials, their hardness dependence on the volume fractions and sizes of WC particles and of mean free path length of the Co binder phases, as proposed in an important extension of the H-P method of analysis [17]. The hardness, H, is shown to follow the equation inset in the figure
H = HWCVWCC + Hm(1 − VWCC)
In Equation (6), HWC is the H-P determined hardness of the WC particles of size d, VWC is their volume fraction, Hm is the H-P hardness of the Co binder, and C is the contiguity measure of WC particle-to-particle contacts. Previously, the upper and lower limiting rule-of-mixtures relationships were shown to envelop the elastic modulus values, E, for the WC-Co system very well [37]. A similar approach to the lower limit relationship for hardness was modified in part because of the experimental observation of higher open circle points being obtained for the smaller WC particle sizes as compared with the lower crossed points for larger particles. To take into account such particle size influence, the rule of mixtures was modified to include particle-to-particle contacts through the effective volume fraction of particles, VWCC. The horizontal arrows show that the three particle positions move into such linear relationships based on the effective volume fraction and with the H-P stresses plotted in each case on the respective ordinate axes for the constituent particle and binder hardness values.
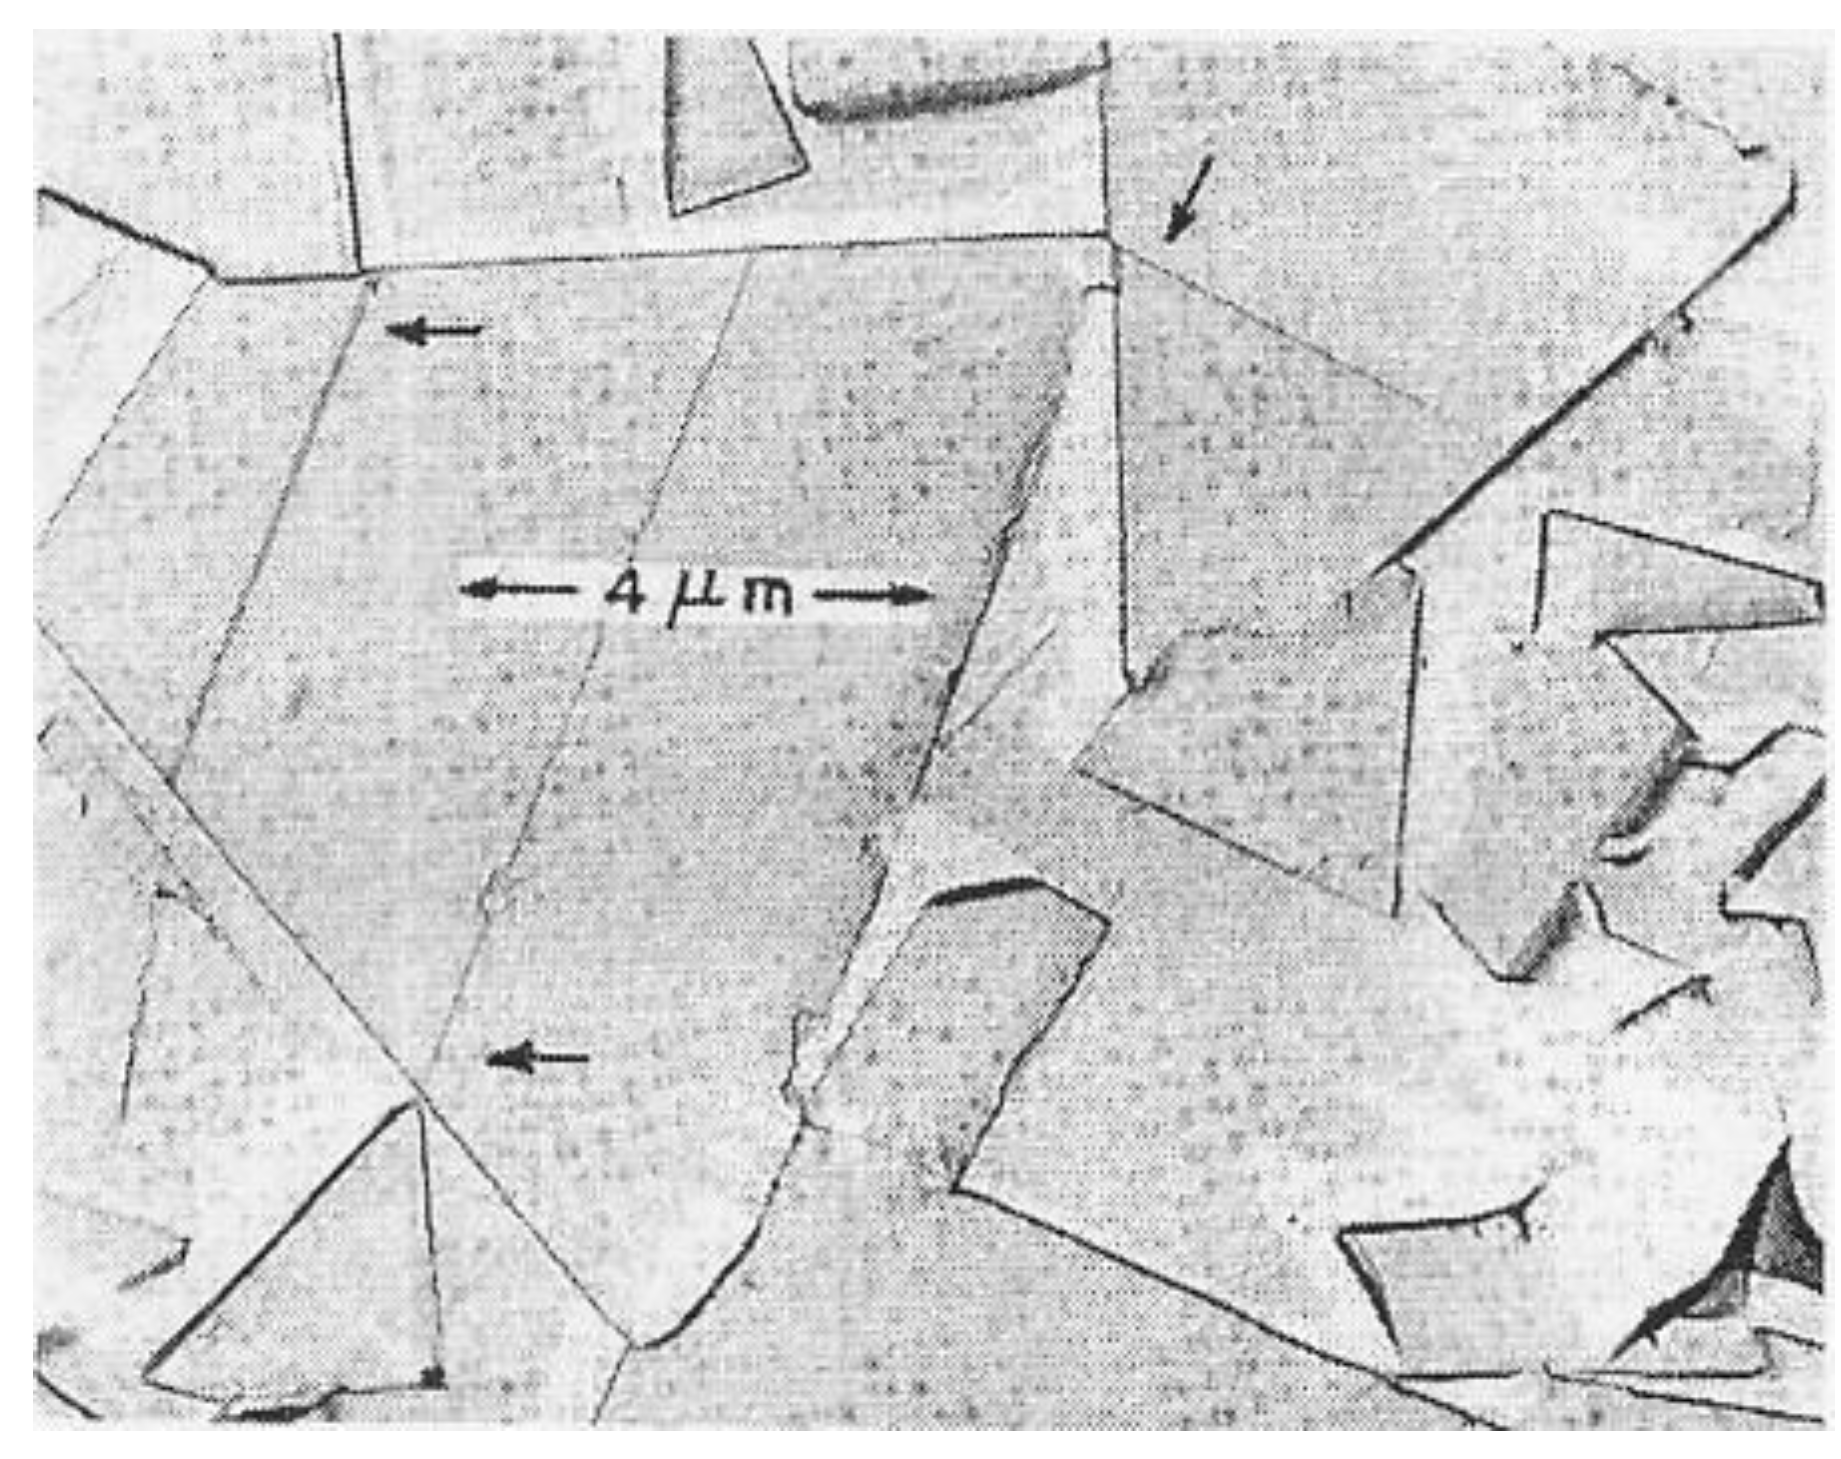
The material contiguity parameter is evaluated on a stereological basis as C = [1 − (NCo/NWC)] in which NCo and NWC are the number of Co free paths and WC particles intersected along a suitable total line length drawn on a microstructural section [38]. An analytic derivation has been presented for C based on tabulated results from a number of investigations of the WC-Co system and with employment of a variation coefficient description applied to the WC particle size distributions [39]. Other results are reported for a theoretical model of crystallographic shapes of WC particles in WC-Co [40] and for modification [41] for flatter shapes of WC particles in WC-Ni of the contiguity-incorporated rule of mixtures relationship given in Equation (6) and Figure 13 for WC-Co. Moreover, Figure 14 shows the second important reason to consider taking the contiguity of WC particles into account in determining the composite material hardness [17]. It was pointed out at the two marked arrow positions on the trapezoidally-shaped WC particle and at the one position on the triangularly-shaped particle that slip had been initiated at the contacts between particles. Such particle-to-particle interactions are taken into account in Equation (6) so as to lessen the strengthening effect of the WC particles in the mixture and to increase the strengthening contribution from the Co binder phase while continuing to maintain a significant H-P strengthening effect on the composite from reduced WC particle sizes.
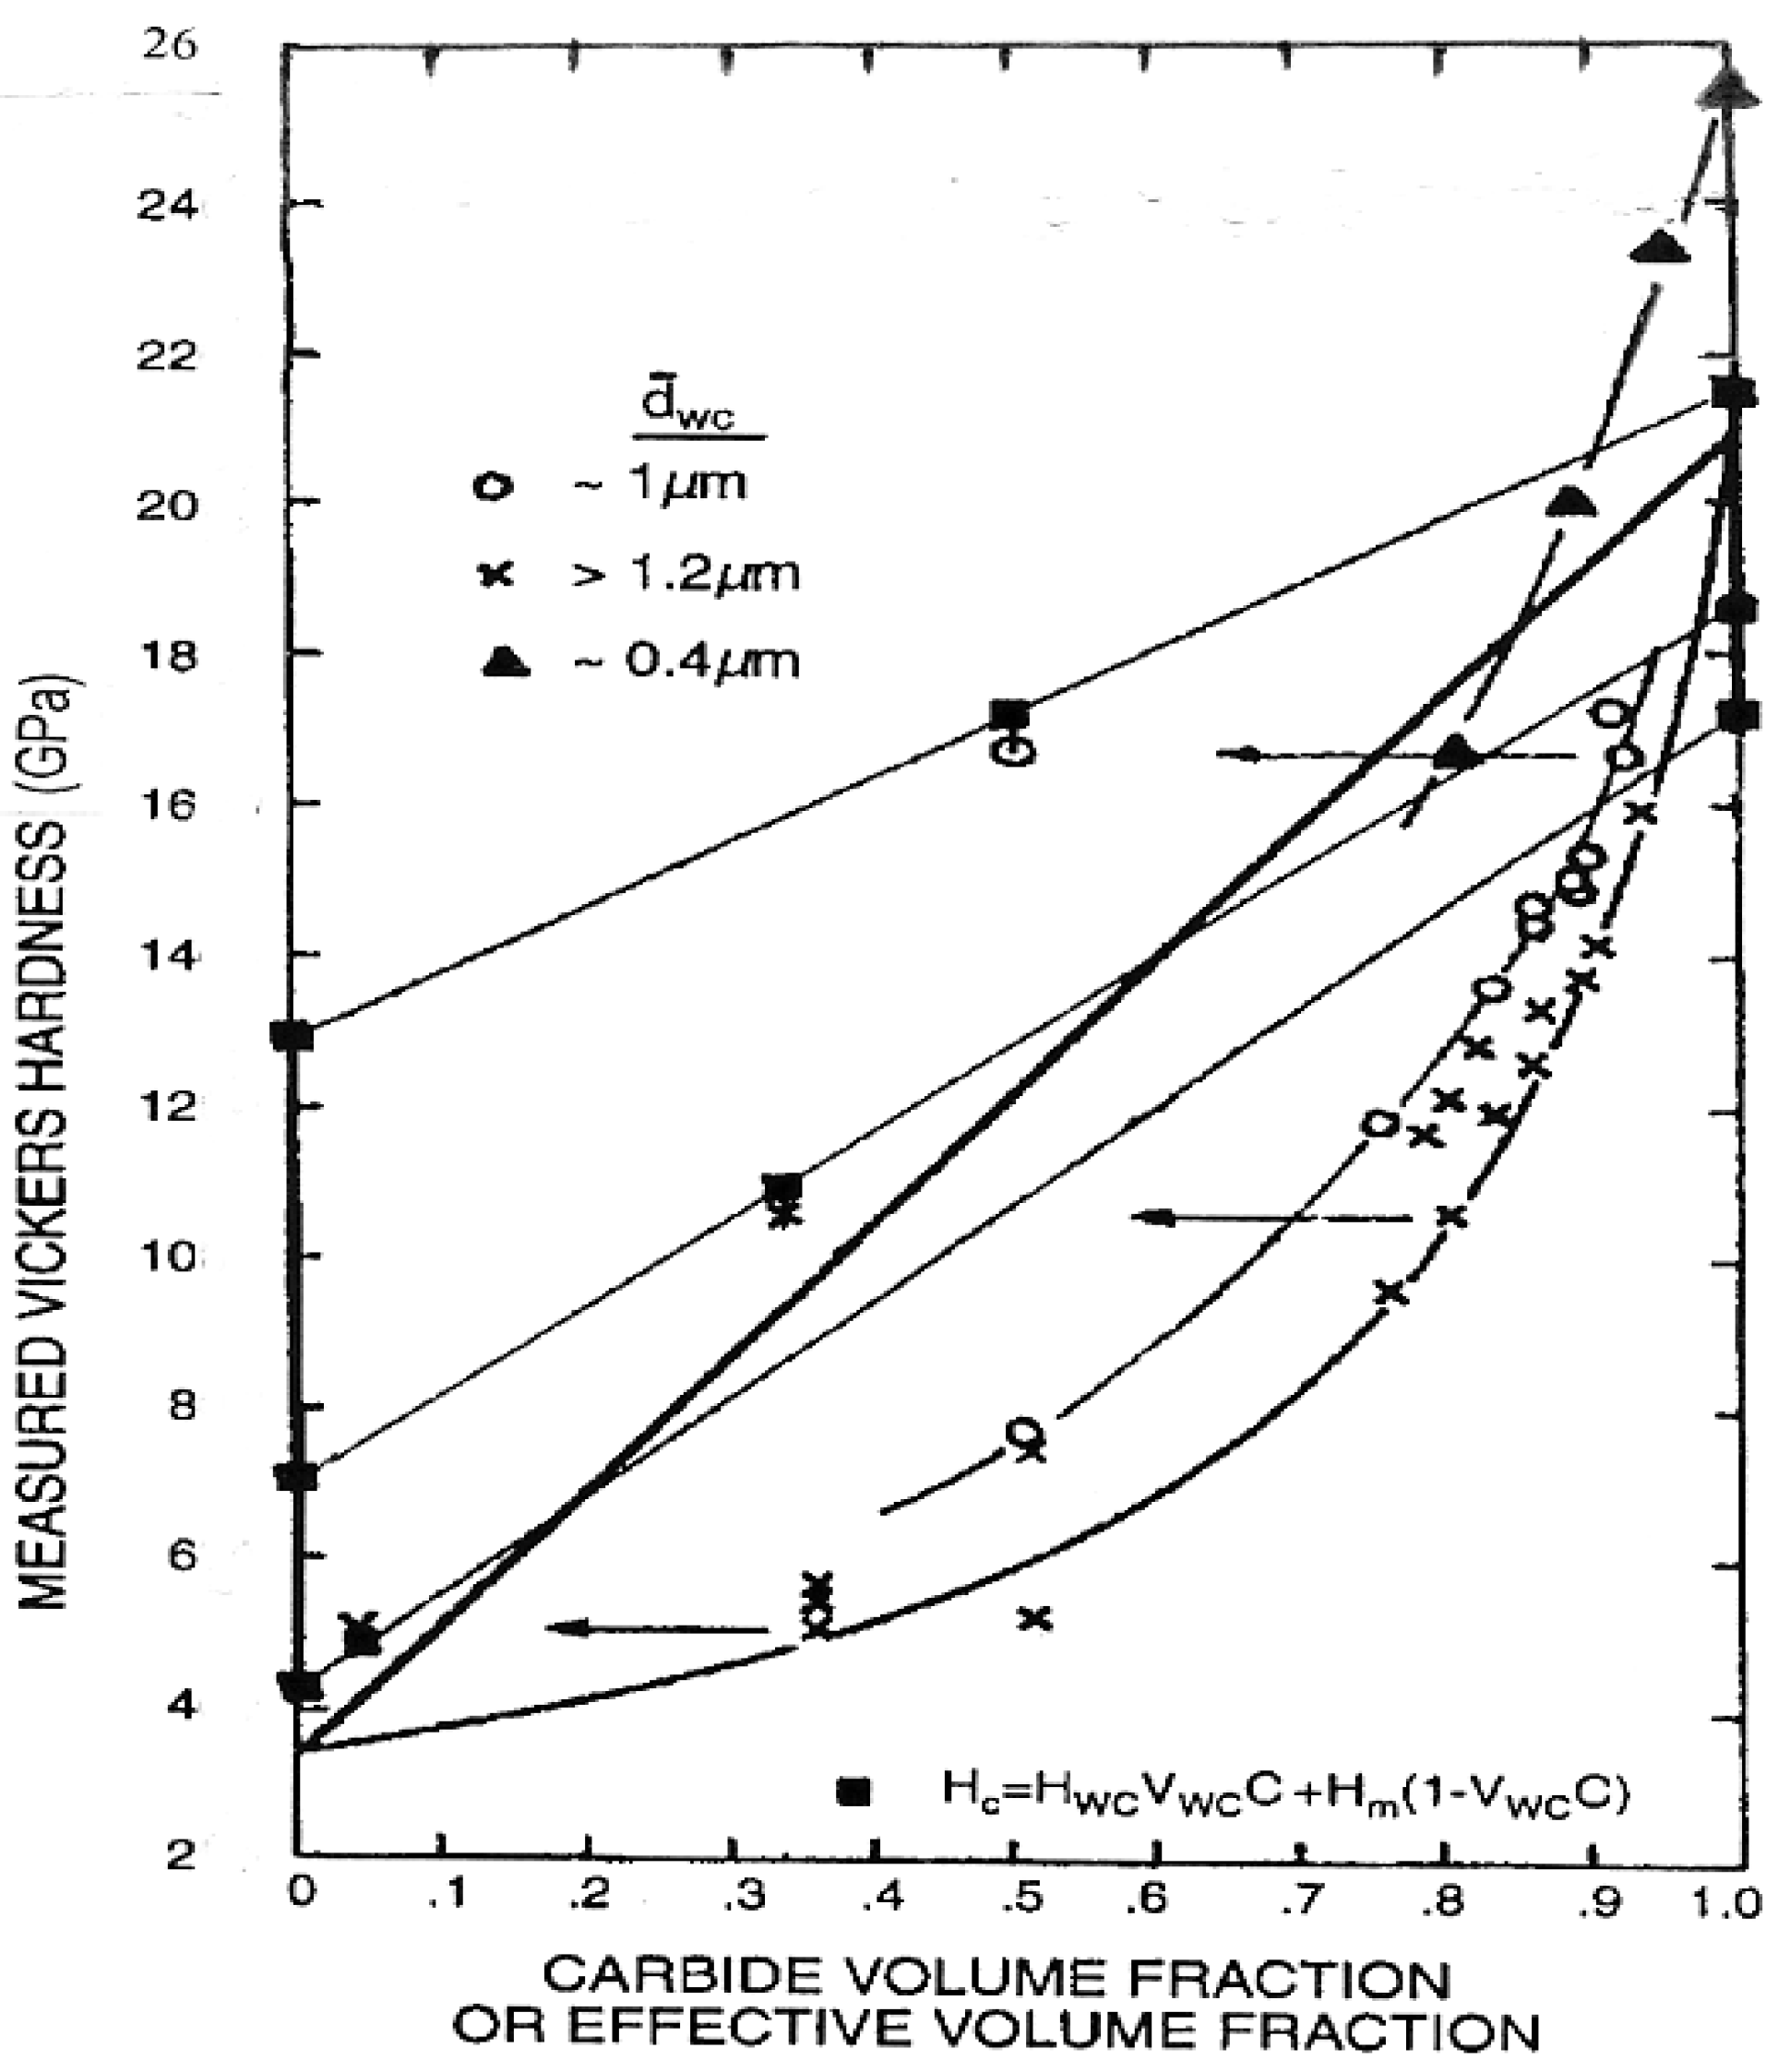
Figure 14.
Deformation in WC-Co at WC particle-to-particle contacts [17].
Figure 14.
Deformation in WC-Co at WC particle-to-particle contacts [17].
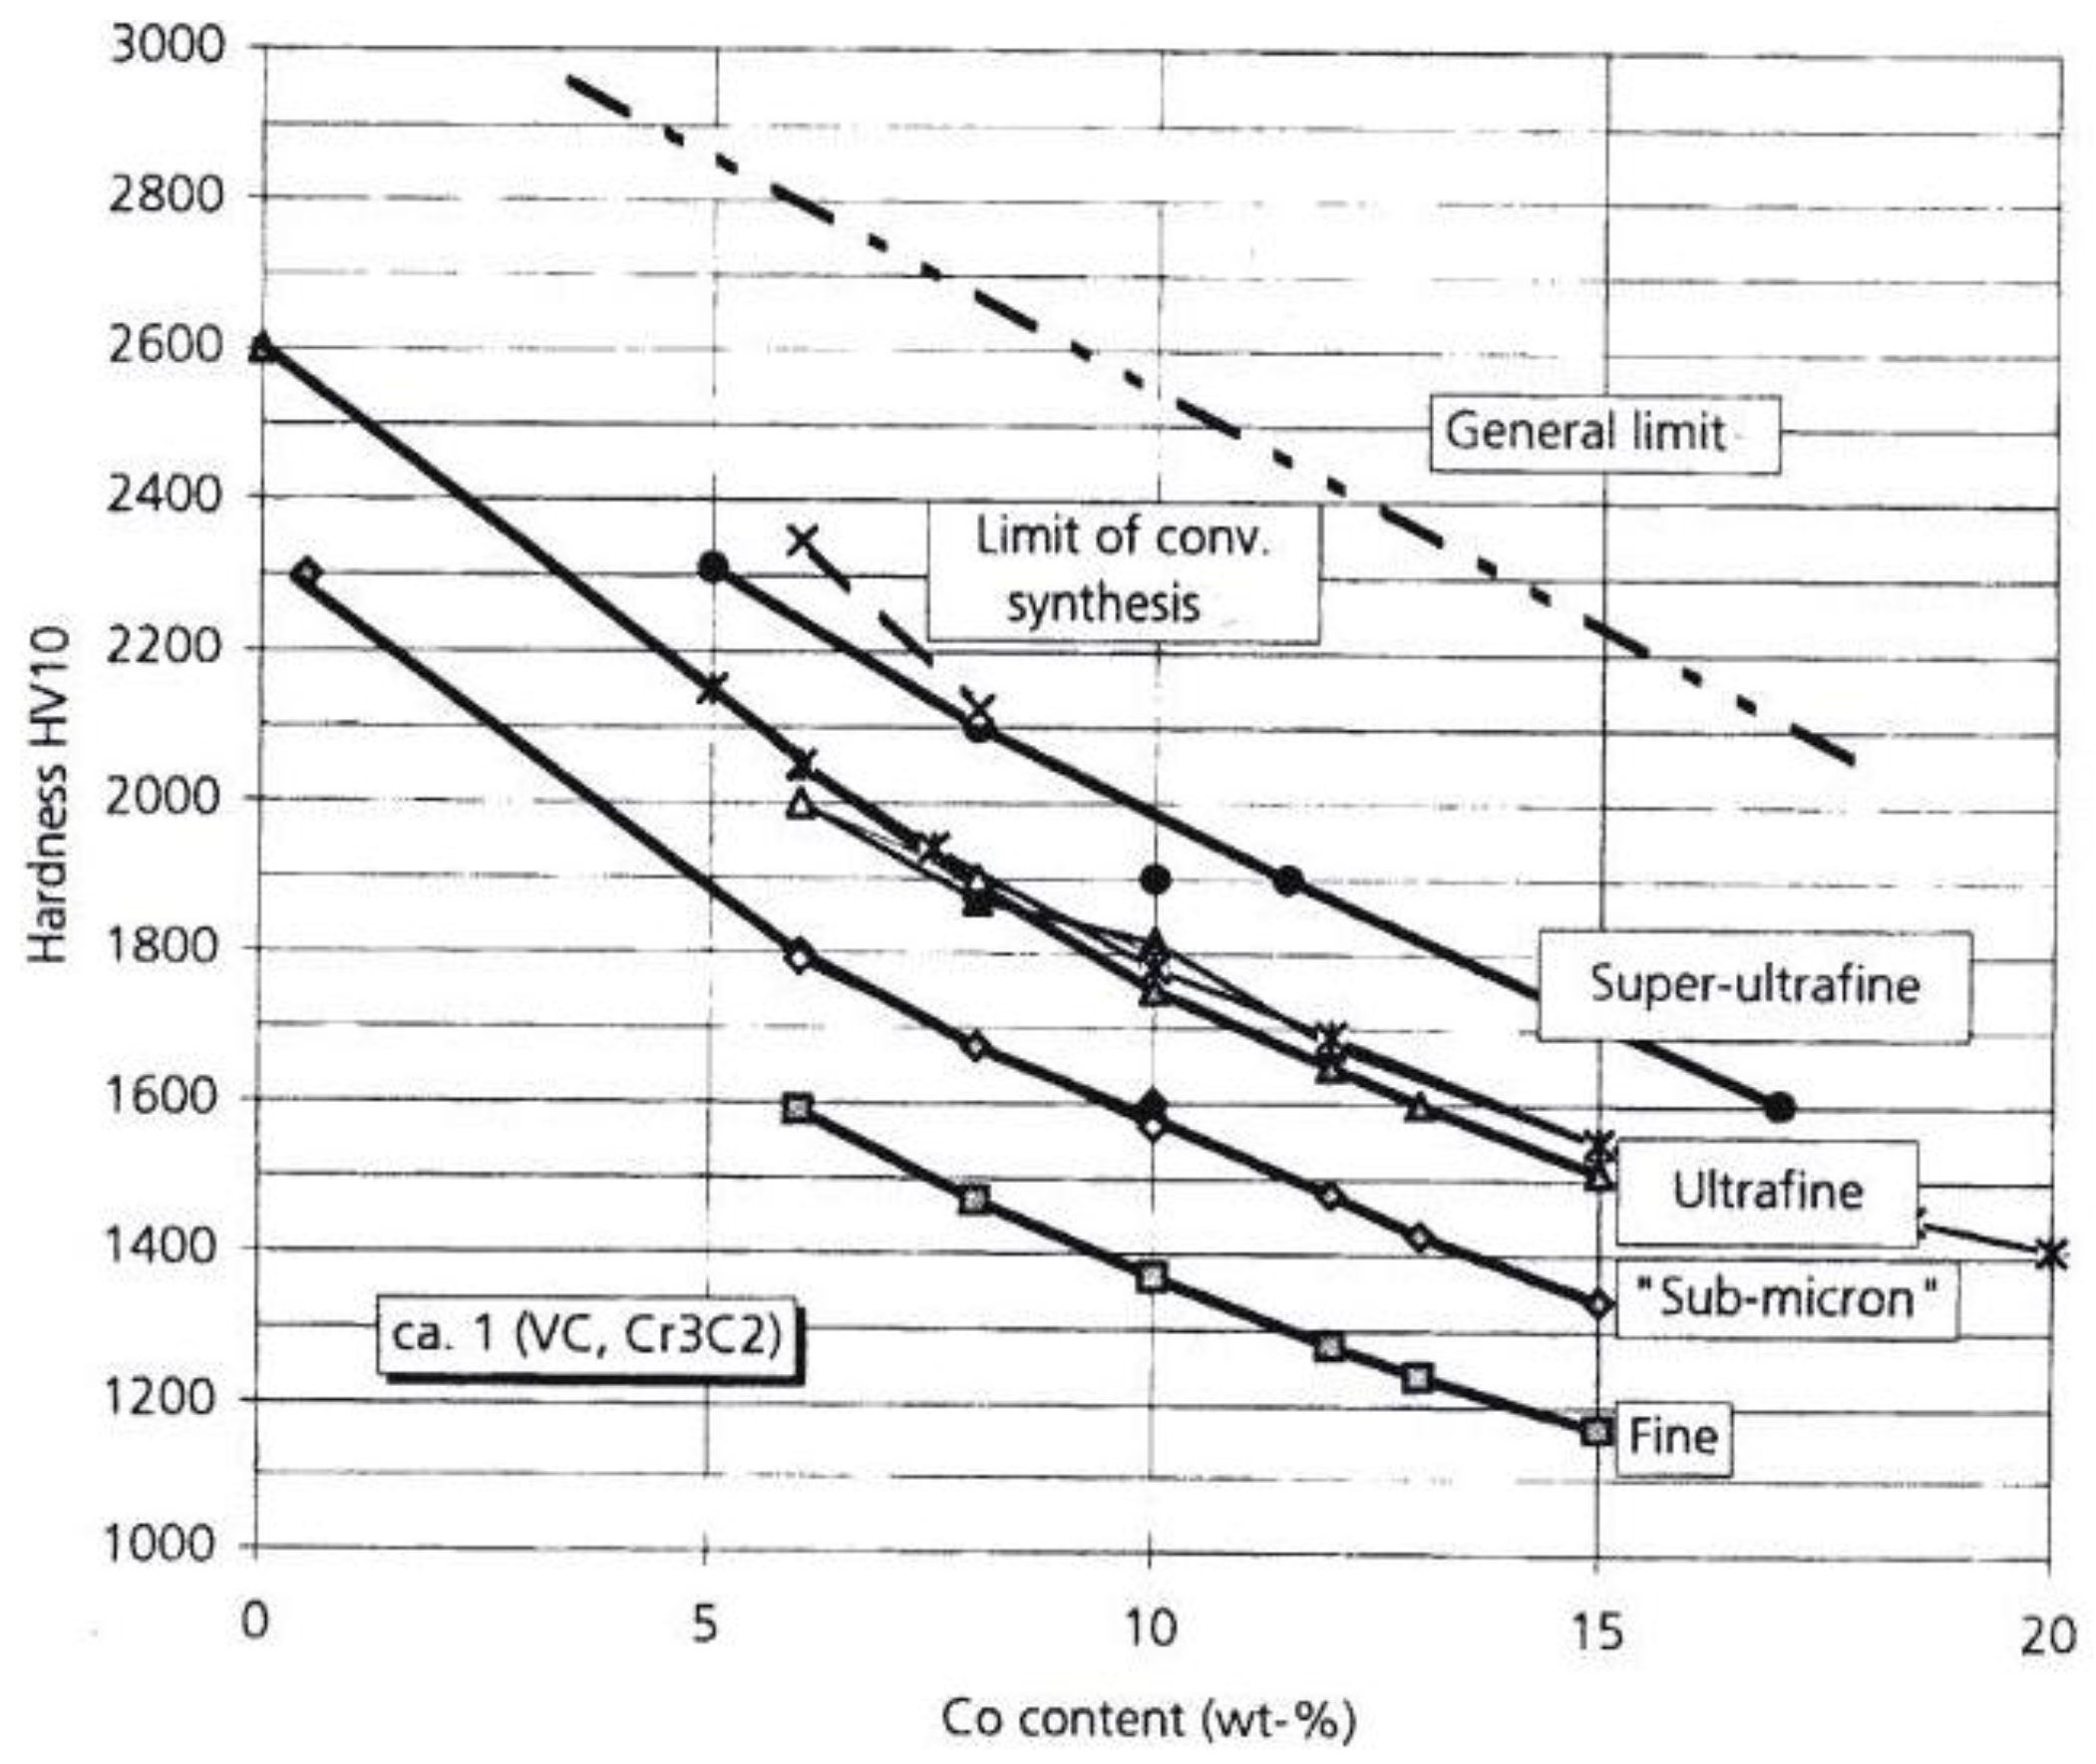
The strengthening effect of smaller WC particles is further established in Figure 13 by the positions of the filled triangle points that were taken from a follow-on investigation of the influence of ultrafine or sub-micrometer WC particle sizes on the composite properties [42]. These points were taken as representative ones along the middle “ultrafine” curve shown below in Figure 15 and were plotted at these particular volume percentages of 2.5, 6 and 11 weight percentages of Co along the reasonably narrowly defined particle sizes utilized for the curve; see also Table 1 in [42]. The lower hardness results were obtained for pressed and sintered superfine and super ultrafine ingredients. Upper limiting estimations of hardness shown as the dashed line in the figure and a limit on achievable hardness to be obtained by conventional methods were plotted. The particular hardness of 25 GPa shown for 0.4 µm WC particles on the WC ordinate scale in Figure 13 may be compared with the 26.6 GPa value for 0.3 µm particles that is plotted in Figure 5 on the hardness stress-strain graph for WC. The combination of the high H0 and fairly low kH has not produced a particularly large difference in hardness for the two particle sizes. Nevertheless, the results in Figure 15 were obtained in consideration of the possible benefit(s) to be gained in WC-Co materials composed of nano-scale constituents and also to provide an assessment of the finer WC particle sizes on the fracture toughness of the materials. Another report [43] has indicated a lesser strengthening effect at nanometer grain sizes and even weakening at the smallest nanometer dimensions. As indicated for the model description of Equation (1) for the fracture mechanics stress intensity KC, there is additional influence of the plastic zone size as well as the material grain size to be taken into account for the material toughness. For the material results covered in Figure 15, KC was found to decrease with decrease in particle size from a highest value of ~23 MPa.m1/2 (727 MPa.mm1/2) to a lower limiting value of ~5 MPa.m1/2 (~158 MPa.mm1/2) that was obtained for a substantial range of WC particle sizes from 3.2 to 0.4 µm. KC is, even at its lowest values, generally much greater than kH, which, if associated with cracking, can be about three or more times larger than kC in Equation (1). In other words, KC >> kH mainly because of the normally large value of the plastic zone size, s, and the crack-free fracture stress, σC, in Equation (1) [2].
Figure 15.
The hardness of WC-Co materials at smaller WC particle sizes [42].
Figure 15.
The hardness of WC-Co materials at smaller WC particle sizes [42].
6. The Fracture Toughness Properties of Al2O3 and WC
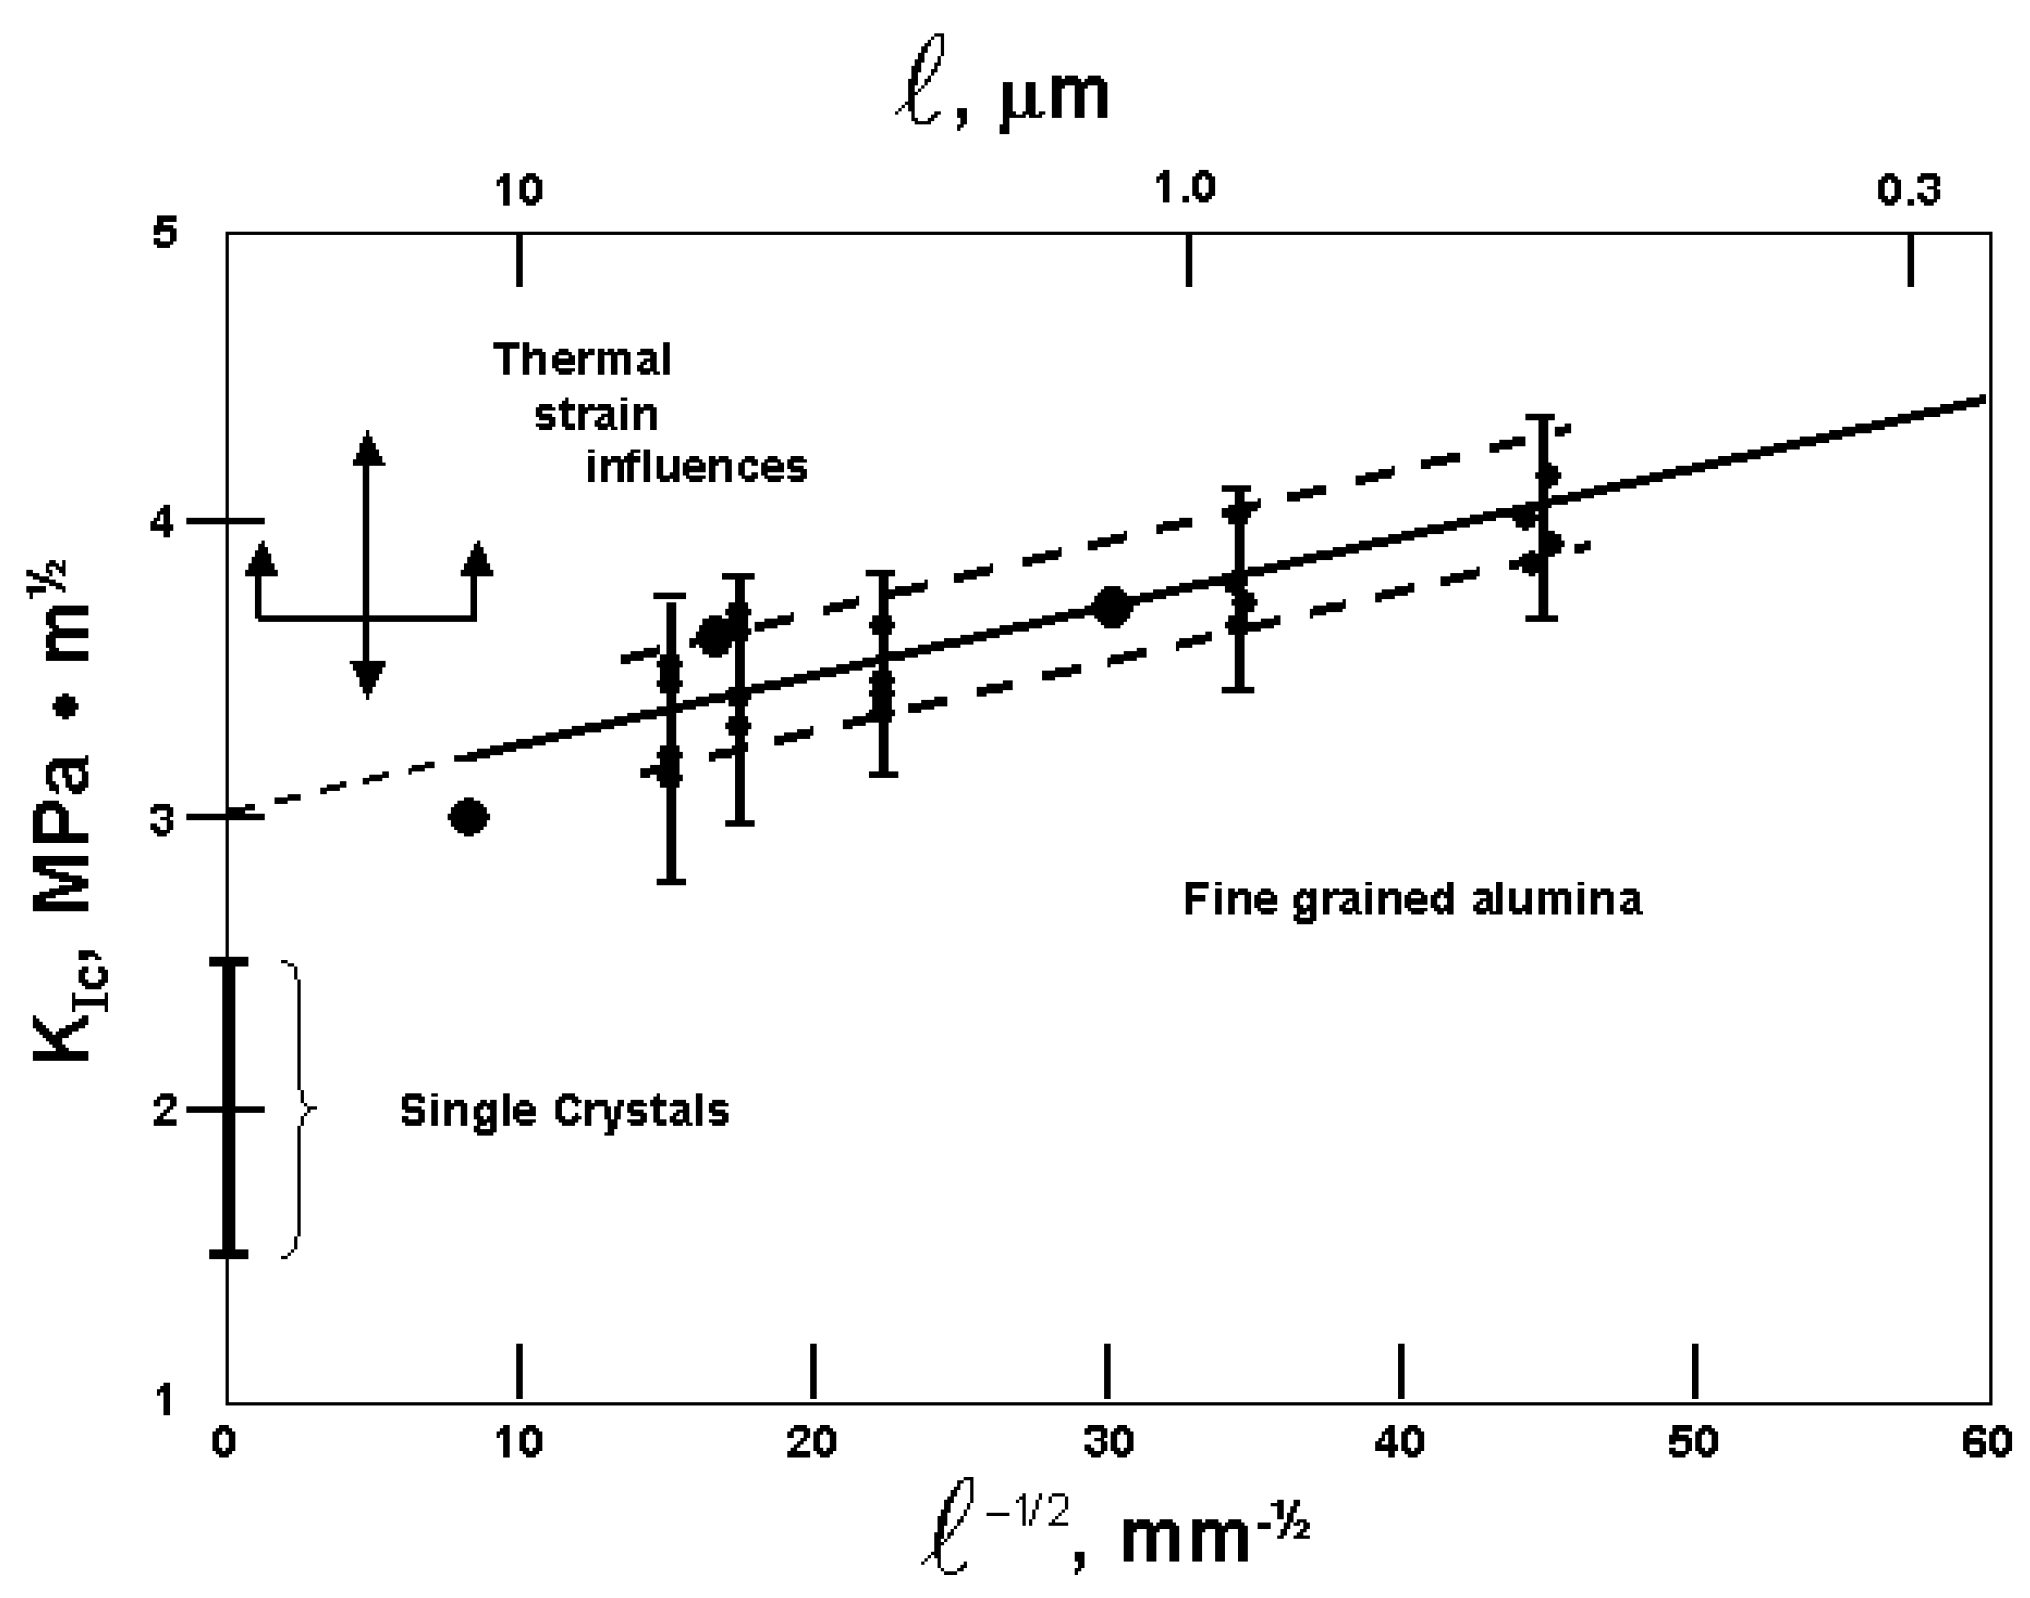
The afore mentioned complexity of mechanical property evaluations in the WC-Co and related composite material systems has prompted alternative approaches to the evaluation of the material strength and toughness properties [44], for example, involving a fractal mechanics approach for the widest hierarchical cases of geometry of the phases and structural nature of the materials [45]. Even for the hardness properties of the WC-Co system, there is sufficient complexity to have promoted a semi-empirical approach to deciphering the influences of the WC grain size and Co mean free paths [46]. To add a further challenge of complication, there are results reported [47] for a hybrid “double cemented” WC-Co system composed of pre-fabricated WC-Co alloy granules embedded in a separately added Co matrix. Here, we proceed with a step-by-step approach to the topic by beginning with a single material case and proceeding onward to greater complication. In that regard, Figure 16 shows a compilation of results [32] for the toughness of Al2O3 materials determined from indentation fracture mechanics measurements [48,49,50].
All of the fracture toughness measurements shown in Figure 16 are lower than the lowest values reported above for the WC-Co materials. In the Al2O3 figure, the larger filled-circle points at three grain sizes were determined for Hertzian type ring cracks formed in Al2O3 substrates under loads of 30–50 kgf applied to sapphire spheres of 5 mm diameter [48]. Ring crack depths of 2 to 13 µm were associated with surface crack diameters of ~300 to ~400 µm. The same trend was followed for somewhat lower KIc measurements evaluated for the different geometry of radial cracks of ~10 µm length at diamond pyramid indentations made at the smallest applied loads of 0.5 kgf. The smaller filled-circle points shown in the figure for five grain sizes, also with the noted experimental variations and bracketed by the band of dashed lines, are average diamond pyramid determined KIc values obtained at loads of 0.3, 0.5, 1.0 and 2.0 kgf [49]. The band of measurements shown in Figure 16 are in agreement with the linear H-P type prediction from Equation (1) based on a constant value of plastic zone size. Also shown on the ordinate axis of Figure 16 is a range of KIc measurements reported for tests on Al2O3 single crystals [50]. The vertical arrows shown between the single crystal and smaller grain size polycrystal measurements mark a region where thermal strains play a role in determining the material toughness, more often than not producing higher measurements because of induced plasticity.
Figure 16.
A compilation [32] of indentation fracture mechanics KIc measurements made on Al2O3 materials [48,49,50] plotted on the basis of Equation (1) with the plastic zone size, s, having a constant value.

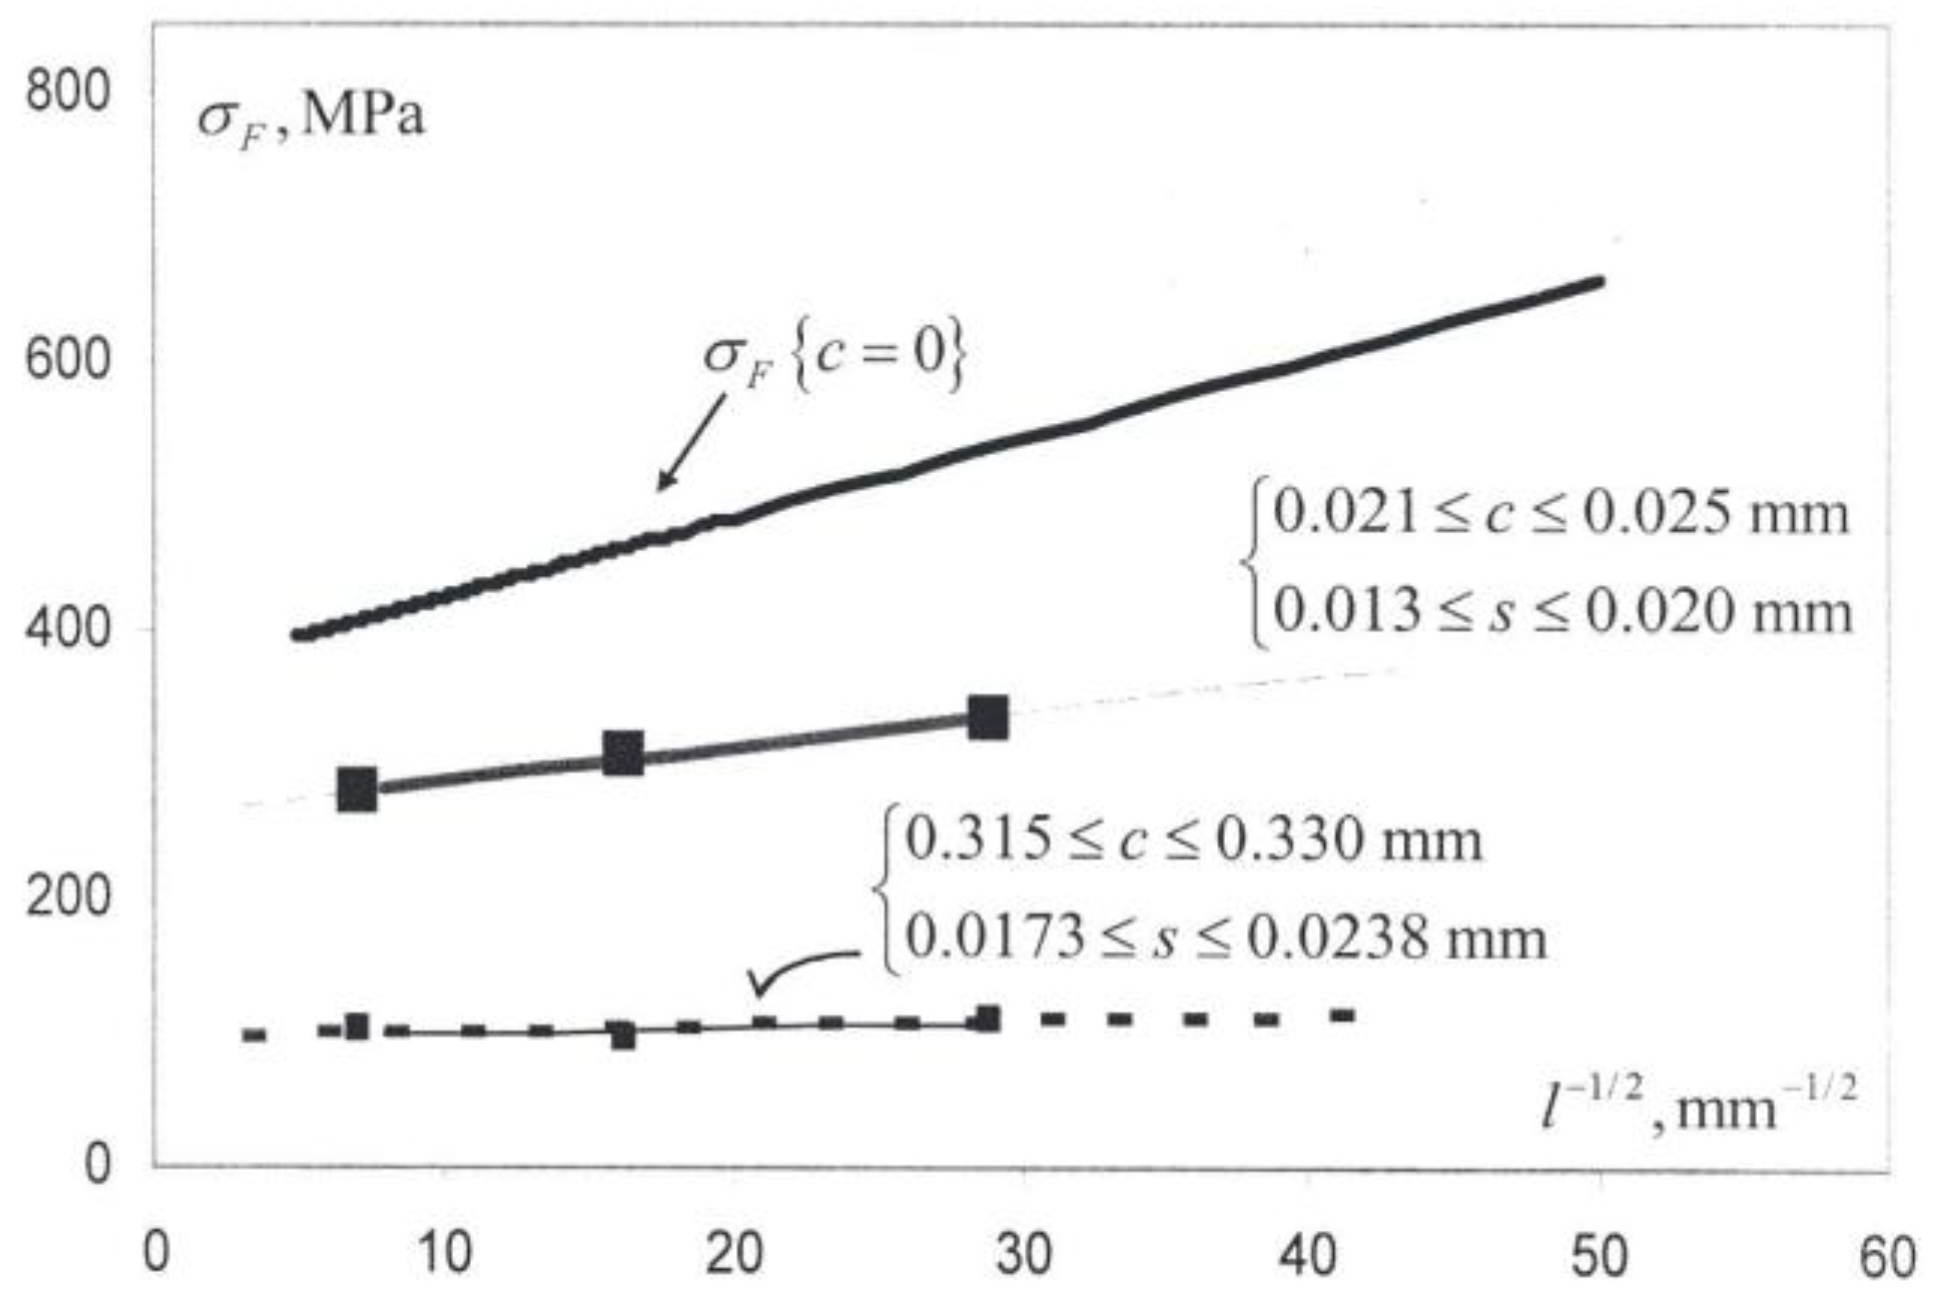
For larger crack sizes induced over a range of increasing applied loads from 1.0 to 25 kgf past the 0.5 kgf value utilized to obtain the filled-circle points in Figure 16, the grain size dependence of KIc was found to gradually reverse itself and, at the highest applied load of 25 kgf, to clearly decrease with decreasing grain size [48]. Table 1 shows a comparison of the diamond pyramid measurements made for the three grain sizes with application of the limiting applied loads of 0.5 and 25 kgf [1,48]. In the Table, the crack-free fracture stresses, σF0 = [σ0C + kCℓ−1/2] from Equation (1), were determined from a previously reported H-P dependence [51]. The calculations for the plastic zone size, s, and for the pre-crack fracture stresses, σFc, employing the two limiting equations that are given at the foot of the Table, were obtained from a model dislocation description of critical crack growth with an associated plastic zone at the crack tip [2,52]. The larger crack size influences on the determination of a KIc that decreases with decrease in grain size is matched with reduction of the H-P dependence for σFc but not so far as producing a similar reversed dependence. A later investigation [53] of strength, toughness and reliability of Al2O3 crack growth properties also showed greater toughness at the smallest crack sizes too but was soon reversed in agreement with those results described in Table 1.

Table 1.
Modeled pre-crack fracture stresses [1].
| ℓ, mm | KIc, MPa.m1/2 | c, mm | σFC, MPa | s, mm | σFC, MPa |
| 0.0012 | 3.16 | 0.0213 | 536 | 0.01365* | 335** |
| 0.0038 | 3.09 | 0.0225 | 461 | 0.01764 | 305.5 |
| 0.01984 | 2.95 | 0.0245 | 415 | 0.01984 | 277.6 |
| 0.0012 | 2.93 | 0.3301 | 536 | 0.01735* | 110.5^ |
| 0.0038 | 3.06 | 0.3239 | 461 | 0.01730 | 95.9 |
| 0.01984 | 3.23 | 0.3146 | 415 | 0.02379 | 102.75 |
*s = (π/8) (KIc/σF0)2; **σFC = σF0 √([s/c]/{1 + [s/c]}); ^σFC =(√8/π)σF0√(s/c)
Figure 17.
Crack-free and pre-crack H-P fracture stresses for Al2O3 [1].
Figure 17.
Crack-free and pre-crack H-P fracture stresses for Al2O3 [1].
Presentation of comparable fracture toughness properties of WC-Co material begins with the reminder of toughness decreasing at smaller WC particle sizes for those materials shown in Figure 15 [42]. In addition, toughness decreases with reduction of the mean free path, λ, of the binder Co phase. Figure 18 shows an updated compilation of results [42,54,55,56].
Figure 18.
A compilation of conventional and indentation fracture mechanics KIc measurements reported for WC-Co material [42,54,55,56] based on the Co mean free path, λ, dependence given in [54].
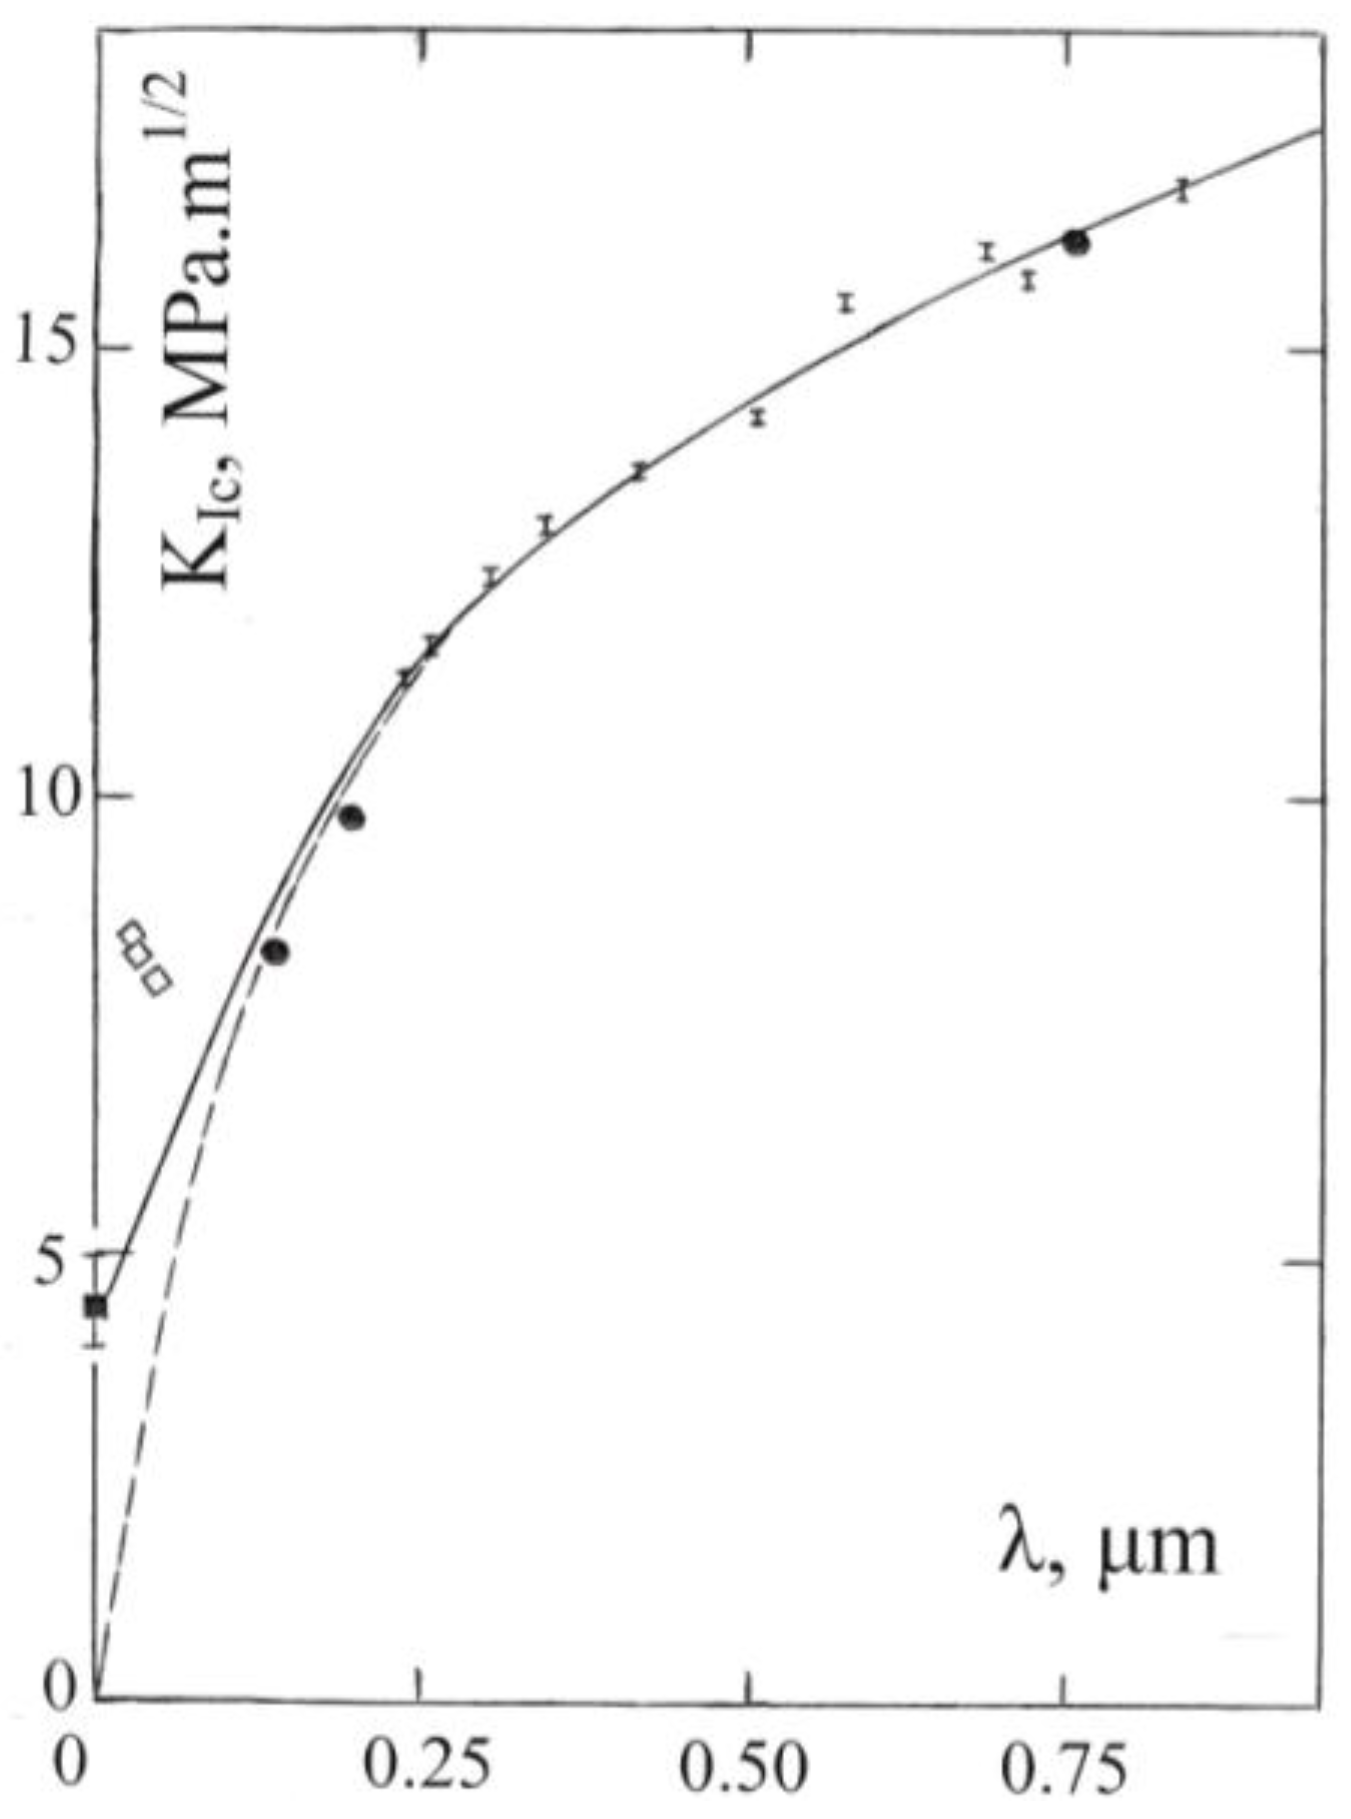
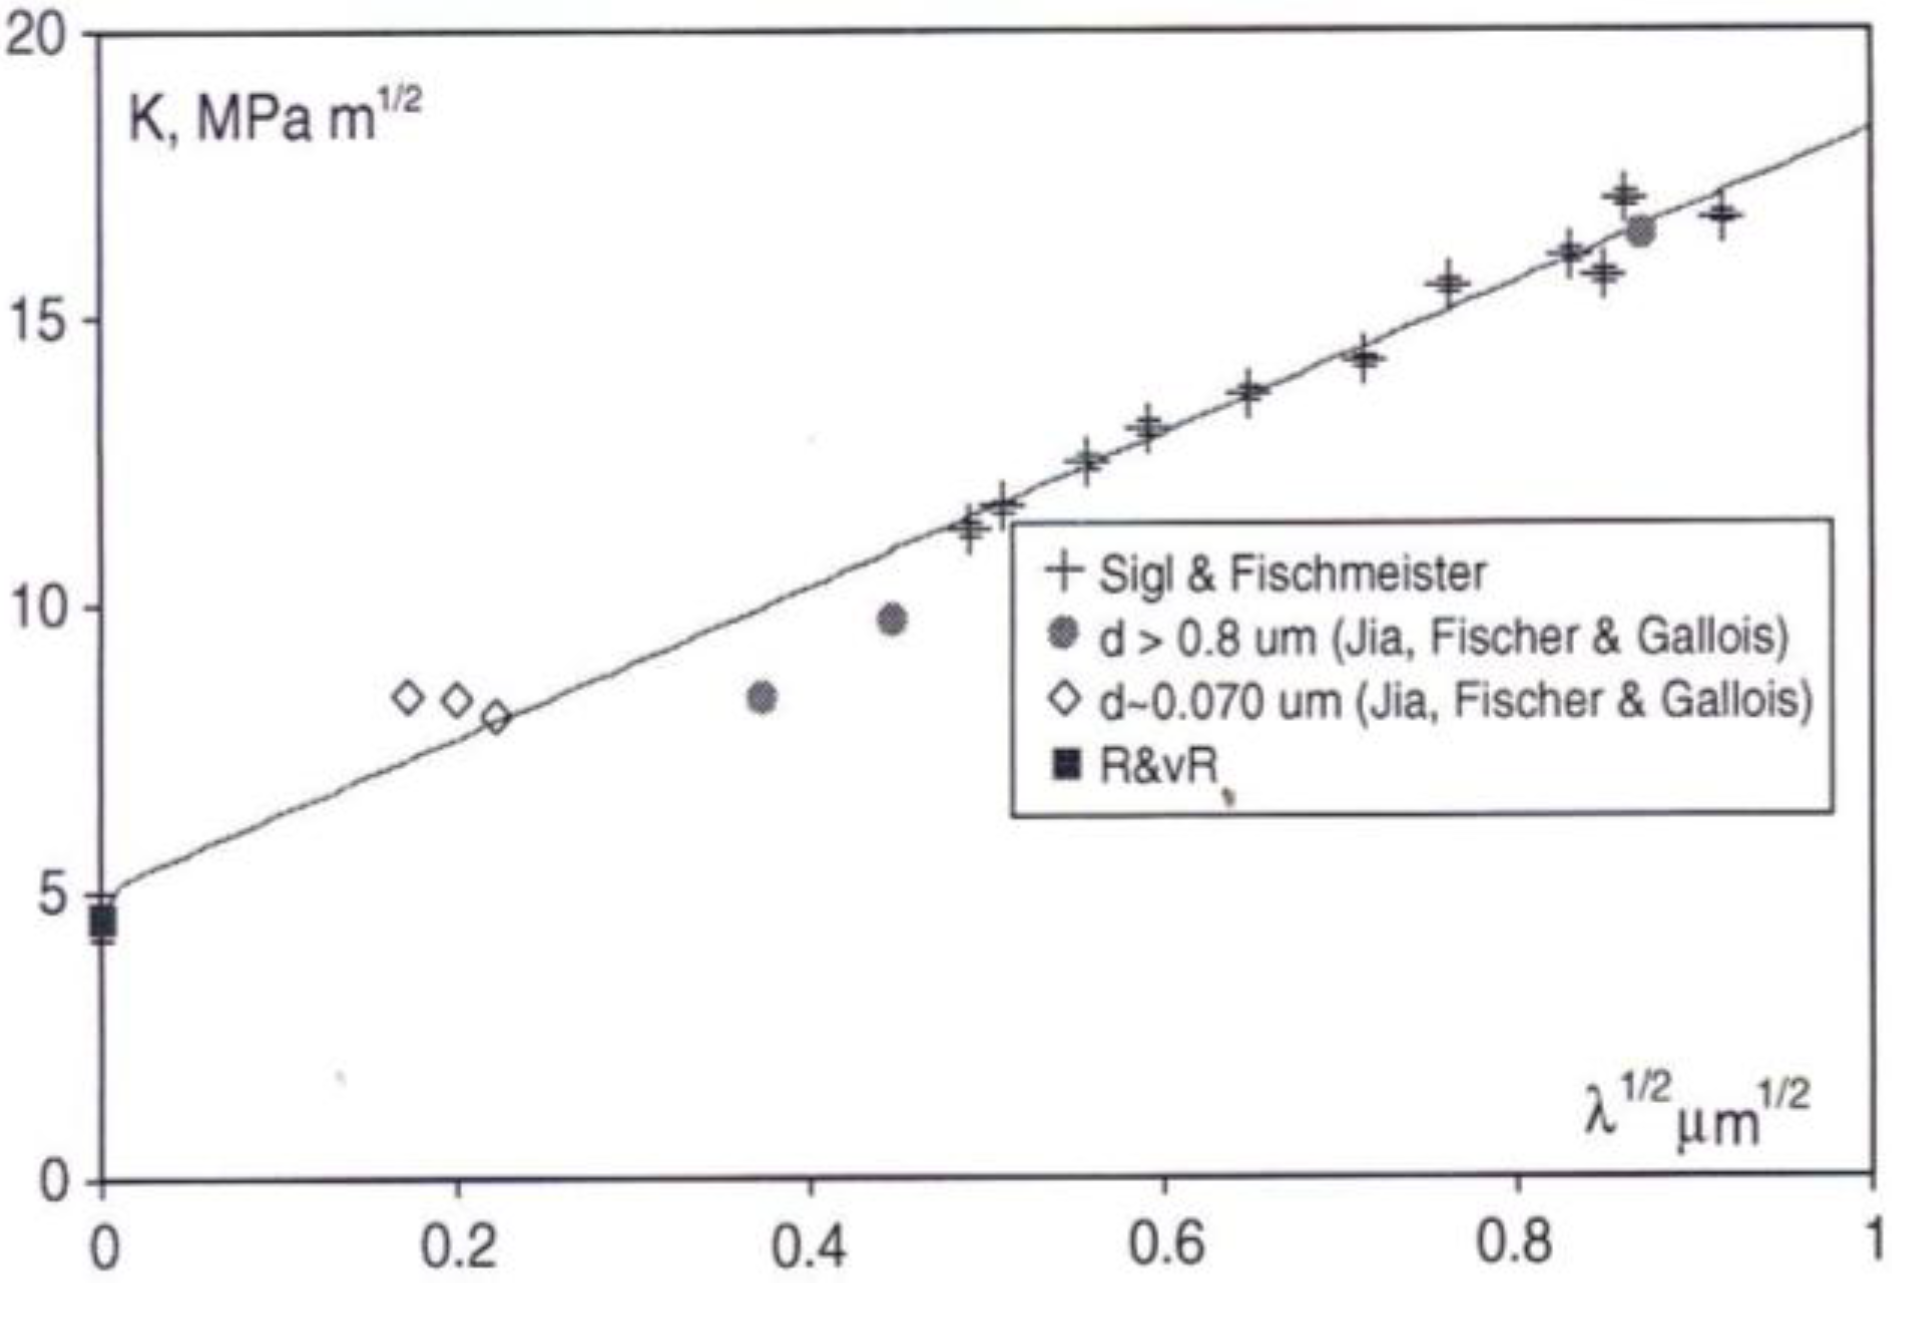
The abscissa and ordinate scales of Figure 18 have been extended from the previously reported figure [54] including only the important points shown as vertical short-line-segments [55]. These data were obtained in bend tests and the KIc measurements were computed on the basis of constructing a detailed account of the energies dissipated during the process of fracturing. Contiguity of the WC particles was taken into account. The fracturing energy was found to be governed by plastic dissipation associated with a “multiligament” path length spreading either within the Co binder or near to the binder/particle interfaces. The H-P dependence described for the Co phase from Equation (6) and in Figure 13 was taken into account in assessing the plastic work. In the original model description for which Figure 18 was constructed, the fracturing mechanism was described in terms of that two-part multiligament zone as compared with the earlier-mentioned plastic zone size, s, in Equation (1). Nevertheless as shown in the graph for the total measurements now also contained in Figure 19, the KIc measurements were able to be plotted in the form of Equation (1) with s and the grain size, ℓ, taken to be proportional to the cobalt mean free path, λ, so that
KIc = α1[σ0Cλ1/2 + α2kC]
The linear λ1/2 dependence shown in Figure 19 for KIc has been added to by incorporating other WC-Co results obtained at conventional (filled circle) and nanometer (open diamond) grain sizes for WC-Co materials [56] and for a toughness result reported for WC material [42], as also shown in each case in Figure 18. The added K (=KIc) measurements were obtained in IFM tests. The fracture paths of the nanostructured materials were shown also to follow a network of bridged ligaments consistent with the earlier results obtained at larger WC particle sizes [55]. Other K measurements involving agreement between microindentation and three point bending test measurements have been reported for Al2O3 and related ceramic materials [57].
Figure 19.
Conventional and indentation fracture mechanics measurements for WC-Co [1,42,55,56] based on Equation (1) with λ taken proportional both to the plastic zone size, s, and the particle size, ℓ.
Elevated temperature measurements over 20 to 1000 C have been reported for bend tests performed on WC-Co materials with micron and sub-micron WC particle sizes [58]. Measurements of the temperature dependence of the transverse rupture stresses for the micron particle size material followed the general trend indicated here in Figure 6 and Figure 11 also with fall-off in strength in the range of 800–900 K. A ductile-brittle transition (d-bt) just below those temperatures was associated with intersection of the rupture strength and yield stress curves. Significant plastic straining prior to fracturing occurred above the d-bt temperatures. Complete stereological measurements were reported. The ambient temperature hardness and fracture stress measurements in [58] were compared in [1] with estimations following on from Equation (4) and Figure 17, allowing for a proportional relationship between ℓ and λ for the tested material compositions. Again, fracturing was attributed largely to failure of the Co binder phase. An interesting report [59] relating to influence of temperature, while in agreement with the importance of the strength properties of the Co binder phase, has attributed a special role to thermal stresses associated with different thermal expansions of the phases in determining the material fracture toughness. The reported model for influence of the thermal expansion incompatibility on fracturing energy was shown to be consistent with an H-P dependence of the fracture stress and to give a similar dependence of the fracture mechanics stress intensity K value to that expressed in Equation (7) involving the Co binder mean free path. Such thermal stress consideration in the WC-Co system is given weight in a report of calculated micro-stresses and their measurement by x-ray and neutron diffraction methods [60].
7. Summary
The hardness and strength properties of WC-Co materials have been reviewed with the aid of related results obtained on Al2O3 and MgO crystals and polycrystals. First, microindentation and nanoindentation hardness test measurements were compared on a hardness type stress–strain basis that included description of the elastic, plastic and cracking behaviors of crystals. Then, consideration was given to a role for the importance of temperature in establishing the plastic strength properties of MgO, Al2O3 and WC crystals and WC-Co materials. A contiguity, C, modified Hall-Petch (H-P) relationship, taking into account WC-to-WC particle contacts, was shown to describe satisfactorily an increased hardness of WC-Co with decreased particle size while also thereby giving greater weight to the hardness properties of the Co binder phase. And, with important scatter of results to be taken into account, a relationship was established between the fracture strengths and fracture mechanics toughness properties of Al2O3 and WC-Co materials, in both cases, also with influence of crack sizes, grain sizes, and plastic zone sizes. All of the results obtained on the WC-Co composite system point to the importance of the Co binder mean free path dimensions in effecting the composite material toughness properties, finally mentioning their role in the fracturing behavior of internal thermal micro-stresses.
Acknowledgments
The author expresses appreciation to Natalia Dubrovinskaia, guest editor of “Hard Materials: Advances in Synthesis and Understanding” for inviting the present article via Emma Ma, Managing Editor of Materials, and with added thanks expressed for the reviewer comments.
References
- Armstrong, R.W.; Cazacu, O. Indentation fracture mechanics toughness dependence on grain size and crack size: Application to alumina and WC-Co. Int. J. Refract. Met. Hard Mater. 2006, 24, 129–134. [Google Scholar] [CrossRef]
- Armstrong, R.W. Dislocation viscoplasticity aspects of material fracturing. Eng. Fract. Mech. 2010, 77, 1348–1359. [Google Scholar] [CrossRef]
- Mitchell, T.E.; Heuer, A.H. Dislocations and mechanical properties of ceramics. In Dislocations in Solids; Nabarro, F.R.N., Hirth, J.P., Eds.; Elsevier B.V.: Oxford, UK, 2004; Volume 12, pp. 339–402. [Google Scholar]
- Armstrong, R.W.; Elban, W.L. Dislocations in energetic crystals. In Dislocations in Solids; Nabarro, F.R.N., Hirth, J.P., Eds.; Elsevier B.V.: Oxford, UK, 2004; Volume 12, pp. 403–446. [Google Scholar]
- Lawn, B.R. Hertzian fracture in single crystals with the diamond structure. J. Appl. Phys. 1968, 39, 4828–4836. [Google Scholar] [CrossRef]
- Armstrong, R.W. Dislocation Pile-ups: From {110} cracking in MgO crystals to model strength evaluations. Mater. Sci. Eng. A 2005, 409, 24–31. [Google Scholar] [CrossRef]
- Armstrong, R.W.; Wu, C.C. Lattice misorientation and displaced volume for hardness indentations in MgO crystals. J. Amer. Ceram. Soc. 1978, 61, 102–106. [Google Scholar] [CrossRef]
- Tromas, C.; Girard, J.C.; Audurier, V.; Woirgard, J. Study of the low stress plasticity in single-crystal MgO by nanoindentation and atomic force microscopy. J. Mater. Sci. 1999, 34, 5337–5342. [Google Scholar] [CrossRef]
- Armstrong, R.W.; Ferranti, L., Jr.; Thadhani, N.N. Elastic/plastic/cracking indentation behavior of hard materials. Int. J. Refract. Met. Hard Mater. 2006, 24, 11–16. [Google Scholar] [CrossRef]
- Lu, C.; Mai, Y.-W.; Tam, P.L.; Shen, Y.G. Nanoindentation-induced elastic-plastic transition and size effect in α-Al2O3 (0001). Philos. Mag. Lett. 2007, 87, 409–415. [Google Scholar] [CrossRef]
- Ferranti, L., Jr.; Armstrong, R.W.; Thadhani, N.N. Elastic/plastic indentation behavior in a continuous ball indentation test. Mater. Sci. Eng. A 2004, 371, 251–255. [Google Scholar] [CrossRef]
- Krell, A.; Schadlich, S. Depth sensing hardness in sapphire and in sintered sub-μm alumina. Int. J. Refract. Met. Hard Mater. 2001, 19, 237–243. [Google Scholar] [CrossRef]
- Chaudhri, M.M. Enhanced cathodoluminescence from nanoindentations in MgO. Philos. Mag. Lett. 1998, 77, 7–16. [Google Scholar] [CrossRef]
- Armstrong, R.W.; Elban, W.L. Macro- to nano-indentation hardness stress-strain aspects of crystal elastic/plastic/cracking behaviors. Exp. Mech. 2010, 50, 545–552. [Google Scholar] [CrossRef]
- Gilman, J.J. Chemistry and Physics of Mechanical Hardness; John Wiley & Sons, Inc.: New York, NY, USA, 2009. [Google Scholar]
- Gee, M.G.; Roebuck, B.; Lindahl, P.; Andren, H.-O. Constitutent phase nanoindentation of WC/Co and Ti(C,N) hard metals. Mater. Sci. Eng. A 1996, A209, 128–136. [Google Scholar] [CrossRef]
- Lee, H.C.; Gurland, J. Hardness and deformation of cemented tungsten carbide. Mater. Sci. Eng. A 1978, 33, 125–133. [Google Scholar] [CrossRef]
- Lee, M. High temperature hardness of tungsten carbide. Metall. Trans. A 1983, 14A, 1625–1629. [Google Scholar] [CrossRef]
- Leslie, W.C.; Sober, R.J. Yielding and plastic flow in a polycrystalline “interstitial-free” Fe-0.15% Ti alloy. Trans. ASM 1967, 60, 99–111. [Google Scholar]
- Copley, S.M.; Pask, J.A. Plastic deformation of MgO single crystals up to 1600 C. J. Am. Ceram. Soc. 1965, 48, 139–146. [Google Scholar] [CrossRef]
- Butt, M.Z.; Khaleeq-ur-Rahman, M.; Ali, D. On the strain-rate dependence of flow stress in crystals with high intrinsic lattice friction. J. Phys. D Appl. Phys. 2009, 42, 035405:1–035405:3. [Google Scholar] [CrossRef]
- Singh, R.N.; Coble, R.L. Dynamic dislocation behavior in iron-doped magnesium oxide crystals containing dislocation dipoles. J. Appl. Phys. 1974, 45, 5129–5135. [Google Scholar] [CrossRef]
- Chaudhri, M.M.; Wells, J.K.; Stephens, A. The dynamic hardness, deformation and fracture of simple ionic-crystals at very high rates of strain. Philos. Mag. A 1981, A43, 643–664. [Google Scholar] [CrossRef]
- Kim, K.S.; Clifton, R.J. Dislocation motion in MgO crystals under plate impact. J. Mater. Sci. 1984, 19, 1428–1438. [Google Scholar] [CrossRef]
- Armstrong, R.W.; Arnold, W.; Zerilli, F.J. Dislocation mechanics of copper and iron in high rate deformation tests. J. Appl. Phys. 2009, 105, 023511:1–023511:7. [Google Scholar]
- Armstrong, R.W.; Raghuram, A.C. Anisotropy of microhardness in crystals. In The Science of Hardness Testing and Its Research Applications; Westbrook, J.H., Conrad, H., Eds.; ASM: Metals Park, OH, USA, 1973; pp. 174–186. [Google Scholar]
- Yoo, K.-C.; Rosemeier, R.G.; Elban, W.L.; Armstrong, R.W. X-ray topography evidence for energy dissipation at indentation cracks in MgO crystals. J. Mater. Sci. Lett. 1984, 3, 560–562. [Google Scholar] [CrossRef]
- Hammond, B.L.; Armstrong, R.W. Recovered elastic and plastic strains at residual micro-indentations in MgO crystals. Philos. Mag. Lett. 1988, 57, 41–47. [Google Scholar] [CrossRef]
- Armstrong, R.W.; Codd, I.; Douthwaite, R.M.; Petch, N.J. The plastic deformation of polycrystalline aggregates. Philos. Mag. 1962, 7, 45–54. [Google Scholar] [CrossRef]
- Armstrong, R.W. Strength and strain rate sensitivity of nanopolycrystals. In Mechanical Properties of Nanocrystalline Materials; Li, J.C.M., Ed.; Pan Stanford Publishing Pte, Ltd.: Singapore, 2011; pp. 61–91. [Google Scholar]
- Skrovanek, S.D.; Bradt, R.C. Microhardness of fine-grain-size Al2O3. J. Am. Ceram. Soc. 1979, 62, 215–216. [Google Scholar] [CrossRef]
- Armstrong, R.W. Grain size dependent fracture mechanics stress intensity. Int. J. Refract. Met. Hard Mater. 2001, 19, 251–255. [Google Scholar] [CrossRef]
- Rice, R.W.; Wu, C.C.; Borchelt, F. Hardness—grain size relations in ceramics. J. Am. Ceram. Soc. 1994, 77, 2539–2553. [Google Scholar] [CrossRef]
- Krell, A. Improved hardness and hierarchic influences on wear in submicron sintered alumina. Mater. Sci. Eng. A 1995, 209, 156–163. [Google Scholar] [CrossRef]
- Franco, A.; Roberts, S.G.; Warren, P.D. Fracture toughness, surface flaw sizes, and flaw densities in alumina. Acta Mater. 1997, 45, 1009–1015. [Google Scholar] [CrossRef]
- Krell, A.; Blank, P. Grain size dependence of hardness in dense submicrometer alumina. J. Am. Ceram. Soc. 1995, 78, 1118–1120. [Google Scholar] [CrossRef]
- Gurland, J. Some aspects of the plastic deformation of phase mixtures with coarse microstructures. In Yield, Flow and Fracture of Polycrystals; Baker, T.N., Ed.; Applied Science Publisher Inc.: London, UK, 1983; pp. 51–67. [Google Scholar]
- Underwood, E.E. Quantitative Stereology; Addison-Wesley: Reading, MA, USA, 1970. [Google Scholar]
- Golovchan, V.T.; Litoshenko, N.V. On the contiguity of carbide phase in WC-Co hardmetals. Int. J. Refract. Met. Hard Mater. 2003, 21, 241–244. [Google Scholar] [CrossRef]
- Christensen, M.; Wahnstrom, G.; Lay, S.; Allibert, C.H. Morphology of WC grains in WC-Co alloys: Theoretical determination of grain shapes. Acta Mater. 2006, 55, 1515–1521. [Google Scholar] [CrossRef]
- Shatov, A.V.; Ponomarev, S.S.; Firtov, S.A. Modeling of the effect of flatter shape of WC crystals on the hardness of WC-Ni cemented carbides. Int. J. Refract. Met. Hard Mater. 2009, 27, 198–212. [Google Scholar] [CrossRef]
- Richter, V.; Ruthendorf, M.V. On hardness and toughness of ultrafine and nanocrystalline hard materials. Int. J. Refract. Met. Hard Mater. 1999, 17, 141–152. [Google Scholar] [CrossRef]
- Conrad, H.; Narayan, J. Grain size hardening and softening in tungsten carbide at low homologous temperatures. In Electron Microscopy: Its Role in Material Science (The Mike Meshii Symposium); Weertman, J.R., Fine, M., Faber, K., Liaw, P., Eds.; The Minerals, Metals and Materials Society: Warrendale, PA, USA, 2003; pp. 141–148. [Google Scholar]
- Carpinteri, A.; Pugno, N.; Puzzi, S. Strength vs. toughness optimization of microstructural composites. Chaos Solitons Fractals 2009, 39, 1210–1223. [Google Scholar] [CrossRef]
- Carpinteri, A.; Paggi, M. A top-down approach for the prediction of hardness and toughness of hierarchical materials. Chaos Solitons Fractals 2009, 42, 2546–2552. [Google Scholar] [CrossRef]
- Makhele-Lekala, L.; Luyckx, S.; Nabarro, F.R.N. Semi-empirical relationship between the hardness, grain size, and mean free path of WC-Co. Int. J. Refract. Met. Hard Mater. 2001, 19, 245–249. [Google Scholar] [CrossRef]
- Deng, X.; Patterson, B.R.; Chawla, K.K.; Koopman, M.C.; Fang, Z.; Lockwood, G.; Griffo, A. Mechanical properties of a hybrid cemented carbide composite. Int. J. Refract. Met. Hard Mater. 2001, 19, 547–552. [Google Scholar] [CrossRef]
- Franco, A.; Roberts, S.G.; Warren, P.D. Fracture toughness, surface flaw sizes, and flaw densities in alumina. Acta Mater. 1997, 45, 1009–1015. [Google Scholar] [CrossRef]
- Muchtar, A.; Lim, L.C. Indentation fracture toughness of high purity submicron alumina. Acta Mater. 1998, 46, 1683–1690. [Google Scholar] [CrossRef]
- Rice, R.W. Mechanical Properties of Ceramics and Composites; Marcel Dekker, Inc.: New York, NY, USA, 2000; p. 80. [Google Scholar]
- Rice, R.W. Review: Ceramic tensile strength–grain size relations: Grain sizes, slopes and branch intersections. J. Mater. Sci. 1997, 32, 1673–1692. [Google Scholar] [CrossRef]
- Armstrong, R.W. The (cleavage) strength of pre-cracked polycrystals. Eng. Fract. Mech. 1987, 28, 529–538. [Google Scholar] [CrossRef]
- Kovar, D.; Bennison, S.J.; Readey, M.J. Crack stability and strength variability in alumina ceramics with rising toughness-curve behavior. Acta Mater. 2000, 48, 565–578. [Google Scholar] [CrossRef]
- Kotoul, M. On the shielding effect of a multiligament zone of a crack in WC-Co. Acta Mater. 1997, 45, 3363–3376. [Google Scholar] [CrossRef]
- Sigl, L.S.; Fischmeister, H.F. On the fracture toughness of cemented carbides. Acta Mater. 1988, 36, 887–897. [Google Scholar] [CrossRef]
- Jia, K.; Fischer, T.E.; Gallois, B. Microstructure, hardness and toughness of nanostructured and conventional WC-Co composites. NanoStruct. Mater. 1998, 10, 875–891. [Google Scholar] [CrossRef]
- Lee, M.; Brun, M.K. Fracture toughness measurement by microindentation and three-point bend methods. Mater. Sci. Eng. 1988, 105-106, 369–375. [Google Scholar] [CrossRef]
- Milman, Yu.V.; Luyckx, S.; Goncharuck, V.A.; Northrop, J.T. Results from bending tests on submicron and micron WC-Co grades at elevated temperatures. Int. J. Refract. Met. Hard Mater. 2002, 20, 71–79. [Google Scholar] [CrossRef]
- Liu, B.; Zhang, Y.; Ouyang, S. Study on the relation between structural parameters and fracture strength of WC-Co cemented carbides. Mater. Chem. Phys. 2000, 62, 35–43. [Google Scholar] [CrossRef]
- Golovchan, V.T. On the thermal residual microstresses in WC-CO hard metals. Int. J. Refract. Met. Hard Mater. 2007, 25, 341–344. [Google Scholar] [CrossRef]
© 2011 by the authors; licensee MDPI, Basel, Switzerland. This article is an open access article distributed under the terms and conditions of the Creative Commons Attribution license (http://creativecommons.org/licenses/by/3.0/).
Share and Cite
MDPI and ACS Style
Armstrong, R.W. The Hardness and Strength Properties of WC-Co Composites. Materials 2011, 4, 1287-1308. https://doi.org/10.3390/ma4071287
AMA Style
Armstrong RW. The Hardness and Strength Properties of WC-Co Composites. Materials. 2011; 4(7):1287-1308. https://doi.org/10.3390/ma4071287
Chicago/Turabian StyleArmstrong, Ronald W. 2011. "The Hardness and Strength Properties of WC-Co Composites" Materials 4, no. 7: 1287-1308. https://doi.org/10.3390/ma4071287