Monitoring Wood Degradation during Weathering by Cellulose Crystallinity

 ,
, 
Abstract
:1. Introduction
2. Experimental Section
2.1. Sample Preparation
2.2. XRD Measurements
2.3. FT-IR Measurements
3. Results and Discussion
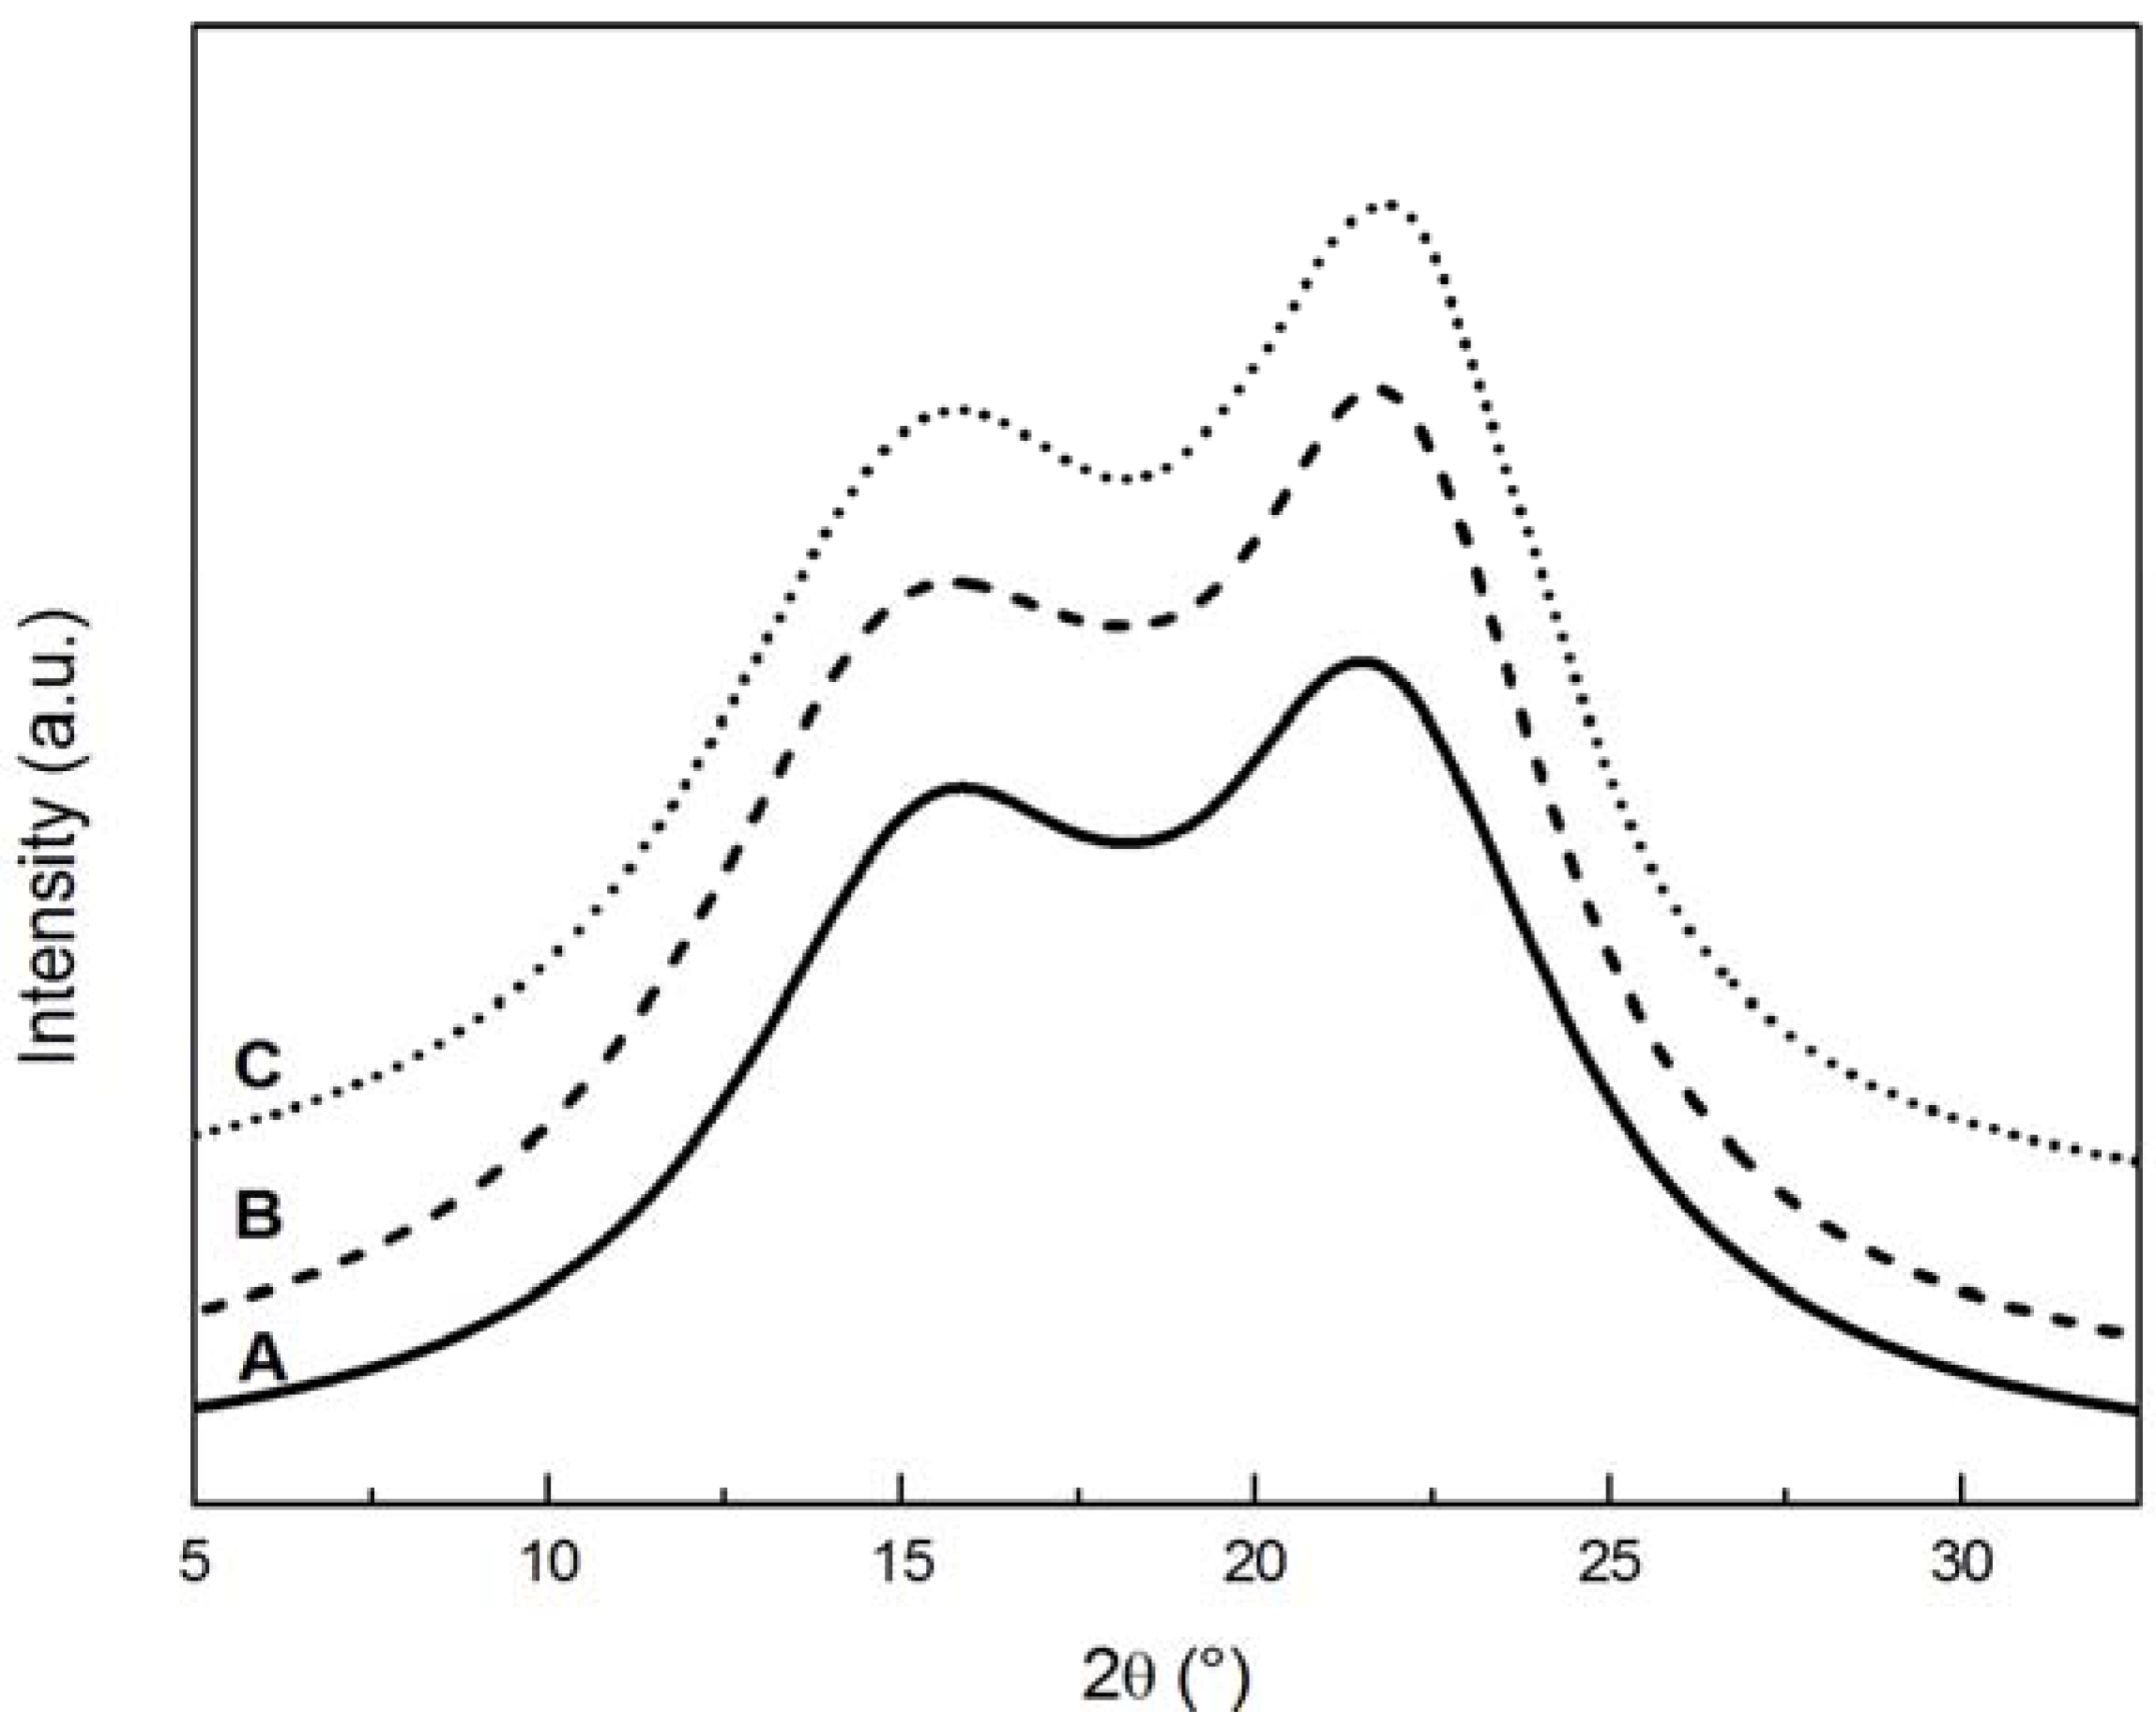
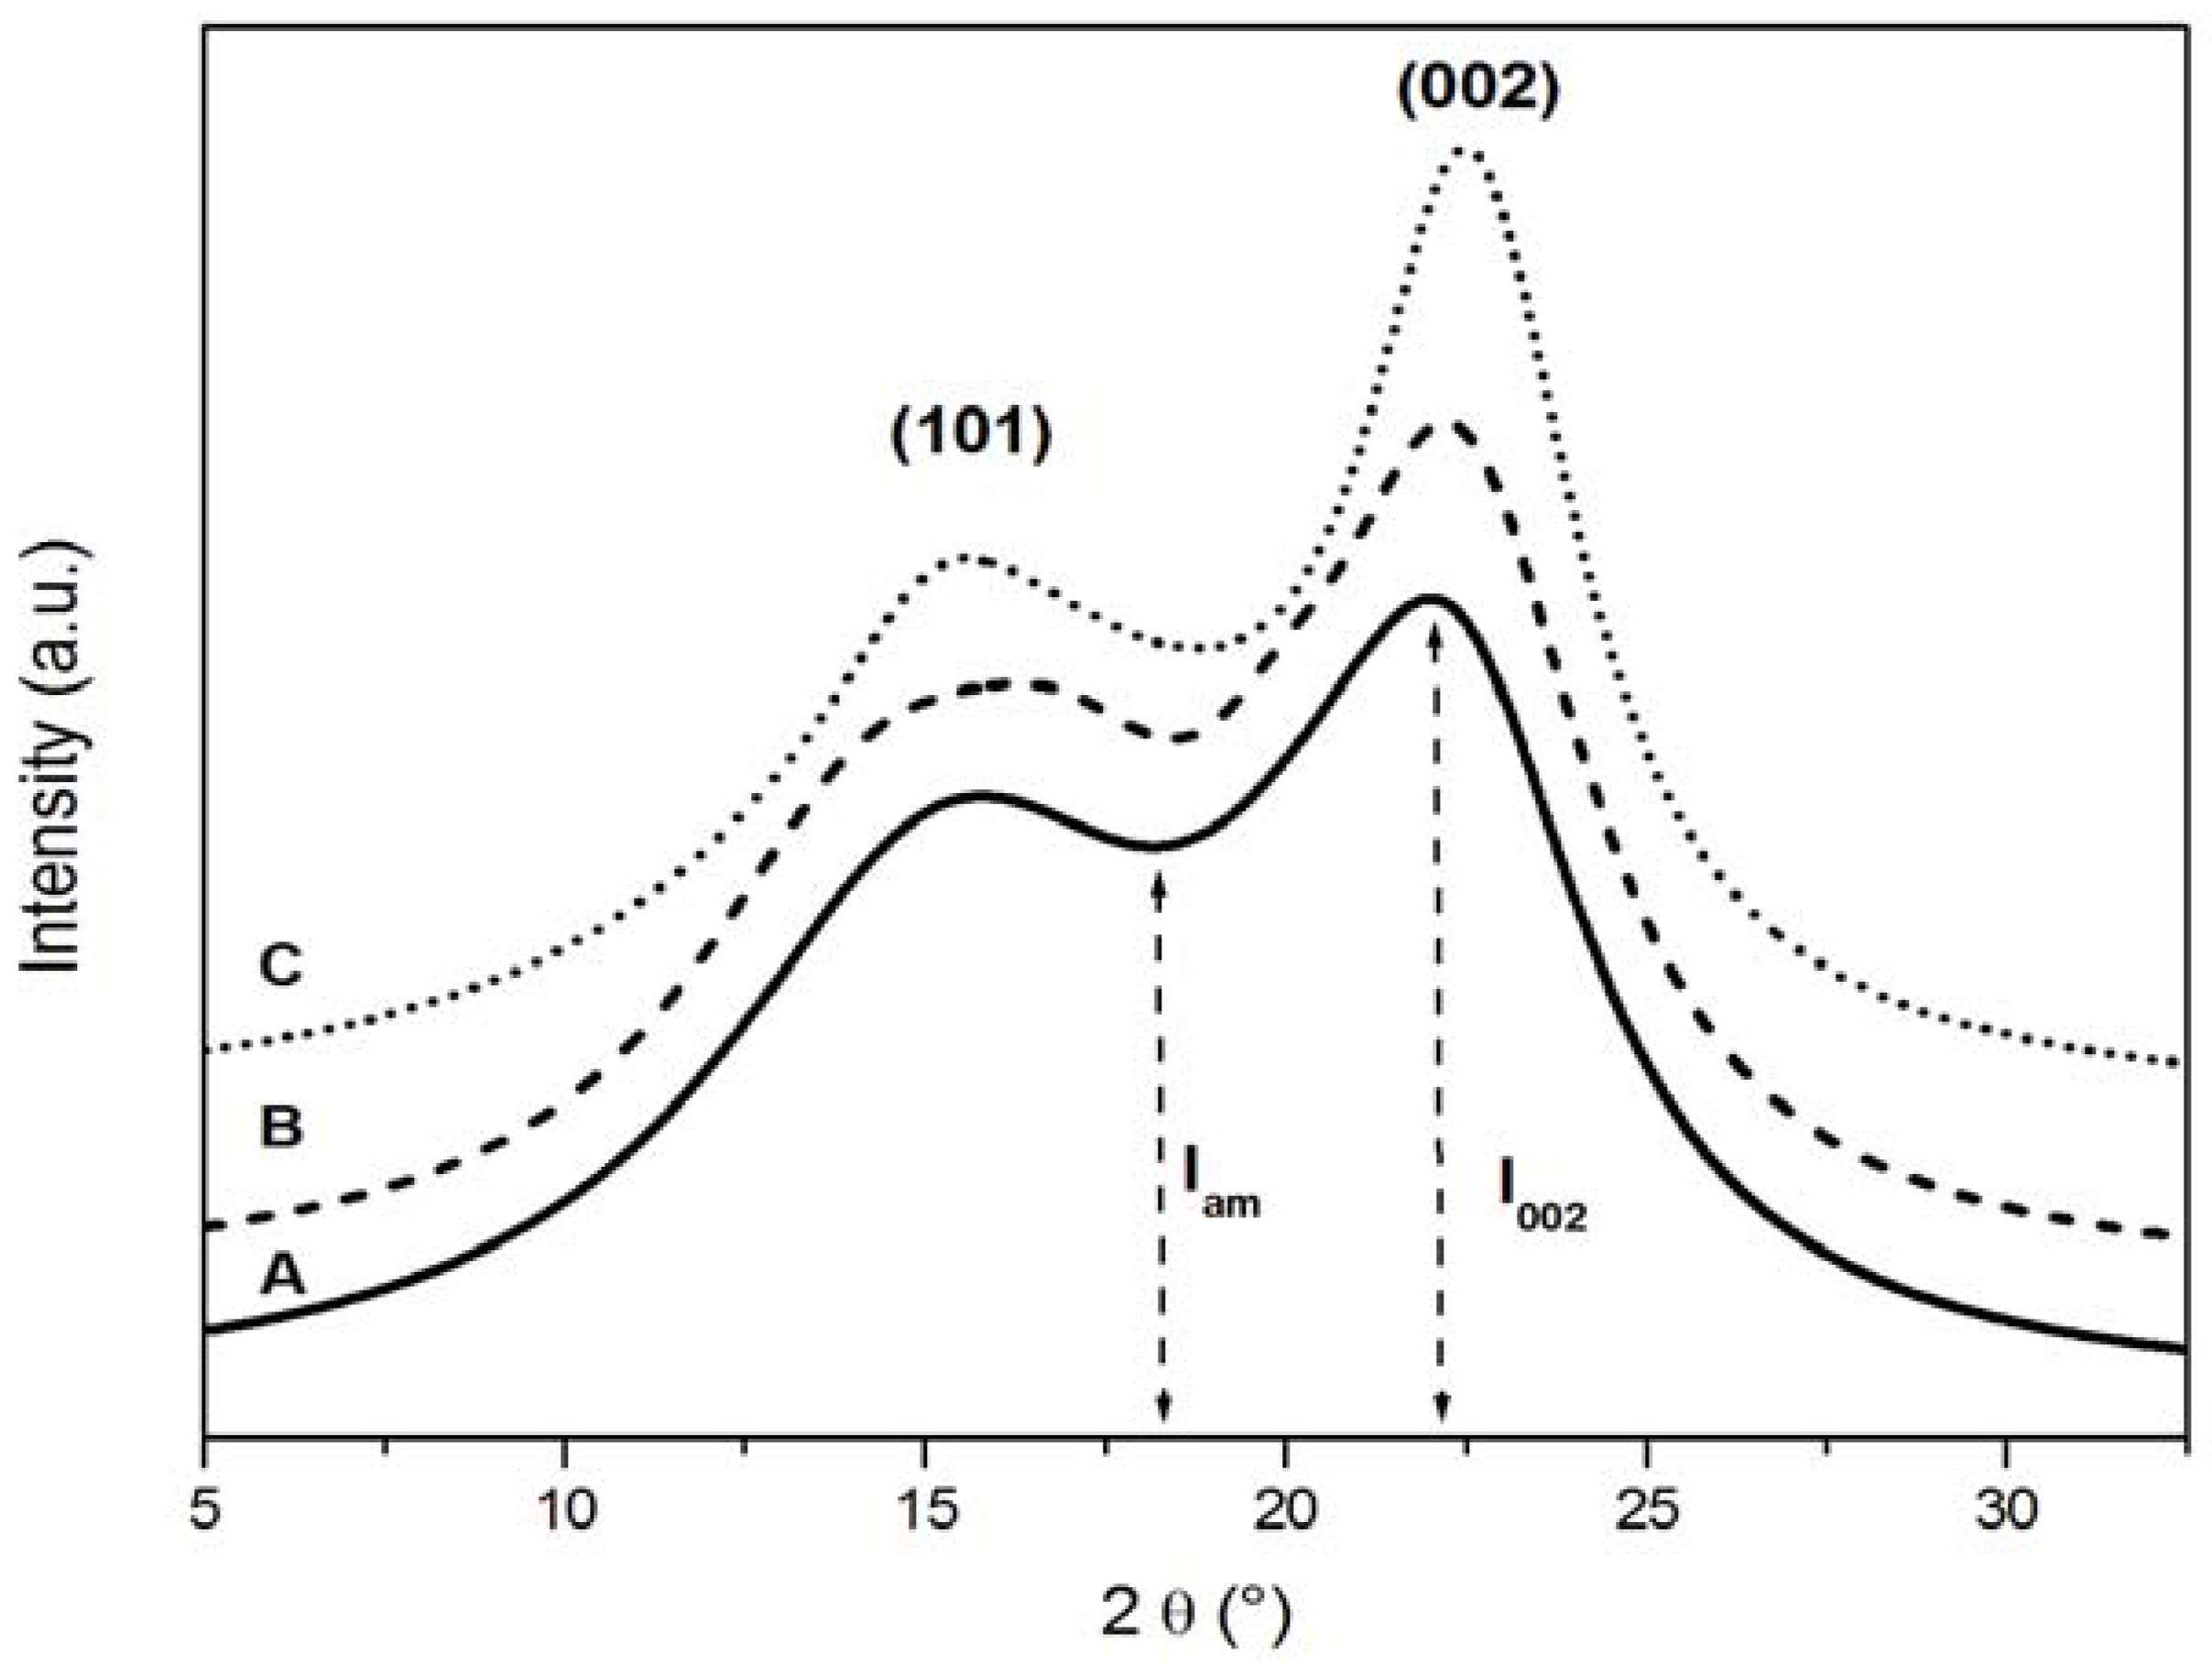
3.1. XRD Results


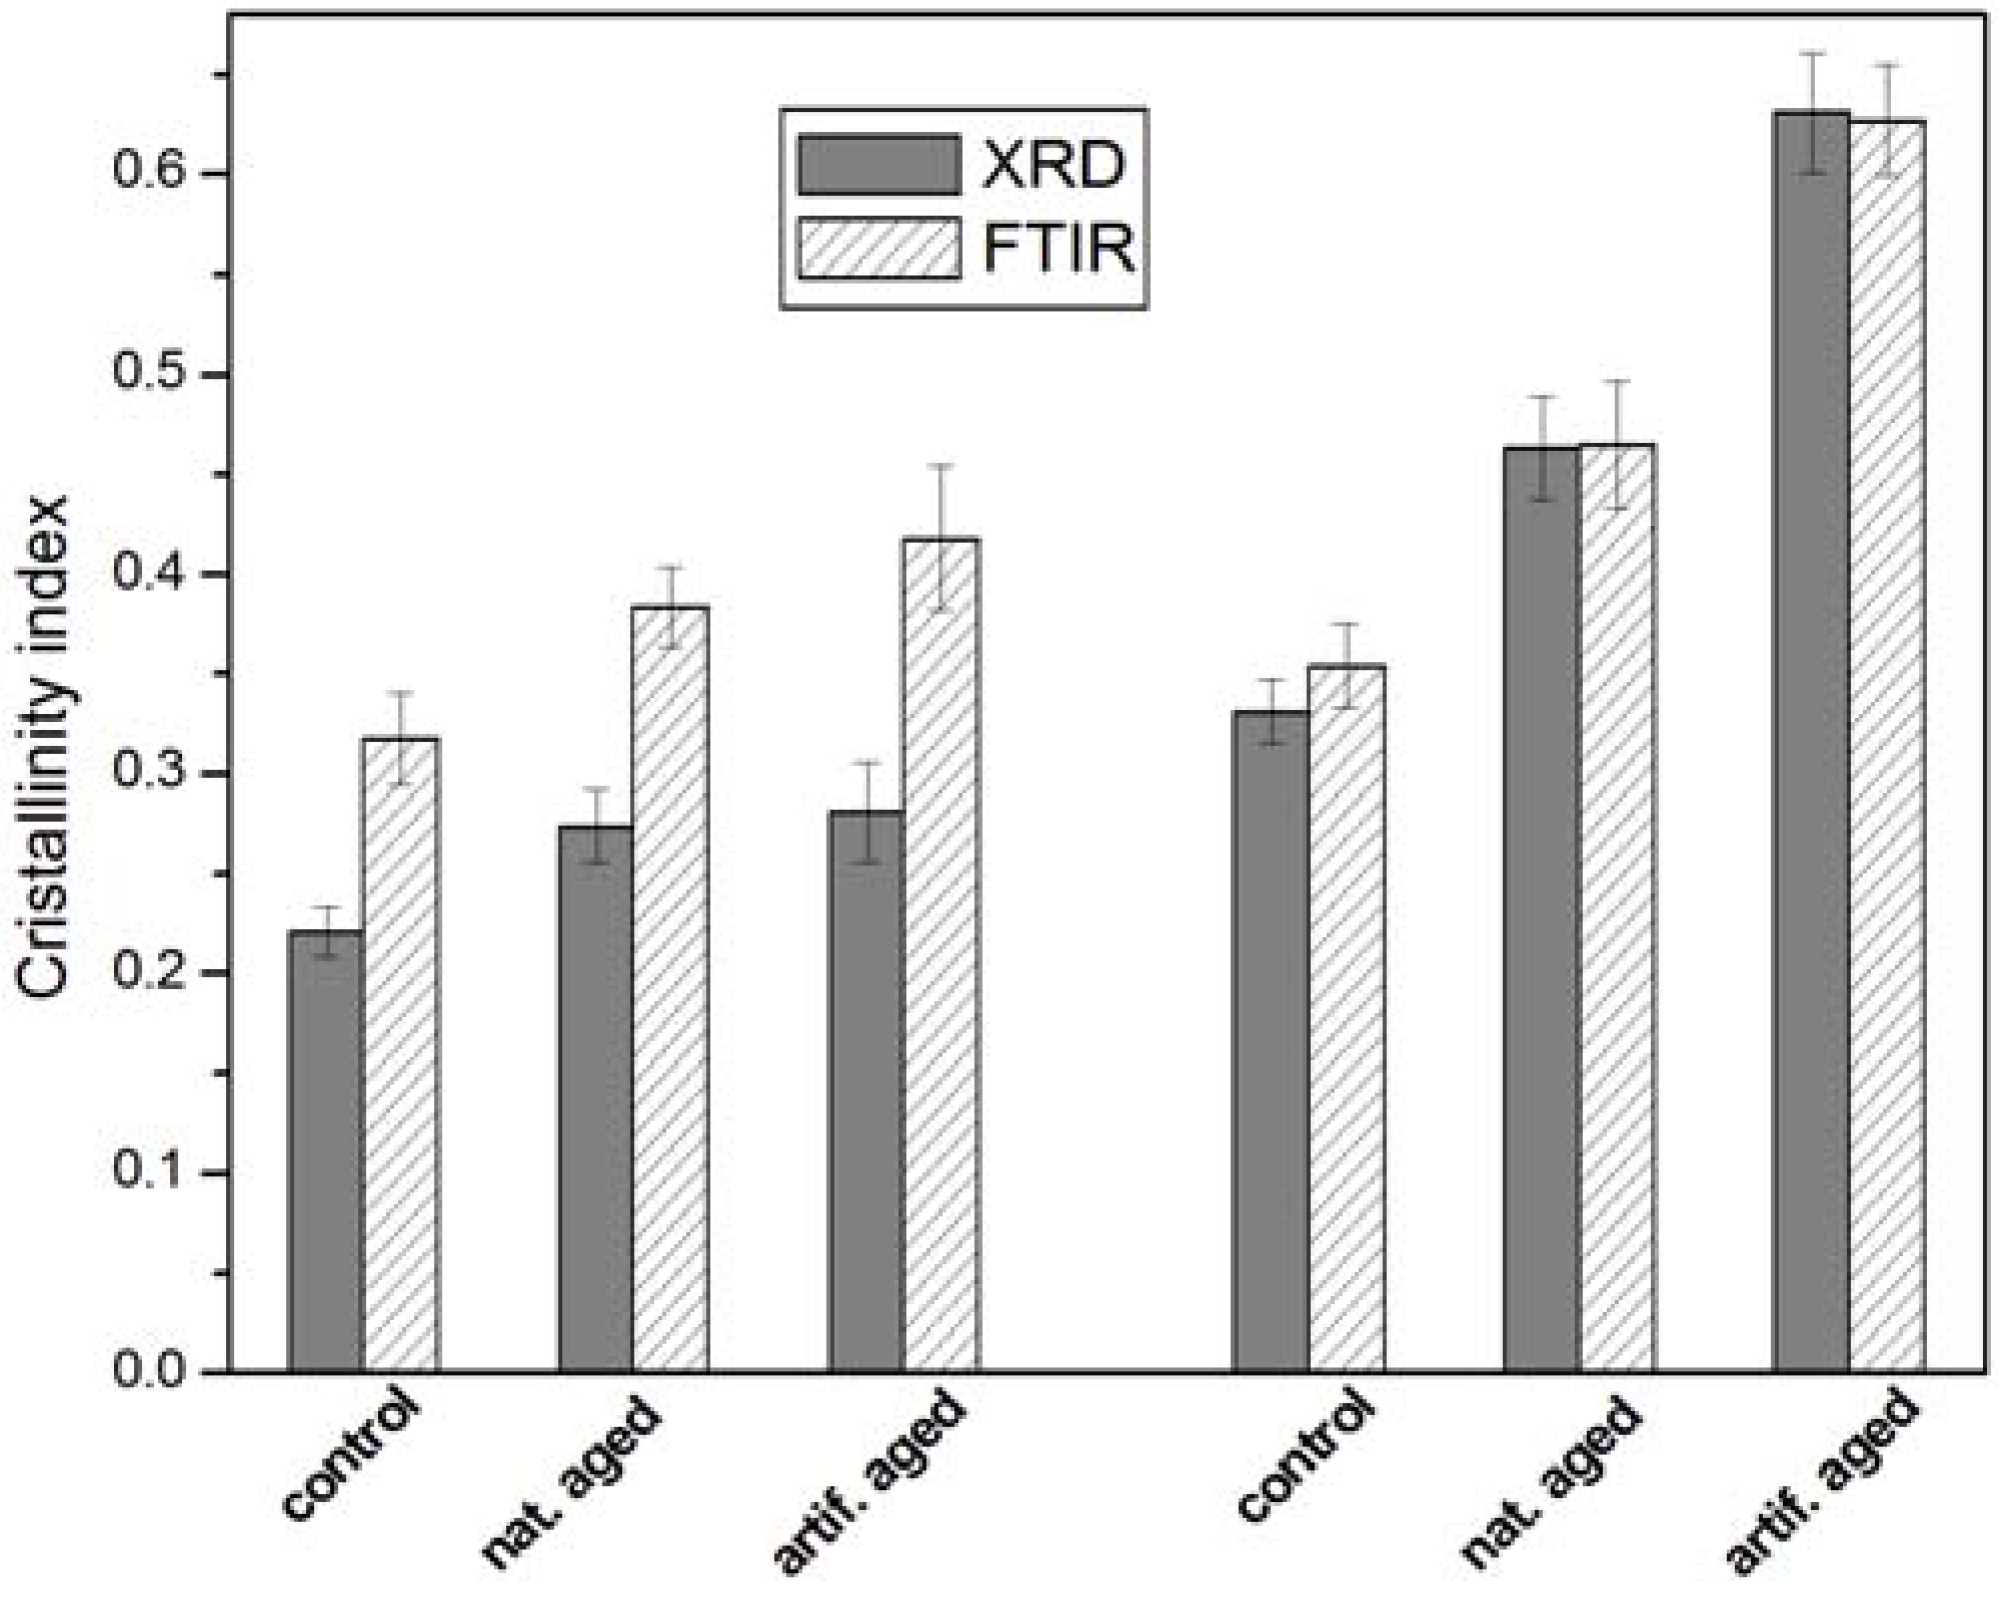
| Sample | CIXRD (%) | ∆CIXRD (%) | Crystallite thickness (nm) | ∆thickness (%) |
|---|---|---|---|---|
| COATED | ||||
| control | 22.1 | – | 3.10 | – |
| naturally aged | 27.4 | 24% | 3.50 | 13% |
| artificially aged | 28.1 | 27% | 3.61 | 16% |
| UNCOATED | ||||
| control | 33.1 | – | 3.11 | – |
| naturally aged | 46.3 | 40% | 3.80 | 22% |
| artificially aged | 63.1 | 90% | 4.09 | 31% |
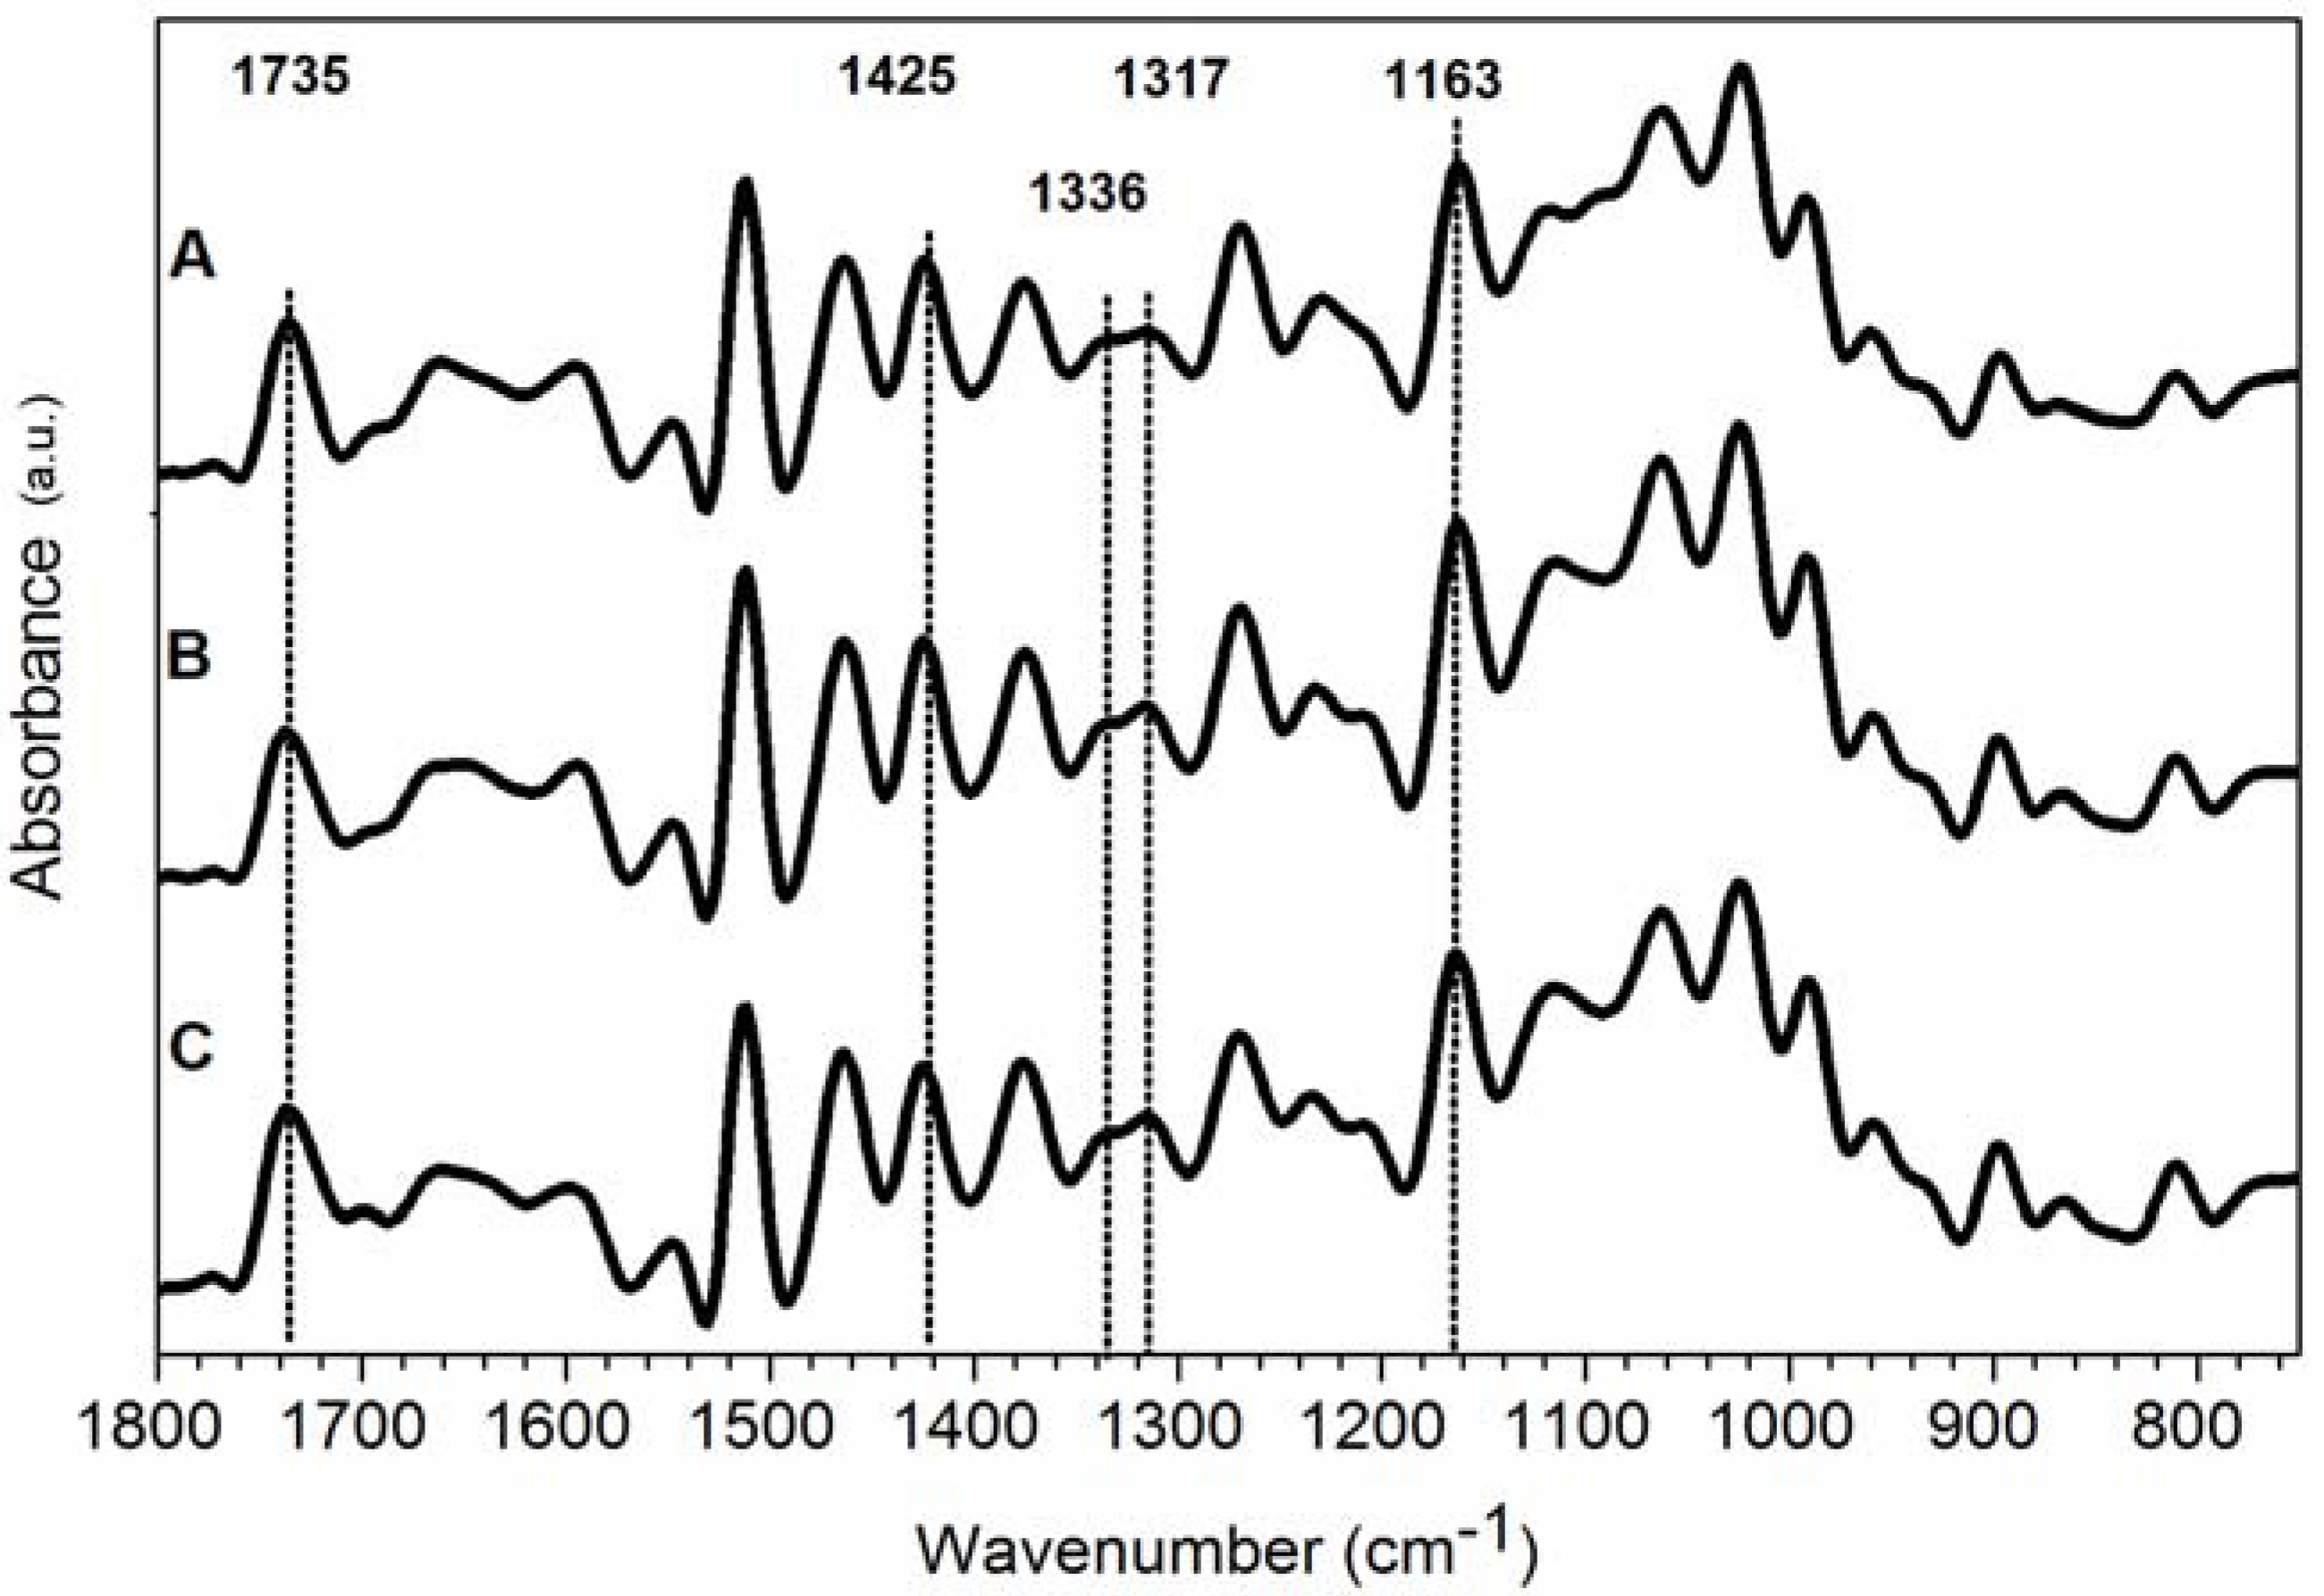
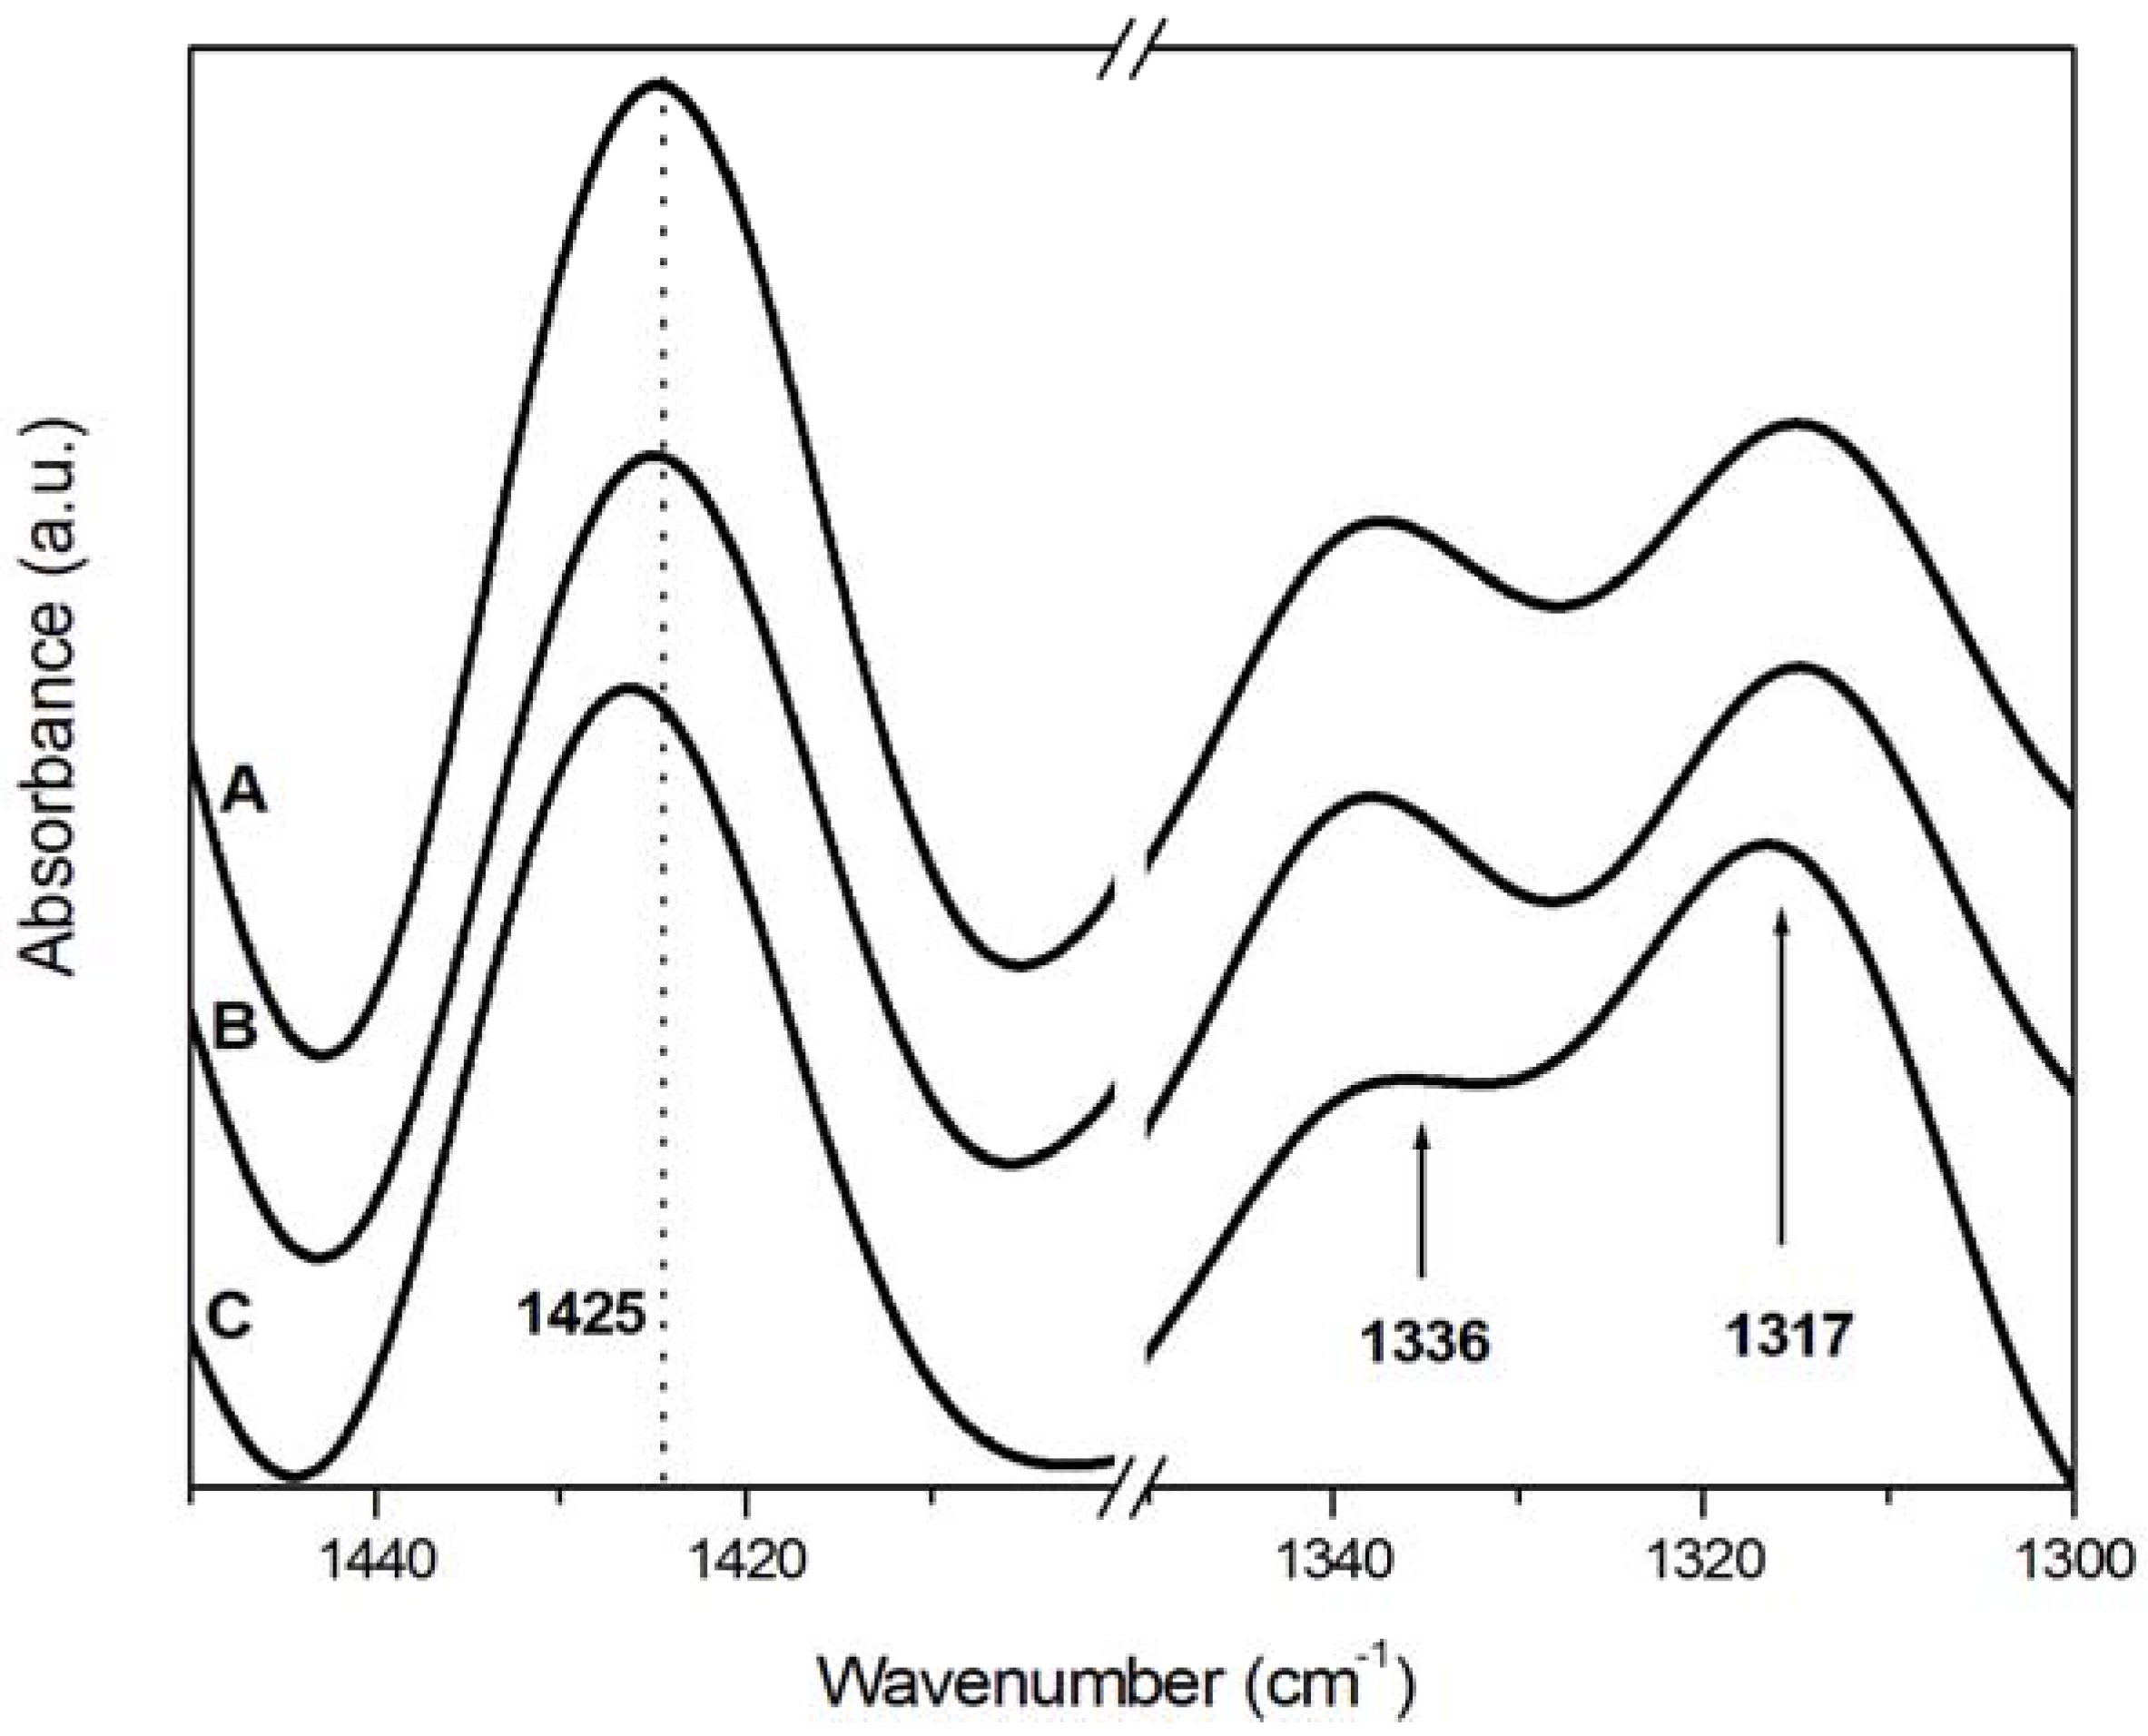
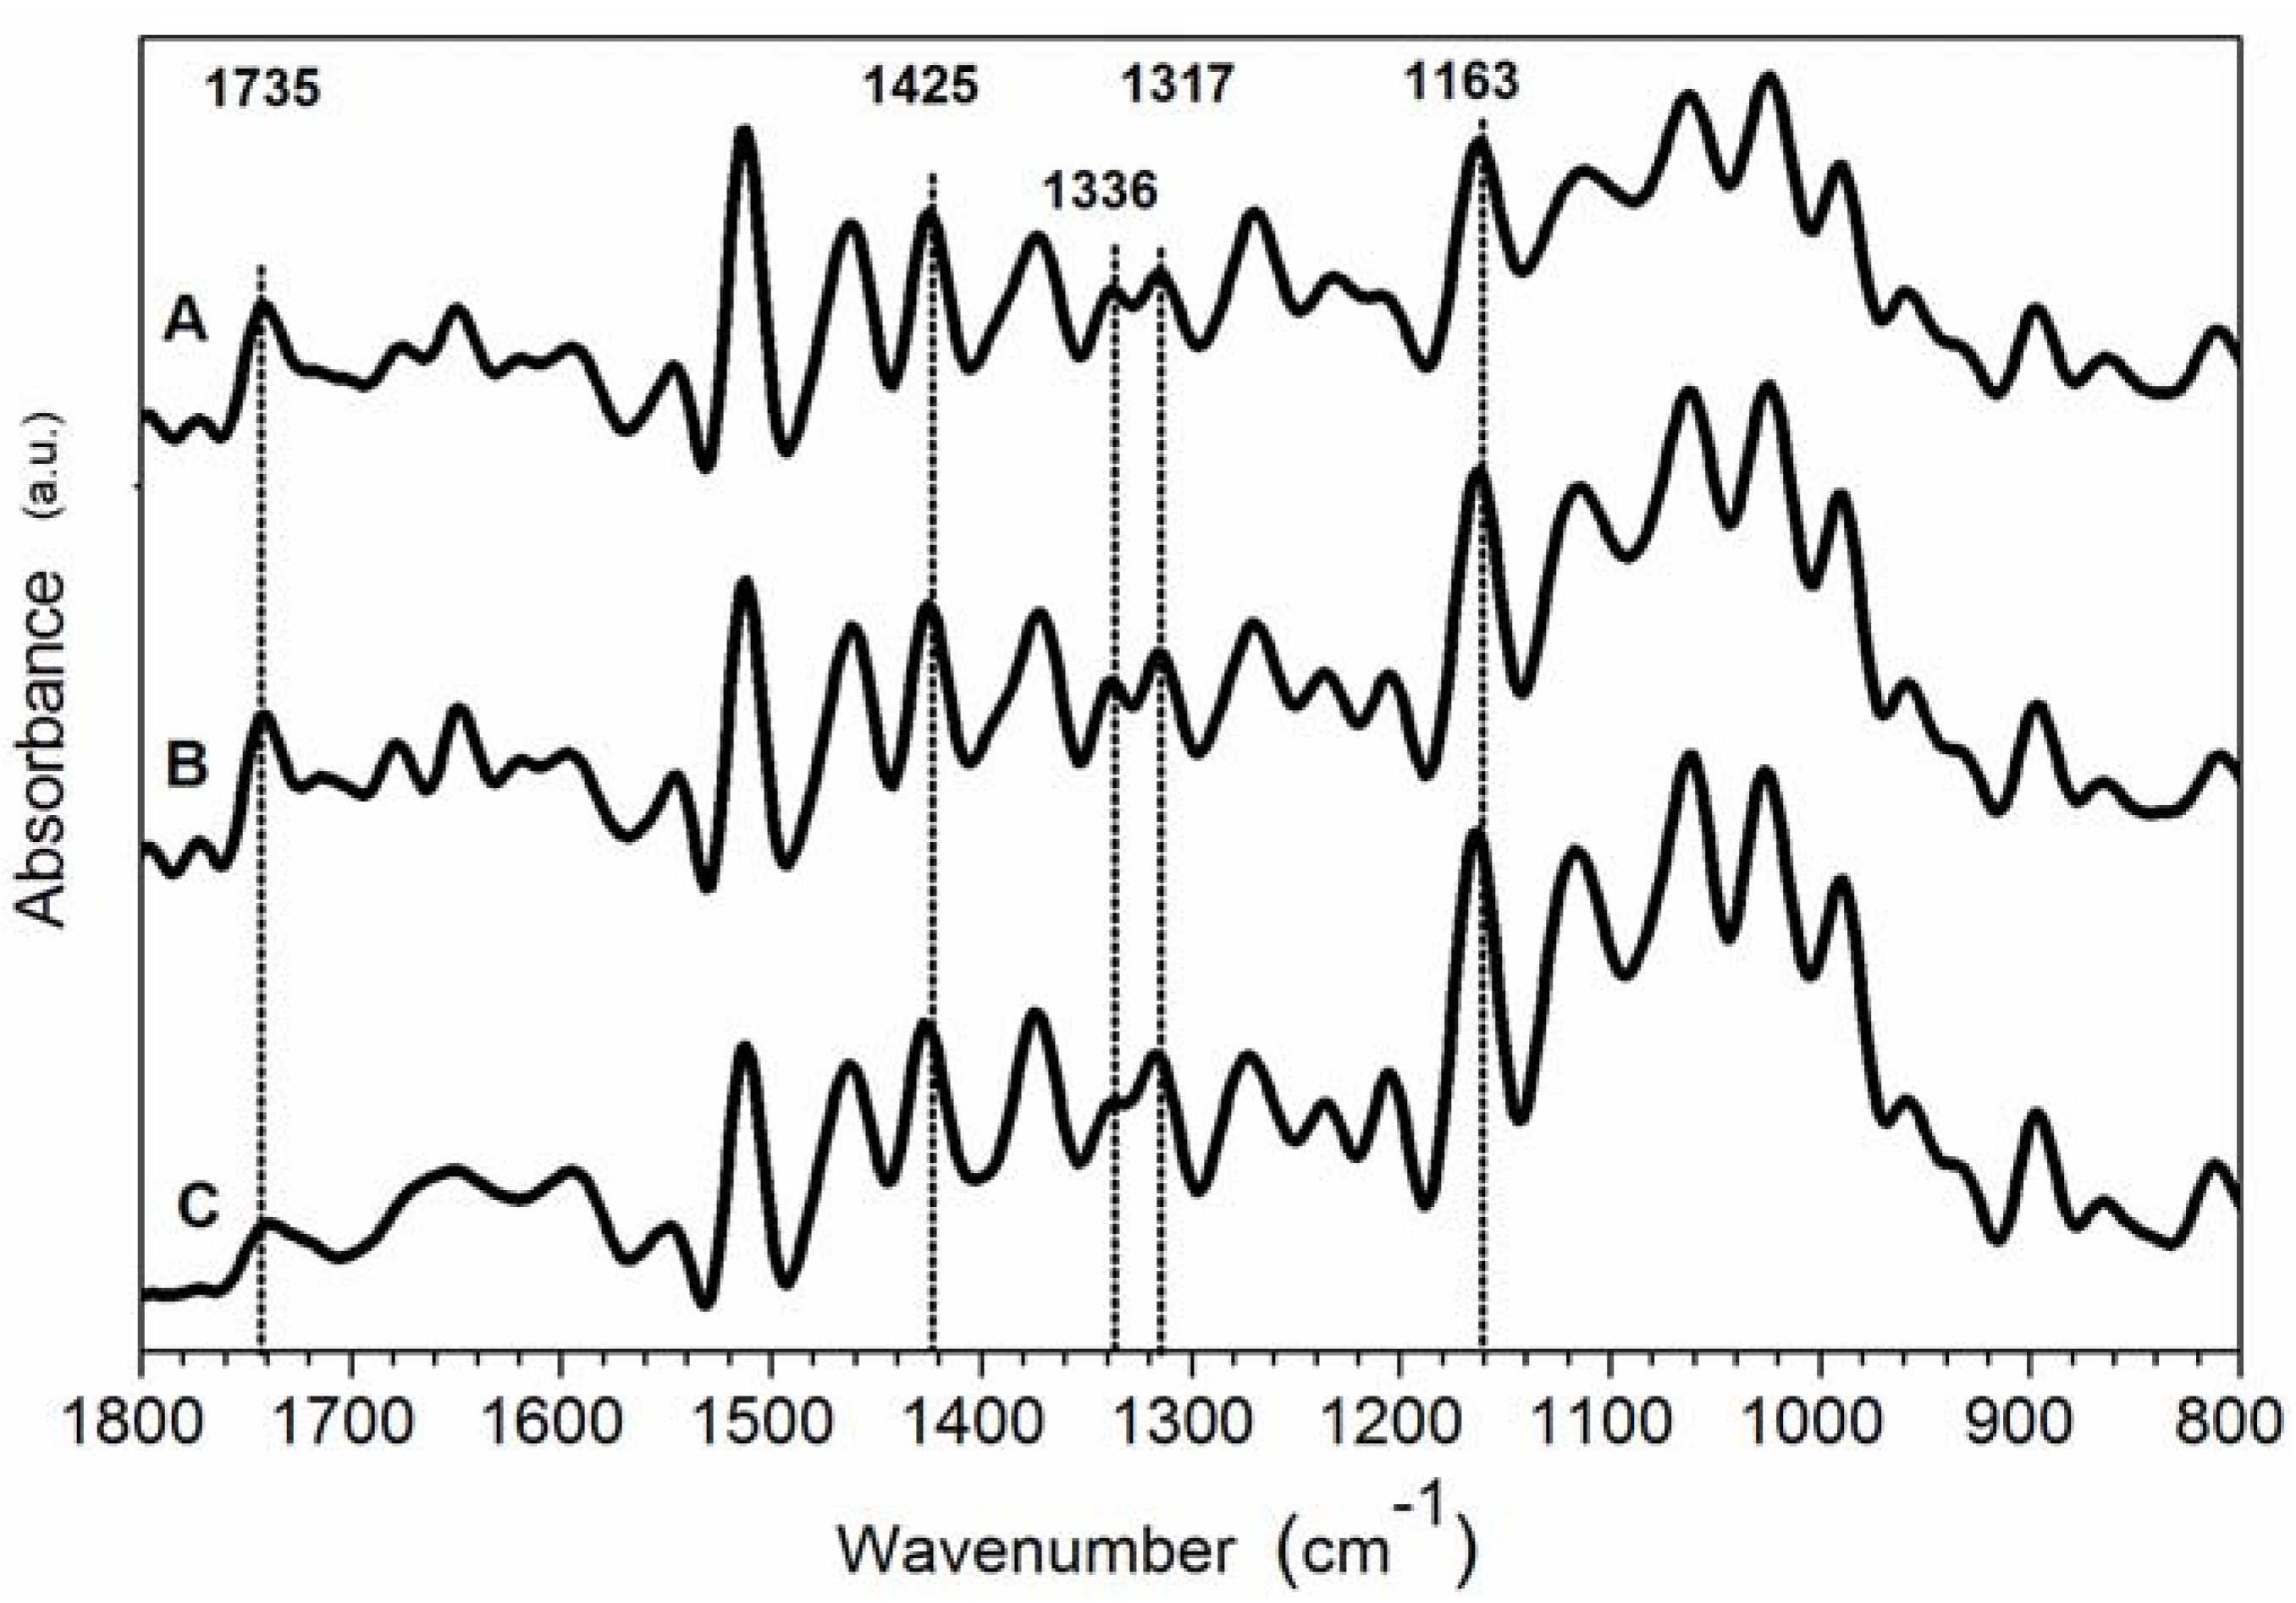
3.2. FT-IR Results

| Wavenumber (cm−1) | Functional group | Assignment |
|---|---|---|
| 1735 | C=O stretching in unconjugated ketones aldehydes and carboxyl | Xylan and hemicellulose |
| 1595 | C=C stretching of the aromatic ring | Lignin |
| 1512 | C=C stretching of the aromatic ring | Lignin |
| 1463 | Asymmetric bending in CH3 | Lignin |
| 1425 | CH2 bending | Cellulose (crystallised I and amorphous) |
| 1375 | CH bending | Cellulose |
| 1336 | OH in plane bending | Cellulose (amorphous) |
| 1317 | CH2 wagging | Cellulose (crystallised I) |
| 1269 | CO stretching | Lignin and hemicellulose |
| 1163 | COC asym. bridge oxygen stretching | Cellulose |
| 897 | asym. Out of phase ring stretching | Cellulose |

| Sample | Band frequency (cm−1) | ||||||||||
|---|---|---|---|---|---|---|---|---|---|---|---|
| 1735 | 1512 | 1463 | 1425 | 1375 | 1336 | 1317 | 1269 | 1163 | 897 | ||
| Absorbance (a.u.) | COATED | ||||||||||
| control | 0.52 | 1.06 | 0.59 | 0.44 | 0.34 | 0.11 | 0.14 | 0.46 | 0.60 | 0.21 | |
| naturally aged | 0.43 | 0.99 | 0.59 | 0.46 | 0.38 | 0.15 | 0.19 | 0.41 | 0.64 | 0.24 | |
| artificially aged | 0.61 | 1.06 | 0.66 | 0.47 | 0.44 | 0.16 | 0.20 | 0.38 | 0.65 | 0.29 | |
| UNCOATED | |||||||||||
| control | 0.51 | 1.27 | 0.72 | 0.62 | 0.45 | 0.28 | 0.32 | 0.43 | 0.67 | 0.31 | |
| naturally aged | 0.40 | 0.80 | 0.50 | 0.45 | 0.37 | 0.25 | 0.29 | 0.27 | 0.70 | 0.27 | |
| artificially aged | 0.15 | 0.61 | 0.39 | 0.39 | 0.38 | 0.22 | 0.30 | 0.24 | 0.80 | 0.30 | |
| Sample | CIFTIR I1375/I1512 | ∆CIFTIR (%) | I1317/I1336 | ∆ (%) |
|---|---|---|---|---|
| COATED | ||||
| control | 0.32 | – | 1.27 | – |
| naturally aged | 0.38 | 19 | 1.27 | 0 |
| artificially aged | 0.42 | 31 | 1.25 | −1 |
| UNCOATED | ||||
| control | 0.35 | – | 1.14 | – |
| naturally aged | 0.47 | 34 | 1.16 | 2 |
| artificially aged | 0.63 | 80 | 1.36 | 19 |

4. Conclusions
Acknowledgments
References
- Xie, Y.; Krause, A.; Mai, C.; Militz, H.; Richter, K.; Urban, K.; Evans, P.D. Weathering of wood modified with the N-methylol compound 1,3-dimethylol-4,5-dihydroxyethyleneurea. Polym. Degrad. Stab. 2005, 89, 189–199. [Google Scholar] [CrossRef]
- George, B.; Suttie, E.; Merlin, A.; Deglise, X. Photodegradation and photostabilisation of wood: The state of the art. Polym. Degrad. Stab. 2005, 88, 268–274. [Google Scholar] [CrossRef]
- Esposito Corcione, C.; Frigione, M. UV-cured siloxane-modified acrylic coatings containing birifrangent calcarenitic stone particles: photo-calorimetric analysis and surface properties. Prog. Org. Coat. 2011, 72, 522–527. [Google Scholar] [CrossRef]
- Esposito Corcione, C.; Frigione, M. UV-cured polymer-boehmite nanocomposite as protective coating for wood elements. Prog. Org. Coat. 2012, 74, 781–787. [Google Scholar] [CrossRef]
- Bhat, I.; Abdul Khalil, H.P.S.; Awang, K.B.; Bakare, I.O.; Issam, A.M. Effect of weathering on physical, mechanical and morphological properties of chemically modified wood materials. Mater. Design 2010, 31, 4363–4368. [Google Scholar] [CrossRef]
- Lionetto, F.; Frigione, M. Effect of novel consolidants on mechanical and absorption properties of deteriorated wood by insect attack. J. Cult. Herit. 2012, 13, 195–203. [Google Scholar] [CrossRef]
- Lionetto, F.; Frigione, M. Mechanical and natural durability properties of wood treated with a novel organic preservative/consolidant product. Mater. Design 2009, 30, 3303–3307. [Google Scholar] [CrossRef]
- Popescu, C.M.; Vasile, C.; Popescu, M.C.; Singurel, Gh. Degradation of lime wood painting supports II. Spectral characterization. Cell. Chem. Technol. 2006, 40, 649–658. [Google Scholar]
- Lionetto, F.; Maffezzoli, A. Relaxations during the postcure of unsaturated polyester networks by ultrasonic wave propagation, dynamic mechanical analysis and dielectric analysis. J. Polym. Sci. Pol. Phys. 2005, 43, 596–602. [Google Scholar] [CrossRef]
- Lionetto, F.; Montagna, F.; Maffezzoli, A. Ultrasonic dynamic mechanical analysis of polymers. Appl. Rheol. 2005, 15, 326–335. [Google Scholar]
- Lionetto, F.; Maffezzoli, A. Polymer characterization by ultrasonic wave propagation. Adv. Polym. Technol. 2008, 27, 63–73. [Google Scholar] [CrossRef]
- Colom, X.; Carrillo, F.; Nogués, F.; Garriga, P. Structural analysis of photodegradated wood by means of FT-IR spectroscopy. Polym. Degrad. Stab. 2003, 80, 543–549. [Google Scholar] [CrossRef]
- Torre, L.; Maffezzoli, A.; Kenny, J.M. Macrokinetic approach to crystallization applied to a new thermoplastic polyimide (new TPI) as a model polymer. J. Appl. Polym. Sci. 1995, 56, 985–993. [Google Scholar] [CrossRef]
- Lionetto, F.; Maffezzoli, A.; Ottenhof, M.A.; Farhat, I.A.; Mitchell, J.R. Ultrasonic investigation of wheat starch retrogradation. J. Food Eng. 2006, 75, 258–266. [Google Scholar] [CrossRef]
- Lionetto, F.; Maffezzoli, A.; Ottenhof, M.A.; Farhat, I.A.; Mitchell, J.R. The retrogradation of concentrated wheat starch systems. Starch 2005, 57, 16–24. [Google Scholar] [CrossRef]
- Kenny, J.M.; Maffezzoli, A.; Nicolais, L. A new kinetic model for polymer crystallization derived by calorimetric analysis. Thermochim. Acta 1993, 227, 83–95. [Google Scholar] [CrossRef]
- Fortunati, E.; Peltzer, M.; Armentano, I.; Torre, L.; Jimenez, A.; Kenny, J.M. Effects of modified cellulose nanocrystals on the barrier and migration properties of PLA nano-biocomposites. Carbohyd. Polym. 2012, 90, 948–956. [Google Scholar] [CrossRef]
- Demitri, C.; del Sole, R.; Scalera, F.; Sannino, A.; Vasapollo, G.; Maffezzoli, A.; Ambrosio, A.; Nicolais, L. Novel superabsorbent cellulose-based hydrogels crosslinked with citric acid. J. Appl. Polym. Sci. 2008, 110, 2453–2460. [Google Scholar] [CrossRef]
- Howell, C.; Steenkjaer Hastrup, A.C.; Goodell, B.; Jellison, J. Temporal changes in wood crystalline cellulose during degradation by brown rot fungi. Int. Biodeterior. Biodegrad. 2009, 63, 414–419. [Google Scholar] [CrossRef]
- Fackler, K.; Stevanic, J.S.; Ters, T.; Hinterstoisser, B.; Schwanninger, M.; Salmén, L. FT-IR imaging microscopy to localise and characterise simultaneous and selective white-rot decay within spruce wood cells. Holzforschung 2011, 65, 411–420. [Google Scholar] [CrossRef]
- Park, S.; Baker, J.O.; Himmel, M.E.; Parilla, P.A.; Johnson, D.K. Cellulose crystallinity index: Measurement techniques and their impact on interpreting cellulase performance. Biotechnol. Biofuels 2010, 3, 1–10. [Google Scholar] [CrossRef] [PubMed]
- Oh, S.Y.; Yoo, D.I.; Shin, Y.; Kim, H.C.; Kim, H.Y.; Chung, Y.S.; Park, W.H.; Youk, J.H. Crystalline structure analysis of cellulose treated with sodium hydroxide and carbon dioxide by means of X-ray diffraction and FT-IR spectroscopy. Carbohyd. Res. 2005, 340, 2376–2391. [Google Scholar] [CrossRef]
- Popescu, C.M.; Singurel, Gh.; Popescu, M.C.; Vasile, C.; Argyropoulos, D.S.; Willford, S. Vibrational spectroscopy and X-ray diffraction methods to establish the differences between hardwood and softwood. Carbohyd. Polym. 2009, 77, 851–857. [Google Scholar] [CrossRef]
- Popescu, C.M.; Popescu, M.C.; Vasile, C. Structural changes in biodegraded lime wood. Carbohyd. Polym. 2010, 79, 362–372. [Google Scholar] [CrossRef]
- European Committee for Standardization. Paints and Varnishes—Coating Materials and Coating Systems for Exterior Wood—Part 3: Natural Weathering Test, CSN EN 927-3; European Committee for Standardization: Brussels, Belgium, 2006. [Google Scholar]
- European Committee for Standardization. Paints and Varnishes—Coating Materials and Coating Systems for Exterior Wood—Part 6: Exposure of Wood Coatings to Artificial Weathering Using Fluorescent UV Lamps And Water, CSN EN 927-6; European Committee for Standardization: Brussels, Belgium, 2006. [Google Scholar]
- Segal, L.; Creely, J.J.; Martin, A.E.; Conrad, C.M. An empirical method for estimating the degree of crystallinity of native cellulose using the X-ray diffractometer. Text. Res. J. 1962, 29, 786–794. [Google Scholar] [CrossRef]
- Nishiyama, Y.; Kuga, S.; Okano, T. Mechanism of mercerization revealed by X-ray diffraction. J. Wood Sci. 2000, 46, 452–457. [Google Scholar] [CrossRef]
- Temiz, A.; Terziev, N.; Jacobsen, B.; Eikenes, M. Weathering, water absorption and durability of silicon, acetylated and heat-treated wood. J. Appl. Polym. Sci. 2006, 102, 4506–4513. [Google Scholar] [CrossRef]
- Andersson, S.; Wikberg, H.; Pesonen, E.; Maunu, S.L.; Serimaa, R. Studies of crystallinity of Scots pine and Norway spruce cellulose. Trees-Struct. Funct. 2004, 18, 346–353. [Google Scholar] [CrossRef]
- Salaita, G.N.; Ma, F.M.S.; Parker, T. C.; Hoflund, G.B. Weathering properties of treated southern yellow pine wood examined by X-ray photoelectron spectroscopy, scanning electron microscopy and physical characterization. Appl. Surf. Sci. 2008, 254, 3925–3934. [Google Scholar] [CrossRef]
- Fabiyi, J.S.; McDonald, A.G.; Wolcott, M.P.; Griffiths, P.R. Wood plastic composites weathering: visual appearance and chemical changes. Polym. Degrad. Stab. 2008, 93, 1405–1414. [Google Scholar] [CrossRef]
- Fabiyi, J.S.; McDonald, A.G.; Morrell, J.J.; Freitag, C. Effects of wood species on durability and chemical changes of fungal decayed wood plastic composites. Compos. A Appl. Sci. Manuf. 2011, 42, 501–510. [Google Scholar] [CrossRef]
© 2012 by the authors; licensee MDPI, Basel, Switzerland. This article is an open access article distributed under the terms and conditions of the Creative Commons Attribution license (http://creativecommons.org/licenses/by/3.0/).
Share and Cite
Lionetto, F.; Del Sole, R.; Cannoletta, D.; Vasapollo, G.; Maffezzoli, A. Monitoring Wood Degradation during Weathering by Cellulose Crystallinity. Materials 2012, 5, 1910-1922. https://doi.org/10.3390/ma5101910
Lionetto F, Del Sole R, Cannoletta D, Vasapollo G, Maffezzoli A. Monitoring Wood Degradation during Weathering by Cellulose Crystallinity. Materials. 2012; 5(10):1910-1922. https://doi.org/10.3390/ma5101910
Chicago/Turabian StyleLionetto, Francesca, Roberta Del Sole, Donato Cannoletta, Giuseppe Vasapollo, and Alfonso Maffezzoli. 2012. "Monitoring Wood Degradation during Weathering by Cellulose Crystallinity" Materials 5, no. 10: 1910-1922. https://doi.org/10.3390/ma5101910