Nopal Cactus (Opuntia Ficus-Indica) as a Holographic Material

Abstract
:1. Introduction
2. Materials
2.1. The Nopal Cactus (Opuntia Ficus-Indica)—Origins
2.2. Mucilage
2.3. Chlorophyll
2.4. Chemical Composition (Opuntia Ficus-Indica)
2.5. Photobiopolymer
3. Methods
3.1. Cactus (Opuntia Ficus-Indica) Dye Preparation
- (a)
- (b)
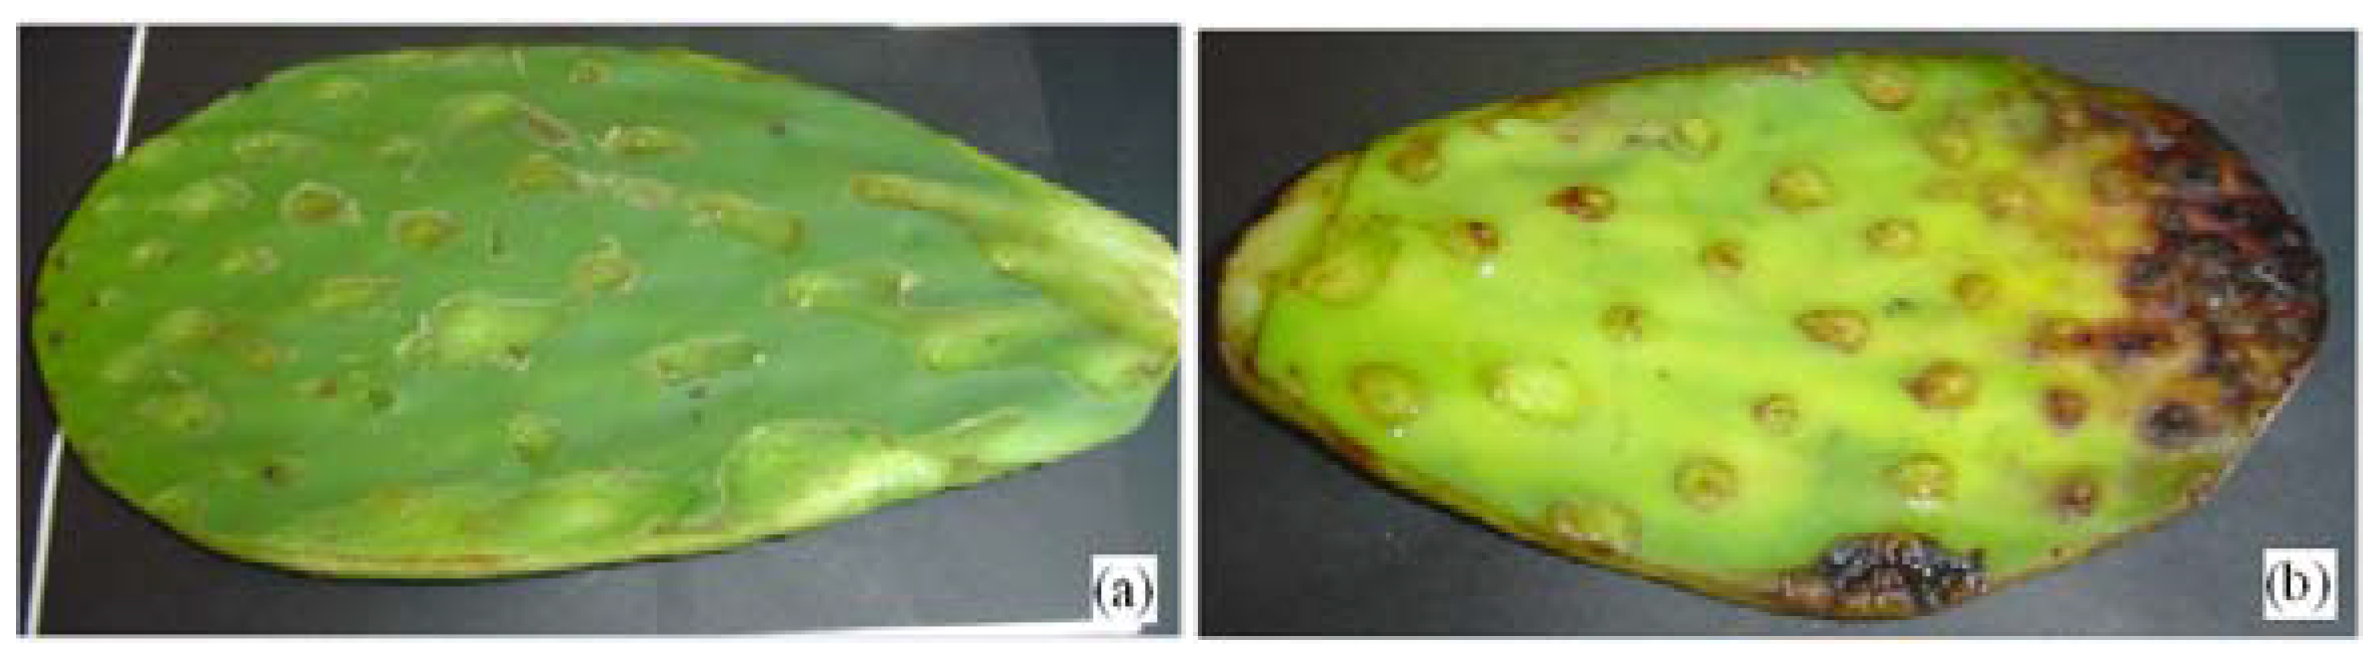
- The drainage of mucus (slime);
- (c)
- The rapid growth of microorganisms (bacteria, fungi and yeasts).
- (1)
- Nopal cactus (Opuntia ficus-indica) is cut into small slices (1 cm × 1 cm about), while removing the prickly thorns, and is then placed in a container (Nopal weighing 250 g can produce an approximate quantity of 12 mL fermented extract).
- (2)
- The cactus is then stored in a plastic container that is sealed and cooled to 10 °C for 10 to 18 days, to obtain an optimal fermentation and get the clear brown solution. On the other hand, with a minimally processed cactus, after one or two days at room temperature (30 °C), it will already demonstrates signs of fermentation.
- (3)
- Deterioration of the cactus in the vessel was observed when the mucus became brown colored. This solution is then filtered by a vacuum filtration method.
- (4)
- After filtering, the extract has a shelf life of five to ten days (at room temperature). In that period, it is appropriate to prepare photosensitive plates. (After these days at room temperature, using the extract to a photosensitive film, the surface of the film shows its deterioration as cracks in the surface).
- (5)
- The solution may be stored under refrigeration (5 °C and 10 °C) for 30 or 60 days.
- (6)
- One of the conditions of this solution for use as a photosensitizer is pH. Due to the variation of pH as a function of storage time and temperature, we worked with a pH of less than seven (Conductronic model PH-10). Normally, fermentation substances tend to decompose and produce alcohols, which lead to an acidity in the substance with a pH less than seven.

| Properties | States |
|---|---|
| Physical state | Liquid |
| Appearance | Clear brown/dark Brown |
| Solubility | Water, alcohol |
| Stability condition | Color change with time |
| pH | acidic (pH < 7) |
3.2. Photopolymer Layer Preparations
- (1)
- The entire mixture is obtained at room conditions in the laboratory, with the average temperature of 20 °C; and a relative humidity of about 40%.
- (2)
- Polyvinyl alcohol (Baker®) was prepared in a 12% solution with distilled water at a temperature of 85 °C.
- (3)
- PVA (Baker®) is mixed with nopal cactus extract in a proportion of 2.5 mL and 0.8 mL (32%). This proportion was found to be the optimum value during the experiments.
- (4)
- The PVA layers doped with nopal cactus extract were prepared by pouring a small amount of the solution onto a glass slide by gravity technique. After 24 hours of storage in complete darkness under normal laboratory conditions (room temperature 20 °C, relative humidity 40%) the samples are dried.
- (5)
- The dry film having 40 µm thickness, with a extract (nopal) concentration at (32% V/V), by pouring 0.5 mL of solution on a substrate area of 9 cm2. This was measured with a digital micrometer (Mitutoyo Corporation® Model IP65). The thickness of the photosensitive film may be modified by varying the amount of solution poured onto a certain area on the substrate surface.
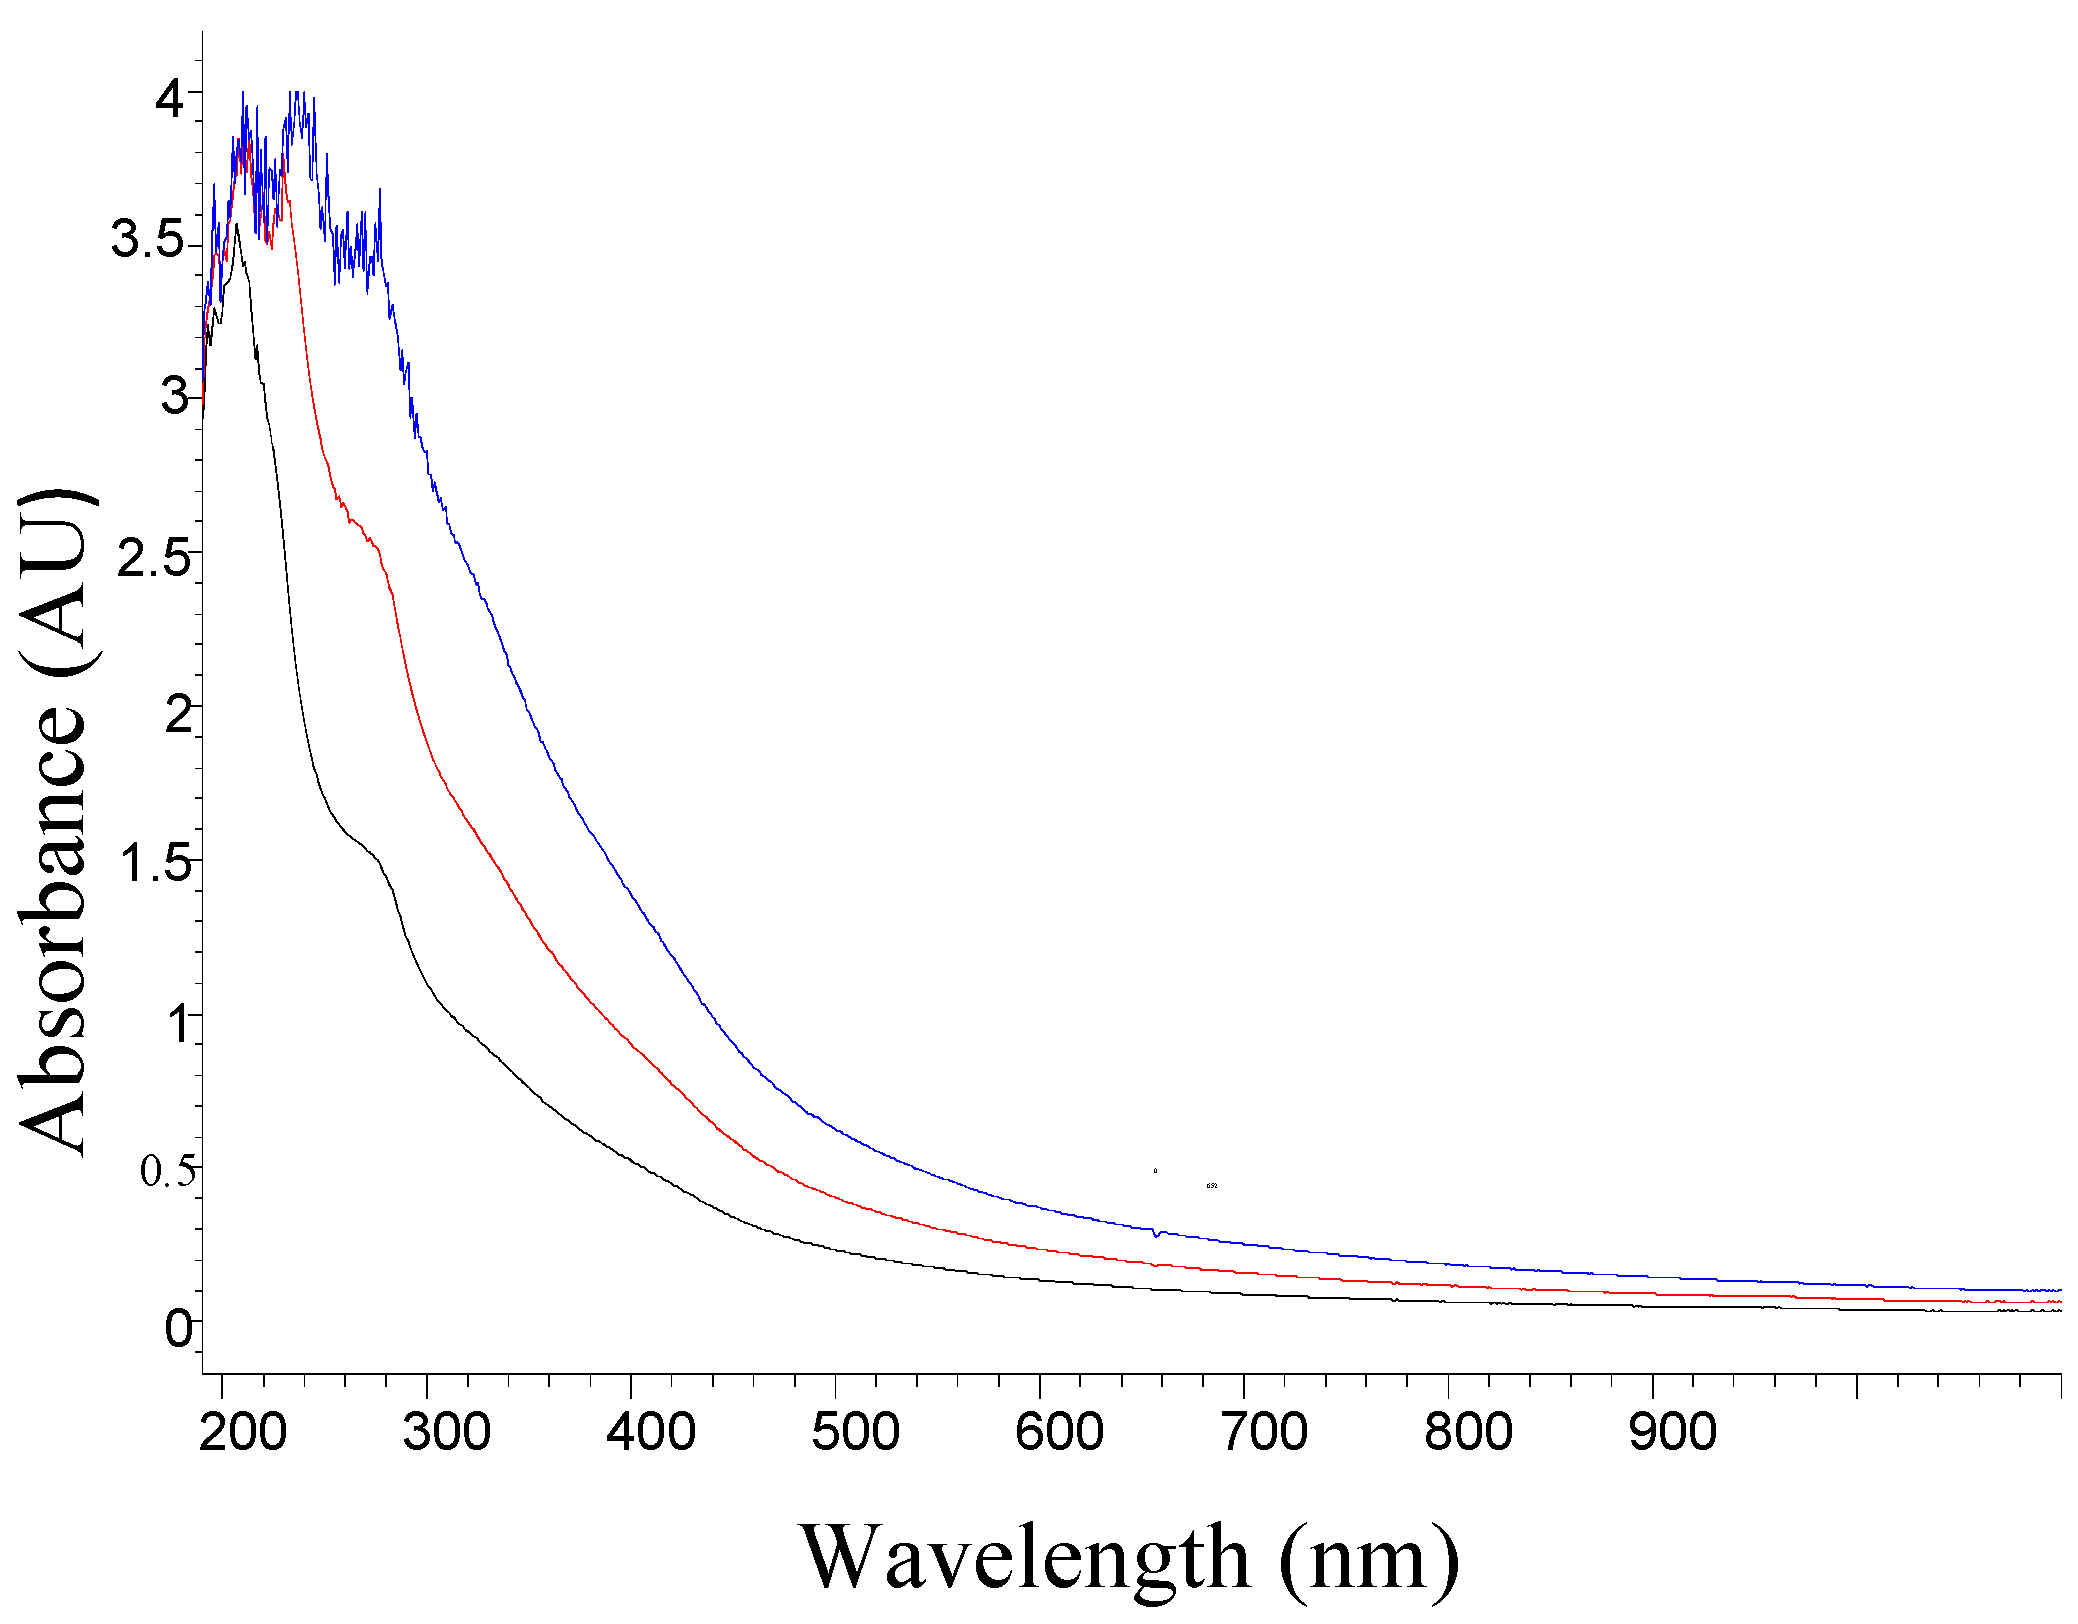
3.3. Absorption UV-Visible Spectrum

3.4. UV-Visible Details Analysis
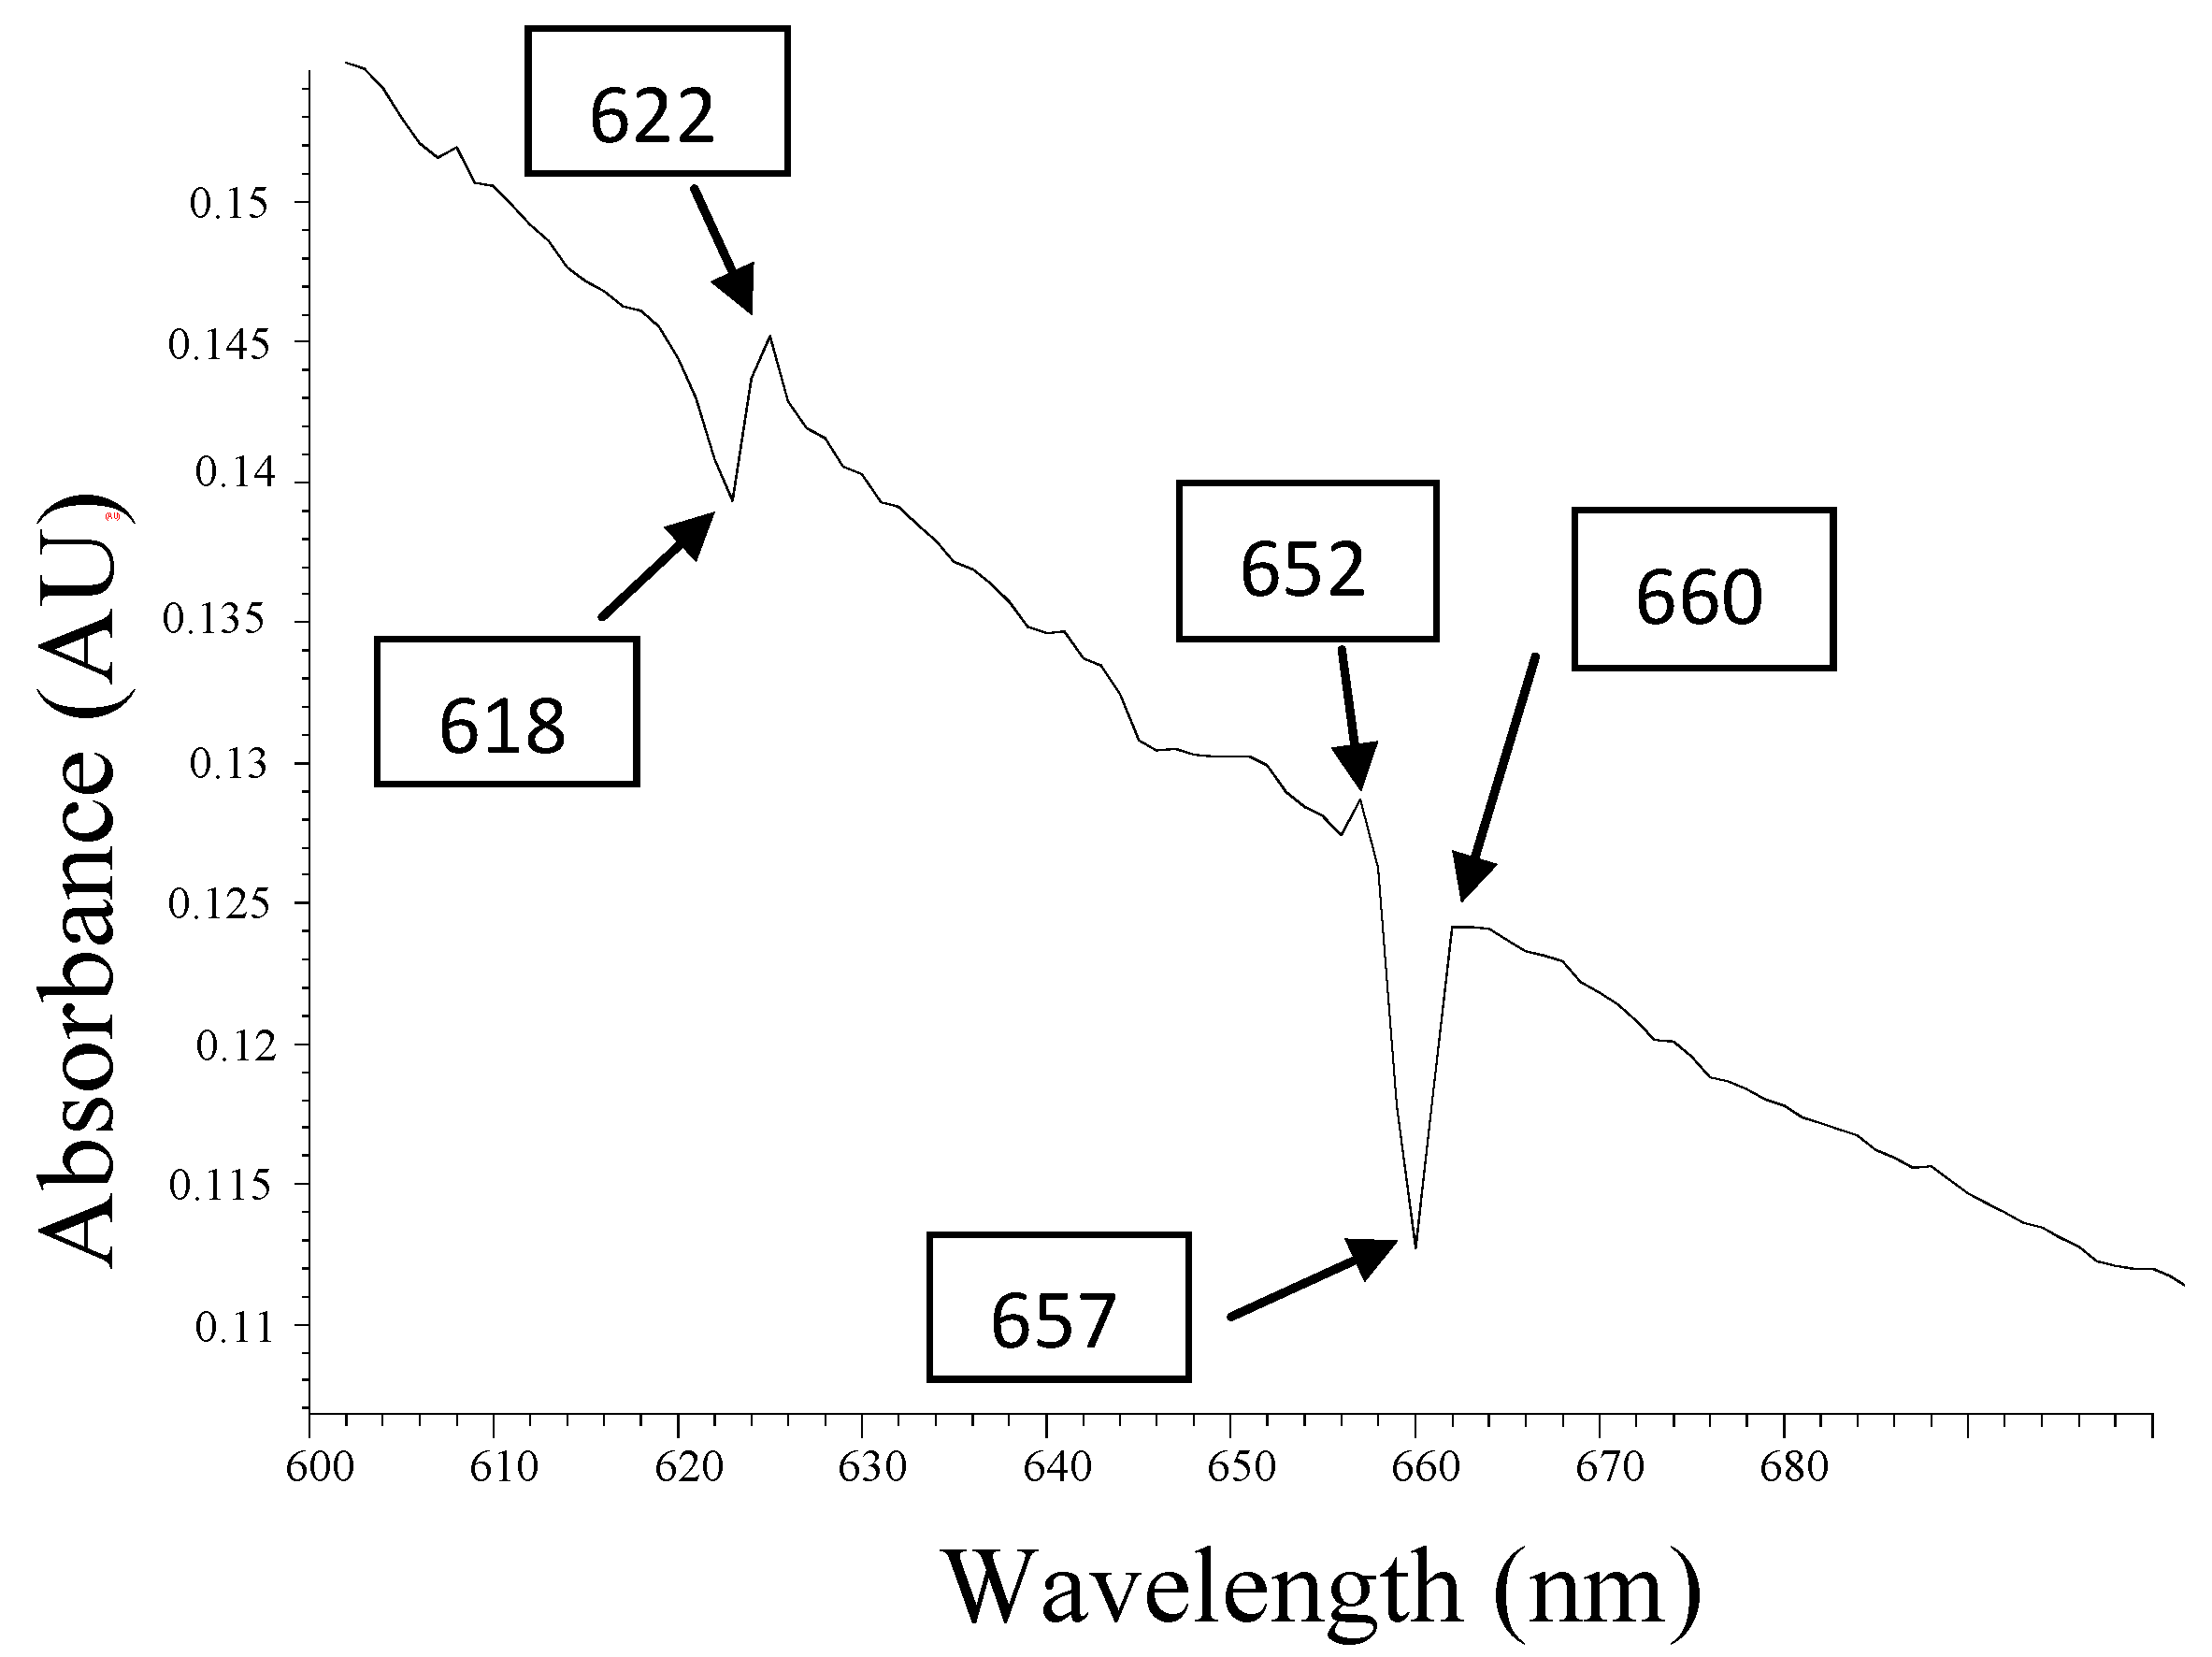
| Peaks(nm) Q band | Abs(AU) | Localization of the Pheophytins |
|---|---|---|
| 622.0 nm | 0.142 | Fe-pheophytin |
| 652.0 nm | 0.125 | Pheophytins |
| 660.0 nm | 0.121 | Chlorophyll |
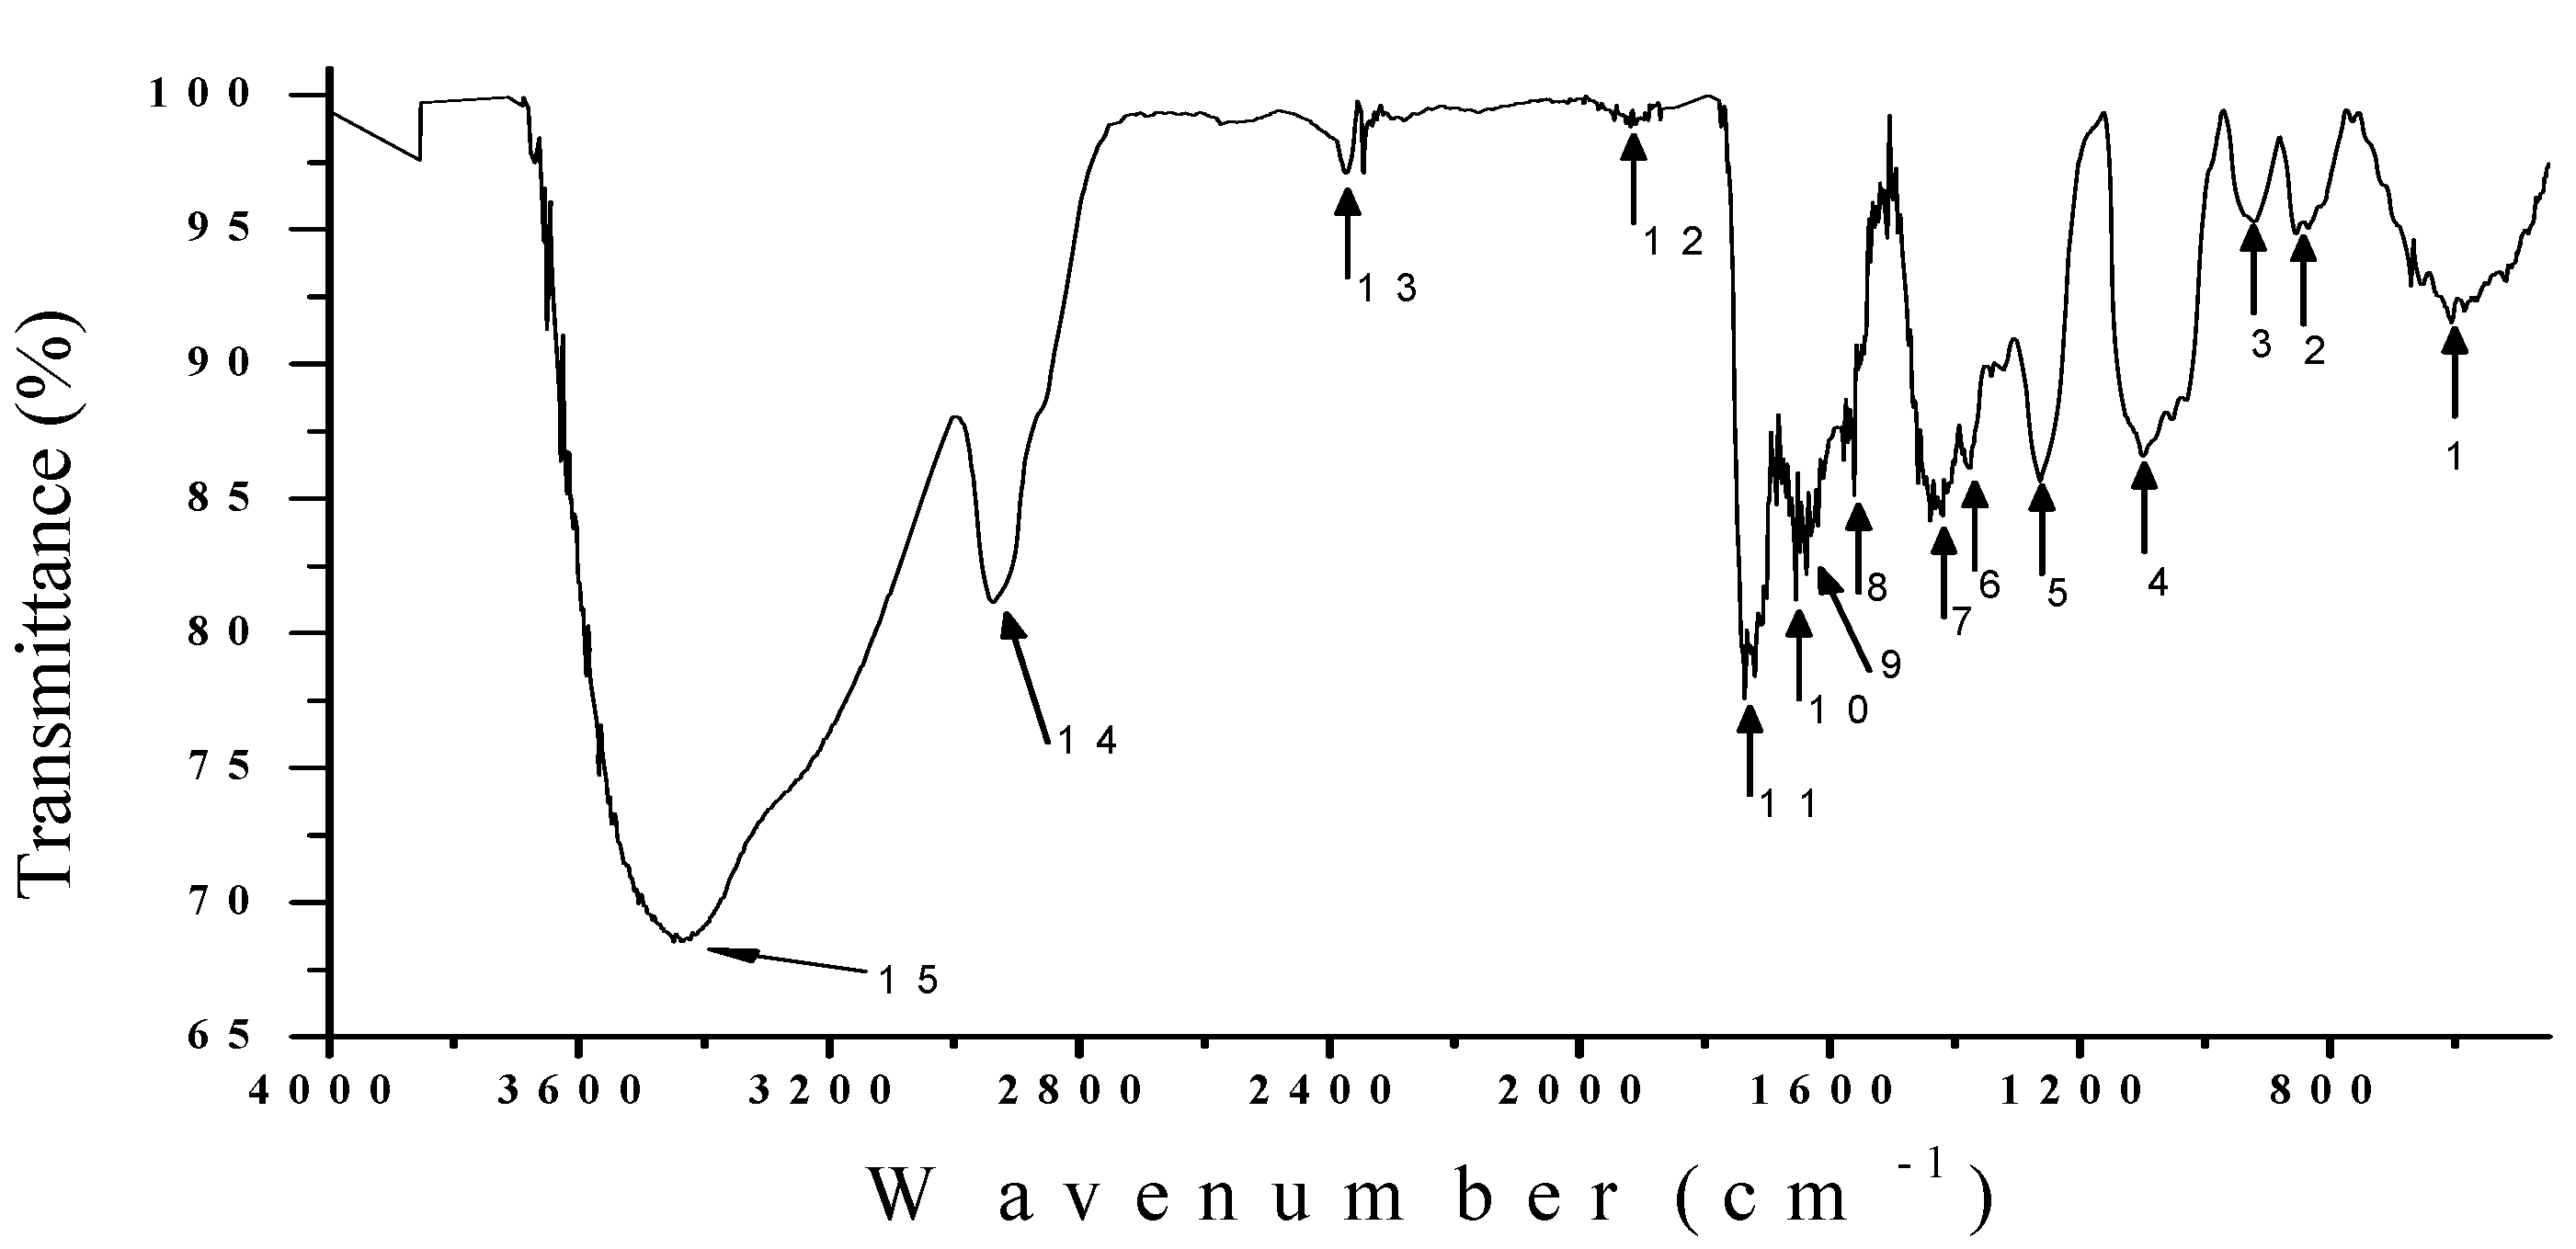
3.5. IR Analysis

| # | Vibrational bands (cm−1) | Probable Links |
|---|---|---|
| 15 | 3448 | N-H Amine, O-H Alcohol |
| 14 | 2939 | O-H Carboxylic Acid, N-H Amine, C-H Alkane |
| 13 | 2374 | N-H Amine |
| 12 | 1911 | C=C=C Alkene, \C=C/ Benzene ring, C=O Anhydride |
| 11 | 1735 | C=O Carboxylic Acid, C=O Ester, C=O Carbonyl, \C=C/ Benzene ring |
| 10 | 1654 | C=C Alkene, C-C Alkane acyclic |
| 9 | 1637 | C=C Alkene, N-H Amine, C-C Alkane monosubstituted |
| 8 | 1618 | N-H Amine, C=O Amino Acid zwitterions |
| 7 | 1560 | C=O Amino Acid, N-H Amine, \C=C/ Benzene ring |
| 6 | 1419 | C-H Alkane, N-O Nitro aliphatic |
| 5 | 1263 | C-O Carboxylic Acid, C=O Ester, C-H Alkane methyl |
| 4 | 1099 | C-O Alcohol, C-F Alkaly Halide, C-N Amine |
| 3 | 921 | =C-H Alkene, Benzene ring meta-disubstituted |
| 2 | 854 | =C-H Alkene, Benzene ring para-disubstituted |
| 1 | 605 | C-Cl Alkyl Halide, C-Br Alkyl Halide |
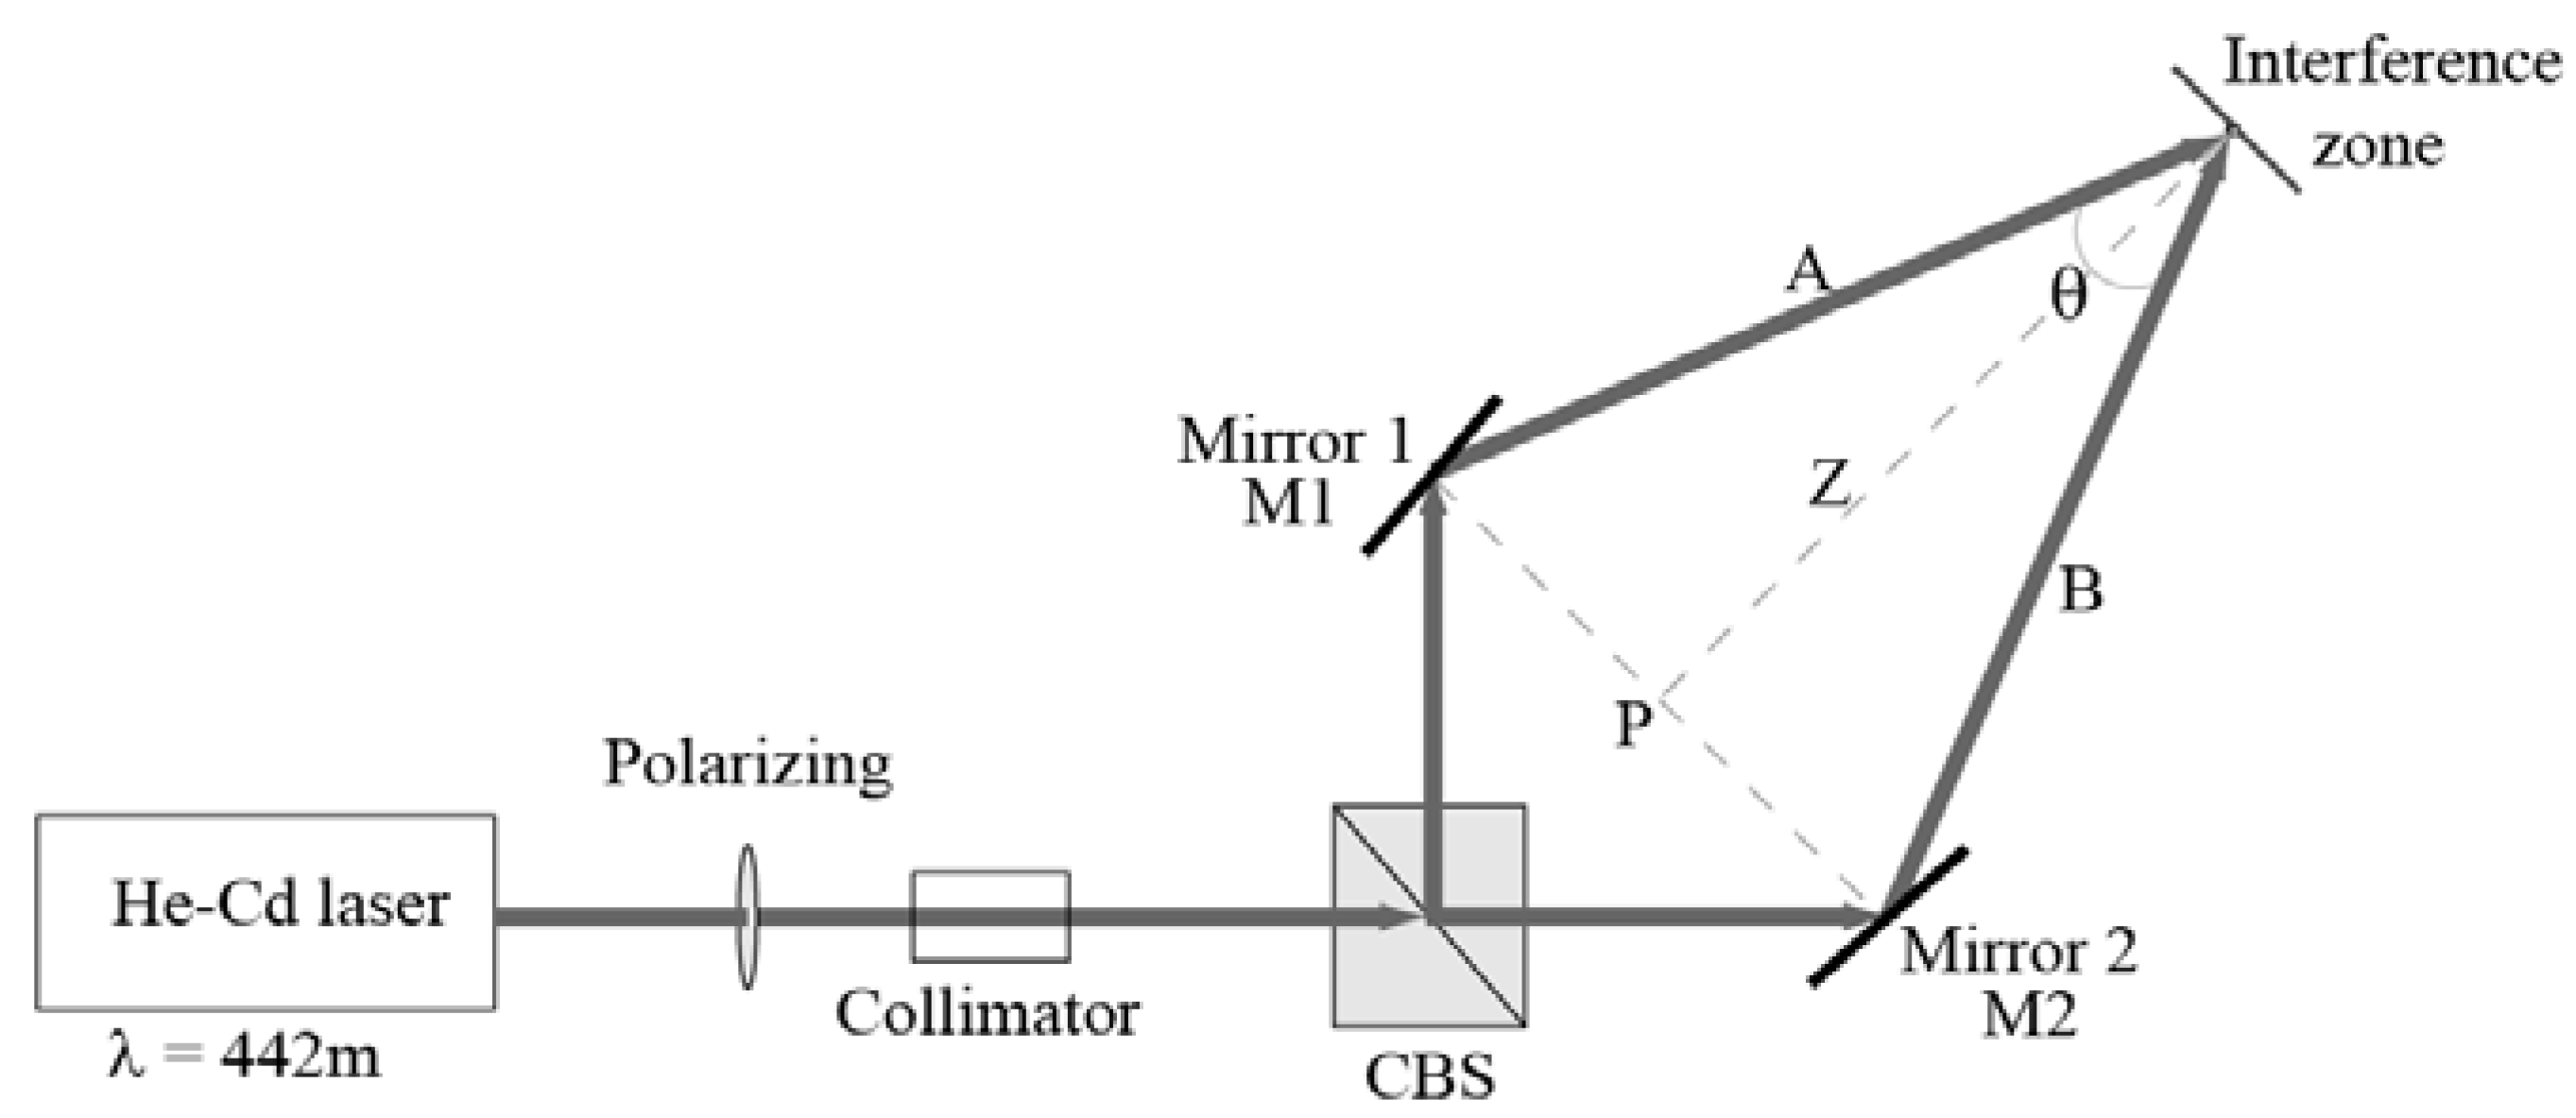
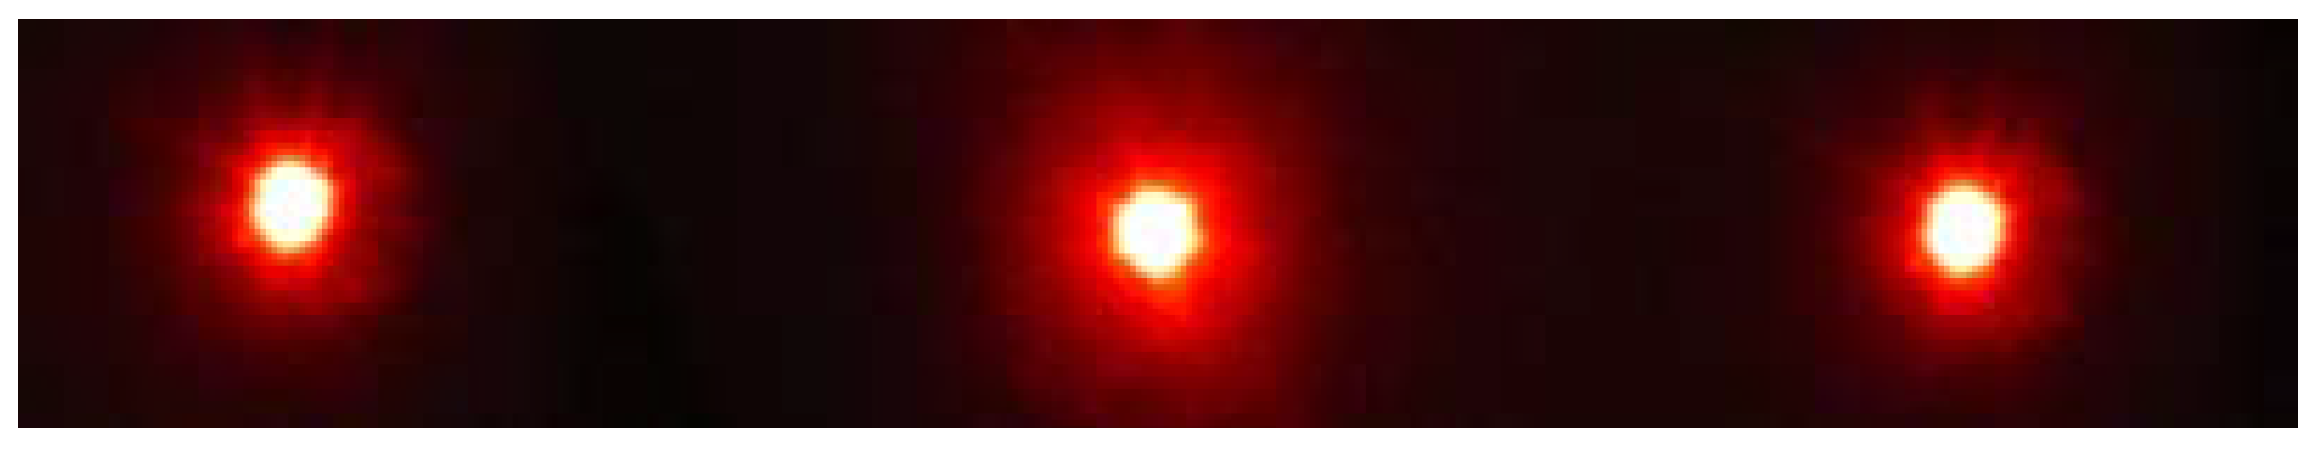
3.6. Recording Process

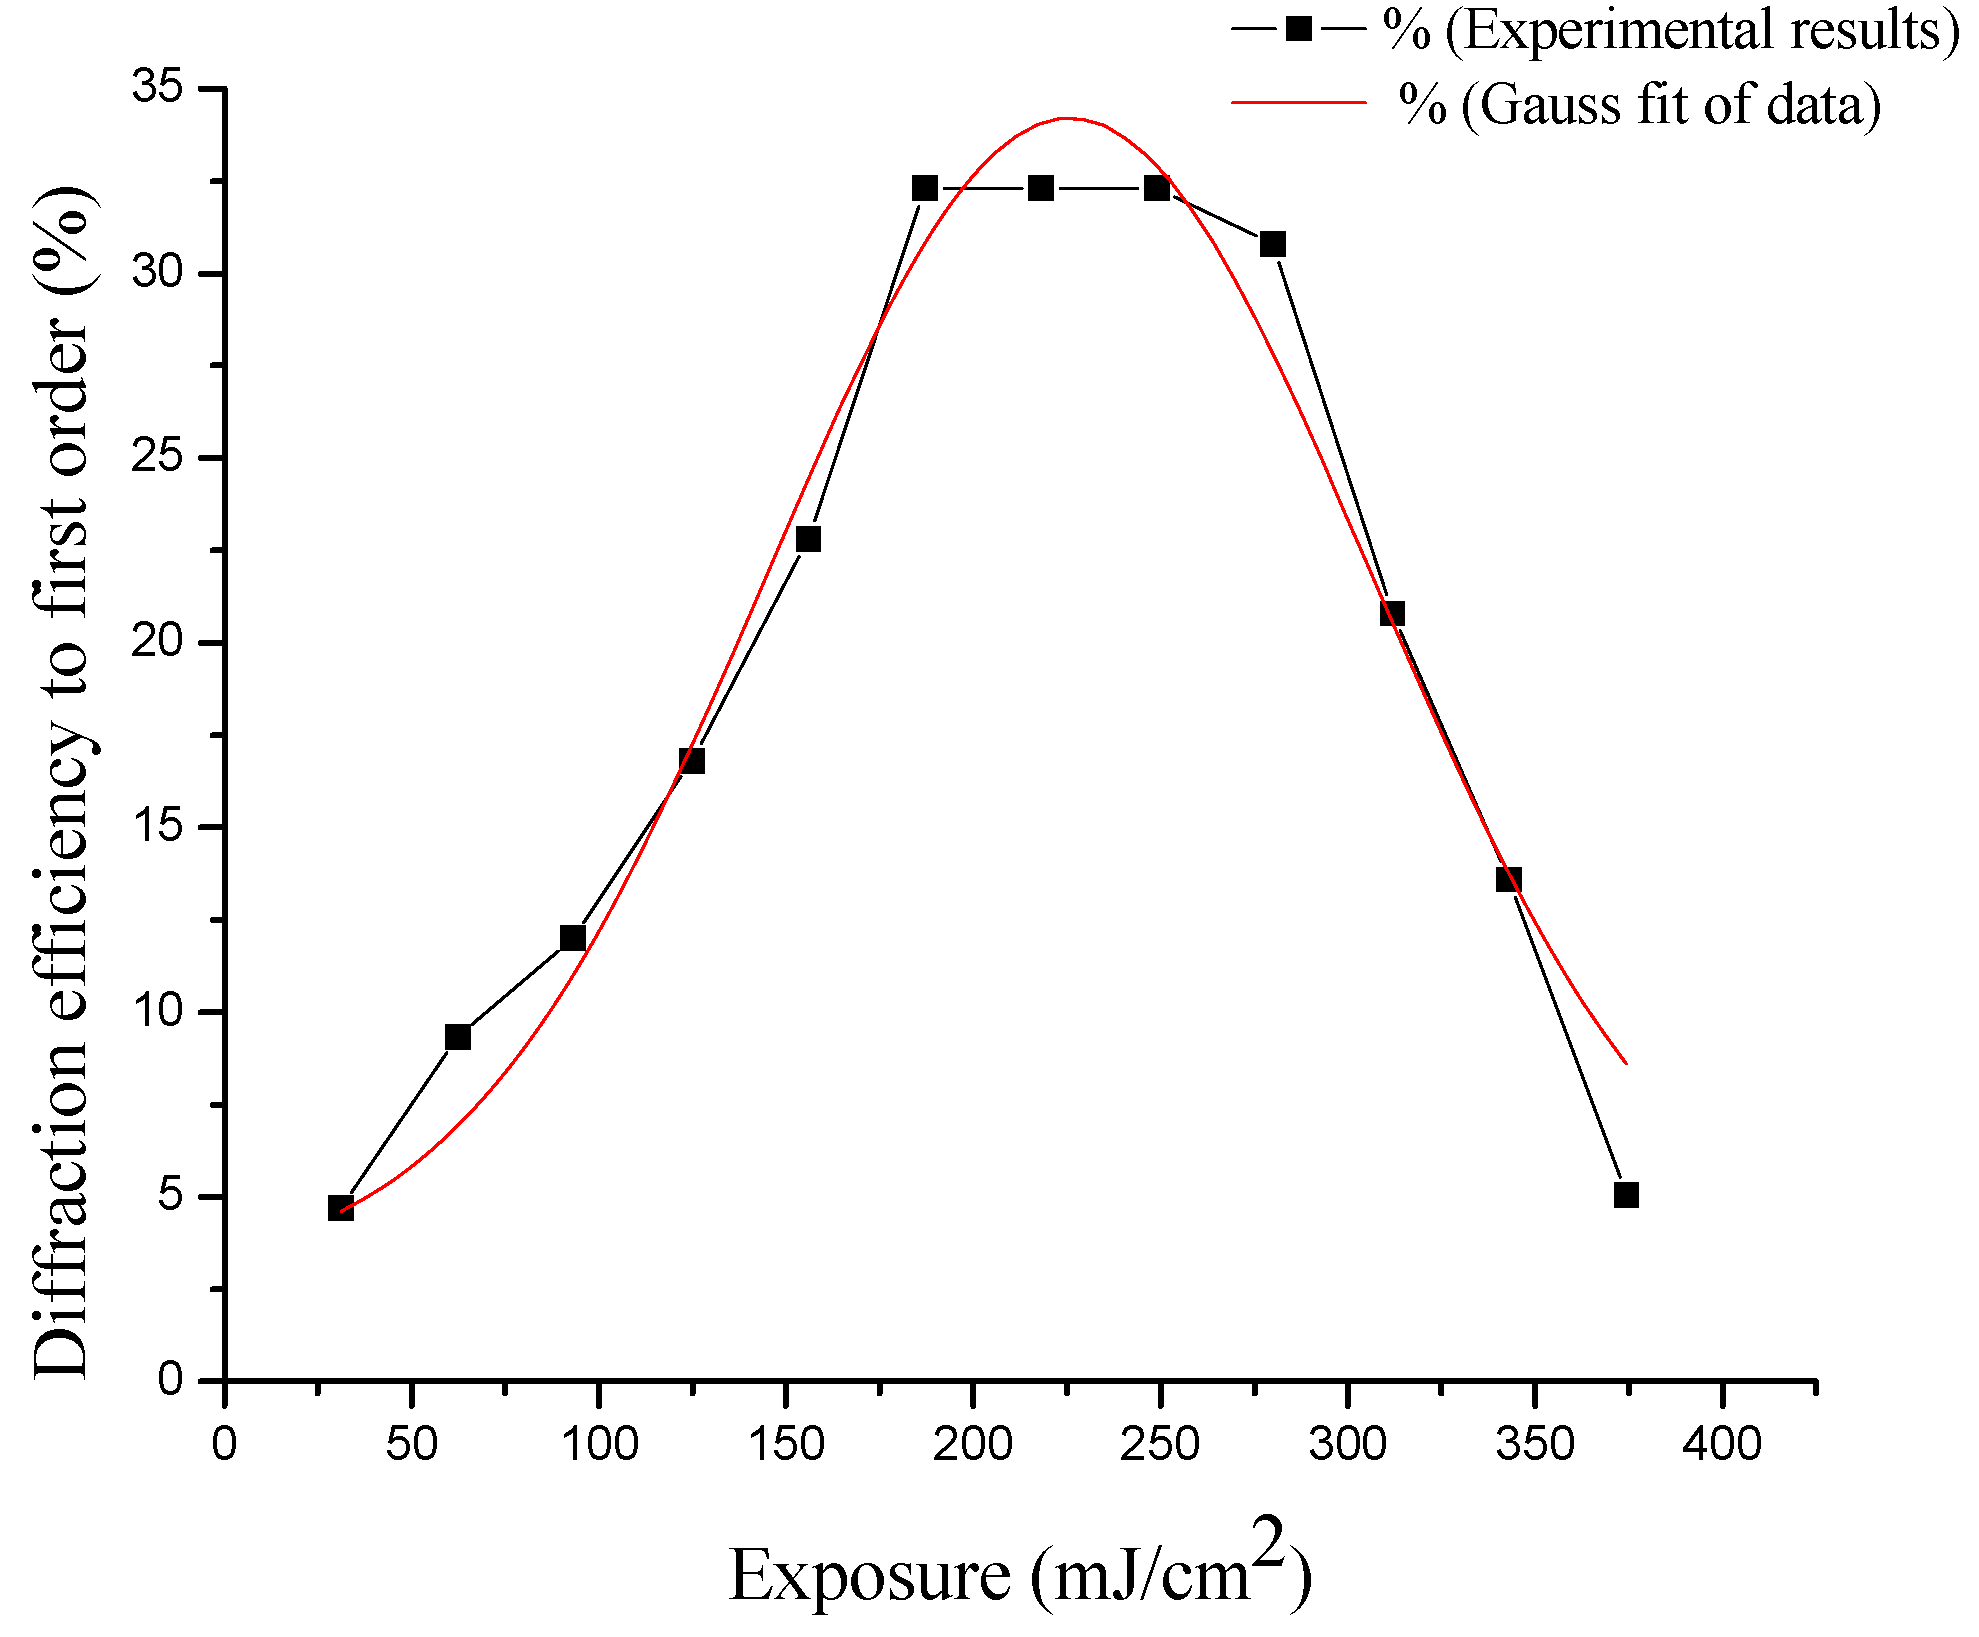
3.7. Experimental Results

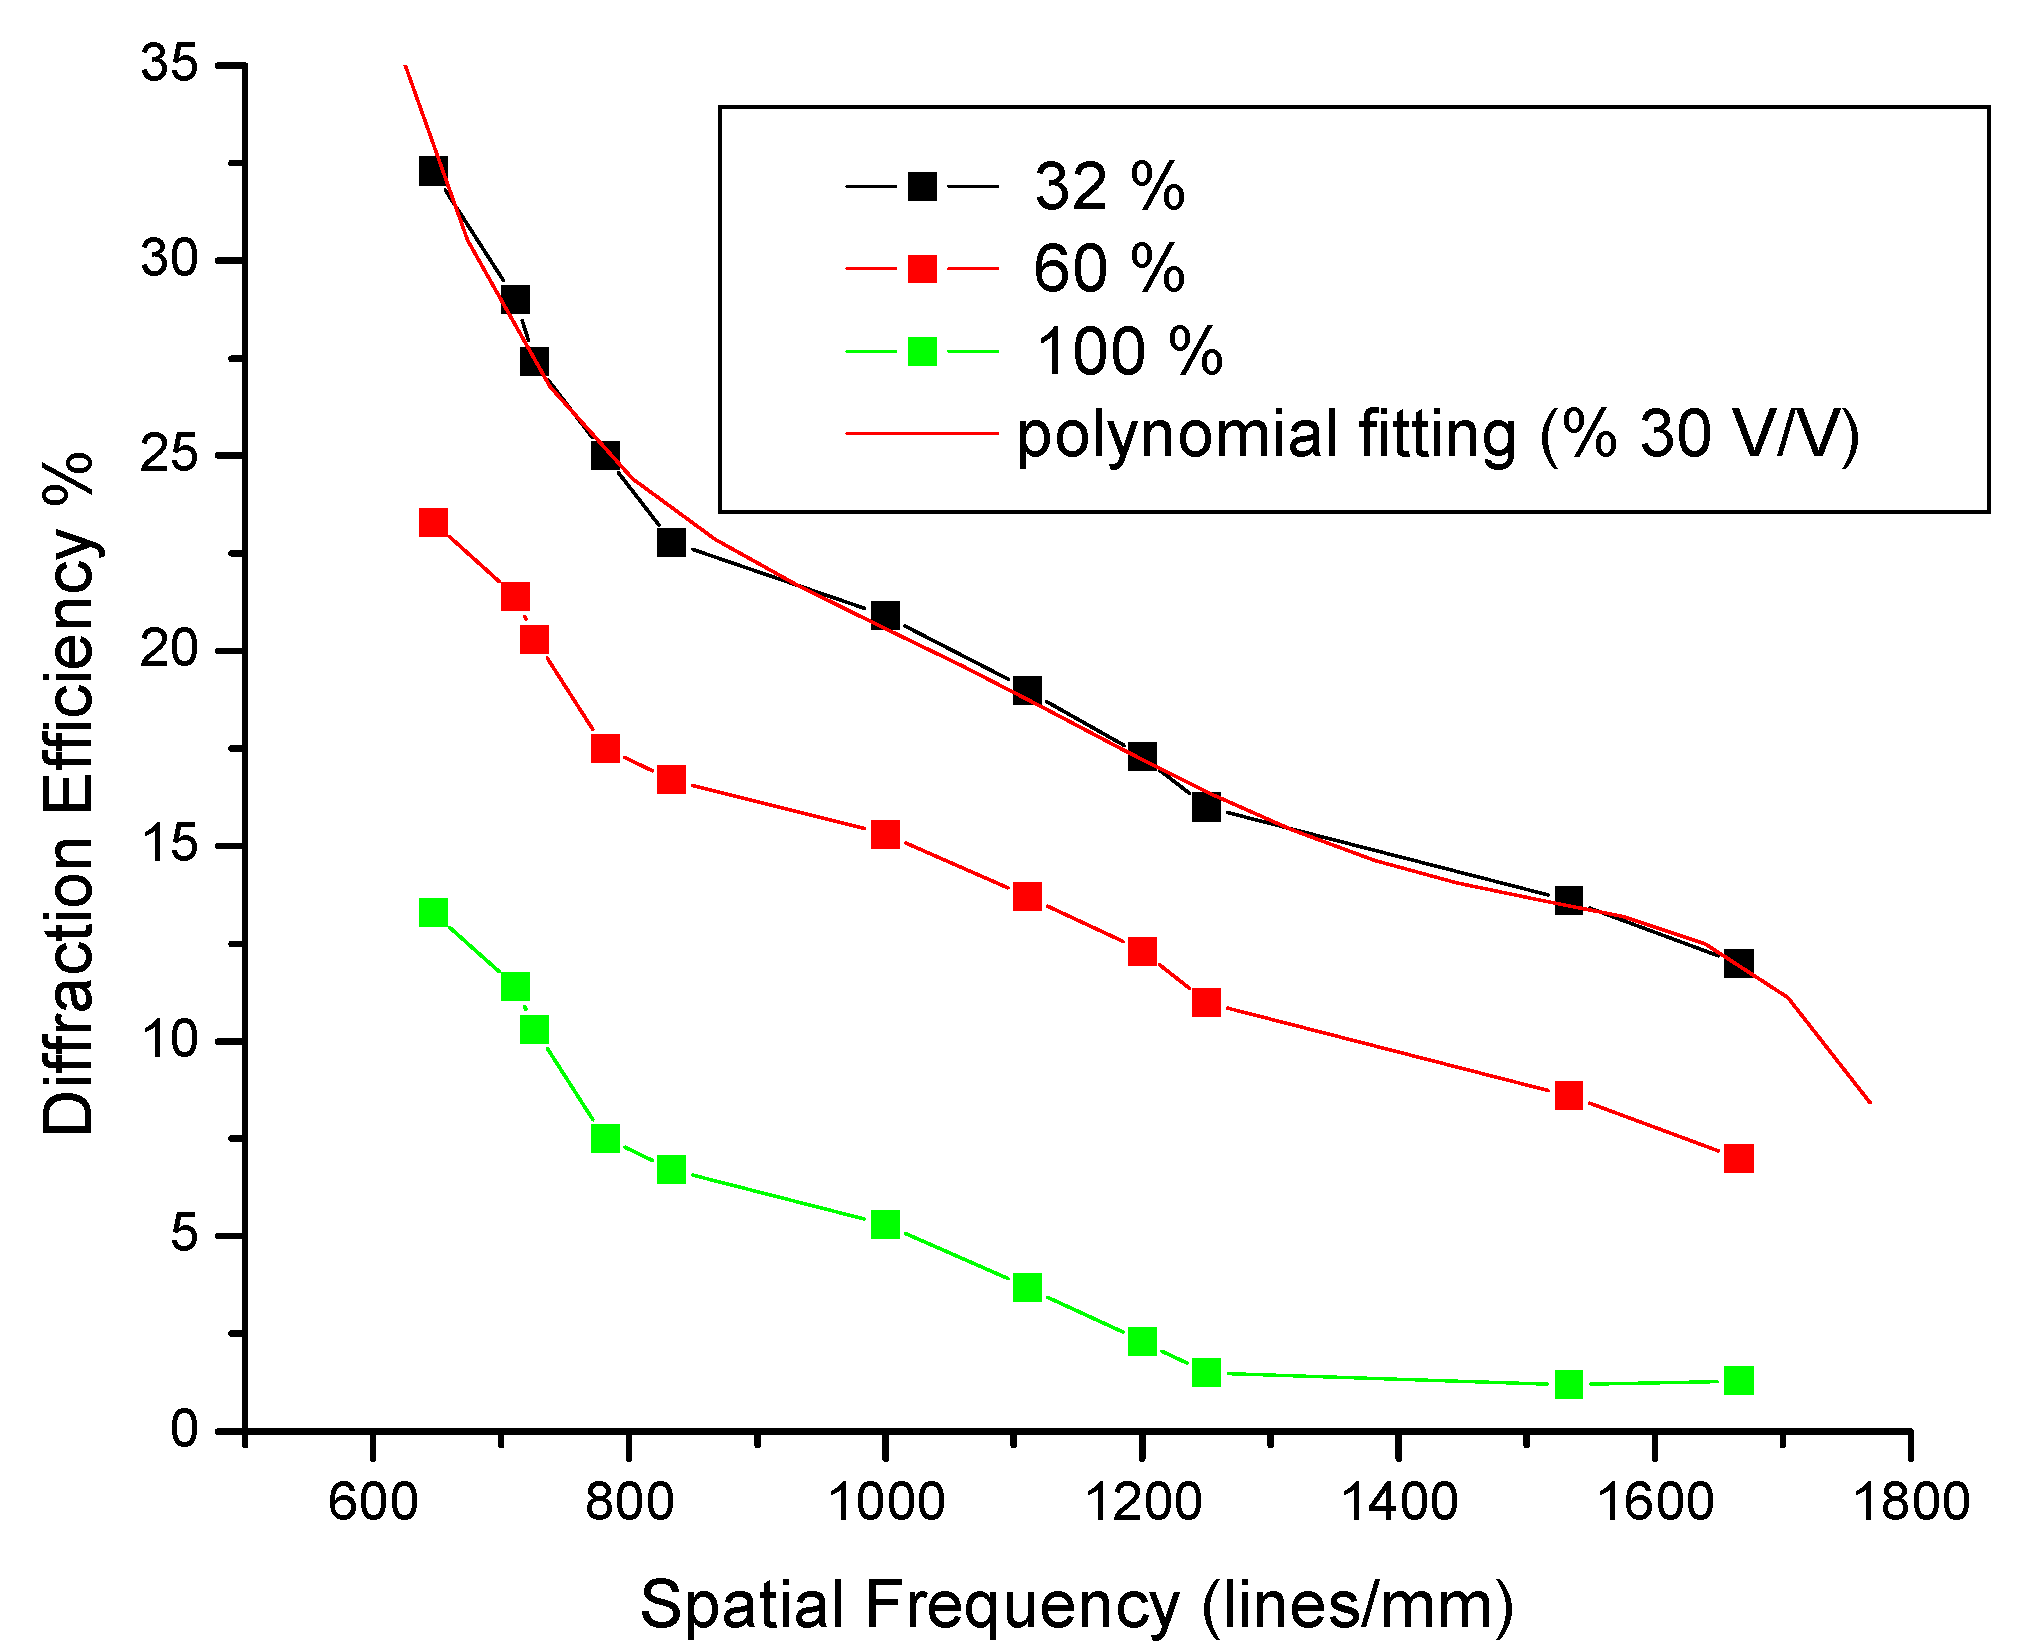
3.8. Energy and MTF


| PVA (mL ± 0.05) | Cactus Extract (mL ± 0.05) | % V/V | Solution on 9 (cm2) | Thickness Physical (μm ± 0.5) |
|---|---|---|---|---|
| 2.5 | 2.5 | 100% | 0.5 mL | 45 |
| 2.5 | 1.5 | 60% | 0.5 mL | 43 |
| 2.5 | 0.8 | 32% | 0.5 mL | 40 |
4. Conclusions
Acknowledgements
References
- Hariharan, P. Hologram recording materials: Recent development. Opt. Eng. 1980, 19, 636–641. [Google Scholar] [CrossRef]
- Sugawara, S.; Murase, K.; Kitayama, T. Holographic recording by dye-sensitized photopolymerization of acrylamide. Appl. Opt. 1975, 14, 378–382. [Google Scholar] [CrossRef] [PubMed]
- Oliva, J.; Mateos, F.; Pastor, C. Dye-sensitized photopolymers in making realtime holographic interferograms. Opt. Pura. Apl. 1985, 18, 193–196. [Google Scholar]
- Ingwall, R.T.; Troll, M. Mechanism of hologram formation in DMP-128 photopolymer. Opt. Eng. 1989, 28, 586–591. [Google Scholar] [CrossRef]
- Smothers, W.K.; Monroe, B.M.; Weber, A.M.; Keys, D.E. Photopolymer for holography. In Practical Holography IV, Proceedings of the SPIE, Los Angeles, CA, USA, 18–22 January 1990; Benton, S.A., Ed.; SPIE: Bellingham, WA, USA, 1990; Volume 1212, pp. 20–29. [Google Scholar]
- Krebs, F.C.; Ramanujam, P.S. Holographic recording in a series of conjugated polymers. Opt. Mater. 2006, 28, 350–354. [Google Scholar] [CrossRef]
- Lee, S.K.; Neckers, D.C. Benzospiropyrans as photochromic and/or thermochromic photoinitiators. Chem. Mater. 1991, 3, 852–858. [Google Scholar] [CrossRef]
- Barachevsky, V.A. Organic storage media for holographic optical memory: State-of-the-art and future. In Holography 2000, Proceedings of the SPIE, St. Poelton, Austria, 10–14 July 2000; Jeong, T.H., Sobotka, W.K., Eds.; SPIE: Bellingham, WA, USA, 2000; Volume 4149, pp. 205–212. [Google Scholar]
- Zhu, J.; Wang, G.; Hao, Y.; Xie, B.; Cheng, A.Y. Highly sensitive and spatially resolved polyvinyl alcohol/acrylamide photopolymer for real-time holographic applications. Opt. Express. 2010, 18, 18106–18112. [Google Scholar] [CrossRef] [PubMed]
- Grzymala, R.; Keinonen, T. Self-enhancement of holographic gratings in dichomated gelatine and polyvinyl alcohol films. Appl. Opt. 1998, 37, 6623–6626. [Google Scholar] [CrossRef] [PubMed]
- Todorov, T.; Nikola, L.; Tomova, N. Polarization holography. 1: A new high-efficiency organic material with reversible photoinduced birefringence. Appl. Opt. 1984, 23, 4309–4312. [Google Scholar] [CrossRef] [PubMed]
- Toxqui-López, S.; Olivares-Pérez, A.; Fuentes-Tapia, I.; Pinto-Iguanero, B. PVA with Nopal dye as holographic recording material. In 22nd Congress of the International Commission for Optics: Light for the Development of the World, Proceedings of the SPIE, Puebla, Mexico, 15–19 August 2011; Rodríguez-Vera, R., Díaz-Uribe, R., Eds.; SPIE: Bellingham, WA, USA, 2011. [Google Scholar]
- Patrick-Griffith, M. The origins of an important cactus crop, opuntia ficus-indica (cactaceae): New molecular evidence. Am. J. Bot. 2004, 91, 1915–1921. [Google Scholar] [CrossRef] [PubMed]
- Bergh, B.O. Avocado: Persea Americana (lauraceae). (In Spanish). In Evolution of Crop Plants; Smartt, J., Simmonds, N.W., Eds.; Longman Scientific & Technical Publishers: Essex, UK, 1995; pp. 240–245. [Google Scholar]
- Roth, M. The laws of Hammurabi. In The Contex of Scripture; Hallo, W., Younger, K.L., Eds.; Brill: Leiden, the Netherlands, 2000; pp. 335–353. [Google Scholar]
- Del-Valle, V.; Hernández-Muñoz, P.; Guarda, A.; Galotto, M.J. Development of cactus mucilage edible coating (opuntia ficus indica) and its application to extend strawberry (fragaria ananassa) shelf-life. Food Chem. 2005, 91, 751–756. [Google Scholar] [CrossRef]
- Medina-Torrez, L.; Brito-De La Fuente, E.; Torrestiana-Sanchez, B.; Alonso, S. Mechanical properties of gels formed by mixtures of mucilage gum (opuntia ficus indica) and carrageenans. Carbohydr. Polym. 2003, 52, 143–150. [Google Scholar] [CrossRef]
- Cardenas, A.; Goycoolea, F.M.; Rinaudo, M. On the gelling behaviour of “nopal” (opuntia ficus indica) low methoxyl pectin. Carbohydr. Polym. 2008, 73, 212–222. [Google Scholar] [CrossRef]
- Goycoolea, F.M.; Cárdenas, A. Pectins from opuntia spp: A short review. J. Prof. Assoc. Cactus Dev. 2003, 5, 17–29. [Google Scholar]
- Majdoub, H.; Roudesli, S.; Deratani, A. Polysaccharides from prickly pear peel and nopals of Opuntia ficus-indica: Extraction, characterization and polyelectrolyte behavior. Polym. Int. 2001, 50, 552–560. [Google Scholar] [CrossRef]
- Trachtenberg, S.; Mayer, A.M. Composition and properties of opuntia ficus-indica mucilage. Phytochem. 1981, 20, 2665–2668. [Google Scholar] [CrossRef]
- McGarvie, D.; Parolis, H. Methylation analysis of the mucilage of opuntia ficus-indica. Carbohydr. Res. 1981, 88, 305–314. [Google Scholar] [CrossRef]
- Yoon-Hee, H.; Young-Hwan, K. Isolation of a pestalotiopsis species degrading mucilage from fruit of opuntia ficus-indica var. sabote. J. Appl. Biol. Chem. 2007, 50, 221–226. [Google Scholar]
- Fleming, I. Absolute configuration and the structure of chlorophyll. Nature 1967, 216, 151–152. [Google Scholar] [CrossRef]
- Arar, E.J. Evaluation of a new fluorometric technique that uses highly selective interference filters for measuring chlorophyll a in the presence of chlorophyll b and pheopigments. In Environmental Monitoring Systems Laboratory; Summary Report for the Office of Research and Development EPA: Cincinnati, OH, USA, 1994. [Google Scholar]
- Holm-Hansen, O.; Lorenzen, C.J.; Holmes, R.W.; Strickland, J.D.H. Fluorometric determination of chlorophyll. J. Cons. Perm. Int. Explor. Mer. 1965, 30, 3–15. [Google Scholar] [CrossRef]
- Larkum, A.W.D.; Kühl, M. Chlorophyll d: the puzzle resolved. Trends Plant Sci. 2005, 10, 355–357. [Google Scholar] [CrossRef] [PubMed]
- Chlorophyll. Available online: http://en.wikipedia.org/wiki/Chlorophyll#cite_note-motilva (accessed on 1 April 2012).
- Müller, T.; Ulrich, M.; Karl-Hans, O.; Kräutle, B. Colorless tetrapyrrolic chlorophyll catabolites found in ripening fruit are effective antioxidants. Angew. Chem. Int. Ed. 2007, 46, 8699–8702. [Google Scholar] [CrossRef]
- Belitz, H.D.; Grosch, W. Food Chemistry, 2nd ed.; Springer: Berlin, Germany, 1999; pp. 98–140. [Google Scholar]
- Maiocchi, M.G.; Avanza, J.R. Degradación de clorofilas y feofitinas a diferentes temperaturas en Ilex dumosa e Ilex paraguariensis; (in Spanish). National University of the Northeast: Corrientes, Argentina, 2004; pp. 1–4. [Google Scholar]
- Hernández-Urbiola, M.I.; Pérez-Torrero, E.; Rodríguez-García, M.E. Chemical analysis of nutritional content of prickly pads (opuntia ficus indica) at varied ages in an organic harvest. Int. J. Environ. Res. Public Health 2011, 8, 1287–1295. [Google Scholar] [CrossRef] [PubMed]
- Stintzing, F.C.; Carle, R. Cactus stems (Opuntia spp.): A review on their chemistry, technology, and uses. Mol. Nutr. Food Res. 2005, 49, 175–194. [Google Scholar] [CrossRef] [PubMed]
- Piga, A. Cactus pear, a fruit of nutraceutical and functional importance. J. Prof. Assoc. Cactus. Dev. 2004, 6, 9–22. [Google Scholar]
- Gallegos-Infante, J.A.; Rocha-Guzman, N.E.; González-Laredo, R.F.; Reynoso-Camacho, R.; Medina-Torres, L.; Cervantes-Cardozo, V. Effect of air flow rate on the polyphenols content and antioxidant capacity of convective dried cactus pear cladodes (Opuntia ficus indica). Int. J. Food Sci. Nutr. 2009, 60, 80–87. [Google Scholar] [CrossRef] [PubMed]
- Salim, N.; Abdelwaheb, C.; Rabah, C.; Ahcene, B. Chemical composition of Opuntia ficus-indica (L.) fruit. Afr. J. Biotechnol. 2009, 8, 1623–1624. [Google Scholar]
- Díaz-Medina, E.M.; Rodríguez-Rodríguez, E.M.; Díaz-Romero, C. Chemical characterization of Opuntia dillenii and Opuntia ficusindica fruits. Food Chem. 2007, 103, 38–45. [Google Scholar] [CrossRef]
- Vàmos-Vigyàzò, L. Polyphenol oxidase and peroxide in fruits and vegetables. CRC Crit. Rev. Food Sci. Nutr. 1981, 15, 49–127. [Google Scholar] [CrossRef]
- Quevedo-Preciado, K.L.; Villegas-Ochoa, M.A.; González-Ríos, H.; Rodríguez-Félix, A. Quality of minimally processed cactus stems. Effect of temperature and browning inhibitors. Rev. Fitotec. Mex. 2005, 28, 261–270. [Google Scholar]
- Saxena, S.K. Polyvynyl alcohol (PVA). Chem. Tech. Assess. 2004, 61, 3–7. [Google Scholar]
- Hernández-Garay, M.P.; Olivares-Pérez, A.; Fuentes-Tapia, I. Characterization and evolution of electro-optical properties from holograms replication on polymer (PVA) with salts (FeCl3). In 5th International Workshop on Information Optics (WIO’06), AIP Conference Proceedings, Toledo, Spain, 5–7 June 2006; Volume 860, pp. 446–454.
- Budkevich, B.A.; Polikanin, A.M.; Pilipovich, V.A.; Ya-Petrochenko, N. Amplitude-phase hologram recording on FeCl3–PVA films. J. Appl. Spectrosc. 1989, 50, 621–624. [Google Scholar] [CrossRef]
- Manivannan, G.; Changkakoti, R.; Lessard, R.A. Cr (VI)- and Fe(III)-doped polymer systems as real-time holographic recording materials. Opt. Eng. 1993, 32, 671–675. [Google Scholar] [CrossRef]
- Olivares-Pérez, A.; Hernández-Garay, M.P.; Fuentes-Tapia, I.; Ibarra-Torres, J.C. Holograms in polyvinyl alcohol photosensitized with CuCl2 (2H2O). Opt. Eng. 2011, 50, 065801:1–065801:6. [Google Scholar]
- Mykhalichko, B.M.; Temkin, O.N.; Myskiv, M.G. Polynuclear complexes of copper(I) halides: Coordination chemistry and catalytic transformations of alkynes. Russ. Chem. Rev. 2000, 69, 957–984. [Google Scholar] [CrossRef]
- John, B.M.; Joseph, R.; Sreekumar, K.; Sudha-Kartha, C. Copper doped methylene blue sensitized poly(vinyl alcohol)-acrylamide films for stable diffraction efficiency. Jpn. J. Appl. Phys. 2006, 45, 8686–8690. [Google Scholar] [CrossRef]
- Kim, E.J.; Yang, H.R.; Lee, S.J.; Kim, G.Y.; Kwak, C.H. Orientational photorefractive holograms in porphyrin: Zn-doped nematic liquid crystals. Opt. Express. 2008, 16, 17329–17341. [Google Scholar] [CrossRef] [PubMed]
- Patachia, S.; Rinja, M.; Isac, L. Some methods for doping poly(vinyl alcohol) hydrogels [PVA-HG]. Rom. J. Phys. 2006, 51, 253–262. [Google Scholar]
- Koca, N.; Karadeniz, F.; Burdurlu, H.S. Effect of pH on chlorophyll degradation and colour loss in blanched green peas. Food Chem. 2007, 100, 609–615. [Google Scholar] [CrossRef]
- Nelson, R.E.; Ferruzzi, M.G. Synthesis and bioaccessibility of Fe-pheophytin derivatives from crude spinach extract. J. Food Sci. 2008, 73, H86–H91. [Google Scholar] [CrossRef] [PubMed]
- Baker, E.W.; Palmer, S.E. The Porphyrins; Dolphin, D., Ed.; Academic press: New York, NY, USA, 1978; Volume 1, pp. 486–552. [Google Scholar]
- Sandiningtyas, R.D.; Suendo, V. Isolation of chlorophyll a from spinach and its modification using Fe2+ in photostability study. In Proceedings of the Third International Conference on Mathematics and Natural Sciences, ICMNS, Bandung, Indonesia, 23–25 November 2010; pp. 859–873.
- Simon, W.; Clerc, T. Elucidación Estructural de Compuestos Orgánicos Por Métodos Espectroscópicos Tomo1, Tablas; (In Spanish). Editorial Alhambra: Madrid, Spain, 1970; pp. 45–60. [Google Scholar]
- Owens, J.W.; O’Connor, C.J. A comparison of the electronic and vibrational spectra of protoporphyrin-IX, hemeoctapeptide, and hemoglobin. Coord. Chem. Rev. 1988, 84, 1–45. [Google Scholar] [CrossRef]
- Crichton, R.R.; Ward, R.J. Iron homeostasis. Met. Ions. Biol. Syst. 1998, 35, 633–665. [Google Scholar] [PubMed]
- Walling, C.; Kurz, M.; Schugar, H.J. The iron(III)-ethylenediaminetetraacetic acid-peroxide system. Inorg. Chem. 1970, 9, 931–937. [Google Scholar] [CrossRef]
- Braun, H.; Gallagher, K.J. Fe2O: A new structural form of iron(III) oxide. Nature 1972, 240, 13–14. [Google Scholar]
- Stiller, A.H.; McCormick, B.J.; Russell, P.; Montano, P.A. Existence and stability of a simple sulfide of iron(III). J. Am. Chem. Soc. 1978, 100, 2553–2554. [Google Scholar] [CrossRef]
- Cotton, F.A.; Wilkinson, G. Advanced Inorganic Chemistry, 4th ed.; Interscirncie publishers, Diviton of John Wiley & Sons, Inc.: Dorset, UK, 1980; pp. 905–924. [Google Scholar]
- Slavich films. Available online: http://www.slavich.com/vrpm.htm (accessed on 20 September 2012).
- Fujifilm F-HL-10. Available online: http://www.fujifilmeurope.be/apps/fuji/fujifilmnv.nsf/files/holography%20pdf%20files/$file/holoGF_01042009.pdf (accessed on 27 October 2012).
- Litiholo RRT20. Available online: http://www.litiholo.com/images/Litiholo%20RRT20%20hologram%20film%20spec%20sheet.pdf (accessed on 20 September 2012).
- Gunzler, H.; Ulrich-Gremlich, H. IR Spectroscopy: An Introduction, 1st ed.; WILEY-VCH Verlag GmbH press: Berlin, Germany, 2002; pp. 171–274. [Google Scholar]
- Xu, F.; Sun, J.X.; Geng, Z.C.; Liu, C.F.; Ren, J.L.; Sun, R.C.; Fowler, P.; Baird, M.S. Comparative study of water-soluble and alkali-soluble hemicelluloses from perennial ryegrass leaves(Loliumperee). Carbohydr. Polym. 2007, 67, 56–65. [Google Scholar] [CrossRef]
- Biomass. Available online: http://www.biorefinery.uga.edu/biomasscharacterization.html (accessed on 7 May 2012).
- Kogelnik, H. Coupled wave theory for thick hologram gratings. Bell Syst. Tech. J. 1969, 48, 2909–2947. [Google Scholar] [CrossRef]
- Kwiek, P.; Molkenstruckb, W.; Reibold, R. Determination of the klein-cook parameter in ultrasound light diffraction. Ultrasonics 1996, 34, 801–805. [Google Scholar] [CrossRef]
- Moharam, M.G.; Young, L. Criterion for bragg and raman-nath diffraction regimes. Appl. Opt. 1978, 17, 1757–1759. [Google Scholar] [CrossRef] [PubMed]
- Gallego, S.; Ortuño, M.; Neipp, C.; García, C.; Beléndez, A.; Pascual, I. Temporal evolution of the angular response of a holographic diffraction grating in PVA/acrylamide photopolymer. Opt. Express. 2003, 11, 181–190. [Google Scholar] [CrossRef] [PubMed]
- Bányász, I. Evaluation of the imaging properties of holograms recorded in materials of limited spatial resolution. Opt. Eng. 1993, 32, 2539–2547. [Google Scholar] [CrossRef]
© 2012 by the authors; licensee MDPI, Basel, Switzerland. This article is an open access article distributed under the terms and conditions of the Creative Commons Attribution license (http://creativecommons.org/licenses/by/3.0/).
Share and Cite
Olivares-Pérez, A.; Toxqui-López, S.; Padilla-Velasco, A.L. Nopal Cactus (Opuntia Ficus-Indica) as a Holographic Material. Materials 2012, 5, 2383-2402. https://doi.org/10.3390/ma5112383
Olivares-Pérez A, Toxqui-López S, Padilla-Velasco AL. Nopal Cactus (Opuntia Ficus-Indica) as a Holographic Material. Materials. 2012; 5(11):2383-2402. https://doi.org/10.3390/ma5112383
Chicago/Turabian StyleOlivares-Pérez, Arturo, Santa Toxqui-López, and Ana L. Padilla-Velasco. 2012. "Nopal Cactus (Opuntia Ficus-Indica) as a Holographic Material" Materials 5, no. 11: 2383-2402. https://doi.org/10.3390/ma5112383