3.2. MAS NMR Studies
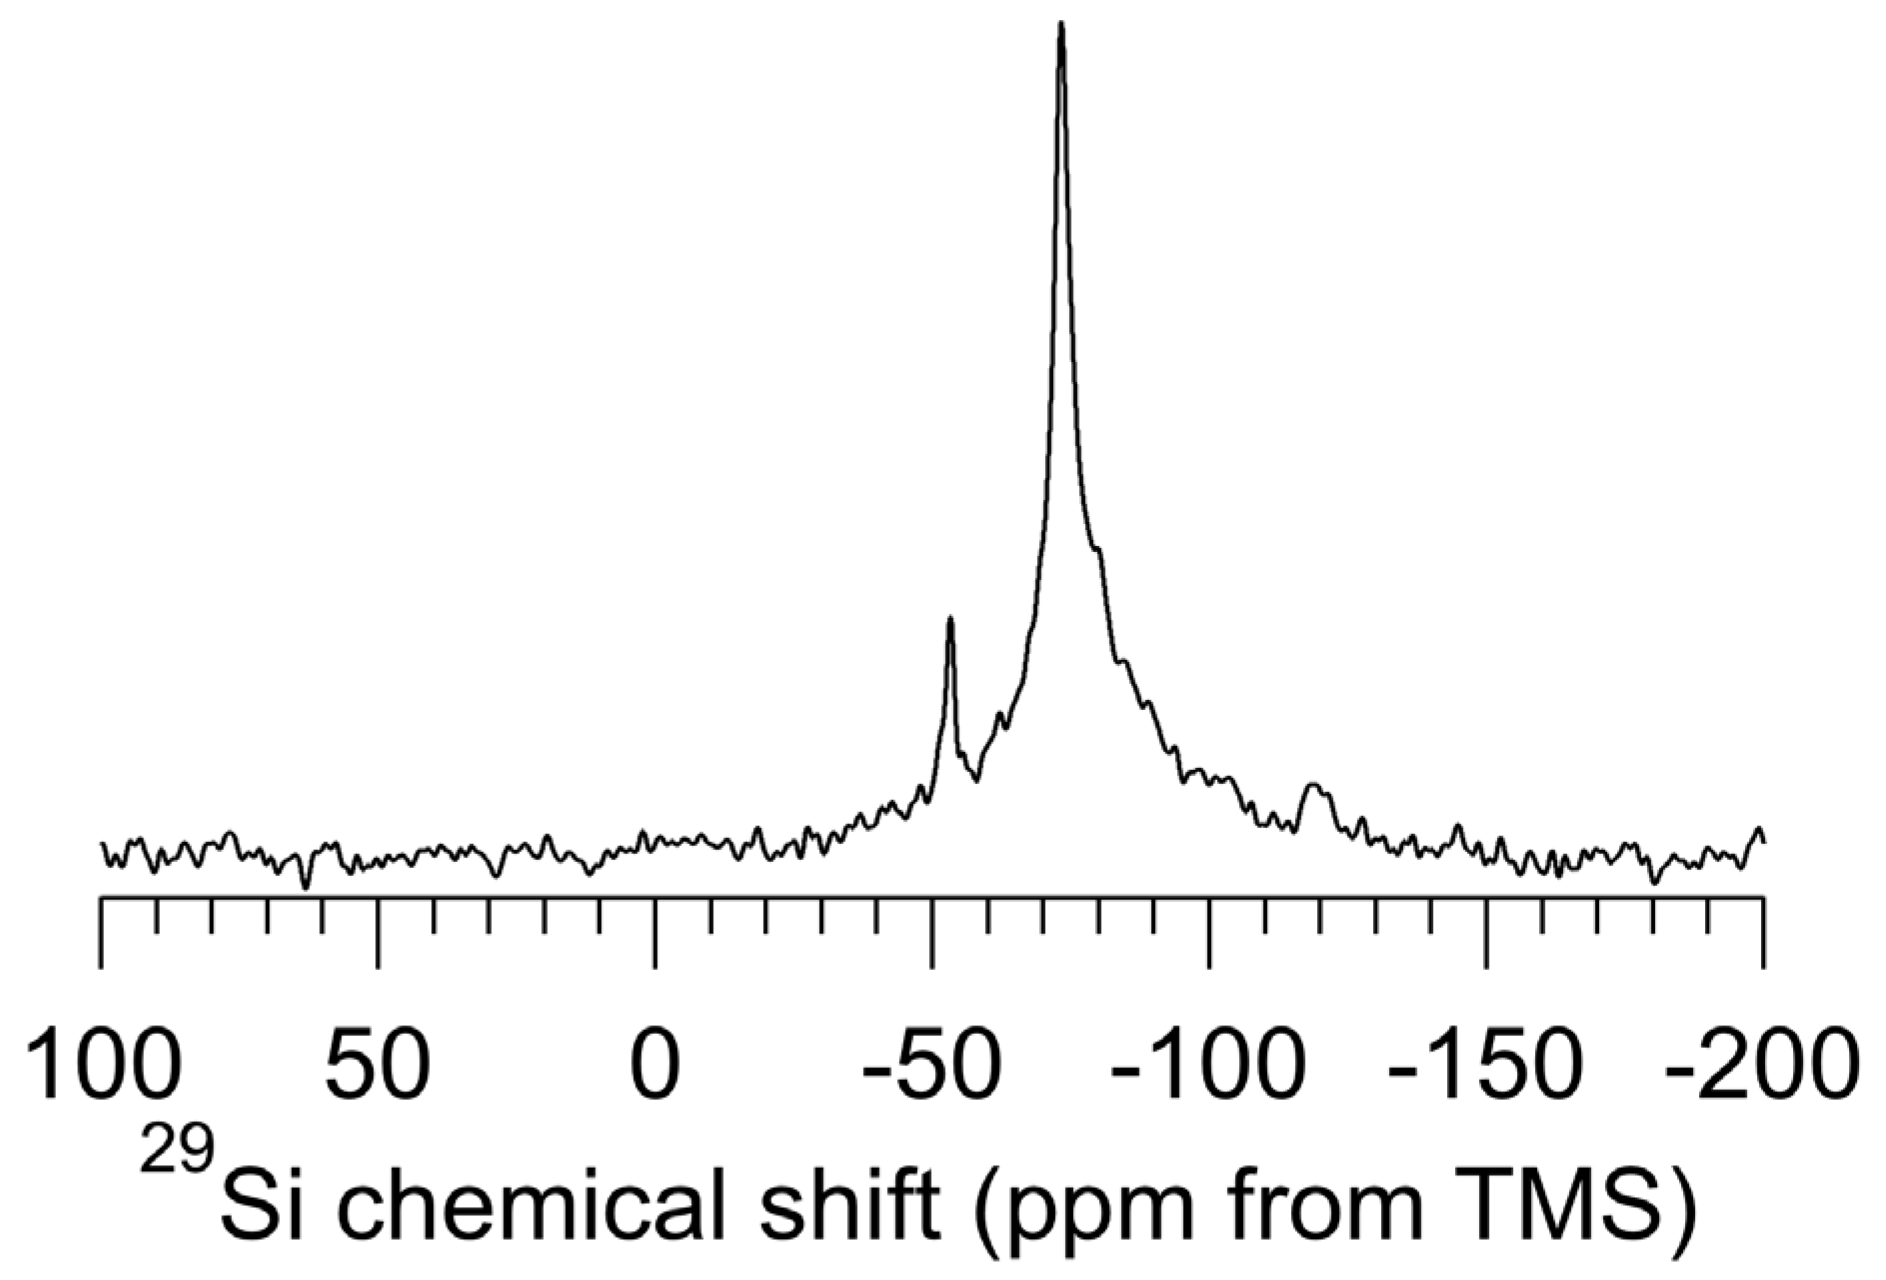
Figure 2 shows the
29Si DP–MAS NMR (no
1H decoupling) spectrum of as-received
np-Si evacuated at 150 °C. The chemical shift of the dominant signal is centered at −73 ppm, with a line width (full width at half maximum, FWHM) of 4.0 ppm (160 Hz), corresponding closely to the
29Si NMR characteristics of
c-Si [
18]. No signal corresponding to
a-Si (a very broad signal centered at −40 ppm) [
18] is seen in this spectrum.
The DP excitation used in obtaining this spectrum does not discriminate
per se between surface and buried silicon atoms. However, if there is a distribution of
29Si T
1 values and the recovery time used is shorter than three times the largest T
1 value, then there will be a measurable distortion in the simple relationship of signal intensity to site concentration. The
29Si T
1 of the sharp
c-Si-like signal (about −73 ppm) in
Figure 2 was estimated (by variation the magnetization recovery time) at 14 T to be on the order of 12,000 s (data not shown). This value is comparable to that reported for
c-Si [
18], where it is also reported that
29Si T
1 for
a-Si ranges from 3000 to 6000 s. Although it would be questionable to specify a lower bound with confidence, if there were a substantial amount of
a-Si present (e.g., 10 atom % of the silicon) in the
np-Si sample examined here, one would expect it to be revealed in this spectrum at about −35 ppm [
18].
Figure 2.
29Si (39.7 MHz) DP–MAS (5.6 kHz) NMR spectrum of np-Si treated with pentane, then evacuated at 150 °C. An excitation pulse of 30° and a recovery time of 30 s was used and 8000 transients were taken.
Figure 2.
29Si (39.7 MHz) DP–MAS (5.6 kHz) NMR spectrum of np-Si treated with pentane, then evacuated at 150 °C. An excitation pulse of 30° and a recovery time of 30 s was used and 8000 transients were taken.
In addition to the sharp peak at −73 ppm in
Figure 2, there is also a sharp peak at −52 ppm and a broader peak at −118 ppm (not as reliably detected as the other two peaks). The −73 ppm and −118 ppm peaks are much less intense in
Figure 2 than is the −73 ppm peak; however, the relative intensities are highly dependent on the recovery time (between pulses). At recovery times of a few seconds, the intensities of these three peaks are roughly comparable, but at very long recovery times, e.g., thousands of seconds, the −73 ppm peak is heavily dominant. The −52 ppm, −73 ppm and −118 ppm peaks appear to be largely unaffected by removal of
1H decoupling; hence, these peaks are due to silicon atoms that are
not directly bonded to hydrogen atoms. The peak at about −118 ppm is broader than the other two peaks and is not clearly apparent in all the spectra recorded.
The fact that the −52 ppm and −73 ppm peaks are sharp indicates that the corresponding silicon sites are due to geometrically homogeneous sets of structures. In the −73 ppm case, this is readily understood in terms of an assignment to c-Si-like silicon regions of the sample.
At recovery times on the order of about 30 s, one sees a broad component at the base of the −73 ppm peak. The breadth of this spectral feature indicates a substantial heterogeneity in chemical structures, probably very similar to the c-Si structure, but with small variations of the bond angles and lengths around the c-Si values of 109.4 degrees and 0.254 nm, respectively.
In comparing chemical shifts obtained in MAS experiments on solid samples with values reported on the same or similar materials in liquid samples (solutions), one should not be surprised by significant differences. These can result from a combination of sources, including small liquid vs. solid structural differences (bond lengths and angles), unaccounted non-nearest-neighbor substituent effects, differences in local and bulk magnetic susceptibility effects, solvent effects and variations in chemical shift referencing methods. For 29Si, these differences might be as large as a few ppm.
29Si CP–MAS Results. Figure 3 shows
29Si CP–MAS spectra of a set of samples based on
np-Si that has been treated in various ways. All of the spectra of
Figure 3, except that shown in
Figure 3A (1.0 ms CP contact time) were obtained in experiments with a CP contact time of 14 ms. The CP technique is based directly upon dipole-dipole interactions,
1H–
29Si interactions in the present case, and favors
29Si NMR signals of silicon atoms that are near hydrogen atoms. The CP–MAS experiments carried out with a long CP contact time (14 ms) may lessen (but do not eliminate) the spatial selectivity of the method.
The
29Si spectra of
Figure 2 and
Figure 3 are so different that, at first glance, they seem to belong to entirely different samples. The spectral differences occur because DP–MAS and CP–MAS are based on completely different mechanisms for generating the
29Si spin polarizations that are observed. While the DP–MAS
29Si spectrum (
Figure 2) relies on
29Si spin-lattice relaxation, which in turn is based on time-dependent spin interactions (e.g., the fluctuating fields generated by a small concentration of unpaired electrons), in
29Si CP–MAS experiments (
Figure 3) the
29Si spins derive spin polarization from nearby protons via static components of
1H–
29Si dipolar interactions. Then, in keeping with the popular view that elemental silicon particles are “capped” on the surface by –H and/or –OH moieties, the observed CP
vs. DP
29Si NMR differences can be understood substantially on the basis that the “crystalline core” of a
np-Si particle consists of crystalline-like silicon sites, most of which are spatially distant from any hydrogen atoms and hence unable to participate effectively in
1H– >
29Si CP. This “crystalline core” is surrounded by a hydrogen-containing, amorphous sheath in which the
29Si nuclei can participate more or less efficiently in
1H– >
29Si CP. One can envision two extreme cases of a material with a chemically homogeneous crystalline portion and a chemically inhomogeneous amorphous portion: (a) A series of distinct particles, each with a crystalline core surrounded by an amorphous (surface) mantle; or (b) a cluster of crystalline cores surrounded by an amorphous portion that connects the cores via some type of covalently bound amorphous network (the surface region)—like whole peanuts in chunky peanut butter.
Taking the typical
np-Si particle diameter of about 50 nm, if one makes the oversimplified assumption of a spherical particle shape, a simple calculation yields the result that about 6% of the idealized
np-Si particle is “at the surface”,
i.e., within about 0.5 nm of the outer edge of the particle. According to this interpretation, the DP–MAS
29Si spectrum of
Figure 2 is dominated by the silicon sites of the crystalline core of the particle, with the CP–MAS
29Si spectra of
Figure 3 representing the roughly 6% of the silicon sites that are “at the surface”.
There must, of course, be an interface region, presumably not more than a couple of silicon atoms in “thickness”, between the core (crystalline) region and the surface region. Our view of the interface region is one in which the silicon atoms are all covalently bonded to four other silicon atoms, therefore having local electronic distributions (and, hence, 29Si chemical shifts) that are very similar to the corresponding properties of crystalline silicon (i.e., close to −73 ppm), but close enough in physical proximity to the nearest hydrogen atoms to be able to participate marginally in 1H– > 29Si CP (requiring a long CP contact period). Presumably, the silicon atoms of the interface region will have local chemical structures of the types, (Si–)3Si–Si–H, (Si–)3Si–Si–OH, (Si–)3Si–Si–O–Si–H and (Si–)3Si–Si–O–Si–OH, where again it is to be understood that all silicon atoms represented by Si are actually four-coordinate.
Figure 3.
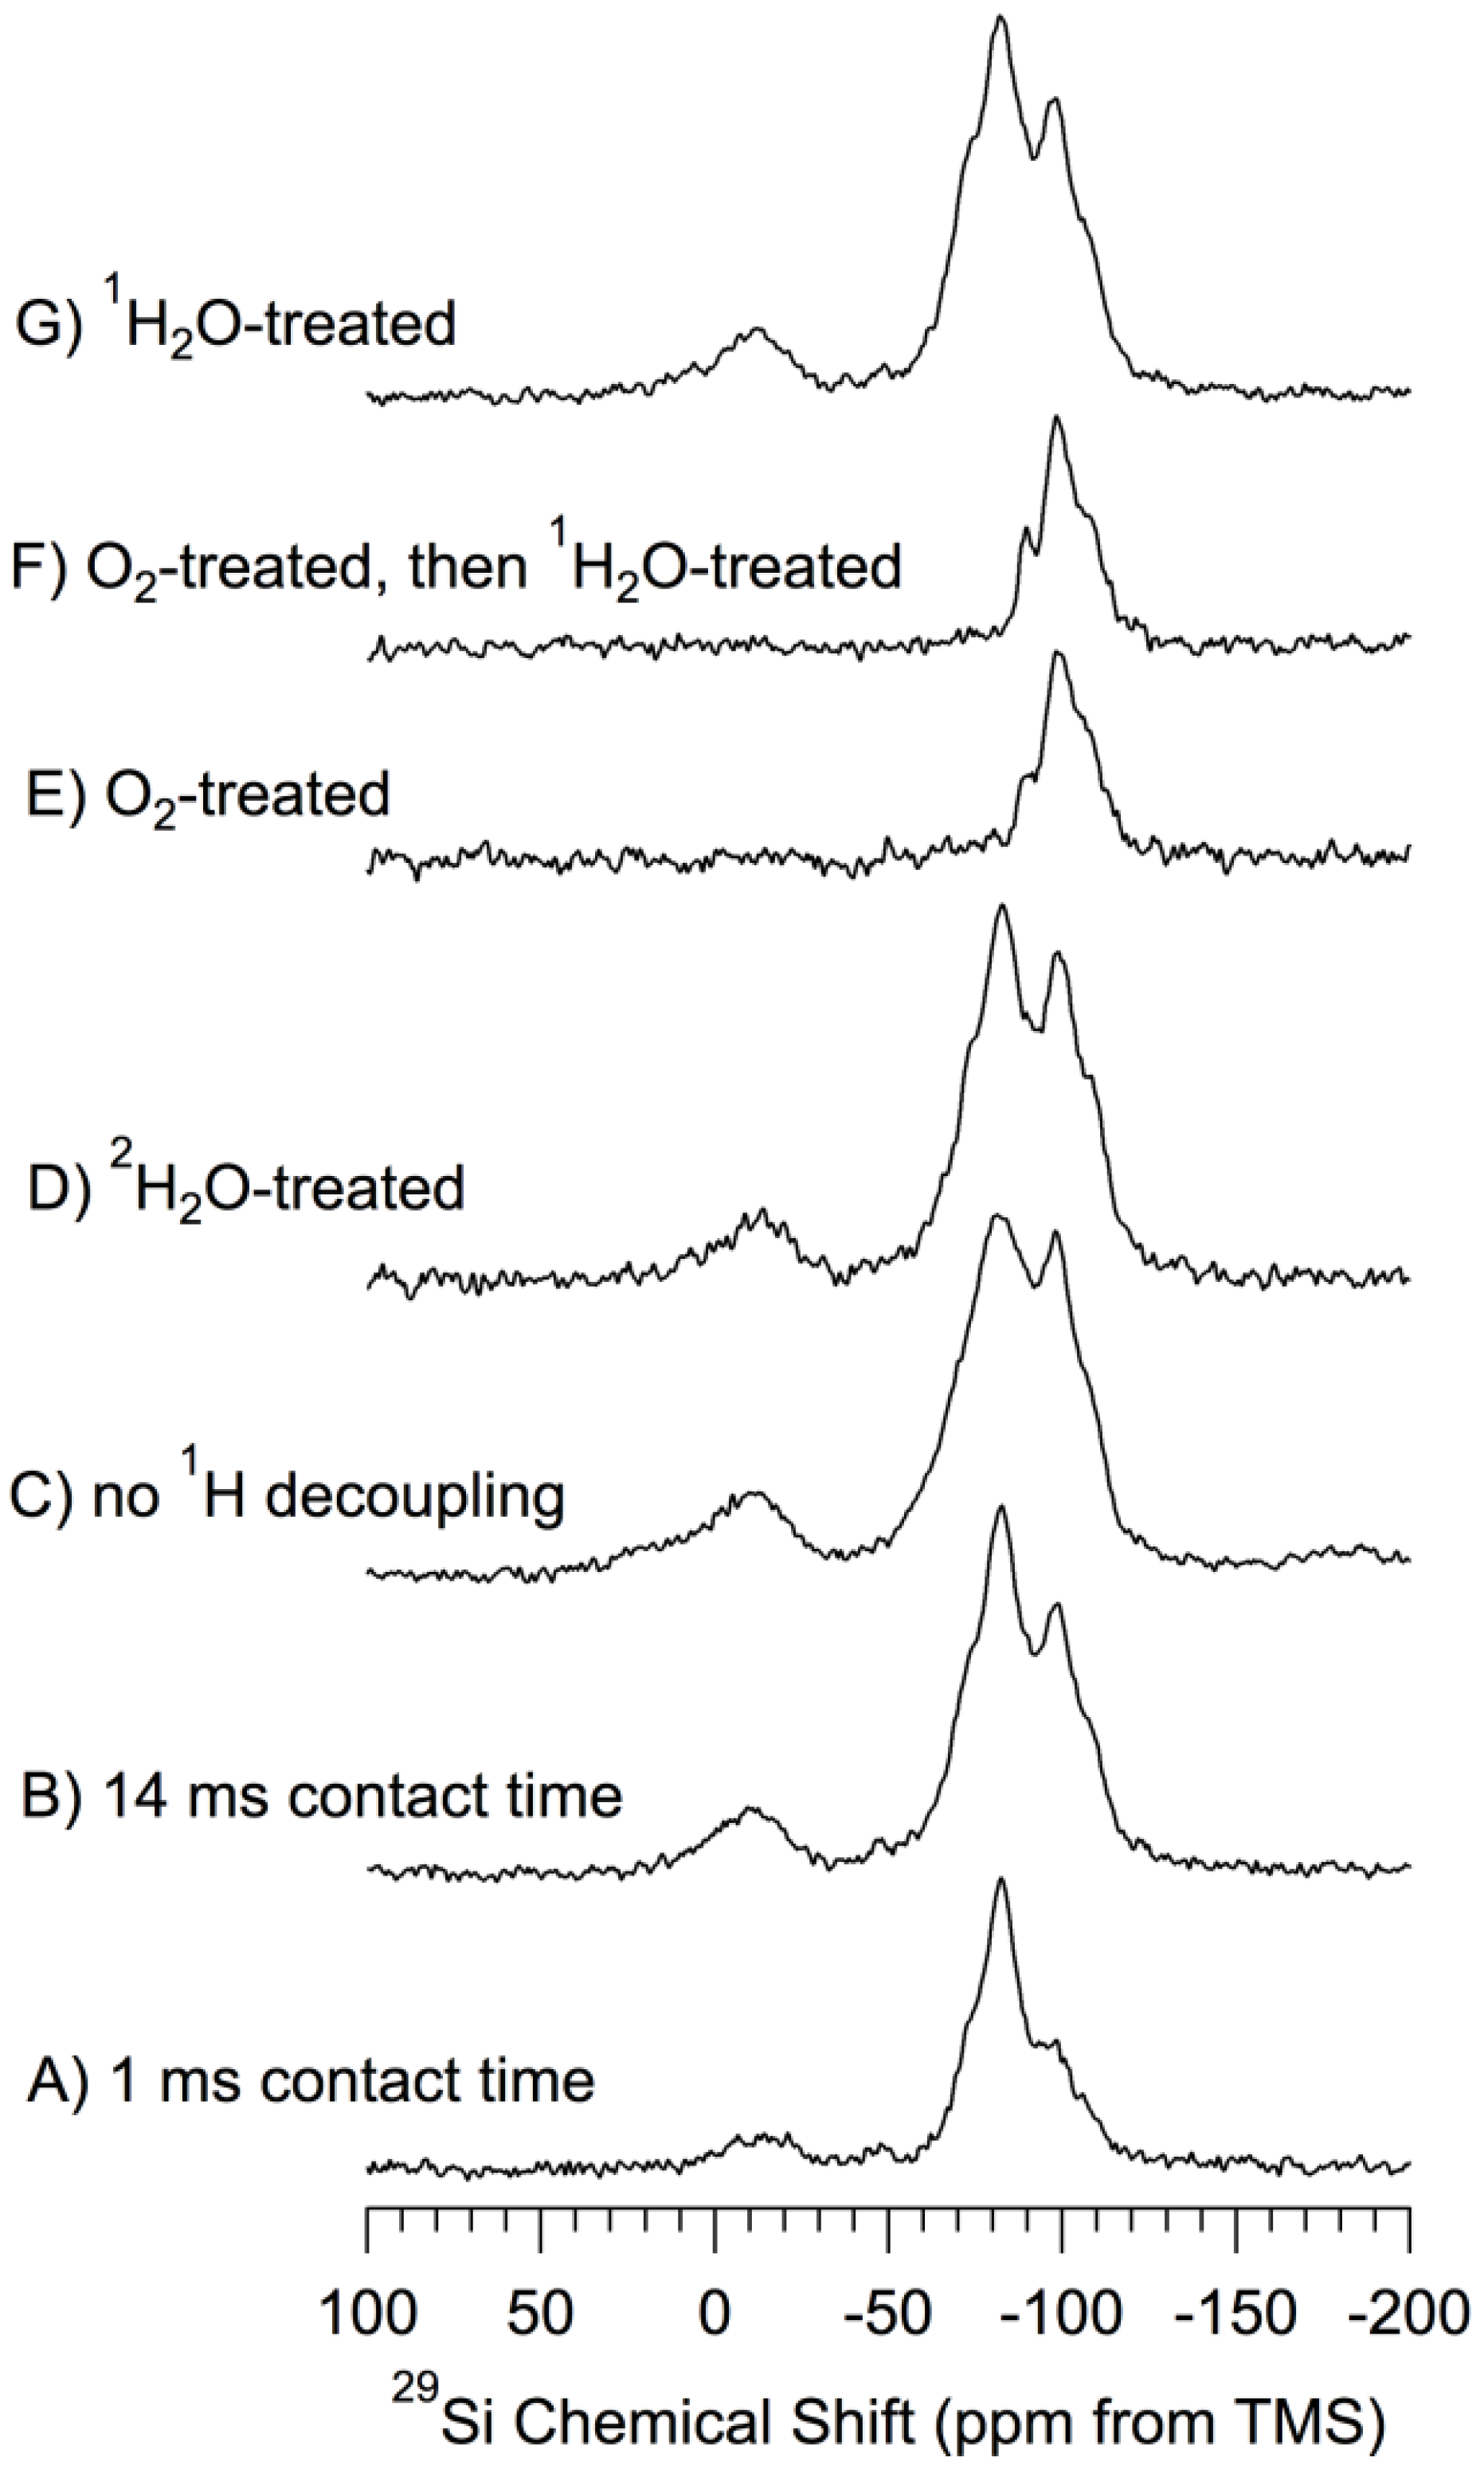
29Si (71.5 MHz) CP–MAS spectra of samples based on np-Si. 1H-decoupled, 7 kHz MAS and 14 ms CP contact time and evacuated at 150 °C, unless noted otherwise. (A) 1 ms contact time; (B) 14 ms contact time; (C) no 1H decoupling; (D) 2H2O-treated; (E) O2-treated (oxidized) at 500 °C; (F) O2-treated (oxidized) at 500 °C-then-1H2O-treated; (G) 1H2O-treated.
Figure 3.
29Si (71.5 MHz) CP–MAS spectra of samples based on np-Si. 1H-decoupled, 7 kHz MAS and 14 ms CP contact time and evacuated at 150 °C, unless noted otherwise. (A) 1 ms contact time; (B) 14 ms contact time; (C) no 1H decoupling; (D) 2H2O-treated; (E) O2-treated (oxidized) at 500 °C; (F) O2-treated (oxidized) at 500 °C-then-1H2O-treated; (G) 1H2O-treated.
For purposes of chemically-focused spectral interpretation, each of the spectra of
Figure 3 was simulated in terms of a set of peaks with line shapes that were either Gaussian (−14 ppm contribution) or Lorentzian (all other contibutions). For each of the spectra of
Figure 3, the use of a mixed (linear combination of Lorentzian and Gaussian) line shape for any of the contributions did not improve the match between the experimental and simulated spectra. Pictorial details of these simulations are given in the
Supporting Materials. Although the quality of the match between an experimental and a simulated spectrum, as represented by the weak intensity of the difference spectrum, is very good, one should, nevertheless, keep in mind the fact that, as is the case in such simulations of most functions with severely overlapping contributions (“peaks”), there is a substantial degree of arbitrariness in this kind of procedure, especially when signal-to-noise is limited, as it is in the present case. The relative intensities of the spectral contributions resulting from the simulations pictured in the
Supporting Materials are summarized in
Table 1 (line widths in
Supporting Materials). One should note that quantitatively significant intensity information, even in a relative sense, is not necessarily achieved from CP spectra obtained at just one CP contact time. For true quantitation a variable contact-time study is usually required. Hence the relative signal intensities reported in
Table 1 should be considered to be only
qualitative indications of relative populations.
One should also note that no
29Si NMR intensity in the crystalline silicon region around −73 ppm is included in the results summarized in
Table 1. However, as indicated above, there must be at least a small core-like contribution of the interface region in the CP–MAS results, especially those obtained at a CP contact time of 14 ms, a contribution that presumably is roughly comparable in intensity to that of the surface region. Accordingly, one can readily include a 4.0 ppm wide spectral contribution at about −73 ppm in the simulations, and still achieve an excellent fit with each experimental spectrum. However, it
is not necessary to include such a contribution to achieve a high-quality fit. The inclusion of this simulation contribution is accompanied by a substantial reduction in the contribution centered at about −83 ppm, typically amounting to 25%–50% of the −83 ppm intensity contribution.
Table 1.
Parameters Used in the Simulations of
29Si CP–MAS Spectra of
Figure 3 a.
Table 1.
Parameters Used in the Simulations of 29Si CP–MAS Spectra of Figure 3 a.
| | | Signal Intensity b | | |
|---|
| Sample c/29Si Chemical Shift (ppm) d | −14 | −74 | −83 | −89 | −99 | −109 | Total e |
| 1 ms CT (Figure 3A) | 73 | 74 | 250 | 57 | 92 | 24 | 540 |
| 14 ms CT (Figure 3B) | 170 | 170 | 270 | 85 | 240 | 65 | 1000 |
| 1H coupled (Figure 3C) | 150 | 160 | 390 f | 45 | 220 | 43 | 1004 |
| 2H2O treated (Figure 3D) | 150 | 155 | 375 | 30 | 320 | 100 | 1130 |
| 500 °C O2 (Figure 3E) | 0 | 0 | 0 | 20 | 180 | 80 | 280 |
| 500 °C O2, then 1H2O treated (Figure 3F) | 0 | 0 | 0 | 30 | 200 | 80 | 310 |
| 1H2O treated (Figure 3G) | 160 | 200 | 330 | 58 | 260 | 72 | 1080 |
1H MAS Results. 360 MHz
1H MAS experiments were carried out, using 15–17 kHz spinning, on a variety of samples based on
np-Si. The spectra are collected in
Figure 4 and
Figure 5. For the reasons given above for caution in comparing MAS-determined chemical shifts with literature values (especially for liquids), one might expect analogous differences here, perhaps up to about 1.0 ppm.
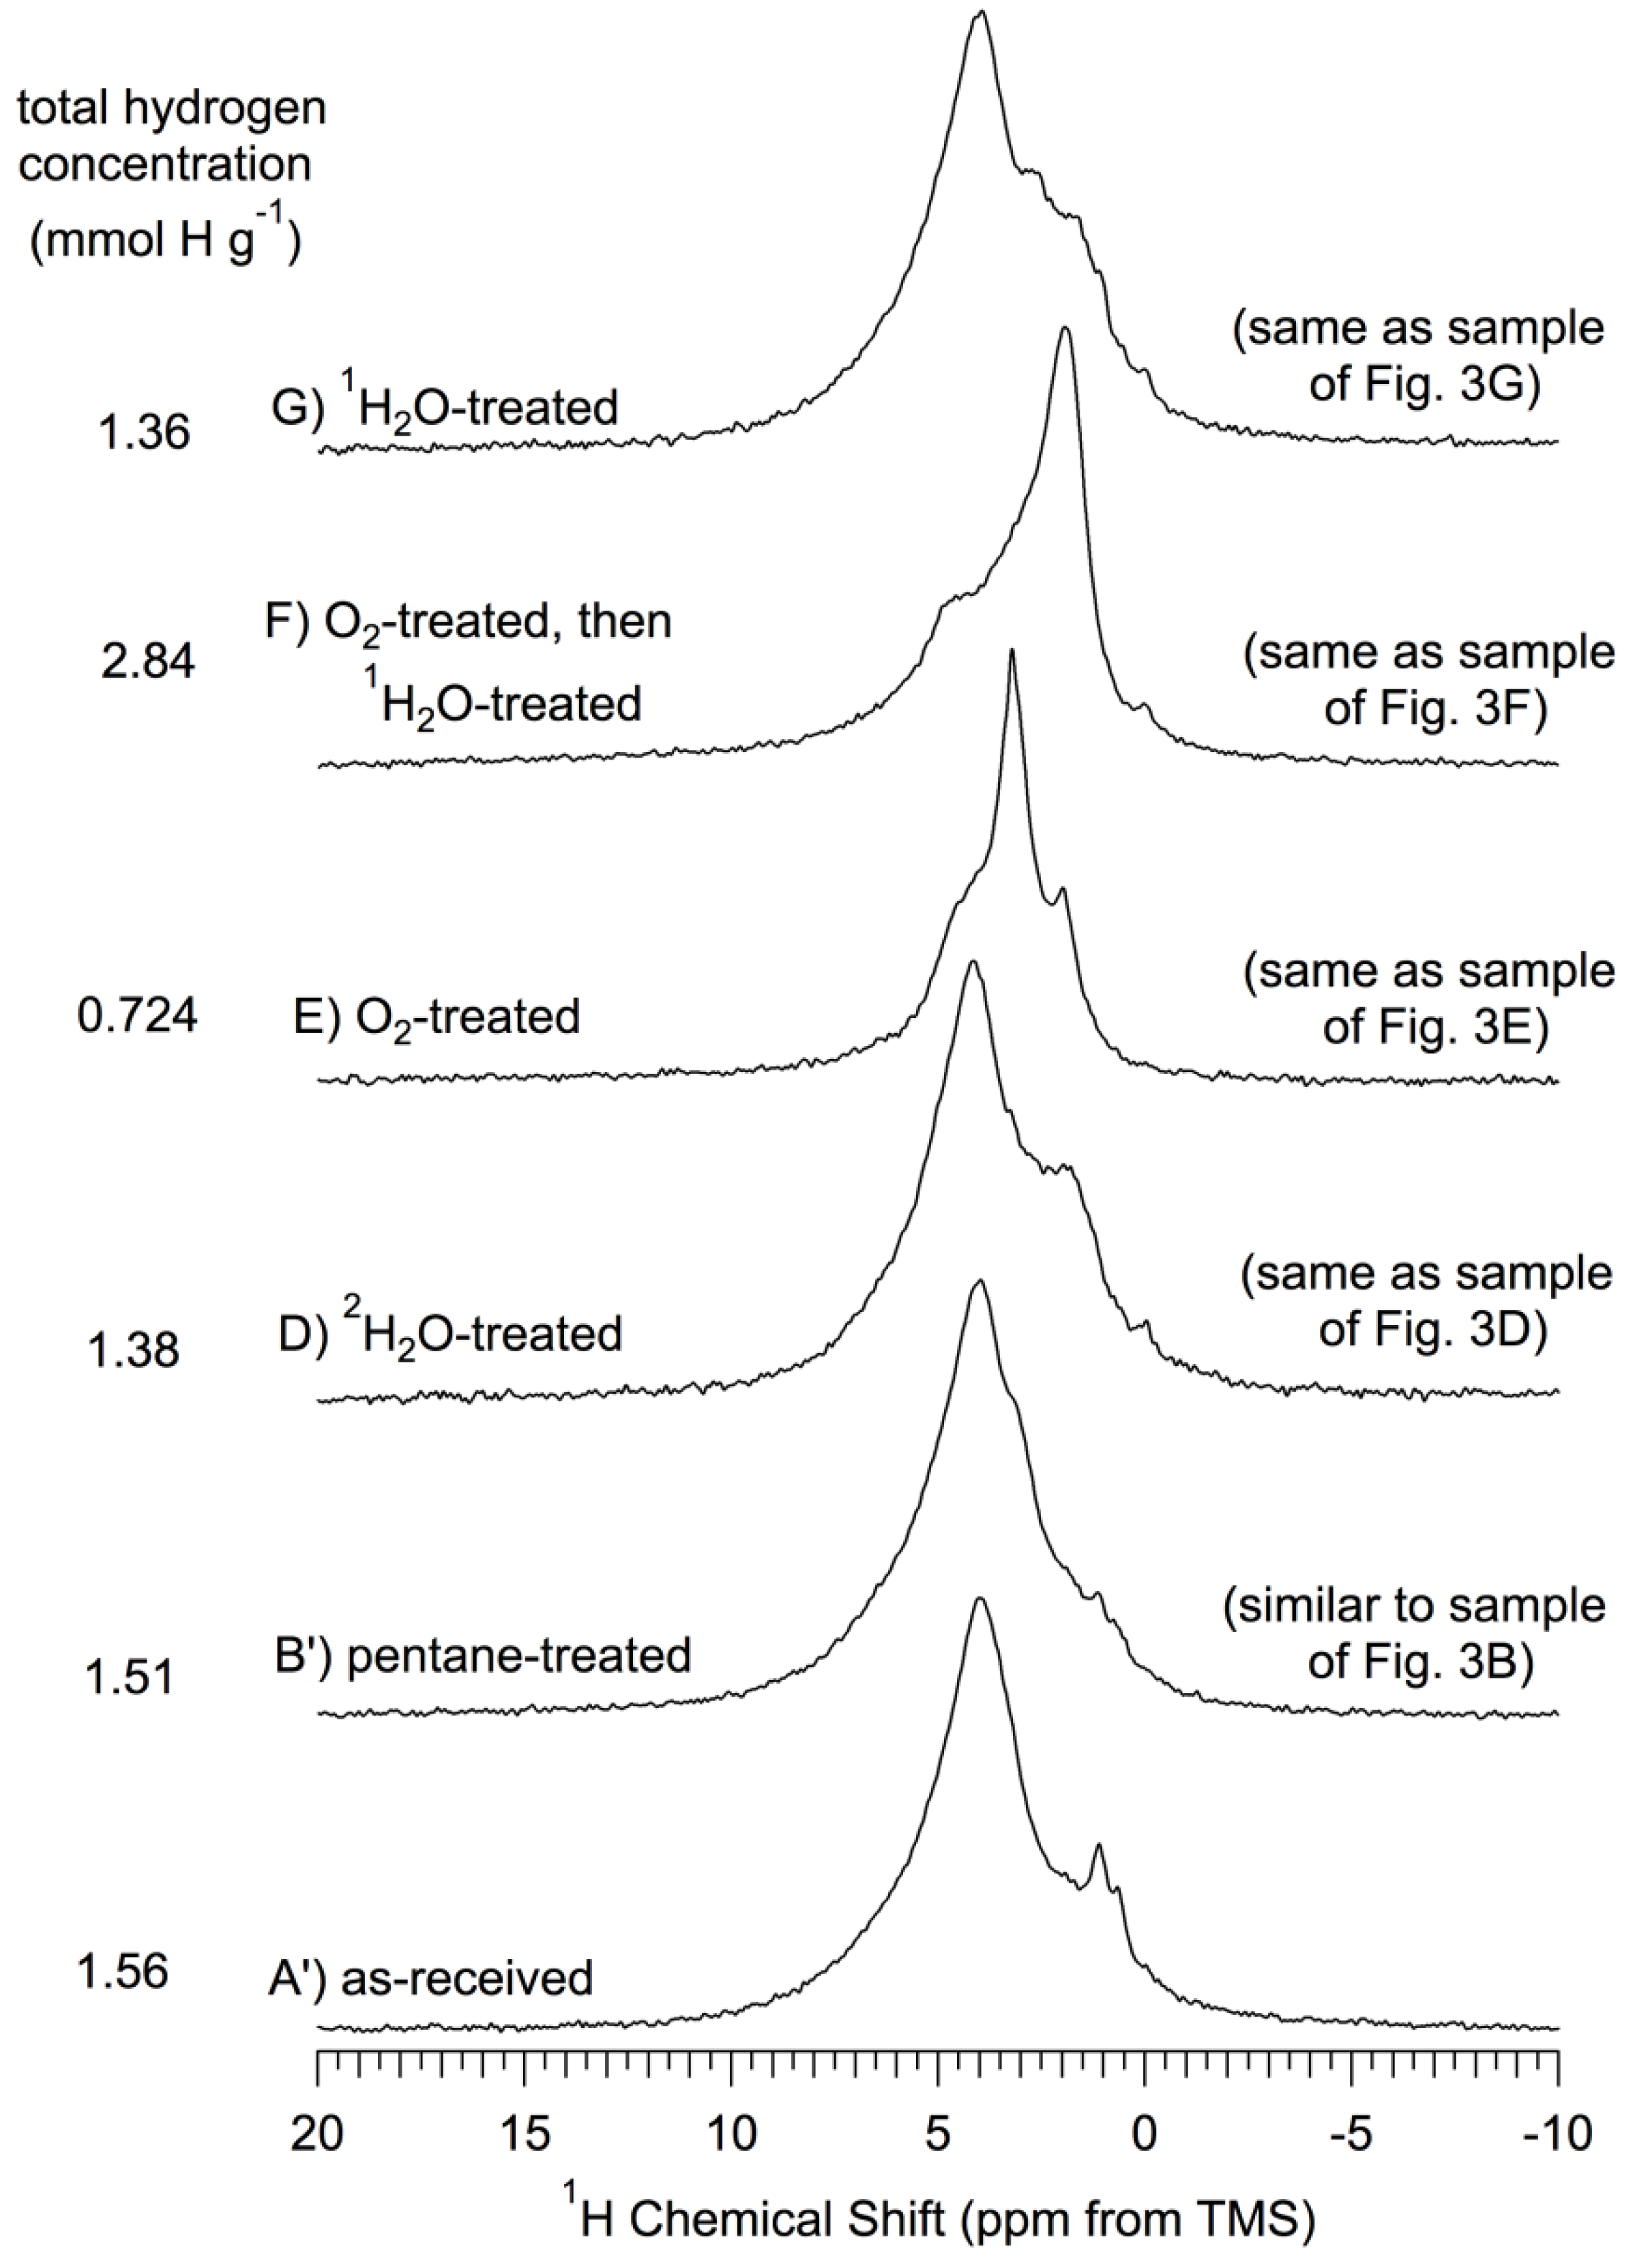
1H MAS spectra of samples that correspond to the
29Si spectra of
Figure 3 are shown in
Figure 4; these figures also show the total
1H content per gram for each sample, as described above.
Figure 4.
1H (360 MHz) MAS (15–17 kHz) NMR spectra of
np-Si and treated
np-Si samples. All samples were evacuated at 150 °C
in vacuo after the treatment described and prior to NMR spectrum collection, as described in the text. (
A’) As-received
np-Si; (
B’) Pentane-treated-then- evacuated at 150 °C (similar to the sample of
Figure 3B, which was
not pentane treated); (
D)
2H
2O-treated-then-evacuated at 150 °C (same as sample of
Figure 3D); (
E) O
2-treated (oxidized) at 500 °C, -then-evacuated at 500 °C (same as sample of
Figure 3E); (
F) O
2-treated (oxidized) at 500 °C-then-
1H
2O-treated-then-evacuated at 150 °C (same as sample of
Figure 3F); (
G)
1H
2O-treated-then- evacuated at 150 °C (same as sample of
Figure 3G). All spectra scaled so that the total area is proportional to the total hydrogen concentration for each sample.
Examination of the
1H MAS spectra in
Figure 4 reveals that there is
1H NMR intensity—as peaks, shoulders or “wings”—at chemical shifts spanning the range from about 7 ppm to about 0 ppm. These spectra and those of
Figure 5 were analyzed via deconvolution/simulation based on up to nine peaks or contributions; not all nine components are represented in any one spectrum.
Table 2 collects the results of these simulations, the details of which can be found in the
Supporting Materials.
Figure 5.
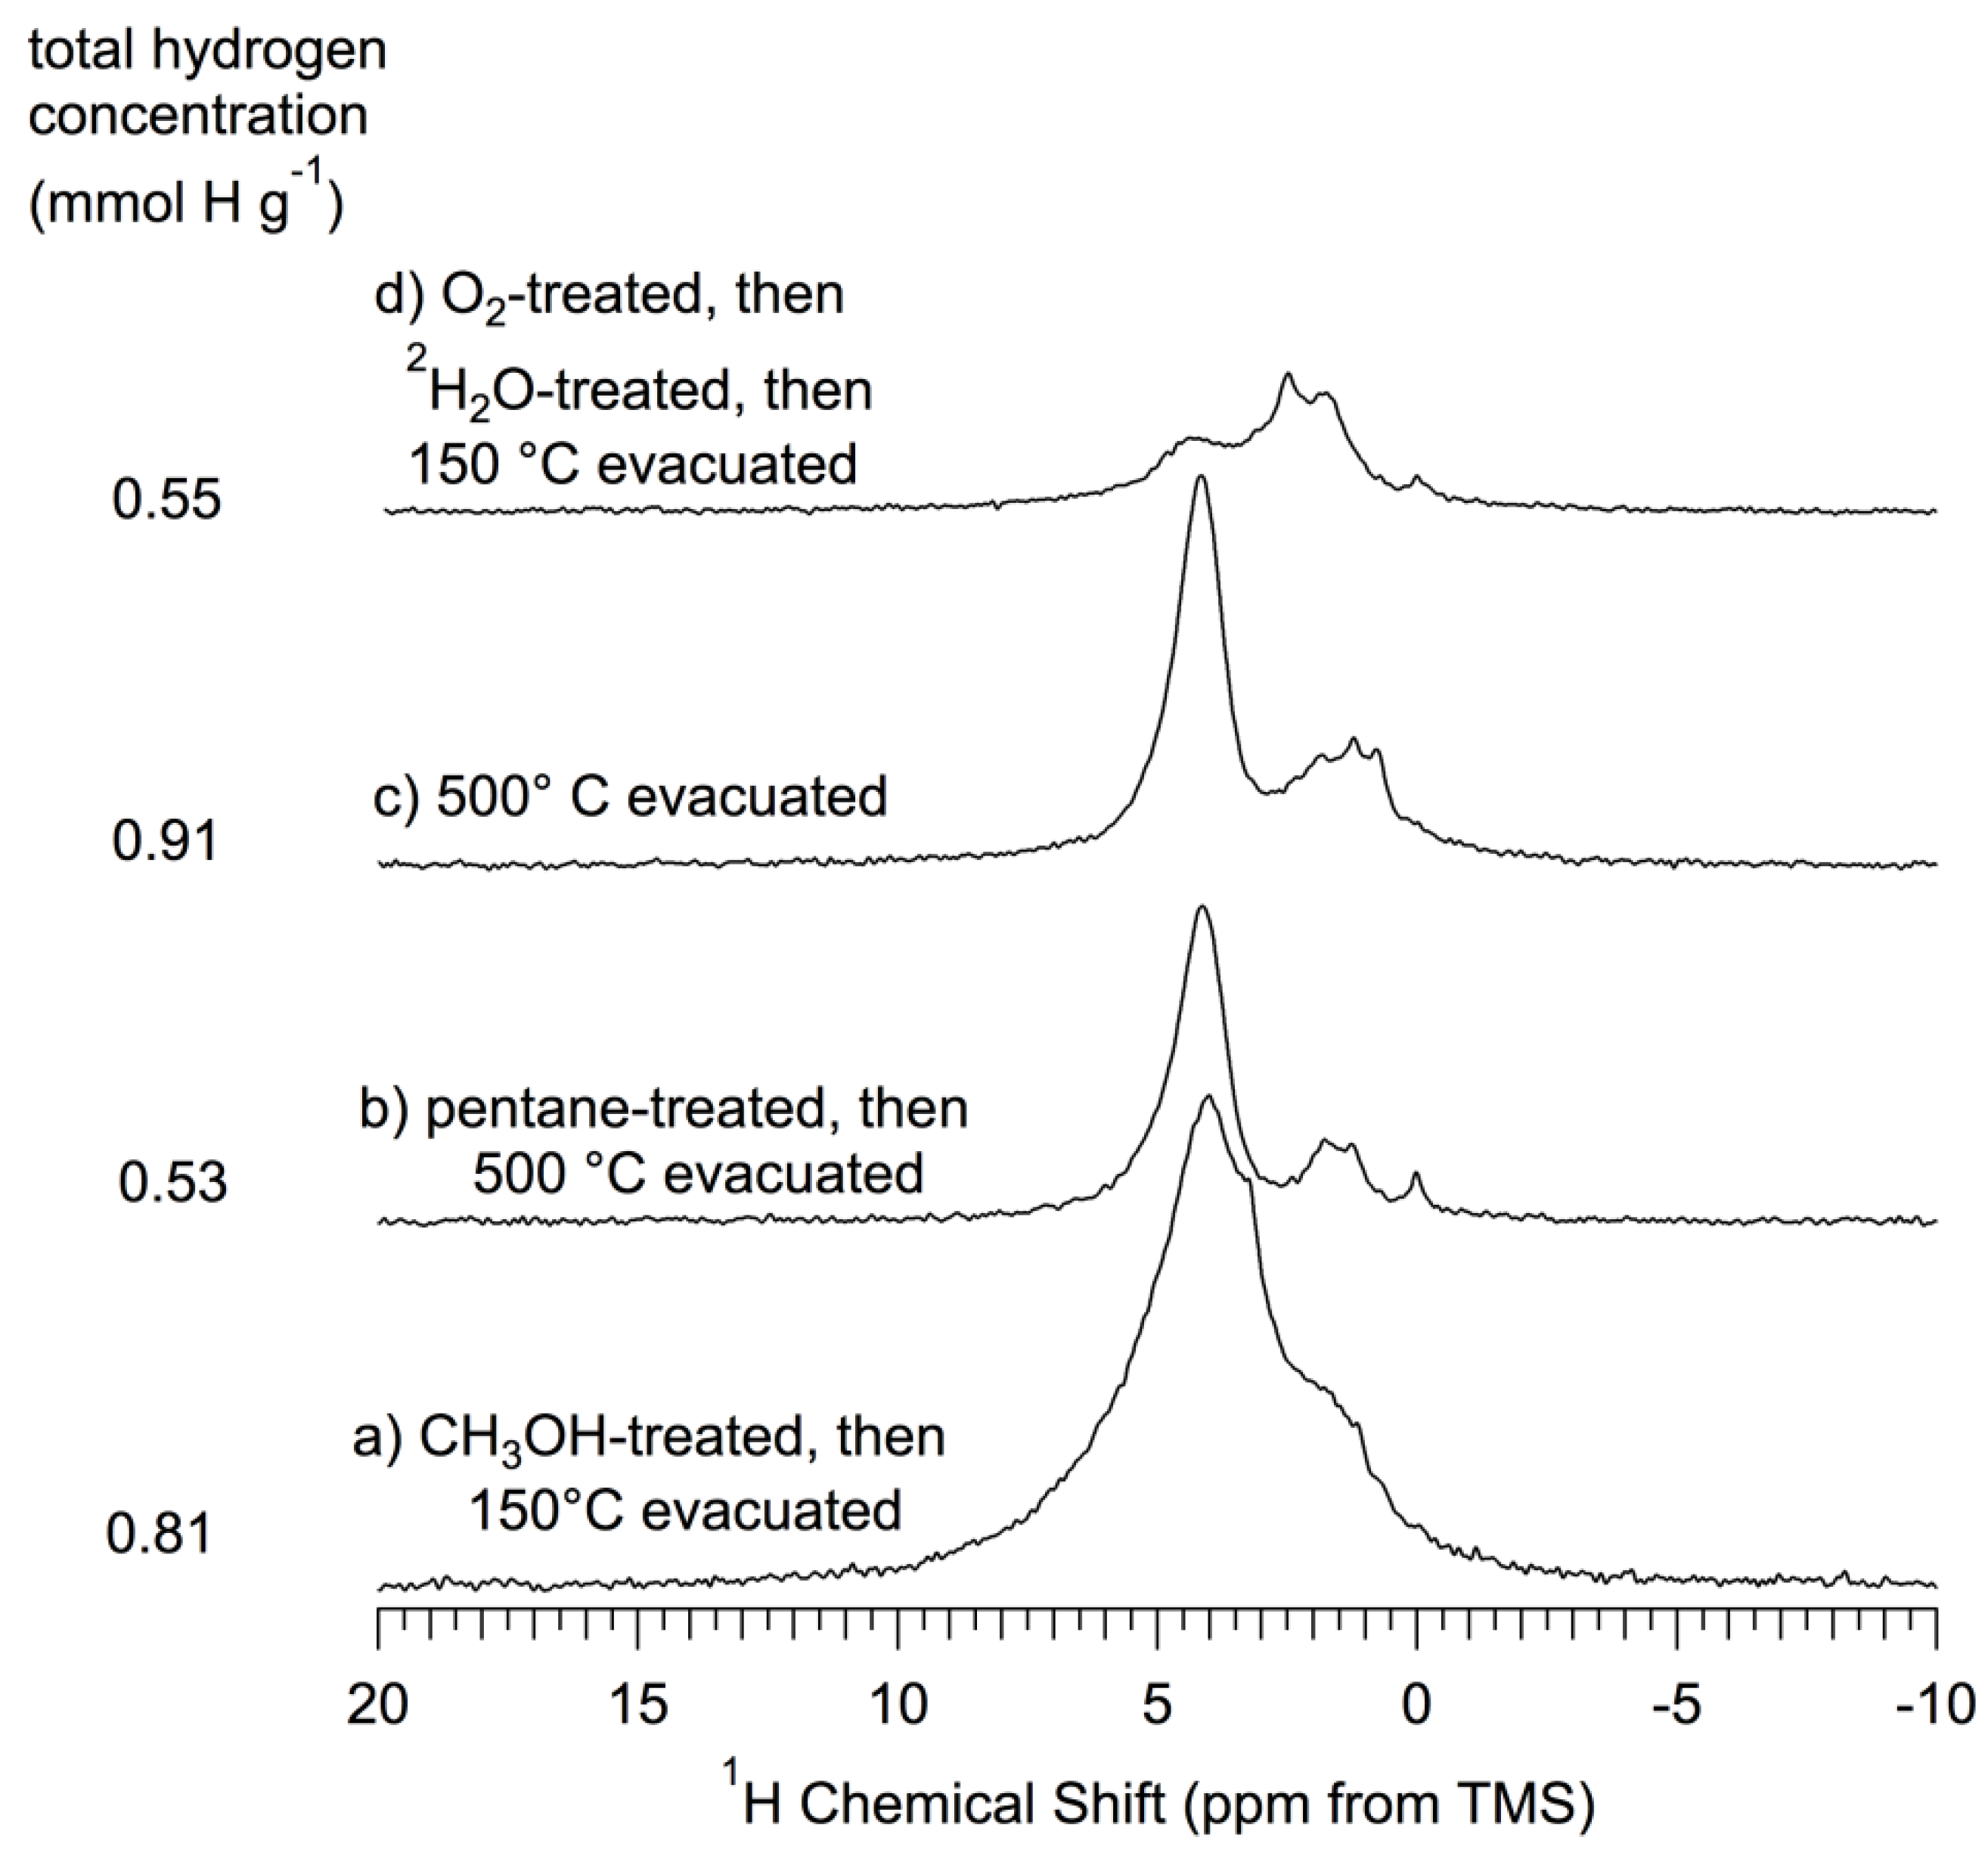
1H (360 MHz) MAS (15–17 kHz) NMR spectra of np-Si and treated np-Si samples. (a) CH3OH-treated; (b) Pentane-treated-then-evacuated at 500 °C; (c) Evacuated at 500 °C; (d) O2-treated (oxidized) at 500 °C-then-2H2O-treated-then-evacuated at 150 °C. All spectra scaled so that the total area is proportional to the total hydrogen concentration for each sample.
Figure 5.
1H (360 MHz) MAS (15–17 kHz) NMR spectra of np-Si and treated np-Si samples. (a) CH3OH-treated; (b) Pentane-treated-then-evacuated at 500 °C; (c) Evacuated at 500 °C; (d) O2-treated (oxidized) at 500 °C-then-2H2O-treated-then-evacuated at 150 °C. All spectra scaled so that the total area is proportional to the total hydrogen concentration for each sample.
Table 2.
Summary of the signal areas of the simulation/deconvolutions of
1H MAS spectra of
Figure 4 and
Figure 5.
Table 2.
Summary of the signal areas of the simulation/deconvolutions of 1H MAS spectra of Figure 4 and Figure 5.
| Signal Integrated Intensity a | |
|---|
| Sample b/1H Chemical Shift (ppm) c | 6.0 | 4.8 | 4.5 | 3.9 | 3.3 | 3.1 | 2.2 | 1.1 | 0.0 | Total d |
| CH3OH (Figure 5a) | 44 | 31 | 48 | 32 | 35 | 7.0 | 21 | 26 | 0.0 | 244 |
| oxidized, then 2H2O (Figure 5d) | 16 | 18 | 12 | 10 | 17 | 0.0 | 37 | 54 | 5.0 | 164 |
| oxidized, then 1H2O (Figure 4F) | 11 | 39 | 21 | 16 | 17 | 0.0 | 45 | 62 | 2.0 | 213 |
| 2H2O (Figure 4D) | 75 | 75 | 70 | 40 | 39 | 0.0 | 39 | 75 | 4.0 | 417 |
| 1H2O (Figure 4G) | 60 | 48 | 84 | 48 | 48 | 0.0 | 48 | 72 | 3.0 | 411 |
| pentane, then 500 °C evacuated (Figure 5b) | 13 | 19 | 86 | 11 | 0.0 | 0.0 | 0 | 26 | 7.0 | 162 |
| 500 °C evacuated (Figure 5c) | 13 | 17 | 122 | 0.0 | 0.0 | 0.0 | 9 | 103 | 13 | 277 |
| 500 °C oxidized (Figure 4E) | 23 | 19 | 15 | 23 | 89 | 0.0 | 15 | 31 | 2.0 | 217 |
| pentane, then 150 °C evacuated (Figure 4B’) | 93 | 46 | 110 | 76 | 56 | 0.0 | 32 | 41 | 0.0 | 454 |
| as-received (Figure 4A’) | 60 | 42 | 68 | 101 | 130 | 0.0 | 40 | 26 | 3.0 | 470 |
Assignments and Quantum Mechanical Calculations of 29Si Chemical Shifts. As an aid in identifying specific
29Si chemical shifts with specific structural moieties,
29Si chemical shift calculations were performed, using the GAUSSIAN program, on model clusters that represent possible local structures that may contribute to the overall surface structure of
np-Si. The results, which cover an experimental range of about 70 ppm, are summarized in
Table 3. As a prior calibration of the
29Si chemical shift calculations on model surface clusters,
29Si chemical shifts were calculated on several Si-containing molecules (molecules 1–8 in
Table 3) and compared with the values obtained experimentally. In the interest of saving computational time in the calculations on possible structural models for specific surface sites of
np-Si, the SiOSiH
3 moiety was used instead of SiOSi(–O–
Si)
3 to represent a
Si–O–
Si bridge between the silicon atom for which δ
29Si is calculated (represented in bold face) and another silicon atom in the structure. The relatively close agreement for model compounds 6, 7 and 8 in
Table 3 with experimental results on silica gel indicates that this is a reasonable approximation for this kind of structure.
Table 3.
Quantum chemically calculated and experimentally obtained 29Si chemical shifts a.
Table 3.
Quantum chemically calculated and experimentally obtained 29Si chemical shifts a.
| Molecule | □ 29Si (ppm) Experimental Calculated | | Molecule | 29Si(ppm) Calculated |
|---|
| 1 | SiH4 | −93 b | −91 | 11 | HSi(–SiH3)2–OSiH3 | −18 |
| 2 | H3Si–SiH3 | −103 c | −96 | 12 | (HO–)Si(–SiH3)3 | −14 |
| 3 | H2Si(–SiH3)2 | −115 c | −105 | 13 | (HO–)2Si(–SiH3)2 | −12 |
| 4 | HSi(–SiH3)3 | −136 c | −124 | 14 | H2Si(–OSiH3)2 | −44 |
| 5 | Si(–SiH3)4 | −165 c | −159 | 15 | H2Si(–SiH3)–OSiH3 | −37 |
| 6 | (HO–)2Si(–OSiH3)2 | −89 d | −86 | 16 | (HO–)Si(–SiH3)2–OSiH3 | −2 |
| 7 | HO–Si(–OSiH3)3 | −99 d | −93 | 17 | (HO–)Si(–SiH3)(–OSiH3)2 | −49 |
| 8 | Si(–OSiH3)4 | −109 d | −100 | 18 | (HO–)2Si(–SiH3)–OSiH3 | −37 |
| 9 | HSi(–OSiH3)3 | – | −77 | 19 | HO(H)Si(–SiH3)2 | −22 |
| 10 | HSi(–SiH3)(–OSiH3)2 | – | −14 | 20 | HO(H)Si(–SiH3)–OSiH3 | −24 |
| | | | 21 | HO(H)Si(–OSiH3)2 | −71 |
For the cases in which calculated results can be compared with reliable experimental data, it seems that the calculated 29Si chemical shifts are commonly more positive (lower shielding) by a few ppm than those obtained experimentally. From the results for compounds 1–9 in the table, a plot of δ29Si(calculated) vs. δ29Si(experimental) shows a very smooth correlation (not shown here).
Silicon-containing compounds that might represent the structures of sites on a
np-Si surface are included in
Table 3. The model cluster H–
Si(–OSiH
3)
3 (molecule 9) represents hydrogen-terminated silicon atoms bonded to three bridging oxygen atoms, H–
Si(–O
Si)
3; and the
29Si chemical shift for the model cluster is calculated to be −77 ppm. This chemical shift is close to the experimentally observed chemical shift of the contribution/signal at about -80 ppm, which is assigned below to some kind(s) of Si(–H)
n moiety, specifically −83 ppm for (
Si–O–)
3Si–H and −74 ppm for (
Si–
O–)
2Si(H)OH. The experimentally observed −74 ppm chemical shift is close to the result calculated for molecule 21 in the table (−71 ppm), providing support for this chemical shift assignment to the HO(H)
Si(–O–
Si)
2 structure (
vide infra).
Among the calculated results of
Table 3, only those for model molecules 10, 11, 12, 13, 16, 19 and 20 are within 20 ppm of −14 ppm, the position of the broad, low-intensity signal in
Figure 3. Of these seven model molecules in
Table 3, numbers 10, 11, 19 and 20 are tentatively ruled out because they contain
Si–H bonds, which is shown below to be an unlikely assignment. This leaves, as possible assignments, the structures, HO–
Si(–
Si)
3, (HO–)
2Si(–
Si)
2 and HO–
Si(–
Si)
2(–O–
Si), which are modeled in
Table 3 by model molecules 12, 13 and 16, respectively; these three structural possibilities are all covered by the formula, (HO)
nSi(–
Si)
m(–O
Si)
4−n−m, which is taken as the structural assignment for the −14 ppm signal. The breadth of the −14 ppm peak may indicate that more than one of these structures contributes to this signal.
Table 4 summarizes the
29Si chemical shift assignments that are employed in this paper. Some of these assignments are taken from a critical examination of the literature and are supported by this study.
Table 4.
29Si chemical shift assignments of this study a.
Table 4.
29Si chemical shift assignments of this study a.
| δ 29Si (ppm) | Molecule | δ 29Si (ppm) | Molecule |
|---|
| −14 | (HO)nSi(–Si)m(–OSi)4−n−m | −89 | (Si–O–)2Si(–OH)2e,f |
| −74 | (Si–O–)2Si(H)OH b,c | −99 | (Si–O–)3SiOH e,f |
| −73 | Si(–Si)4 crystal d + interface | −109 | (Si–O–)4Si e,f |
| −83 | (Si–O–)3Si–H b,c | – | – |
3.3. Chemical Interpretations
“Untreated” np-Si samples. Figure 3B shows the proton-decoupled
29Si CP–MAS NMR spectrum of
np-Si evacuated at 150 °C. The simulated spectrum of
Figure 3B (
Supporting Materials) consists of six heavily overlapping signals, each with a unique chemical shift, whose spectral characteristics are summarized in
Table 1. The signal at −14 ppm, in addition to differing from the other contributions in line shape, also differs from the rest in the spectrum simulation of
Figure 3B in having a significantly larger line width of 28 ppm, compared with 9 to 12 ppm for the others. This suggests that the −14 ppm signal (signal/contribution) likely represents more than one site structure on the surface. This −14 ppm signal appears in all of the spectra of
Figure 3 for samples that have
not been subjected to the oxidative treatment with O
2 at 500 °C. No spinning sidebands are observed for any signal. It is worth noting that −74 ppm and −83 ppm are very close to the −73 ppm and −83 ppm values that have been reported for (
Si–O–)
2Si(H)OH and (
Si–O–)
3Si–H structures, respectively, from data on solid and/or liquid samples of (R–O–)
3Si–H or its polysiloxane polymers and/or modified silicas [
41,
42]. Here the symbol,
Si, stands for silicon atoms that are bonded or bridged to the silicon atom,
Si, on whose chemical shift we are focused, and it is understood that
Si has additional bonds that are not shown in the formula.
In examining the 29Si CP–MAS results and attempting to assign specific spectral regions to specific local surface structures, an important strategy is to establish which spectral regions are identified with silicon atoms that have directly attached (bonded) hydrogen atoms, i.e., with Si–H bonds. In solid-state 29Si NMR, one is drawn to experimental approaches that depend predictably on the strengths of 1H–29Si dipole-dipole interactions. One such approach is to examine the effect of changing the CP contact time (CT), since the rate of 1H– > 29Si CP transfer of polarization depends strongly on the strength of pertinent 1H–29Si dipolar interactions, which in turn are inversely proportional to the cube of the 1H–29Si internuclear distance.
Comparison of the spectra of
Figure 3A,B, which come from spectra obtained with 1 ms and 14 ms, respectively, provides an opportunity to assess
qualitatively the CP dynamics. Of course, to characterize the CP dynamics
quantitatively, one would need a more extensive study of the relevant spin dynamics (most commonly, a variable-contact-time study). To the extent that the 14 ms spectra represent, at least qualitatively, the relative site populations of the surface region (and interface region), the integrated intensities shown in
Table 1 indicate that the surface populations, identified in terms of
29Si chemical shift, fall in the order: −83 ppm > −99 ppm > −14 ppm ≈ −74 ppm > −89 ppm > −109 ppm. As expected, in the comparison highlighted here, seen both in the spectra and in the corresponding parameters in
Table 1 that were derived from them, the overall integrated spectral intensity of the spectrum measured with CT = 14 ms (
Figure 3B) is substantially larger than for the spectrum obtained with CT = 1 ms (
Figure 3A). This intensity difference is very strong for the spectral contributions at around −14 ppm, −89 ppm, −99 ppm and −109 ppm, and not so large for the contribution at −83 ppm. This pattern seems reasonable if one assumes that the −83 ppm contribution comes from Si–H sites, for which CP transfer will be well developed already at 1 ms of CP contact, and will have less to gain from a CT increase to 14 ms than will CP intensity at silicon atoms with no directly bonded hydrogen. The CP responsible for those spectral contributions, at −14 ppm, −89 ppm, −99 ppm and −109 ppm, benefit more markedly from the longer CP CT; therefore, the corresponding silicon sites center on silicon atoms with no directly-bonded hydrogens. The −74 ppm spectral contribution, for reasons not yet understood, also shows a strong response to increasing CT. The ratio of integrated spectral intensities obtained with CT values of 1 ms and 14 ms, also given in
Table 1, are consistent for the spectral contributions at −89 ppm, −99 ppm and −109 ppm with results published on fumed silica [
44] and silica gel [
45], derived from variable-contact-time data for silica peaks identified as (
Si–O–)
2Si(OH)
2, (
Si–O–)
3SiOH and (
Si–O–)
4Si contributions, respectively.
Figure 3C shows the
29Si CP–MAS NMR (not
1H decoupled) spectrum of pentane-treated
np-Si evacuated at 150 °C. The spectrum was recorded
without proton decoupling. Even without proton decoupling, the
29Si–
1H dipolar coupling will be largely averaged by 7 kHz MAS, but the
29Si–
1H J coupling will still be operative, as confirmed by simulations carried out with the Simpson program [
46]. Comparing the spectra of
Figure 3B,C, and the corresponding parameters in
Table 1, one sees that the line widths of the spectral contributions at about −74 ppm and −83 ppm have roughly doubled when the proton decoupler was turned off, while the line widths of the −14 ppm, −89 ppm, −99 ppm and −109 ppm spectral contributions are almost unchanged. The large increases in line widths observed are likely due to a combination of residual dipolar broadening and unresolved
29Si–
1H J coupling in silicon sites with directly-bonded hydrogens. J
Si–H in silatrane, N(CH
2CH
2O)
3Si–H, is reported to be 270 Hz [
47]. These patterns are consistent with the following tentative assignments: −14 ppm, no directly-bonded hydrogens (at least for the main structural constituent contributing to this spectral region); −74 ppm, (
Si–O–)
2Si(H)OH (substantial uncertainty associated with the CT dependence described above); −73 ppm, interface sites; −83 ppm, (
Si–O–)
3Si–H; −89 ppm, (
Si–O–)
2Si(OH)
2; −99 ppm, (
Si–O–)
3Si–OH; −109 ppm, (
Si–O–)
4Si.
Another dipole-based technique that is used routinely in
13C MAS NMR to establish C, H proximity (assuming rapid MAS or atomic-level motions do not largely average the relevant dipole-dipole interactions), is the interrupted decoupling or
dipolar dephasing technique [
48]. In this technique a period, often about 40 µs, is inserted between the end of the period generating
13C magnetization from CP and the beginning of proton-decoupled
13C detection. During this “interrupt” period,
13C magnetization of carbons that are strongly impacted by dipolar interaction(s) with one or more protons (e.g., directly-bound
13C–
1H in relatively rigid structures) is rapidly dephased and strongly attenuated in the observed
13C spectrum.
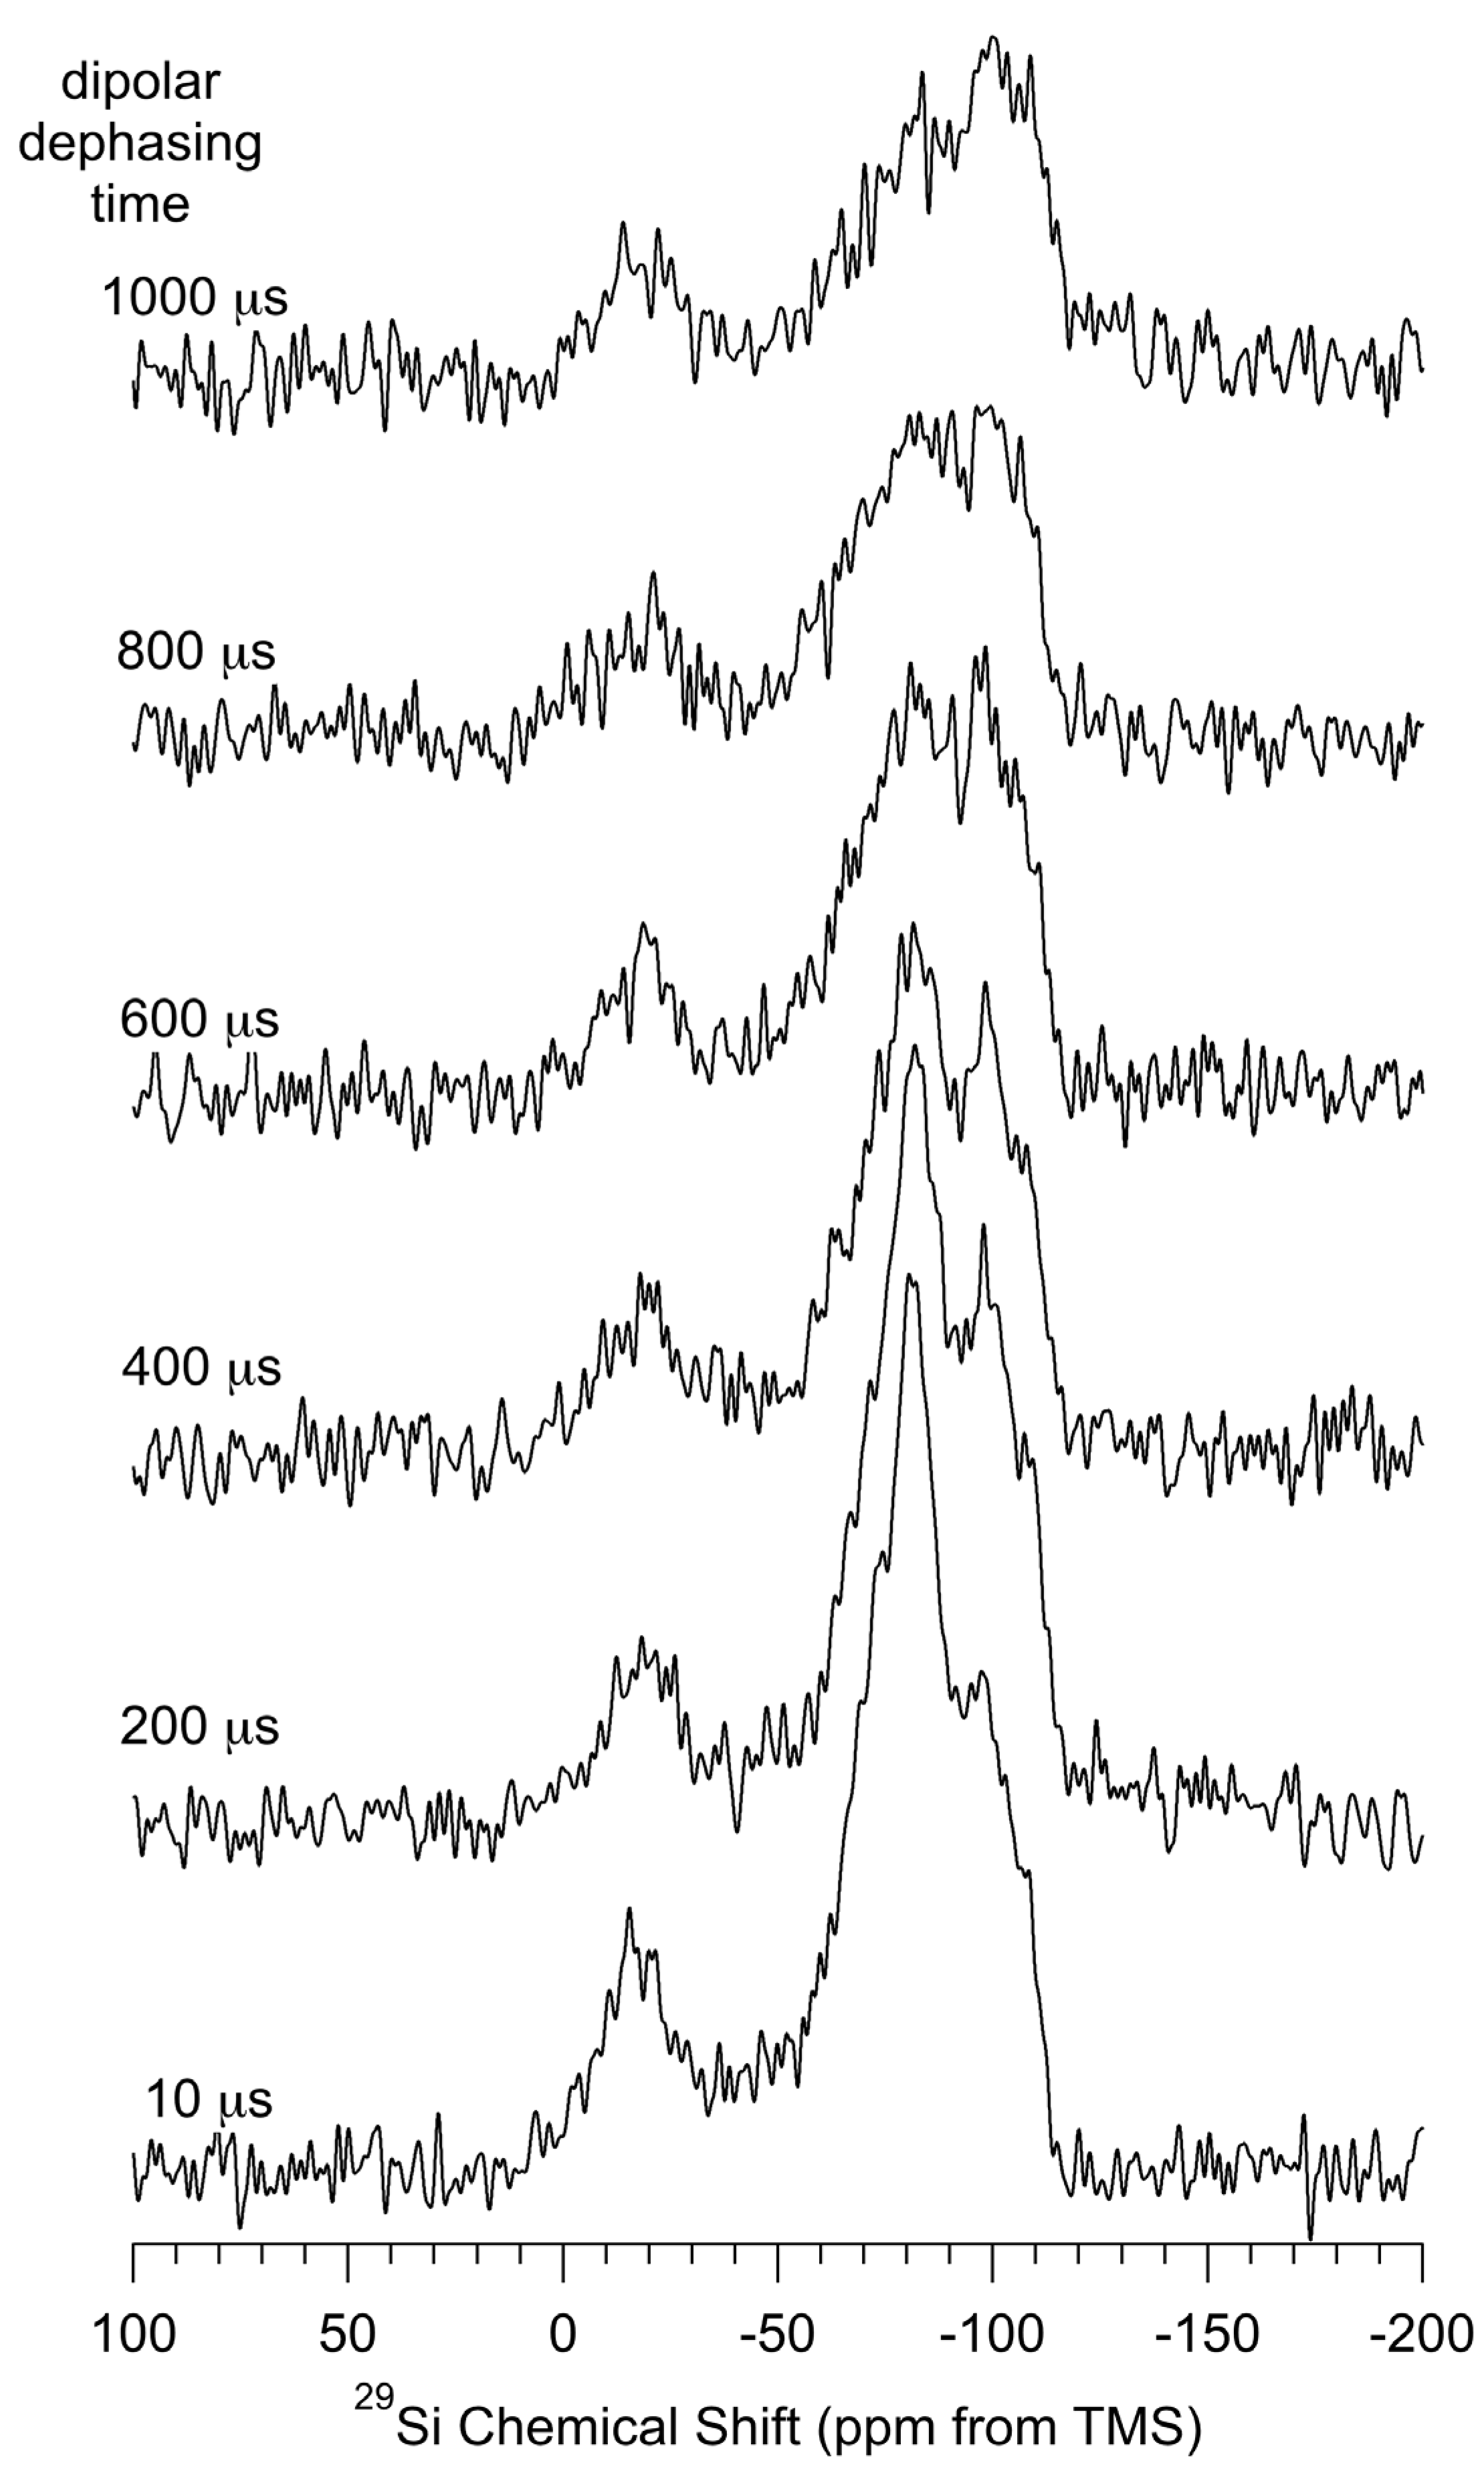
Figure 6 shows the result of applying the dipolar-dephasing technique to the CP–MAS
29Si spectrum of
np-Si evacuated at 150 °C. From the spectra shown for various durations of the dephasing period, one sees that magnetization of the region around −80 ppm (including both the −74 ppm and −83 ppm spectral contributions) dephases much more rapidly than for other regions of the spectrum, indicating that the
29Si resonance(s) giving rise to spectral intensity in that region are due to silicon sites that are in closest proximity to H, e.g., Si(–H)
n sites.
The integrated intensities of each contribution in the deconvolutions of the spectra in
Figure 6 (details in the
Supporting Materials) for each dephasing period (interrupt period) were analyzed in terms of a single decaying exponential function (almost certainly an oversimplification); this analysis yielded the following time constants describing the decays of the various
29Si CP–MAS spectral contributions: −14 ppm, 1.8 ms; −74 ppm, 1.0 ms; −83 ppm, 0.60 ms; −89 ppm, 1.0 ms; −99 ppm, 3.5 ms; −109 ppm, 5.0 ms. The dipolar-dephasing time constants for the −89 ppm and −99 ppm contributions are in reasonable agreement with published values for the (
Si–O–)
2Si(–OH)
2 and (
Si–O–)
3Si–OH signals, respectively, derived from dipolar-dephasing experiments on fumed silica [
44] and are in the same order (albeit with much smaller values) as are dipolar-dephasing constants derived from silica gel data [
45].
The six dipolar-dephasing time constants given above are qualitatively consistent with what one would expect in terms of the chemical shift assignments suggested above and in interpretations below, and summarized in
Table 4,
i.e., (HO–)
nSi(–
Si)
m(–O–
Si)
4−m−n for −14 ppm, (
Si–O–)
2Si(H)OH for −74 ppm, interface sites for −73 ppm, (
Si–O–)
3Si–H for −83 ppm, (
Si–O–)
2Si(–OH)
2 for −89 ppm, (
Si–O–)
3Si–OH for −99 ppm and (
Si–O–)
4Si for −109 ppm. The last three structures correspond to silica-like surface sites.
The
1H MAS spectra of as-received
np-Si (
Figure 4A’) and
np-Si that has been treated with pentane-then-evacuated at 150 °C (
Figure 4B’) consist of a broad peak centered at about 4 ppm, with some intensity in the regions around 3.3 ppm, 2.2 ppm, 1.1 ppm and 0.7 ppm; the overall (spectrum-wide) intensities for the two samples are essentially the same. Such patterns (aside from the small features at 0.7 ppm, which are not included in the simulations from which
Table 2 was generated) are represented by substantial numbers for several contributions in the deconvolution results given in
Table 2. The samples evacuated at 500 °C (
Figure 5b,c) show a sharpening of the main pattern that includes a maximum at about 4.3 ppm and a more sharply defined intensity pattern in the 0 to 2 ppm range.
Figure 6.
Dipolar-dephasing 29Si (71.5 MHz) CP–MAS (5.0 kHz) spectra of np-Si for various dipolar-dephasing periods, as indicated.
Figure 6.
Dipolar-dephasing 29Si (71.5 MHz) CP–MAS (5.0 kHz) spectra of np-Si for various dipolar-dephasing periods, as indicated.
1H MAS spectra of the
np-Si samples that had been evacuated at 500 °C show substantial decreases in overall spectral intensity, more than 1/3 for the 500 °C-evacuated sample (
Figure 5c) and about 2/3 for the pentane-treated-then-500 °C-evacuated sample (
Figure 5b) relative to spectra of the samples that have not been heated at 500 °C (
Figure 4A’,B’). One could speculate that this
1H NMR intensity loss centered around 4 ppm could be due to some kind of dehydrogenation reaction of the type represented in Equation 1 (where it is understood that the symbol,
Si, stands for a silicon atom to which there are additional bonds that are not shown explicitly) or a condensation process of the types represented in Equation 2 or more likely, Equation 3,
Processes of these types could also account for the loss of CP–MAS
29Si intensity centered at about −80 ppm, identified above as sites of the type, (Si–O–)
3Si–H (or (
Si–O–)
2Si(H)OH), in the spectra of
np-Si that has been heated at 500 °C in the presence of O
2 (
vide infra); however, this change in spectra associated with O
2 treatment at 500 °C could also be associated with an oxidative process of the types represented in Equations 4 and 5.
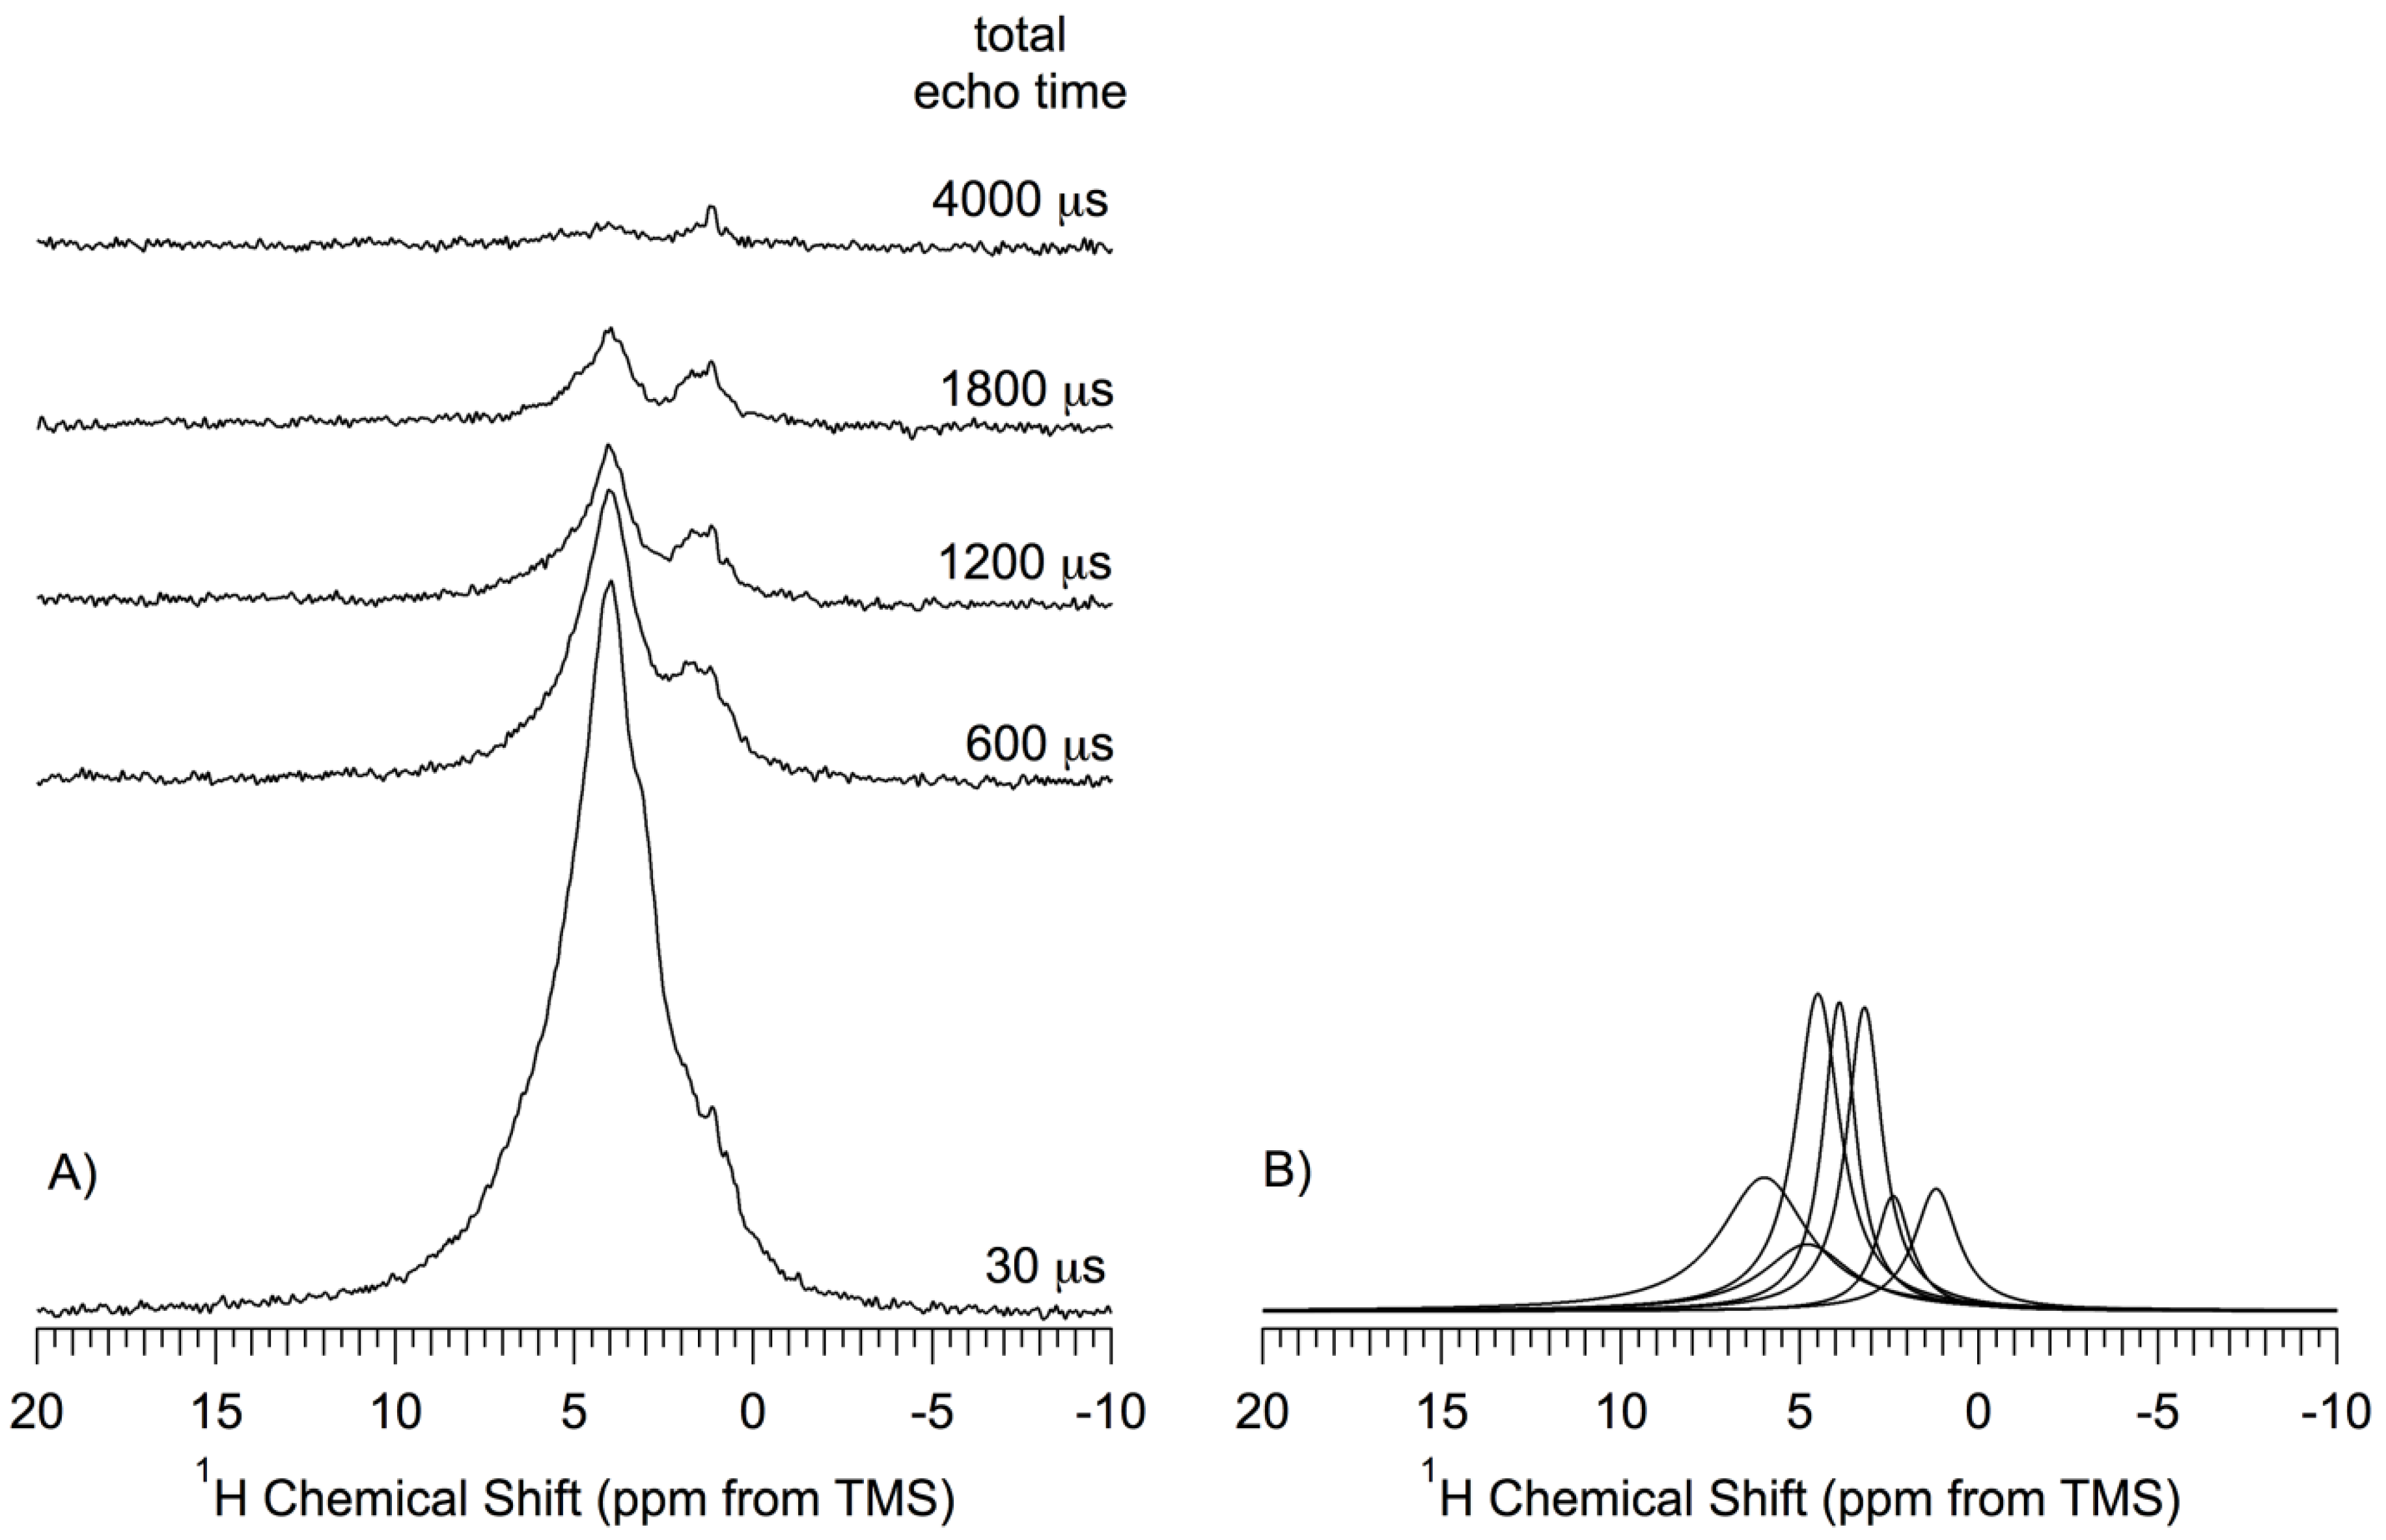
Figure 7 shows the
1H MAS NMR spectra, obtained by the DEPTH-echo sequence, of the
np-Si sample (pentane-treated-then-evacuated at 150 °C) as a function of total echo time (
τtotal = 2
τ1 + 2
τ2). In this technique, details of which are given in the
Supporting Materials, probe background signals are suppressed and the isotropic part of the
1H NMR chemical shift refocuses for any time
τtotal; for low MAS speed, the anisotropic part of the
1H chemical shift can refocus completely only when
τtotal is equal to 2n
τr, where n is an integer and
τr is the MAS rotor period, but is effectively averaged for all
τtotal if the MAS speed is much larger than the CSA (as in the present case, with MAS speeds of at least 12 kHz). The inhomogeneous part of dipolar interactions (
1H–
1H and
1H–
29Si) are also refocused, along with the chemical shift effects, each time that every refocusing interval equals an even number of rotor periods (2n
τr). Thus, it is the
homogeneous contribution of dipolar interactions in effect over the
τtotal period that preferentially attenuates the transverse magnetization of the protons that are most strongly involved in homogeneous dipolar interactions. This is roughly analogous to the well-known dipolar dephasing technique applied routinely in solid-state
13C NMR and represented in
Figure 6 for
29Si NMR, or to CRAMPS
1H experiments with dipolar dephasing [
49,
50]. In obtaining the spectra shown in
Figure 7, the parameter
τtotal was varied from 30 µs to 4000 µs, keeping
τtotal equal to 2n
τr. Only spectra obtained for
τtotal = 30, 600, 1200, 1800 and 4000 µs are shown in
Figure 7.
The
1H NMR spectra obtained with various
τ values were deconvolved into seven Lorentzian-shape peaks, centered at 6.0 ppm, 4.8 ppm, 4.5 ppm, 3.9 ppm, 3.3 ppm, 2.2 ppm and 1.1 ppm (shown in
Figure 7B only for
τtotal = 30 µs). According to this deconvolution process, the corresponding magnetization decay of each of the seven contributions was represented by an exponential function with a time constant,
T2’ estimated by fitting each measured intensity to a separate exponential decay (details in the
Supporting Materials). The
T2’ values obtained from this process are: 6.0 ppm, 0.50 ms; 4.8 ppm, 0.50 ms; 4.5 ppm, 0.50 ms; 3.9 ppm, 0.90 ms; 3.3 ppm, 0.60 ms; 2.2 ppm, 0.40 ms; 1.1 ppm, 2.0 ms. The relative area (integrated intensity) of each of the seven peaks is reflective of the (NMR-visible) abundance of the species (subject to the spectroscopic conditions identified earlier) giving rise to the peak. The observed relative abundances are: 4.5 ppm > 6.0 ppm > 3.9 ppm > 3.3 ppm > 4.8 ppm > 1.2 ppm > 2.2 ppm. The relative individual areas range from 24% to 7% of the total area.
As can be seen in
Figure 7A and the T
2’ values given above, the lowest-shielding
1H MAS contribution decays by dipolar dephasing faster than do the higher-shielding contributions, which indicates that the protons that contribute to the lower-shielding side of the spectrum are involved in stronger homogeneous
1H–
1H dipolar effects than those on the higher-shielding side. If the 1.2 ppm peak is assigned to protons of isolated hydroxyl groups, then its larger
T2’ value can perhaps be explained partially by the motion of those protons about a Si–O bond. It has been shown previously that hydroxyl groups of a silica gel surface execute fast (with reference to a 5 × 10
−6 s time scale defined by deuterium quadrupole interactions) [
51] limited-extent rotational (librational) diffusion about the Si–O axis; the librational motions can be restricted by hydrogen bonds. The librational motions of
isolated hydroxyl groups are less restricted than those of hydrogen-bonded hydroxyls (the
1H–
1H distance between a pair of isolated hydroxyl groups is longer than that of a hydrogen-bonded hydroxyl pair), which results in smaller
1H–
1H dipolar interactions for the isolated hydroxyls.
Figure 7.
(A) 1H (360 MHz) MAS (14.3kHz) Depth-Echo spectra of a np-Si sample evacuated at 150 °C as a function of total echo time, τtotal = 2τ1 + 2τ2. Spectra were obtained by the DEPTH-echo pulse sequence with 1024 transients, shown without amplitude scaling (true amplitude); (B) Deconvolution/simulation contributions to the 1H NMR spectrum obtained at τtotal =30 μs.
The small 2.2 ppm contribution in
Figure 7B can tentatively be assigned to protons of hydrogen-bonded hydroxyls. It is known that hydrogen bonding produces a proton chemical shift to lower shielding and that the magnitude of this effect increases with stronger hydrogen bonding [
51,
52]. Thus, strongly hydrogen-bonded hydroxyls give a
1H NMR signal in the lower-shielding region and are less mobile. It may be dangerous to interpret the other dominant peaks in the same way, because Si–O–H dynamics in a
np-Si system might be much different from the dynamics on a silica surface.
A plausible identification of at least a major portion of the 6.0, 4.8 and 4.5 ppm spectral contributions is hydrogens that are
directly bonded to silicon. This kind of hydrogen is essentially immobile, so the
1H–
1H interactions between them are not averaged by atomic-level motion and are expected to be stronger than those between “mobile” hydroxyl protons of a comparable inter-hydrogen distance [
45]. The
29Si CP–MAS spectra and related theoretical calculations of
29Si chemical shifts (
vide supra) also indicate that a major fraction of the surface sites in
np-Si samples that have not been intentionally oxidized consists mainly of hydrogen-terminated silicon, instead of silanol (Si–OH) groups (
vide infra). This is consistent with our interpretation that these peaks in the DEPTH-echo measurements on
np-Si for
τtotal = 30 µs, arise mainly from hydrogen atoms that are
directly bonded to surface silicon atoms.
Water-Treated Samples. Figure 3D,G show the proton-decoupled
29Si CP–MAS NMR spectra of
np-Si that has been treated, respectively, with
1H
2O or
2H
2O (then evacuated at 150 °C), obtained using a 14 ms CP contact time. Comparison of these spectra shows the effect of a chemical treatment that provided an opportunity for replacement of any readily-exchangeable hydrogens on the surface (e.g., of Si–OH) by deuterium atoms. One sees no substantial evidence in
Figure 3D or
Table 1 of a removal of
1H sources for
1H– >
29Si CP. The proton-decoupled
29Si CP–MAS NMR spectrum of
1H
2O-treated
np-Si (
Figure 3G) is very similar to the spectra of 150 °C-evacuated
np-Si (
Figure 3B) and the sample treated with
2H
2O (
Figure 3D). While there are some significant, albeit not dramatic, differences in the intensities of the six contributions (
Table 1) for comparable positions in the spectra of
Figure 3B,D and G, the line widths of comparable contributions are identical (within experimental error). The similarities among the
29Si CP–MAS spectra of
Figure 3B,D and G are so strong that the only chemically significant conclusion that seems to follow is that
readily-exchangeable OH groups are not dominant on the surfaces of these samples; otherwise, the effects of
1H–
2H exchange would have been more dramatic in these
1H– >
29Si CP–MAS
29Si spectra.
The total NMR-determined proton concentrations of the samples of
Figure 4A’ (as-received) and
Figure 4B’ (pentane-treated-then-evacuated at 150 °C) are essentially the same as each other; also the total
1H concentrations of the samples of
Figure 4D (
2H
2O-treated-then-evacuated at 150 °C) and
Figure 4G (
1H
2O-treated-then-evacuated at 150 °C) are the same as each other. Within this quartet of samples/spectra, the pentane-treated and as-received samples have about 12% higher total
1H intensity than the samples that have been treated with water. This difference is primarily manifested in the intensity contributions around 3.9 ppm and 3.3 ppm and is partially compensated by larger contributions around 1.1 ppm for the water-treated samples. If there were a dominant contribution of readily exchangeable Si–OH moieties on the untreated (or pentane-treated-then-150 °C evacuated) sample, the main effect of
2H
2O treatment would be hydrogen exchange and a reduced Si–O–
1H intensity (probably at about 1.1 ppm) [
44];
such a spectral difference is not observed between Figures 4D,G, or between Figure 4D and Figure 4A’
or B’. These results are consistent with indications from the
29Si NMR results (and
2H MAS results,
vide infra) that there is not a dominant contribution of readily exchangeable Si–OH moieties on the un-oxidized
np-Si surface.
An obvious difference between the
1H NMR spectra of
2H
2O-treated and
1H
2O-treated samples would have been expected, and is
not observed, if water treatment had resulted in simple hydrolysis of strained Si–Si bonds, e.g., as represented by Equation 6.
A direct oxidation by water (Equation 7) seems unlikely.
Table 2 indicates that the main
1H NMR effect of
np-Si treatment with
1H
2O (
Figure 4G) and
2H
2O (
Figure 4D) is a transfer of
1H intensity from the region around 3.9 ppm (near the assignment for (
Si–O–)
3Si–H to about 1.1 ppm (near previous assignment for isolated silanols of a silica system) [
44]. This decrease in 3.9 ppm intensity and increase in 1.1 ppm intensity could be explained by some kind of chemical reaction of the type shown in Equation 8 (assuming that the hydride
1H chemical shift of structure II is substantially different from that in structure I).
It may be noteworthy that the
29Si CP–MAS spectra (
Figure 3D,G) of samples that correspond to those of the
1H MAS spectra of water-treated samples (
Figure 4D,G) do not show any convincing evidence that supports (or refutes) the speculative chemistry embodied in Equations 6–8, or of
any substantive chemical changes.
np-Si that had been treated with another hydroxyl-containing species, CH
3OH, and then evacuated at 150 °C (
Figure 5a), yielded a
lower overall hydrogen concentration and a broader, reduced-intensity pattern around the central maximum, between about 3 ppm and about 5 ppm. This overall reduction of hydrogen concentration seems unlikely to be due to an extraction of non-polar organic contaminants, as these would be more effectively extracted by pentane; and it is not obvious from
Figure 4 and
Figure 5 that this occurs. One can speculate that the reduced-intensity pattern around 4 ppm might be due to some kind of chemical reaction involving the reduction of CH
3OH (Equation 9); but these experiments showed no visual evidence (e.g., CH
4 evolution) for such a process.
Oxidized samples.
Figure 3E shows the proton-decoupled
29Si CP–MAS NMR spectrum of oxidized
np-Si (evacuated at 500 °C), obtained using a 14 ms CP contact time. The most obvious differences between the
29Si NMR spectra of oxidized (
Figure 3E) and un-oxidized (
Figure 3B) samples are a general loss of overall spectral intensity and peak narrowing in the spectrum of the oxidized sample and the total loss of intensity in the −14 ppm, −74 ppm and −83 ppm regions. One sees in
Table 1 that only the spectral contributions centered at −89 ppm, −99 ppm and −109 ppm survive in the oxidation (the −109 ppm contribution may actually increase); as pointed out above, these are the same chemical shifts at which one finds the Q2, Q3 and Q4 moieties in the
29Si CP–MAS spectra of silicas [
43]; hence, such assignments may account for
at least portions of the spectral intensity in these chemical shift regions in the spectra of
Figure 3. In terms of the tentative structural assignment given above, these results indicate that the 500 °C O
2 treatment converts all
Si–
Si and
Si–H bonds, and some of the
Si–OH moieties, at the surface primarily to
Si–O–
Si linkages and that
Si of most of these new
Si–O–Si linkages are sufficiently remote from hydrogen atoms to be incapable of exhibiting observable
1H– >
29Si CP.
In the
1H MAS spectra, the three samples with a history of intentional oxidation (O
2 treatment at 500 °C), represented in
Figure 4E,F and
Figure 5d, show dramatic changes relative to as-received (
Figure 4A’) or pentane-treated-then-150 °C-evacuated (
Figure 4B’)
np-Si samples. The sample that was subjected to
only 500 °C O
2 treatment, with no subsequent water treatment (
Figure 4E), shows a sharp decrease (roughly half) in total
1H concentration;
Table 2 indicates that this intensity loss is distributed throughout the entire spectrum, except perhaps for the contribution at about 3.3 ppm. This broad intensity loss would be consistent with the occurrence of oxidation processes that convert
Si–H moieties into
Si–O–
Si moieties or into
Si–OH groups (Equation 10) followed by condensation of adjacent silanols (Equation 11).
The fact that, as seen in
Table 2, the 1.1 ppm intensity in
Figure 4A’,B’ (as-received or pentane-treated-then-150 °C evacuated, respectively) is largely retained in
Figure 4E (500 °C oxidized) is consistent with the idea that dehydration is more difficult with isolated silanols (about 1.1 ppm) than with hydrogen-bonded silanols (>2 ppm). In light of the
29Si CP–MAS results (
Figure 3) on the −109 ppm spectral contribution, It would appear that
n = 0 may be the most probable interpretation.
Figure 3F shows the proton-decoupled
29Si CP–MAS NMR spectrum of oxidized-then-
1H
2O-treated (then evacuated at 150 °C)
np-Si, obtained using a 14 ms CP contact time. This spectrum is very similar to that of the
np-Si sample that had been only oxidized (no
1H
2O treatment,
Figure 3E), as shown numerically in
Table 1. Thus, the
29Si CP–MAS experiments provide no obvious evidence of any major chemical transformation due to the water treatment.
The
1H MAS spectrum of the
2H
2O-treated-then-oxidized sample (
Figure 5d) shows a huge decrease in total
1H concentration, relative to that of the pentane-treated-then-150 °C evacuated
np-Si sample, manifested across the entire spectrum, except for a small intensity increase in the 1–3 ppm range (
Table 2). The large total
1H intensity loss upon oxidation of
np-Si with O
2 at 500 °C (
Figure 4E) is more than restored when this sample is treated with
1H
2O (
Figure 4F); in fact the total
1H content of this sample is almost double that of the as-received or pentane-treated-then-150-°C-evacuated samples. From
Table 2 one sees that this increase in total
1H content, relative to the spectrum of the O
2-oxidized-only sample (
Figure 4E), is spread across the spectrum, except for a modest decrease in spectral intensity around 3.3 ppm, and is especially large in the 4.8 ppm, 2.2 ppm and 1.1 ppm contributions. These intensity increases with
1H
2O treatment are consistent with surface reactions of the types represented in Equations 12 and 13 for the oxidation and water-treatment steps and imply that the 4.8 ppm, 2.2 ppm and 1.1 ppm chemical shifts may be associated with structures of the (
Si–O–)
4−n−p (
Si–)
pSi(–OH)
n type on the surface. For
p = 0,
these proton chemical shifts have been assigned in previous work on silica gel to protons in isolated silanols (Si–OH) (1.1 ppm) [
44], silanols with hydrogen-bonds (Si–OH
...HO–Si) of modest strength (roughly 1.2 to 2.0 ppm) and silanol networks with very strong hydrogen bonds (>2 ppm). The modest decrease in 3.3 ppm intensity in the
1H MAS spectrum upon
1H
2O treatment suggests that one effect of water treatment on the 500 °C/O
2-oxidized
np-Si sample could be a “sharpening” of the spectral intensity patterns on both sides of 3.3 ppm, ostensibly due to some degree of reduced structural heterogeneity in the associated site structures, reducing the overlapped intensity into the 3.3 ppm region.
Comparison of the spectra of oxidized samples that have been treated with
1H
2O (
Figure 4F) and with
2H
2O (
Figure 5d) emphasizes structural changes that are generated by oxidation, but show up in
1H NMR spectra of water-treated samples only when the water is
1H
2O. This comparison shows larger spectral intensity contributions across the entire spectrum (
Table 2) of
Figure 4F, compared with
Figure 5d, with the largest differences for the contributions at 4.8 ppm, 2.2 ppm and 1.1 ppm. Since one expects that the main source of differences between these
1H MAS spectra will be associated with readily “exchangeable” Si–OH moieties, these results indicate that these three spectral regions perhaps correspond to structural sites of the type, (
Si–O–)
4−nSi(–OH)
n (most probably with
n = 1 and 2). These chemical interpretations are consistent with the corresponding
29Si CP–MAS results, which show a dramatic loss of intensity centered at about −80 ppm, (
Si–O–)
3Si–H and (
Si–O–)
2Si(H)OH, for oxidized samples (
Figure 3E for oxidized-only and
Figure 3F for oxidized-then-
1H
2O-treated). The combination of results suggests that most likely there are essentially no Si–Si bonds remaining at the surface after O
2 oxidation at 500 °C.
2H MAS NMR results. Since useful information regarding the chemical status of hydrogen atoms is often available from deuterium NMR, especially from comparing the NMR results of samples that differ only in their
1H
vs.
2H contents,
2H MAS experiments were carried out on
np-Si samples that had been (a) treated (exchanged) with
2H
2O (the same kind of sample as in
Figure 3D and
Figure 4D) and (b) oxidized-then-
2H
2O-treated (the same kind of sample as in
Figure 5d). While most solid-sample
2H NMR experiments are carried out on static samples, focusing on the relationship between line shape and motion [
53], our experiments employed MAS because of our primary interest in chemical shift/structure issues. Treating the
np-Si with
2H
2O will result in the replacement by
2H atoms of those
1H atoms that are both sterically accessible to the
2H
2O and of a local site structure, e.g., Si–OH, that is suitable for exchanging hydrogen with liquid water (presumably via an adsorbed-water intermediate).
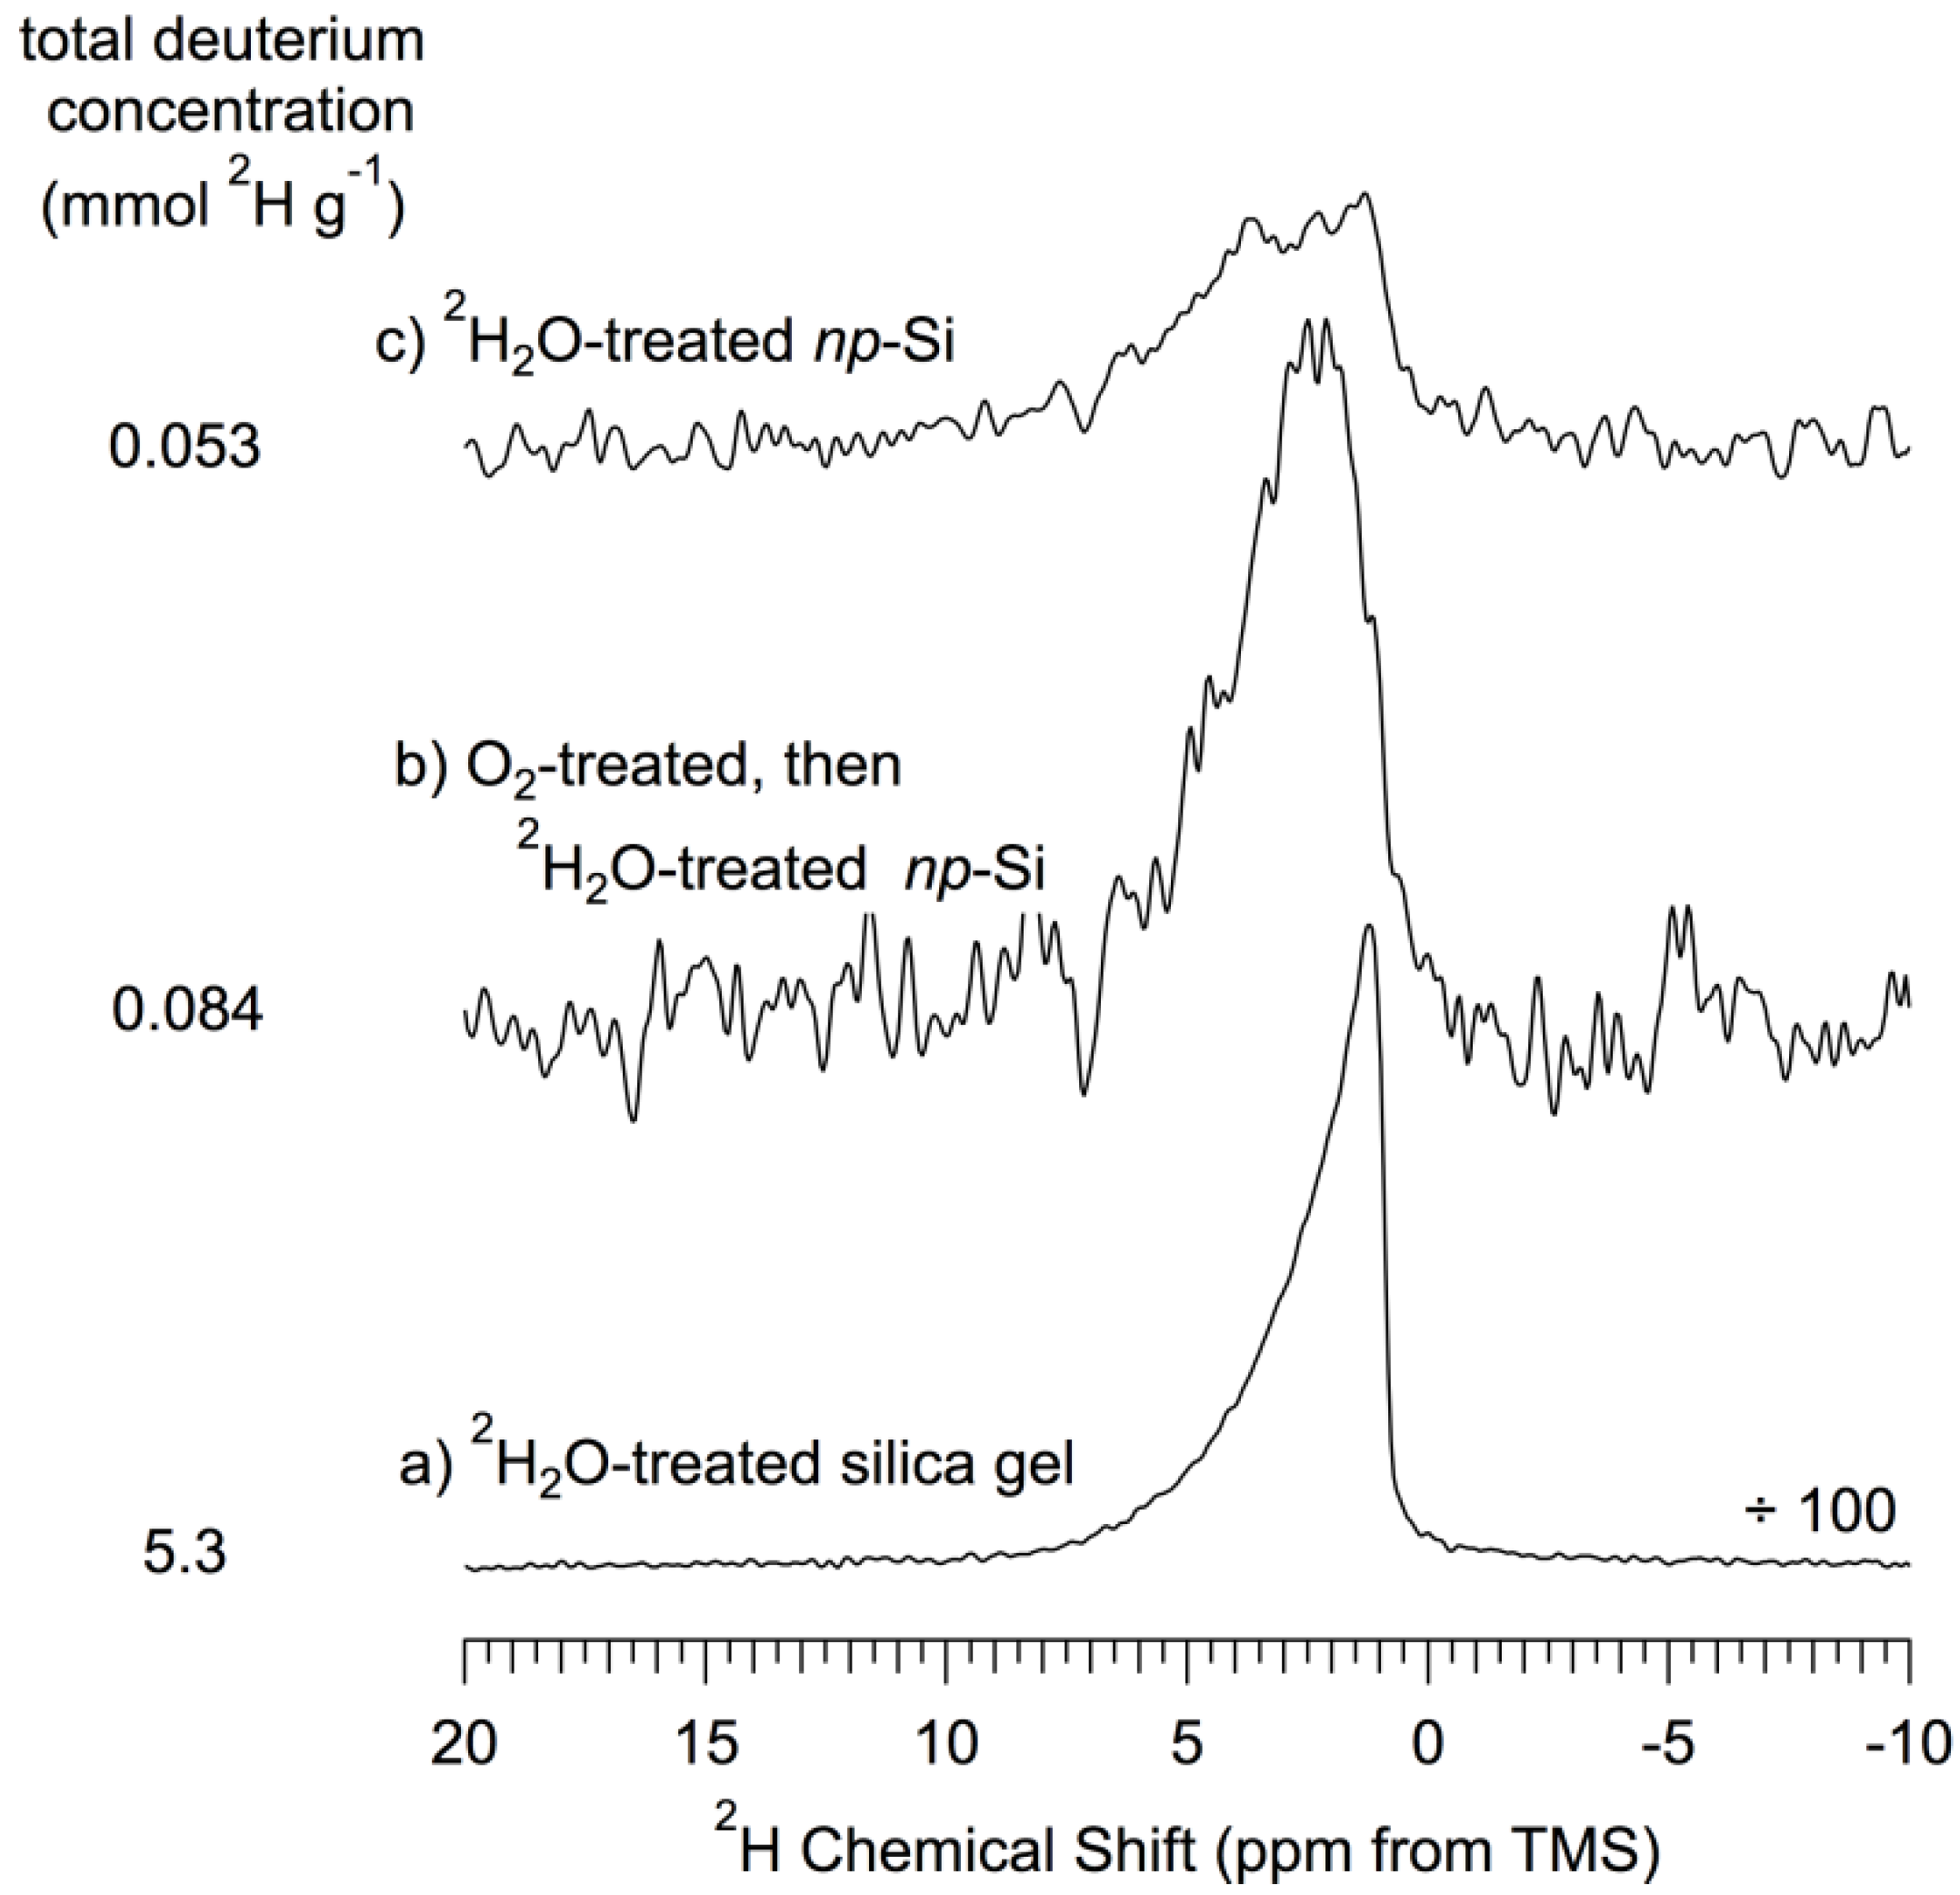
The results are shown in
Figure 8, along with a
2H MAS spectrum of
2H
2O-treated silica gel. This figure shows a
2H NMR signal that is nearly twice as intense for the oxidized-then-
2H
2O-treated sample (
Figure 8b) as for the sample that had not been subjected to the O
2/500 °C oxidation procedure (
Figure 8c). Since the effect of
2H
2O treatment is viewed substantially in terms of
2H-for-
1H exchange in silanol groups at the surface, this result implies that the O
2/500 °C treatment roughly doubles the H-exchange accessible silanol concentration on the
np-Si surface. In comparison with the spectrum of a
2H
2O-exchanged silica gel (
Figure 8a), one sees that the H-exchangeable silanol concentrations represented in
Figure 8 are very small compared with those of silica gel [
54].
The OH concentration of dry silica gel has previously been determined (5.3 mmol OH g
−1) [
54] and apparently almost this entire hydrogen population is exchangeable with
2H
2O; then, from the
2H NMR intensities of
Figure 8 and the weights of the individual samples, the OH concentrations of
np-Si and oxidized
np-Si could be estimated as 0.053 and 0.084 mmol H g
−1, respectively, assuming that all of the
2H
2O-exchangeable hydrogen on
np-Si-based samples are readily exchangeable silanol moieties. Comparing these two numbers with the hydrogen contents given in
Table 2, one can conclude that about 3% of the hydrogen content of pentane-treated-then-150 °C evacuated
np-Si is in H-exchangeable surface silanols and for the oxidized
np-Si sample this percentage is about 6%.
These numbers are an order of magnitude smaller than what one would estimate from the integrated 29Si CP–MAS NMR intensities summarized in Table 1, if we assumed that the intensities centered at about −89 ppm, −99 ppm, and −109 ppm were due entirely to silica-like, i.e., readily exchangeable sites. These results reinforce the implied interpretation above that a substantial portion of the Si–OH moieties of
np-Si are not accessible for hydrogen exchange.
Figure 8.
2H (55 MHz) MAS (7 kHz) NMR spectra of treated silica gel and treated
np-Si samples. (
a)
2H
2O-treated-then-150 °C evacuated silica gel; (
b) 500 °C O
2-treated-then-
2H
2O-treated-then-150 °C evacuated
np-Si; (
c)
2H
2O-treated-then-150 °C evacuated
np-Si. The total deuterium concentration was determined by comparison of the numerical integral of each spectrum referenced to the proton concentration for dry silica gel determined by Li
et al. [
54]. The
np-Si spectra are scaled so that the total area (integral) is proportional to the
2H g
−1 value for each sample. The silica gel spectrum is scaled correspondingly, except for a factor of 100.


