2.2. 13C Line Shape versus Temperature
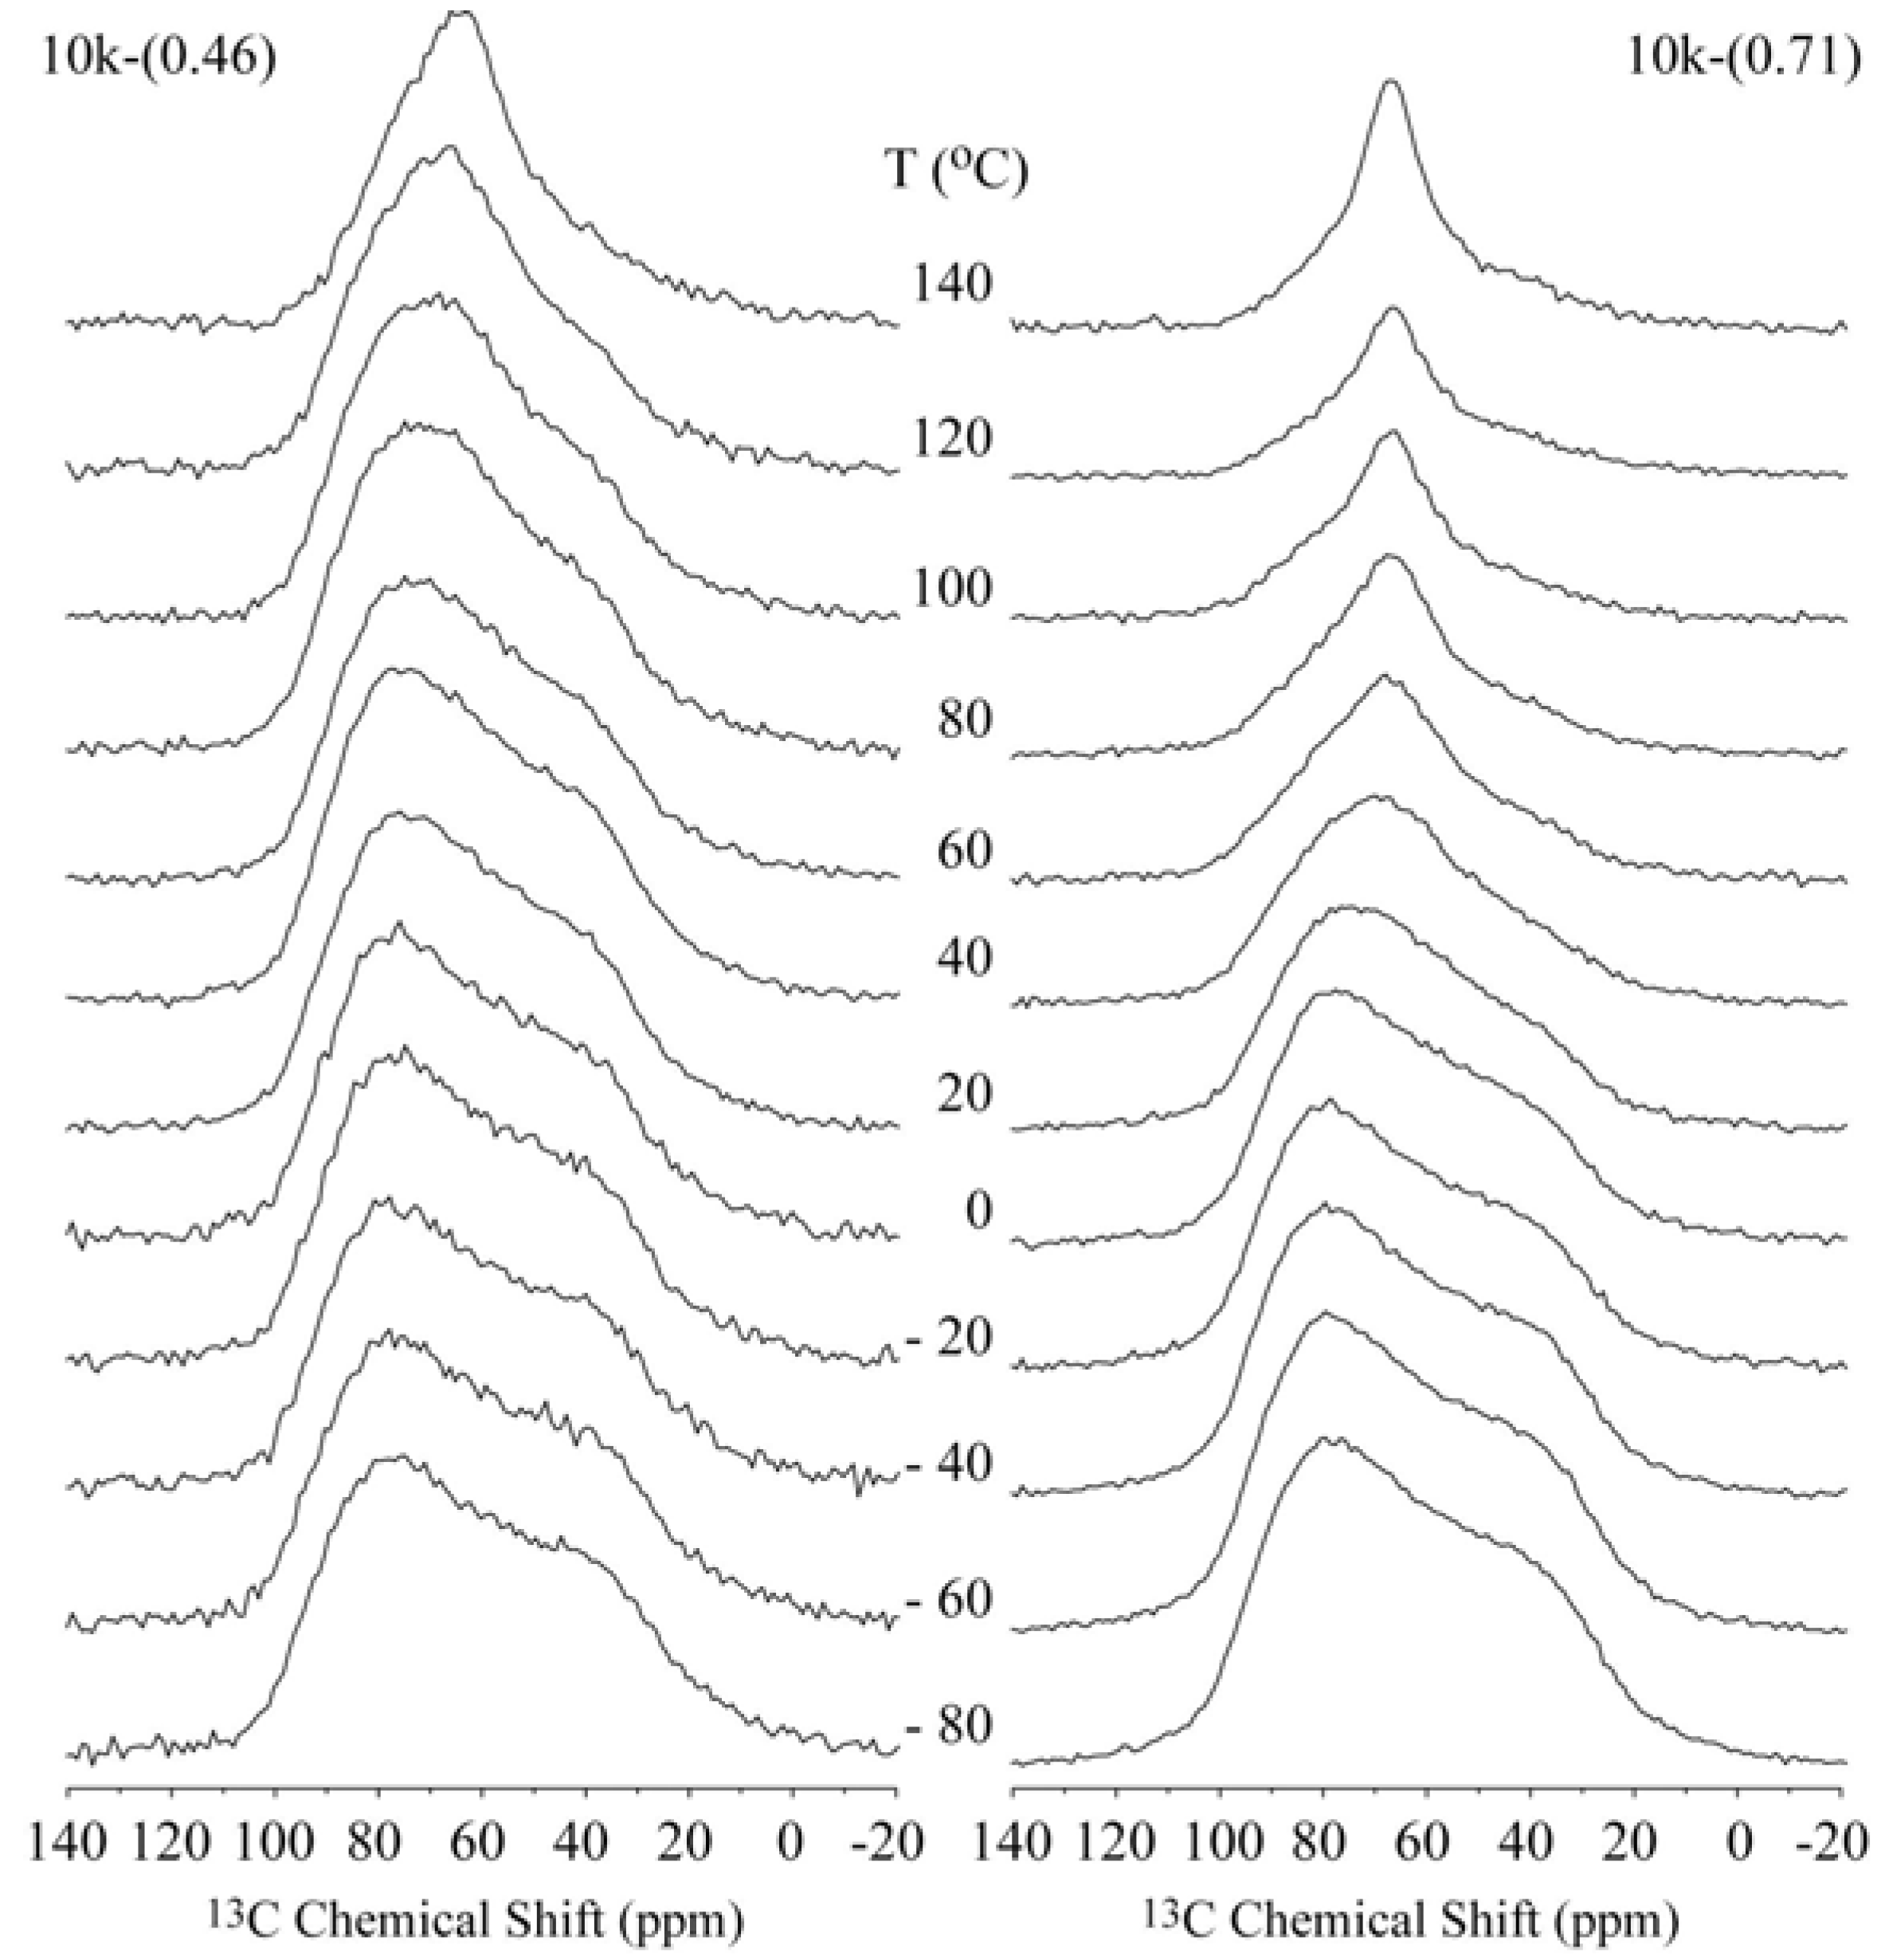
The 13C chemical shift spectra (or 13C CSA spectra) are very useful for identifying the presence of dynamical processes in polymers. This determination is relatively straightforward for PEG because it only contains one magnetically non-equivalent carbon along the polymer chain. We used the 13C CSA spectra to obtain a qualitative description of the molecular motion in the different samples.
Figure 2 shows the temperature dependence of the
13C CSA spectra for the 10k-(0.46) and 10k-(0.71) samples, which correspond to the single- and double-layer PEG configurations, respectively. In both cases, the narrowing of the spectra is clearly observed, which occurs at lower temperatures for the 10k-(0.71) sample.
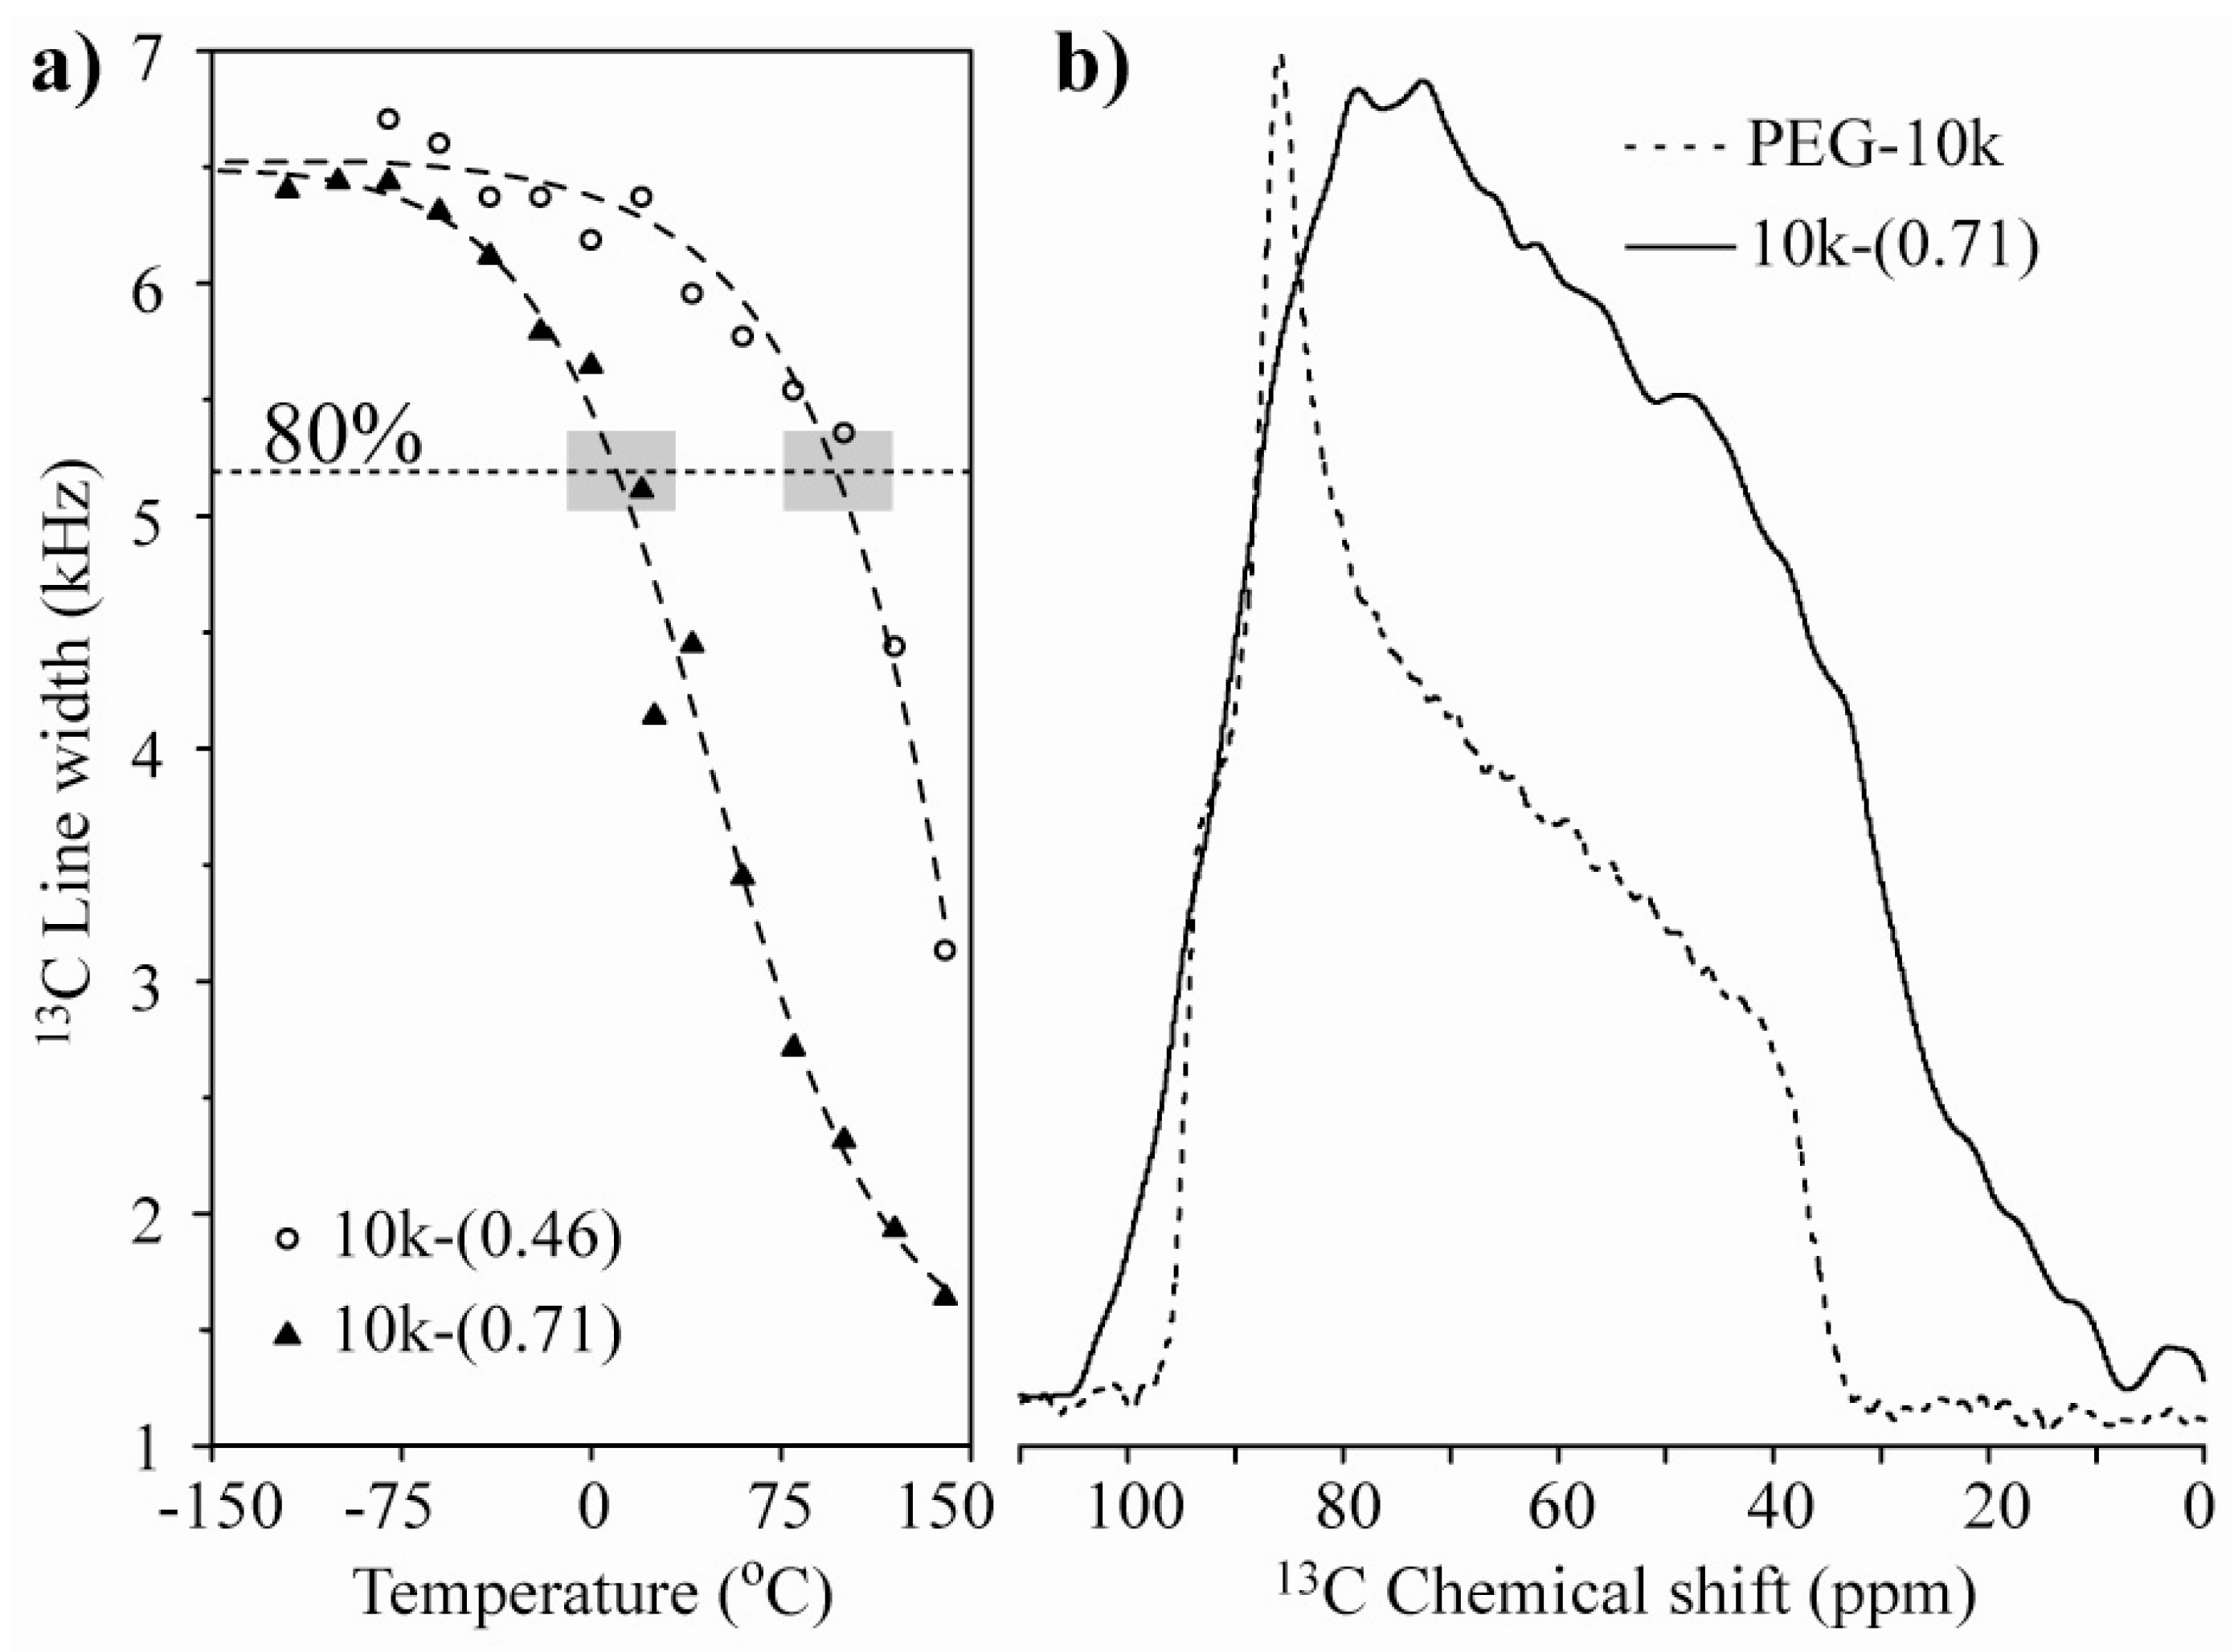
Figure 3a presents the plots of the line width at half maximum
versus temperature for the 10k-(0.46) and 10k-(0.71) nanocomposites. The observed behavior suggests that the chain motion in the single-layer intercalated compound has a higher activation energy, which might be related to a stronger interaction with the clay platelets. To obtain a better picture of the motion, we studied the motional geometry using Exchange NMR experiments. However, to compare the motional amplitudes in different samples, it is preferable for the motions to have similar correlation times (similar dynamic regimes). To achieve this behavior, the measurement temperature must be chosen in such a way that the motionally averaged powder spectra for both samples are similar, which can in fact be easily obtained by selecting the temperature where the line widths are as similar as possible. Therefore, all of the Exchange experiments presented in the following sections were performed at temperatures where the line widths at half maxima correspond to approximately 80% of their rigid limit values; see the gray boxes in
Figure 3a. Note that the powder spectra observed for the lowest temperatures are broader than that observed for pure PEG (
Figure 3b). This broadening is primarily due to magnetic susceptibility effects in HCT. For naturally occurring clays, the occurrence of magnetic impurities is well-known [
31,
32,
33] If these impurities were in the paramagnetic phase, they would produce a strong reduction the in relaxation times that could be so severe that they would render NMR signals completely unobservable [
34]. However, it was reported in reference [
35] that the true magnetic susceptibility of the HCT matrix is very small, and the measured high low-field M/H ratio is actually due to the presence of small amounts of ferrimagnetic Fe
3O
4 and/or
γ-Fe
2O
3 oxides, which exhibit ferromagnetic-like behavior that saturates at low fields (~5 kOe) and do not drastically influence the high-field (~94 kOe) NMR spectra and relaxation times.
Figure 2.
Temperature dependence of the 13C NMR spectra obtained for the single- and double-layer nanocomposites 10k-(0.46) and 10k-(0.71), respectively.
Figure 2.
Temperature dependence of the 13C NMR spectra obtained for the single- and double-layer nanocomposites 10k-(0.46) and 10k-(0.71), respectively.
Figure 3.
(a) 13C line-width versus temperature for the 10k-(0.46) and 10k-(0.71) samples. The horizontal dashed line and the gray boxes represent the regions where the line-widths correspond to approximately 80% of their rigid limit values; (b) Room temperature 13C NMR spectra for pure PEG with Mw = 10,000 g/mol and the 10k-(0.71) samples.
2.3. 2D Separated-Local-Field NMR
To obtain information about the geometry of the PEG molecular motion in the intercalated compounds, we used 1D and 2D Exchange NMR experiments. However, the interpretation of the results depends on the knowledge (or at least an estimation) of the orientation of the principal axis system (PAS) of the chemical shift tensor relative to a fixed local molecular axis frame (MF). To achieve this requirement, 2D Separated-Local-Field (SLF) experiments [
26,
27] were performed for pure PEG with a M
w = 10,000 g/mol and for the 10k-(0.71) samples. This experiment provides a 2D powder spectrum that corresponds to the correlation between the
13C–
1H dipolar and
13C chemical-shift anisotropic (CSA) interactions. This correlation depends on the principal values and the PAS orientation of both the
13C–
1H dipolar and
13C chemical-shift tensors. The CSA principal values were obtained from the
13C powder spectrum. The
13C–
1H dipolar interaction principal values are easily obtained from the typical C–H distance, and the orientation of the main axis of the C–H dipolar interaction tensor is directly obtained from the orientation of the
13C–
1H bond. Consequently, the only unknown variable that defines the 2D SLF spectrum is the PAS orientation of the chemical shift tensor. This PAS orientation is given by the three Euler angles (
α,
β,
γ) that define the relative orientation between the C–H dipolar and CSA tensors. Thus, by simulating the 2D SLF spectrum for a set of Euler angles and comparing it with the experimental one, we can obtain these angles (
α,
β, and
γ) using a best-fit analysis. For the CH
2 groups, the same analysis can be performed, but in this case, the two CH dipolar tensors are replaced by the sum and difference tensors, which are also well-defined because the bond angle between the two CH bonds is fixed [
27].
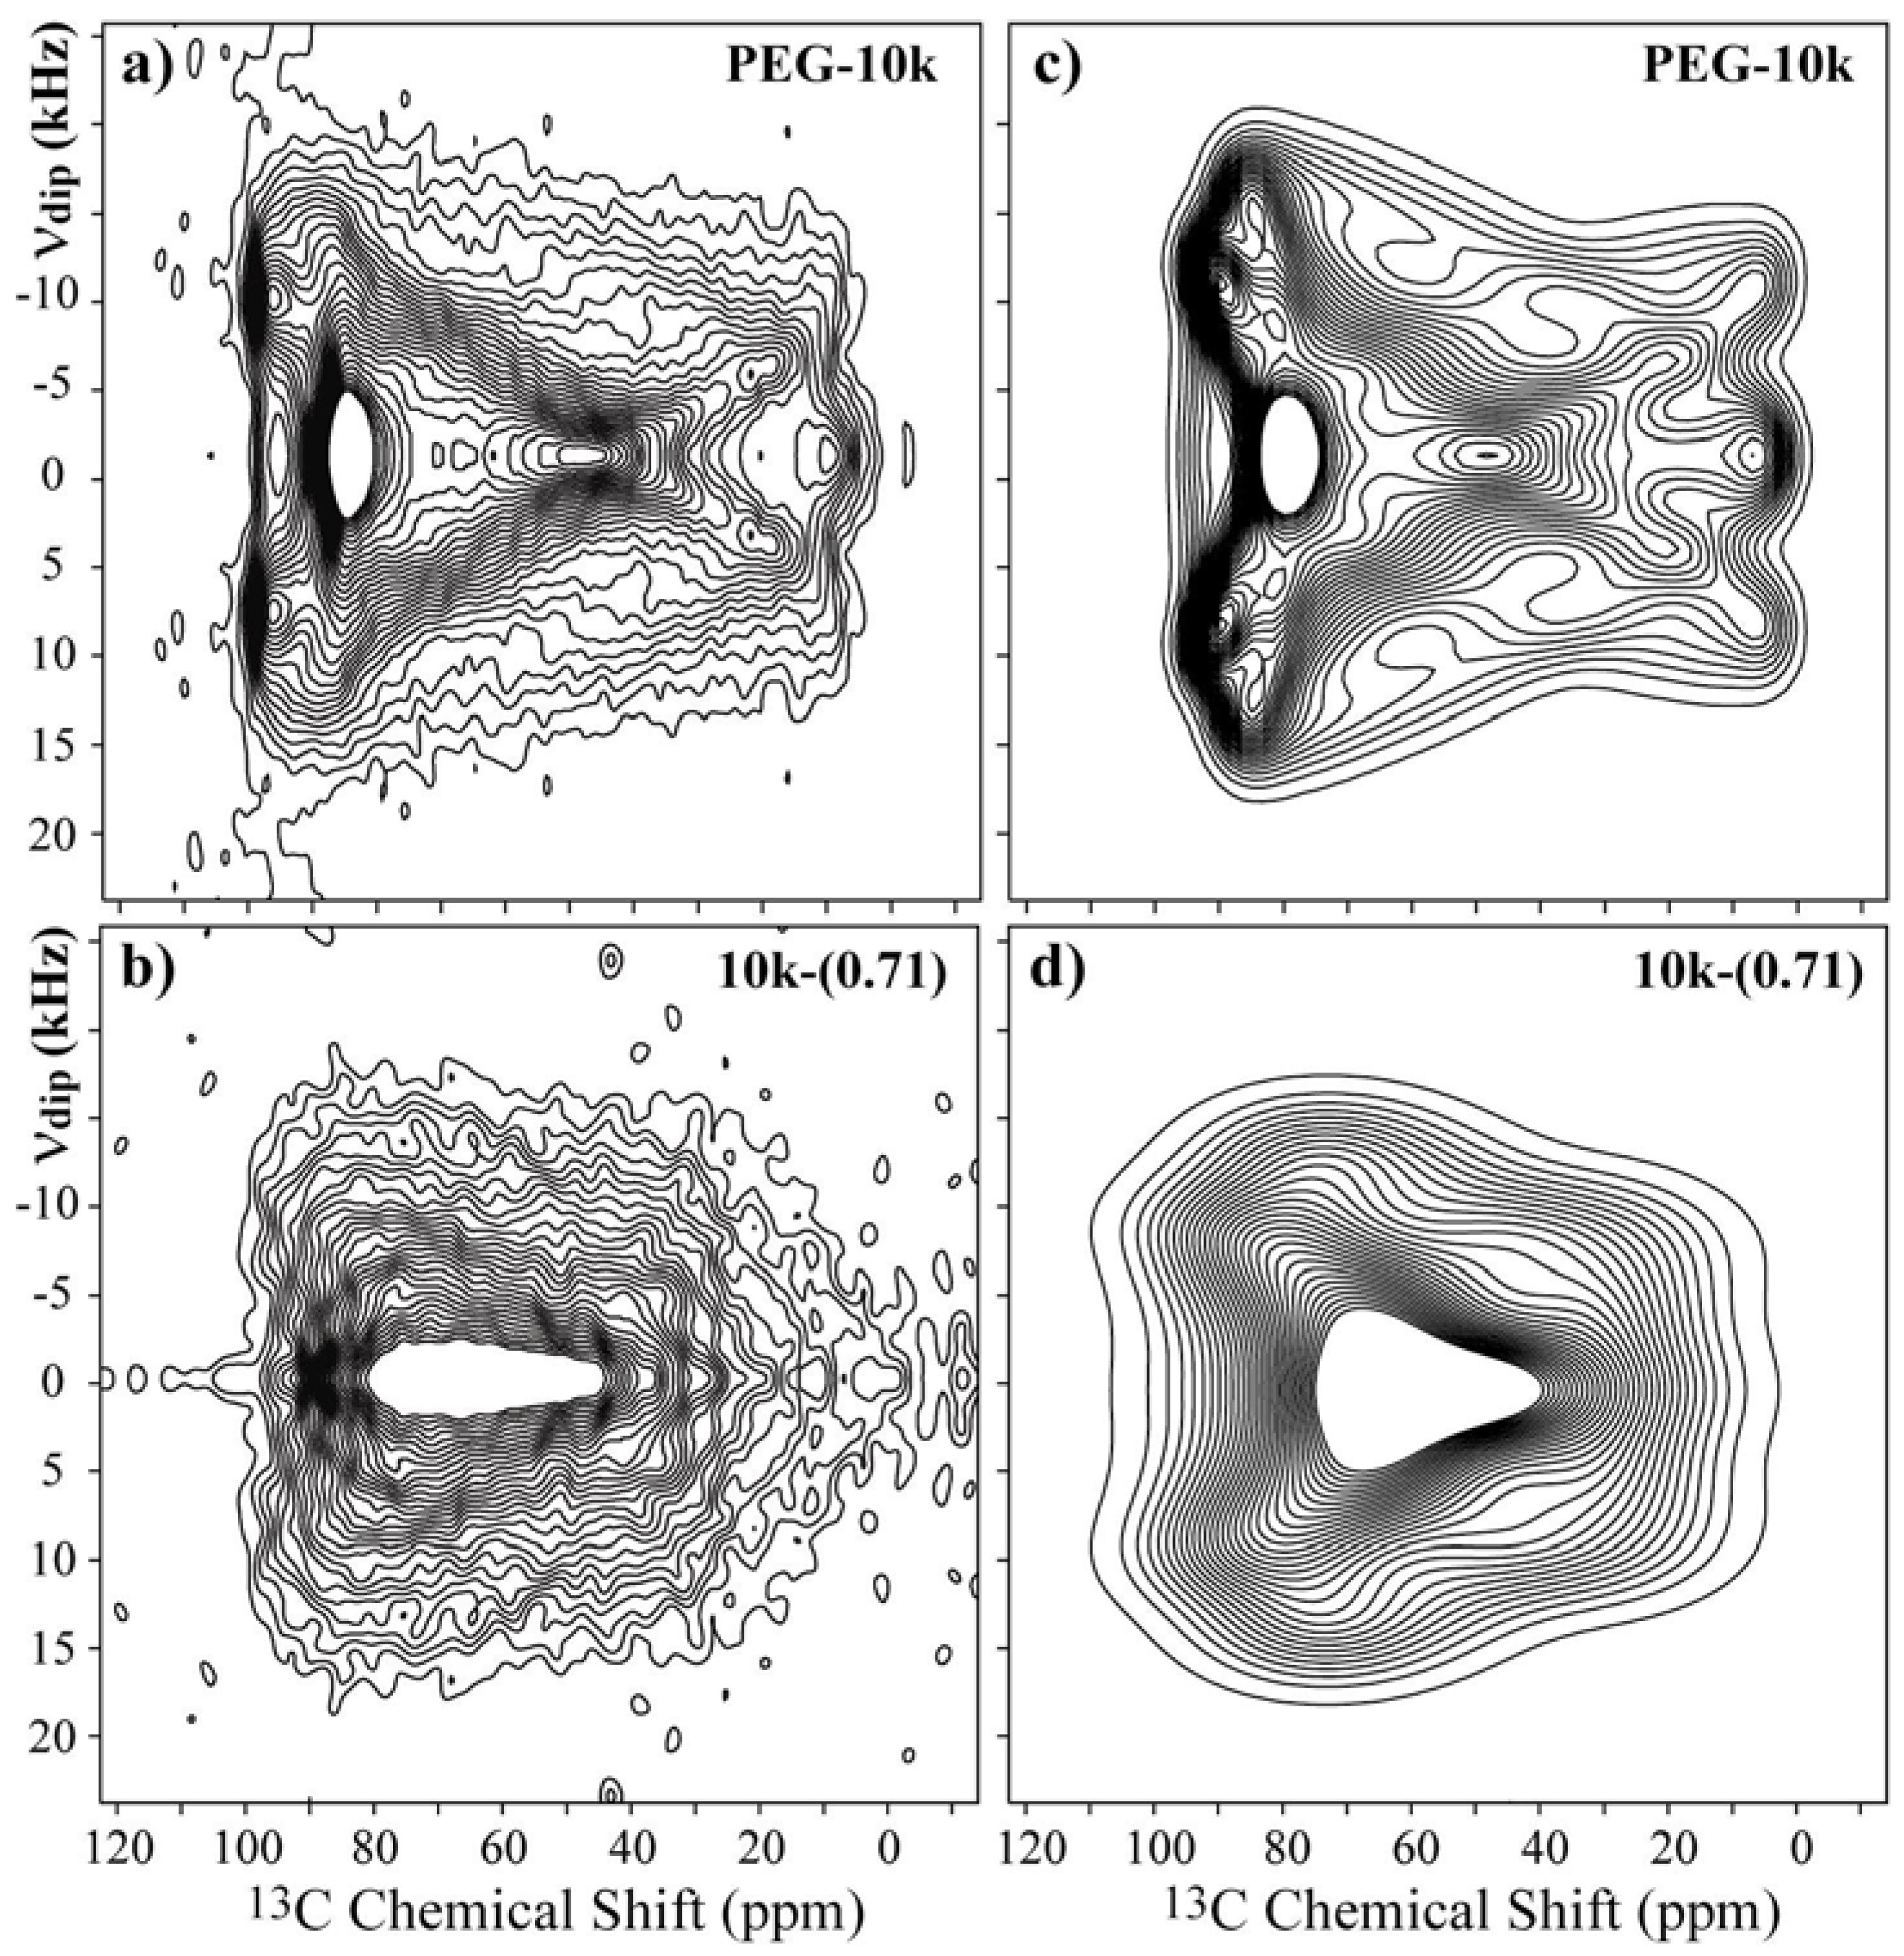
Figure 4a,c present the experimental and best-fit simulated SLF spectra for the pure PEG with a M
w = 10,000 g/mol. The experimental spectrum can be well reproduced using the set of Euler angles (90°, 20°, and 90°). For the 7
2 helix conformation of PEG in the crystalline phase, this orientation means that the
σyy principal axis is along the middle line of the two CH bonds, and the
σzz principal axis lies 25° from the local helix axis. These values are in good agreement with those obtained in a previous study given the estimated imprecision of about 5° in the determination of the Euler angles [
27]. The 2D SLF spectrum for the 10k-(0.71) sample is shown in
Figure 4b.
As observed, this spectrum is significantly different from that of pure PEG, but the symmetries of both spectra are similar. In fact, the majority of the differences between the spectra are attributed to the strong broadening of the powder spectrum. Thus, to simulate the SLF spectrum for PEG in the 10k-(0.71) sample, we took the principal values from the
13C powder pattern and assumed that the structure of PEG inside the clay is essentially a distorted helix [
10], which allowed us to assume a local chain axis quite similar to that of pure PEG. Therefore, we simulated the spectrum using the orientations obtained from pure PEG as a base, and the best simulation was obtained for the angles (90°, 30°, and 90°),
Figure 4d. However, note that despite having the correct symmetry, the reproduction of the experimental spectrum by the simulated one is not as good as for pure PEG. Indeed, due to the conformation disorder along the PEG helix in the intercalated compound, which produces a distribution of chemical shifts and a broadening due to susceptibility effects, the precise Euler orientations cannot be obtained from these results, which were used only as a hint of the basic Euler orientations used in 2D Exchange simulations. In other words, the CSA orientation (90°, 30°, and 90°) was used as a starting point for the 2D Exchange simulations, and the CSA distribution (amplitude and orientations) were included in the 2D Exchange simulations by using a proper reorientation angle distribution [
36] and an artificial Gaussian broadening. Thus, in this work, we used the basic CSA orientation obtained from the 2D SFL experiments and introduced the disorder in the reorientation angle distribution.
Figure 4.
Experimental 2D Separated-Local-Field NMR spectra obtained for (
a),(
b) pure PEG with M
w = 10,000 g/mol and the 10k-(0.71) samples at room temperature; and (
c),(
d) the corresponding simulations using the CSA orientation reported in reference [
27].
Figure 4.
Experimental 2D Separated-Local-Field NMR spectra obtained for (
a),(
b) pure PEG with M
w = 10,000 g/mol and the 10k-(0.71) samples at room temperature; and (
c),(
d) the corresponding simulations using the CSA orientation reported in reference [
27].
2.4. Exchange NMR
2D Exchange NMR [
23] is a powerful technique for studying slow molecular reorientations. This measurement essentially consists of monitoring the orientation-dependent NMR frequencies before (
t1) and after (
t2) a mixing time (
tm), when usually
t1,t2 tm, such that the molecular reorientation only can occur during
tm. In the absence of molecular motion, the 2D spectrum obtained after the 2D Fourier transform of the 2D time signal S(
t1,
t2,
tm) in
t1 and
t2, is purely diagonal. In contrast, if slow molecular reorientations occur during
tm , off-diagonal intensities are observed. The intensity pattern of the 2D Exchange spectrum strongly depends on motional geometry,
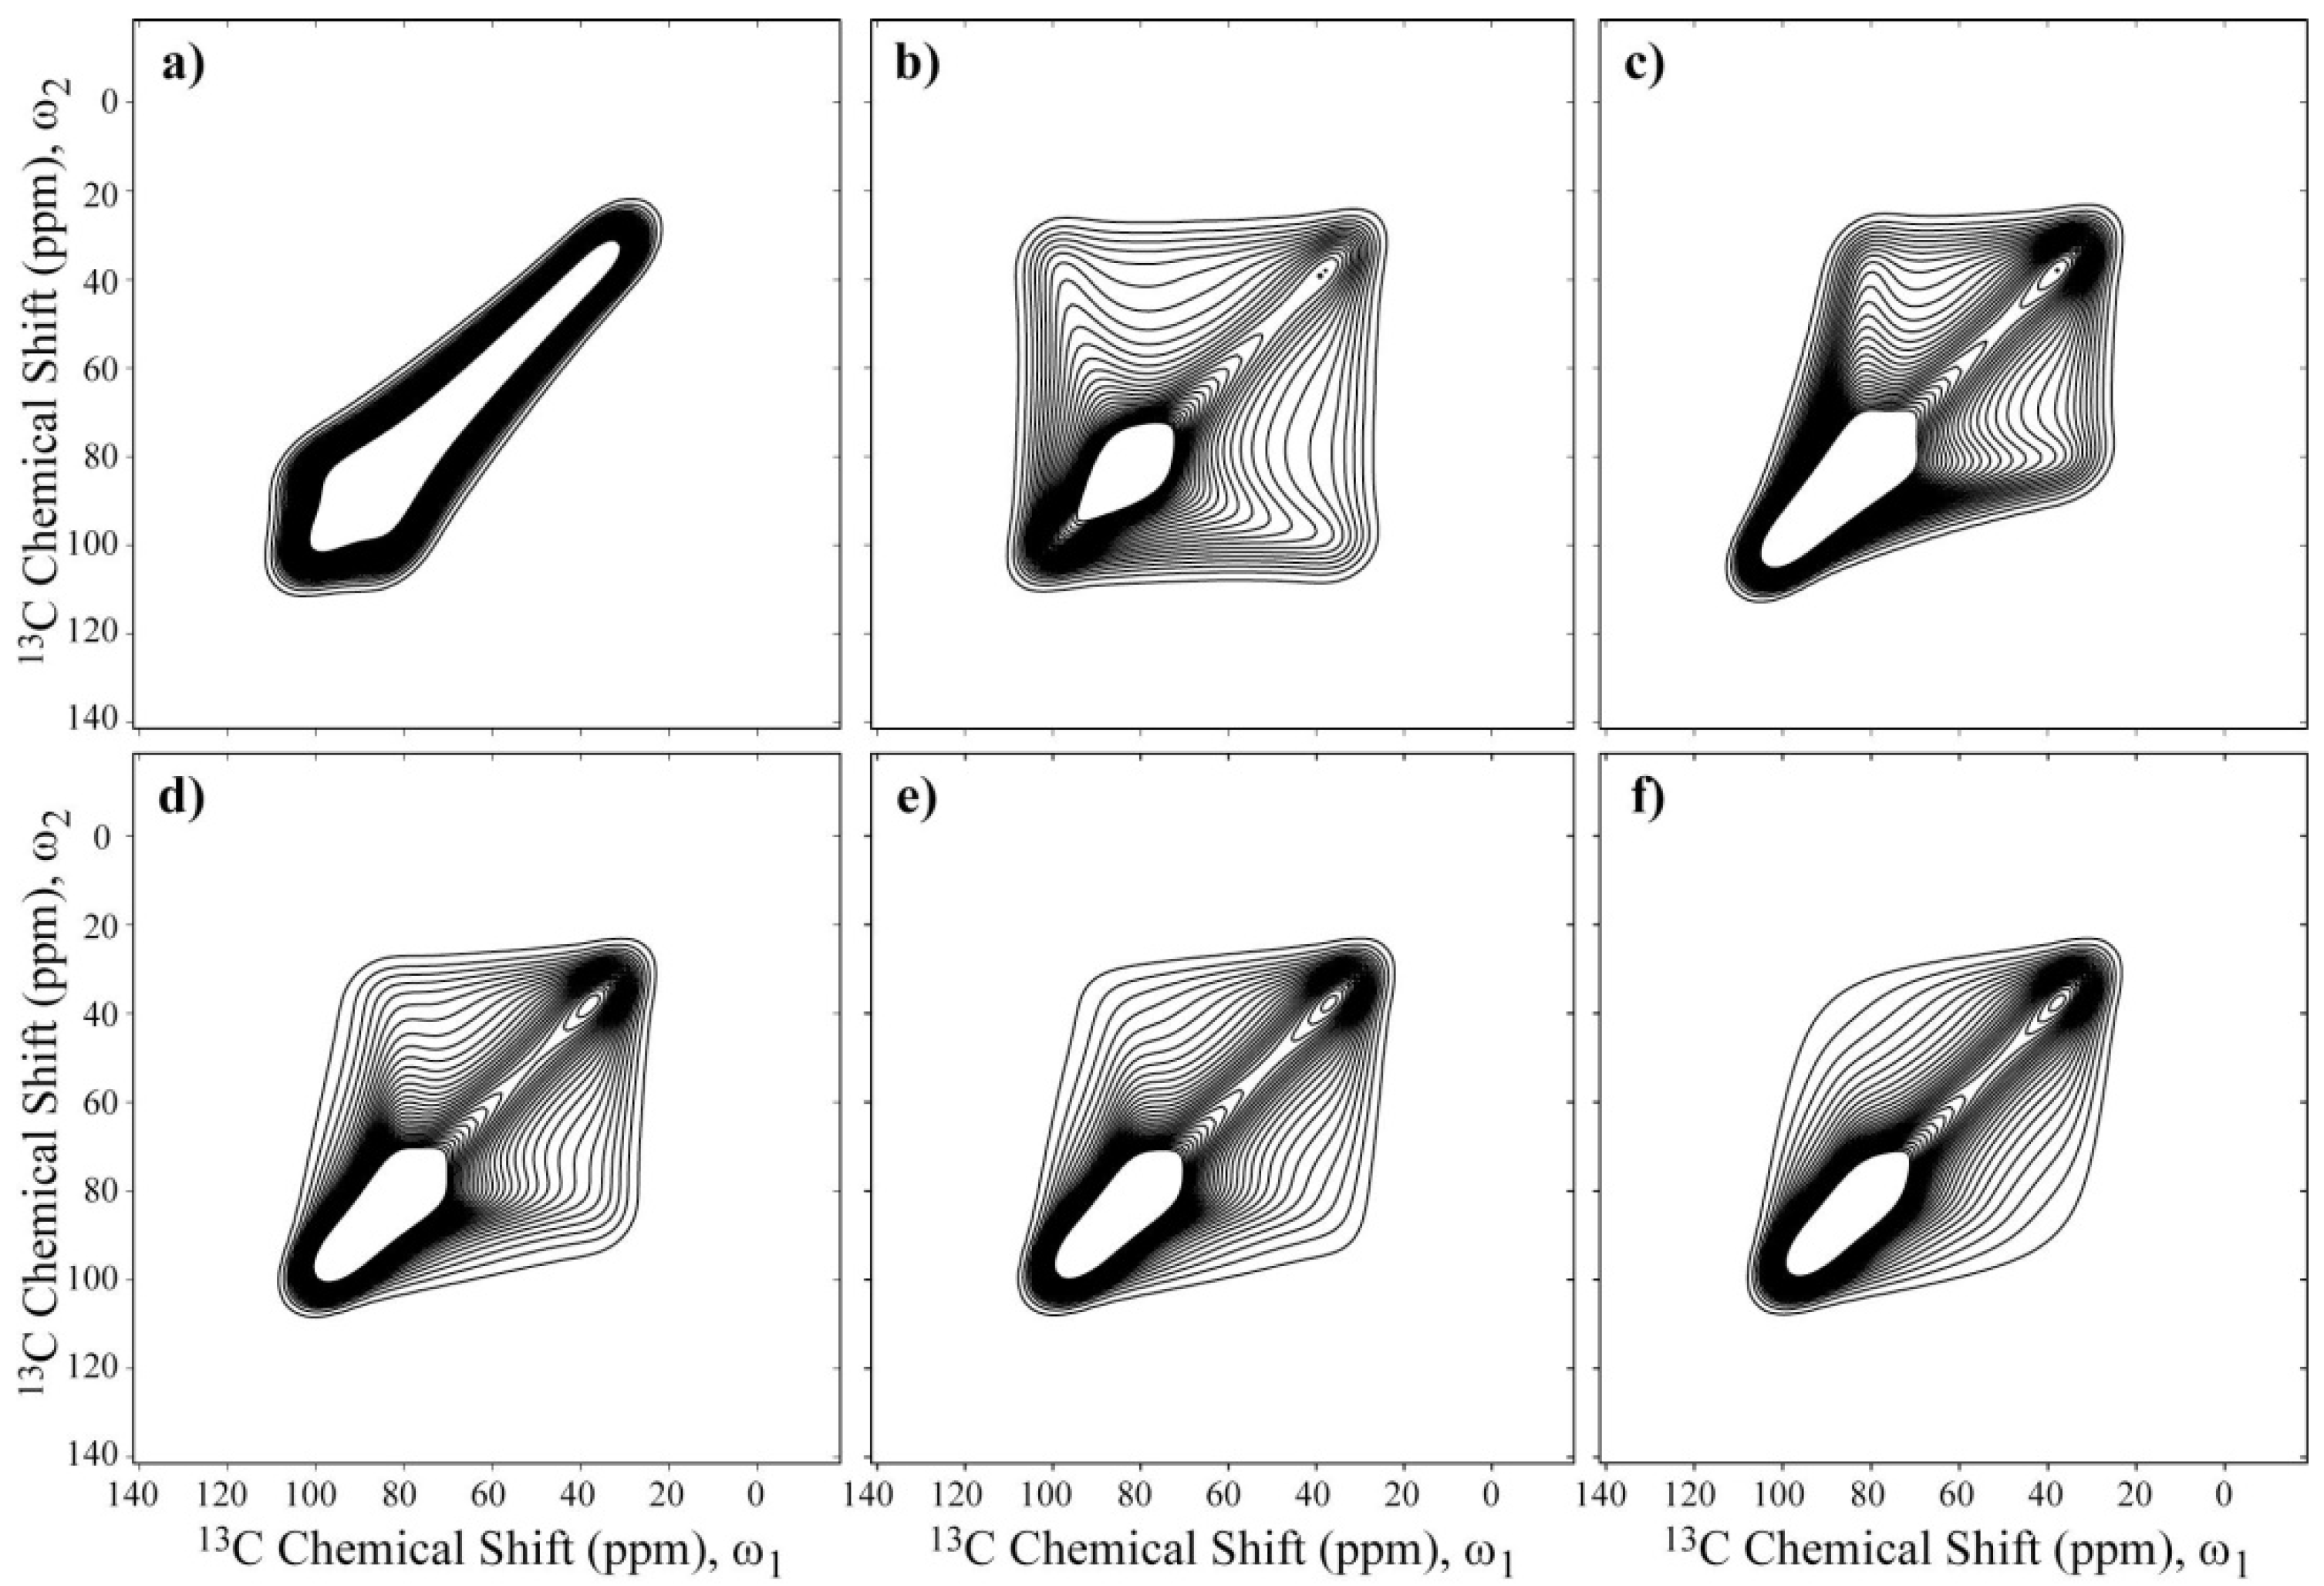
i.e., it depends on the motional amplitude and the rotation axis, which allows this parameter to be estimated from this experiment. This feature makes the 2D Exchange method particularly powerful in this work, where the primary objective is to determine the differences between the motional behaviors based on the composition of the intercalation compounds. Using the Euler angles for the PAS orientation of the chemical shift, we investigated the dependence of the rotational axis in the 2D Exchange Experiment by conducting a set of simulations considering a Gaussian distribution of rotation angles with root-mean-square angle of
σD = 60°. We considered rotations around the
σxx,
σyy, and
σzz principal axes, and around axes 30°, 40° and 50° apart from the
σzz principal axis. The results of these simulations are summarized in
Figure 5. As observed, the spectral shapes change considerably with the rotation axis, which may allow such axes to be identified from the 2D Exchange Spectrum.
Figure 5.
Simulations of 2D Exchange NMR spectra considering a Gaussian distribution of rotation angles with a root-mean-square angle of 60°. Rotations around the (a) σxx; (b) σyy; and (c) σzz principal axes, and around axes (d) 30°; (e) 40°; and (f) 50° apart from the σzz principal axis. In these cases, the angle β corresponds to the Euler angle that relates the z-axis of the local chain and the PAS of the chemical shift tensor.
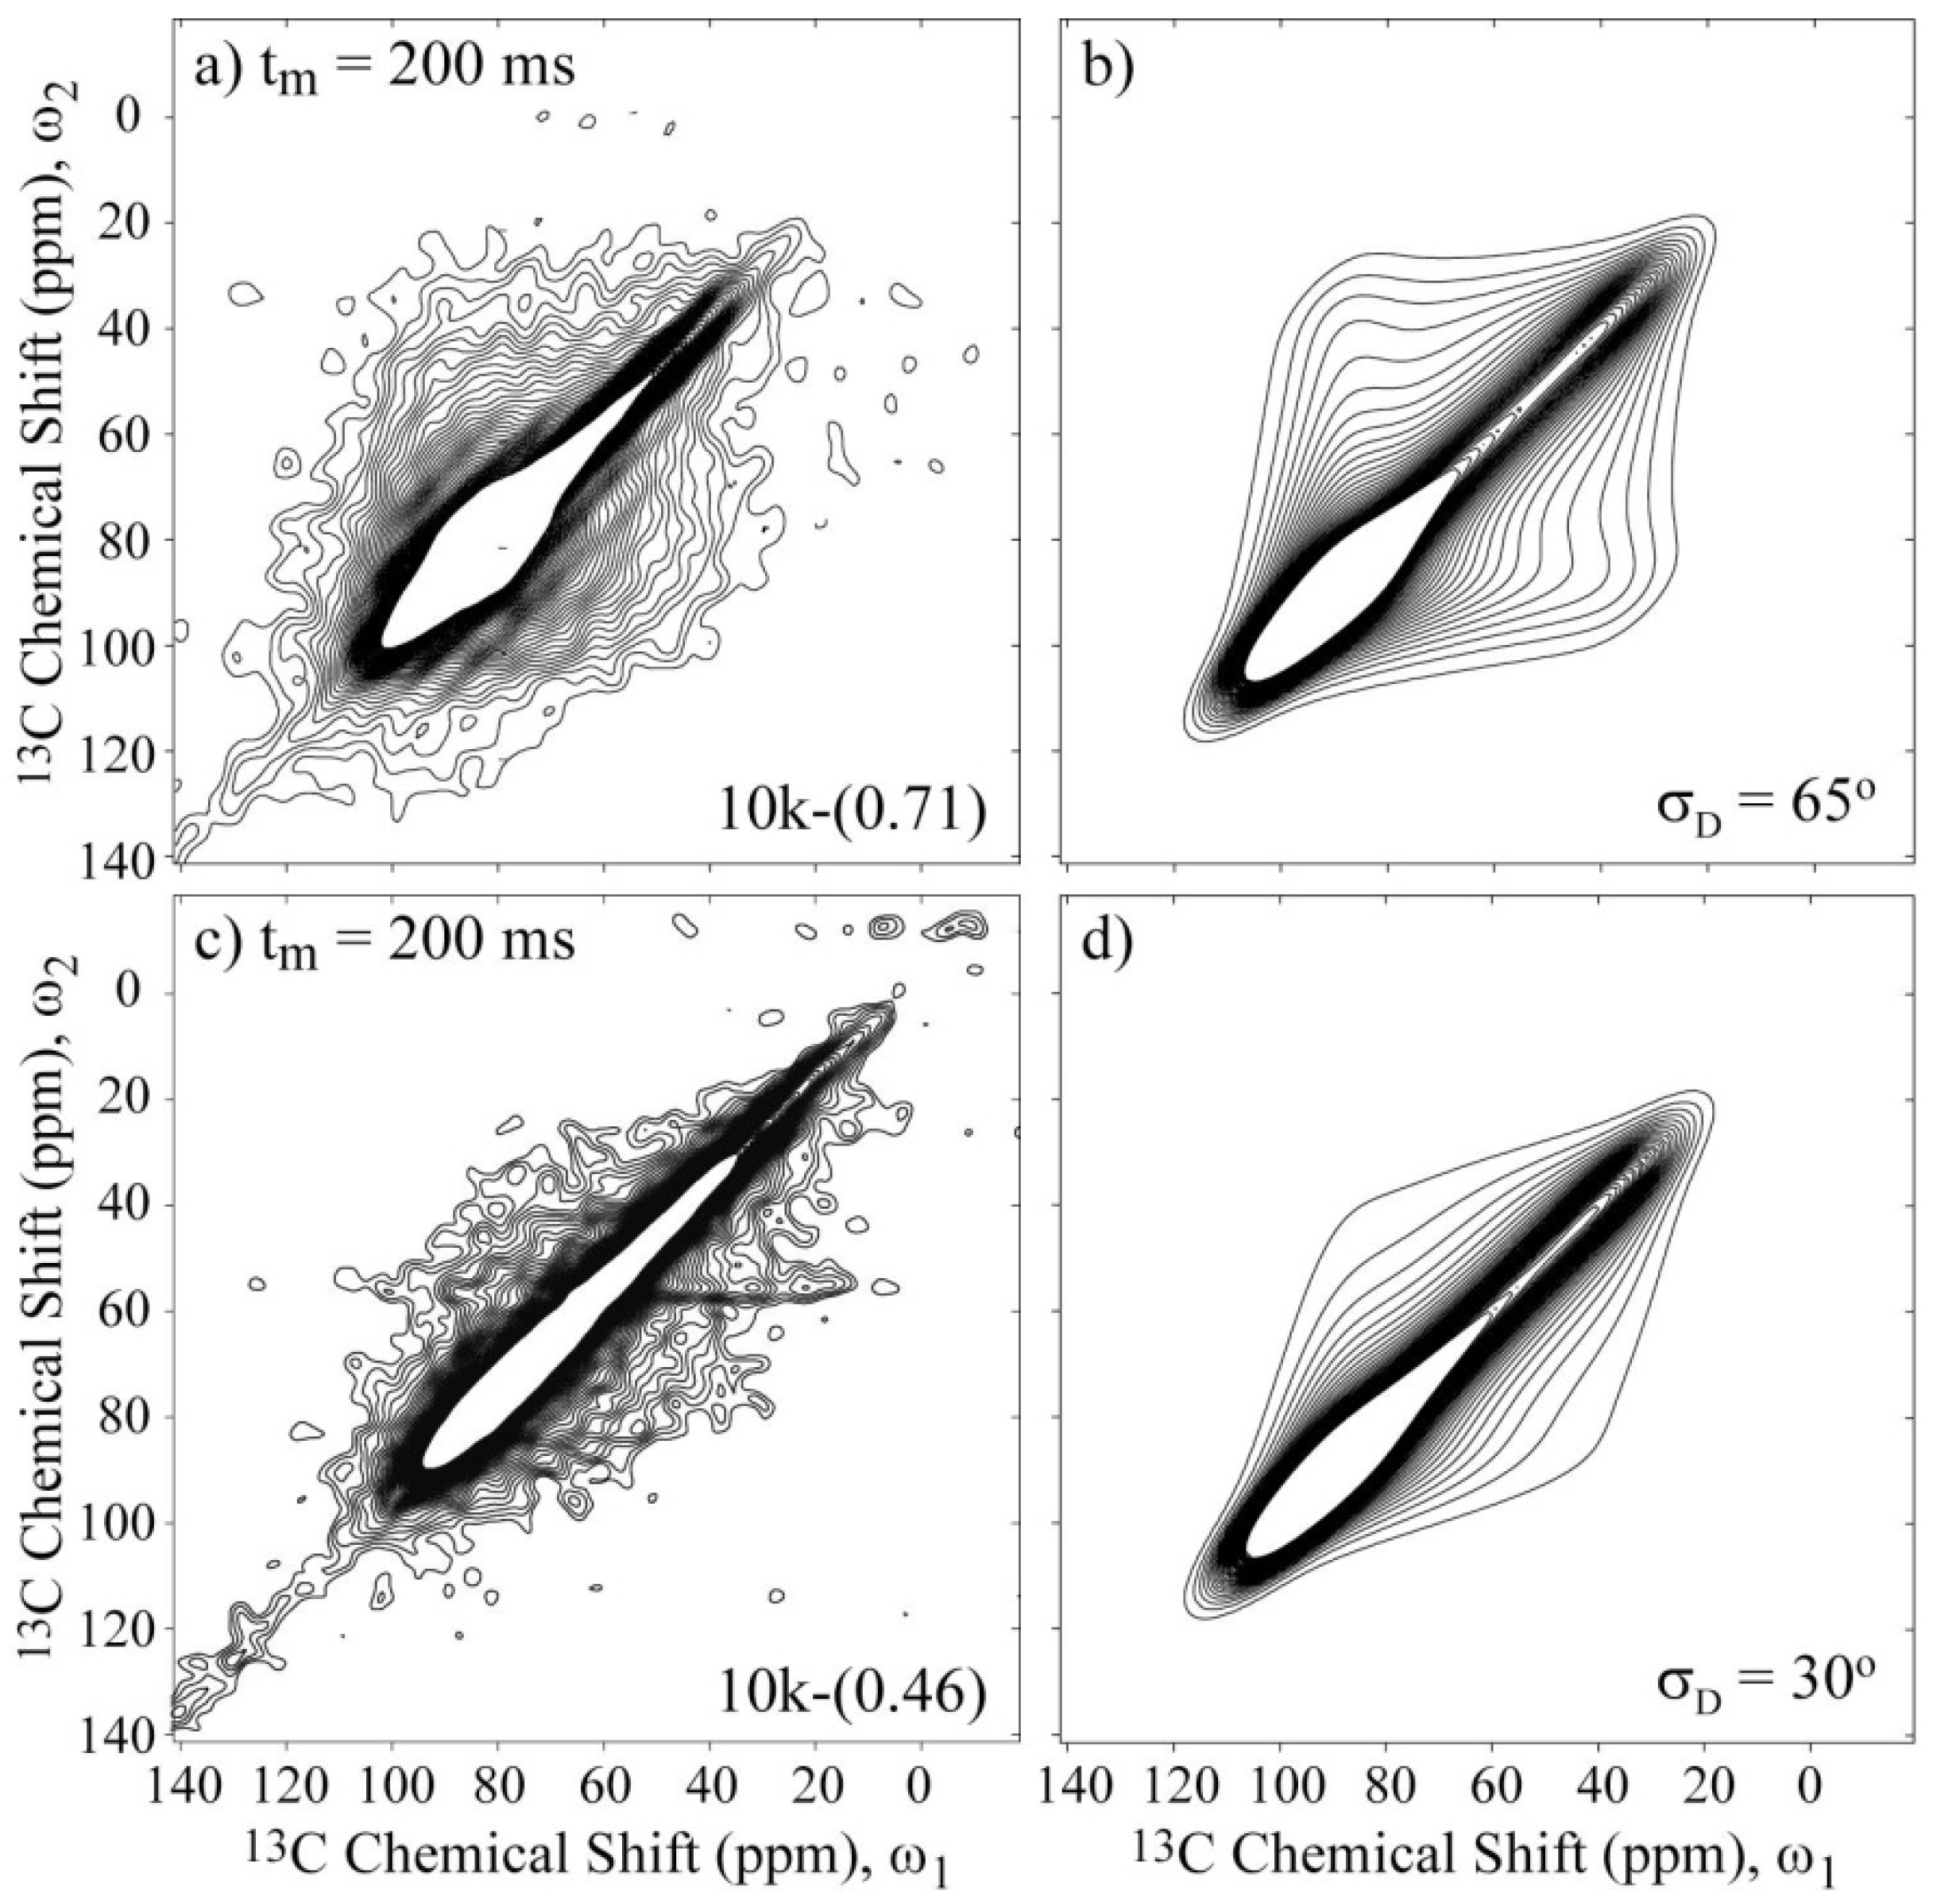
Figure 6a,c present the experimental 2D Exchange spectra for the 10k-(0.71) and 10k-(0.46) samples at 20 and 100 °C, respectively. When comparing the spectrum obtained for the 10k-(0.71) sample with the simulations presented in
Figure 5, it can be observed that this spectrum resembles the majority of the spectra that were simulated with the rotation axis apart from
σzz axis with an angle on the order of 40° or above. The absence of well-defined elliptical ridges in the spectrum reveals that the motion does not occur between well-defined sites, which can be interpreted as a direct consequence of the conformational disorder along the polymer chains. Additionally, due to the spatial hindrance induced by the intercalation in the clay galleries, a two-dimensional dynamics is expected for the PEO chains. Furthermore, it was shown in reference [
10] that PEO chains intercalated in clay assume an distorted helix conformation, exhibiting OC–CO gauche (~90%) and trans (10%) torsion angles. Thus, the motional model used was a rotation around the local helix axis. Considering that the
σzz principal axis is approximately equal to or greater than 40° displaced from the local chain axis, this result suggests that the molecular motions in the PEG intercalated in the clay is composed of rotations around the local chain axis of the distorted helix observed in reference [
10]. In fact, because molecular reorientations transverse to the clay plates planes are unlikely due to the space restriction and planar wobbling of the chains would require the motion of many segments, these rotations around the local helix axis, which are similar to a helical jump but involve distorted sites, appear more favorable. As depicted in
Figure 5, the spectra in
Figure 5c,d are indistinguishable, showing that the uncertainty in the local axis orientation is about 20°. This is certainly a big uncertainty, but given the aforementioned features of the system reported previously, it seems reasonable to assume this geometry. Thus, the above identification of the rotational axis was performed by basically looking at the symmetry of the 2D Exchange spectrum. However, there are still some significant differences between the experimental and the simulated spectra. As previously mentioned, these differences might be attributed to the conformational disorder of the PEG chains, which was not considered in the simulations.
However, it was demonstrated that for systems with considerable configurational and conformational disorder, executing uniaxial reorientations on the reorientation angle distribution,
R(Δ
φ), which fully determines the exchange intensity, is the autocorrelation function of the distribution of angular positions
in an ensemble of equivalent segments [
36]. Thus, for a segment that has a probability
p(
φ1) of starting its motion at an orientation
φ1 and whose corresponding reorientation angle distribution is
p(Δ
φ +
φ1),
R(Δ
φ) is obtained as follows:
For a specific motional amplitude,
φD,
is a box function with equal probability between
φD and
φD, which leads to a triangular
R(Δ
φ) [
36]. Then, to consider the configurational and conformational disorder, a Gaussian shaped amplitude distribution
A(
φD) is assumed and the final
R(Δ
φ) is obtained by the summation of the triangular
R(Δ
φ) function for each
φD.Figure 6b presents the simulated spectrum obtained using this
R(Δ
φ) obtained for a motional amplitude of
σD = 65° and a CSA tensor orientation of (90°, 30°, and 90°). As observed, the agreement between the experimental and simulated spectra is considerably improved; the conformation disorder is significant in this system, as previously suggested in reference [
10]. Also note that a reorientation angle distribution given by Equation (1) has a high intensity at small angles that decays for higher angles. Thus, it can also be a good model for a system that has some segments that exhibit small angle motion and other segments that exhibit high angle reorientations. Notice that, as usual in Exchange NMR experiments, this result is also equivalent to motions that occur with a large distribution of correlation times, where segments that move outside or in the limits of the dynamic range detected by Exchange NMR (ms–s) contribute as if they were rigid or exhibit small angle motions [
37,
38]. In both interpretations, the models fit with the PEO-montmorillonite anchoring model proposed in references [
18,
19,
20,
21,
22]. Specifically in tightly confined environments, it may be difficult for long-chain molecules to adopt their lowest energy conformation, and they expect to find low-amplitude reorientation enhanced due to inefficiencies in packing and lack of access to low energy conformations. However, these effects, which are expected to lead to enhanced dynamics, must be balanced by the interactions of the organic layer with the inorganic surface. The attractive interactions that stabilize the interface tend to pin the polymer to the surface at multiple sites along its backbone, and these pinned sites inhibit the large-angle reorientation of the polymer in these slit pores. Therefore, despite the differences between the PEG/Na
+-hectorite and PEO/Li
+-montmorillonite intercalation compounds, which includes both cation capacity exchange and the interlayer cations, we expect to observe similar anchoring effects for the PEG/Na
+-hectorite nanocomposite. In the anchoring model, the cations on the surface of the clay serve as pinning points for the oxides in PEG, where multiple oxygen atoms try to associate with each such charge, and as a result of geometric constraints in the vicinity of the pinning, the layer of PEG closest to the surface is (i) distorted with respect to its local conformation compared to the bulk and (ii) dynamically inhibited compared to bulk. Furthermore, for those PEO/PEG segments which are not pinned to a surface, the awkwardness of packing in the vicinity of the confining wall leads to an effective density gradient and somewhat inefficient packing, which leads to increased dynamics, at least relative to the bulk models.
Figure 6.
Experimental and simulated 2D Exchange spectra for the (
a),(
b) 10k-(0.71) sample at T = 20 °C and (
c),(
d) the 10k-(0.46) sample at T = 100 °C. The simulations were performed assuming rotations around the local chain axis with amplitudes distributed as Gaussian functions with rms values
σD indicated in the figures. The orientation of the chemical shift tensor was assumed to be the same as that of crystalline PEG, and the conformational disorder was considered by calculating the reorientation angle distribution from the rotation angle distribution according to reference [
36]. The temperatures were selected to ensure that the samples were in the same dynamic regime; see
Figure 3a.
Using the above model and procedure to perform the simulations, we investigated the influence of the chain lengths and packing (single- or double-layered) on the geometry of the slow molecular motions.
Figure 6c,d present the experimental and simulated 2D Exchange spectra for the 10k-(0.46) sample. In this case, the amplitude of the motion is reduced to
σD = 30°, which is considerably less than the value obtained for the 10k-(0.71) sample. This result indicates that the direct interaction of the polymer with both clay platelets has a significant influence on the PEG dynamics, which most likely restricts the motion of the chain near the surface that consequently increases the contribution of conformations associated with small angle motion in the reorientation angle distribution or the number of anchoring sites.
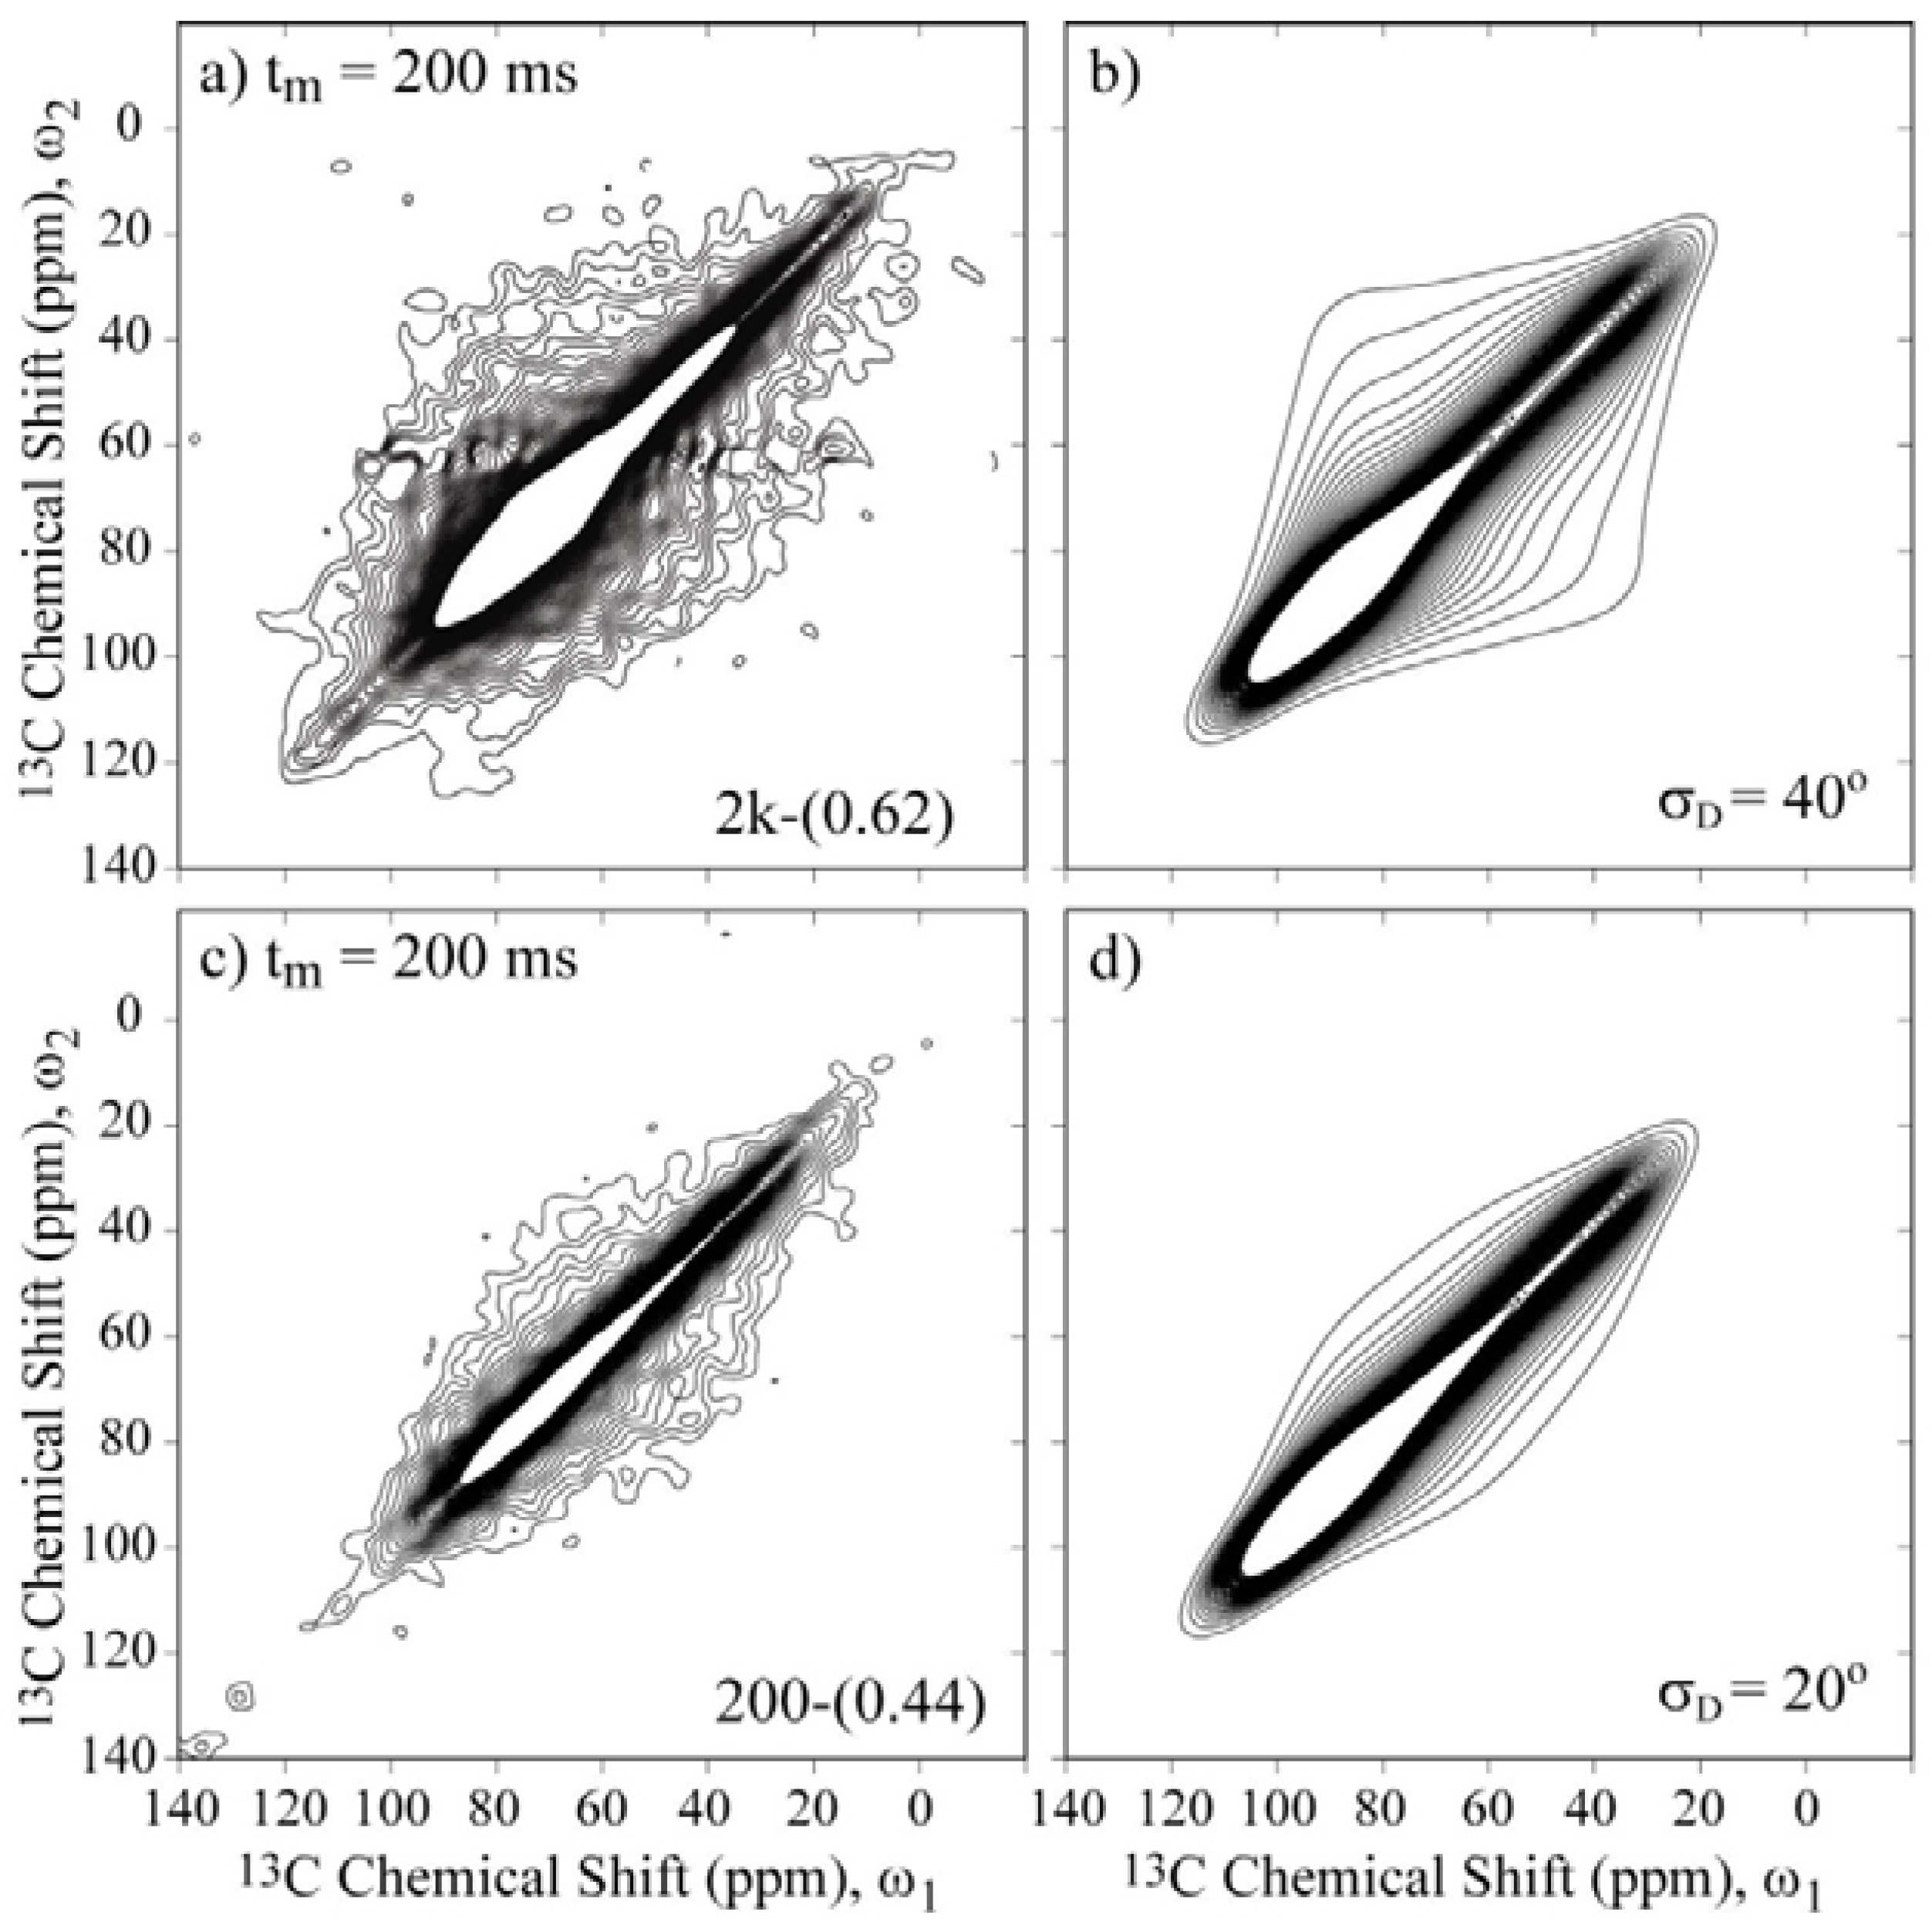
Figure 7 presents the 2D Exchange spectra of the 200-(0.44) and 2k-(0.62) samples. These results allow the determination of how the chain length affects the motional amplitudes in the single- and double-layer configurations. By comparing
Figure 6a with
Figure 7a and
Figure 6c with
Figure 7c, it is evident that the overall amplitude of the motions increases with the molecular weight. Based on the anchoring model [
18,
19,
20,
21,
22], this result indicates that the anchoring points are hindering the PEG motion because this effect is more evident for smaller molecular weights, where the restriction to the motion is more effective for extending the full polymer length, and for single-layer configurations, where an increase of anchoring points is expected due to the interaction of the polymer chain with both clay layers.
Figure 7.
Experimental and simulated 2D Exchange spectra for the (
a),(
b) 2k-(0.62) sample at T = −20 °C and the (
c),(
d) 200-(0.44) sample at T = 10 °C. The simulations were performed assuming rotations around the local chain axis with amplitudes distributed as Gaussian functions with rms values
σD indicated in the figures. The orientation of the chemical shift tensor was assumed to be the same as that of crystalline PEG, and the conformational disorder was considered by calculating the reorientation angle distribution from the rotation angle distribution according to reference [
36]. The temperatures were selected to ensure that the samples were in the same dynamic regime.
To confirm the model proposed above, we performed Centerband-Only Detection of Exchange (CODEX) [
24,
25] experiments and used the same model to fit the experimental data. This technique allows the slow molecular motions in a sideband-free 1D MAS spectrum to be identified and characterized. More specifically, the MAS spectrum measured after the application of the CODEX pulse sequence [
24,
25] depends on the difference of the CSA dependent MAS phases (recoupled by a REDOR like train of π pulses), which are encoded during two evolution periods with a duration of
Ntr that flanks a mixing period
tm. To avoid intensity decay due to relaxation during the evolution and mixing periods and to remove the non-mobile part of the signal, the CODEX spectral intensities are usually subtracted and normalized by the intensities of a reference spectrum
S0, which is acquired with the same pulse sequence but with a mixing time that is considerably shorter than the motion correlation times; therefore, no motion effects are codified in this spectrum. The result is a pure-exchange intensity Δ
S = (
S0−
S)/
S0, where the
tm dependence and the
Ntr provide the motion correlation function and the motional amplitudes, respectively.
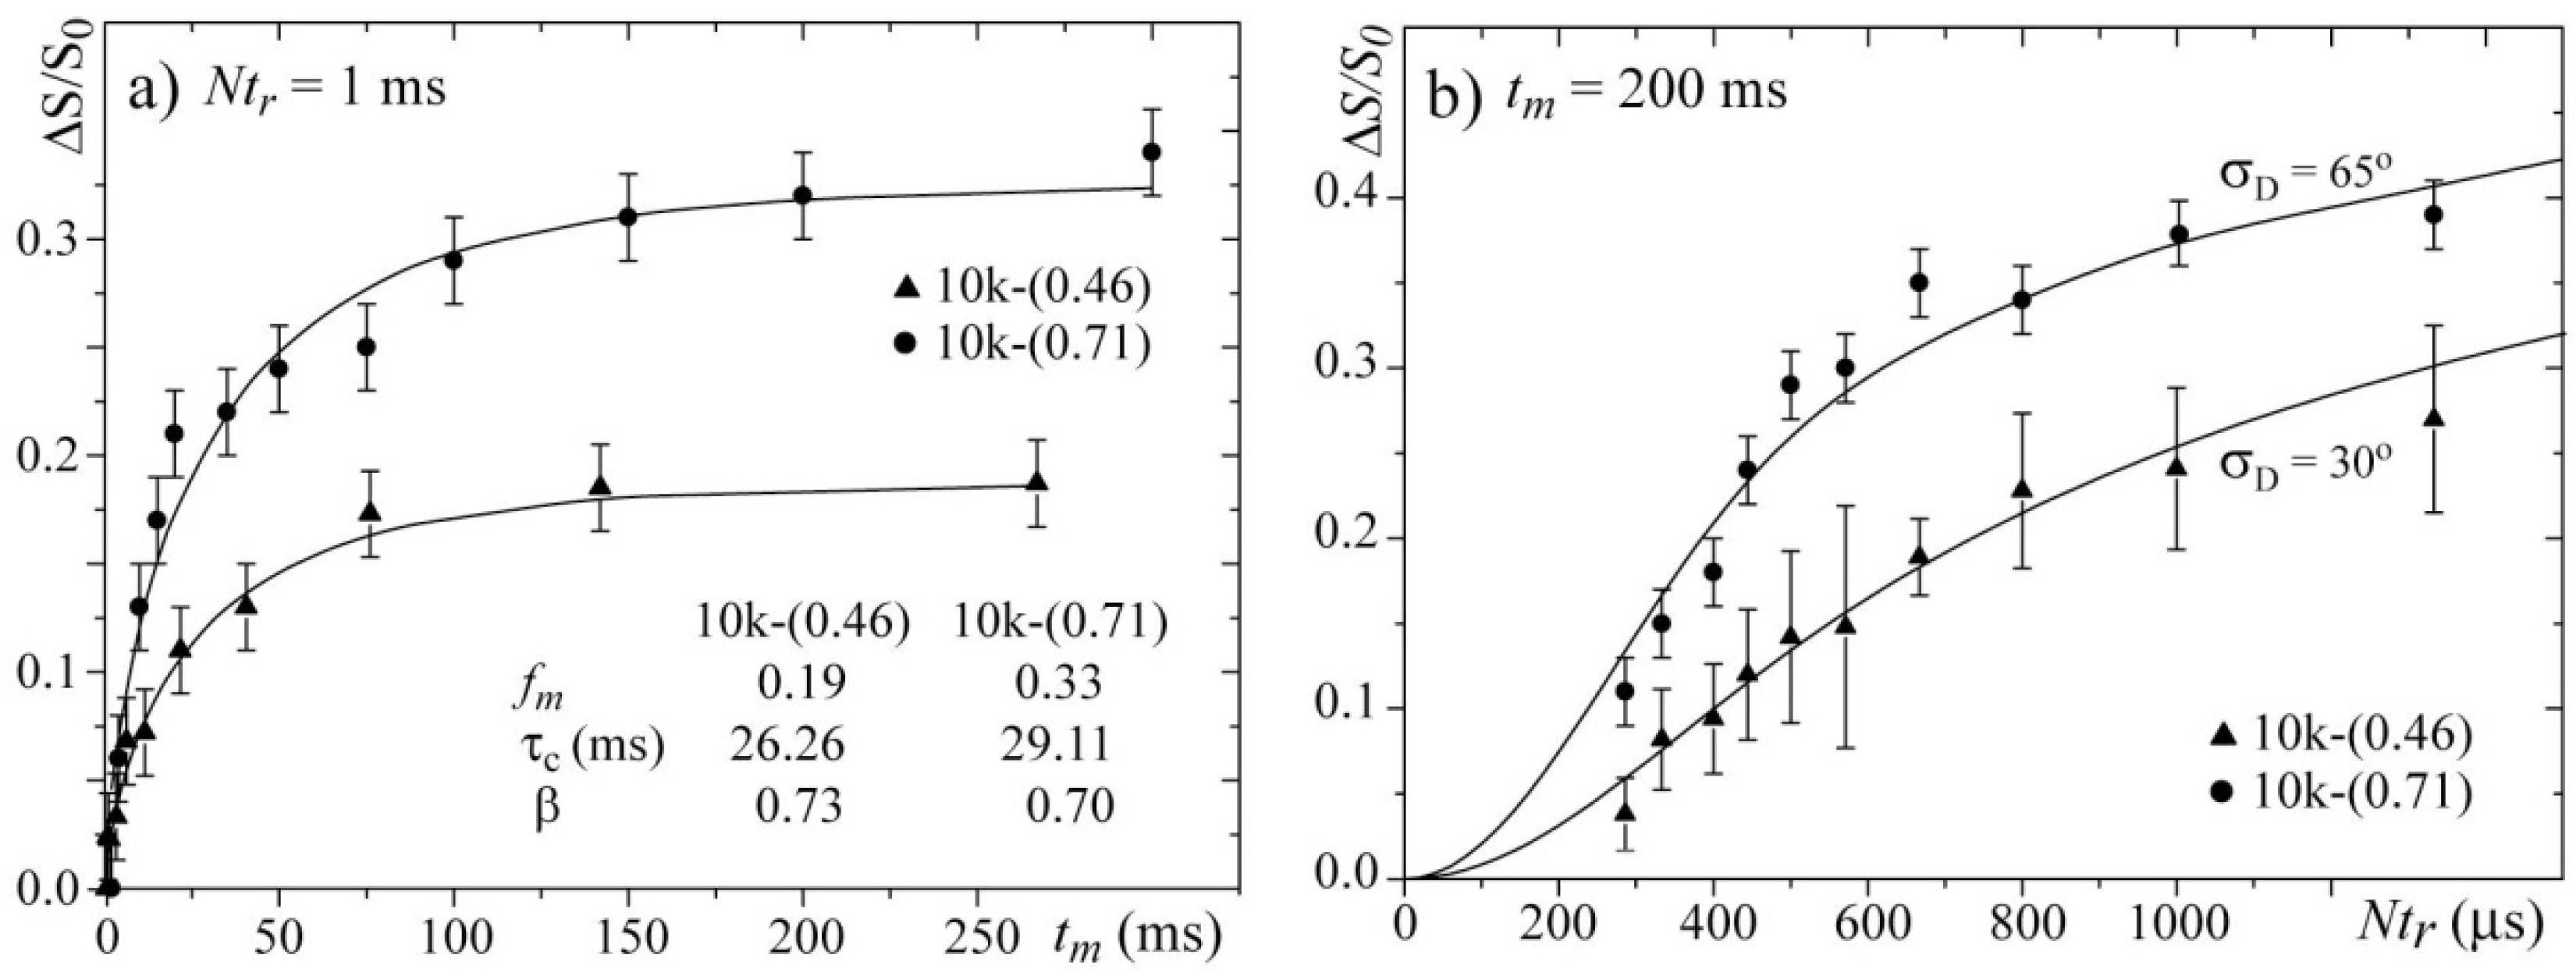
Figure 8a presents the
tm-dependences of the normalized pure-exchange CODEX intensities
for the 10k-(0.46) and 10k-(0.71) samples. Both curves were fit using stretched exponential functions. Note that the parameter
τc and the stretching parameters
β obtained from the
tm-dependence are very similar for both samples. This result confirms that by selecting the temperatures such that the line widths are motion narrowed to similar values, the dynamics of the chains in both samples occur with similar correlation times,
i.e., they are occurring in comparable motional regimes.
Figure 8b presents the
Ntr-dependences for the 10k-(0.46) and 10k-(0.71) samples and the corresponding simulations. In the simulation, the same model and parameters used for simulating the 2D Exchange spectra shown in
Figure 6 were used. For both samples, the agreements between the experimental and simulated curves are reasonably good. The differences between the
Ntr CODEX curves of both samples are clear, which confirms that the amplitude of the rotations is smaller for the sample with the single-layer intercalation. In fact, the results obtained by the CODEX might appear redundant because the 2D Exchange experiments provided the same information, but this is not totally true. 2D Exchange is a non-normalized experiment, and a decrease in the motion amplitude can be confused with a decrease in the fraction of segments detected in the time window probed by the experiment (mobile fraction). As an example, let us consider a system were the motion amplitude is sufficiently high to produce a 2D Exchange spectrum with an amplitude in all spectral ranges. Nevertheless, for diffusive types of molecular motion, the intensities in the wings of the 2D Exchange spectrum (spectral regions well off diagonal) are usually considerably less than in the near diagonal regions. Consequently, if only a small fraction of the molecular segments participate in the exchange process, even for high angle motions, the intensity in the wings in the 2D Exchange spectrum might be below the noise level, which may give the impression that the motion amplitude is smaller than it actually is. This behavior may bias our interpretation concerning the differences in the motional amplitudes because the mobile fraction is also considerably different among the samples. Here, the CODEX results play their major role. Because of the normalization, in the CODEX experiments, the information about the mobile fraction and the motional amplitudes are uncoupled,
i.e., while the plateau in the
Ntr dependence provides the
fm, the slope of such curve depends on the rotation angle. Therefore, the clear difference in the slope of the curve shown in
Figure 8b reveals that there is indeed a difference in the motional amplitudes of the two samples, which validates the analysis and interpretations of the 2D Exchange experiments presented above. Finally, we would like to point that, due to the aforementioned reasons, a precise evaluation of reorientation angle and distribution is difficult to be done, so the proposed motion geometry was based on both the experimental results and the unique characteristics of the system. However, most of the general conclusions obtained by comparing the different samples are indeed model free, being the simulations done to quantify the results and establish the most probable (in our view) picture for the motion in these systems.
Figure 8.
(a) Mixing time tm and (b) evolution time Ntr-dependences of the CODEX normalized intensities for the 10k-(0.71) sample at T = 20 °C and the 10k-(0.46) sample at T = 100 °C.
Figure 8.
(a) Mixing time tm and (b) evolution time Ntr-dependences of the CODEX normalized intensities for the 10k-(0.71) sample at T = 20 °C and the 10k-(0.46) sample at T = 100 °C.

