Quantum Dots as Multifunctional Materials for Tumor Imaging and Therapy

Abstract
:1. Introduction
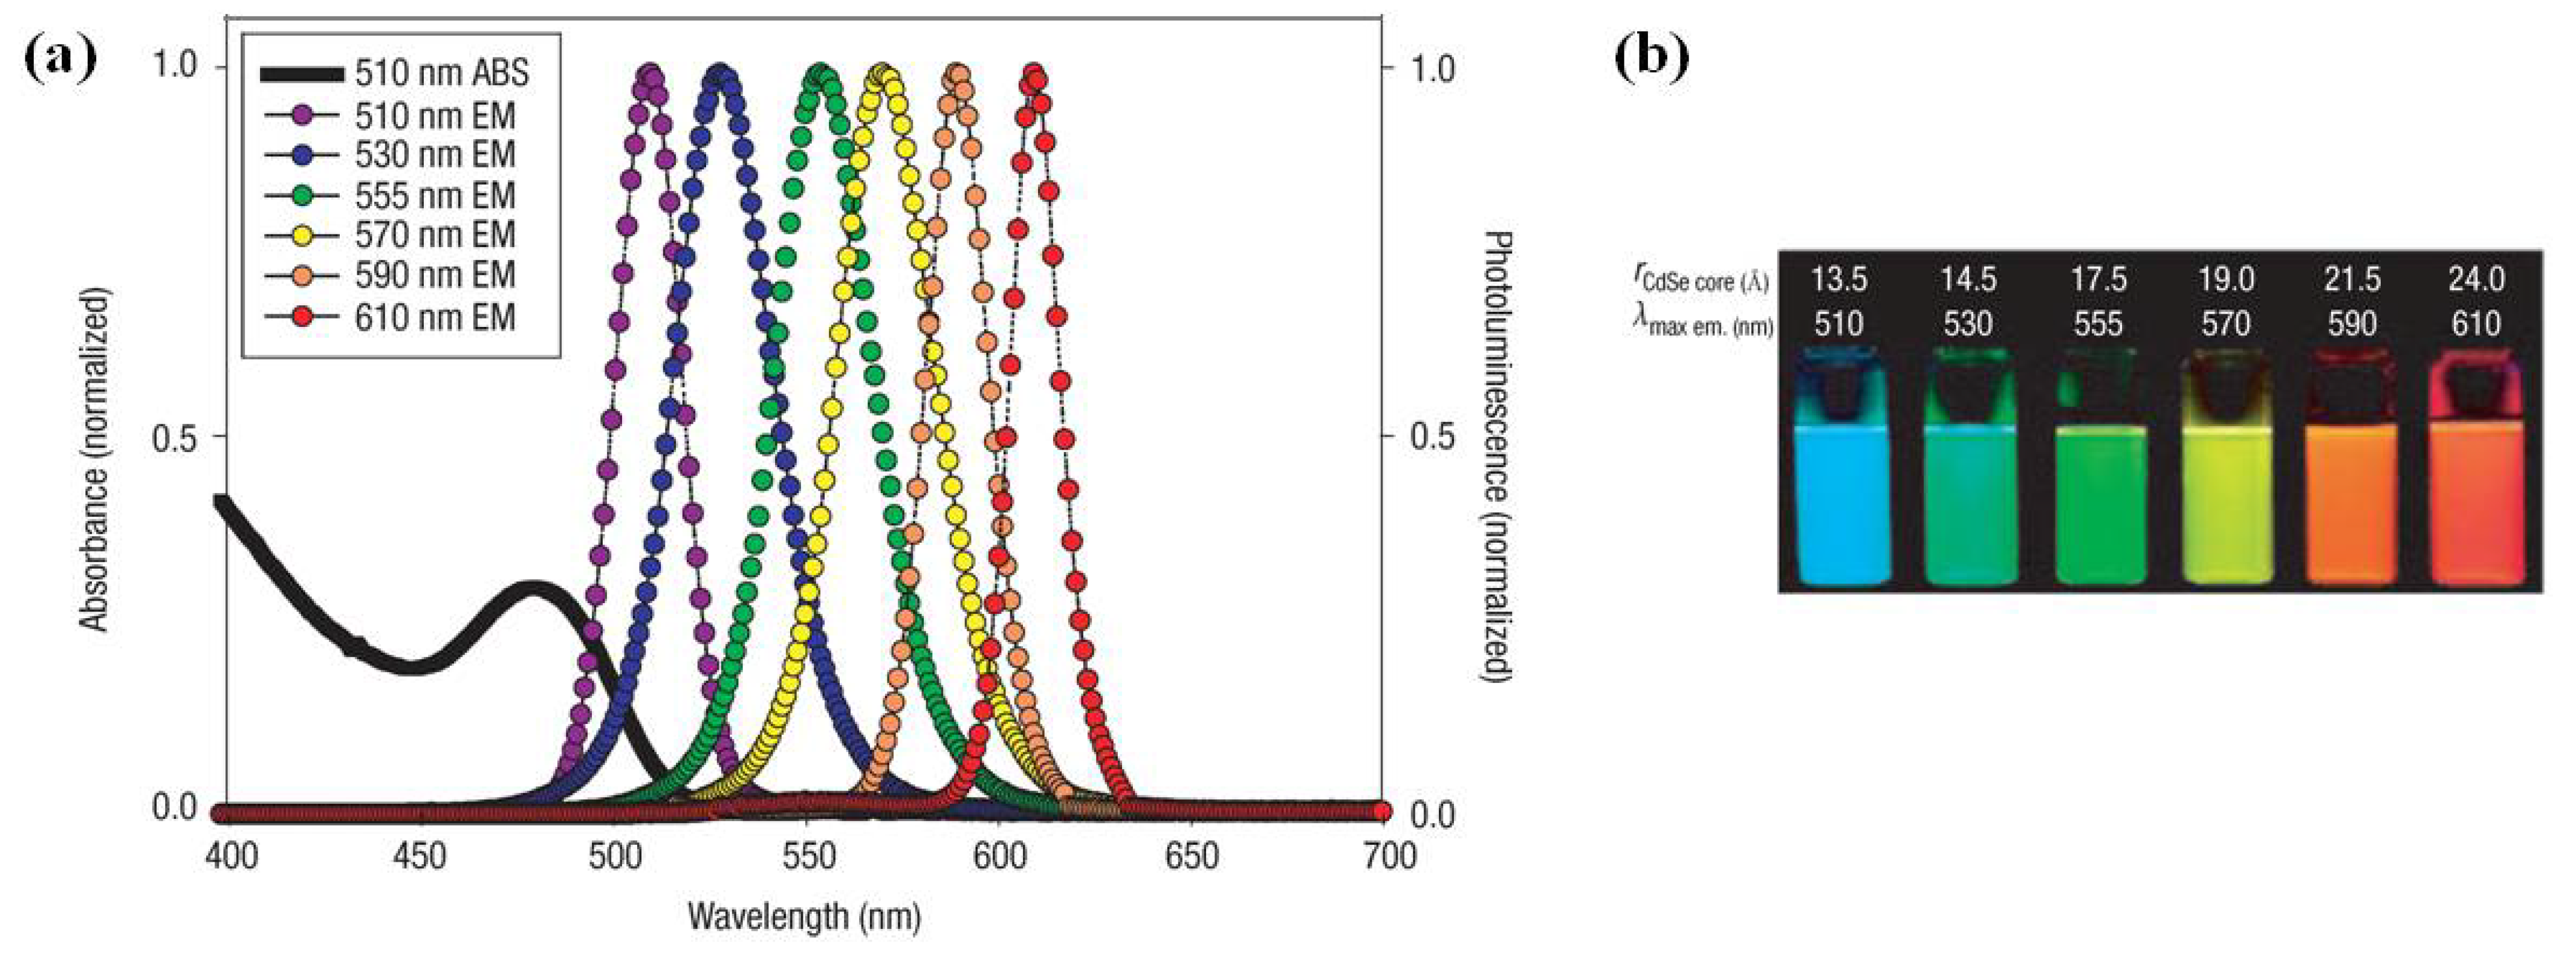
1.1. Quantum Dots

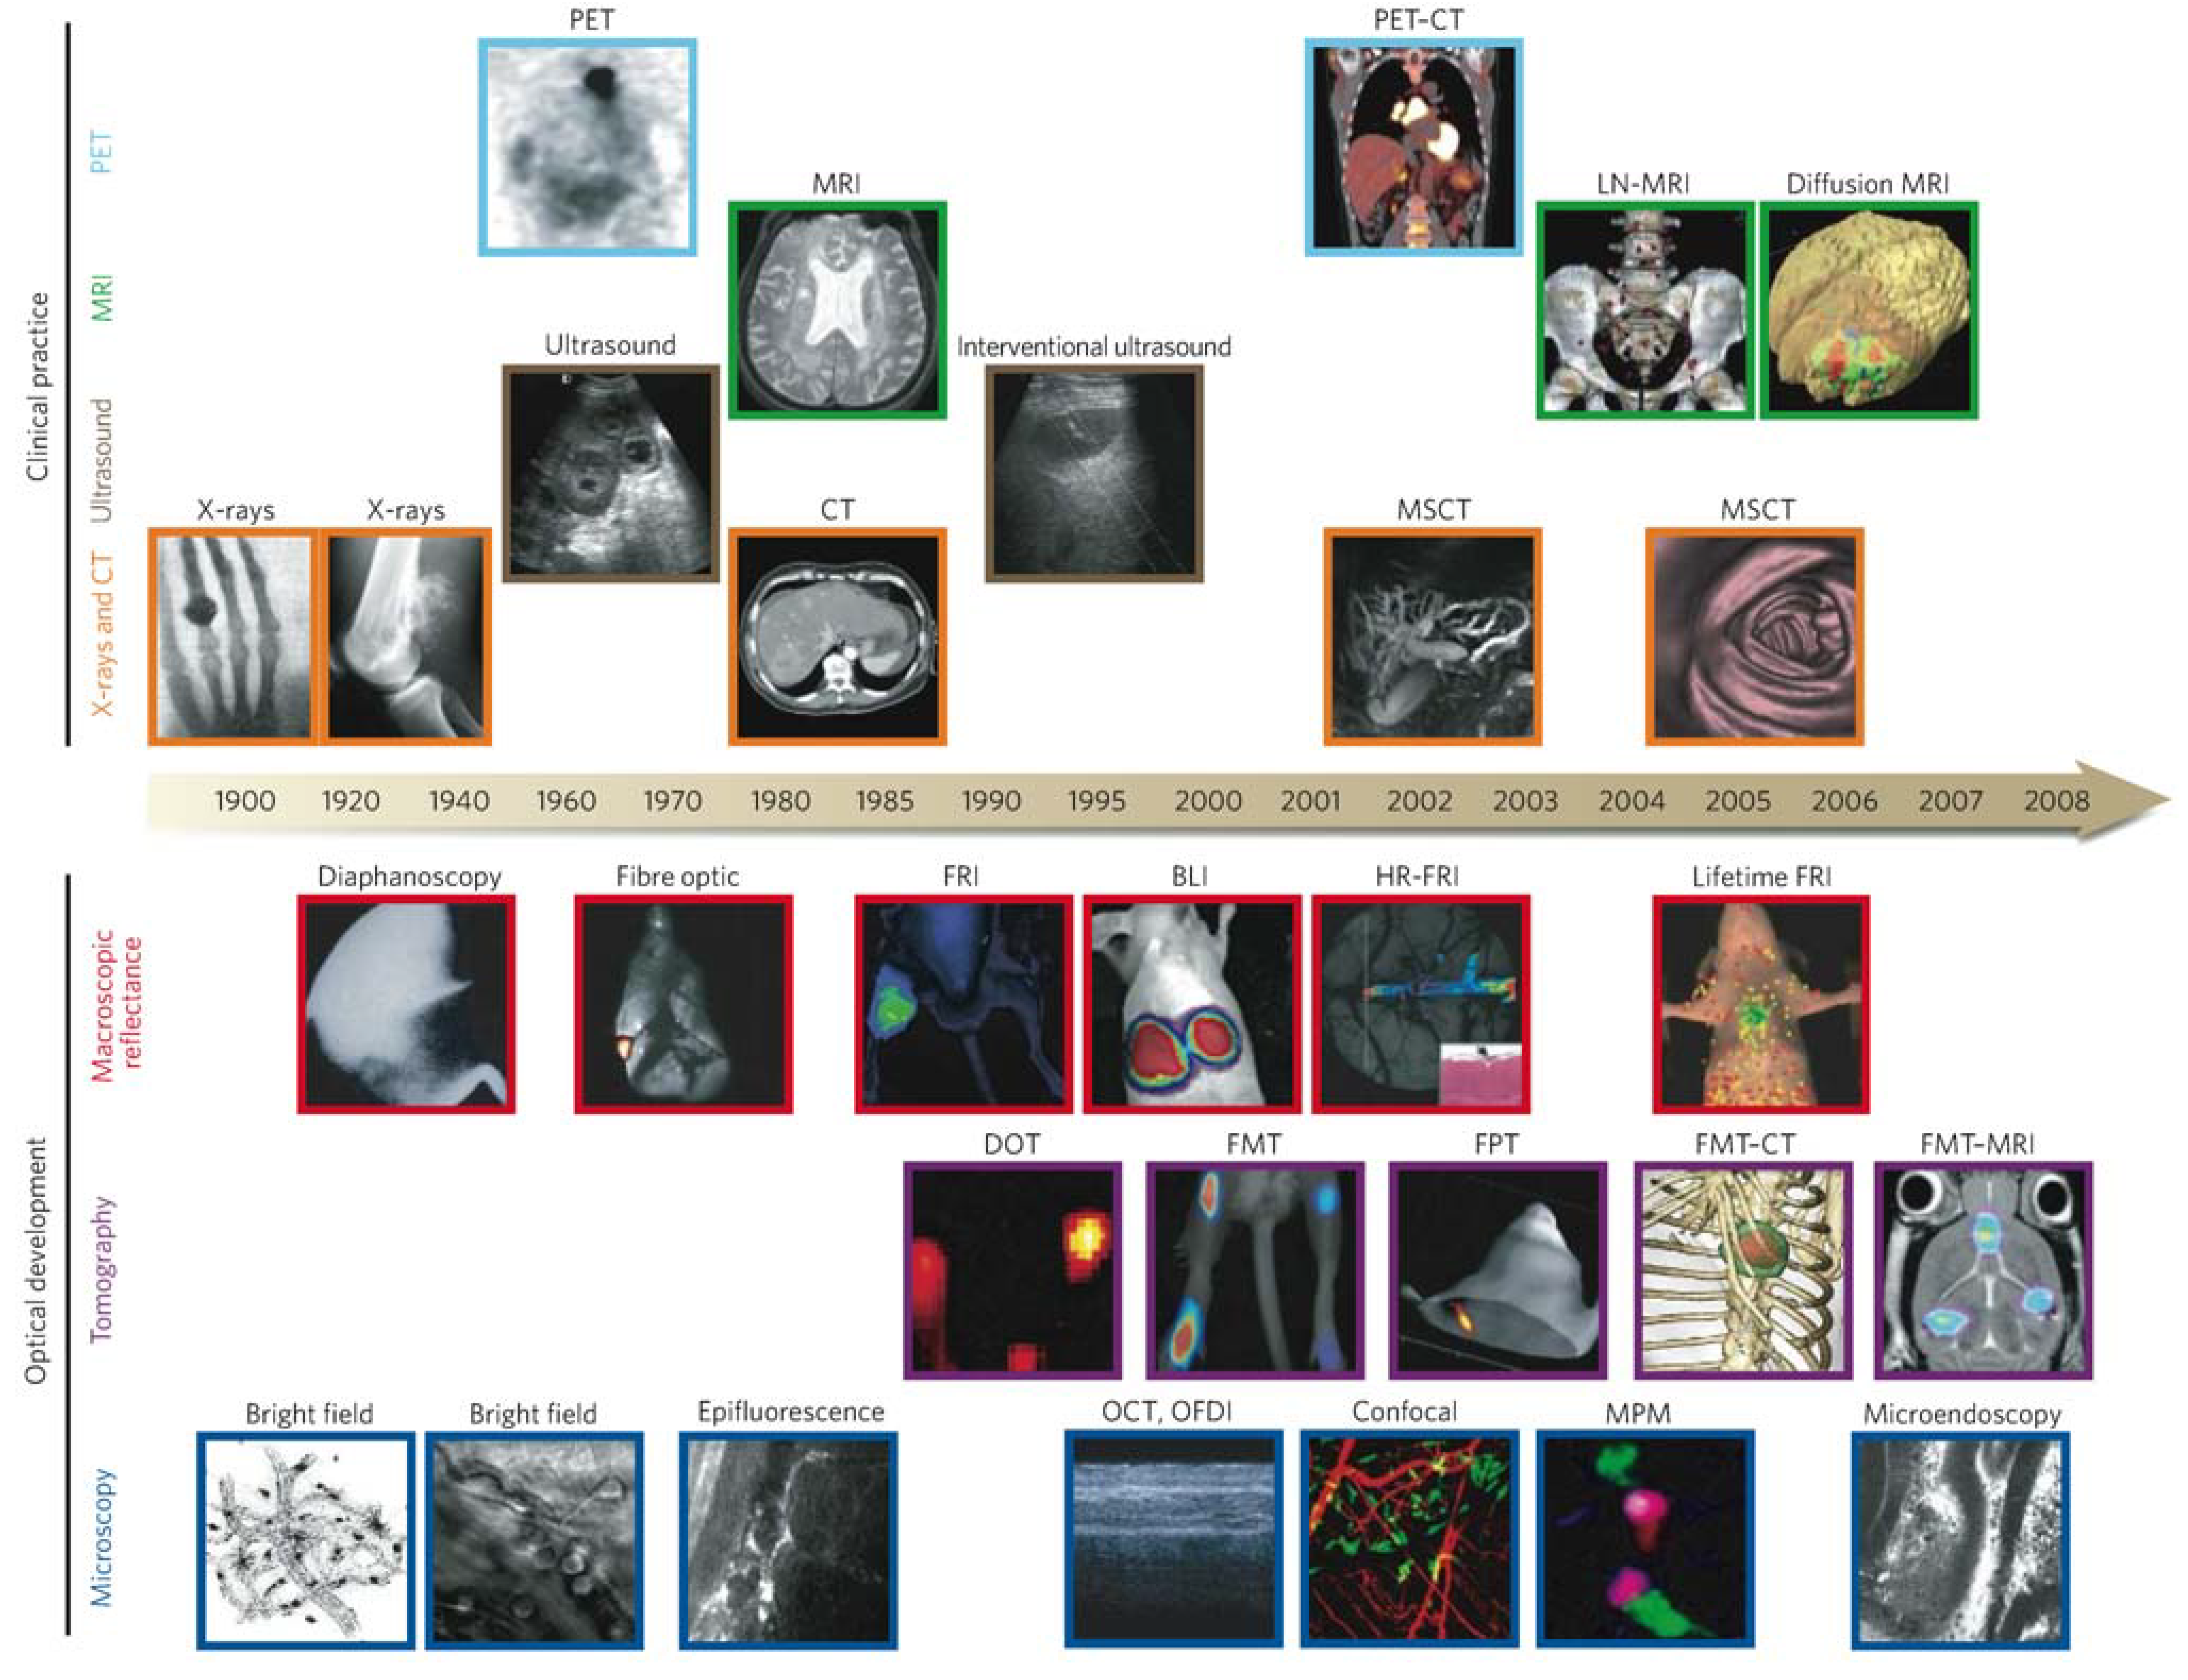
1.2. Tumor Imaging

| Technique | Resolution * | Depth | Time † | Quantitative ‡ | Multi-channel | Imaging agents | Target | Cost § | Main small-animal use | Clinical use |
|---|---|---|---|---|---|---|---|---|---|---|
| MRI | 10–100 μm | No limit | Minutes to hours | Yes | No | Paramagnetic chelates, magnetic particles | Anatomical, physiological, molecular | $$$ | Versatile imaging modality with high soft-tissue contrast | Yes |
| CT | 50 μm | No limit | Minutes | Yes | No | Iodinated molecules | Anatomical, physiological | $$ | Imaging lungs and bone | Yes |
| Ultrasound | 50 μm | cm | Seconds to minutes | Yes | No | Microbubbles | Anatomical, physiological | $$ | Vascular and interventional imaging || | Yes |
| PET | 1–2 mm | No limit | Minutes to hours | Yes | No | 18F-,64Cu- or 11C-labelled compounds | Physiological, molecular | $$$ | Versatile imaging modality with many tracers | Yes |
| SPECT | 1–2 mm | No limit | Minutes to hours | Yes | No | 99mTc- or 111In-labelled compounds | Physiological, molecular | $$ | Imaging labelled antibodies, proteins and peptides | Yes |
| Fluorescence reflectance imaging | 2–3 mm | <1 cm | Seconds to minutes | No | Yes | Photoproteins, fluorochromes | Physiological, molecular | $ | Rapid screening of molecular events in surface-based disease | Yes |
| FMT | 1 mm | <10 cm | Minutes to hours | Yes | Yes | Near-infrared fluorochromes | Physiological, molecular | $$ | Quantitative imaging of fluorochrome reporters | In development |
| Bioluminescence imaging | Several mm | cm | Minutes | No | Yes | Luciferins | Molecular | $$ | Gene expression, cell and bacterium tracking | No |
| Intravital microscopy ¶ | 1 μm | <400–800 μm | Seconds to hours | No | Yes | Photoproteins, fluorochromes | Anatomical, physiological, molecular | $$$ | All of the above at higher resolutions but limited depths and coverage | In development # |
1.3. Tumor Therapy
2. QDs for Tumor Imaging
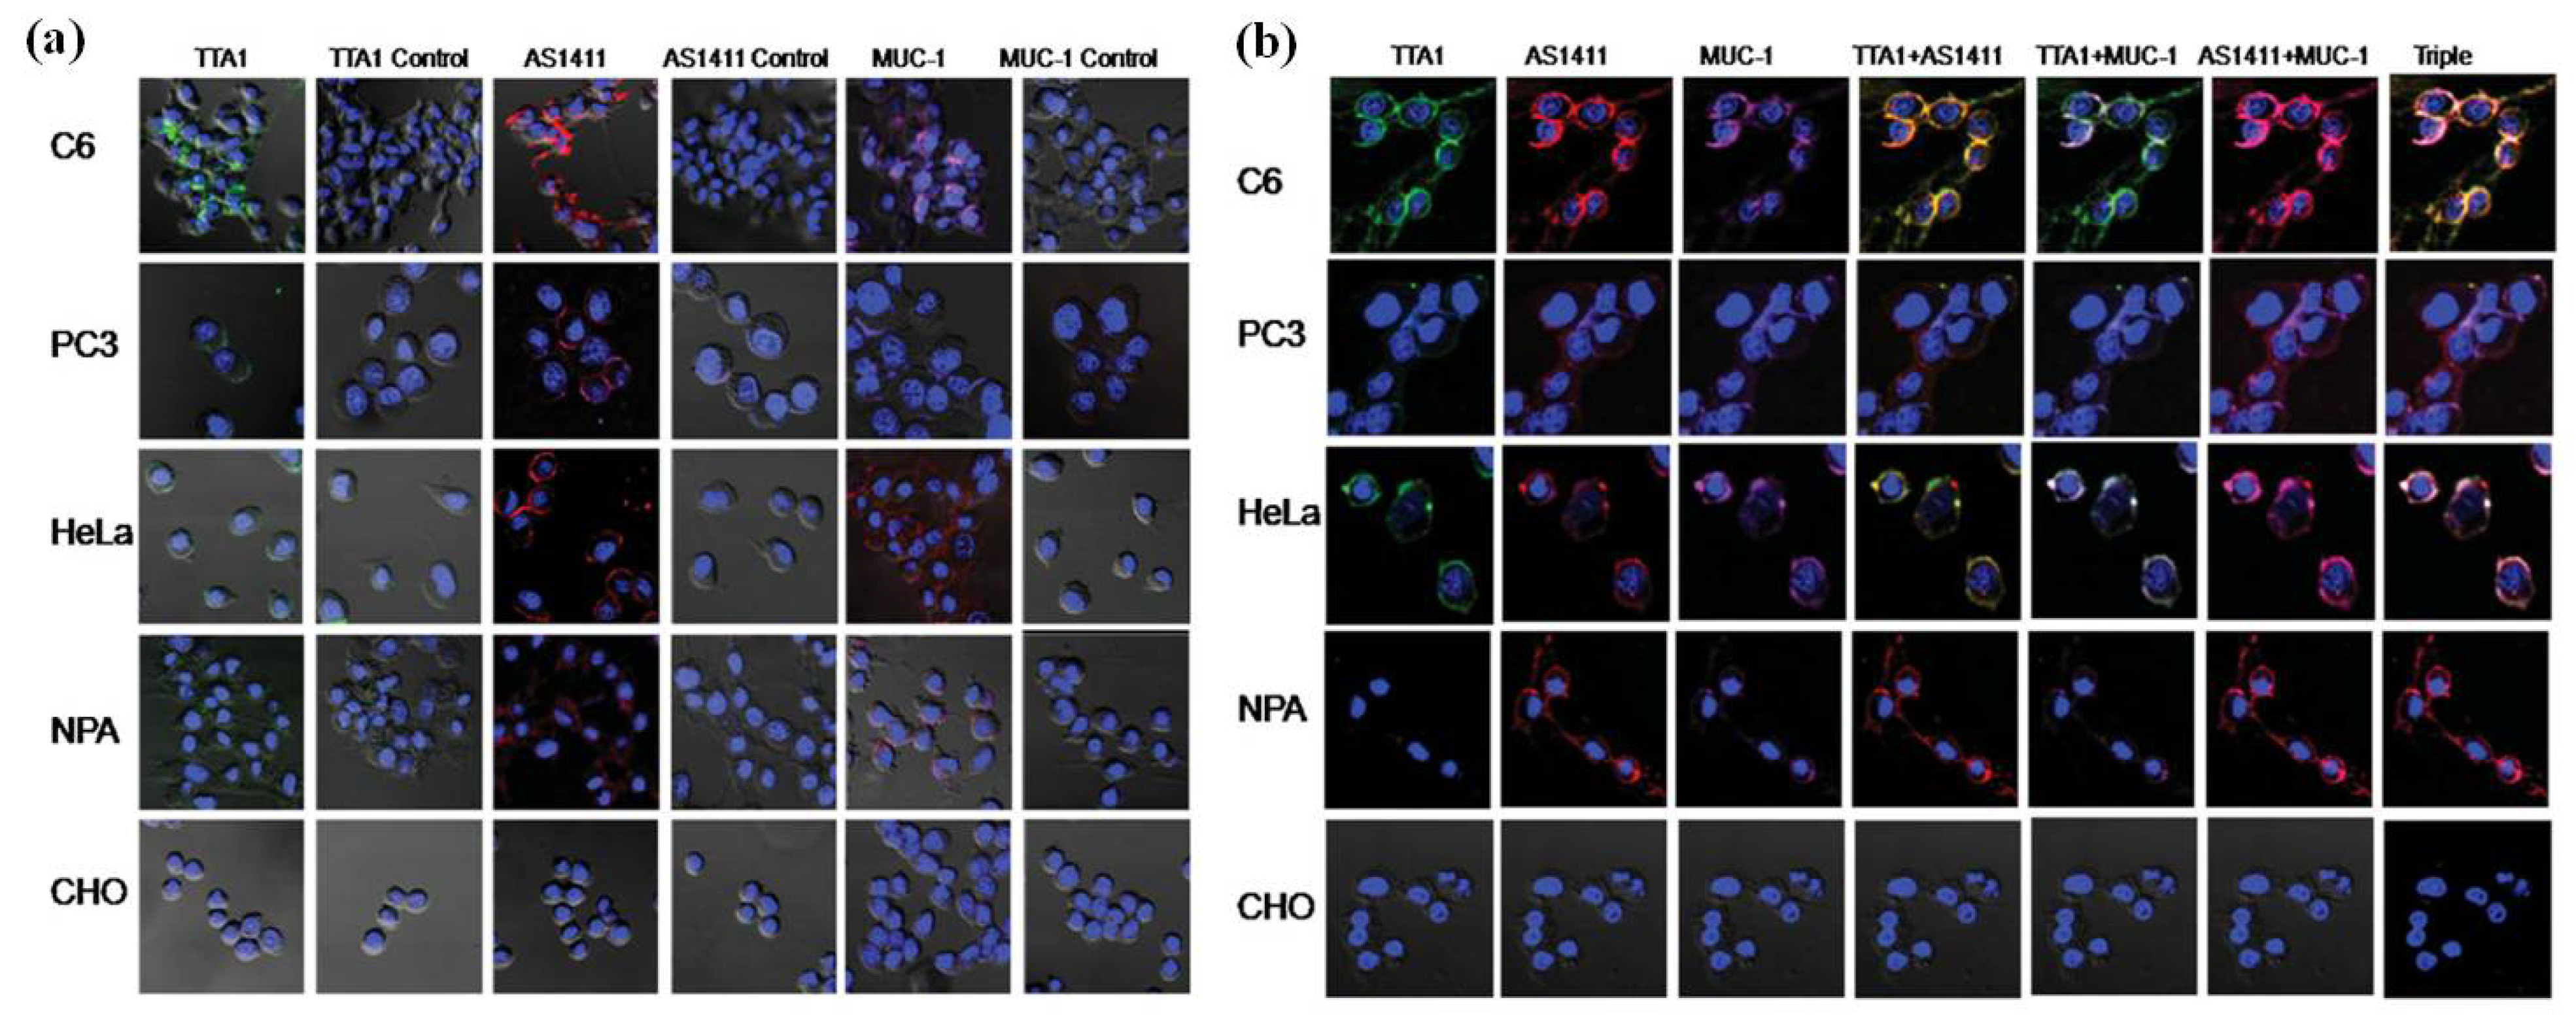
2.1. QDs for Imaging Membrane Receptors (Surface)

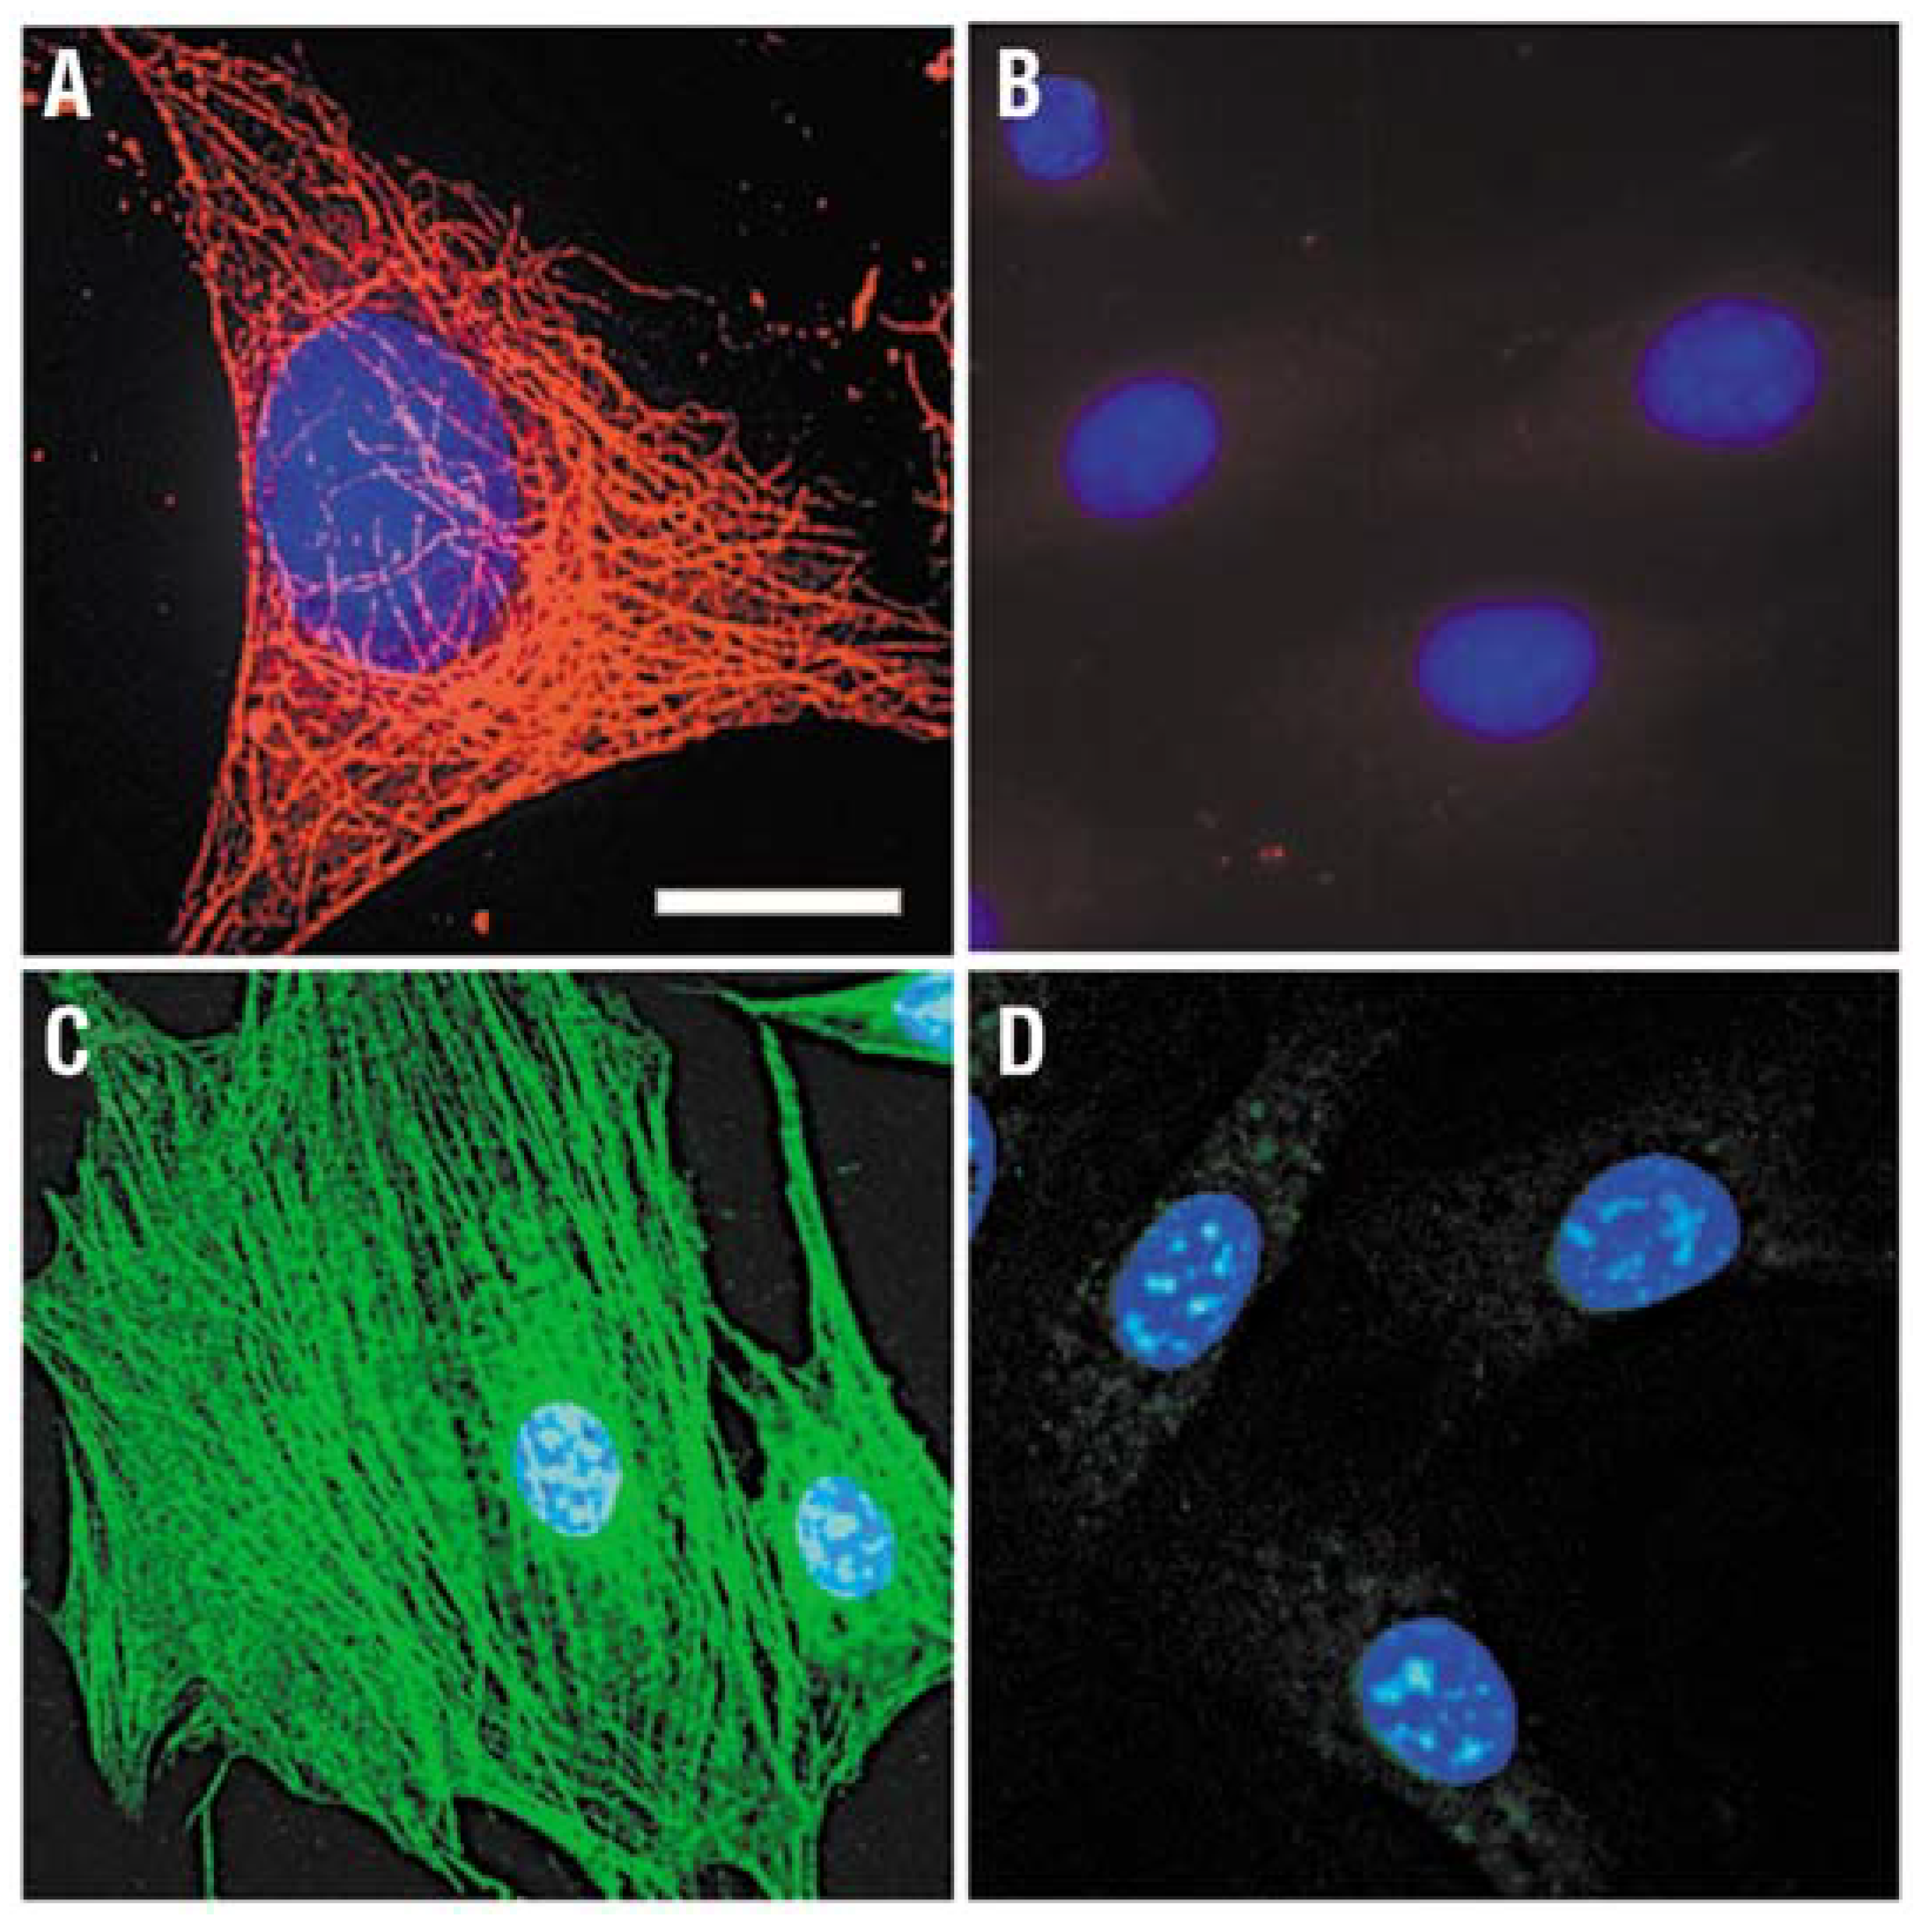
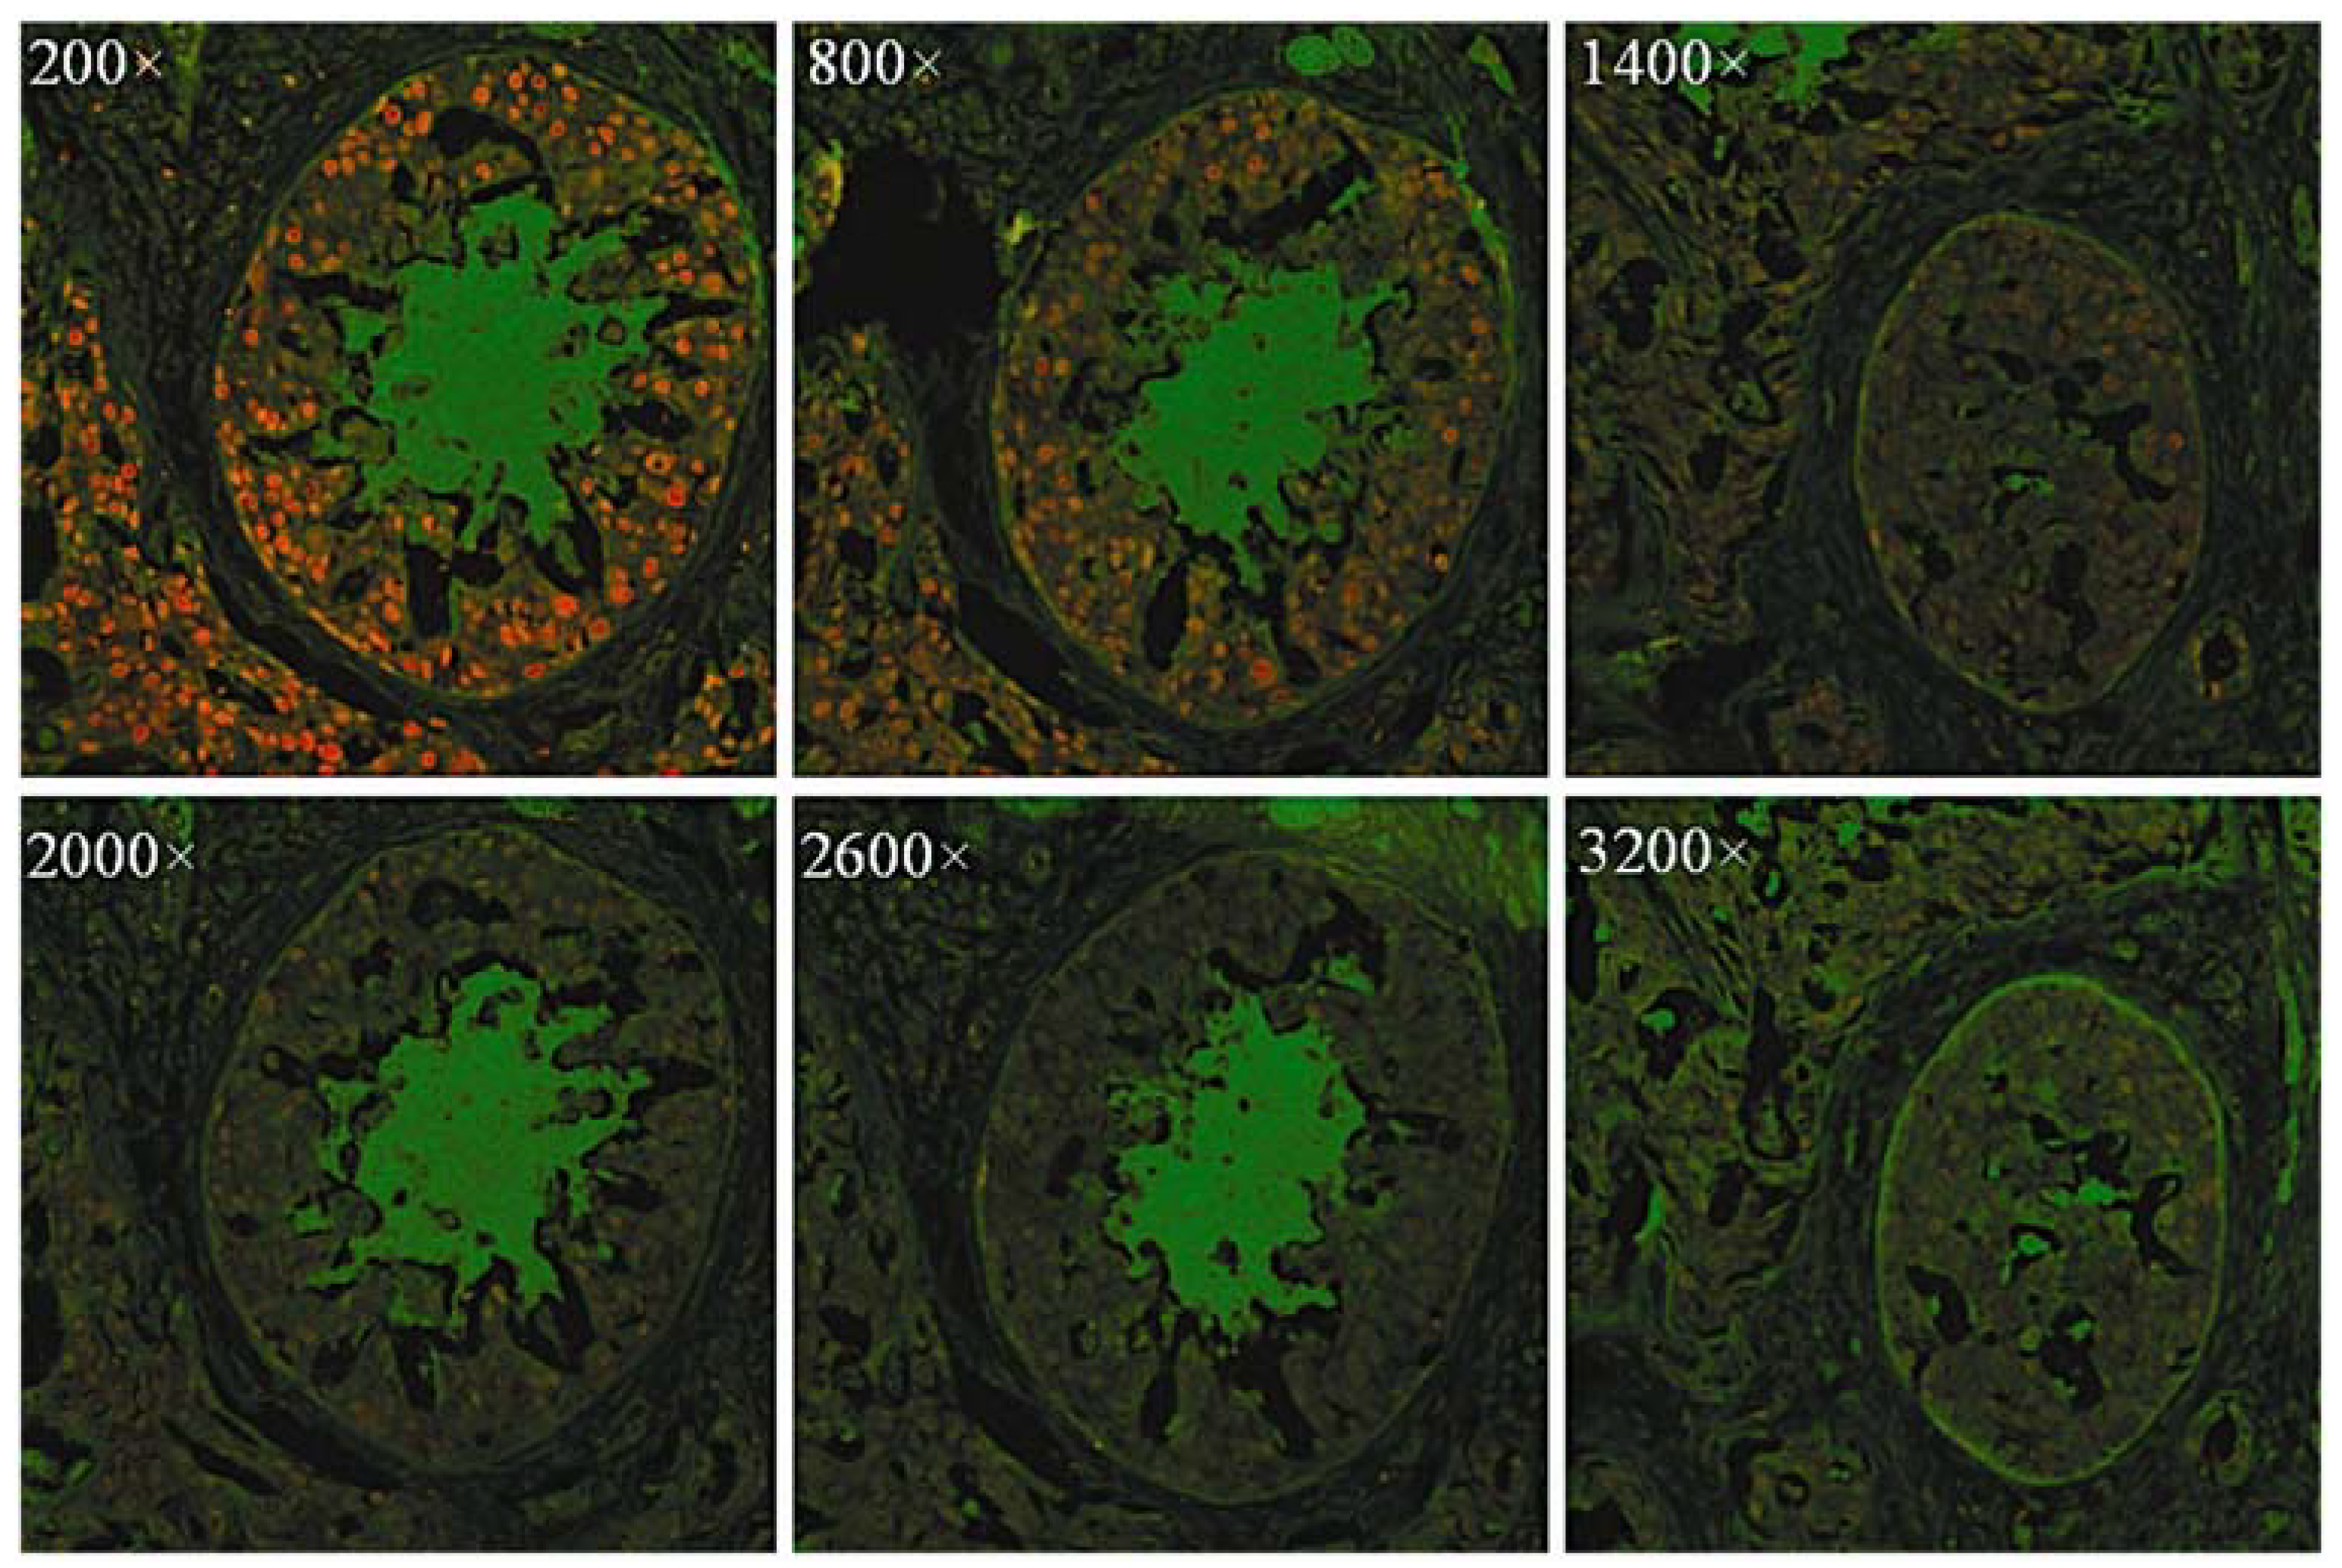
2.2. QDs for Imaging Cytoskeleton Components (Intracellular)

2.3. QDs for Imaging Nuclear Antigens (Intranuclear)

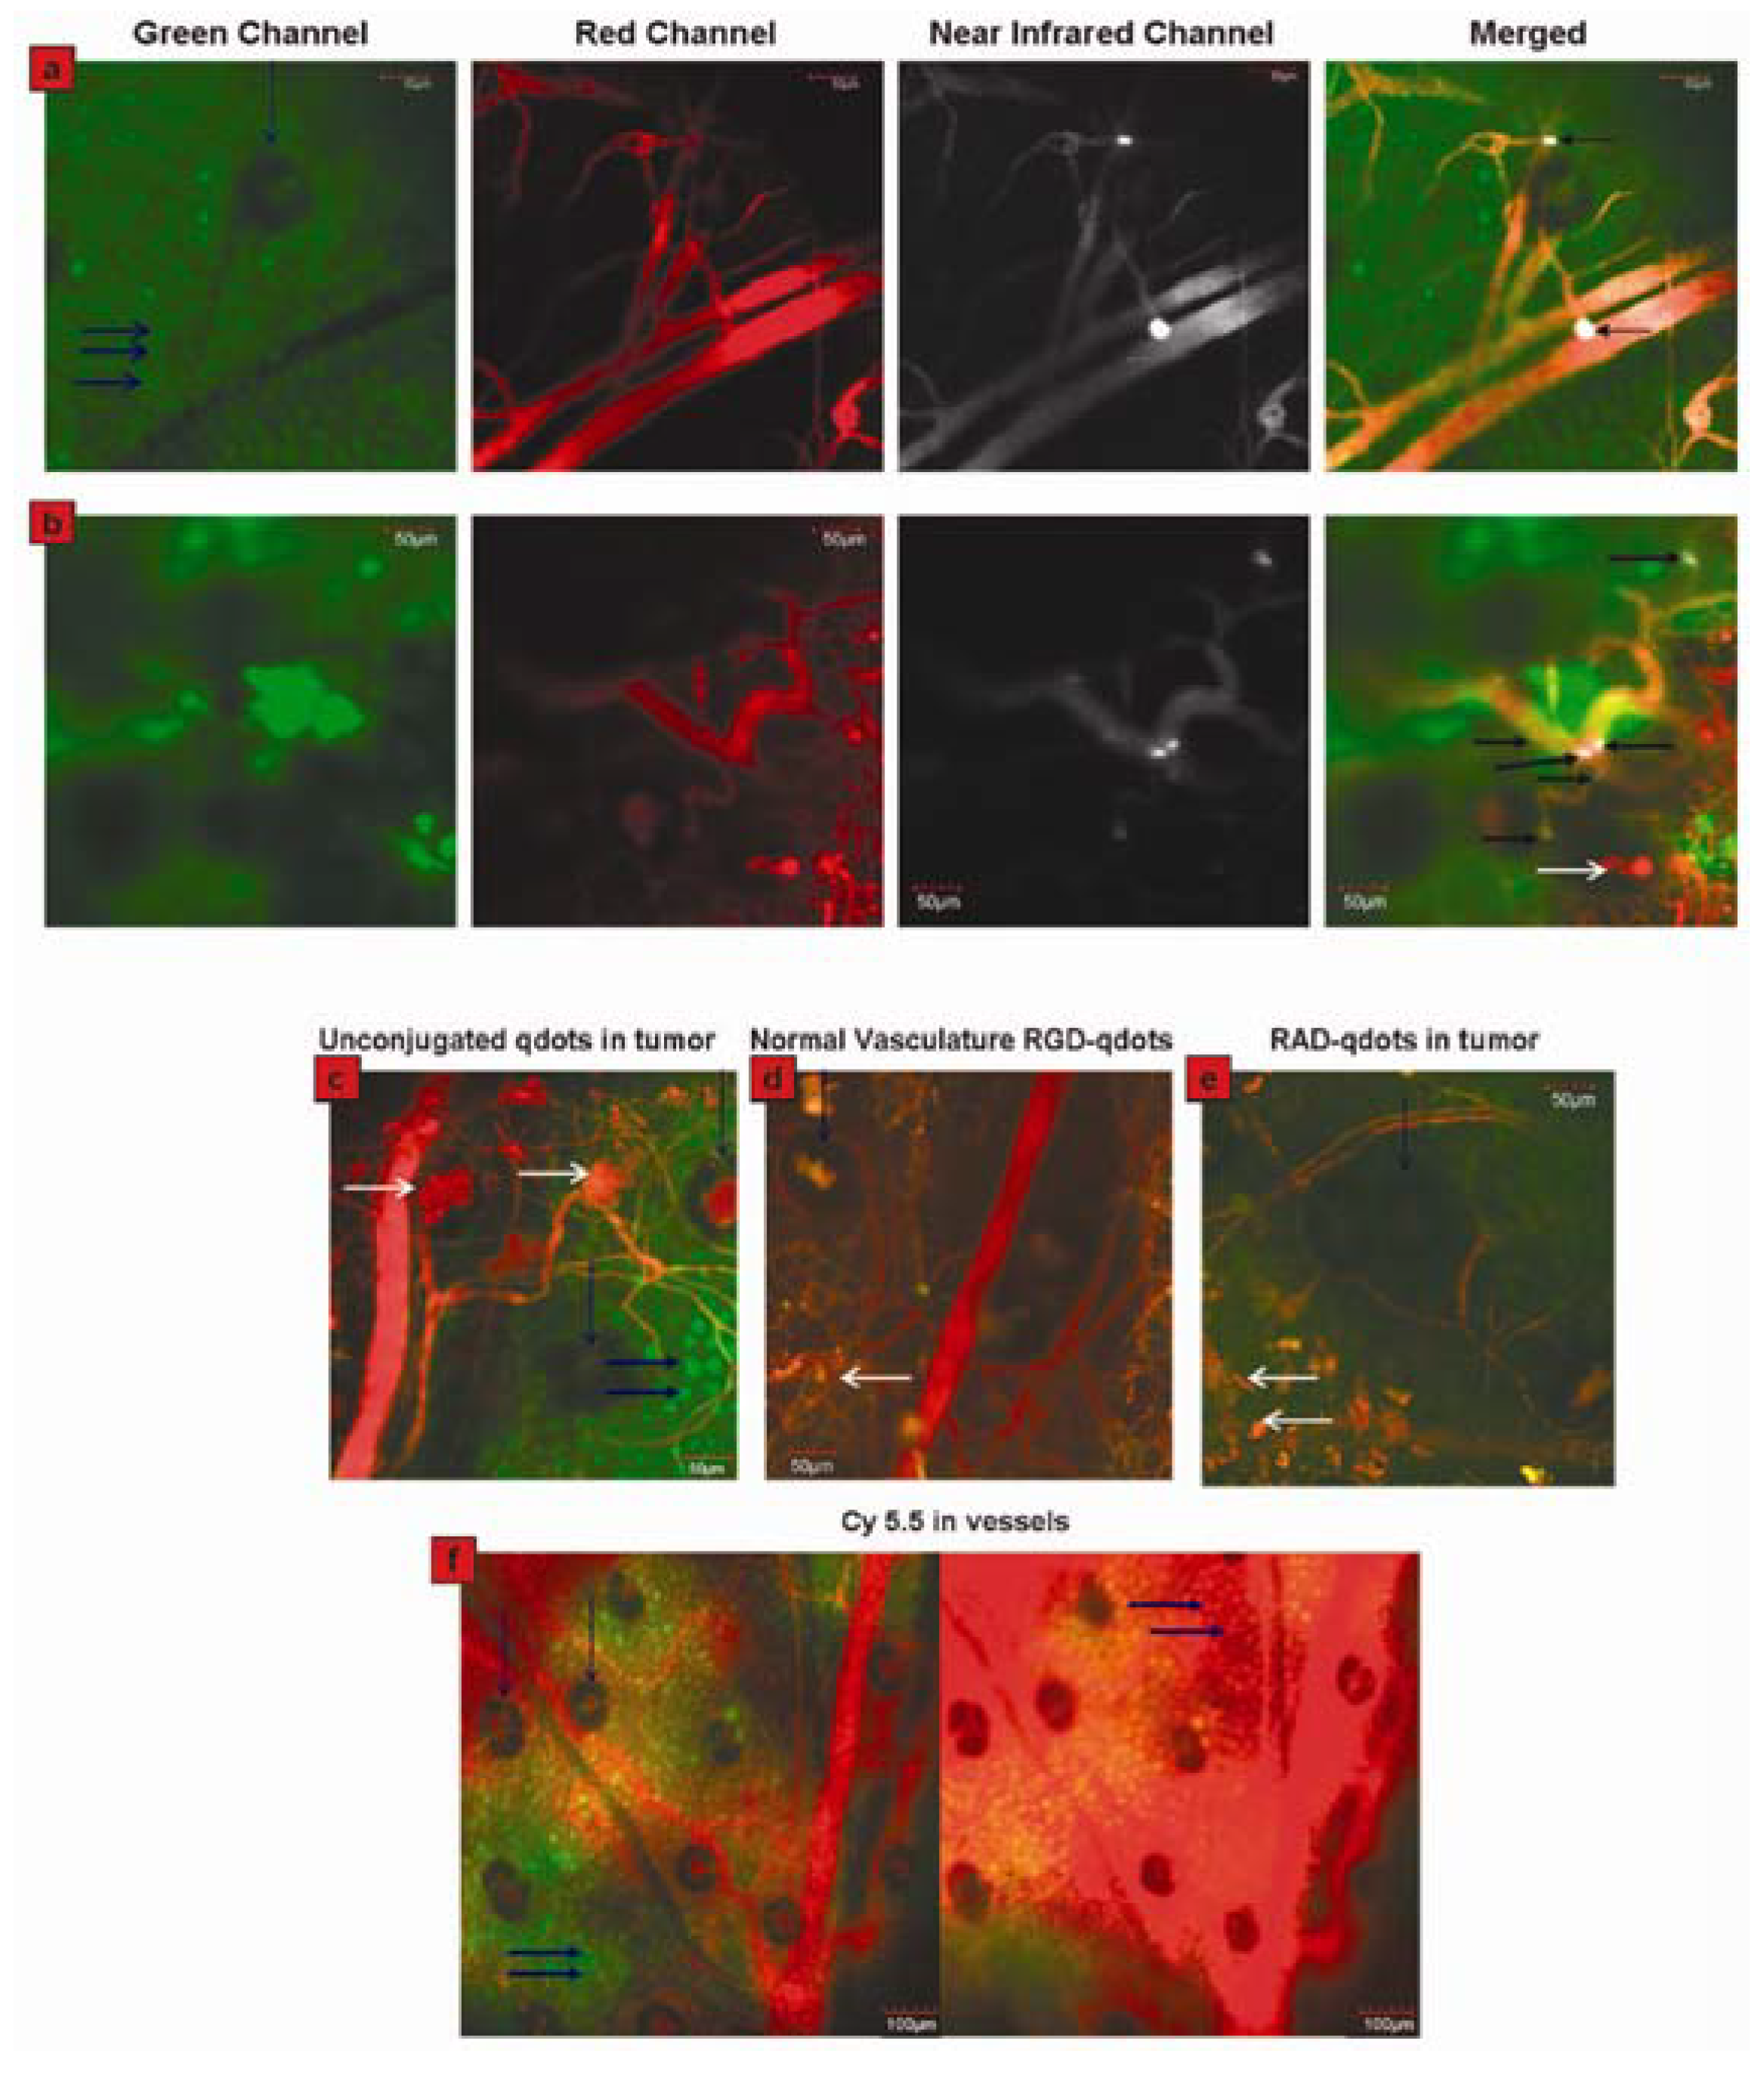
2.4. QDs for Imaging Tumor Neovasculature (a Special Example of Tumor Imaging)

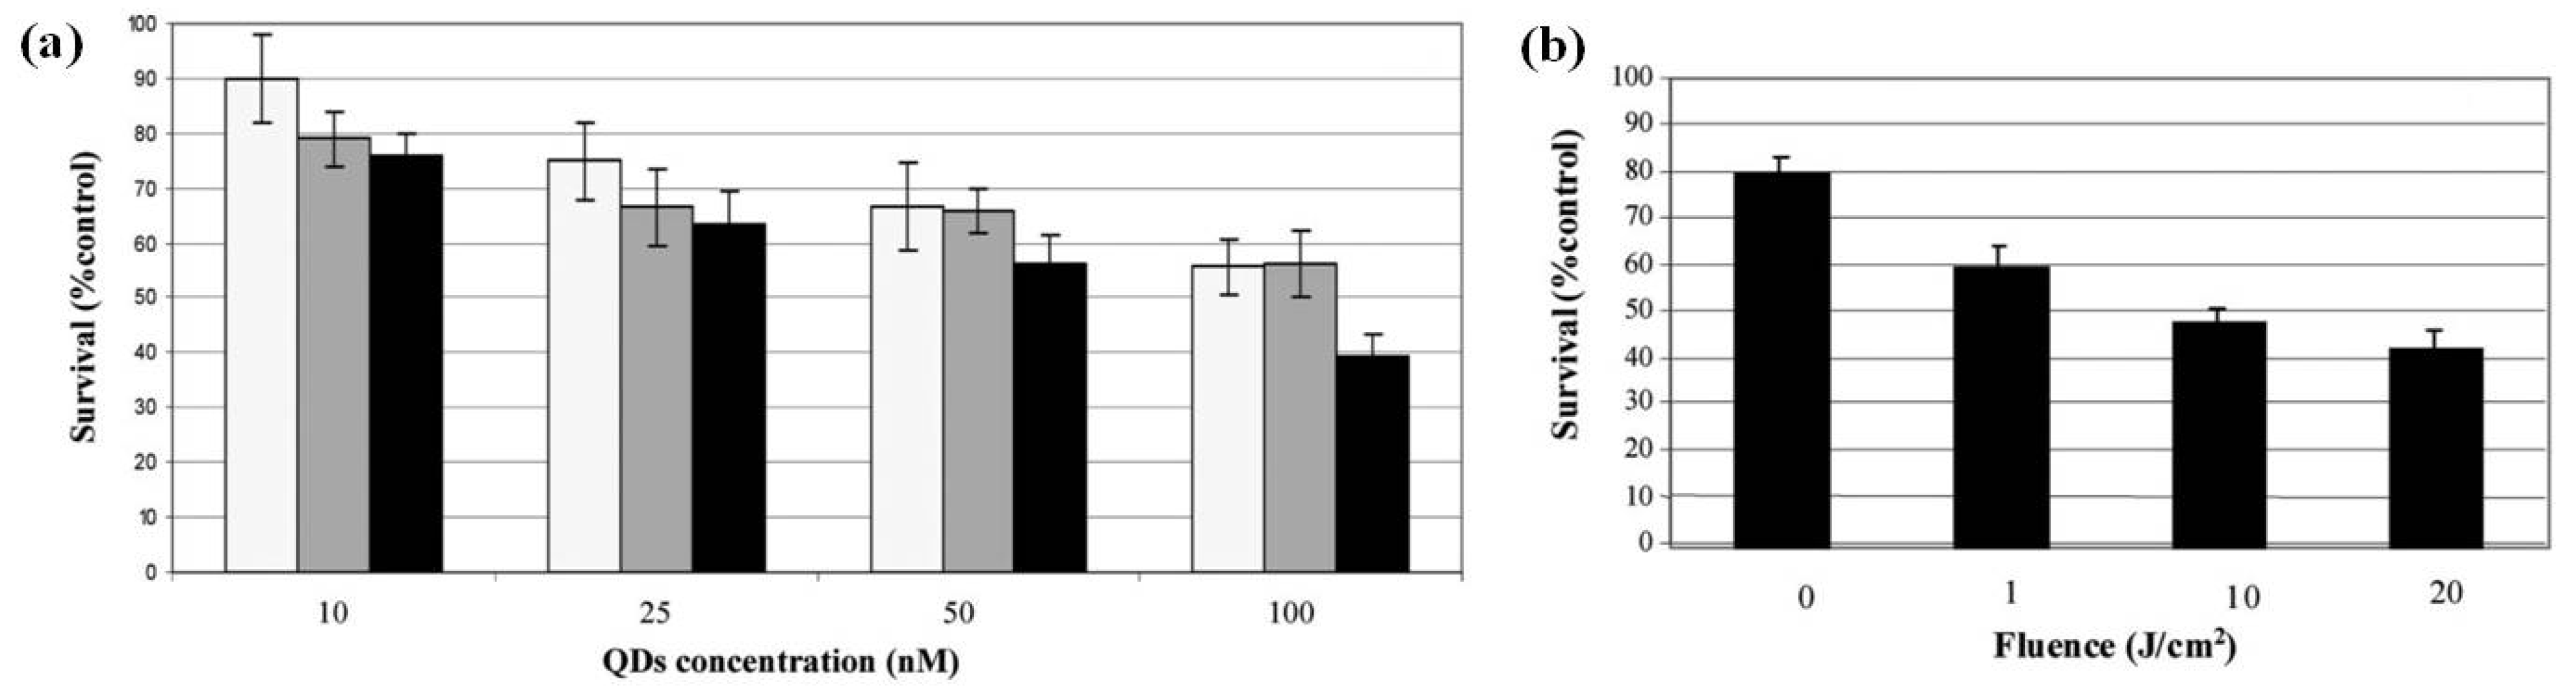
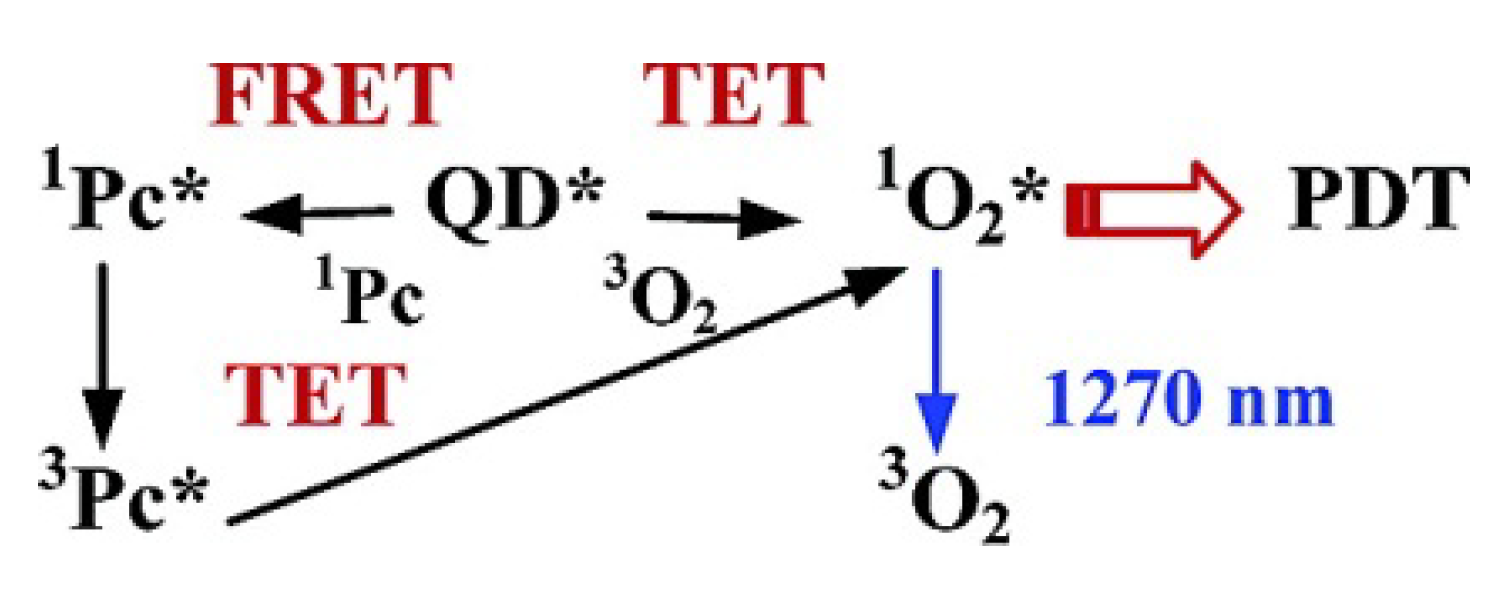
3. QDs for Tumor Therapy


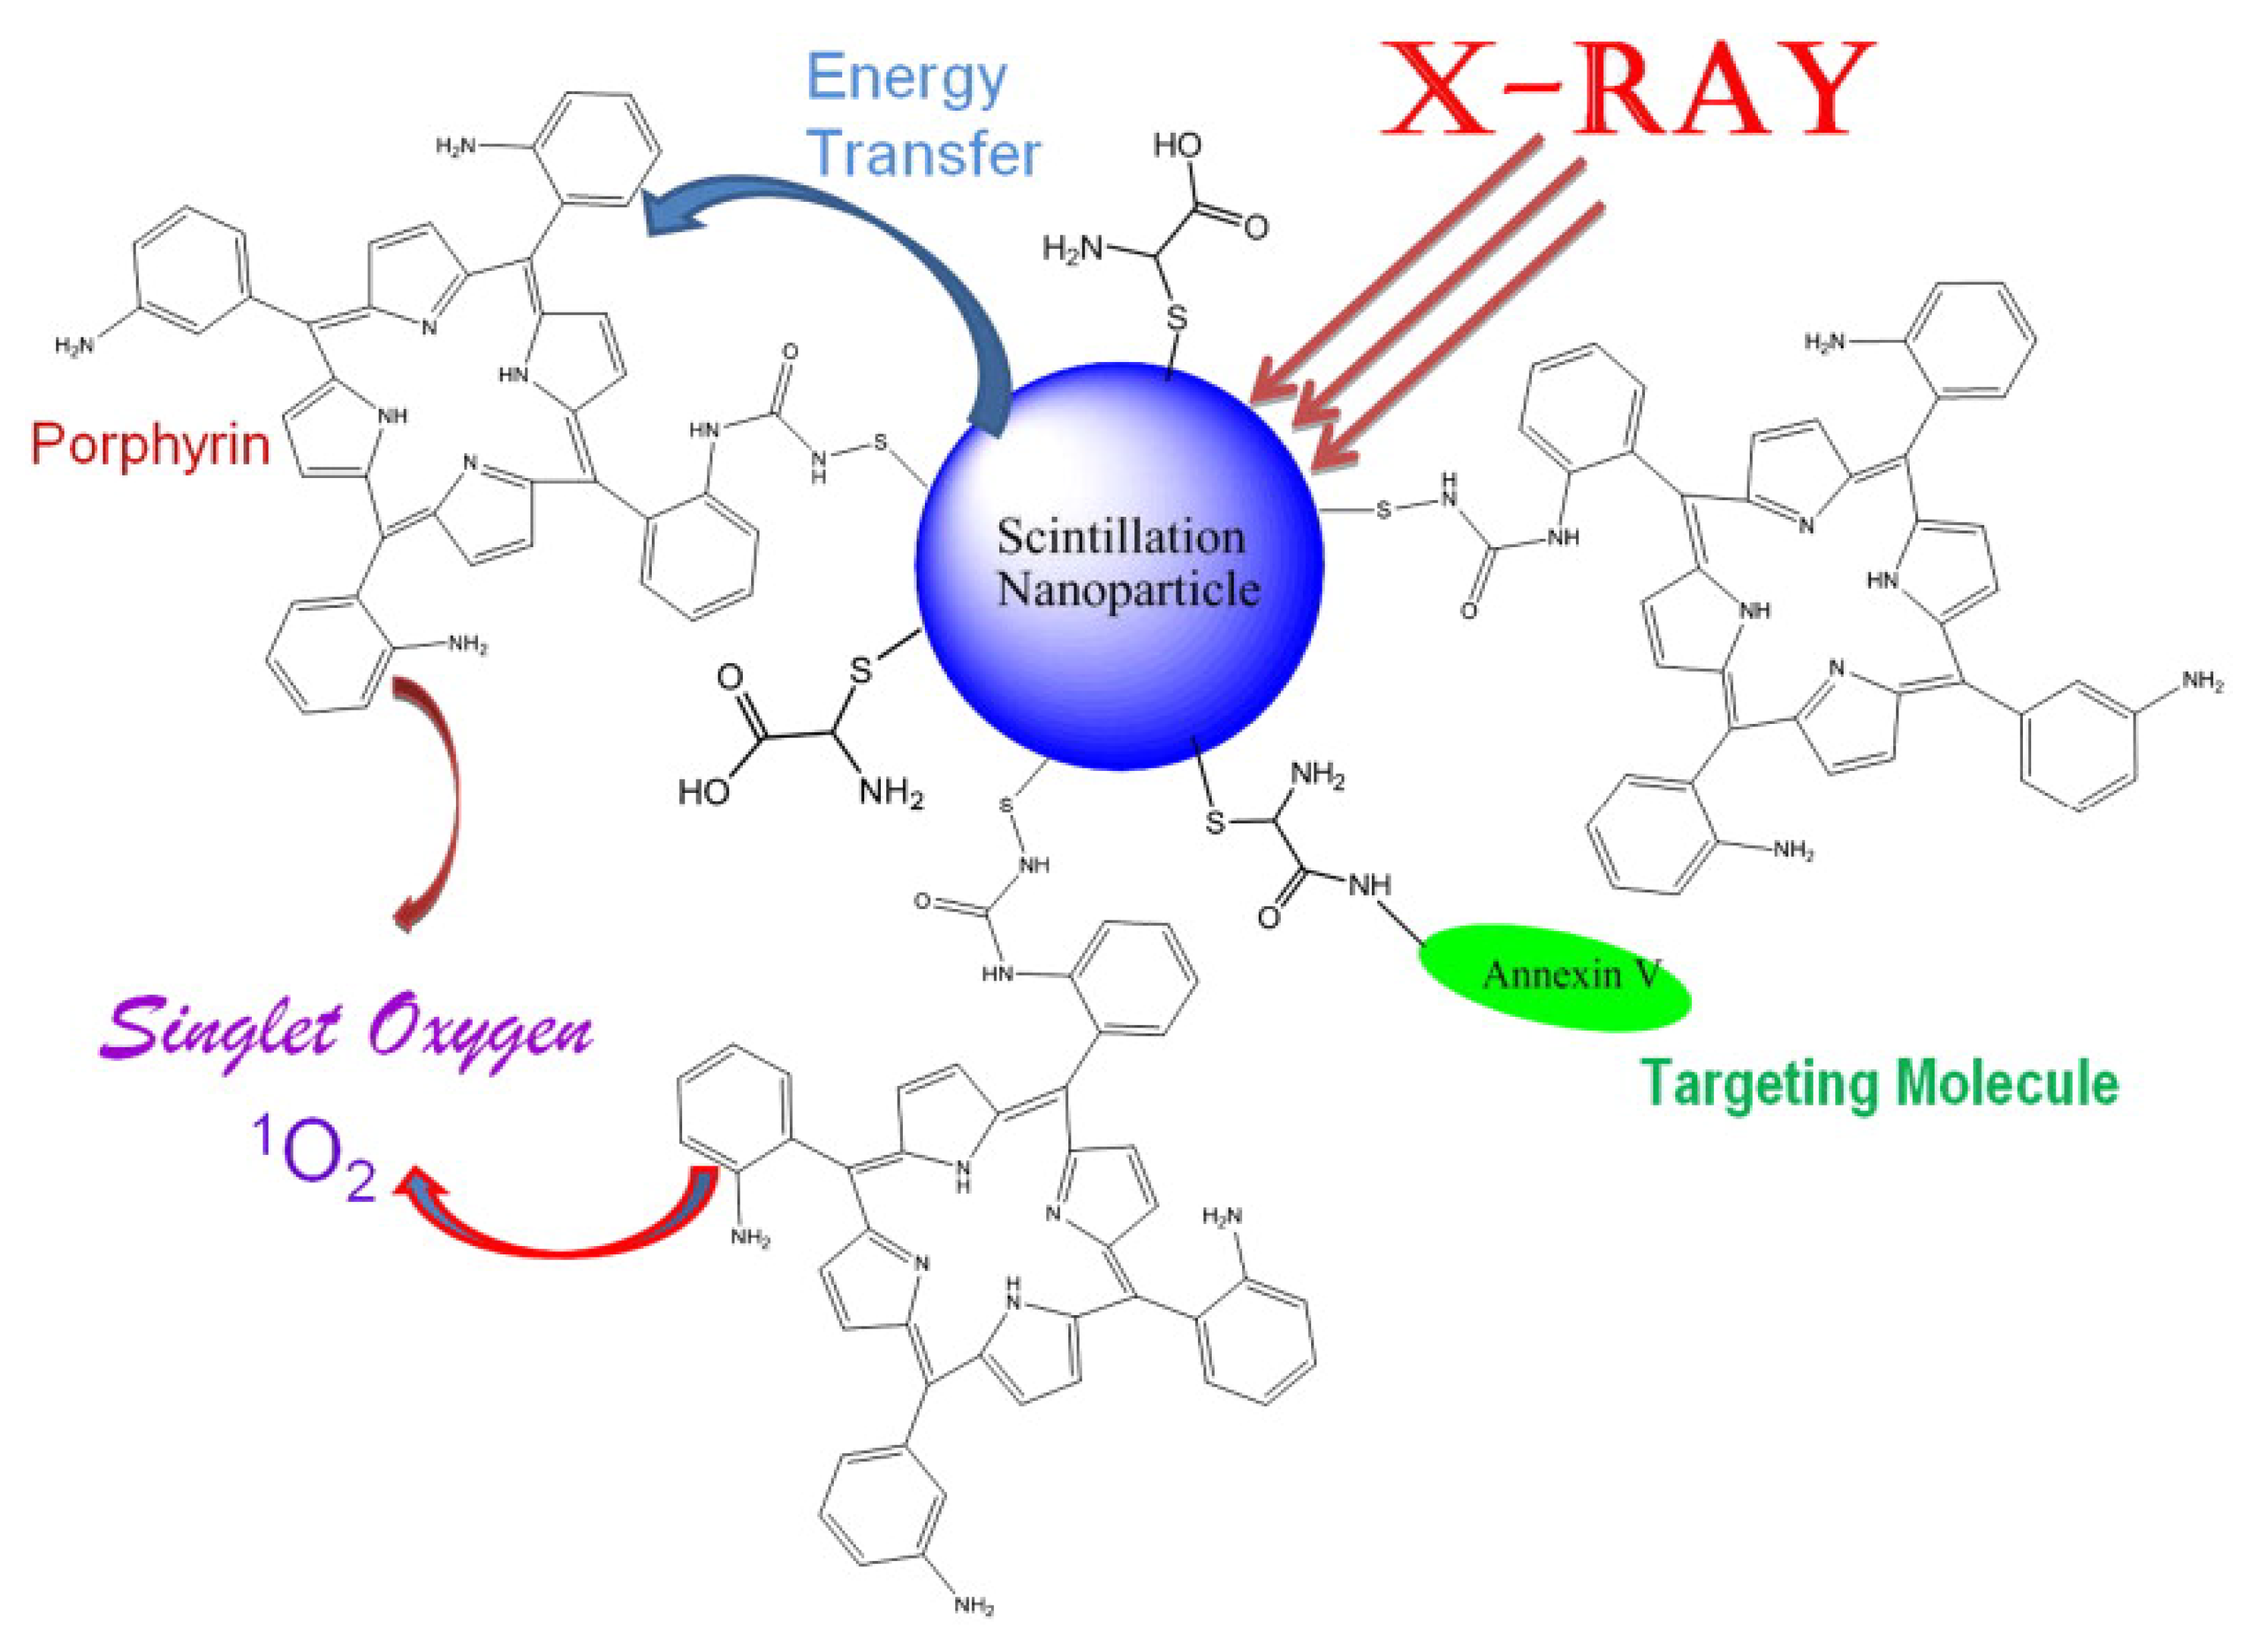
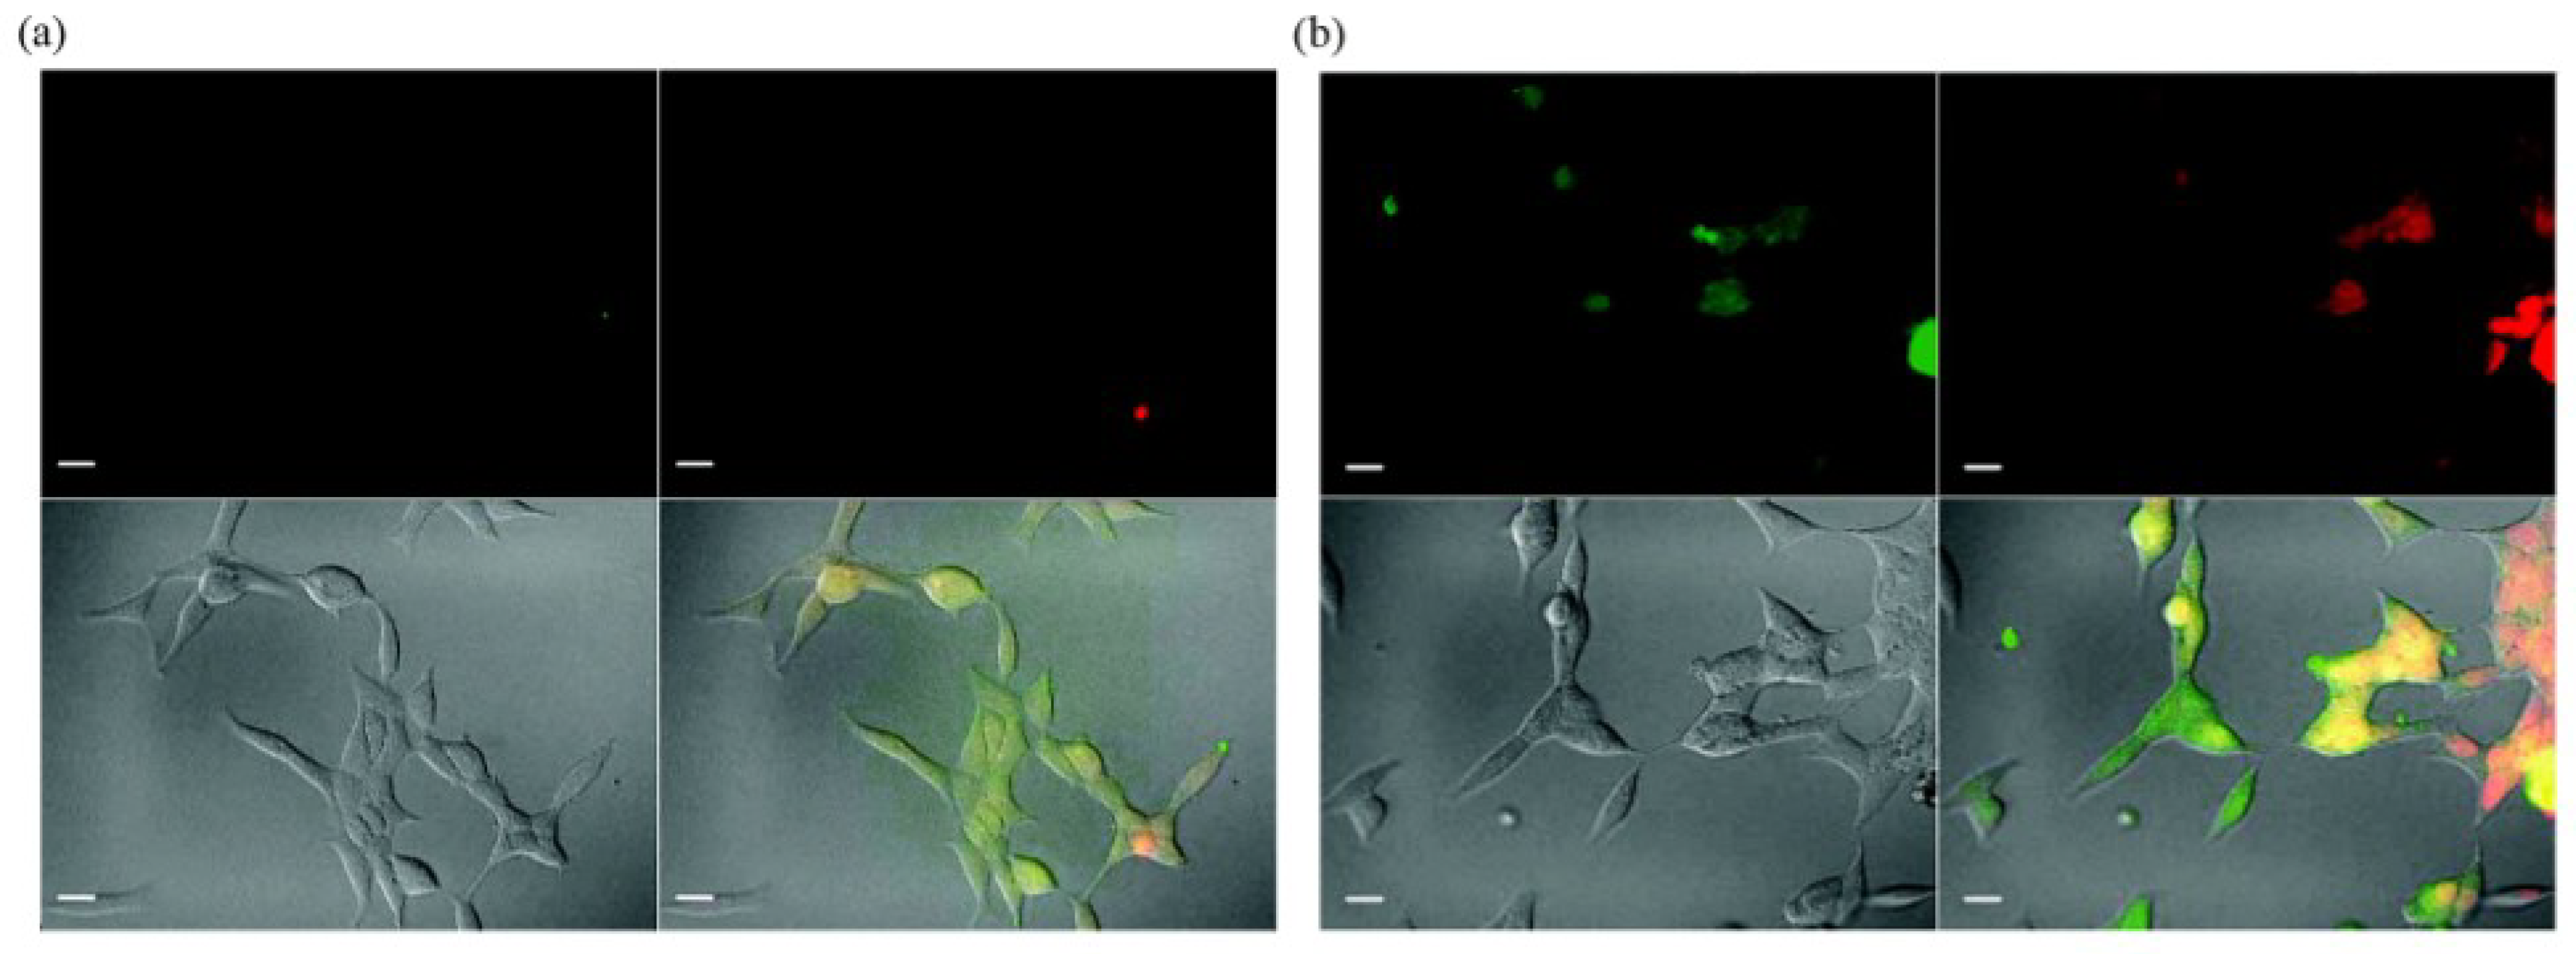
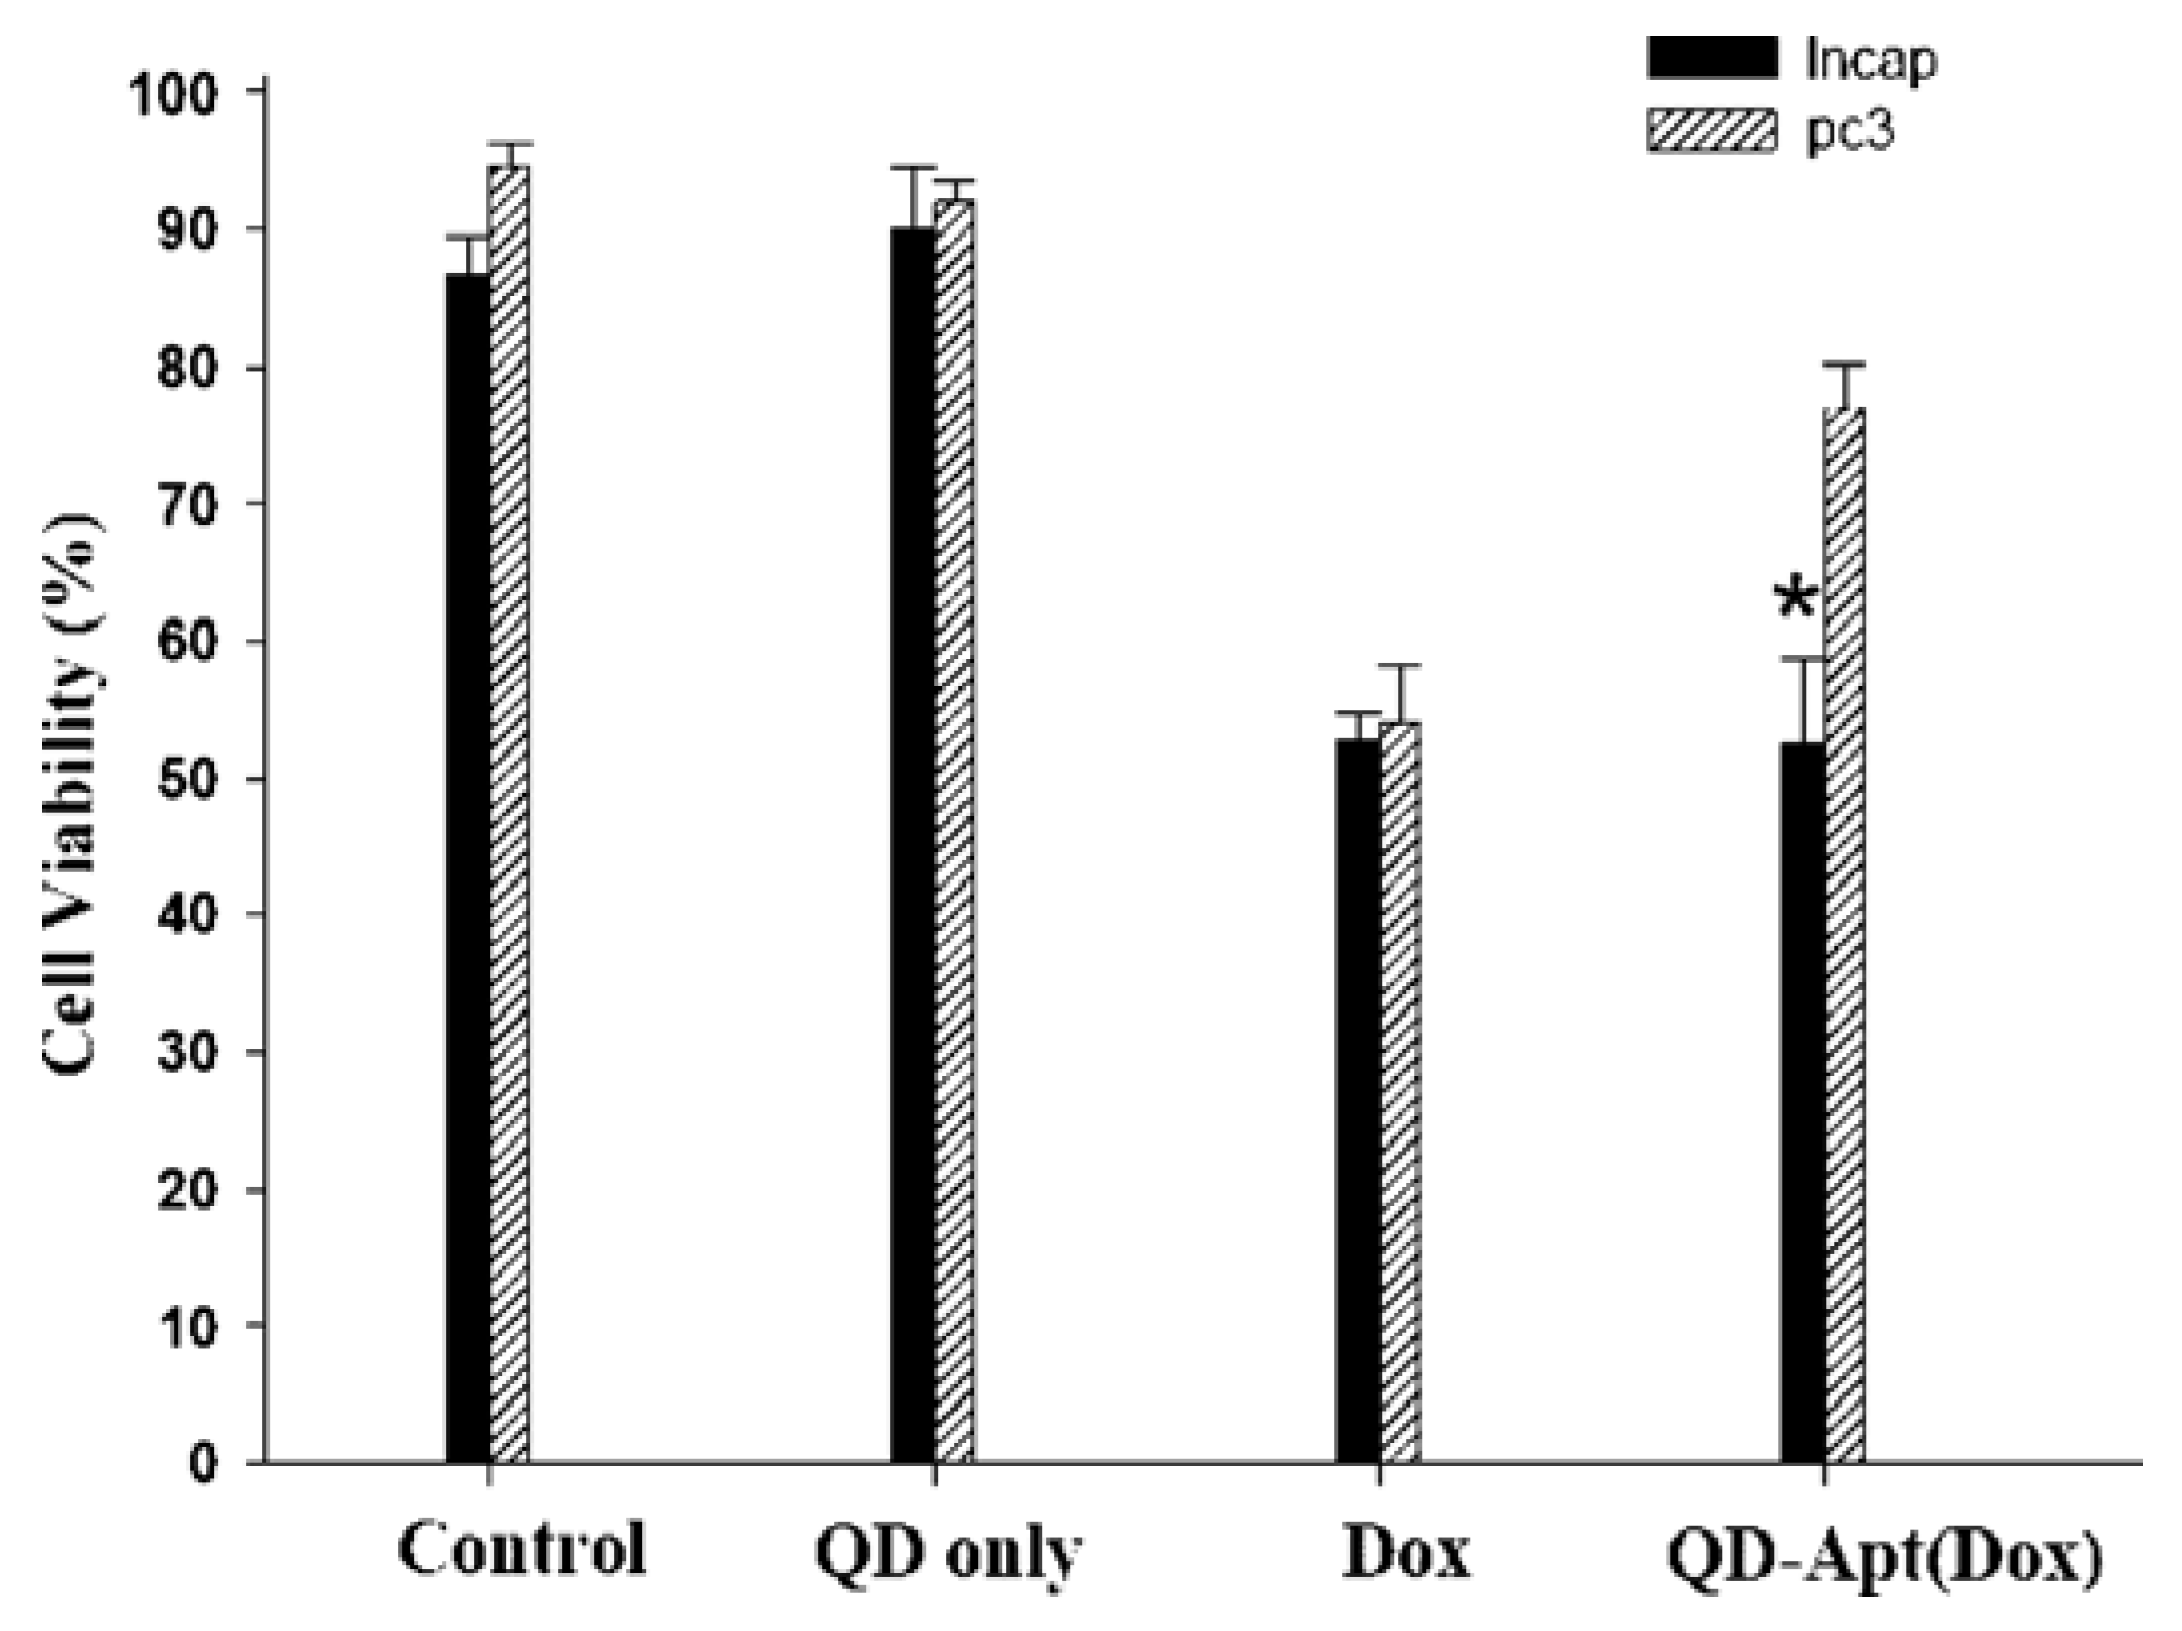
4. Multifunctional QDs for Synchronous Tumor Imaging and Therapy

5. Conclusions
Acknowledgements
References
- Hanson, R.; Kouwenhoven, L.P.; Petta, J.R.; Tarucha, S.; Vandersypen, L.M.K. Spins in few-electron quantum dots. Rev. Mod. Phys. 2007, 79, 1217–1265. [Google Scholar] [CrossRef]
- Hardman, R. A toxicologic review of quantum dots: Toxicity depends on physicochemical and environmental factors. Environ. Health Perspect. 2006, 114, 165–172. [Google Scholar] [CrossRef] [PubMed]
- Michalet, X.; Pinaud, F.F.; Bentolila, L.A.; Tsay, J.M.; Doose, S.; Li, J.J.; Sundaresan, G.; Wu, A.M.; Gambhir, S.S.; Weiss, S. Quantum dots for live cells, in vivo imaging, and diagnostics. Science 2005, 307, 538–544. [Google Scholar] [CrossRef] [PubMed]
- Samir, T.M.; Mansour, M.M.H.; Kazmierczak, S.C.; Azzazy, H.M.E. Quantum dots: Heralding a brighter future for clinical diagnostics. Nanomedicine 2012, 7, 1755–1769. [Google Scholar] [CrossRef] [PubMed]
- Medintz, I.L.; Uyeda, H.T.; Goldman, E.R.; Mattoussi, H. Quantum dot bioconjugates for imaging, labelling and sensing. Nat. Mater. 2005, 4, 435–446. [Google Scholar] [CrossRef] [PubMed]
- Ganesh, N.; Zhang, W.; Mathias, P.C.; Chow, E.; Soares, J.; Malyarchuk, V.; Smith, A.D.; Cunningham, B.T. Enhanced fluorescence emission from quantum dots on a photonic crystal surface. Nat. Nanotechnol. 2007, 2, 515–520. [Google Scholar] [CrossRef] [PubMed]
- Huang, F.M.; Festy, F.; Richards, D. Tip-enhanced fluorescence imaging of quantum dots. Appl. Phys. Lett. 2005, 87, 183101:1–183101:3. [Google Scholar]
- Jamieson, T.; Bakhshi, R.; Petrova, D.; Pocock, R.; Imani, M.; Seifalian, A.M. Biological applications of quantum dots. Biomaterials 2007, 28, 4717–4732. [Google Scholar] [CrossRef] [PubMed]
- Weissleder, R.; Pittet, M.J. Imaging in the era of molecular oncology. Nature 2008, 452, 580–589. [Google Scholar] [CrossRef] [PubMed]
- Ghasemi, Y.; Peymani, P.; Afifi, S. Quantum dot: Magic nanoparticle for imaging, detection and targeting. Acta Biomed. 2009, 80, 156–165. [Google Scholar] [PubMed]
- Stringari, C.; Nourse, J.L.; Flanagan, L.A.; Gratton, E. Phasor fluorescence lifetime microscopy of free and protein-bound nadh reveals neural stem cell differentiation potential. PLoS One 2012, 7, e48014. [Google Scholar] [CrossRef] [PubMed]
- Frangioni, J.V. In vivo near-infrared fluorescence imaging. Curr. Opin. Chem. Biol. 2003, 7, 626–634. [Google Scholar] [CrossRef] [PubMed]
- Chua, S.; Gnanasegaran, G.; Cook, G.J.R. Miscellaneous cancers (lung, thyroid, renal cancer, myeloma, and neuroendocrine tumors): Role of spect and pet in imaging bone metastases. Semin. Nucl. Med. 2009, 39, 416–430. [Google Scholar] [CrossRef] [PubMed]
- Barrett, T.; Kobayashi, H.; Brechbiel, M.; Choyke, P.L. Macromolecular mri contrast agents for imaging tumor angiogenesis. Eur. J. Radiol. 2006, 60, 353–366. [Google Scholar] [CrossRef] [PubMed]
- Cai, W.B.; Shin, D.W.; Chen, K.; Gheysens, O.; Cao, Q.Z.; Wang, S.X.; Gambhir, S.S.; Chen, X.Y. Peptide-labeled near-infrared quantum dots for imaging tumor vasculature in living subjects. Nano Lett. 2006, 6, 669–676. [Google Scholar] [CrossRef] [PubMed]
- Gao, J.H.; Chen, K.; Xie, R.G.; Xie, J.; Lee, S.; Cheng, Z.; Peng, X.G.; Chen, X.Y. Ultrasmall near-infrared non-cadmium quantum dots for in vivo tumor imaging. Small 2010, 6, 256–261. [Google Scholar] [CrossRef] [PubMed]
- Jiang, S.B. Radiotherapy of mobile tumors. Semin. Radiat. Oncol. 2006, 16, 239–248. [Google Scholar] [CrossRef] [PubMed]
- Guerra-Bubb, J.; Croteau, R.; Williams, R.M. The early stages of taxol biosynthesis: An interim report on the synthesis and identification of early pathway metabolites. Nat. Prod. Rep. 2012, 29, 683–696. [Google Scholar] [CrossRef] [PubMed]
- Galluzzi, L.; Senovilla, L.; Vitale, I.; Michels, J.; Martins, I.; Kepp, O.; Castedo, M.; Kroemer, G. Molecular mechanisms of cisplatin resistance. Oncogene 2012, 31, 1869–1883. [Google Scholar] [CrossRef] [PubMed]
- Anderson, R.F.; Shinde, S.S.; Hay, M.P.; Denny, W.A. Potentiation of the cytotoxicity of the anticancer agent tirapazamine by benzotriazine n-oxides: The role of redox equilibria. J. Am. Chem. Soc. 2006, 128, 245–249. [Google Scholar] [CrossRef] [PubMed]
- Efferth, T.; Li, P.C.H.; Konkimalla, V.S.B.; Kaina, B. From traditional chinese medicine to rational cancer therapy. Trends Mol. Med. 2007, 13, 353–361. [Google Scholar] [CrossRef] [PubMed]
- Ping, S.Y.; Hour, T.C.; Lin, S.R.; Yu, D.S. Taxol synergizes with antioxidants in inhibiting hormal refractory prostate cancer cell growth. Urol. Oncol. Semin. Orig. Investig. 2010, 28, 170–179. [Google Scholar] [CrossRef]
- Robertson, C.A.; Evans, D.H.; Abraharnse, H. Photodynamic therapy (PDT): A short review on cellular mechanisms and cancer research applications for pdt. J. Photochem. Photobiol. B Biol. 2009, 96, 1–8. [Google Scholar] [CrossRef]
- Gao, X.H.; Yang, L.L.; Petros, J.A.; Marshal, F.F.; Simons, J.W.; Nie, S.M. In vivo molecular and cellular imaging with quantum dots. Curr. Opin. Biotechnol. 2005, 16, 63–72. [Google Scholar] [CrossRef] [PubMed]
- Wu, X.Y.; Liu, H.J.; Liu, J.Q.; Haley, K.N.; Treadway, J.A.; Larson, J.P.; Ge, N.F.; Peale, F.; Bruchez, M.P. Immunofluorescent labeling of cancer marker Her2 and other cellular targets with semiconductor quantum dots. Nat. Biotechnol. 2003, 21, 41–46. [Google Scholar] [CrossRef] [PubMed]
- Ballou, B.; Ernst, L.A.; Andreko, S.; Harper, T.; Fitzpatrick, J.A.J.; Waggoner, A.S.; Bruchez, M.P. Sentinel lymph node imaging using quantum dots in mouse tumor models. Bioconjug. Chem. 2007, 18, 389–396. [Google Scholar] [CrossRef] [PubMed]
- Chambers, A.F.; Groom, A.C.; MacDonald, I.C. Dissemination and growth of cancer cells in metastatic sites. Nat. Rev. Cancer 2002, 2, 563–572. [Google Scholar] [CrossRef] [PubMed]
- Gonda, K.; Watanabe, T.M.; Ohuchi, N.; Higuchi, H. In vivo nano-imaging of membrane dynamics in metastatic tumor cells using quantum dots. J. Biol. Chem. 2010, 285, 2750–2757. [Google Scholar] [CrossRef] [PubMed]
- Kang, W.J.; Chae, J.R.; Cho, Y.L.; Lee, J.D.; Kim, S. Multiplex imaging of single tumor cells using quantum-dot-conjugated aptamers. Small 2009, 5, 2519–2522. [Google Scholar] [PubMed]
- Christian, S.; Pilch, J.; Akerman, M.E.; Porkka, K.; Laakkonen, P.; Ruoslahti, E. Nucleolin expressed at the cell surface is a marker of endothelial cells in angiogenic blood vessels. J. Cell Biol. 2003, 163, 871–878. [Google Scholar] [CrossRef] [PubMed]
- Teng, Y.; Girvan, A.C.; Casson, L.K.; Pierce, W.M.; Qian, N.; Thomas, S.D.; Bates, P.J. As1411 alters the localization of a complex containing protein arginine methyltransferase 5 and nucleolin. Cancer Res. 2007, 67, 10491–10500. [Google Scholar] [CrossRef] [PubMed]
- Daniels, D.A.; Chen, H.; Hicke, B.J.; Swiderek, K.M.; Gold, L. A tenascin-c aptamer identified by tumor cell selex: Systematic evolution of ligands by exponential enrichment. Proc. Natl. Acad. Sci. USA 2003, 100, 15416–15421. [Google Scholar] [CrossRef] [PubMed]
- Borbas, K.E.; Ferreira, C.S.M.; Perkins, A.; Bruce, J.I.; Missailidis, S. Design and synthesis of mono- and multimeric targeted radiopharmaceuticals based on novel cyclen ligands coupled to anti-muc1 aptamers for the diagnostic imaging and targeted radiotherapy of cancer. Bioconjug. Chem. 2007, 18, 1205–1212. [Google Scholar] [CrossRef] [PubMed]
- Ferreira, C.S.M.; Matthews, C.S.; Missailidis, S. DNA aptamers that bind to muc1 tumour marker: Design and characterization of muc1-binding single-stranded DNA aptamers. Tumor Biol. 2006, 27, 289–301. [Google Scholar] [CrossRef]
- Wettstein, G.; Bellaye, P.S.; Micheau, O.; Bonniaud, P. Small heat shock proteins and the cytoskeleton: An essential interplay for cell integrity? Int. J. Biochem. Cell Biol. 2012, 44, 1680–1686. [Google Scholar] [CrossRef] [PubMed]
- Heng, Y.W.; Koh, C.G. Actin cytoskeleton dynamics and the cell division cycle. Int. J. Biochem. Cell Biol. 2010, 42, 1622–1633. [Google Scholar] [CrossRef] [PubMed]
- Hernandez, P.; Tirnauer, J.S. Tumor suppressor interactions with microtubules: Keeping cell polarity and cell division on track. Dis. Model. Mech. 2010, 3, 304–315. [Google Scholar] [CrossRef] [PubMed]
- Bruchez, M.; Moronne, M.; Gin, P.; Weiss, S.; Alivisatos, A.P. Semiconductor nanocrystals as fluorescent biological labels. Science 1998, 281, 2013–2016. [Google Scholar] [CrossRef] [PubMed]
- Ybo, J.; Kambara, T.; Gonda, K.; Higuchi, H. Intracellular imaging of targeted proteins labeled with quantum dots. Exp. Cell Res. 2008, 314, 3563–3569. [Google Scholar] [CrossRef] [PubMed]
- Xu, H.; Chen, C.A.; Peng, J.; Tang, H.W.; Liu, C.M.; He, Y.; Chen, Z.Z.; Li, Y.; Zhang, Z.L.; Pang, D.W. Evaluation of the bioconjugation efficiency of different quantum dots as probes for immunostaining tumor-marker proteins. Appl. Spectrosc. 2010, 64, 847–852. [Google Scholar] [CrossRef] [PubMed]
- Smith, B.R.; Cheng, Z.; De, A.; Koh, A.L.; Sinclair, R.; Gambhir, S.S. Real-time intravital imaging of rgd-quantum dot binding to luminal endothelium in mouse tumor neovasculature. Nano Lett. 2008, 8, 2599–2606. [Google Scholar] [CrossRef] [PubMed]
- Rhyner, M.N.; Smith, A.M.; Gao, X.H.; Mao, H.; Yang, L.L.; Nie, S.M. Quantum dots and multifunctional nanoparticles: New contrast agents for tumor imaging. Nanomedicine 2006, 1, 209–217. [Google Scholar] [CrossRef] [PubMed]
- Juzenas, P.; Chen, W.; Sun, Y.P.; Coelho, M.A.N.; Generalov, R.; Generalova, N.; Christensen, I.L. Quantum dots and nanoparticles for photodynamic and radiation therapies of cancer. Adv. Drug Deliv. Rev. 2008, 60, 1600–1614. [Google Scholar] [CrossRef] [PubMed]
- Bakalova, R.; Ohba, H.; Zhelev, Z.; Nagase, T.; Jose, R.; Ishikawa, M.; Baba, Y. Quantum dot anti-cd conjugates: Are they potential photosensitizers or potentiators of classical photosensitizing agents in photodynamic therapy of cancer? Nano Lett. 2004, 4, 1567–1573. [Google Scholar] [CrossRef]
- Morosini, V.; Bastogne, T.; Frochot, C.; Schneider, R.; Francois, A.; Guillemin, F.; Barberi-Heyo, M. Quantum dot-folic acid conjugates as potential photosensitizers in photodynamic therapy of cancer. Photochem. Photobiol. Sci. 2011, 10, 842–851. [Google Scholar] [CrossRef] [PubMed]
- Samia, A.C.S.; Chen, X.B.; Burda, C. Semiconductor quantum dots for photodynamic therapy. J. Am. Chem. Soc. 2003, 125, 15736–15737. [Google Scholar] [CrossRef] [PubMed]
- Bagalkot, V.; Zhang, L.; Levy-Nissenbaum, E.; Jon, S.; Kantoff, P.W.; Langer, R.; Farokhzad, O.C. Quantum dot–aptamer conjugates for synchronous cancer imaging, therapy, and sensing of drug delivery based on bi-fluorescence resonance energy transfer. Nano Lett. 2007, 7, 3065–3070. [Google Scholar] [CrossRef] [PubMed]
- Gillies, E.R.; Frechet, J.M.J. Ph-responsive copolymer assemblies for controlled release of doxorubicin. Bioconjug. Chem. 2005, 16, 361–368. [Google Scholar] [CrossRef] [PubMed]
- Klostranec, J.M.; Chan, W.C.W. Quantum dots in biological and biomedical research: Recent progress and present challenges. Adv. Mater. 2006, 18, 1953–1964. [Google Scholar] [CrossRef]
- Zhang, H.; Yee, D.; Wang, C. Quantum dots for cancer diagnosis and therapy: Biological and clinical perspectives. Nanomedicine 2008, 3, 83–91. [Google Scholar] [CrossRef] [PubMed]
- Liang, G.L.; Ren, H.J.; Rao, J.H. A biocompatible condensation reaction for controlled assembly of nanostructures in living cells. Nat. Chem. 2010, 2, 54–60. [Google Scholar] [CrossRef] [PubMed]
© 2013 by the authors. Licensee MDPI, Basel, Switzerland. This article is an open access article distributed under the terms and conditions of the Creative Commons Attribution license ( http://creativecommons.org/licenses/by/3.0/).
Share and Cite
Liu, L.; Miao, Q.; Liang, G. Quantum Dots as Multifunctional Materials for Tumor Imaging and Therapy. Materials 2013, 6, 483-499. https://doi.org/10.3390/ma6020483
Liu L, Miao Q, Liang G. Quantum Dots as Multifunctional Materials for Tumor Imaging and Therapy. Materials. 2013; 6(2):483-499. https://doi.org/10.3390/ma6020483
Chicago/Turabian StyleLiu, Longfei, Qingqing Miao, and Gaolin Liang. 2013. "Quantum Dots as Multifunctional Materials for Tumor Imaging and Therapy" Materials 6, no. 2: 483-499. https://doi.org/10.3390/ma6020483