Article

Dehydration Process of Hofmann-Type Layered Solids

by
Omar Reyes-Martinez
1,
Enelio Torres-García
2,
Geonel Rodríguez-Gattorno
3,* and
Edilso Reguera
1
1
Centro de Investigación en Ciencia Aplicada y Tecnología Avanzada Unidad Legaria, Instituto Politécnico Nacional, Legaria 694, Colonia, Irrigación, México D.F. 11500, Mexico
2
Mexican Petroleum Institute, Eje Central 152, México D.F. 07730, Mexico
3
Center for Research and Advanced Studies of the National Polytechnic Institute, Km 6 Antigua Carretera Progreso, Cordemex, Mérida 97310, Yucatán, Mexico
*
Author to whom correspondence should be addressed.
Materials 2013, 6(4), 1452-1466; https://doi.org/10.3390/ma6041452
Submission received: 14 December 2012 / Revised: 8 March 2013 / Accepted: 22 March 2013 / Published: 9 April 2013

Abstract

:
In the present work the dehydration process of layered solids with formula unit M(H2O)2[Ni(CN)4nH2O, M = Ni, Co, Mn; n = 1, 2, 4 is studied using modulated thermogravimetry. The results show that water molecules need to overcome an energetic barrier (activation energy between 63 and 500 kJ/mol) in order to diffuse through the interlayer region. The related kinetic parameters show a dependence on the water partial pressure. On the other hand, X-ray diffraction results provide evidence that the dehydration process is accompanied by framework collapse, limiting the structural reversibility, except for heating below 80 °C where the ordered structure remains. Removal of water molecules from the interlayer region disrupts the long-range structural order of the solid.

Graphical Abstract

1. Introduction

For many years, microporous solids have played an important role in the improvement of technologies involving processes such as separation, adsorption, ion exchange and heterogeneous catalysis. For this reason, they have been extensively studied [1,2,3] and a new generation of different porous materials have emerged, such as metal–organic frameworks (MOFs) [4,5], covalent–organic frameworks (COFs) [6,7], zeolitic imidazolate frameworks (ZIFs) [8] and amorphous polymers of intrinsic microporosity (PIMs) [9], to mention just a few. There is another class of structures known as Hofmann-type compounds in which the size and geometry of the pores can be tailored by incorporating appropriate pillars between neighboring layers to form 3D porous frameworks. Such an assembling process impacts in the physico-chemical features, particularly in the geometry of the cavities and the surface properties for the resulting porous materials. Hofmann compounds are classified within the clathrate structures as microporous solids that have being the subject of intense research related to their fundamental significance in understanding the nature of interactions between molecular and ionic species [10,11,12,13]
The classical Hofmann structure consists of square planar Ni(II) metal centers surrounded by C-bound cyanide ligands, which are assembled by nickel atoms linked at the N end of the CN ligands [14]. In the resulting layer, the axial coordination positions for the second metal are occupied by NH3 or H2O molecules, which complete the metal octahedral coordination environment. The resulting motif is an extended 2D network in which octahedral nickel atoms can be replaced by several other transition metals to form solids with layered structures [15]. The region of weak interaction between neighboring layers, commonly known as the interlamellar region or gallery, is receiving increasing attention related to the possibility of utilizing the principles of crystal engineering and rational design to synthesize a great variety of inclusion compounds with predetermined structural characteristics. The series of Hofmann-type solids studied in this work are also appropriate building blocks for the formation of hybrid inorganic–organic materials, replacing the ammonia and water molecules coordinated to the axial positions of the octahedral metal by organic molecules [11,16]. When molecules with two coordination sites and different length are included in that region, pillared porous solids of different cavity size and geometry can be obtained [11]. When the organic ligand has only one coordination site, bimolecular pillars are formed [16]. In this last case neighboring layers remain in communication by the intermolecular interaction established between the organic ligands involved. In the interlayer region, the included molecules are confined to a small volume where their intermolecular interactions are limited to only few molecules.
These interesting compounds have potential applications in novel hybrid inorganic–organic materials and porous solids of tailored cavity geometry and volume appropriate for H2, N2 and CO2 storage and/or separation [10,11,12,13]. Hence, the aim of this work is to provide a detailed study of the thermal properties for a series of Hofmann-type layered solids in order to shed light on the structural stability of the water molecules upon heating and its related kinetic parameters. The kinetic parameters derived were used to interpret the mechanistic aspects related to dehydration and structural collapse of the solids considered in this work. The samples consist of solids of formula unit M(H2O)2[Ni(CN)4nH2O with M = Mn, Co, Ni, where neighboring layers remain together through a network of coordinated and hydrogen-bonded water molecules. The amount of weakly hydrogen-bonded water molecules found in the interlayers region determines the crystal structure adopted by the solids; three different ordered phases are known, L0, K and L1 [17,18,19], with 1, 2 and 4 weakly bonded water molecules per formula unit [19].

2. Experimental

2.1. Synthesis Procedure

Samples were prepared by mixing aqueous solutions of 0.038 M K2[Ni(CN)4]·H2O and the corresponding metal sulfate (Mn2+, Co2+ and Ni2+) at the same concentration. For the preparation of the L1 phase, the solutions were mixed without agitation, while the L0 phase was precipitated with continuous stirring for 2 h. To obtain the K phase, the sample was maintained at 70 °C without agitation for 5 days. The resulting precipitated solids were separated from the solution by centrifugation. The solid fraction was repeatedly washed with distilled water to remove the accompanying ions and air-dried. The synthesis process is summarized in Figure 1, which illustrates the assembly of the anionic [Ni(CN)4]2− building blocks with the M2+ metal cations to form a layered structure. The available water molecules used as solvent occupy the available axial positions for the assembling metal. These coordinated water molecules stabilize additional weakly bonded water molecules in the interlayer region through a network of hydrogen bonding interactions. As already mentioned, the amount of this type of water molecules determines the crystal structure of the formed precipitate.
Figure 1. Schematic representation of the assembling process in order to obtain the K, L1 and L0 phases. The hydrogen-bonded water molecules are highlighted within open circles in the interlayers region, while the rest of the oxygen atoms (in red) correspond to coordinated water molecules (two per unit cell).
Materials 06 01452 g001

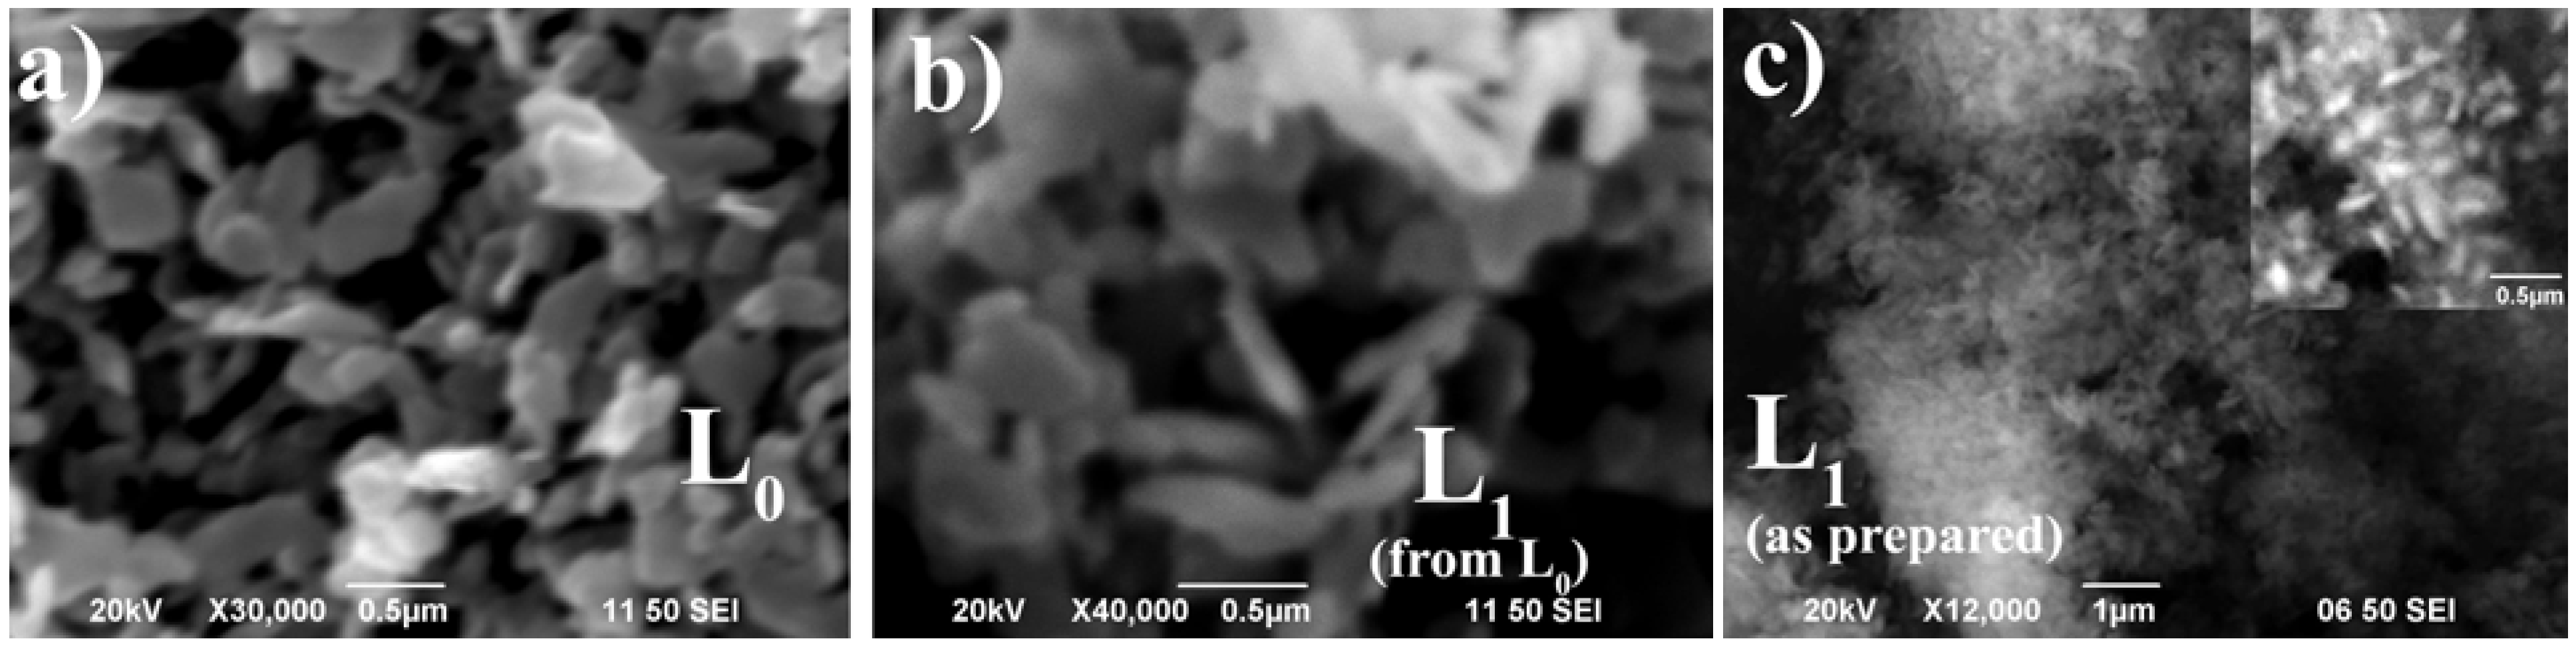
2.2.X-ray Diffraction (XRD) and Scanning Electron Microscopy (SEM)

Powder X-ray diffraction patterns were collected for as-prepared samples and used to monitor the structural changes during the dehydration process. Patterns were obtained using Bragg-Brentano geometry in a D-8 Advance diffractometer with Cu Kα radiation, using a nickel filter in the secondary beam and a scintillation detector. Diffraction intensity was measured between 4° and 80°, with a step size of 0.02° and an integration time of 9 s per point. Details of the crystal structure for this family of 2D materials are available in reference [19], and the crystallographic information files were used to model the schematic structures of each phase and the water sub-networks. The morphology of the as-prepared and dehydrated samples was characterized by scanning electron microscopy (SEM) using a JEOL JSM 6390 LV operating at an accelerating voltage of 15~20 kV. Charging phenomena during observation did not allow us to obtain high quality images for some samples, while any attempt of increasing the conductivity by depositing a thin metallic gold layer by evaporation resulted in a change of the water content with partial structural collapse.

2.3.Hi-Resolution and Modulated Thermogravimetric Analysis

A Thermogravimetric Analyzer Q5000 IR by TA Instruments, Inc. (USA) was used to obtain mass loss profiles upon heating of the samples. Samples (between 5 and 10 mg) were placed in a platinum-HT open pan and heated from room temperature to 200 °C with a heating rate of 1 °C/min and a sinusoidal temperature perturbation with an amplitude of ±3 °C and a period of 60 s. These analyses were carried out both under a dynamic atmosphere of dry air and at a fixed water partial pressure (3130 Pa), with a flow of 25 cm3/min. The water partial pressure is controlled by bubbling the air through pure water at a constant temperature (25 °C). Typical thermogravimetric plots and the modulated parameters are shown in Figure S1 of the Supporting Information.
A slight difference between the experimental and theoretical weight loss was found, which was ascribed to a small fraction of physisorbed water molecules that are removed under gas flow during the programming of the MTG experiments. The resulting TGA curves were analyzed using “TA Instruments Universal Analysis 2000 software”. A detailed description related with the kinetic analysis can be found in section 1 of the Supporting Information.
It is important to note here that in order to get a clear comprehension of the general trends in the activation energy (Ea) profiles we should keep in mind the nature of the dehydration processes in each material under study (i.e., hydrogen-bonded water molecules, coordinated water molecules or both). Assuming that it is reasonable to expect that the mechanism controlling the overall kinetics is similar for any specific crystallographic phase, we compare the activation energy profiles for each of the cations (i.e., Ni2+, Co2+ and Mn2+). In general three regions can be distinguished along the dynamic activation energy profiles: high and steep sides at both extremes of the curve, and a nearly constant plateau in between, which can be considered as the minimum of the energy barrier (Ea) that should be overcome in the main process controlling the kinetics of the reaction [20]. Both extremes (at low and high α values) are zones where the mechanism is usually very complex due to its mixed nature; frequently these zones comprise simultaneous processes such as nucleation and growth, reaction and nucleation, or reaction and diffusion, therefore only the region for Ea from 0.1 ≤ α ≤ 0.9 is used for the interpretation of results. It should be noted that the activation energy is expected to depend on the transformation degree (α) [21,22,23]; in other cases, an increasing Ea as a function of α reveals a possible competition between parallel reactions [24,25,26,27].

3. Results and Discussion

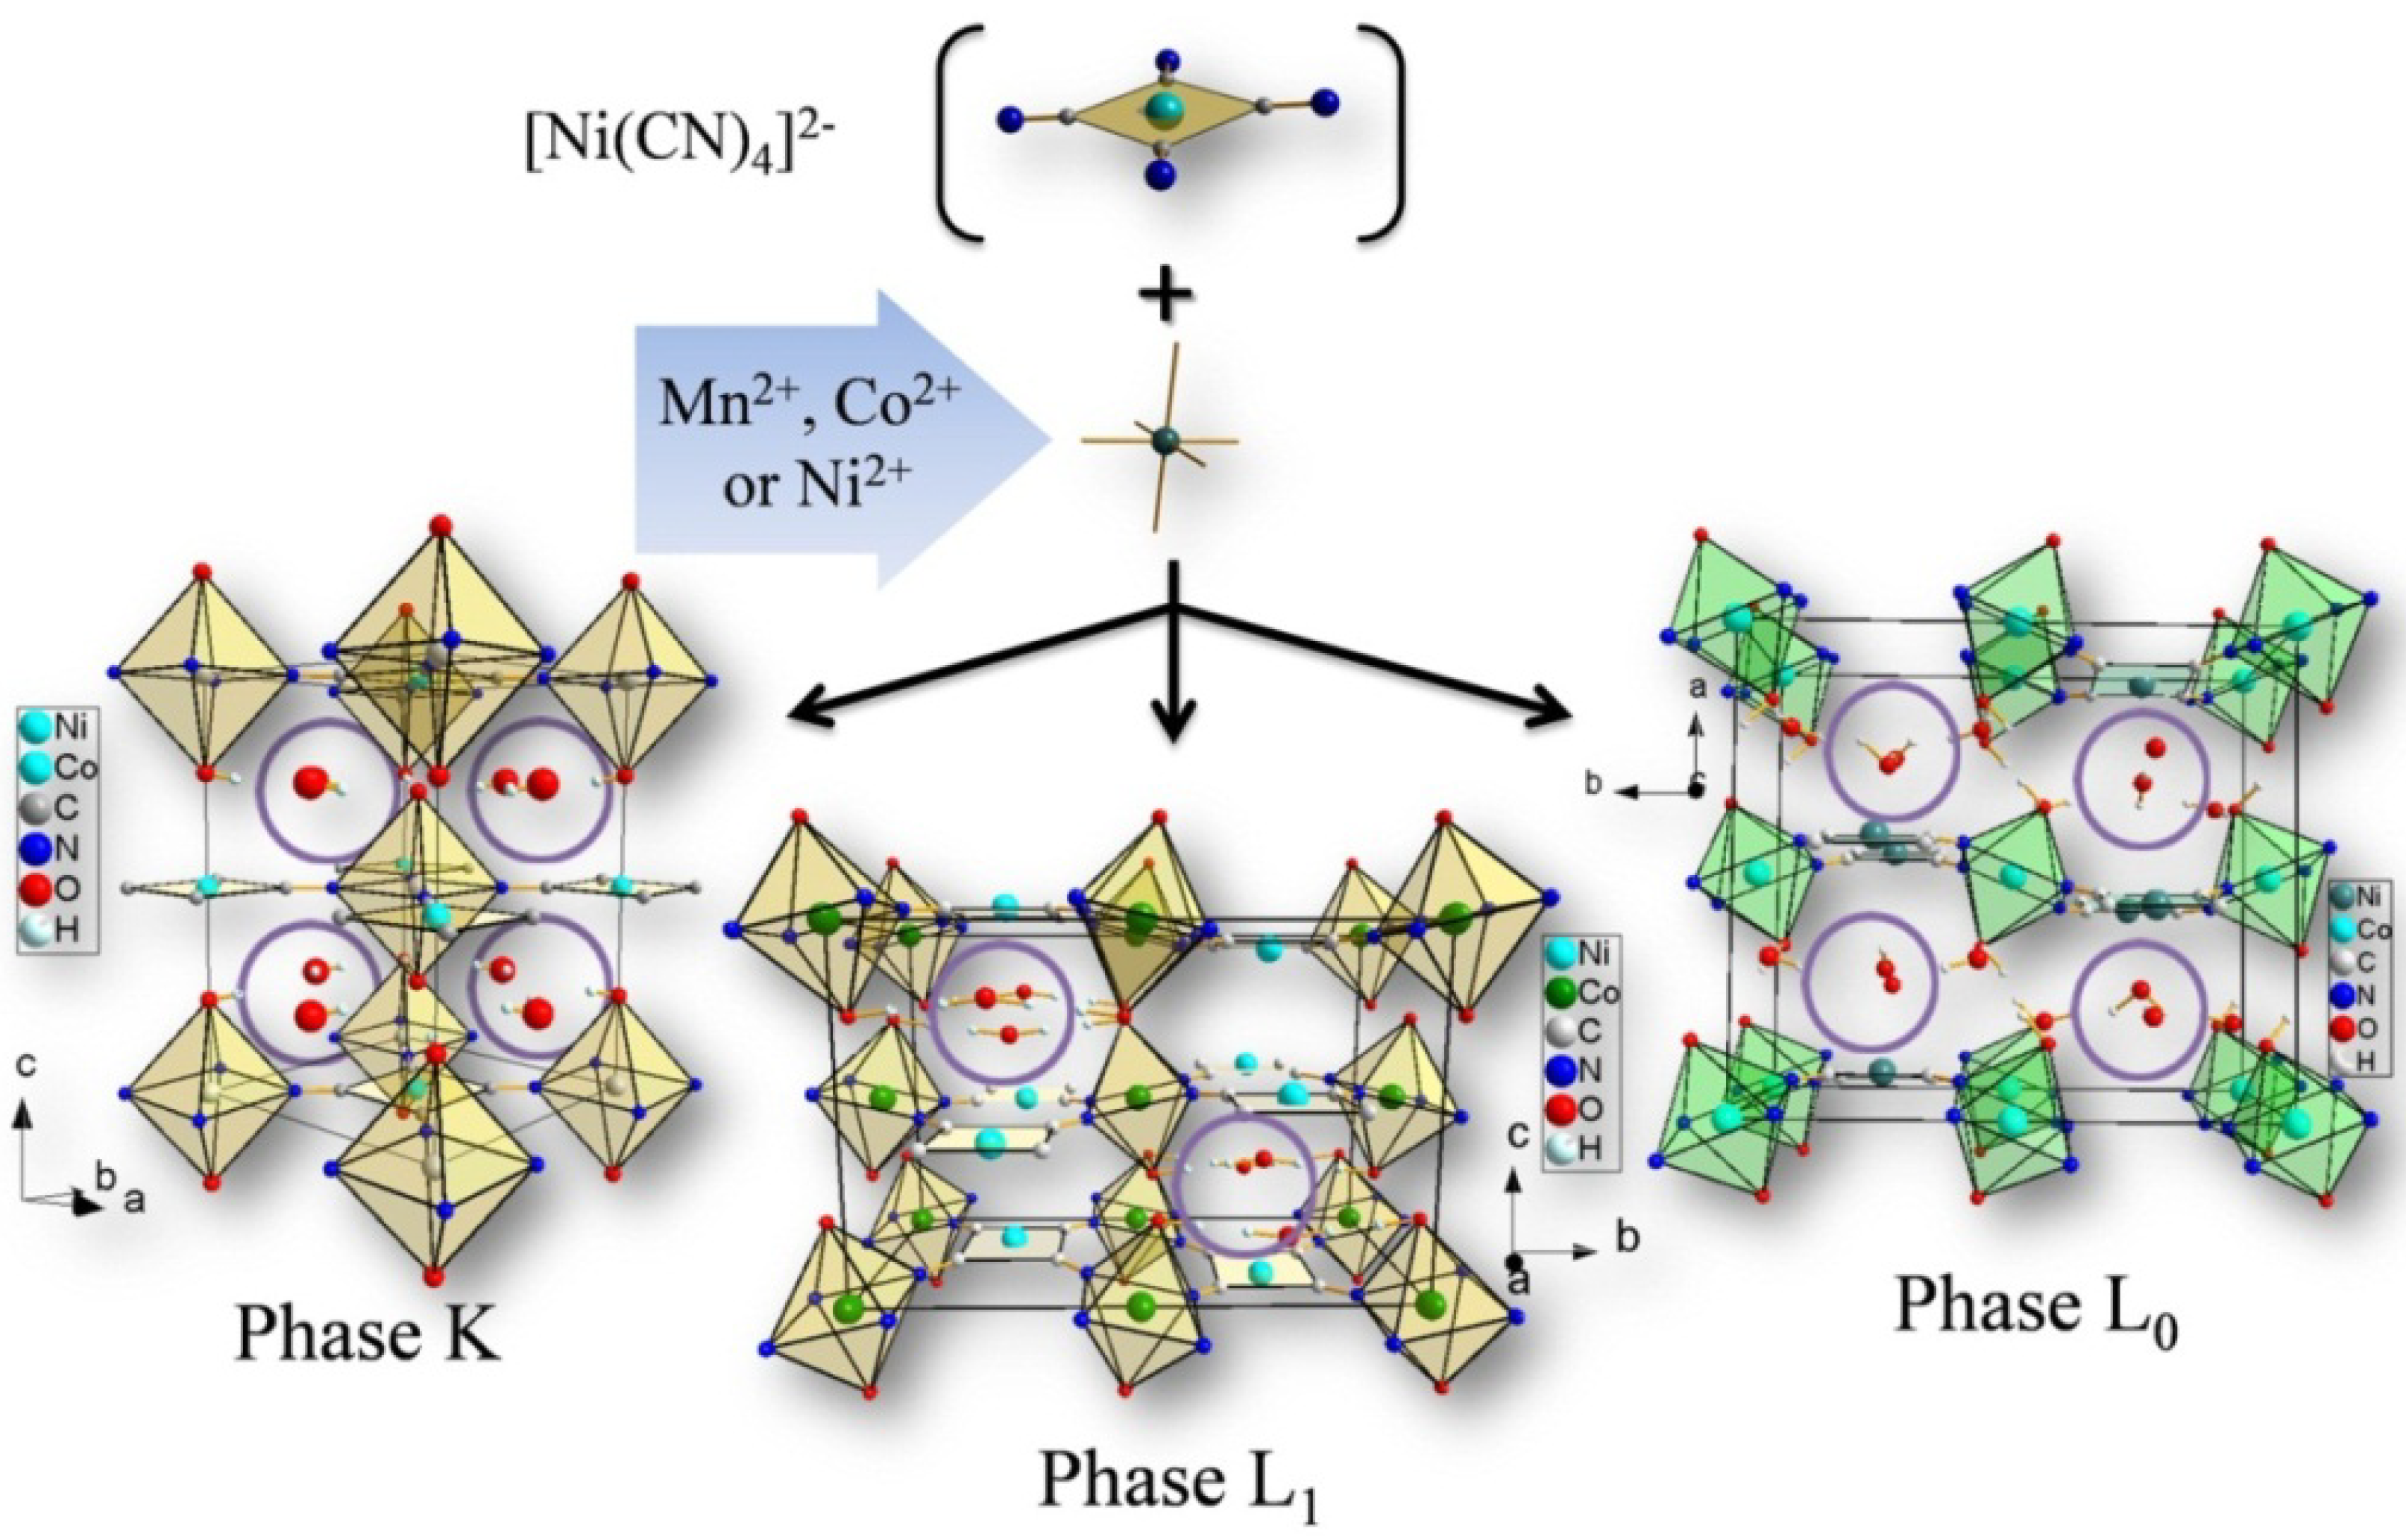
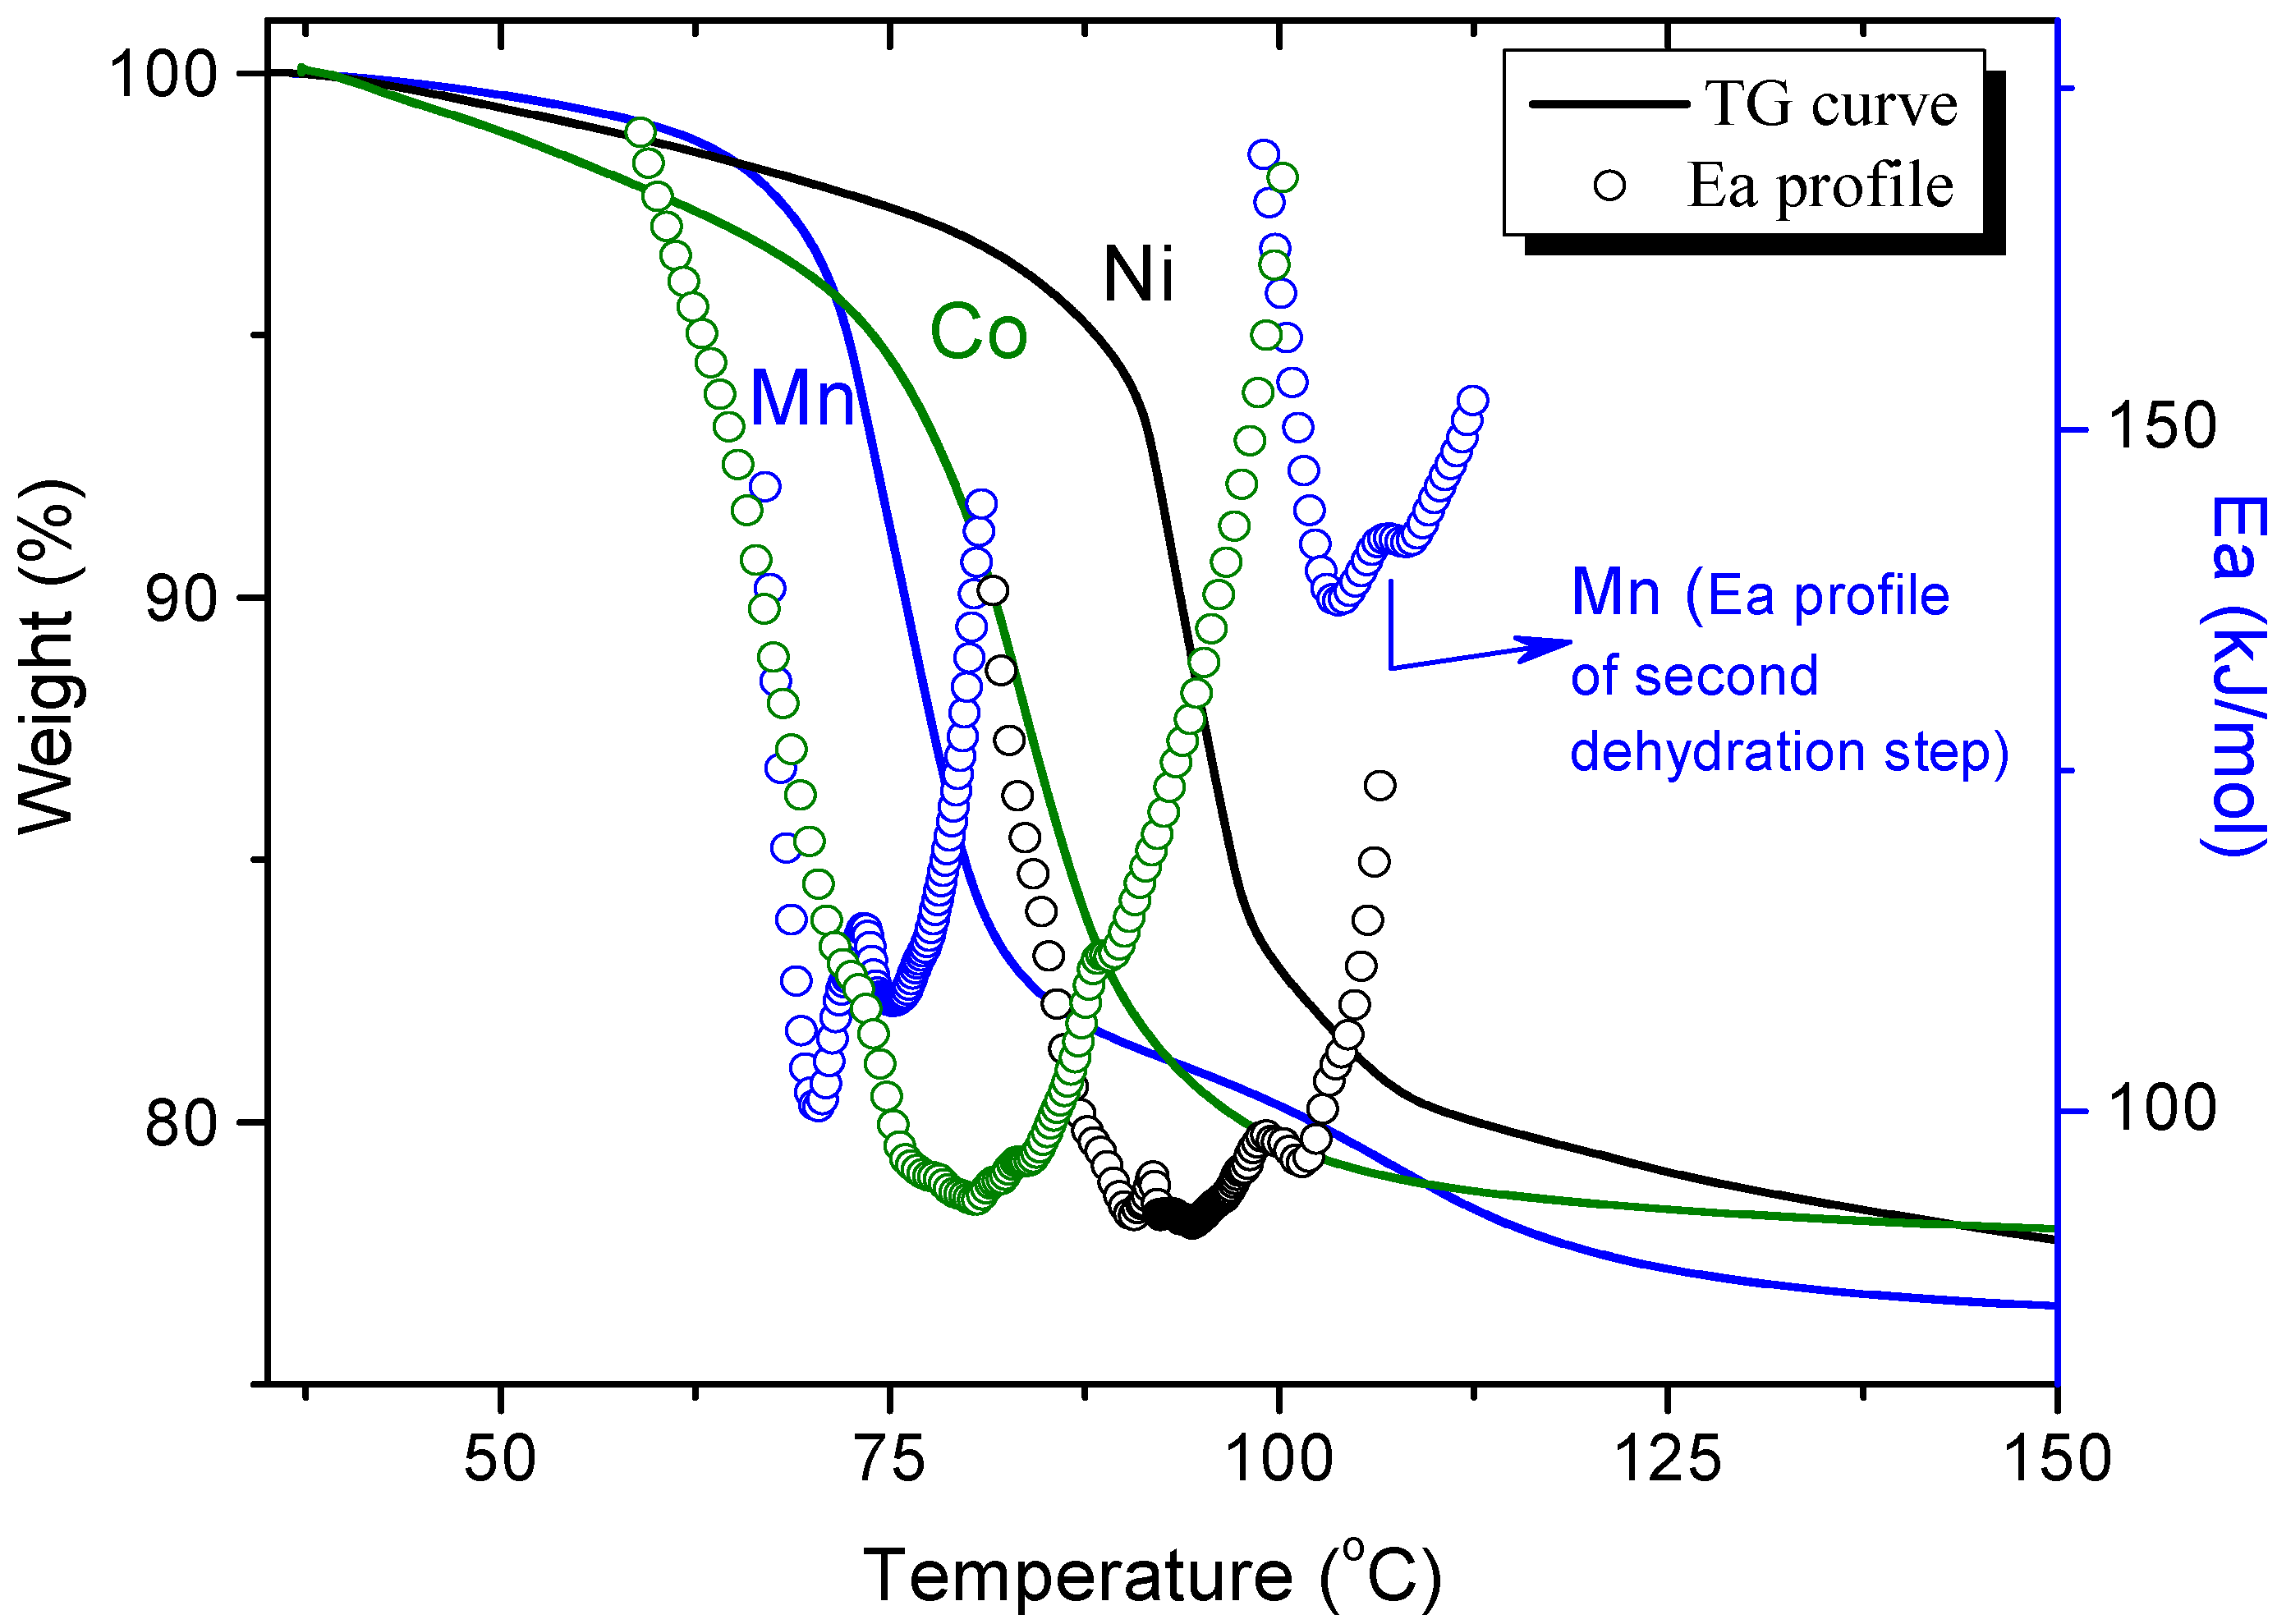
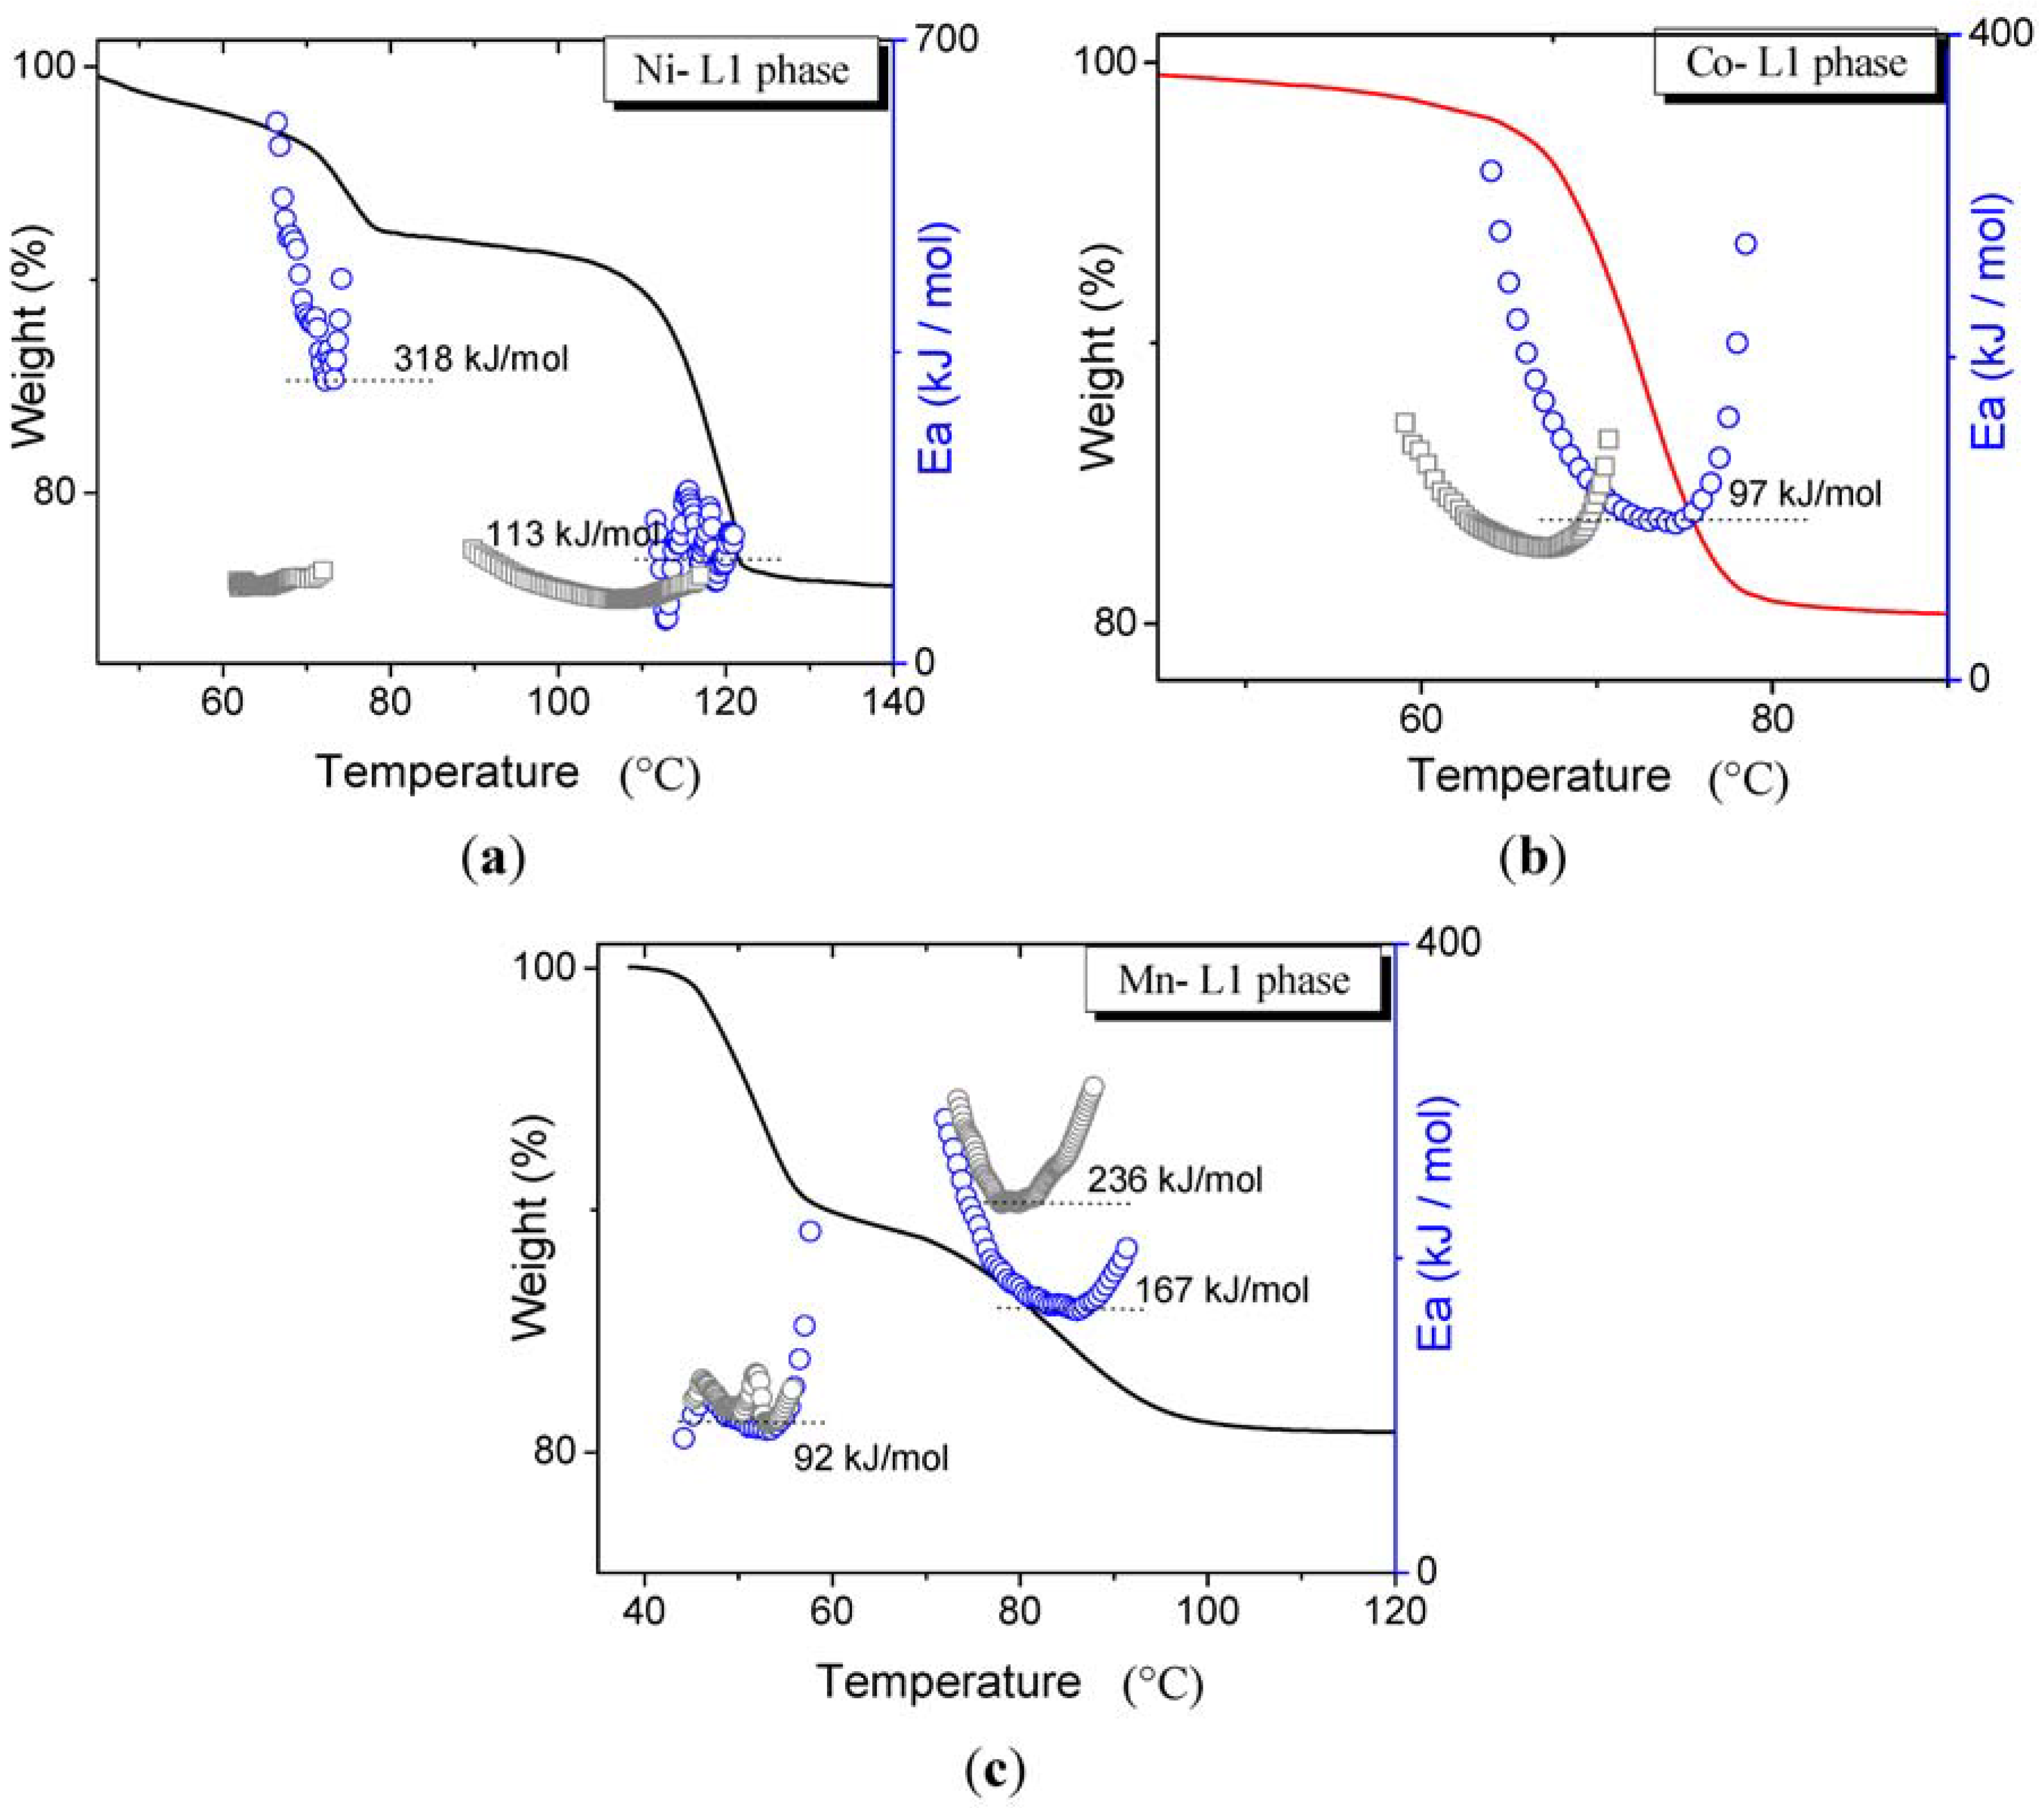
3.1. Dehydration with Different Transition Metals in the Same Structure Phase

In Figure 2 the thermogravimetric curve (TG) and its activation energies profiles for Mn2+, Co2+ and Ni2+ K-phases are shown, which correspond to the case where the samples crystallized in the same phase (see X-ray diffraction patterns in Figure S2 of the Supporting Information) with a different transition metal in the structure. It can be observed that all samples result fully dehydrated above 180 °C. The temperature at maximum dehydration rate and the general material stability follow the order: Ni2+ > Co2+ > Mn2+, a sequence that is expected to be determined by the polarizing power of the metal and the strength of its electrostatic interaction with the water molecules included in its structural cavities [28]. In general, the O–O distance among water molecules in the framework always increases from Ni2+ to Mn2+ in each of the phases [19].
Figure 2. Thermogravimetric curves and activation energies profiles for the K-phase, M(H2O)2[Ni(CN)4]·2H2O, of Ni2+, Co2+ and Mn2+.
Materials 06 01452 g002
According to the activation energy profiles shown in Figure 2 for the K-phase of Co and Ni, the minimum values of the activation energy are quite similar. In addition, the dehydration process for the two metals occurs in a single step and without distinction for the release of hydrogen-bonded and coordinated water molecules. The mechanism for dehydration is envisaged to be controlled by the continuous local reordering of the water molecules induced by the water chemical potential at the solid-gas interface and along the structure. In the case of the Mn K-phase two dehydration steps are well resolved, the first one involving three (two hydrogen bonded and one coordinated) of the total o four water molecules, and the last step involving only one coordinated water molecule; here, the increase in activation energy is consistent with the energetic differences between the bonding nature expected for hydrogen-bonded and coordinated water molecules. For this metal (Mn), the activation energy corresponding to the second dehydration step increases up to 140 kJ/mol, a value that is typical for the removal of coordinated water molecules [28].
Following this reasoning, we assume that the release of water molecules with an energy barrier on the order of 90 to 100 kJ/mol corresponds to diffusional processes modulated by multiple hydrogen bonds, a behavior known for laminar systems or hydrated compounds [29,30,31,32].

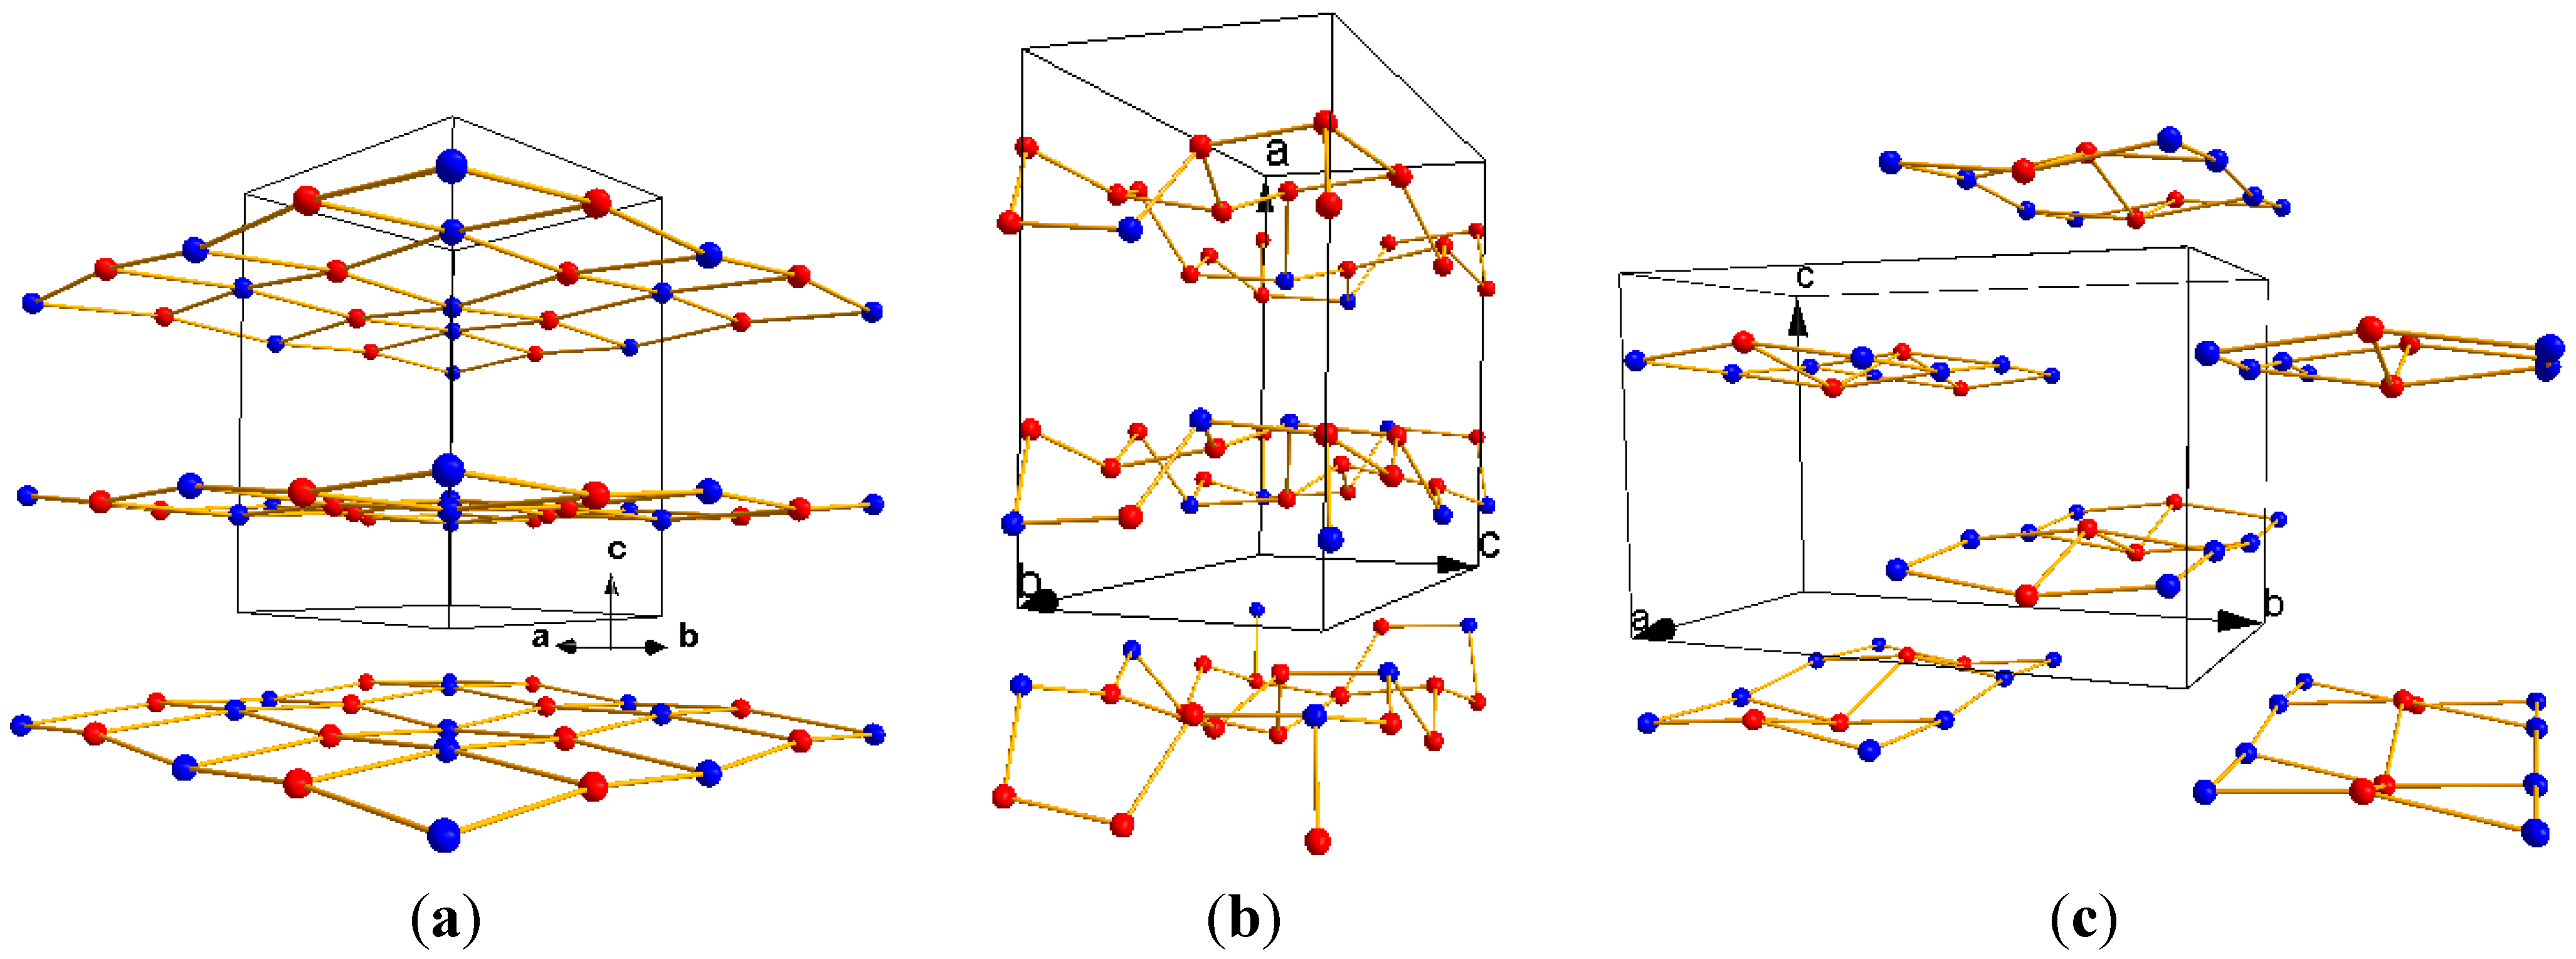
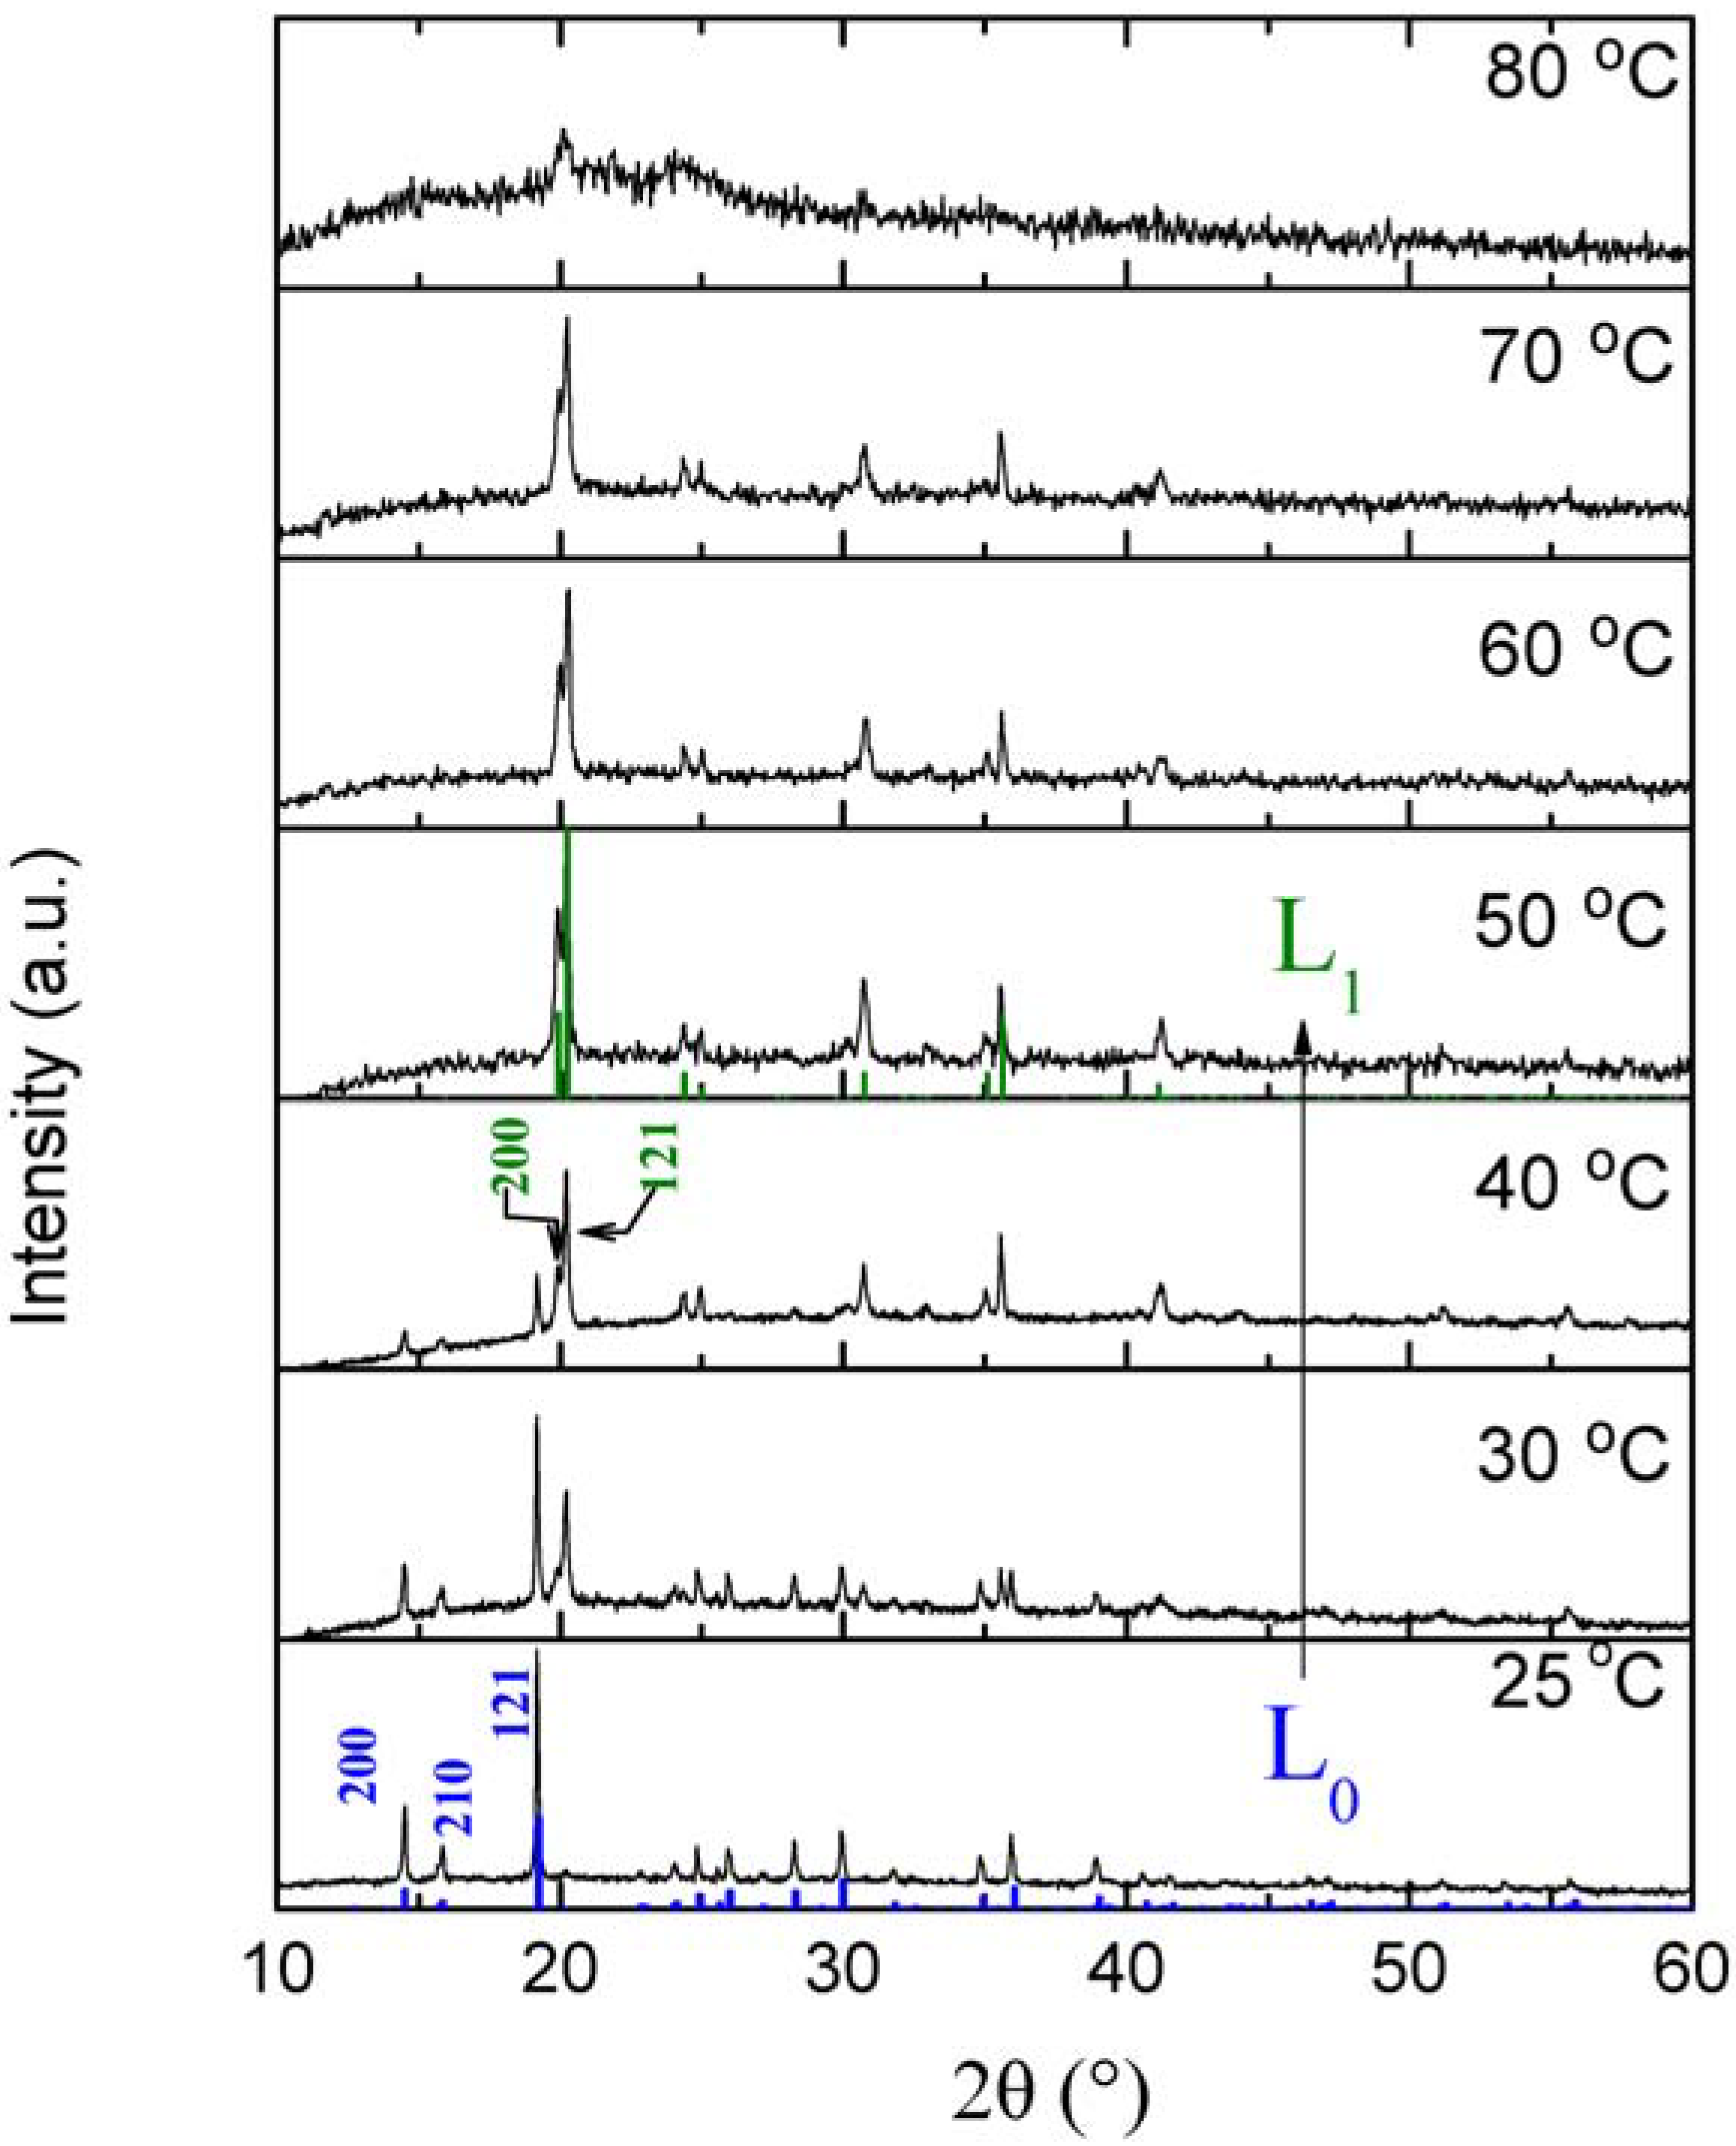
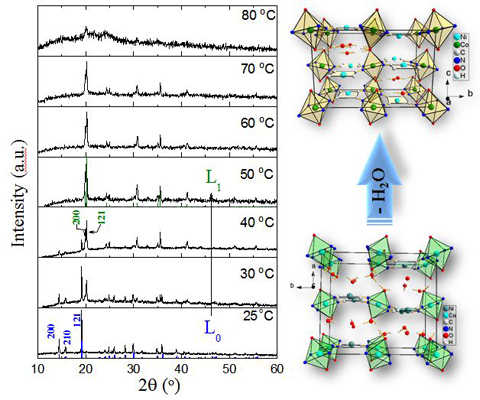
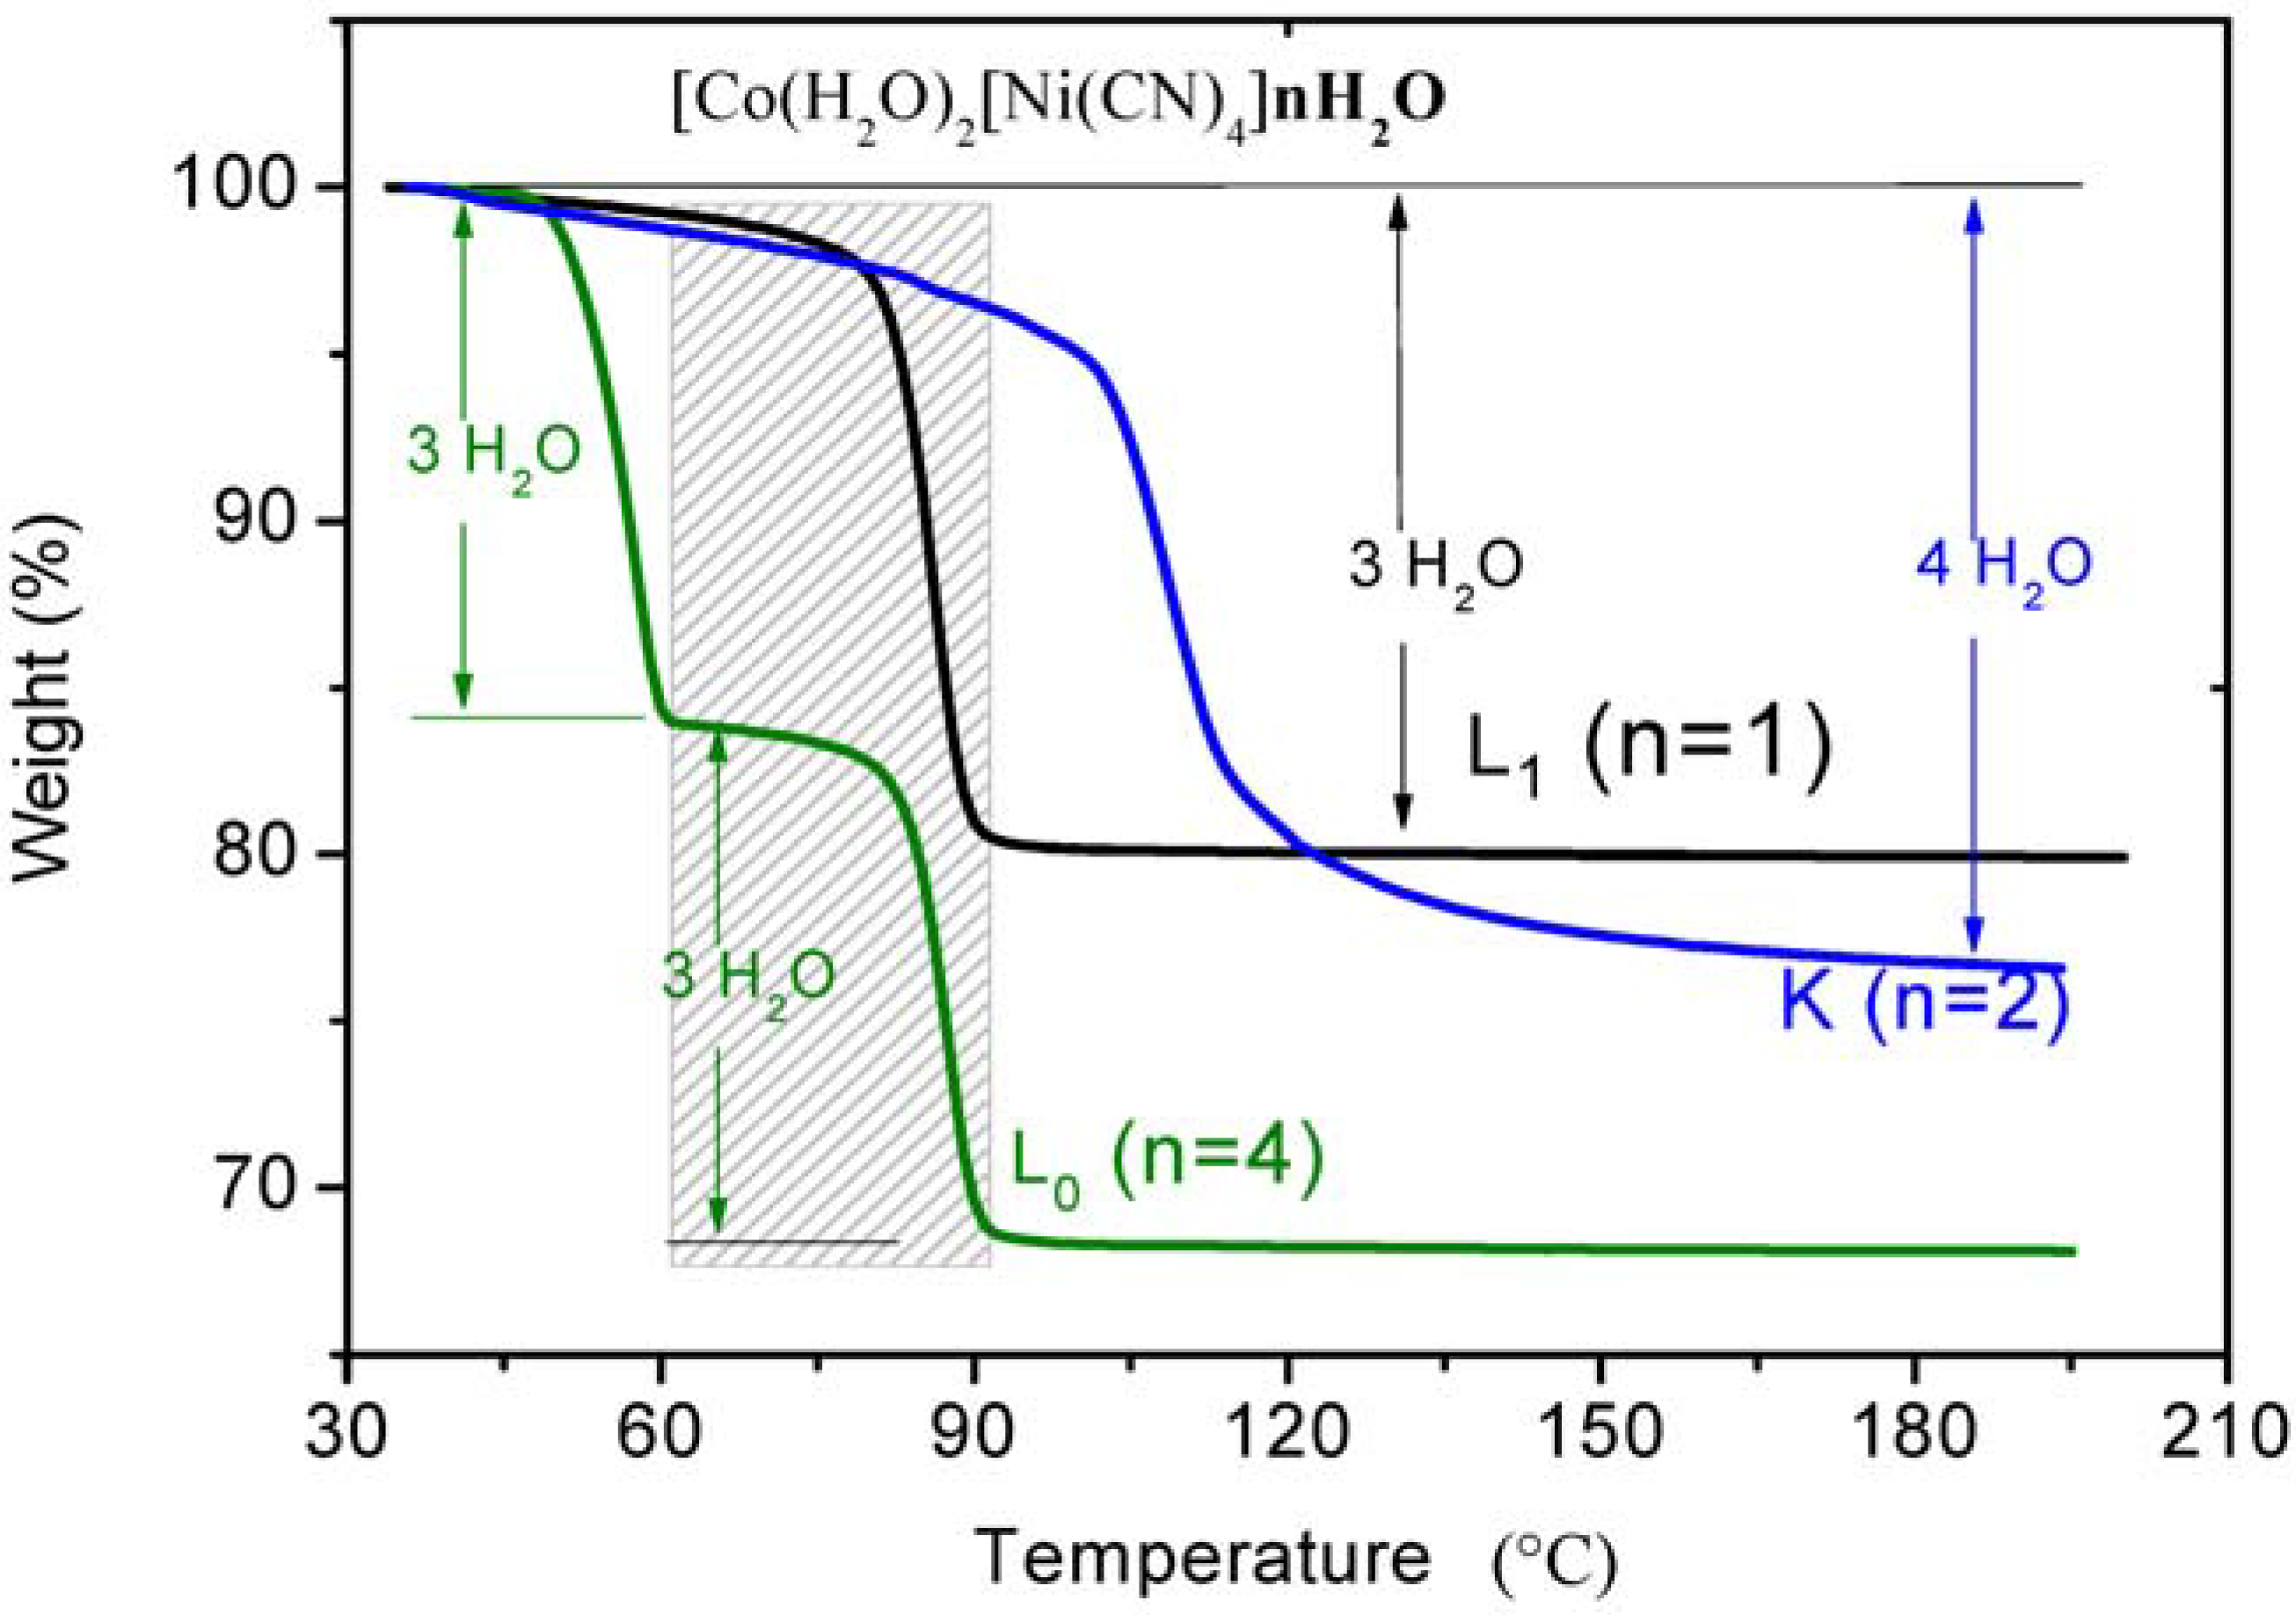
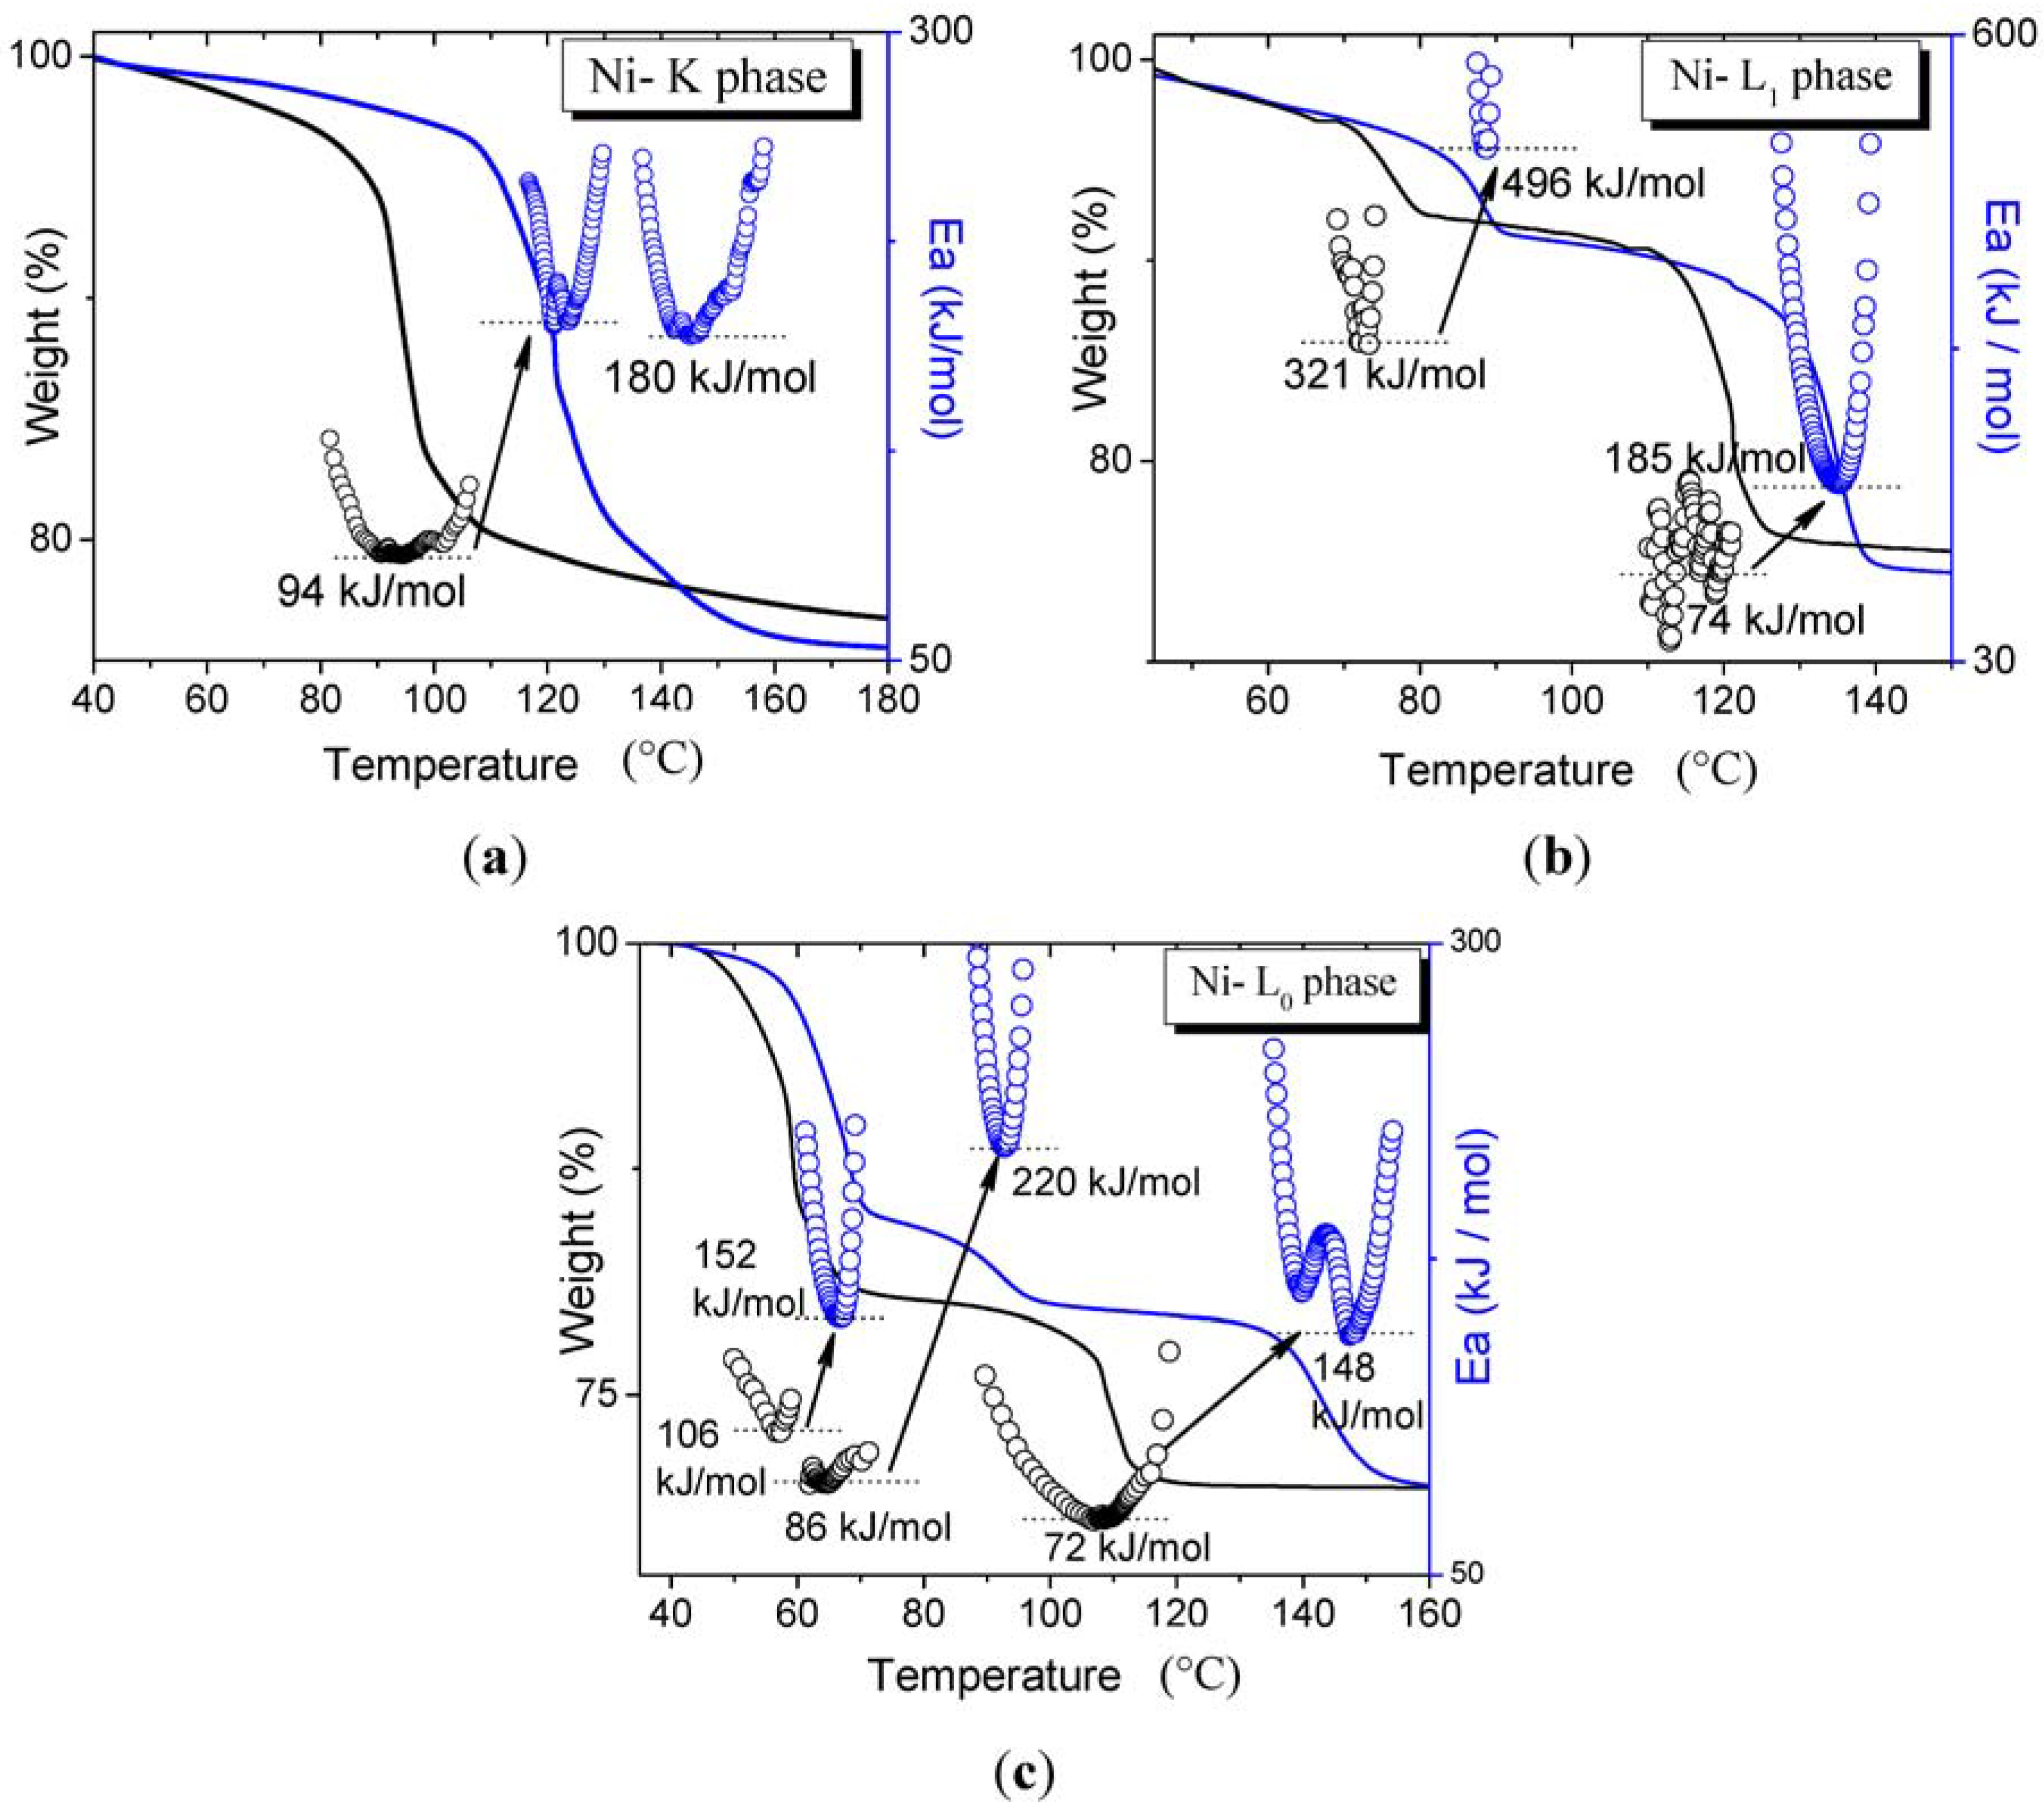
3.2. Dehydration with the Same Transition Metals in Different Phases

Figure 3 shows the TG curves for the same transition metal (Co2+) crystallizing in the 3 different structural modifications, wherein the total weight loss satisfactorily agrees with the number of water molecules found in each of the structures; 19.52% (2.98 water molecules), 23.42% (3.82 water molecules), and 31.88% (5.83 water molecules), which corresponds to the expected 3, 4 and 6 molecules for L1, K and L0 phases, respectively. In this case, the relative thermal stability order is L0 < L1 < K, which refers only to the completeness of the dehydration processes. Interestingly, in the L0 structure the shortest hydrogen bonds are found, hence, simple phenomenological arguments fail to explain the observed trend for the dehydration temperature. The interpretation of activation energy profiles in multistep dehydration processes of complex compounds is a challenging task related to the cooperative and anti-cooperative intermolecular interactions between water molecules and their host framework [33,34,35]. Another problematic issue in hydrogen bonding that is necessary to address for the interpretation of the dynamic rupture of hydrogen bonds is the local geometry of the water molecules network (homodromic, heterodromic or antidromic [36]); it is well known that the arrangement and clustering size affects the global energetics of the system [33].
Figure 3. Thermogravimetric curves (TGs) for Co(H2O)2[Ni(CN)4nH2O, n = 1, 2, 4 (L1, K and L0 phases). The framed area emphasizes the similarity between the dehydration of the L1 sample (second step) and the L0 sample.
Materials 06 01452 g003
In the present Hofmann’s crystal structures the water molecules organize along two-dimensional planes (see schematic representation in Figure 4), alternating their positions between the fixed octahedral coordination sites (defined by the metal position) and positions within the cavities in between the metals polyhedrons. Note that the water network consists of a continuous two-dimensional tetramer arrangement for the K phase, a hexagonal ice-like, two-dimensional network for the L0 phase and discrete arrangements of tetramers for the L1 phase. According to theoretical quantum calculations the tetramer configuration appears to represent the most stable water cluster [33], while the shortest hydrogen bonds of the L0 phase, which have a hexagonal ice-like configuration, are not necessarily the strongest [37].
Figure 4. Schematic representation of water two-dimensional sub-network in (a) K; (b) L0; and (c) L1 phases. Each sphere represents oxygen atoms in water molecules: the atoms in blue correspond to coordinated water molecules (note that the hydrogen atoms are omitted). The black lines delimit the unit cell in each structure and the arrows indicate the unit cell axes.
Materials 06 01452 g004
Following Figure 3, the phases L1 and K release the water molecules in a single step, indicating that the dehydration process takes place through a dynamic interchange between the water molecules located at diffusion channels and those at coordination positions in both structures. The first step in the TG curve, for the L0 phase, involves the loss of only three of the total four water molecules that are weakly interacting with the structure through hydrogen bonds; this takes place at a relatively low temperature (60 °C, see Figure 3). Subsequently, the coordinated water molecules of the L0 phase are released at 90 °C in a profile which resembles that of the L1 phase (see the framed area in Figure 3). This behavior is quite interesting because it suggests the occurrence of the transition from the L0 to the L1 phase after the release of the water molecules interacting through hydrogen bonds.
In order to corroborate the possible L0 to L1 structural transition, the L0-[Co(H2O)2Ni(CN)4]·4H2O sample was heated from room temperature to 80 °C and monitored every 10 °C by X-ray diffraction. Figure 5 shows the sequence of the X-ray diffraction patterns upon heating, in which the phase transition and finally the structural collapse once the dehydration completes at 80 °C can be clearly observed. According to the peak positions, the transition and collapse occur gradually but without noticeable change of the cell parameters.
Figure 5. Sequence of X-ray powder diffraction patterns of as-prepared Co(H2O)2[Ni(CN)4]·4H2O (L0 phase) from room temperature to 80 °C, showing the transition to the L1 phase upon dehydration and its further collapse into an amorphous material. Colored bar-plots correspond to diffraction lines expected for each of the pure phases: L0 (blue) and L1 (olive).
Materials 06 01452 g005
The transition involves a reduction of 25.3% of the cell volume, mainly resulting from a considerable contraction in the a axis parameter as shown in Table 1, which is also accompanied by a less pronounced expansion in the b and c axes. From Figure 5, the most noticeable changes are the collapse of the L0-{200}, {210} and {121} families of planes and their reconstruction in {002} and {121} of the L1 phase. As expected from the similarities between the structures, the crystallographic transition takes place in all the L0 phases of each metal, in a similar range of temperatures (see Figure S3 in Supporting Information). It can be envisaged that the loss of the shielding effect from water molecules upon dehydration of the L0 phase generates a local charge imbalance that provokes the displacement of sheets toward better stability (L1 phase). According to the temperature dependence of the cell parameters, this process seems to be critical rather than gradual; also note that both phases could coexist even at temperatures as low as 40 °C. In the L0 phases the only step worthwhile to analyze is the first dehydration step related to the L0 transition into the L1 phase; the stability follows the expected trend according to the O–O distance, however, the activation energy for Ni2+ and Mn2+ are essentially the same (108 and 106 kJ/mol, respectively) while for Co2+ it increases to 168 kJ/mol. There is no simple, straightforward explanation for this tendency, however, if one analyzes the temperatures of the maximum rate of dehydration, the order is Co2+ (46 °C), Mn2+ (52 °C) and Ni2+ (58 °C); hence, the Co–L0 phase is more affected by the simultaneous presence of both phases and in the mixed character of the mechanism.
Table 1. Calculated cell parameters and volume for L0 and L1 phases.
L0 phaseL1 phase
Cell Parameters (Å)a = 12.195(2)a = 7.115(2)
b = 13.885(3)b = 14.264(3)
c = 7.143(3)c = 8.898(1)
Volume (Å3)1209.5(3)903.0(2)
On the other hand, the L1 phases involve two main steps of dehydration except for Co, where dehydration occurs in only one step; in Figure 6 the thermogravimetric curves with their corresponding activation energy profiles for each of the metals are shown.
Figure 6. Thermogravimetric curves and the activation energy profiles for the three L1 phases (M(H2O)2[Ni(CN)4]·2H2O, where M = (a) Ni2+; (b) Co2+ and (c) Mn2+). Gray points in each of the plots correspond to activation energy profiles of the L1 phase resulting from heating of the L0 phase.
Materials 06 01452 g006
Here it is worth mentioning that as L0 transforms into L1 during dehydration, we would expect that Ea for the second step of dehydration of L0 were similar to those measured in pure as-prepared L1. This inference is essentially true, within 10% of the minimum energy value, except for nickel in which the value increased to more than threefold in the first step, while for manganese the activation energy decreased from 236 to 167 kJ/mol in the second step (see gray points in the plots). Also observe that the general tendency is that L1 derived from L0 (during thermogravimetric studies) always have a slightly lower dehydration temperature. The calculated cell parameters and the weight loss for both types of L1 phases (as prepared or obtained from thermogravimetric study) are the same, therefore, changes in activation energies cannot be attributed to structural dissimilarities or to differences in the composition and content of water in the structure. As the changes in morphologies might strongly influence the diffusional paths, additional SEM characterization were performed in order to explain this behavior (see, for example, Figure 7).
Figure 7. SEM micrographs of: (a) as prepared L0 phase; (b) L1 derived from L0 after heating and (c) the as prepared L1 phase, the insets shows a magnification of a selected area.
Materials 06 01452 g007
As can be observed in Figure 7a,b, the structural transition takes place without change in the morphology of the crystallites in spite of the volume change during transformation. Hence, the L1 phase derived from L0 conserves the initial L0 morphology. In general, all samples show a plate-like morphology which is a manifestation of the lamellar character of the crystal structure; however, substantial differences are found in crystal cleavage and flatness of the microcrystals. Contradictorily, the as-prepared L1 phase exhibits a smaller particle size than L1 derived from heated L0, suggesting that lowering in dehydration temperature is not directly related to the diffusional pathway during water release. Despite the low quality of the micrograph of the Ni-L0 phase, it appears that this sample is different from the rest of the L0 materials by having very small and organized flake-like crystals (see Figure 8) with an interparticle mesoporous morphology, which could explain the lower activation energy for Ni-L1 derived from L0.
Samples of anhydrous solids obtained by progressive and moderate heating on the herein studied materials for the three considered metals have been used in other work for pyrazine and imidazole intercalation, and 3D crystalline solids were always formed [10,11,12,13,38,39]. This is in correspondence with the recorded TG curves. Once all the water molecules are removed, the layered material remains stable and only above 280 °C it is progressively disrupted with the evolution of cyanogen, C2N2, and the formation of reduced species of the involved metals, which are then oxidized in the presence of air.
Figure 8. SEM micrograph of the as prepared Ni-L0 phase.
Materials 06 01452 g008

3.3. The Influence of Water Partial Pressure

With the purpose of observing the influence of chemical potential of water in the kinetics of the dehydration processes, the thermal profiles were studied under fixed water partial pressure (3130 Pa) in the purging gas flow, and some of the results are presented in Figure 9 as an example. For comparison purposes, thermogravimetric curves without the presence of water are also shown (plots in black).
It can be observed that there is a shift of all the curves to higher temperatures due to the increase of the water partial pressure; this is a general tendency for all the samples. The shift in the temperature corresponding with the maximum rate ranges from 10 °C to 35 °C and is accompanied by a substantial increase of the minimum activation energy. The temperature increase is intuitively expected on the basis of the Le Chatelier’s principle; however, the observed increase in activation energy implies a considerable reduction of the dehydration rate, which is an indication of a transition state characterized by a dissociative mechanism (negative activation volume change, see details in Section 2 of the Supporting Information). This is also predictable behavior since dehydration processes mainly involve the breaking of hydrogen and coordination bonds. In general, it is noticed that increasing the water partial pressure increases the Ea dependence on the reaction advance, hence, the activation energy profiles become more pronounced and symmetric around a minimum close to α ≅ 0.5, which is an indication of the complex nature of the dehydration process [29,40]. In some cases (Ni-K phase, Figure 9a), the Ea profile splits into two well-resolved processes with similar values of the activation energy, suggesting a separation of contributions from hydrogen bond water and the coordinated water molecules, and supporting the idea that both types of water molecule leave the material by the same mechanism. However, although the results are reproducible, further detailed research is necessary to discard the possible influence of experimental parameters. In the presence of higher water partial pressure, all the previous trends change, where the K phase appears to be more affected than any other phase; for example, the Co-K phase suffers an increment of the activation of more than three times the initial value.
The Ni-L1 phase is the only case where the activation energies result to be surprisingly high in the first step of dehydration (even without the presence of water). There are few examples in the literature that report similar values for dehydration processes [40,41,42]; we assume that this behavior could be related to the discrete character of the water sub-network in this phase which, in turn, increases the initial barrier for water diffusion; however, further exhaustive research is required for a better insight into this phenomenon.
Figure 9. Thermogravimetric curves and their corresponding Ea profiles for (a) Ni-K phase; (b) Ni-L1 phase and (c) Ni-L0 phase. The data in blue corresponds to samples under higher water partial pressure (3130 Pa), while plots in black represent the profiles without water. Arrows indicate the correspondence between each step, with and without the presence of water.
Materials 06 01452 g009

4. Conclusions

The dehydration and structural collapse of the Hofmann’s layered compounds, M(H2O)2[Ni(CN)4]·nH2O with M = Mn2+, Co2+, Ni2+ and n = 1, 2 4 were studied by means of modulated thermogravimetry and X-ray diffraction techniques. In general, the temperature at the maximum dehydration rate and the material stability follows the order: Ni2+ > Co2+ > Mn2+, a sequence that is determined by the metal polarizing power and the strength of its electrostatic interaction with the water molecule included in its structural cavities, and defines the mean intermolecular distance. Themogravimetric curves and X-ray diffraction patterns show that during the first step of dehydration L0 transforms into the L1 phase, and the subsequent dehydration at higher temperatures entails the structural collapse of the materials; the phase transition results from the loss of the shielding effect from water molecules upon dehydration, which generates a local charge imbalance provoking the displacement of sheets toward better stability (L1 phase). The increase in water partial pressure results in a shift of the thermogravimetric curves to higher temperatures, accompanied by an increase of the activation energy in most of the materials. The dehydration process takes place without disruption of the layer structure. Only above 280 °C, is progressive decomposition of layers upon heating observed.

Acknowledgments

Omar Reyes thanks the financial support from the PIFI-IPN program and CONACyT for the PhD scholarship. The authors gratefully acknowledge the partial financial support from FOMIX-Yucatan grant No. 170120 and CONACyT projects 129048 and 174247. The authors thank Gerko Oskam for reviewing the manuscript.

References

  1. Férey, G. Microporous solids: From organically templated inorganic skeletons to hybrid frameworks...ecumenism in chemistry. Chem. Mater. 2001, 13, 3084–3098. [Google Scholar] [CrossRef]
  2. Paul, A.; Wright, M.D. Microporous Framework Solids; RSC Materials Monographs; Royal Society of Chemistry: London, UK, 2008; Volume 4. [Google Scholar]
  3. Chang, C.D.; Silvestri, A.J. The conversion of methanol and other O-compounds to hydrocarbons over zeolite catalysts. J. Catal. 1977, 47, 249–259. [Google Scholar] [CrossRef]
  4. Rowsell, J.L.C.; Yaghi, O.M. Metal–organic frameworks: A new class of porous materials. Microporous Mesoporous Mater. 2004, 73, 3–14. [Google Scholar] [CrossRef]
  5. Rowsell, J.L.C.; Yaghi, O.M. Effects of Functionalization, catenation, and variation of the metal oxide and organic. Linking units on the low-pressure hydrogen adsorption properties of metal-organic frameworks. J. Am. Chem. Soc. 2006, 128, 1304–1315. [Google Scholar] [CrossRef] [PubMed]
  6. Côté, P.; Benin, A.I.; Ockwig, N.W.; Keeffe, M.O.; Matzger, A.J.; Yaghi, O.M. Porous, crystalline, covalent organic frameworks. Science 2005, 310, 1166–1170. [Google Scholar] [CrossRef] [PubMed]
  7. El-Kaderi, H.M.; Yaghi, O.M.; Hunt, J.R.; Mendoza-Cortes, J.L.; Côté, A.P.; Taylor, R.E.; Keeffe, M.O. Designed synthesis of 3D covalent organic frameworks. Science 2007, 316, 268–272. [Google Scholar] [CrossRef] [PubMed]
  8. Hayashi, H.; Côté, A.P.; Furukawa, H.; O’Keeffe, M.; Yaghi, O.M. Zeolite A imidazolate frameworks. Nat. Mater. 2007, 6, 501–506. [Google Scholar] [CrossRef] [PubMed]
  9. McKeown, N.B.; Budd, P.M. Polymers of intrinsic microporosity (PIMs): Organic materials for membrane separations, heterogeneous catalysis and hydrogen storage. Chem. Soc. Rev. 2006, 35, 675–683. [Google Scholar] [CrossRef] [PubMed]
  10. Li, Y.; Liu, Y.; Wang, Y.; Leng, Y.; Xie, L.; Li, X. Hydrogen storage properties of [M(Py){Ni(CN)4}] (M = Fe, Co, Ni). Int. J. Hydrog. Energy 2007, 32, 3411–3415. [Google Scholar] [CrossRef]
  11. Culp, J.T.; Natesakhawat, S.; Smith, M.R.; Bittner, E.; Matranga, C.; Bockrath, B.Y. Hydrogen storage properties of rigid three-dimensional hofmann clathrate derivatives: The effects of pore size. J. Phys. Chem. C 2008, 112, 7079–7083. [Google Scholar] [CrossRef]
  12. Culp, J.T.; Smith, M.R.; Bittner, E.; Bockrath, B. Hysteresis in the physisorption of CO2 and N2 in a flexible pillared layer nickel cyanide. J. Am. Chem. Soc. 2008, 130, 12427–12434. [Google Scholar] [CrossRef] [PubMed]
  13. Nishikiori, S.; Yoshikawa, H.; Sano, Y.; Iwamoto, T. Inorganic–organic hybrid molecular architectures of cyanometalate host and organic guest systems: Specific behavior of the guests. Acc. Chem. Res. 2005, 38, 227–234. [Google Scholar] [CrossRef] [PubMed]
  14. Büttner, H.G.; Kearley, G.J.; Howard, C.J.; Fillaux, F. Structure of the Hofmann clathrates Ni(NH3)2Ni(CN)4·2C6D6 and Zn(NH3)2Ni(CN)4·2C6H6. Acta Cryst. 1994, B50, 431–435. [Google Scholar] [CrossRef]
  15. Dunbar, K.R.; Heintz, R.A. Chemistry of transition metal cyanide compounds: Modern perspectives. Inorg. Chem. 1997, 45, 283–391. [Google Scholar]
  16. González, M.; Lemus-Santana, A.A.; Rodríguez-Hernández, J.; Knobel, M.; Reguera, E. π–π interactions and magnetic properties in a series of hybrid inorganic–organic crystals. J. Solid State Chem. 2013, 197, 317–322. [Google Scholar] [CrossRef]
  17. Mathey, Y.; Mazieres, C. Les phases cyanures de nickel (II) hydrates. Can. J. Chem. 1974, 52, 3637–3644. [Google Scholar] [CrossRef]
  18. Lemus, A.A.; Rodriguez Hernandez, J.; del Castillo, L.F.; Basterrechea, M.; Reguera, E. Unique coordination of pyrazine in T[Ni(CN)4]·2pyz with T = Mn, Zn, Cd. J. Solid State Chem. 2009, 182, 757–766. [Google Scholar] [CrossRef]
  19. Rodríguez-Hernández, J.; Lemus-Santana, A.A.; Vargas, C.N.; Reguera, E. Three structural modifications in the series of layered solids T(H2O)2[Ni(CN)4xH2O with T = Mn, Co, Ni: Their nature and crystal structures. Comptes Rendus Chim. 2012, 15, 350–355. [Google Scholar] [CrossRef]
  20. Menzinger, M.; Wolfgang, R. The meaning and use of the arrhenius activation energy. Angew. Chem. Int. Ed. 1969, 8, 438–444. [Google Scholar] [CrossRef]
  21. Vyazovkin, S.; Wight, C.A. Kinetics in solids. Annu. Rev. Phys. Chem. 1997, 48, 125–149. [Google Scholar] [CrossRef] [PubMed]
  22. Vyazovkin, S.; Linnert, W. Isokinetic relationships at the thermal decomposition of tetranuclear copper(II)-complexes. Int. J. Chem. Kinet. 1995, 27, 597–604. [Google Scholar] [CrossRef]
  23. Bertrand, G.; Lallemant, M.; Watelle, G. Propos sur l’interpretation de l’energie d’activation experimentale Cas des decompositions endothermiques solide-gaz. J. Therm. Anal. 1978, 13, 525–542. [Google Scholar] [CrossRef]
  24. He, G.; Riedl, B.; Aït-Kadi, A. Model-free kinetics: Curing behavior of phenol formaldehyde resins by differential scanning calorimetry. J. Appl. Polym. Sci. 2003, 87, 433–440. [Google Scholar] [CrossRef]
  25. Vyazovkin, S.V.; Lesnikovich, A.I. An approach to the solution of the inverse kinetic problem in the case of complex processes: Part 1. Methods employing a series of thermoanalytical curves. Thermochim. Acta 1990, 165, 273–280. [Google Scholar] [CrossRef]
  26. Rodriguez-Gattorno, G.; Martinez-Hernández, A.; Aleman-Vazquez, L.O.; Torres-Garcia, E. Structural and thermal study of carbon-modified molybdenum sub-oxide catalysts. Appl. Catal. A 2007, 321, 117–124. [Google Scholar] [CrossRef]
  27. Darriet, B.; Rat, M.; Galy, J.; Hagenmuller, P. Sur quelques nouveaux pyrochlores des systemes MTO3 WO3 et MTO3 TeO3 (M = K, Rb, Cs, Tl; T = Nb, Ta). Mater. Res. Bull. 1971, 6, 1305–1316. [Google Scholar] [CrossRef]
  28. Zhang, Y. Electronegativities of elements in valence states and their applications. Inorg. Chem. 1982, 21, 3886–3889. [Google Scholar] [CrossRef]
  29. Steiner, T. The hydrogen bond in the solid state. Angew. Chem. Int. Ed. 2002, 41, 48–76. [Google Scholar] [CrossRef]
  30. Holt, J.B.; Cutlert, I.B.; Wadsworth, M.E. Kinetics of the Thermal Dehydration of Hydrous Silicates. In Proceedings of the Twelfth National Conference on Clays and Clay Minerals; International Series of Monographs on Earth Sciences; Symposium Publications Division, Pergamon Press: Atlanta, GA, USA, 1964; Volume 19, pp. 55–67. [Google Scholar]
  31. Koga, N.; Tanaka, H. Accommodation of the actual solid-state process in the kinetic model function. I. Significance of the non-integral kinetic exponents. J. Therm. Anal. 1994, 41, 455–469. [Google Scholar] [CrossRef]
  32. Valente, J.S.; Rodriguez-Gattorno, G.; Valle-Orta, M.; Torres-García, E. Thermal decomposition kinetics of MgAl layered double hydroxides. Mater. Chem. Phys. 2012, 133, 621–629. [Google Scholar] [CrossRef]
  33. Xantheas, S.S. Cooperativity and hydrogen bonding network in water clusters. Chem. Phys. 2000, 258, 225–231. [Google Scholar] [CrossRef]
  34. Rivelino, R.; Canuto, S. Theoretical study of mixed hydrogen-bonded complexes: H2O–HCN–H2O and H2O–HCN–HCN–H2O. J. Phys. Chem. A 2001, 105, 11260–11265. [Google Scholar] [CrossRef]
  35. Luck, W.A.P. The importance of cooperativity for the properties of liquid water. J. Mol. Struct. 1998, 448, 131–142. [Google Scholar] [CrossRef]
  36. Saenger, W. Structure and dynamics of water surrounding biomolecules. Ann. Rev. Biophys. Biophys. Chem. 1987, 16, 93–114. [Google Scholar] [CrossRef]
  37. Bürgi, H.B.; Dunitz, J.D. Can statistical analysis of structural parameters from different crystal environments lead to quantitative energy relationships? Acta Cryst. B 1988, 44, 445–448. [Google Scholar] [CrossRef]
  38. Lemus-Santana, A.A.; Rodríguez-Hernández, J.; González, M.; Demeshko, S.; Ávila, M.; Knobel, M.; Reguera, E. Synthesis and characterization of T[Ni(CN)4]·2pyz with T = Fe, Ni; pyz = pyrazine: Formation of T-pyz–Ni bridges. J. Solid State Chem. 2011, 184, 2124–2130. [Google Scholar] [CrossRef]
  39. Rodríguez-Hernández, J.; Lemus-Santana, A.A.; Ortiz-Lopez, J.; Sandoval, S.J.; Reguera, E. Low temperature structural transformation in T[Ni(CN)4xpyz with x = 1, 2; T = Mn, Co, Ni, Zn, Cd; pyz = pyrazine. J. Solid State Chem. 2010, 183, 105–113. [Google Scholar] [CrossRef]
  40. Martin, W.F.; Feller, D.; Dixon, D.A. Hydrogen bond energy of the water dimer. J. Phys. Chem. 1996, 100, 2993–2997. [Google Scholar] [CrossRef]
  41. Zhu, H.; Xu, J.; Varlashkin, P.; Long, S.; Kidd, C. Dehydration, hydration behavior, and structural analysis of fenoprofen calcium. J. Pharm. Sci. 2001, 90, 845–859. [Google Scholar] [CrossRef] [PubMed]
  42. Weber, J.N.; Greer, R.T. Dehydration of serpentine: Heat of reaction and reaction kinetics at PH2O = 1 atm. Am. Mineral. 1965, 50, 450–464. [Google Scholar]

