2. Basic Concepts
In this section, we review some kinematic relationships for finite deformations of incompressible, hyperelastic materials. First, let us consider a material particle at the place
X =
Xkek in an initially undeformed reference configuration of a body. When subjected to a prescribed deformation, the particle at
X moves to the place
X =
xkek in the current configuration of the body in a common rectangular Cartesian frame
φ with the origin at
O and an orthonormal basis
ek. An isochoric deformation is described by:
in which λ
i,
i = 1, 2 and 3, denote the principal stretches in
φ. The Cauchy–Green deformation tensor
B =
FFT has the form:
where
ejk =
ej ⊗
ek,
ei, are associated orthonormal principal directions; and
F is the usual deformation gradient. The magnitude of the strain at a material point
X, also called the
strain intensity and denoted by
m, is defined by
![Materials 06 02873 i001]()
where
tr denotes the trace operation. In the undeformed state
F =
1, and the strain intensity
; otherwise
for isochoric deformations [
21].
The principal invariants
Ik of
B are defined by:
Thus, the magnitude
m of
B as a function of the invariants is given by:
here
when and only when
λ = 1, the unstrained deformation state. Also, for all deformations of an incompressible material,
I3 = 1.
To model the material stress-softening behavior, we shall assume that the microstructural material damage is characterized by a certain isotropic and non-monotonous increasing function
F(
m;
M) that depends on the material strain intensity
m and satisfies the conditions:
where
M represents the maximum previous strain intensity at the point at which the material is unloaded from its virgin material path. The softening function
F(
m;
M) is determined by a constitutive equation that describes the evolution of micro-structural changes that begin immediately upon deformation from the natural, undistorted state of the virgin material. We assume that
F(
m;M) is a positive non-monotones-increasing function of the strain intensity on the interval
. If we let
M be the amount of stretch at the point at which the material is unloaded and fix the maximum previous strain intensity energy at
m = M, then the stress-softening material response for subsequent unloading and reloading again from an unstrained state, or from any other elastic point for which
m = M is defined by the following time-independent constitutive equation
where
τ denotes the Cauchy stress tensor in the stress-softened material and
T denotes the Cauchy stress tensor during loading of the virgin material.
Based on the non-monotonous behavior of reinforced rubber-like materials [
21], here we assume that the softening function has the form
where
δ is a positive softening material parameter;
α and
γ are positive scaling constants chosen to best fit experimental data for a given rubber-like material. Substitution of Equation (7) into Equation (6), gives:
Notice that for our constitutive material model given by Equation (8), the ratios of the nontrivial physical stress components
Tij in the virgin material to the corresponding nontrivial physical components
τij in the stress-softening material, for a given deformation state, are determined by the inverse of the softening function alone:
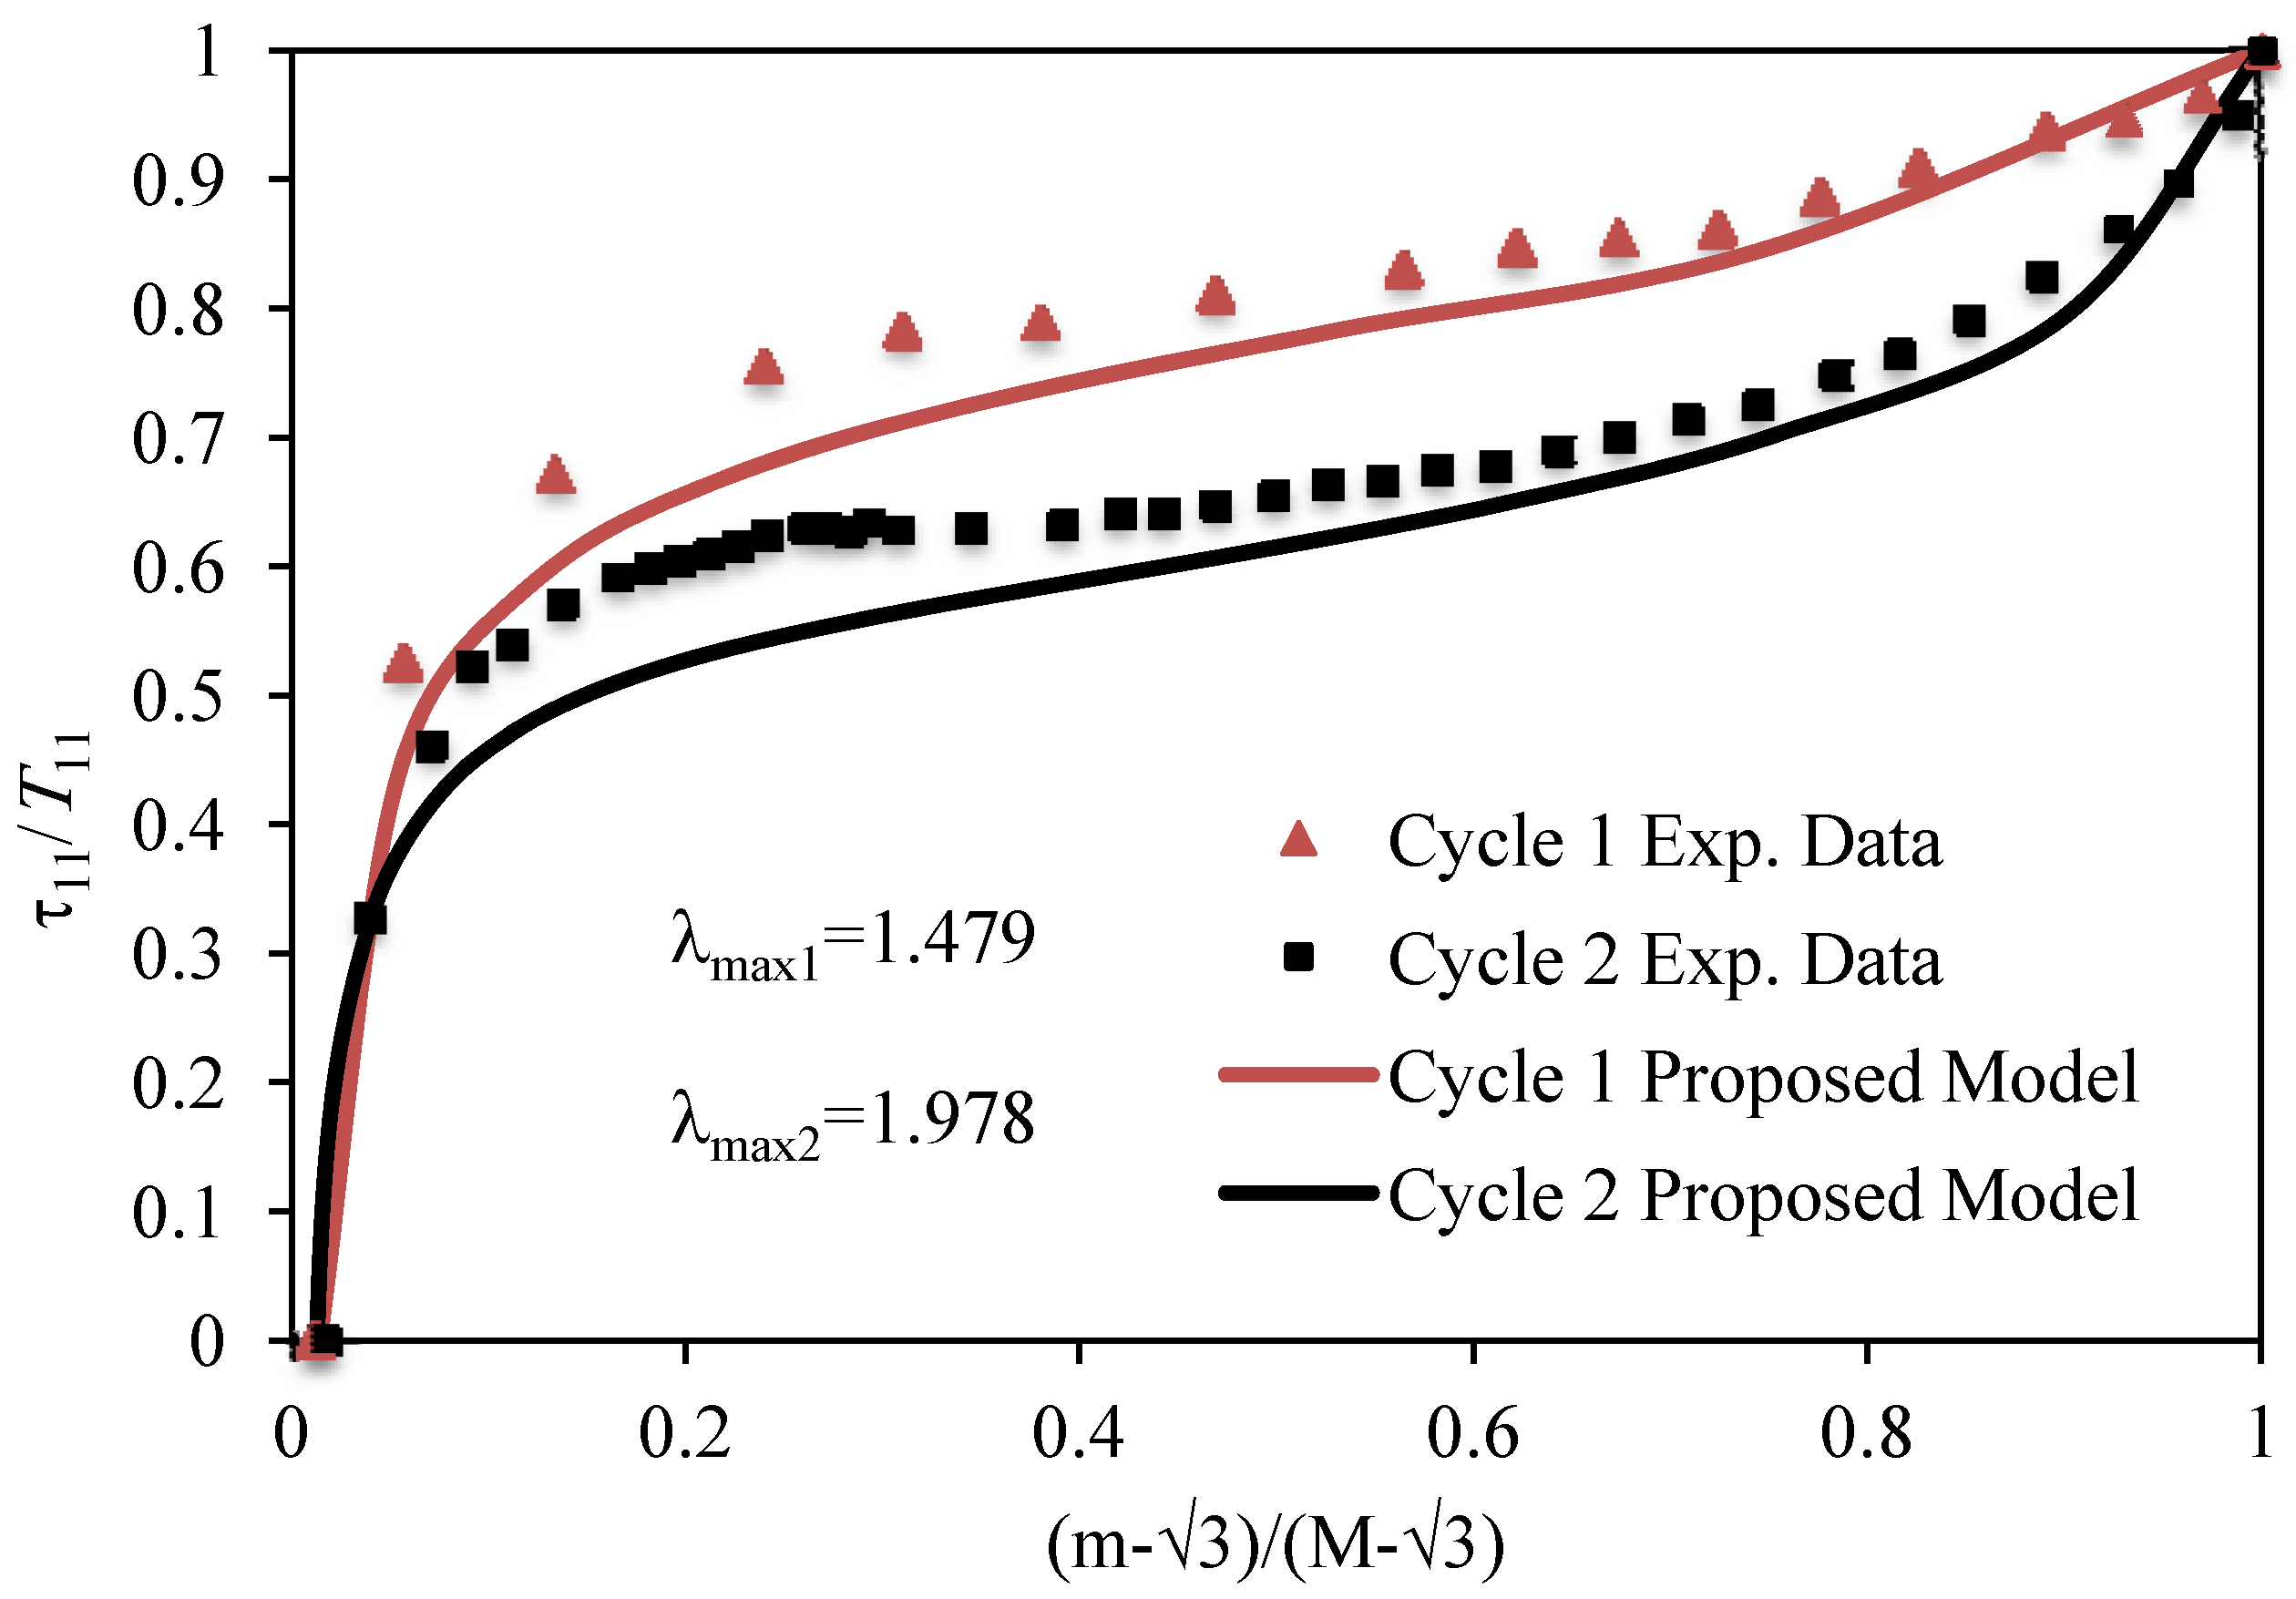
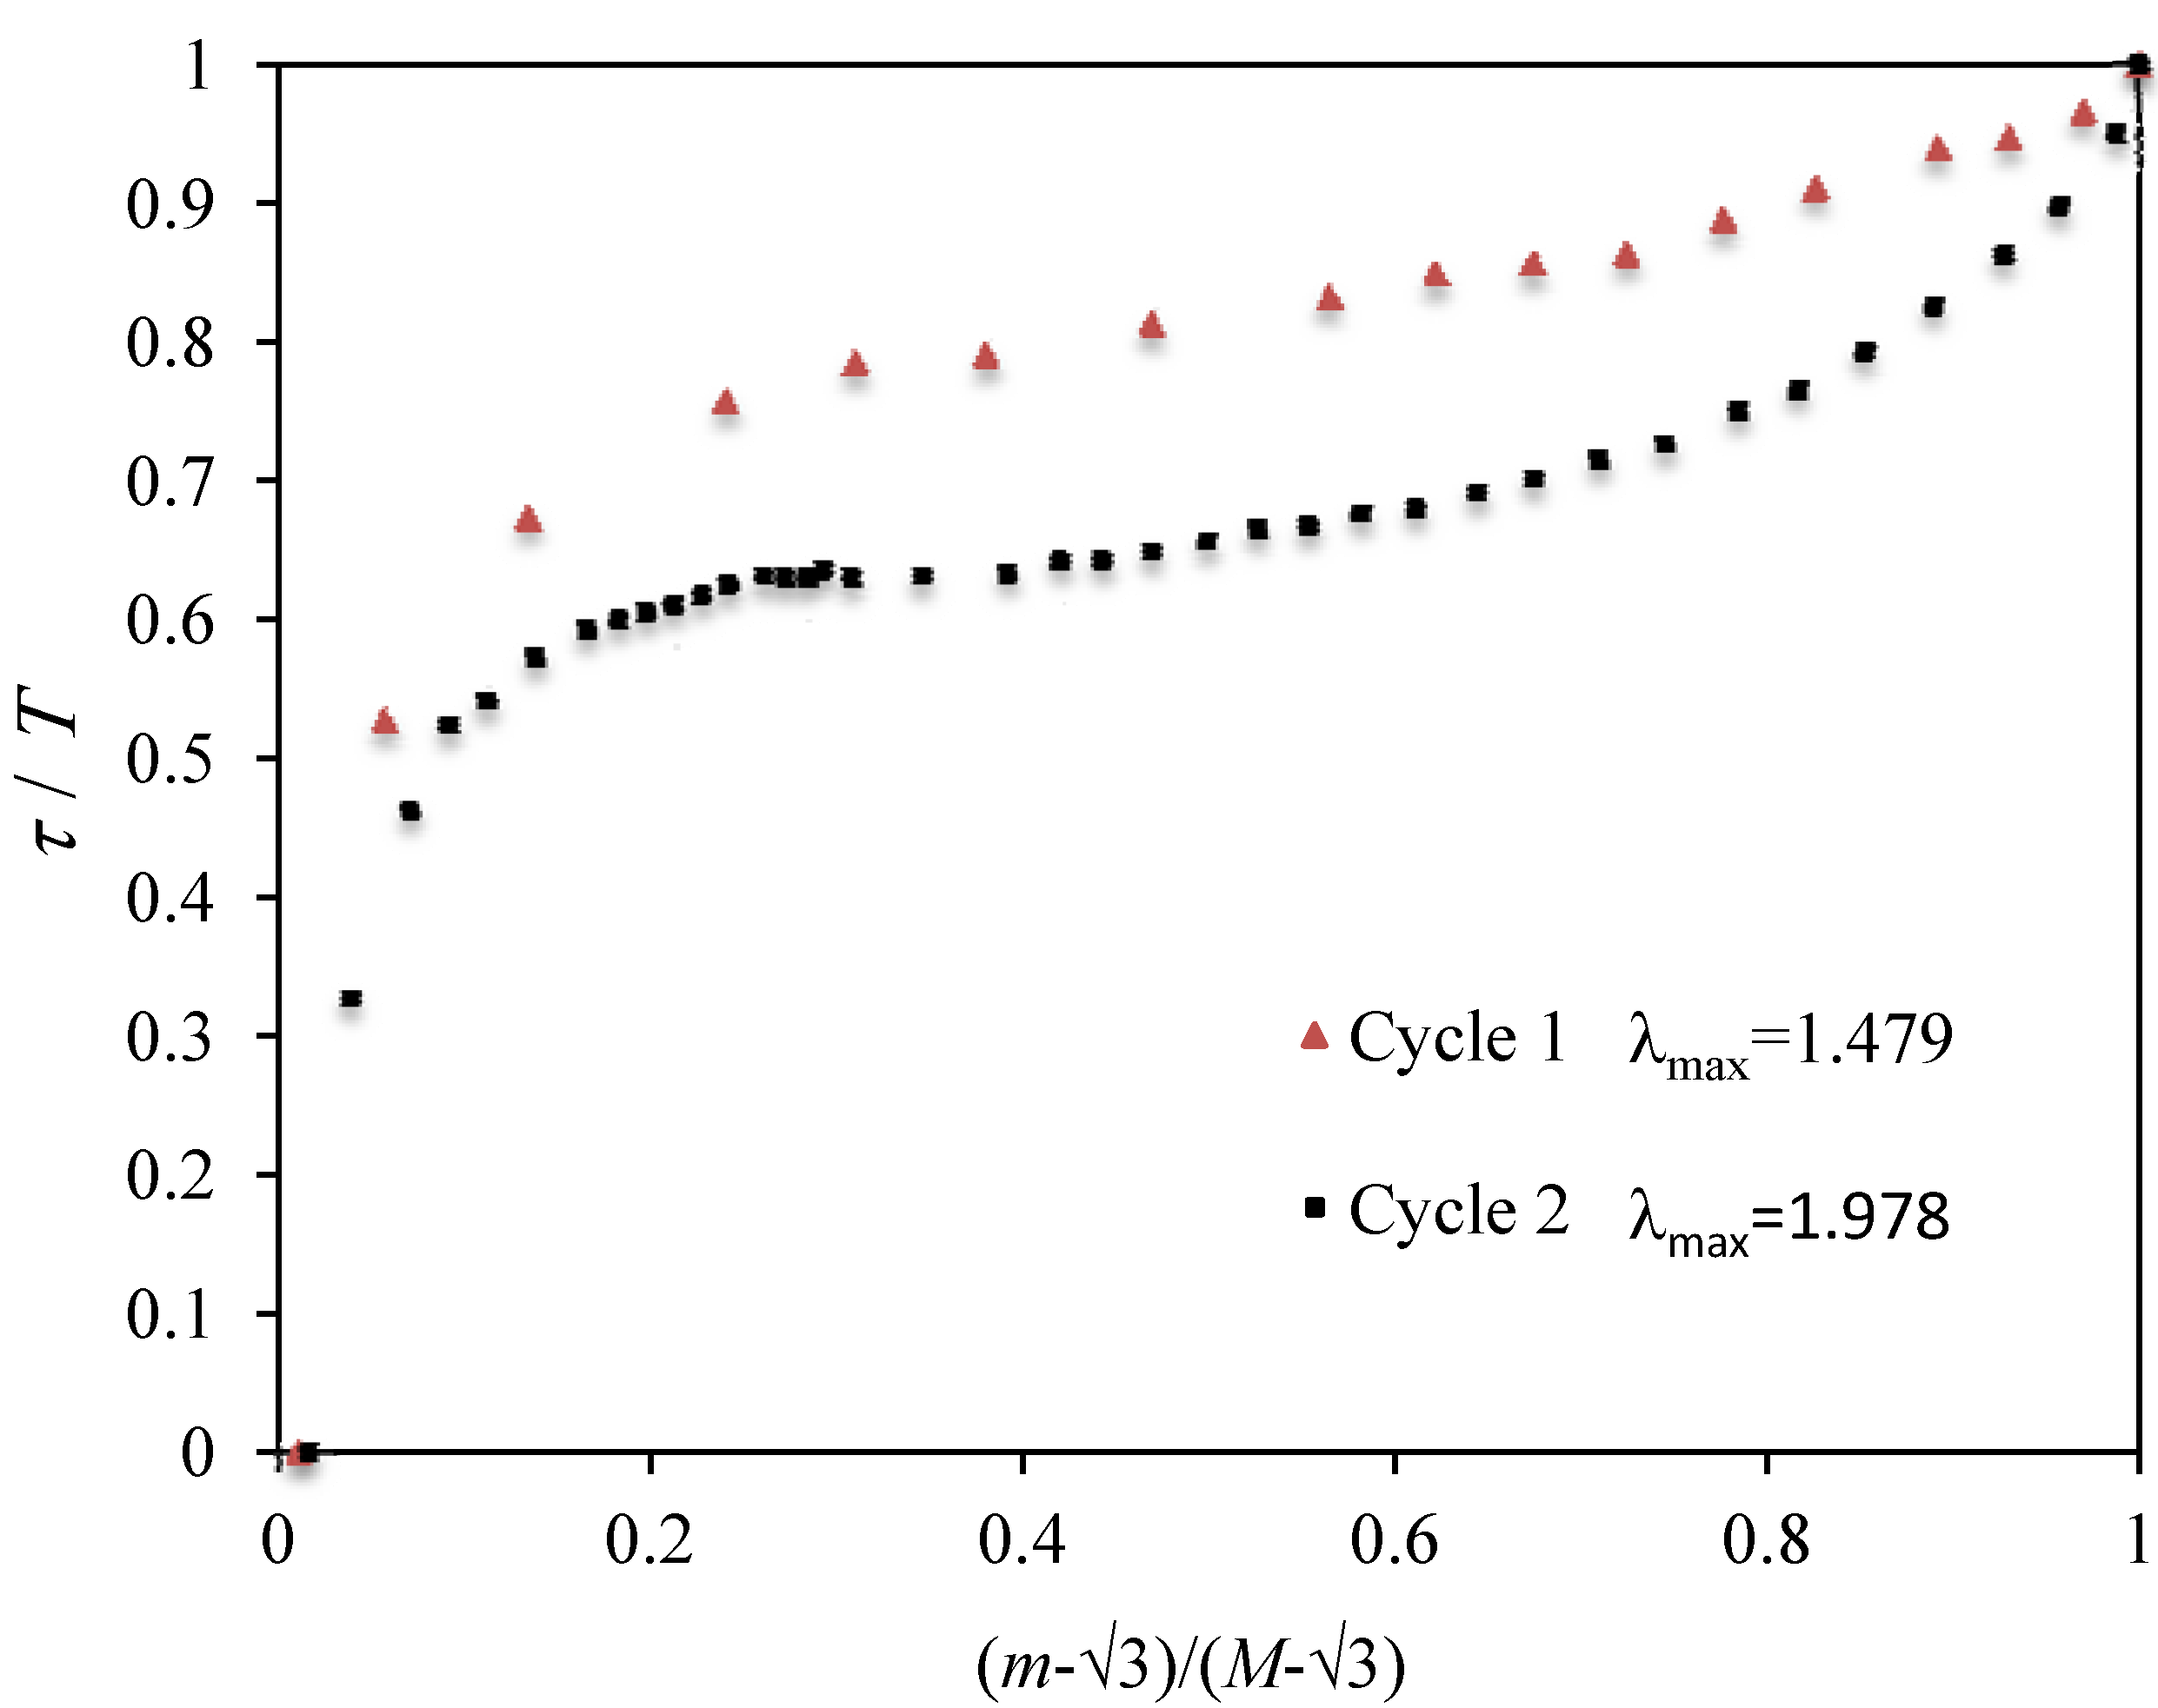
The simple rule given by Equation (9) provides an expression to determine the softening parameters from experimental data as shown in
Figure 1, in which the first two loading–unloading cycles are considered to compute the corresponding values of
α,
δ, and
γ.
Figure 1.
Normalized experimental stress data for the first two loading–unloading cycles of uniaxial tension tests performed in BIMSM-MWCNT (12.2%) composite material plotted against the normalized strain intensity ratio. Experimental data adapted from [
7].
Figure 1.
Normalized experimental stress data for the first two loading–unloading cycles of uniaxial tension tests performed in BIMSM-MWCNT (12.2%) composite material plotted against the normalized strain intensity ratio. Experimental data adapted from [
7].
A similar procedure was followed by Gurtin and Francis [
22] by considering a one-dimensional softening damage function to describe internal damage in highly filled solid propellants subjected to simple uniaxial tension tests; however, their results did not collapse to a single curve for all values of
λmax. Also, please note that various hypothetical damage functions, bearing properties similar to Equation (7), have been proposed in the literature. However, these have monotone-like behavior. See, for instance, [
3,
21,
23,
24,
25,
26] and references cited therein.
3. “Isotropized” Model
In this section, we review the main features of the Cantournet
et al. model [
7] and show how the strain energy densities of the polymeric matrix and the volumetric fraction of carbon nanotubes can be computed.
By following the results found in [
7], the strain energy density
Uc, of the MWCNT composite elastomer material can be found by adding the strain energy density of the elastomeric part
Ue, to the strain energy density associated with the MWCNTs,
UMWCNT. It was also assumed that the strain energy density of the MWCNT’s is giving by the following rule:
where
f is the volumetric fiber fraction. The elastomeric strain energy density
Ue is also assumed to be given by the compressible version of the eight chain model:
where
N is the chain number of links,
![Materials 06 02873 i009]()
,
![Materials 06 02873 i010]()
,
![Materials 06 02873 i011]()
,
![Materials 06 02873 i012]()
,
![Materials 06 02873 i013]()
and
KB is the material bulk modulus,
Ը−1 is the inverse of the Langevin function, and
I1 and
I3 are the first and third invariants of the left Cauchy–Green deformation tensor. Thus, the Cauchy stress tensor due to the elastomeric matrix
Te, can be obtained by the following expression:
which can be rewritten as
where
B is the left Cauchy–Green deformation tensor and
μR is the material shear Young modulus. Note that the second term becomes zero if the material is incompressible,
i.e.,
J = 1.
Cantournet and co-workers make the assumption that the MWCNT strain energy,
UMWCNT, can be expressed by an “isotropized” relation described by:
or in equivalent form by
where
A1 and
A2 are the “isotropized” parameters fitted from the
UMWCNT vs. ![Materials 06 02873 i018]()
data plots by using uniaxial experimental data.
Since the Cantournet model states that the composite strain energy function is simply the sum of the contributions from the elastomer material and from the MWCNTs, the Cauchy stress constitutive equation of the composite material can thus be written as:
It is important to mention that, in general, the Cantournet model [
7] fits loading virgin paths for lower volumetric MWCNT fraction and for relative small deformations well, but tends to overestimate experimental data for higher volumetric fractions of MWCNT at large deformations [
7].
4. Inclusion of Residual Strain Effects
This section describes a method to predict analytically the permanent set phenomenon of rubber-like materials. To take into account residual deformations, we follow the Holzapfel
et al. model [
27] and assume that the strain energy function
W has the form
where the function
Ue represents the strain energy density of the composite material associated with the primary loading path;
Ŵrs is the strain energy density function related to the material damage mechanism during unloading conditions;
ξa, a = 1, 2, 3 represent the discontinuous damage variables;
p is an arbitrary hydrostatic pressure; and
J =
λ1λ2λ3 = 1 due to the incompressibility condition.
In accordance with the pseudo-elasticity theory introduced in [
28], the damage energy density function must satisfy the following relationship:
By using the concepts of the pseudo-elasticity theory, it is possible to show that the discontinuous damage variables
ξa are given as
where
C represents a material constant related to the damage mechanism, and
λa max are the maximum values of the principal stretches at which unloading on the primary loading path begins. In accordance with the pseudo-elasticity theory, on the primary loading path
ξa must be inactive, while on the unloading path,
ξa has the value given by Equation (19). In this case, the damage energy density function which depends on the positive scaling parameter
n can be expressed as [
29]
Here,
c0 is an integration constant, and
n is a positive scaling parameter that in general takes the value of one for the proposed material model. Thus, the supplementary stress components
, in the principal directions, can be computed as the derivative of the damage energy density with respect to the principal stretches:
where
∂Ŵrs/
∂λa is given as
Substitution of Equation (22) into Equation (21), yields the expression to compute the residual stress components
:
Then, the corresponding constitutive equation that characterizes the material behavior during the unloading path that takes into account not only the non-monotonous softening effects but also residual strains, can be described by
where
τ denotes the Cauchy stress of the stress-softening material, and
Tc is given by Equation (16).
Finally, and by recalling Equation (23), the stress–stretch constitutive material model that predicts softening and residual strain effects for polymeric-like reinforced materials, for a three-dimensional deformation state, is given by
5. Comparison of Theoretical Predictions with Experimental Data
In this section, we compare uniaxial experimental data with theoretical predictions provided by Equation (25). The experimental data are taken from different elastomeric materials mainly reinforced with carbon nanotubes: BIMSM-MWCNT [
7], natural rubber-MWCNT [
30], reinforced polybutadyene with carbon black particles PB-CB and a thermoplastic polymer blend PC/ABS reinforced with SWCNT.
First, we compare experimental data of the elastomeric material called BIMSM-MWCNT [
7]. Here, we choose the parameter values of
α = 1/2, and
γ = 1 in Equation (25) and then we fit the value of the softening parameter
δ and the chain number of links
N = 30 by following a procedure similar to the one described in [
7]. The shear modulus
μR, and the “isotropized” parameters,
A1 and
A2, for each volumetric fraction of MWCNT are listed in
Table 1.
Table 1.
Material parameter values of A1, A2, and μR for different weight volume fractions of MWCNTs.
Table 1.
Material parameter values of A1, A2, and μR for different weight volume fractions of MWCNTs.
| Material parameter values | 2.6% w | 6.1% w | 8.8% w | 12.2% w |
|---|
| A1 (MPa) | 6.61 | 8.39 | 8.01 | 12.4 |
| A2 (MPa) | 2.31 | 3.16 | 2.24 | 3.33 |
| μR(MPa) | 0.45 | 0.43 | 0.43 | 0.44 |
The damage parameter values for each volumetric fraction of MWCNTs are also summarized in
Table 2. The residual strain parameters, shown in
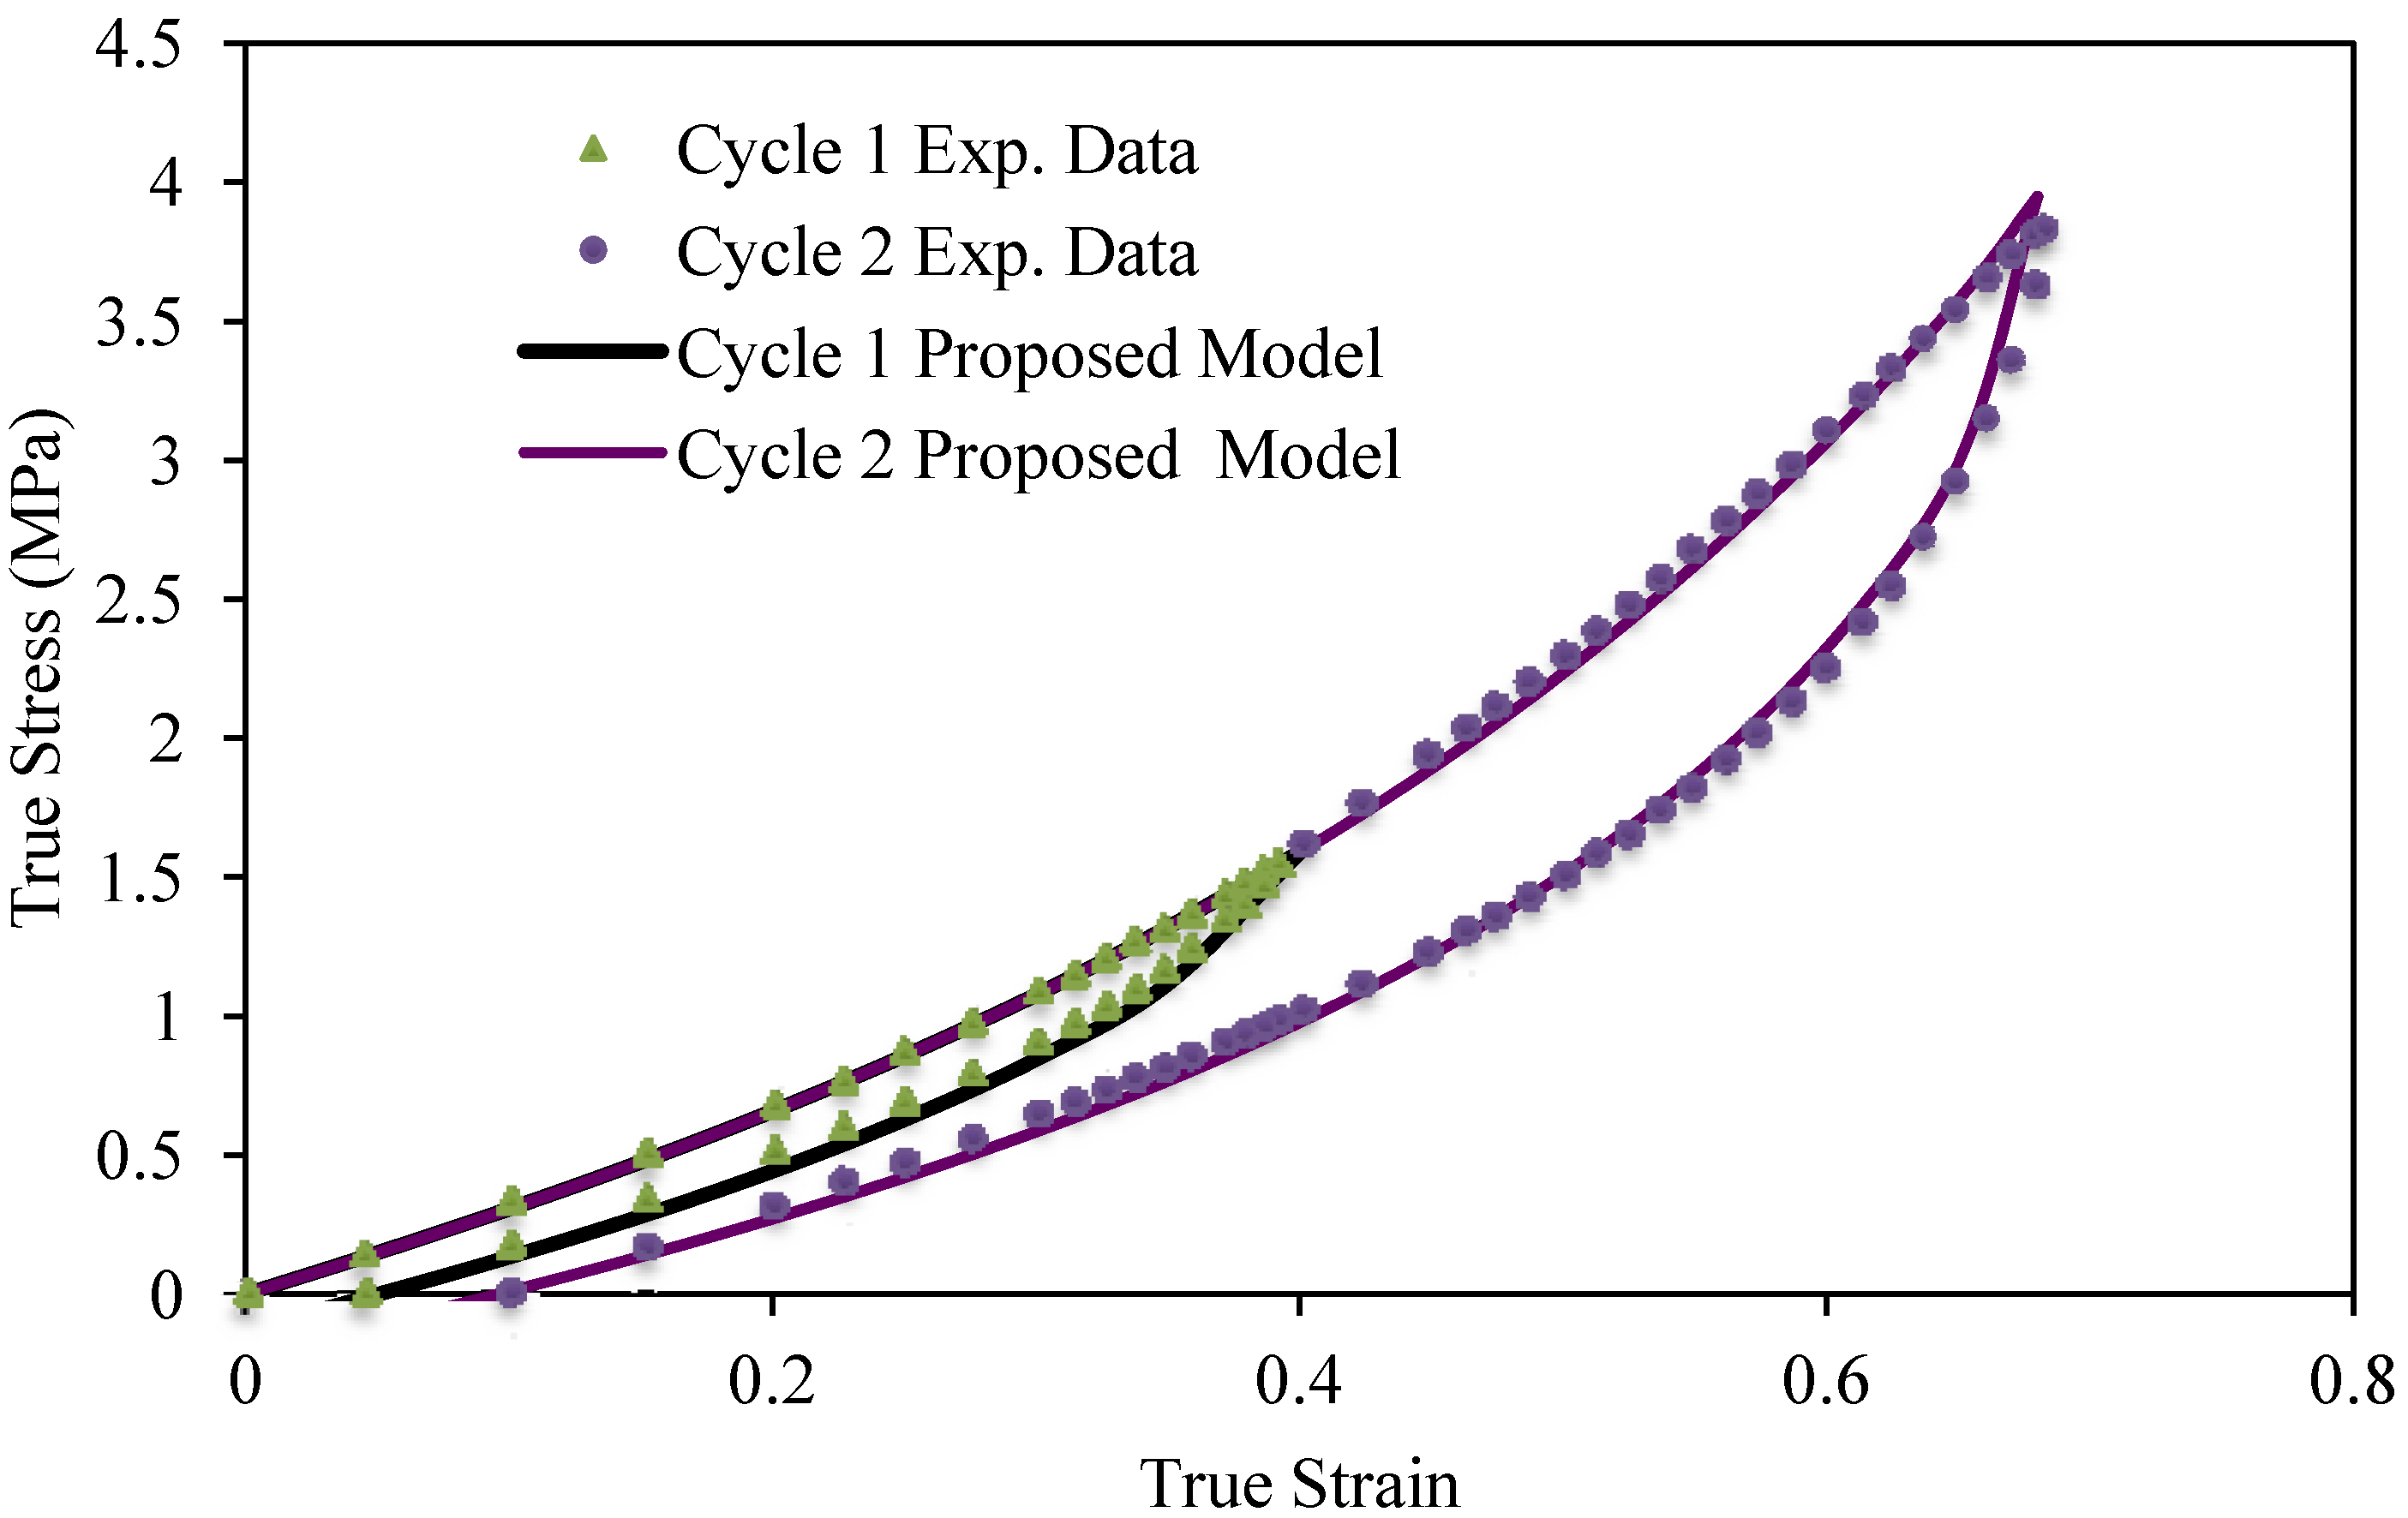
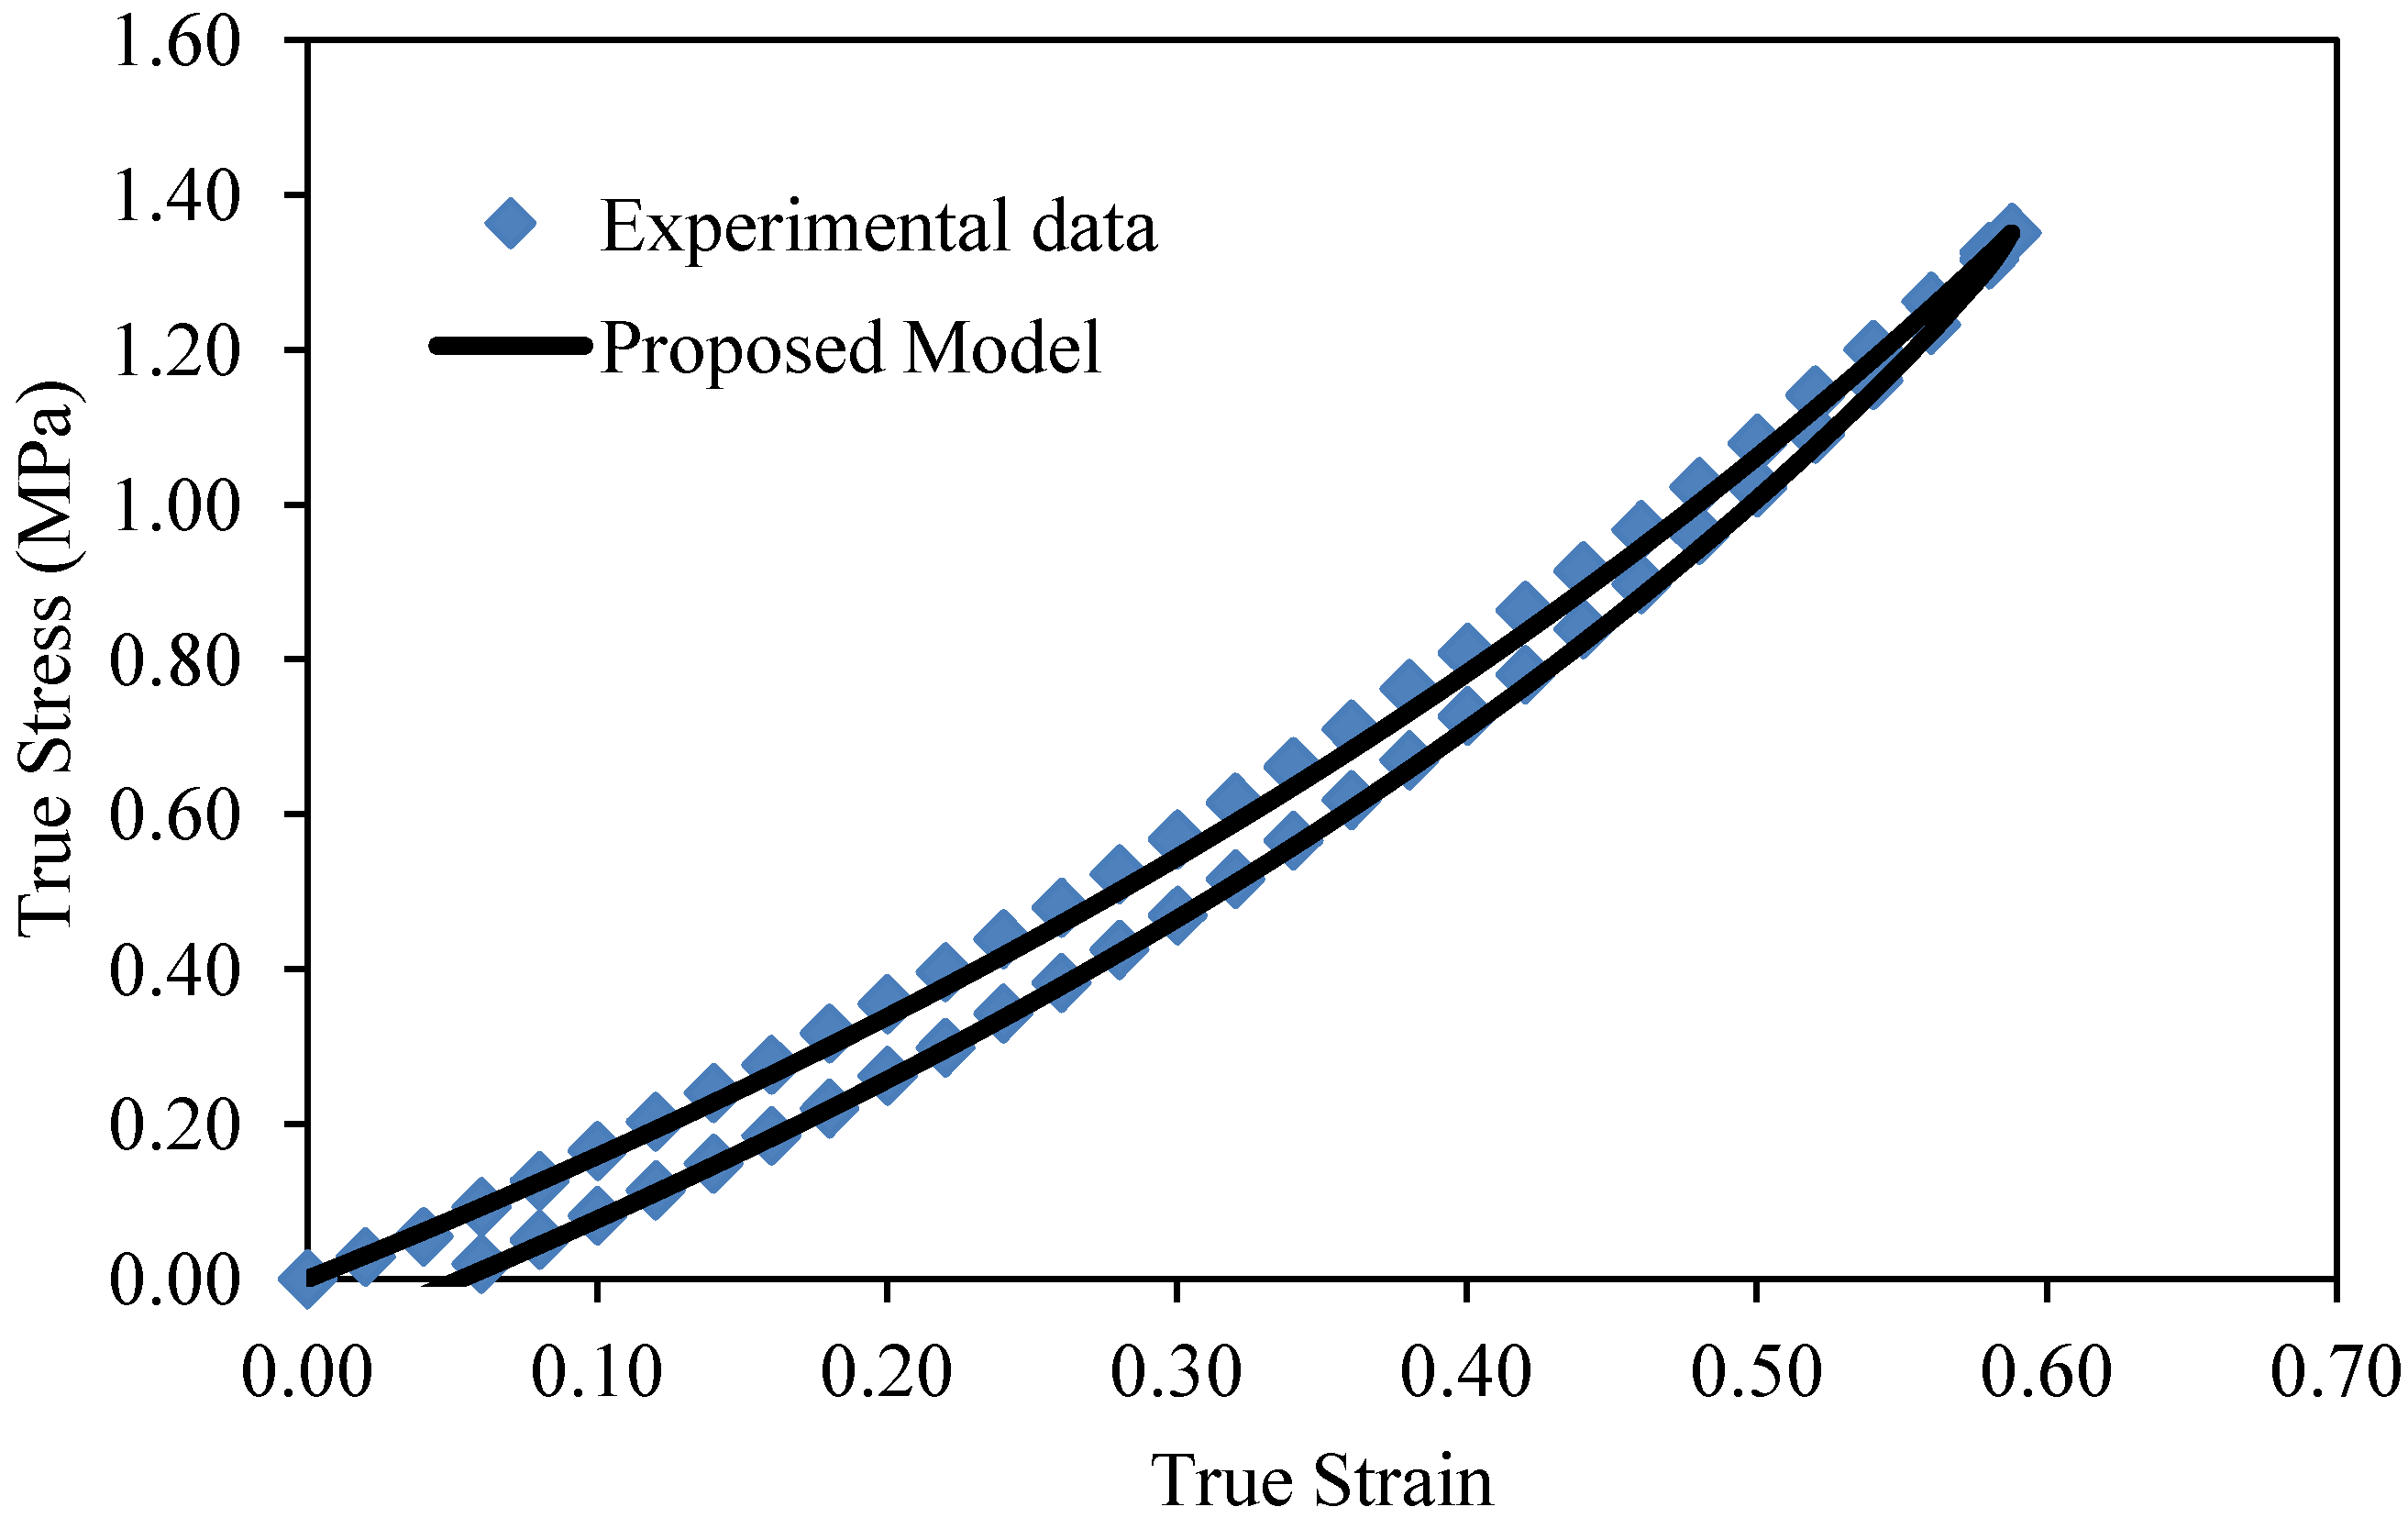
Table 2, are fitted by substituting Equation (23) into Equation (24). We next use Equation (25) and compute theoretical predictions by considering a volumetric fraction of 12.2% of MWCNT. As we can see from
Figure 2, there is good agreement between experimental data and theoretical predictions mainly at lower stretch values.
Table 2.
Damage parameter values for different weight volume fractions of MWCNTs.
Table 2.
Damage parameter values for different weight volume fractions of MWCNTs.
| Weight fraction | 0.0% | 2.6% | 6.1% | 8.8% | 12.2% |
|---|
| δ | 0.05 | 0.08 | 0.10 | 0.13 | 0.36 |
| γ | 1 | 1 | 1 | 1 | 1 |
| C (MPa) | 6.00 | 8.00 | 6.40 | 5.88 | 1.80 |
Figure 2.
Theoretical predictions obtained from the proposed material model given by Equation (25) compared with experimental data for 12.2% of MWCNT. The estimated material parameter values are δ = 0.49, and C = 4 MPa.
Figure 2.
Theoretical predictions obtained from the proposed material model given by Equation (25) compared with experimental data for 12.2% of MWCNT. The estimated material parameter values are δ = 0.49, and C = 4 MPa.
We now use Equation (8) and Equation (25) to compare this experimental data with theoretical predictions by plotting the ratio of the stress-softening stress,
τ11, and the virgin stress,
T11,
versus the strain intensity ratio of
for the first two cycles, as illustrated in
Figure 3. As we can see from
Figure 3, theoretical predictions follow experimental data well. Similar plots can be obtained by considering different volumetric fractions of MWCNT.
Table 3 summarizes the root-mean-square error (RMSE) obtained in the first loading and unloading curves, respectively.
Table 3.
RMSE at different percents of weight volume fractions of MWCNTs for loading and the first unloading paths.
Table 3.
RMSE at different percents of weight volume fractions of MWCNTs for loading and the first unloading paths.
| MWCNT,% | RMSE Loading path | RMSE First unloading path |
|---|
| 2.6 | 0.039 | 0.042 |
| 6.1 | 0.048 | 0.050 |
| 8.8 | 0.053 | 0.054 |
| 12.2 | 0.054 | 0.075 |
Figure 3.
Comparison of theoretical predictions computed from Equations (16) and (25) with experimental data collected from a 12.2% w fraction of MWCNT-reinforced elastomer by plotting the normalized stress ratio τ11/T11 versus the normalized strain intensity ratio (m – √3)/(M – √3)
Figure 3.
Comparison of theoretical predictions computed from Equations (16) and (25) with experimental data collected from a 12.2% w fraction of MWCNT-reinforced elastomer by plotting the normalized stress ratio τ11/T11 versus the normalized strain intensity ratio (m – √3)/(M – √3)
The maximum predicted error,
e, for the 12.2% wt fraction is 2.67% for both loading and unloading curves. The corresponding RMSE is 0.048 for cycle 2 of the experimental data shown in
Figure 2. Notice that for high volumetric fractions of MWCNT, the magnitude of the RMSE between experimental data and theoretical predictions has a small increasing value. Therefore, we can conclude that the modified Cantournet model tends to follow data even for high volumetric fractions of MWCNT in the BIMSM-MWCNT-reinforced polymer well. The corresponding RMSE values at different volumetric factions of MWCNT’s for the first loading–unloading material cycle are summarized in
Table 3.
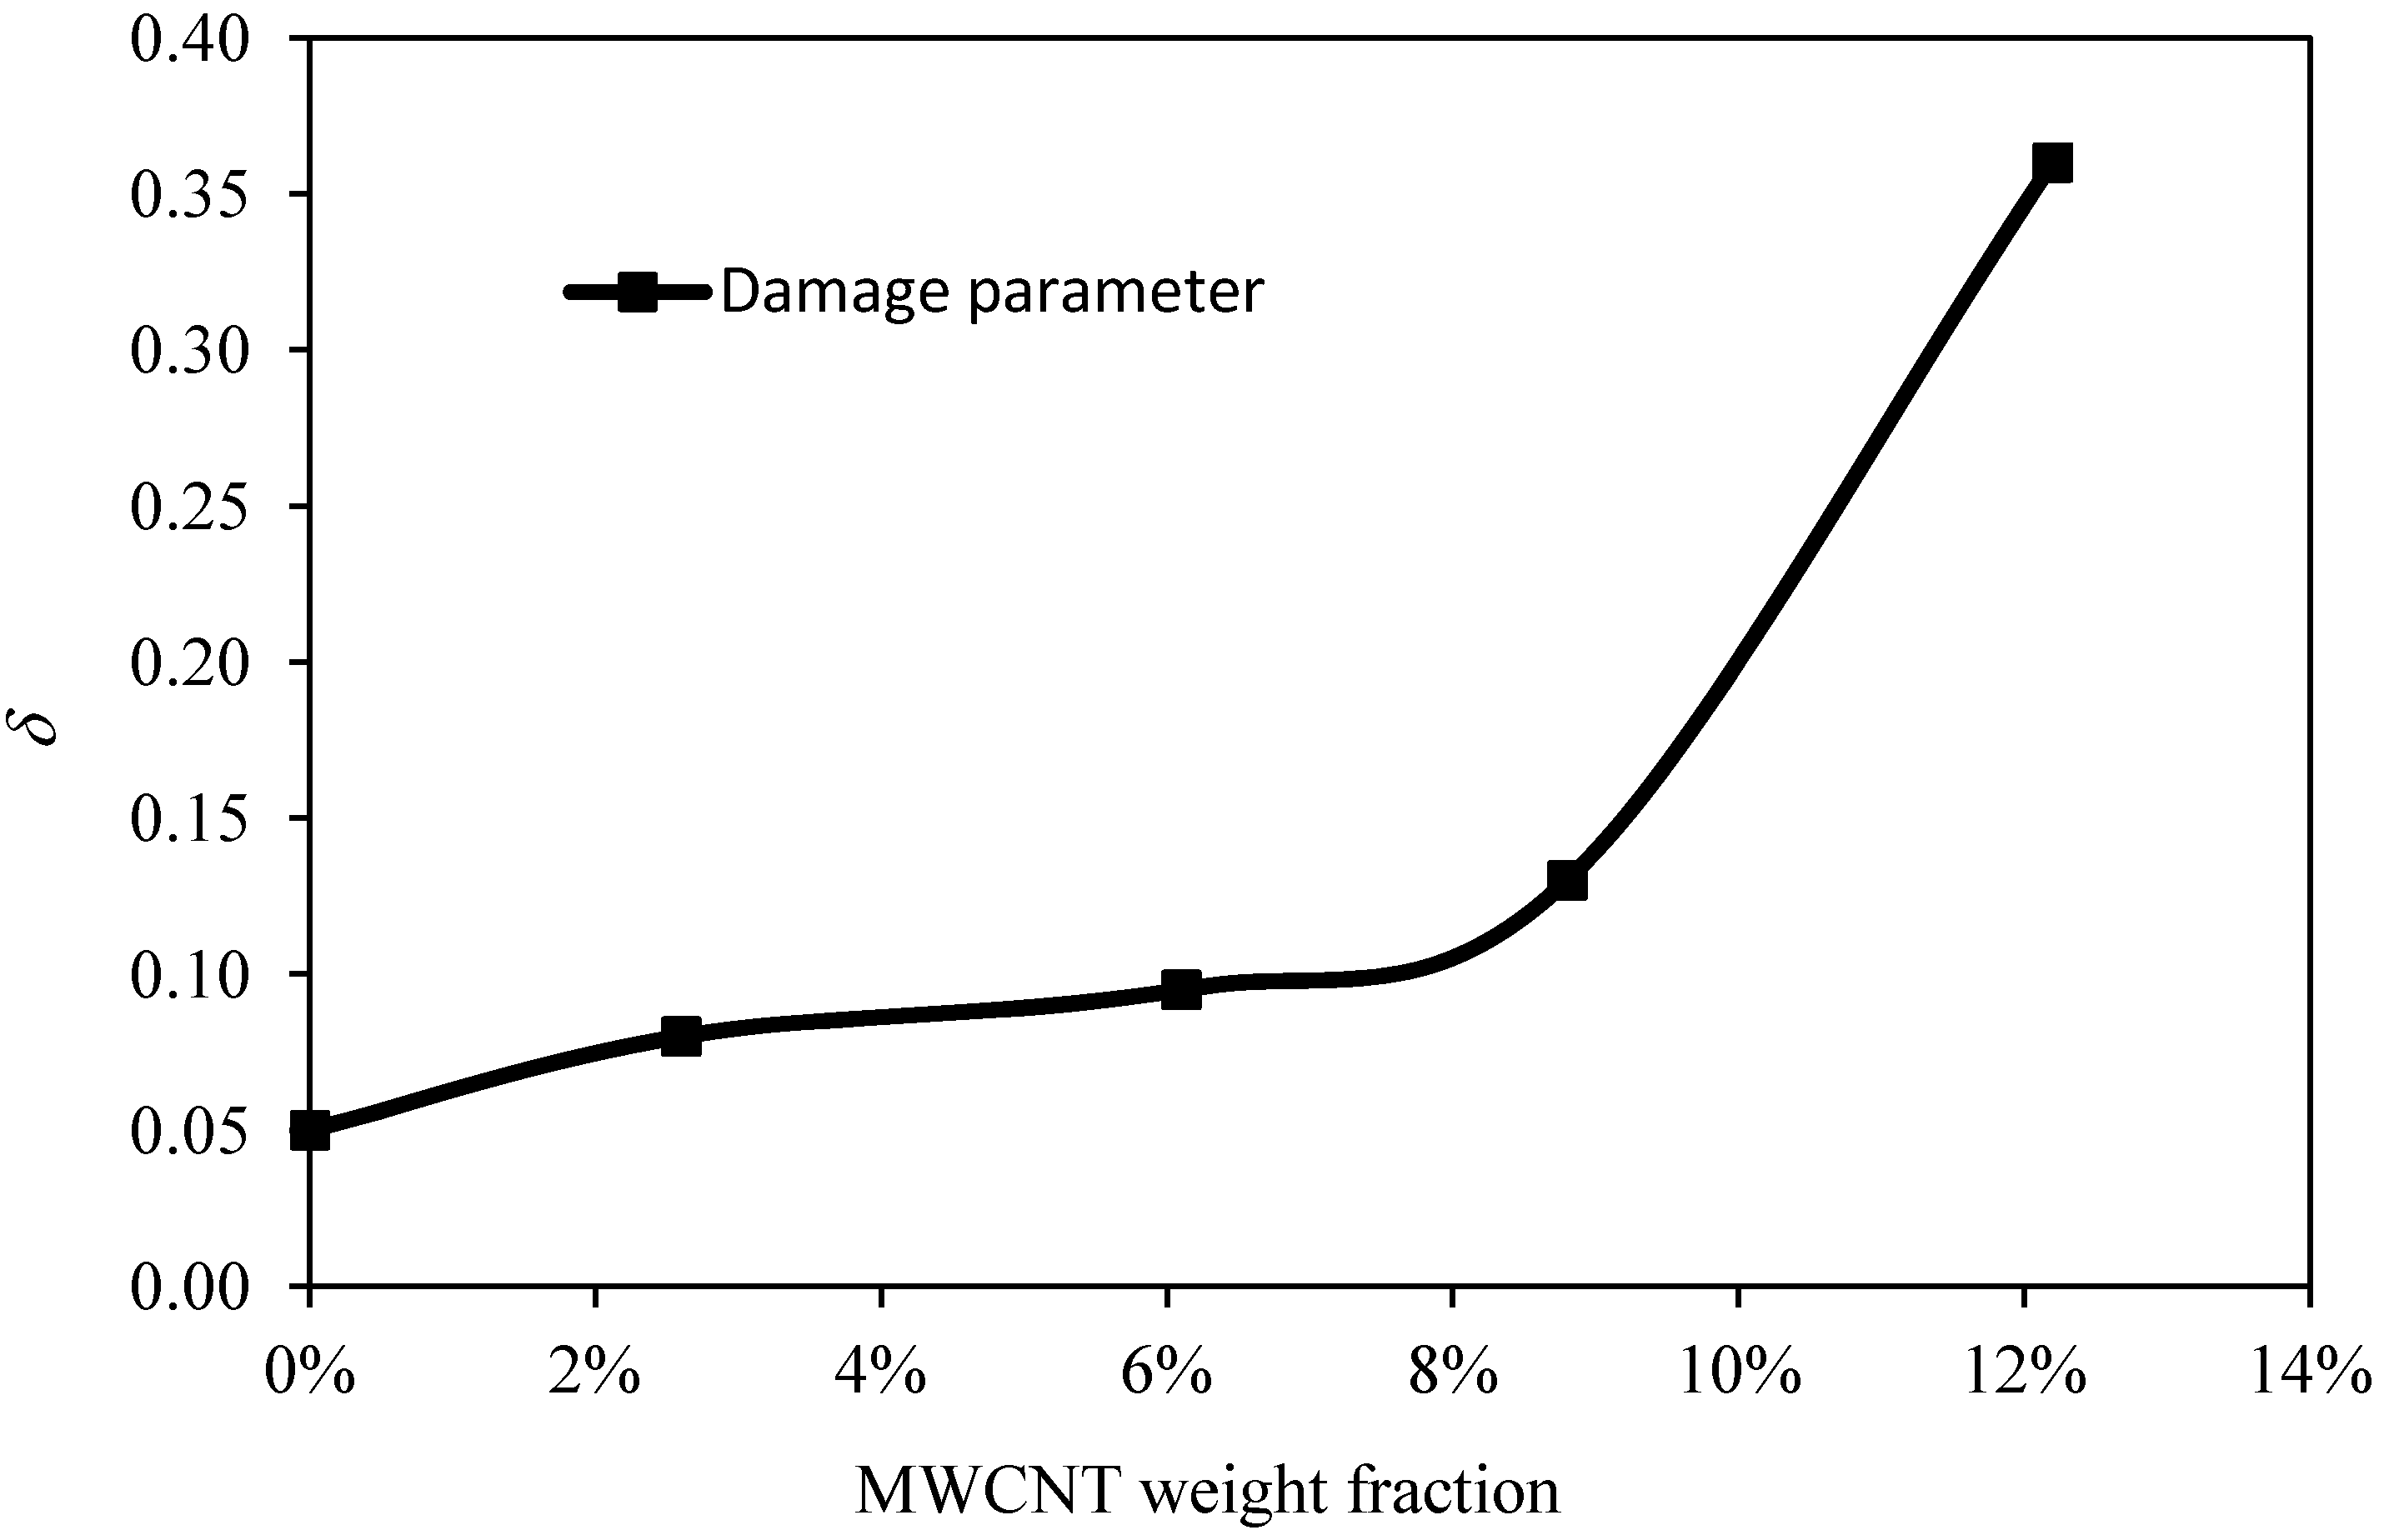
In
Figure 4, we have plotted the variation of the softening parameter
δ versus the weight fraction of MWCNTs added to the polymeric matrix of the BIMSM polymer. As we can see from
Figure 4, when the weight fraction increases, the softening parameter
δ also tends to increase. This plot can be used as a reference curve to predict the value of
δ at different weight fractions of MWCNTs.
Figure 4.
Softening parameter behavior, δ, as a function of the material weight fraction of MWCNT.
Figure 4.
Softening parameter behavior, δ, as a function of the material weight fraction of MWCNT.
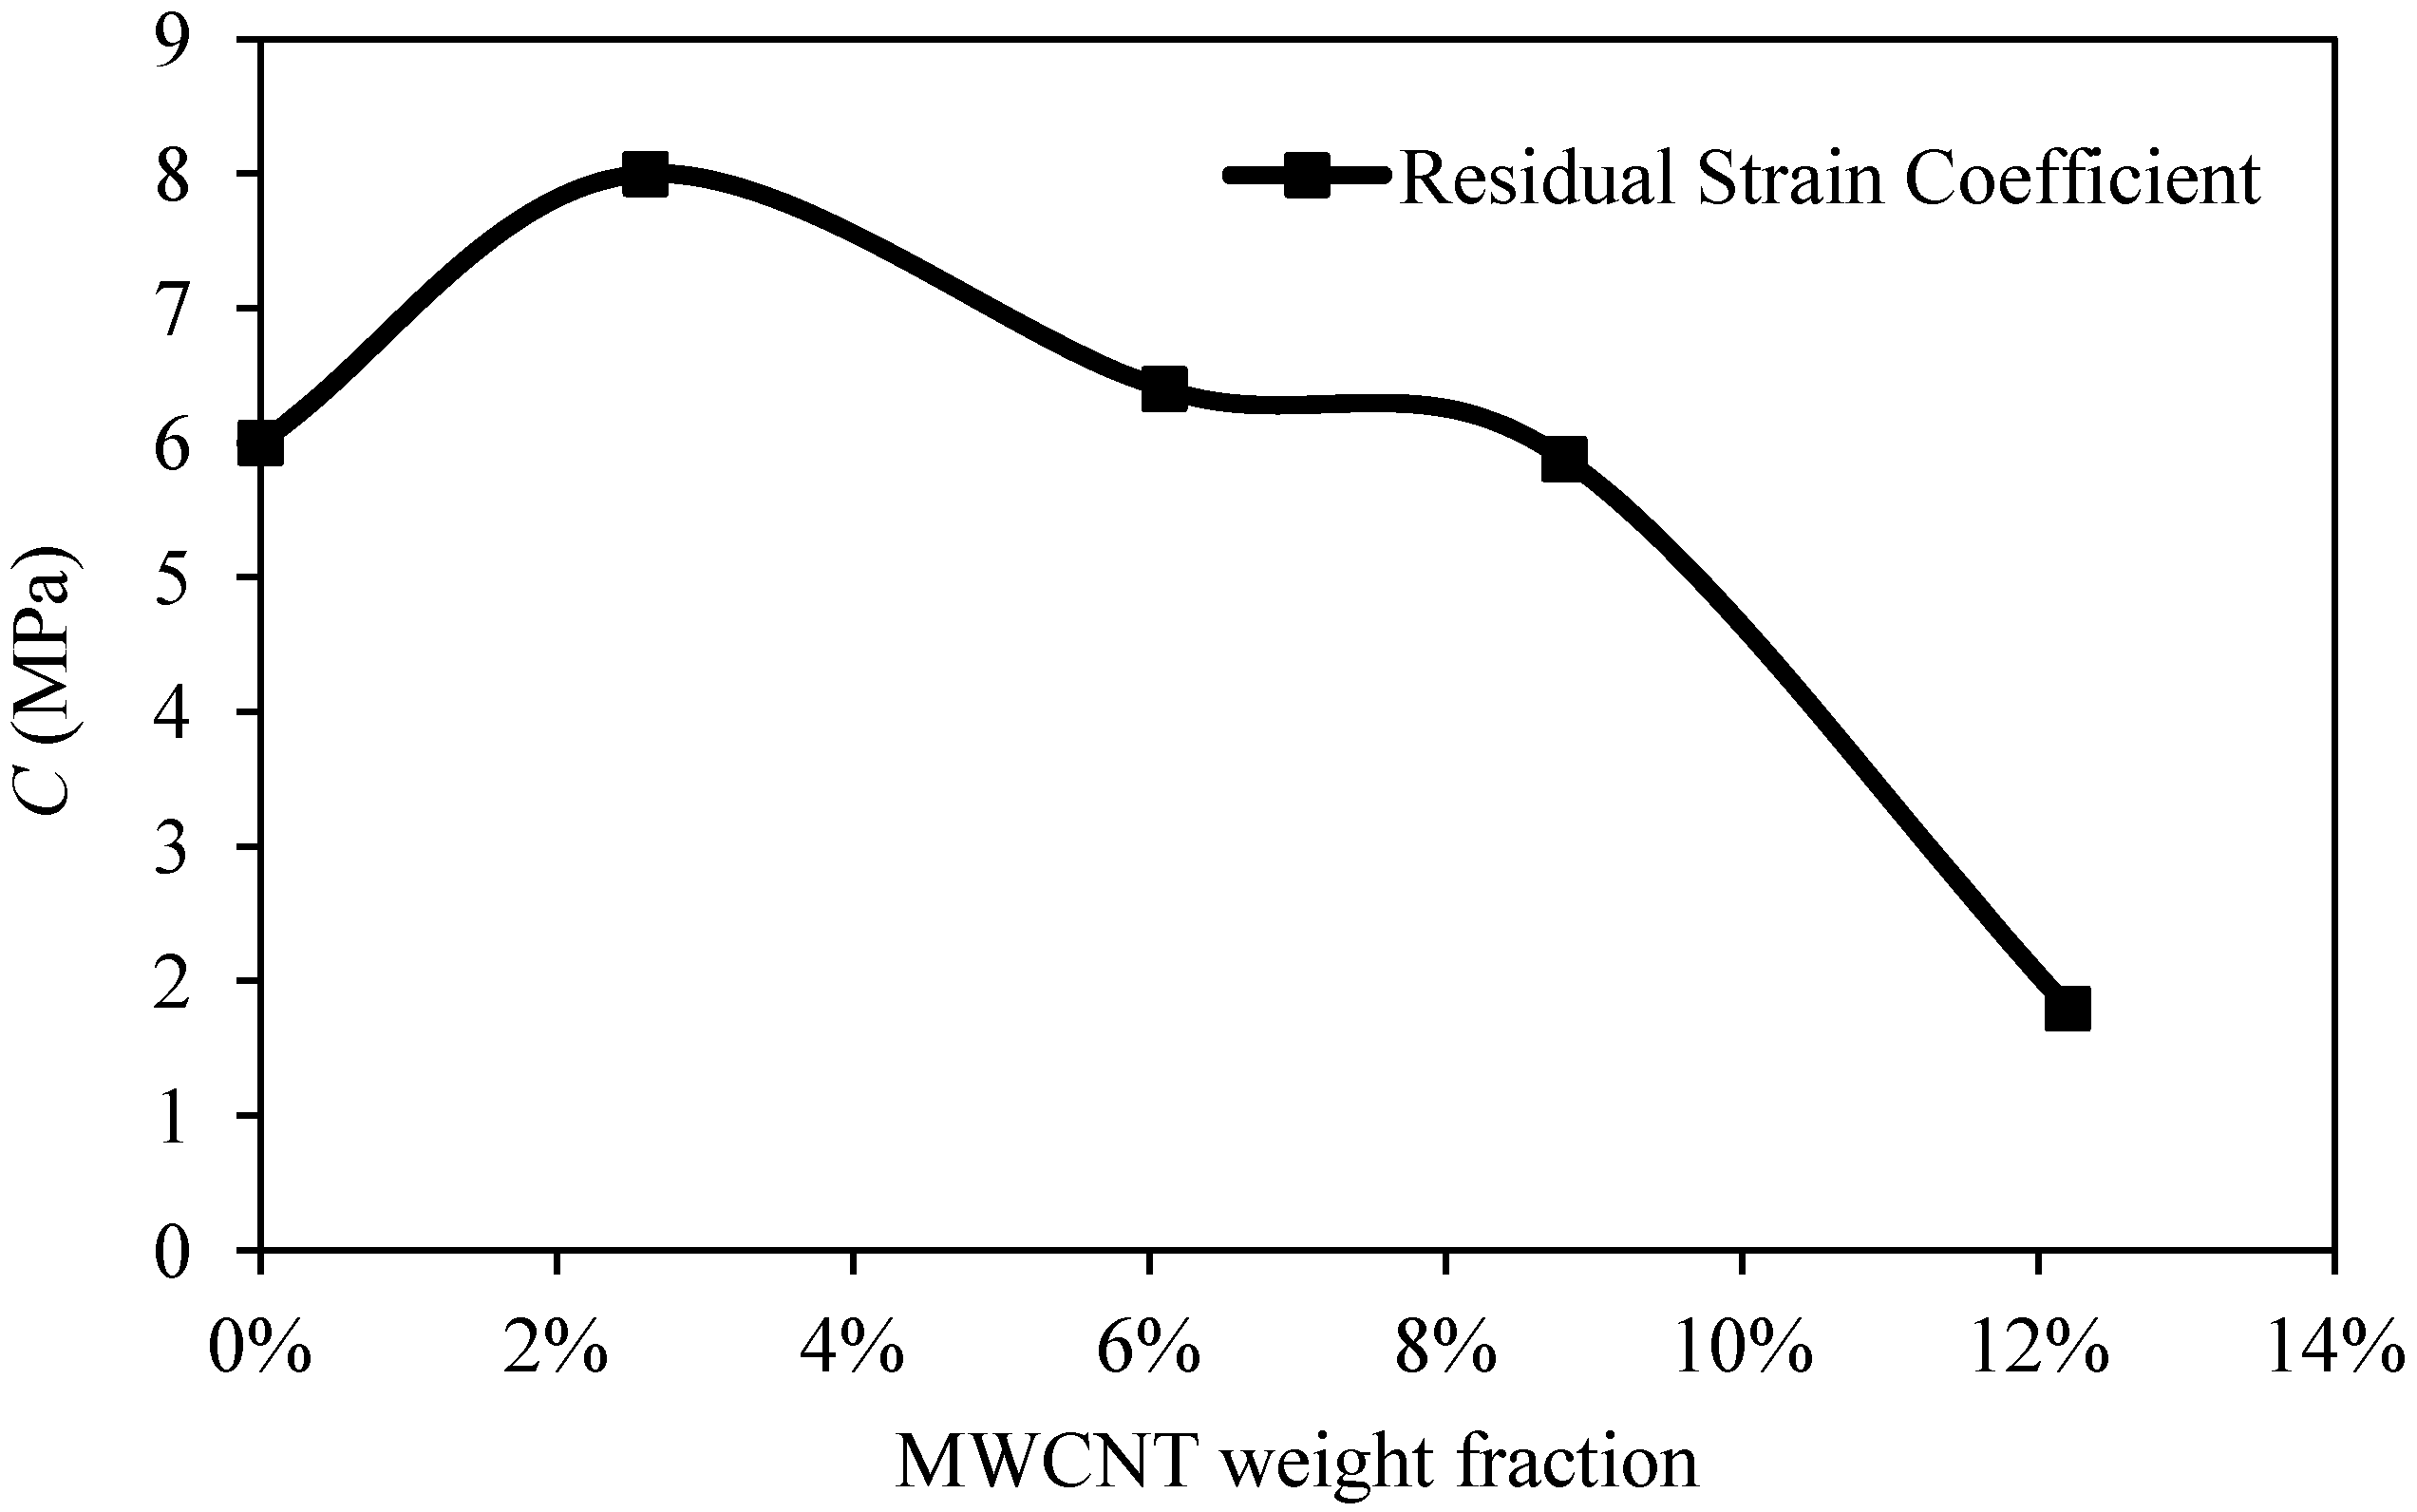
Figure 5 shows the variation of the residual strain material parameter
C versus the volumetric fractions of MWCNTs. Note that the values of
C tend to decrease at higher volumetric fractions of MWCNTs; also, its curve exhibits a non-monotonous behavior.
Figure 5.
Residual strain material parameter values, C, plotted as a function of the weight fraction of MWCNT.
Figure 5.
Residual strain material parameter values, C, plotted as a function of the weight fraction of MWCNT.
We next use uniaxial extension experimental data obtained from Nah
et al. [
30] for reinforced natural rubber to assess the accuracy of our modified Cantournet
et al. model given by Equation (25) by considering the parameter values of
μR =0.75 MPa,
δ = 0.3,
C = 1.0 MPa,
n = 1,
γ = 1,
α = 0.5,
A1 = 137 MPa,
A2 = 10.8 MPa and
N = 30. As we can see from
Figure 6, theoretical predictions tend to underestimate experimental data mainly at lower strain values.
However, the qualitative and quantitative behavior exhibited by experimental data are accurately predicted from our proposed material model given by Equation (25). In this case, the computed RMSE values are 0.392 and 0.144 for the loading and unloading paths, respectively. The maximum error attained is 3.66% computed at the maximum stretch value shown in
Figure 6.
Figure 6.
Comparison of theoretical predictions obtained from the proposed model given by Equation (25) with experimental data for 1 phr NR-SWCNT. Here the material parameter values are
δ = 0.3 and
C = 1.0 MPa. Experimental data adapted from [
30].
Figure 6.
Comparison of theoretical predictions obtained from the proposed model given by Equation (25) with experimental data for 1 phr NR-SWCNT. Here the material parameter values are
δ = 0.3 and
C = 1.0 MPa. Experimental data adapted from [
30].
Figure 7 shows theoretical predictions of the normalized stress ratio
τ11/
T11 plotted against the normalized strain intensity ratio
by using Equations (16) and (25). As we can see from
Figure 7, theoretical predictions follow experimental data well.
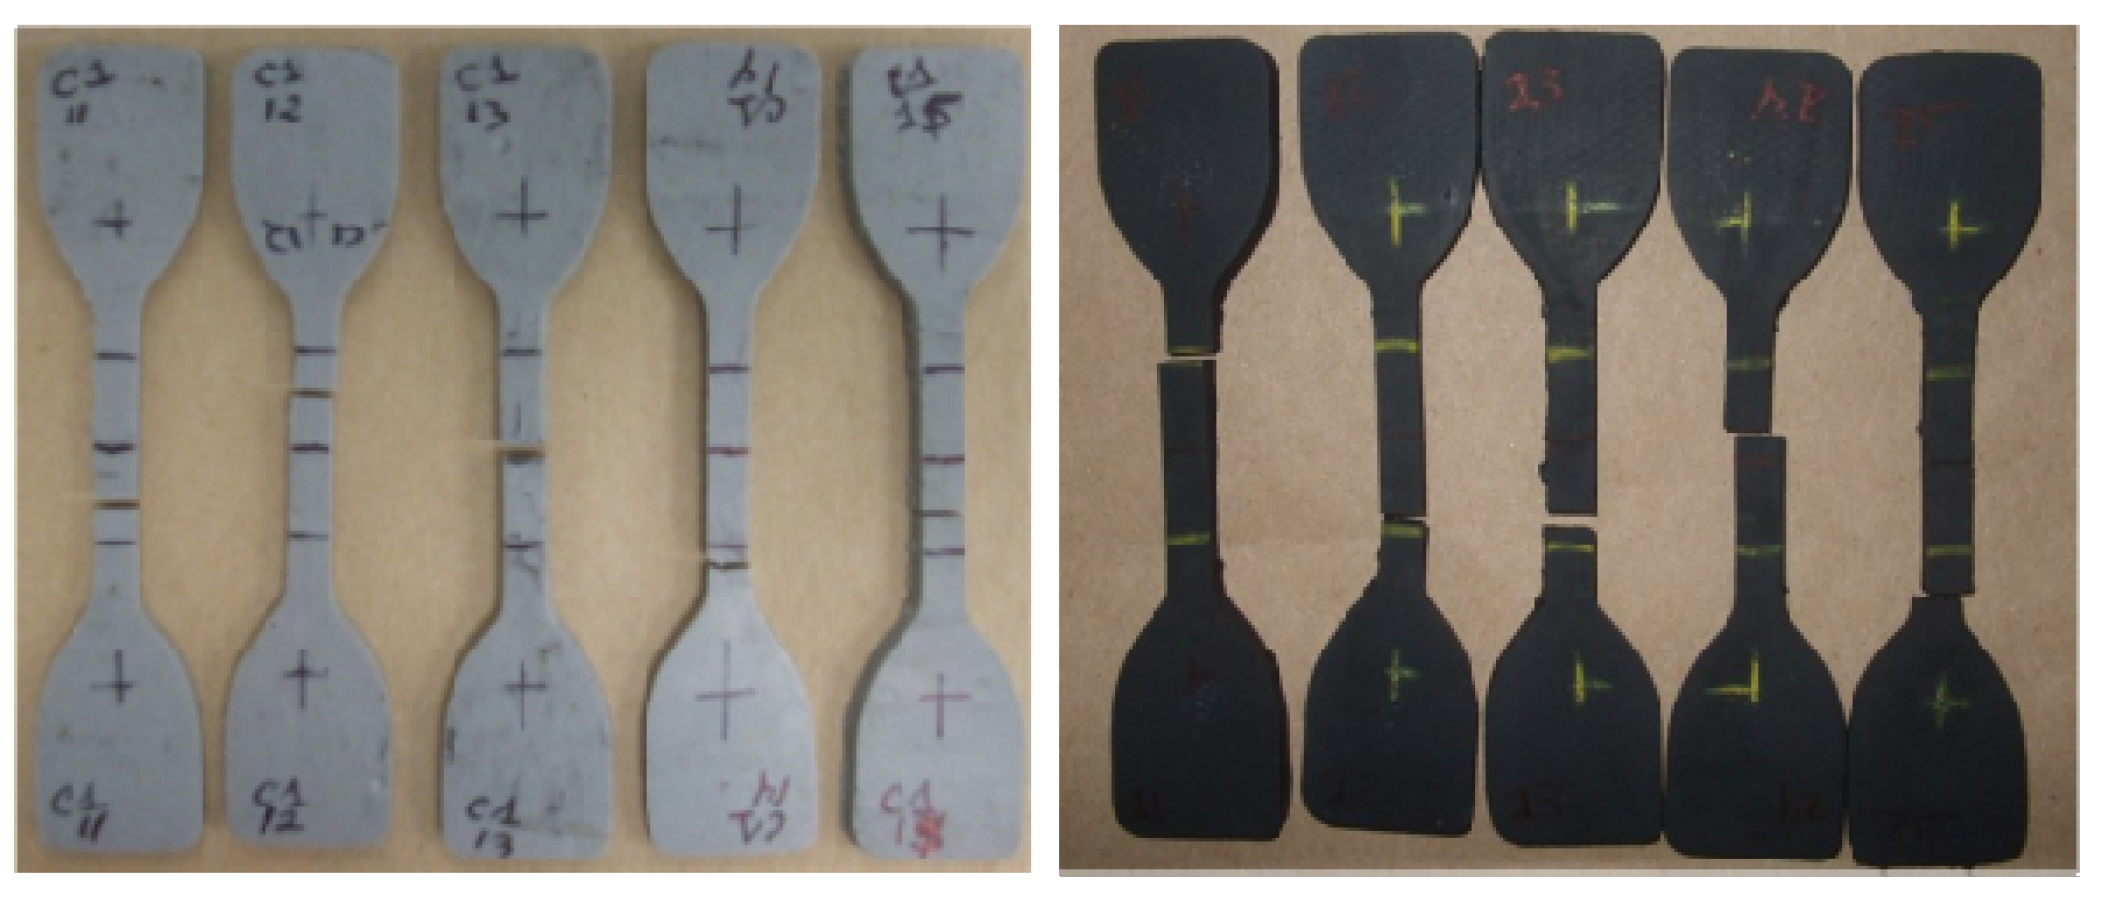
We now use uniaxial extension experimental data obtained from samples of PBR-CB elastomer according to ASTM D412 Rev A, standard die C collected by using an universal testing machine MTS insight 2 with a load cell capacity of 2 kN. Some of the samples tested are shown in
Figure 8. These samples are commercial blends described in
Table 4. Comparison of experimental data obtained at the constant strain rate of 0.3 s
−1 and theoretical predictions is shown in
Figure 9 for the first loading and unloading cycle. The estimated parameter values are
A1 = 6.213 MPa,
A2 = −0.2549 MPa,
µR = 0.45 MPa,
δ = 0.05,
N = 30,
C = 5.5 MPa,
n = 1,
α = ½, and
γ = 1.
Figure 7.
Comparison of theoretical predictions with respect to experimental data for 1 phr NR-MWCNT. Experimental data adapted from [
30].
Figure 7.
Comparison of theoretical predictions with respect to experimental data for 1 phr NR-MWCNT. Experimental data adapted from [
30].
Figure 8.
Specimens of PBR and PBR-CB subjected to uniaxial cyclic tension tests, according to ASTM D412 Rev A, standard die C.
Figure 8.
Specimens of PBR and PBR-CB subjected to uniaxial cyclic tension tests, according to ASTM D412 Rev A, standard die C.
Table 4.
Composition for the two samples of polybutadiene (the unit is phr).
Table 4.
Composition for the two samples of polybutadiene (the unit is phr).
| Chemical composition | Sample 1P (phr) | Sample 2 (phr) |
|---|
| Polybutadiene | 100 | 100 |
| CB | 0 | 7 |
| ZnO | 5 | 5 |
| S/A | 1 | 1 |
| MBTS | 1 | 1 |
| Sulfur | 2 | 2 |
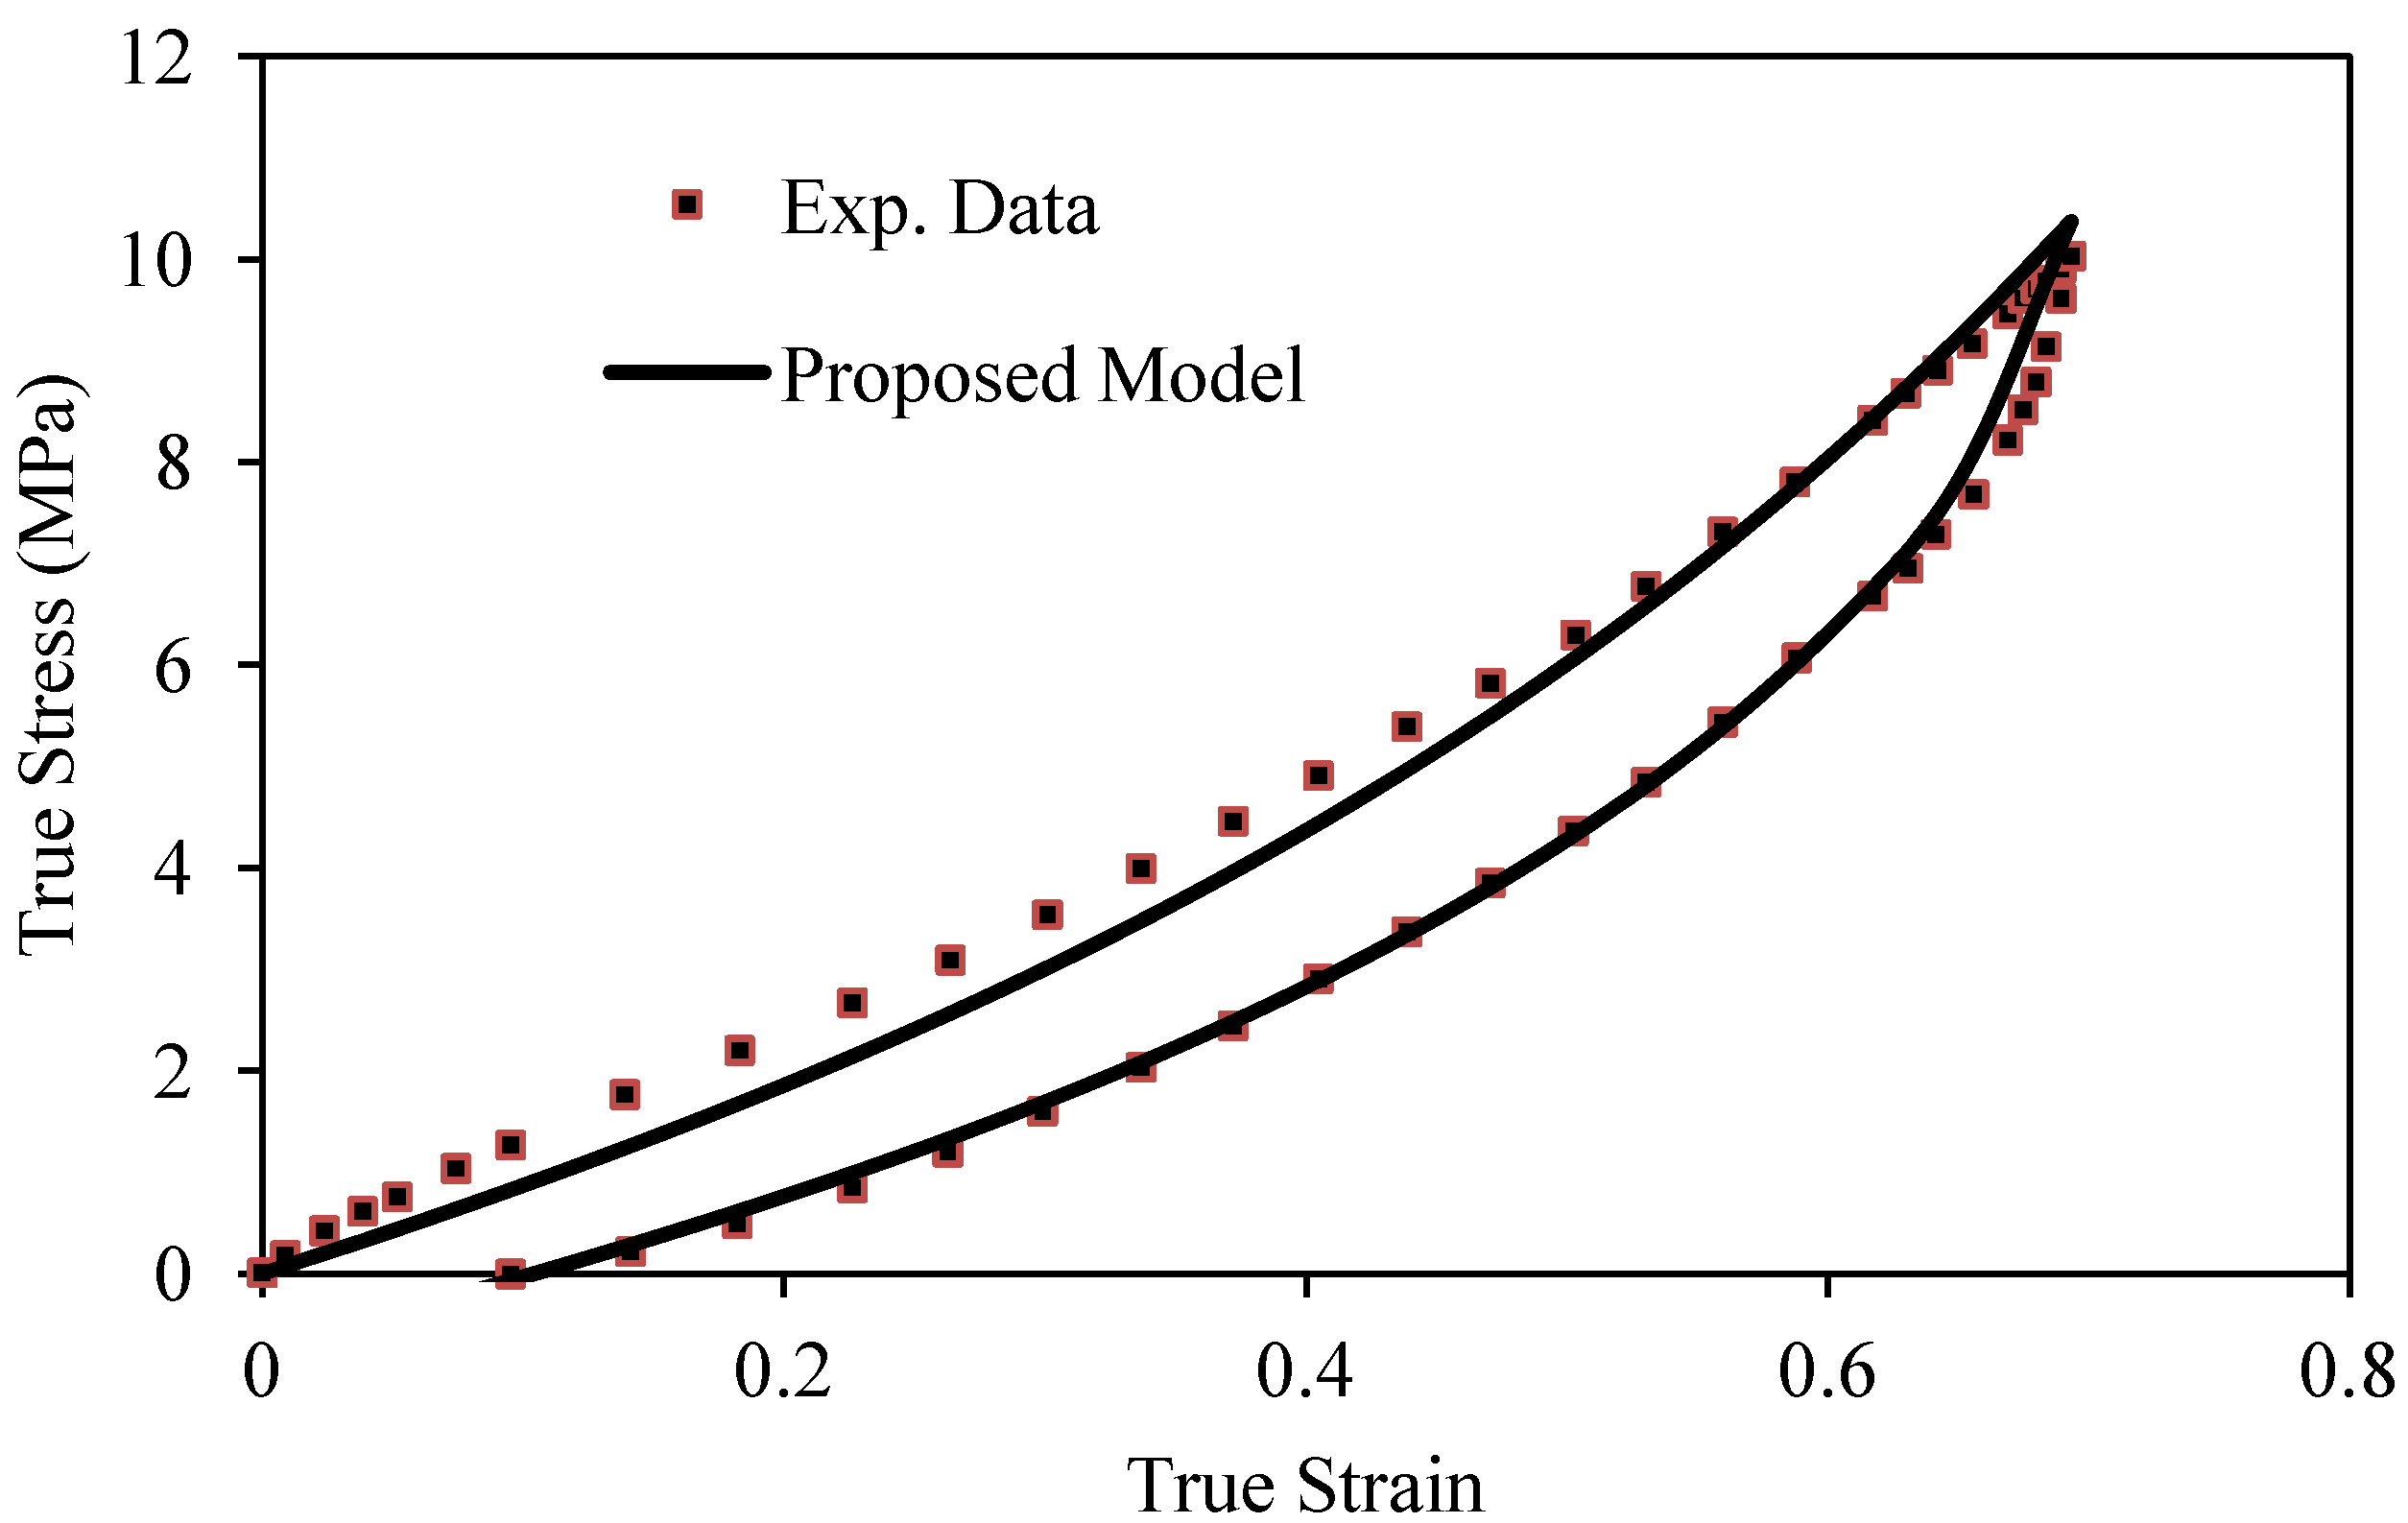
As we can see from
Figure 9, there is good agreement between theoretical predictions and collected experimental data. In this case, the RMSE has the values of 0.0401 and 0.0107 for loading and unloading curves, as shown in
Table 5. The maximum error value is 7.11% computed at the stretch value of
λmax = 1.8.
Figure 9.
Comparison of experimental data with respect to stress-softened predictions obtained from Equation (25) for 1 phr of CB-reinforced elastomer.
Figure 9.
Comparison of experimental data with respect to stress-softened predictions obtained from Equation (25) for 1 phr of CB-reinforced elastomer.
Table 5.
Predicted median square (MSE) and quadratic (RMSE) error values for a PBR-CB composite material.
Table 5.
Predicted median square (MSE) and quadratic (RMSE) error values for a PBR-CB composite material.
| Computed error values | Loading | Unloading |
|---|
| MSE | 0.0016 | 0.0001 |
| RMSE | 0.0401 | 0.0107 |
| Maximum Error | 7.11% | 1.94% |
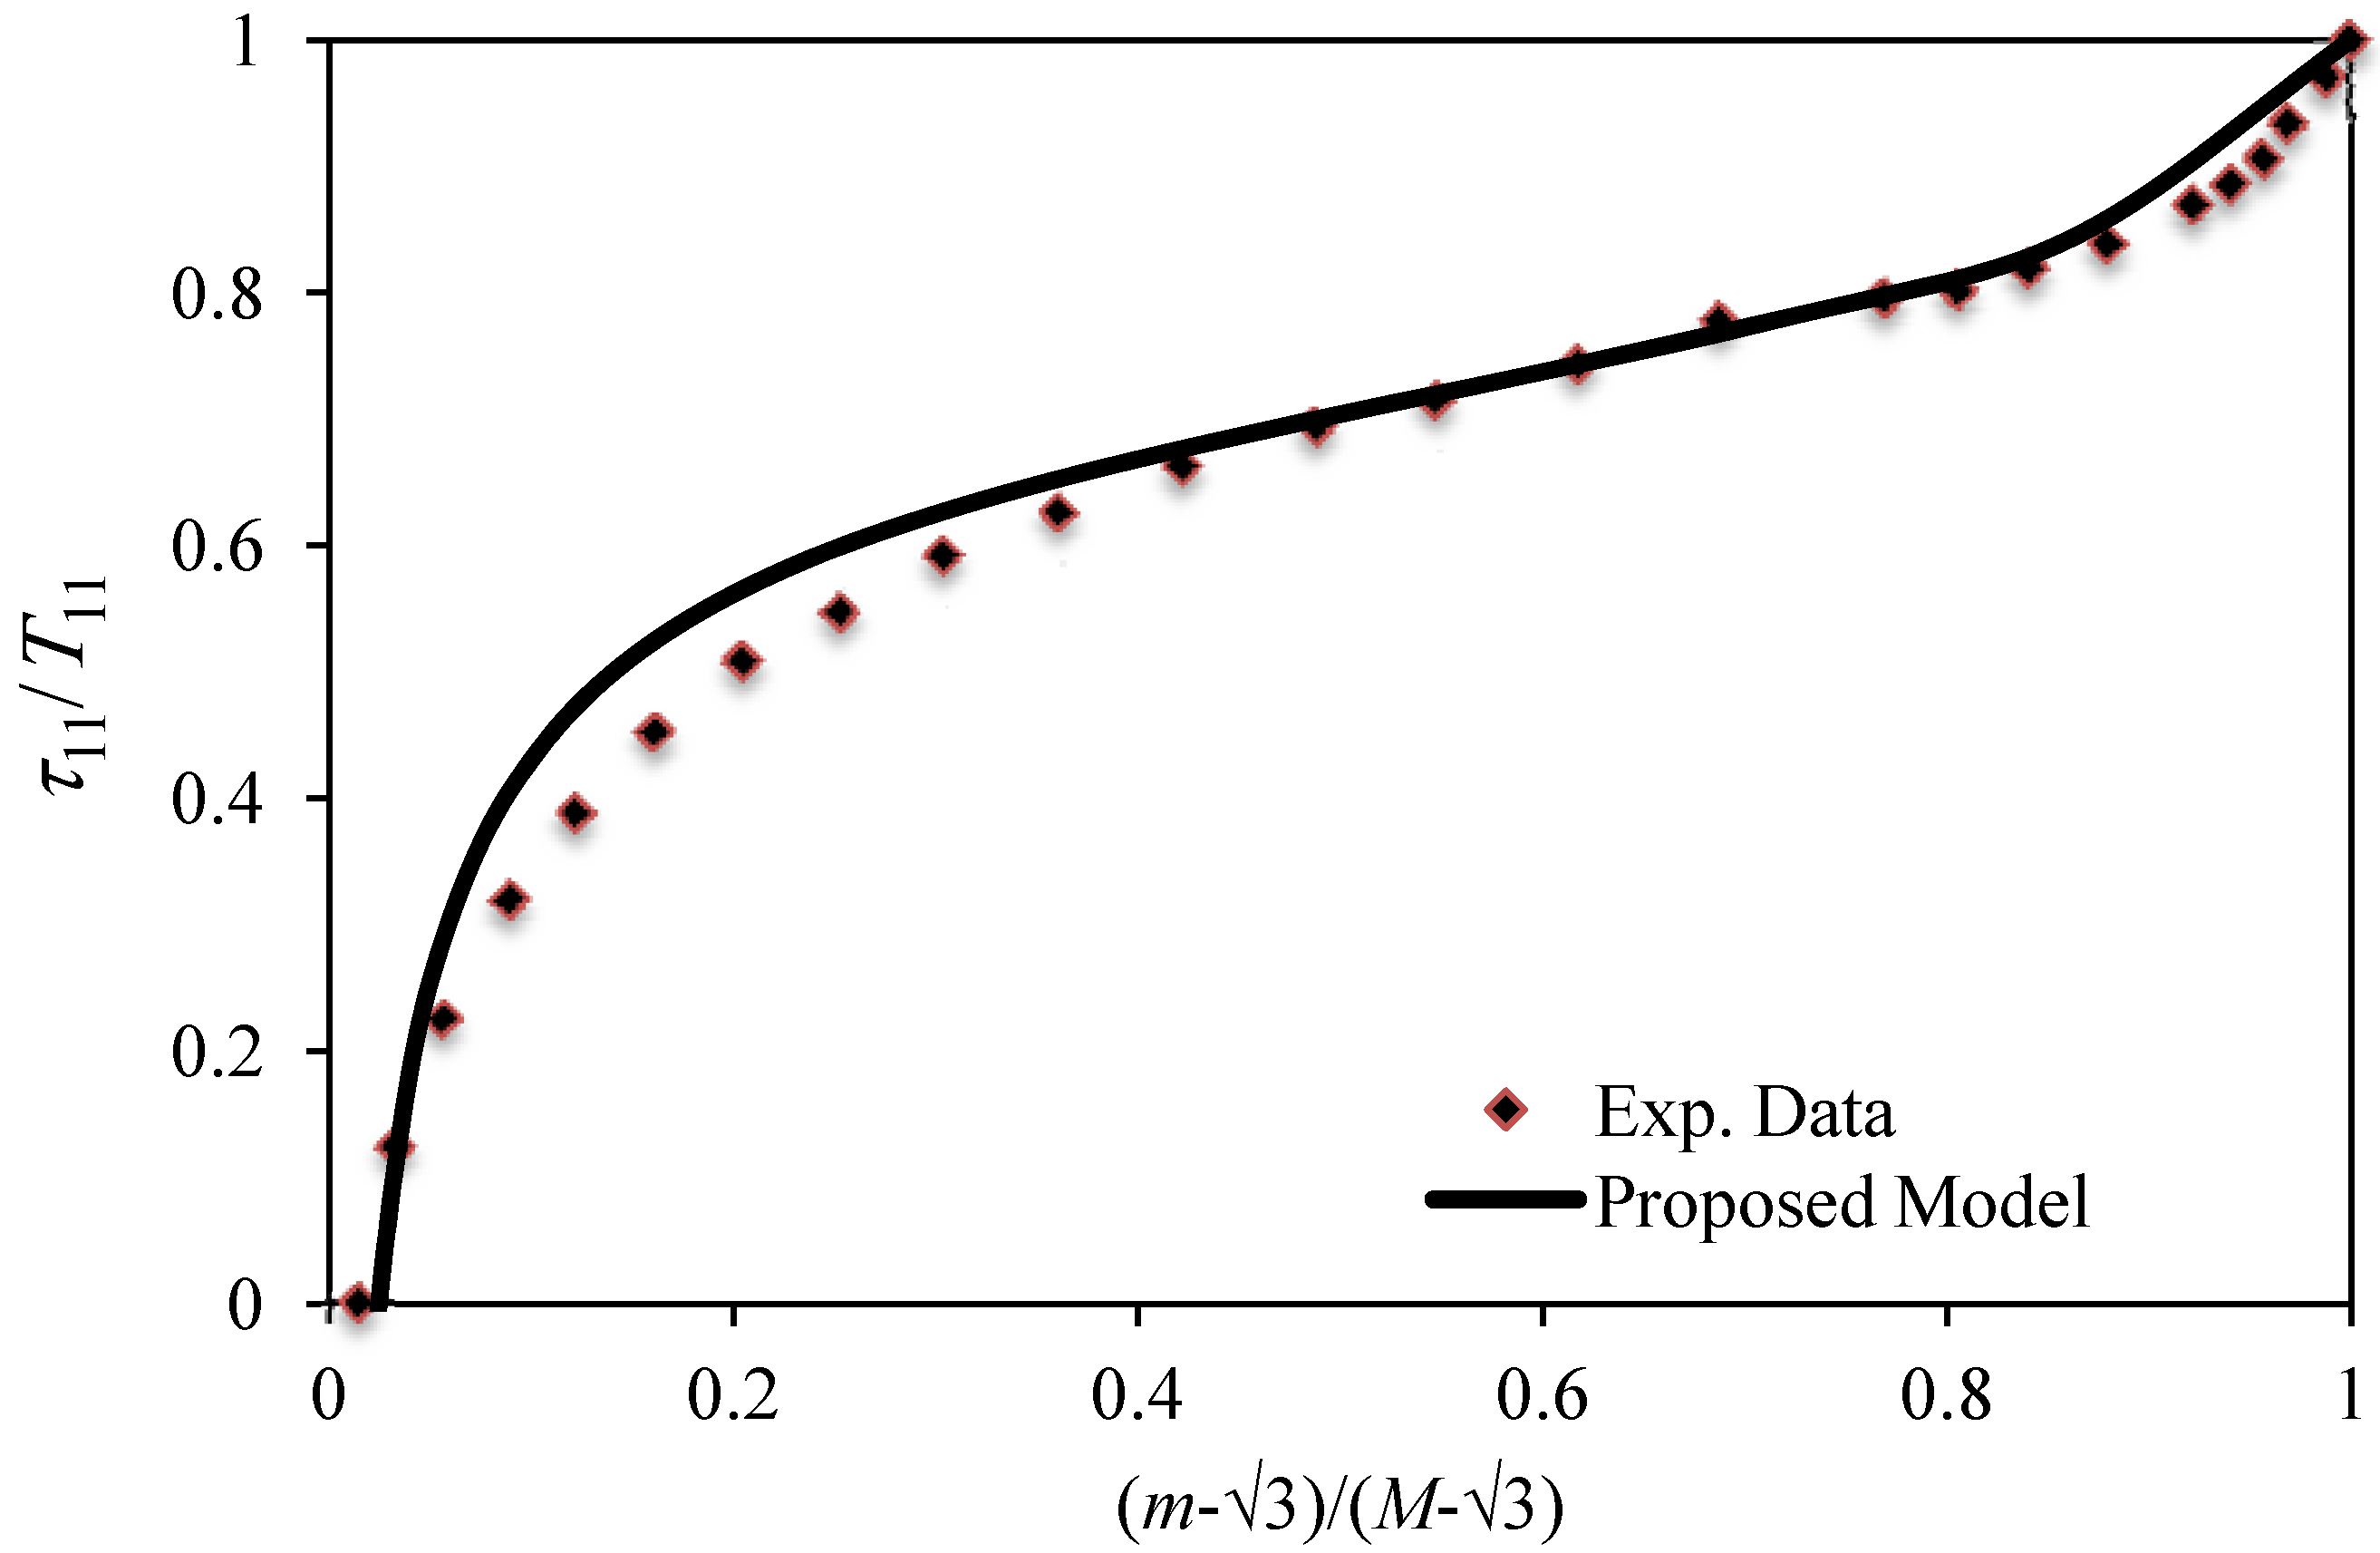
Figure 10 shows the ratio of the softening stress
τ11, and the virgin stress
T11, plotted
versus the normalized strain ratio
. Notice that our proposed non-monotonous softening model, along with the inclusion of residual strains, predicts well the behavior of the PBR-CB composite material.
Figure 10.
Comparison of experimental data and the normalized predicted material stresses τ11/T11 for the first cycle of loading and unloading for the PBR-CB composite material.
Figure 10.
Comparison of experimental data and the normalized predicted material stresses τ11/T11 for the first cycle of loading and unloading for the PBR-CB composite material.
We next characterize samples of PC/ABS reinforced with SWCNTs with 2% and 3% of weight volume fraction. In this case, we followed the ASTM-D638 type IV, and used the universal testing machine, MTS Insight 2 from MTS Insight
® electromechanical testing system with a load cell capacity of 2 kN to perform two different tests: (a) uniaxial tension test to failure; and (b) uniaxial cyclic tests with a constant incremental elongation.
Figure 11 shows the experimental set up and the material samples. We performed cyclic tests for each SWCNT fraction at the strain rate of 0.001 s
−1.
Figure 12 shows the results for uniaxial cyclic test in which there is a slight increment of the strength value when the material is reinforced with 2% of SWCNT.
Figure 11.
Experimental setup for PC/ABS composites. (a) Universal testing machine MTS insight 2; and (b) PC/ABS-SWCNT specimen dumbbell shape Die C according to the ASTM D638 type IV.
Figure 11.
Experimental setup for PC/ABS composites. (a) Universal testing machine MTS insight 2; and (b) PC/ABS-SWCNT specimen dumbbell shape Die C according to the ASTM D638 type IV.
Figure 12.
Collected uniaxial experimental data for PC/ABS-SWCNT composite material samples with 2% weight fraction of SWCNT at the strain rate of 0.001 s−1.
Figure 12.
Collected uniaxial experimental data for PC/ABS-SWCNT composite material samples with 2% weight fraction of SWCNT at the strain rate of 0.001 s−1.
We next use our material constitutive model given by Equation (25) to predict the mechanical behavior of this thermoplastic polymer blend, PC/ABS reinforced with 2% and 3% w of SWCNT. The material parameter values are shown in
Table 6.
The comparison of experimental data and theoretical prediction for a 2% w SWCNT fraction are illustrated in
Figure 13 for the first three loading and unloading cycles. It is important to mention that during the tensile test, we loaded and unloaded the samples at stretch values below the material yield point to capture only the material elastic behavior. As we can see from
Figure 13, our proposed constitutive material model predicts experimental data well. Also, it is noteworthy that the RMSE value does not exceed 1.1866, as shown in
Table 7.
Table 6.
Entry and fitted parameters values for PC/ABS-SWCNT composite material.
Table 6.
Entry and fitted parameters values for PC/ABS-SWCNT composite material.
| Parameter | 2% w SWCNT | 3% w SWCNT | Fitting parameter | 2% w SWCNT | 3% w SWCNT |
|---|
| Volume fraction, f | 0.0088 | 0.0031 | µR (MPa) | 359.4880 | 346.0830 |
| N | 200 | 200 | Δ | 0.7 | 0.8 |
| n | 1 | 1 | A1 (MPa) | 1882.3 | 1960.6 |
| α | 1/2 | 1/2 | A2 (MPa) | −4849.9 | −47239 |
| N | 1 | 1 | C (MPa) | 13 | 10 |
Table 7.
Predicted quadratic (RMSE) and median square (MSE) error values for PC/ABS-reinforced material data shown in
Figure 13. Here, “Diff” represents the maximum percentage error between theoretical and experimental data.
Table 7.
Predicted quadratic (RMSE) and median square (MSE) error values for PC/ABS-reinforced material data shown in Figure 13. Here, “Diff” represents the maximum percentage error between theoretical and experimental data.
| 2% w SWCNT | Cycle 1 | Cycle 2 | Cycle 3 |
|---|
| Loading | Unloading | Loading | Unloading | Loading | Unloading |
|---|
| RMSE | 0.1069 | 0.1655 | 0.3922 | 0.6546 | 0.9776 | 1.1866 |
| MSE | 0.0114 | 0.0274 | 0.1538 | 0.4285 | 0.9558 | 1.4081 |
| Diff | 1.20% | 2.21% | 3.74% | 3.19% | 6.20% | 5.44% |
Based on the above results, we can conclude that the enhanced material model described by Equation (25) describes the mechanical behavior of polymeric materials reinforced with SWCNT quite well.
Figure 13.
Comparison of theoretical predictions obtained from Equation (25) with experimental data of PC/ABS material reinforced with 2% weight fraction of SWCNT.
Figure 13.
Comparison of theoretical predictions obtained from Equation (25) with experimental data of PC/ABS material reinforced with 2% weight fraction of SWCNT.


 ,
, 
 where tr denotes the trace operation. In the undeformed state F = 1, and the strain intensity ; otherwise for isochoric deformations [21].


 ,
,  ,
,  ,
,  ,
,  and KB is the material bulk modulus, Ը−1 is the inverse of the Langevin function, and I1 and I3 are the first and third invariants of the left Cauchy–Green deformation tensor. Thus, the Cauchy stress tensor due to the elastomeric matrix Te, can be obtained by the following expression:


 data plots by using uniaxial experimental data.


