Dielectric Properties of Dual-Frequency Reactive Mesogens before and after Photopolymerization

Abstract
: The dielectric properties of reactive mesogens before and after photopolymerization were investigated. Commercially available nematic reactive mesogens (RMS03-013C, Merck) were measured and found to be dual-frequency liquid crystals. The property arose from the δ-relaxation process that was caused by rotational fluctuations parallel to the molecule’s long axis. After polymerization, the polymerized reactive mesogens still exhibited this dual-frequency property. The result was attributed to the β-relaxation process which arose from rotational fluctuations of localized parts of the main chain. The sign change of the dielectric anisotropy with increasing frequency after polymerization was opposite to the sign change before polymerization.1. Introduction
Reactive mesogens (RMs) are polymerizable liquid crystal (LC) monomers with rigid cores and reactive end groups. RMs can be easily aligned using the same methods used for low molecular mass LC. The end groups are polymerized with other end groups in the presence of photoinitiators and UV light, and form a film. Consequently, the orientation of the RM molecules is “frozen” and the film still has birefringence [1,2]. This remarkable characteristic makes them attractive as promising materials for light actuators such as polarizers, color filters, retarders and so on [3–5]. On the other hand, polymerized RMs (PRMs), which are stimuli-responsive materials, can be actuated by light [6–9], heat [10–12] and their properties have been well studied. There are also few reports about electric field driven PRMs [13,14]. However, investigation of the dielectric properties of PRMs in these studies were not carried out adequately and the dielectric constants of RMs before polymerization were used to investigate the kinetics, although the dielectric properties of PRM, in which the fluctuations of molecules is restricted, is supposed to be different from unpolymerized RMs [15–17]. Therefore, investigation of relations between the dielectric property and the behavior of PRMs as actuators is necessary to achieve more development in PRM actuator research.
In this study, we investigate the dielectric properties of commercially available nematic RMs (RMS03-013C, Merck, Darmstadt, Germany) in both the monomer and polymer state. The RMs were found to be dual-frequency LCs (DFLCs) in the monomer state. DFLCs change the sign of the dielectric anisotropy and are studied mainly for improving response speed of LCs [18]. It is of interest to examine how the dielectric properties of dual-frequency RMs change after polymerization.
2. Experiment
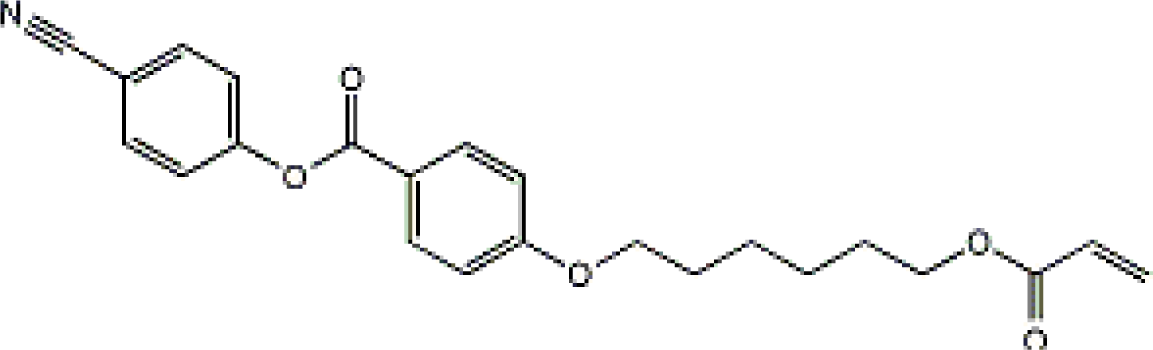
The sample was prepared by mixing a photoinitiator [2-Benzyl-2-(dimethylamino)-4’-morpholinobutyrophenone, Tokyo chemical industry] with RMs at a concentration of 2.8 wt%. It should be note that the RM mixture contains several RMs and one of the RMs, 4-[6-(Acryloyloxy)hexyloxy]benzoic acid=4-cyanophenyl ester (see Figure 1), is pronounced. The glass substrates with indium tin oxide electrodes and alignment layers were used for assembling sandwich cells. Planar and homeotropic alignment were adopted to measure the dielectric constant perpendicular (ε⊥) and parallel (ε⃦) to the molecular long axis, respectively. Planar alignment polyimide (AL1254, JSR, Tokyo, Japan) and homeotropic alignment polyimide (JALS-20210-R2, JSR) were used; AL1254 was rubbed to induce uniaxial alignment. These cells were filled with the samples and PRMs were obtained by UV irradiation (25 mW/cm2, 60 s) at room temperature using a UV lamp (Lightningcure LC9566, Hamamatsu Photonics, Hamamatsu, Japan).
The impedance of the cells was measured at elevated temperature using an impedance analyzer (4294A, Agilent Technologies, Santa Clara, CA, USA). The amplitude of the probe signal is 0.02 V and the frequency range was varied from 103 to 105 Hz. The complex dielectric constant, ε = ε′ − iε″, was calculated by representing the cells with an equivalent circuit consisting of a parallel connected resistance and capacitance. The dielectric anisotropy was obtained by the relation Δε = ε⃦ − ε⊥.
3. Results and Discussion
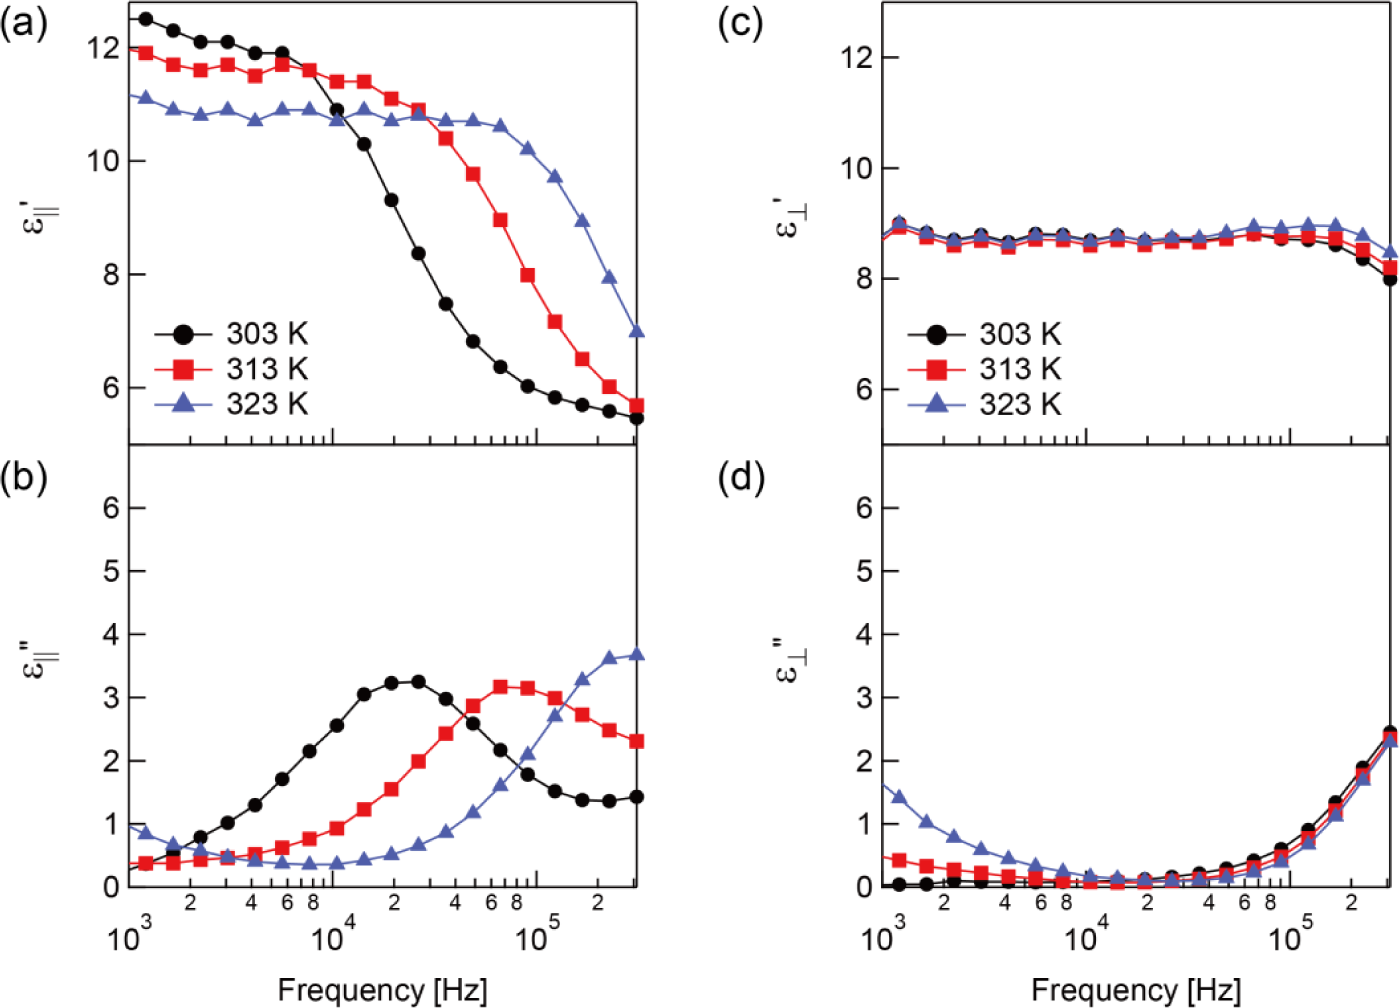
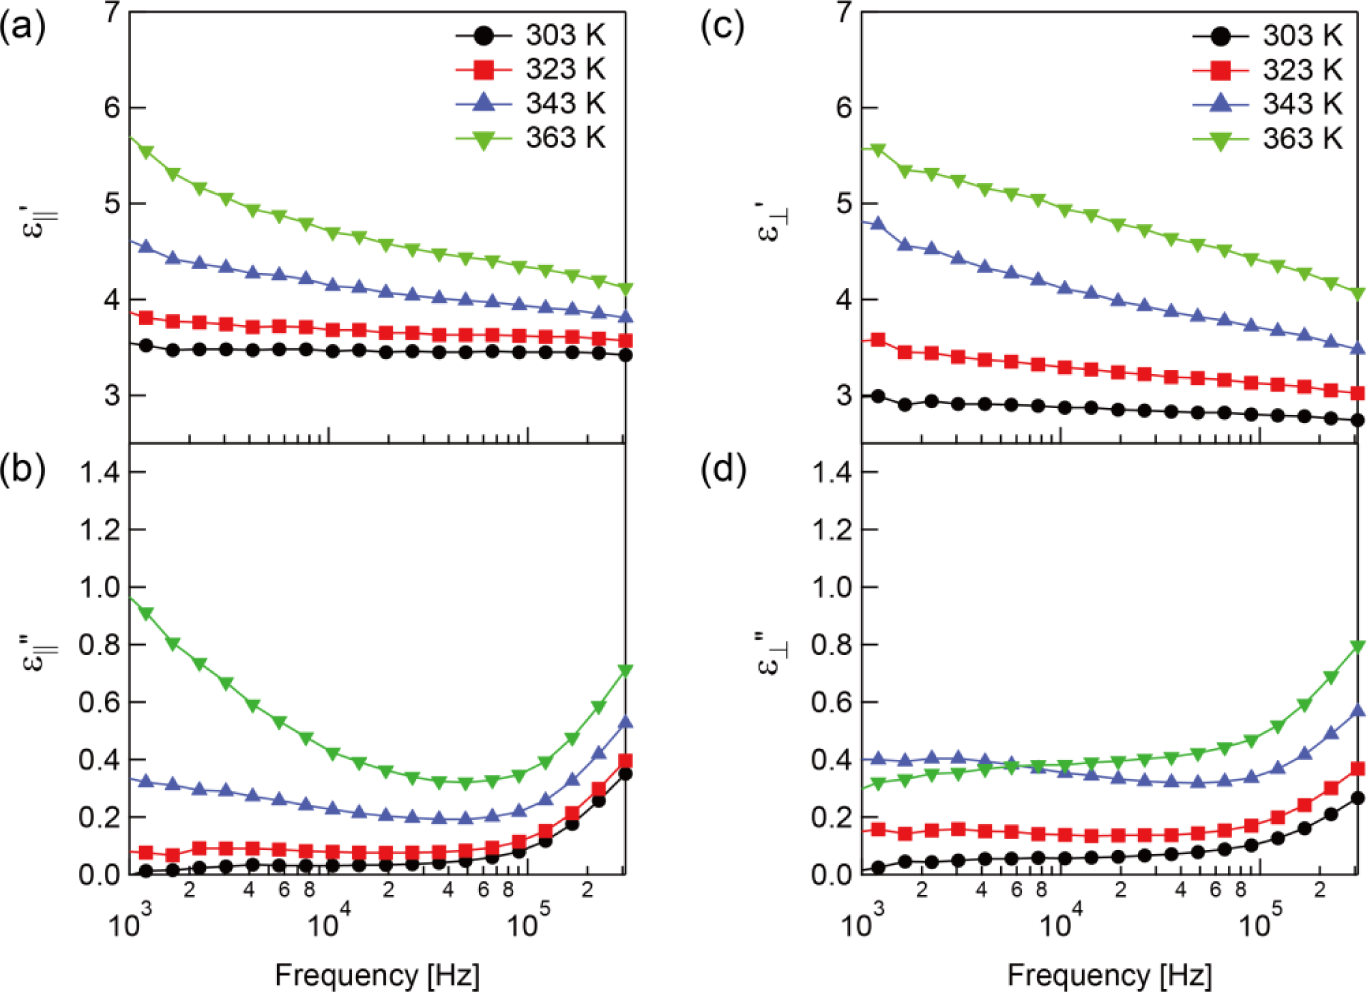
The dielectric constants before polymerization up to 323 K are shown in Figure 2. It should be noted that the phase transition of the sample from the nematic to isotropic state was at approximately 329 K. The relaxation process was observed and indicated by a steep decrease of ε⃦′ (Figure 2a) and a peak in ε⃦″ (Figure 2b). On the other hand, and do not have a frequency dependence (Figure 2c,d).
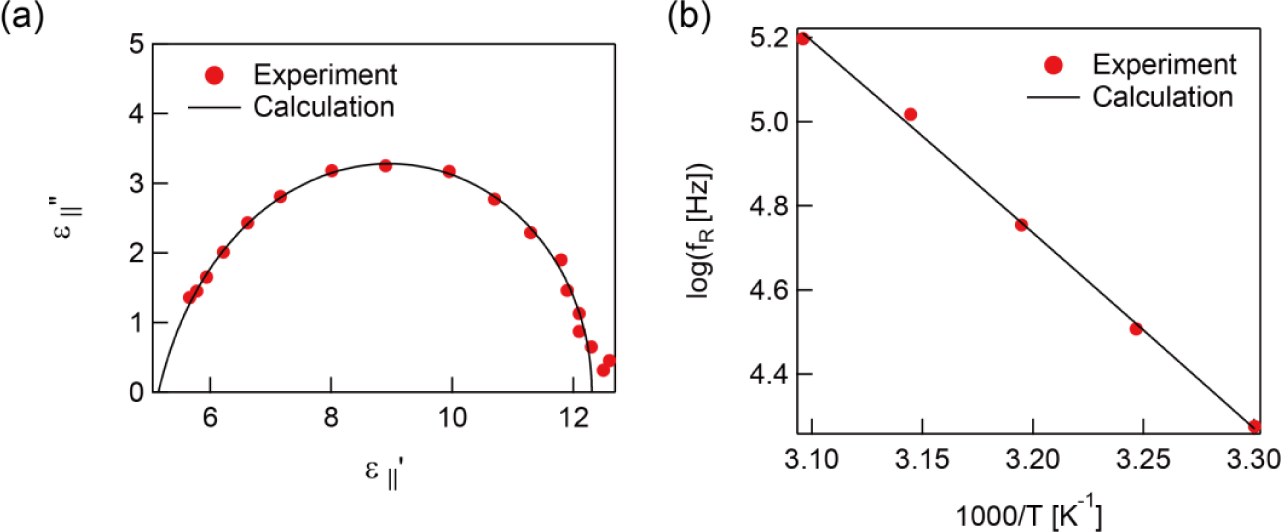
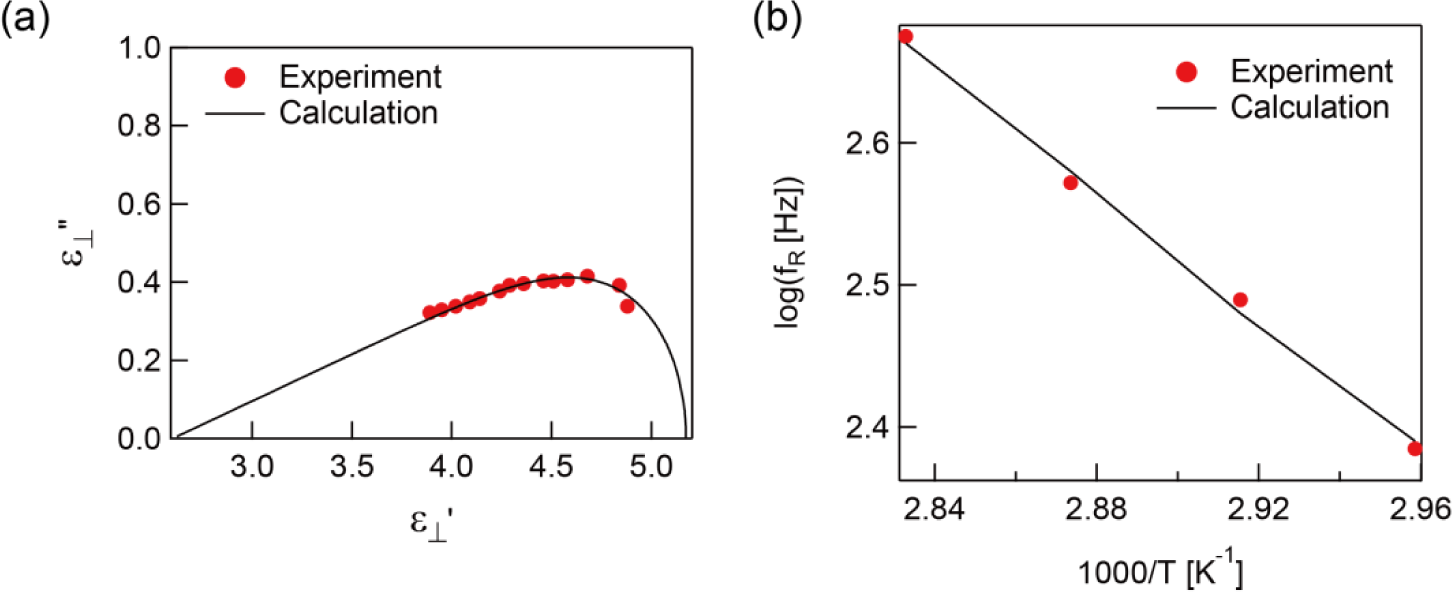
Detailed information about relaxations can be obtained using the Cole-Cole plot by calculating the fitting model function of Havriliak–Negami [19] described below:
Here, ω = 2πf is the circular frequency and τ is the relaxation time multiplied by 2π. The relaxation frequency fR can be obtained by fR = τ/2π. εs − ε∞ is the relaxation strength where εs and ε∞ are the dielectric constant at the extra low and high frequency, respectively. b and a are shape parameters (0 < b, ab < 1) due to the symmetric and asymmetric broadening of the dielectric loss peak which characterize the width of the distribution of the relaxation time. The Cole-Cole plot of the dielectric constant parallel to the molecule axis at 303 K is shown in Figure 3a. The fitting parameters are a = 0.82, b = 0.99, and fR = 18.8 kHz. The plot gives a slightly asymmetric semicircle due to a being a little smaller than 1. The temperature dependence of the relaxation frequency, extracted by Equation (1), is presented in Figure 3b. Generally, the temperature dependence of the relaxation frequency can be described by the Arrhenius equation fR ∝ exp(−Ea/kbT), where Ea is the activation energy, kb is the Boltzmann constant, and T is absolute temperature. The measured temperature dependence of the relaxation frequency followed the Arrhenius equation well with Ea = 87.9 kJ·mol−1 as shown in Figure 3b.
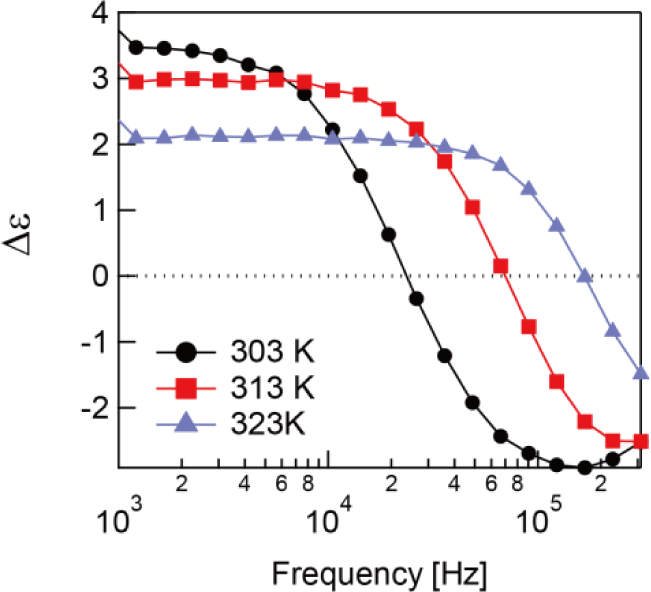
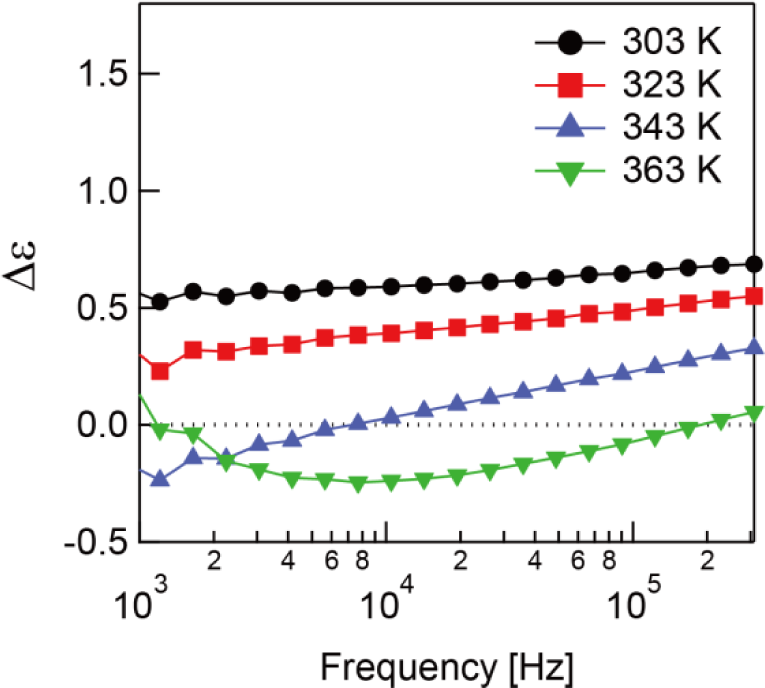
A RM molecule has two components of its dipole vector longitudinal and transverse to its long axis. The orientational polarization occurs when the dipoles are rotationally fluctuated by the electric field, and the dielectric constants ε‖ = ε‖′ − ε‖″ and are generated from the rotational fluctuations parallel and perpendicular to the molecule long axis, respectively. Since the relaxation process was only found with ε‖, the relaxation of the unpolymerized sample was attributed to the rotational fluctuation of the molecules around the molecule short axis called δ-relaxation [16]. The obtained activation energy is an acceptable value for the δ-relaxation of nematic liquid crystals [16,20]. The δ-relaxation generally occurs at lower frequency than β-relaxation which is caused by the rotational fluctuations of molecules around the molecule long axis [16,20]. This means the relaxation process with ε⊥ is supposed to show up in the higher frequency region. The asymmetric semicircle of the Cole-Cole plot means that the relaxation includes multi-relaxation processes. Therefore, the RM used in this study, which is mixture of several RMs, should have multi-relaxation processes. Since only ε‖ has the relaxation process in the measured frequency region, become larger than ε‖′ in the high frequency region while ε‖′ is larger than in the low frequency region. Hence, the sign of the dielectric anisotropy, Δε = ε‖ − ε⊥ changes from positive to negative at a specific frequency called the crossover frequency as can see in Figure 4. This is the typical behavior of DFLCs [18].
The real parts of the complex dielectric constants of the sample after polymerization were lower than before polymerization for the entire measured frequency region (Figure 5a,c). While of the unpolymerized sample does not vary with temperature, of the polymerized sample does. This tendency can also be seen with ε‖′. In addition, the same temperature dependence was also found with ε‖″ and as shown in Figure 5b,d. Although there were no outstanding peaks with ε‖″ and , weak peaks in were found at the low frequency region. The temperature dependence of the imaginary parts of the dielectric constants at 3 kHz is shown in Figure 6. Both ε‖″ and increase with increasing temperature as mentioned previously and has a peak indicating the existence of dielectric loss.
In Figure 7a, the Cole-Cole plot of is shown with the calculation from Equation (1) using fitting parameters a = 0.15, b = 0.95, and fR = 308.7 Hz. The resultant plot is quite different from a symmetric semicircle due to the low value of a caused by a large relaxation time distribution. The temperature dependence of the relaxation frequency for is shown in Figure 7b. The result followed the Arrhenius equation similar to ε‖″ of the unpolymerized sample. The activation energy was calculated as 43.4 kJ·mol−1.
The lower dielectric constants of PRM can be attributed to the restriction of rotational fluctuations of PRM molecules because of the connection of each molecule leading to decreasing contribution of the orientational polarization. Generally, δ-relaxation is not able to activate with main chain liquid crystalline polymers in which mesogens are incorporated directly into a main chain [15,16]. Moreover, in case of side chain liquid, crystalline polymers in which mesogens are decoupled from a main chain by a spacer, δ-relaxation can only become active above the glass transition temperature, Tg [16,17,21]. Hence, δ-relaxation must not occur with our system where Tg = 372 K as measured by differential scanning calorimetry.
Increasing ε‖″ and with increasing temperature could be attributed to α-relaxation assigned to micro-Brownian motion of a main chain being active around Tg. It is reported that α-relaxation can be observed with both ε‖″ and owing to random movement of micro-Brownian motion [21]. Since the temperature dependence of ε‖″ and observed in PRM is not observed in RM, the dependence should be an inherent characteristic of the polymeric system similar to the glass transition temperature. The dielectric constants at low frequency are slightly higher than at high frequency. It is believed that the α-relaxation peak will show up at the low frequency region at higher temperature.
The relaxation process indicated by a weak peak in is attributed to β-relaxation [15,17,21]. The β-relaxation is also observed in non-liquid crystalline polymeric systems arising from rotational fluctuations of localized parts of a main chain and/or side chains attached to a main chain. It should be mentioned that the relaxation time distribution of β-relaxation is quite large because of the occurrence of several relaxation processes. In the case of 4-[6-(Acryloyloxy)hexyloxy]benzoic acid=4-cyanophenyl ester, the fluctuations of the ester group near the main chain and fluctuations of the mesogen are reported [17,21]. In addition, the other materials mixed with the sample could broaden the dielectric loss peak as shown in Figure 7 (a). The obtained activation energy of the relaxation with is an acceptable value for β-relaxation [16,17,21].
In Figure 8, the dielectric anisotropy of the polymerized sample is shown. It is worth mention that the sign of the dielectric anisotropy changes from negative to positive above 338 K, which is the opposite behavior of the sample before polymerization. This dual-frequency behavior is given by the β-relaxation. Although the δ-relaxation dominates the system before polymerization, the β-relaxation takes precedence after polymerization. It is thought this phenomena only occurs with the RMs with large ε⊥ or with a large component of the dipole vector transverse to the long axis of the molecule.
4. Conclusions
The dielectric properties of the RM before and after polymerization were investigated. The RM showed the dielectric relaxation of the δ-relaxation arising from rotational fluctuation of the molecules around the molecule short axis. Consequently, the RM showed DFLC behavior. On the other hand, the PRM had the dielectric relaxation assigned to the β-relaxation generated from the rotational fluctuation of the molecules around the molecule long axis. The PRM also showed dual-frequency characteristics. However, the dielectric anisotropy, with increasing frequency, was observed to go from positive to negative before polymerization and negative to positive after polymerization.
Acknowledgments
This study was supported by a Grant-In-Aid for Research Fellowships from the Japan Society for the Promotion of Science (JSPS) for Young Scientist and by the PRESTO (Precursory Research for Embryonic Science and Technology) program from Japan Science and Technology Agency. The authors thank Mr. Yusuke Gotoh for helpful discussions.
Conflicts of Interest
The authors declare no conflict of interest.
References
- Johan, L.; Dirk, J.B. Cross-Linked Liquid Crystalline Systems: From Rigid Polymer Networks to Elastomers; Dirk, J.B., Gregory, P.C., Slobodan, Z., Eds.; CRC Press: Boca Raton, FL, USA, 2011; pp. 3–48. [Google Scholar]
- Thiem, H.; Strohriegl, P.; Shkunov, M.; McCulloch, I. Photopolymerization of reactive mesogens. Macromol. Chem. Phys 2005, 206, 2153–2159. [Google Scholar]
- Broer, D.J.; Lub, J.; Mol, G.N. Wide-band reflective polarizers from cholesteric polymer networks with a pitch gradient. Nature 1995, 378, 467–469. [Google Scholar]
- Lub, J.; van de Witte, P.; Doornkamp, C.; Vogels, J.P.A.; Wegh, R.T. Stable photopatterned cholesteric layers made by photoisomerization and subsequent photopolymerization for use as color filters in liquid-crystal displays. Adv. Mater 2003, 15, 1420–1425. [Google Scholar]
- Bae, K.-S.; Cha, U.; Moon, Y.-K.; Heo, J.W.; Lee, Y.-J.; Kim, J.-H.; Yu, C.-J. Reflective three-dimensional displays using the cholesteric liquid crystal with an inner patterned retarder. Opt. Express 2012, 20, 6927–6931. [Google Scholar]
- Yu, Y.; Nakano, M.; Ikeda, T. Photomechanics: Directed bending of a polymer film by light. Nature 2003, 425, 145–145. [Google Scholar]
- Van Oosten, C.L.; Bastiaansen, C.W.M.; Broer, D.J. Printed artificial cilia from liquid-crystal network actuators modularly driven by light. Nat. Mater 2009, 8, 677–682. [Google Scholar]
- Cheng, F.; Yin, R.; Zhang, Y.; Yen, C.-C.; Yu, Y. Fully plastic microrobots which manipulate objects using only visible light. Soft Matter 2010, 6, 3447–3449. [Google Scholar]
- Camacho-Lopez, M.; Finkelmann, H.; Palffy-Muhoray, P.; Shelley, M. Fast liquid-crystal elastomer swims into the dark. Nat. Mater 2004, 3, 307–310. [Google Scholar]
- Sánchez-Ferrer, A.; Fischl, T.; Stubenrauch, M.; Wurmus, H.; Hoffmann, M.; Finkelmann, H. Photo-crosslinked side-chain liquid-crystalline elastomers for microsystems. Macromol. Chem. Phys 2009, 210, 1671–1677. [Google Scholar]
- Buguin, A.; Li, M.-H.; Silberzan, P.; Ladoux, B.; Keller, P. Micro-actuators: When artificial muscles made of nematic liquid crystal elastomers meet soft lithography. J. Am. Chem. Soc 2006, 128, 1088–1089. [Google Scholar]
- Ahir, S.V.; Tajbakhsh, A.R.; Terentjev, E.M. Self-assembled shape-memory fibers of triblock liquid-crystal polymers. Adv. Funct. Mater 2006, 16, 556–560. [Google Scholar]
- Cairns, D.R.; Sibulkin, M.; Crawford, G.P. Switching dynamics of suspended mesogenic polymer microspheres. Appl. Phys. Lett 2001, 78, 2643–2645. [Google Scholar]
- Kosc, T.Z.; Marshall, K.L.; Jacobs, S.D.; Lambropoulos, J.C.; Faris, S.M. Electric-field-induced motion of polymer cholesteric liquid-crystal flakes in a moderately conductive fluid. Appl. Opt 2002, 41, 5362–5366. [Google Scholar]
- Gedde, U.W.; Liu, F.; Hult, A.; Gustafsson, A.; Jonsson, H.; Boyd, R.H. Dielectric relaxation of liquid crystalline main chain polyethers. Polymer 1991, 32, 1219–1222. [Google Scholar]
- Friedrich, K.; Andreas, S. Broadband Dielectric Spectroscopy; Friedrich, K., Andreas, S., Eds.; Springer: Berlin, Germany, 2003; pp. 385–432. [Google Scholar]
- Zentel, R.; Strobl, G.R.; Ringsdorf, H. Dielectric relaxation of liquid crystalline polyacrylates and polymethacrylates. Macromolecules 1985, 18, 960–965. [Google Scholar]
- Xianyu, H.; Wu, S.-T.; Lin, C.-L. Dual frequency liquid crystals: a review. Liq. Cryst 2009, 36, 717–726. [Google Scholar]
- Havriliak, S.; Negami, S. A complex plane representation of dielectric and mechanical relaxation processes in some polymers. Polymer 1967, 8, 161–210. [Google Scholar]
- Davies, M.; Moutran, R.; Price, A.H.; Beevers, M.S.; Williams, G. Dielectric and optical studies of a nematogen (4,4-n-heptyl-cyanobiphenyl). J. Chem. Soc. Faraday Trans. 2 1976, 72, 1447–1458. [Google Scholar]
- Haase, W.; Pranoto, H.; Bormuth, F.J. Dielectric properties of some side chain liquid crystalline polymers. Ber. Bunsenges. Phys. Chem 1985, 89, 1229–1234. [Google Scholar]


© 2014 by the authors; licensee MDPI, Basel, Switzerland This article is an open access article distributed under the terms and conditions of the Creative Commons Attribution license (http://creativecommons.org/licenses/by/3.0/).
Share and Cite
Kumagai, T.; Yoshida, H.; Ozaki, M. Dielectric Properties of Dual-Frequency Reactive Mesogens before and after Photopolymerization. Materials 2014, 7, 1113-1121. https://doi.org/10.3390/ma7021113
Kumagai T, Yoshida H, Ozaki M. Dielectric Properties of Dual-Frequency Reactive Mesogens before and after Photopolymerization. Materials. 2014; 7(2):1113-1121. https://doi.org/10.3390/ma7021113
Chicago/Turabian StyleKumagai, Takayuki, Hiroyuki Yoshida, and Masanori Ozaki. 2014. "Dielectric Properties of Dual-Frequency Reactive Mesogens before and after Photopolymerization" Materials 7, no. 2: 1113-1121. https://doi.org/10.3390/ma7021113