Characterization of Nanoreinforcement Dispersion in Inorganic Nanocomposites: A Review

 ,
,
Abstract
:1. Introduction

2. Qualitative Characterization
2.1. Characterization Techniques
2.2. Metal Matrix Nanocomposites

| Characterization technique | Mode of analysis | Sample form | Extent of distribution |
|---|---|---|---|
| Scanning Electron Microscopy (SEM) | direct | powder and bulk | localized (2D) |
| Transmission Electron Microscopy (TEM) | direct | powder and bulk | localized (2D) |
| Atomic Force Microscopy (AFM) | direct | bulk | localized (3D) |
| X-ray Microcomputed Tomography | direct | bulk | localized (3D) |
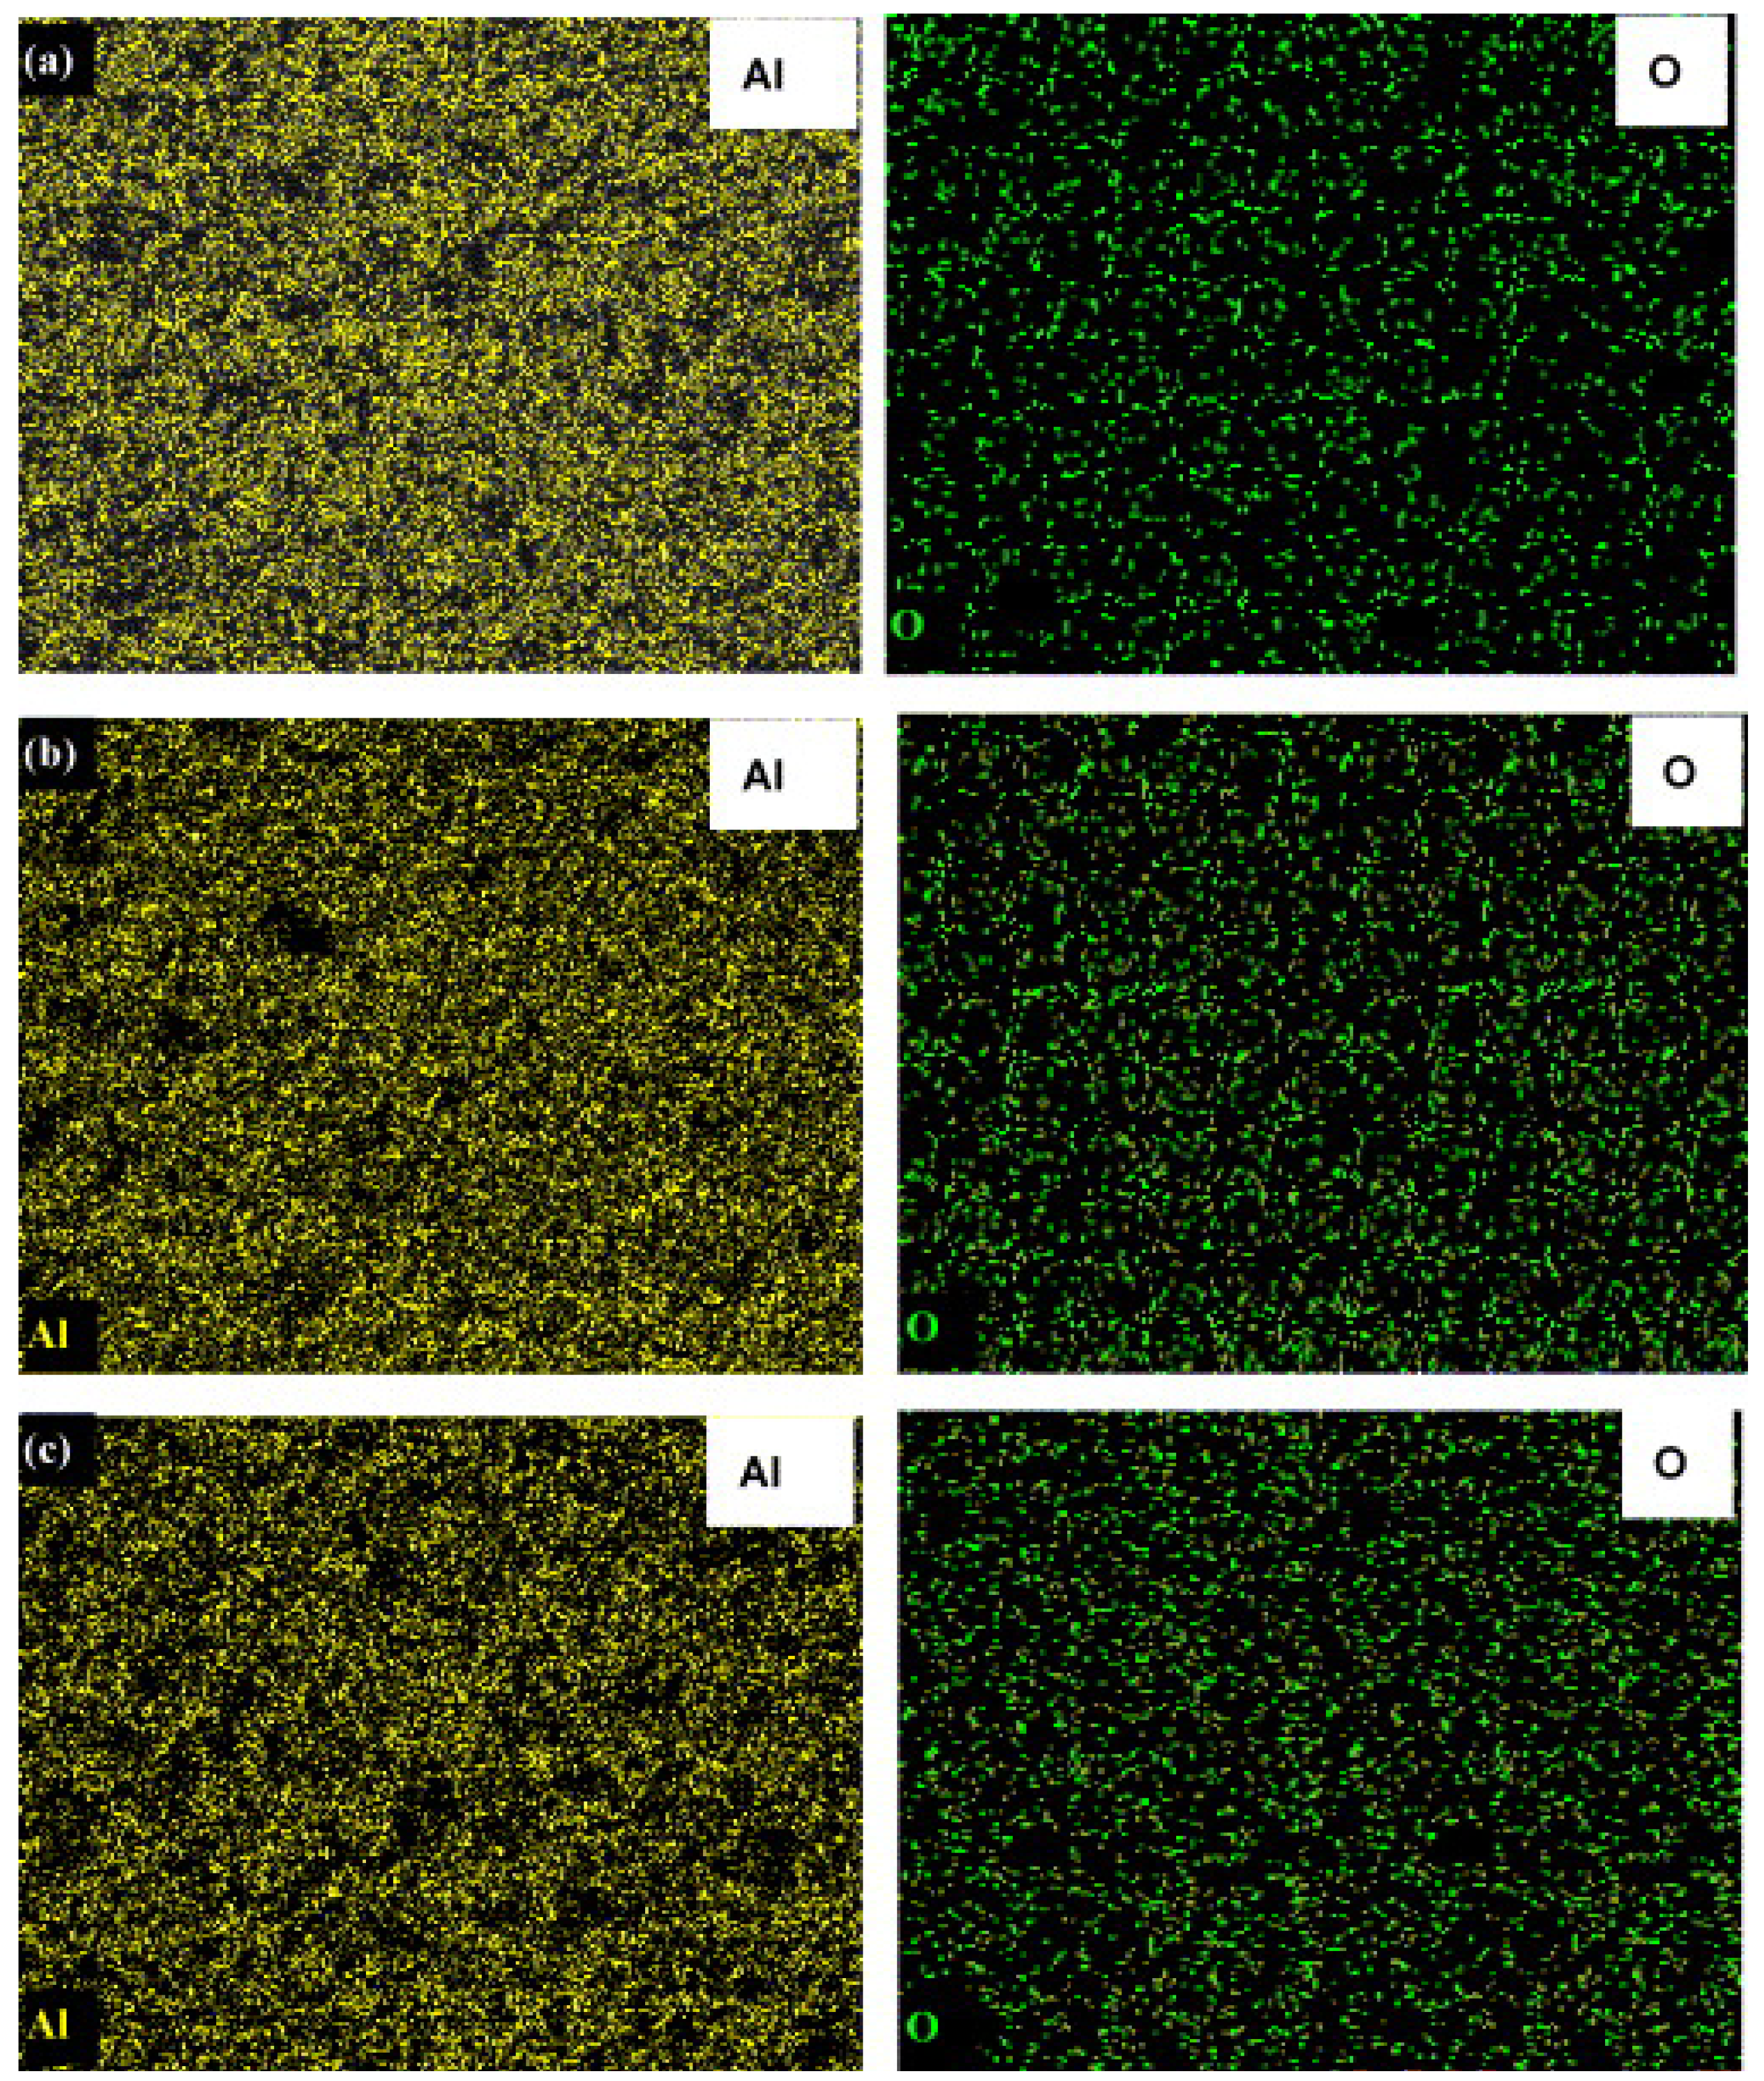
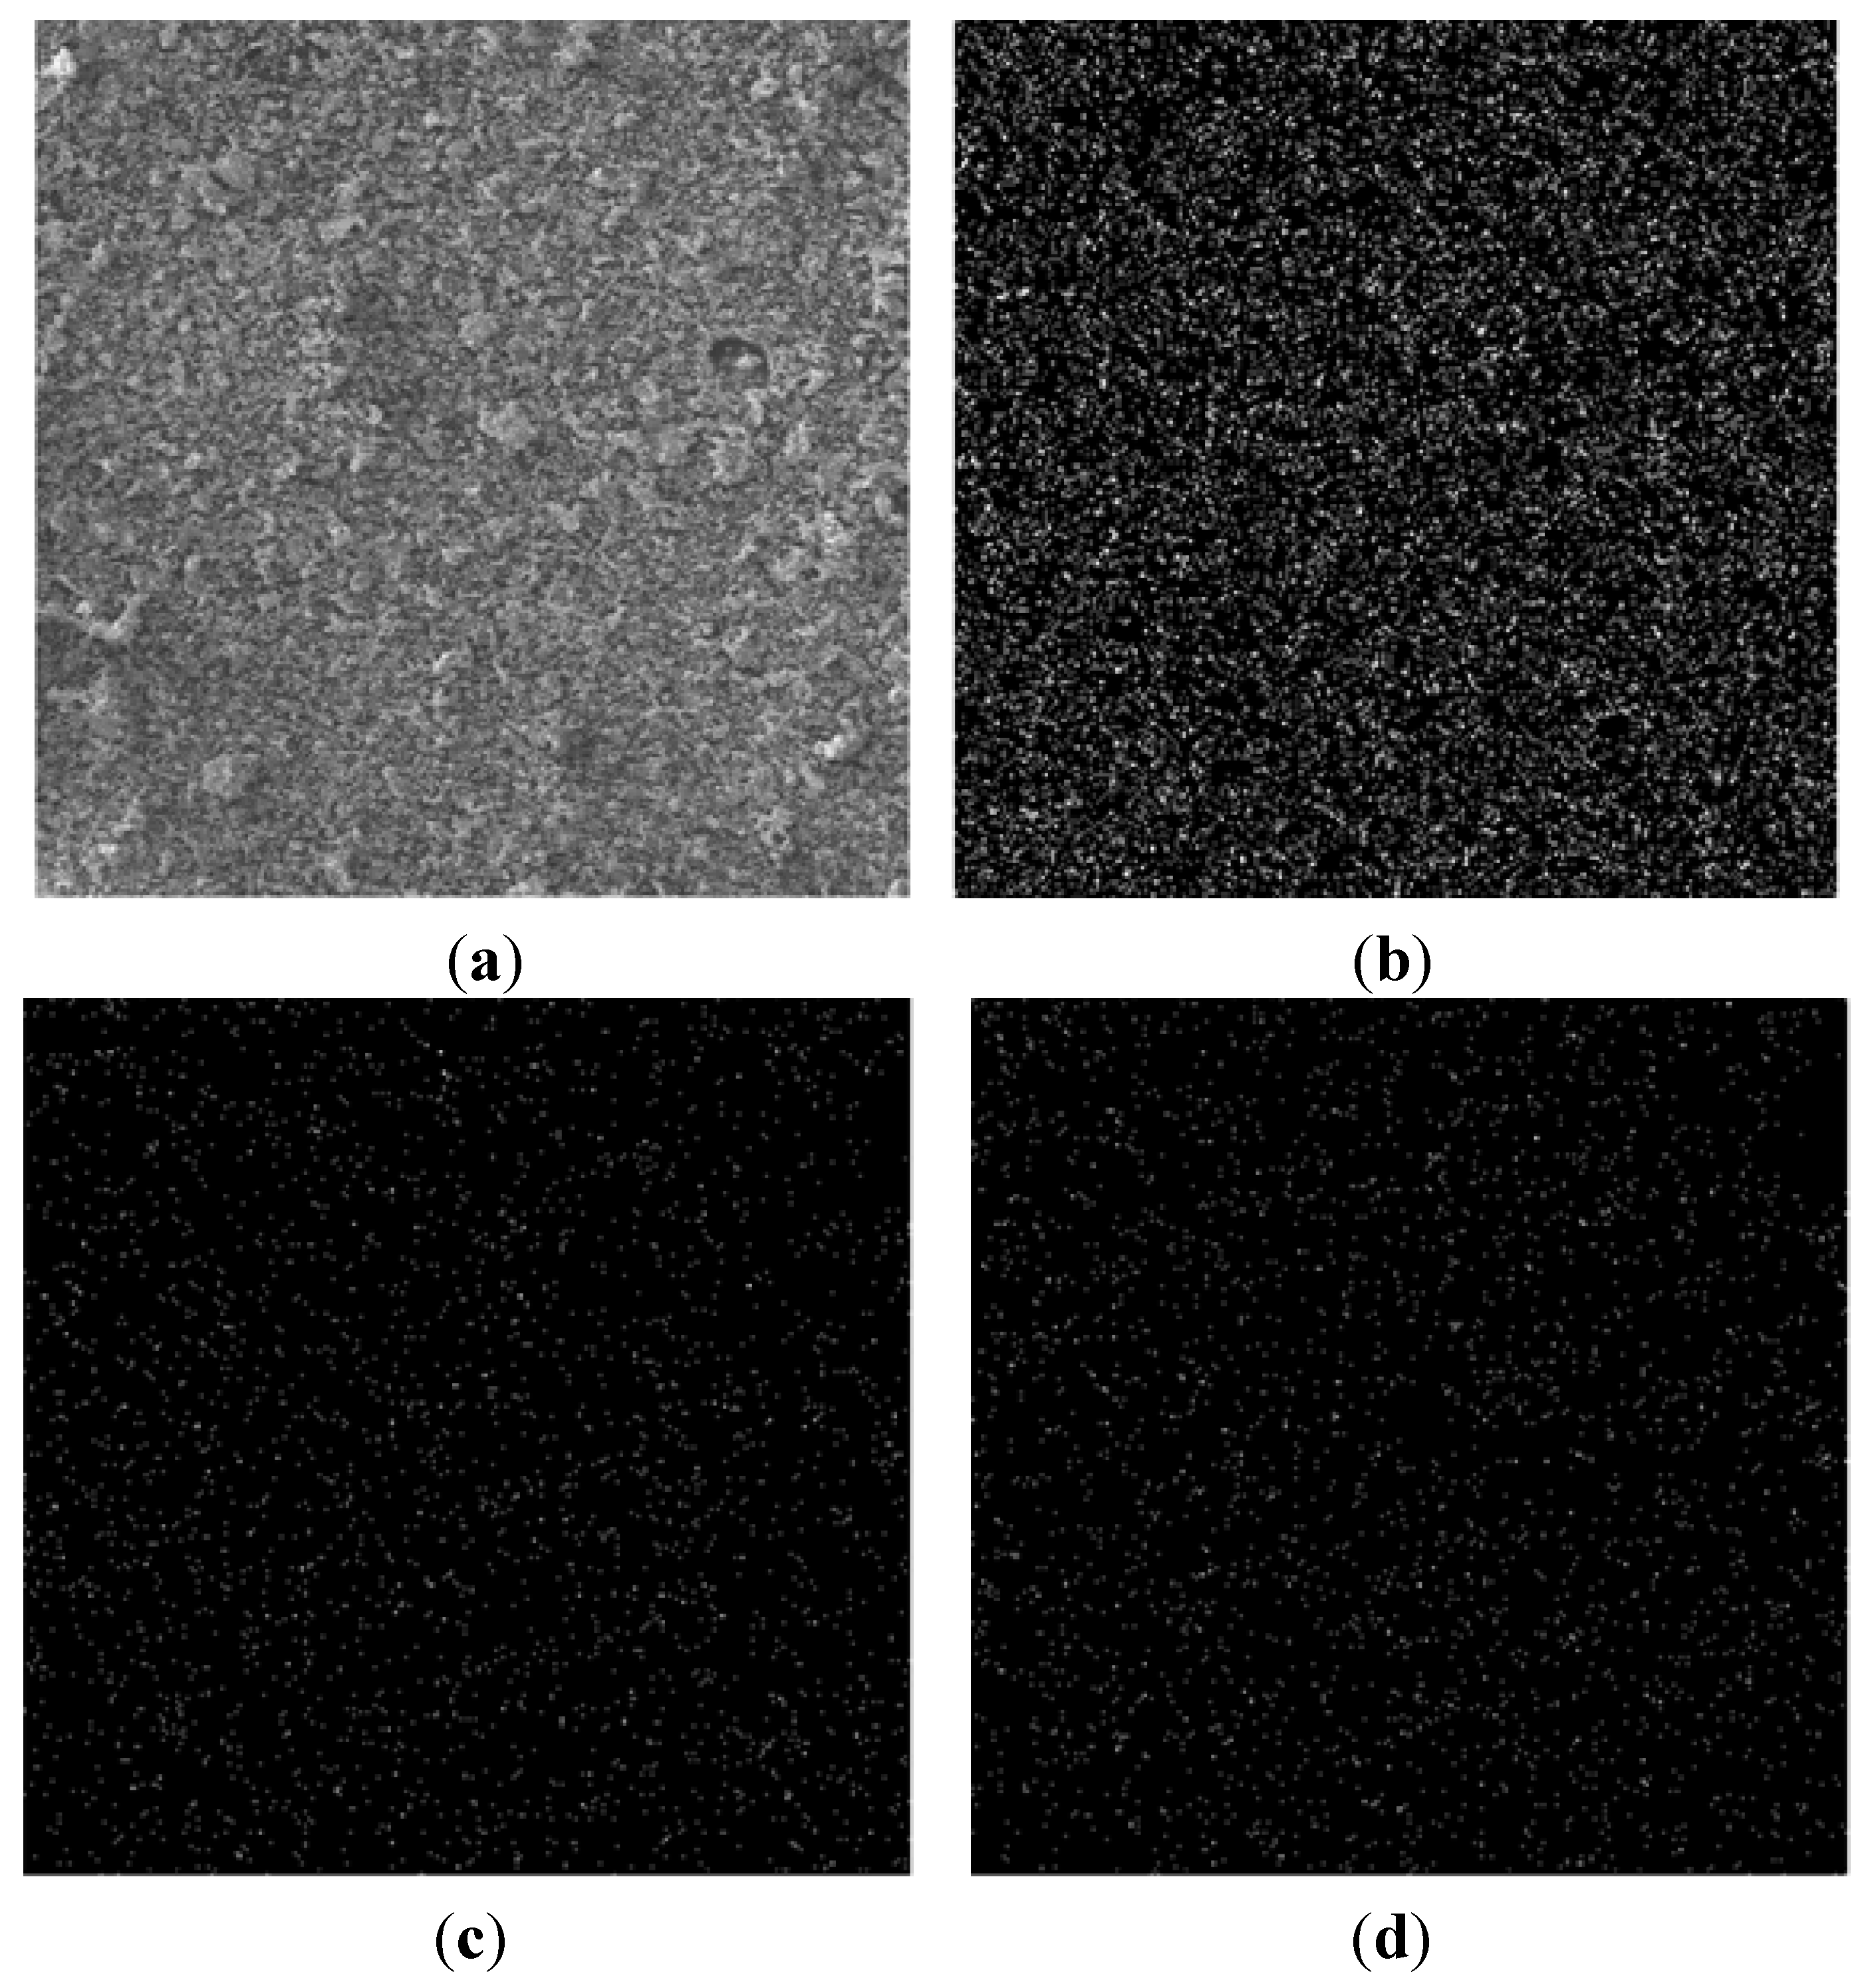
| X-ray mapping | direct | powder and bulk | localized and bulk |
| Zeta Potential Measurements | indirect | powder | localized and bulk |
| Raman Confocal Microscopy | direct | bulk | localized and bulk (3D) |
| Ultra-Small Angle X-ray Scattering (USAXS) | indirect | powder and bulk | – |


| Nanocomposite | Fabrication process | Characterization technique | Composite form | Dispersion quality | Reference |
|---|---|---|---|---|---|
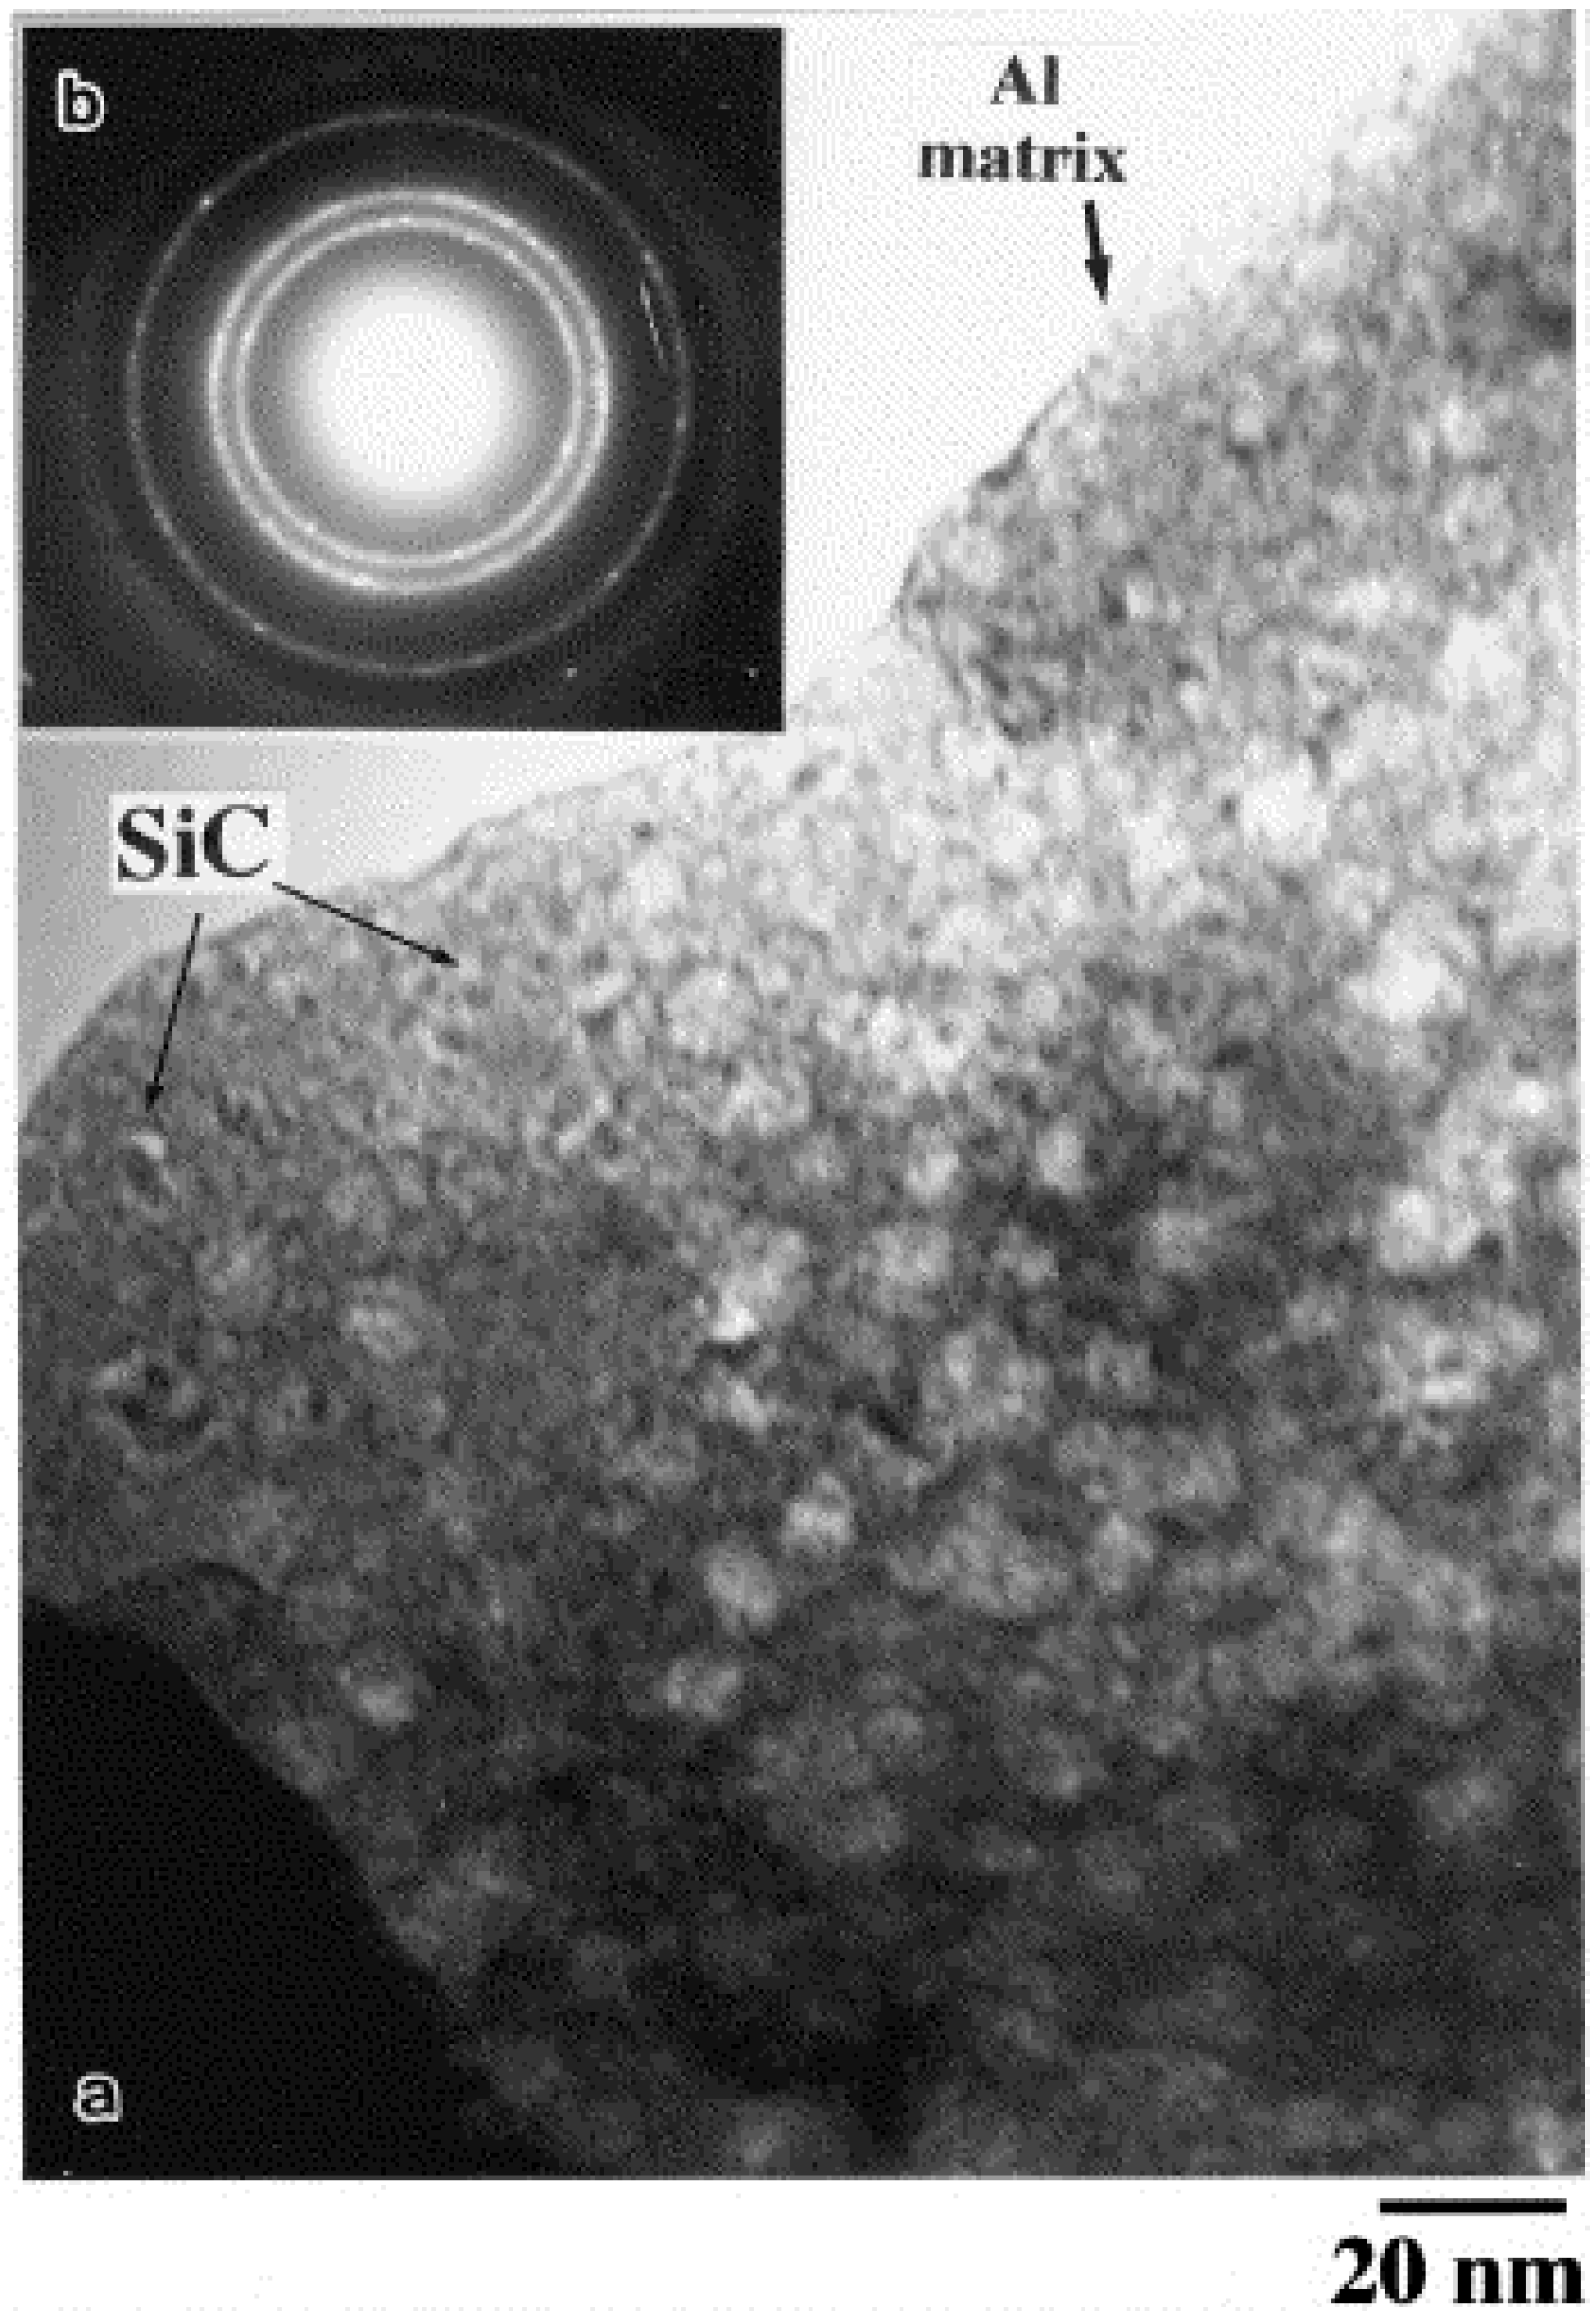
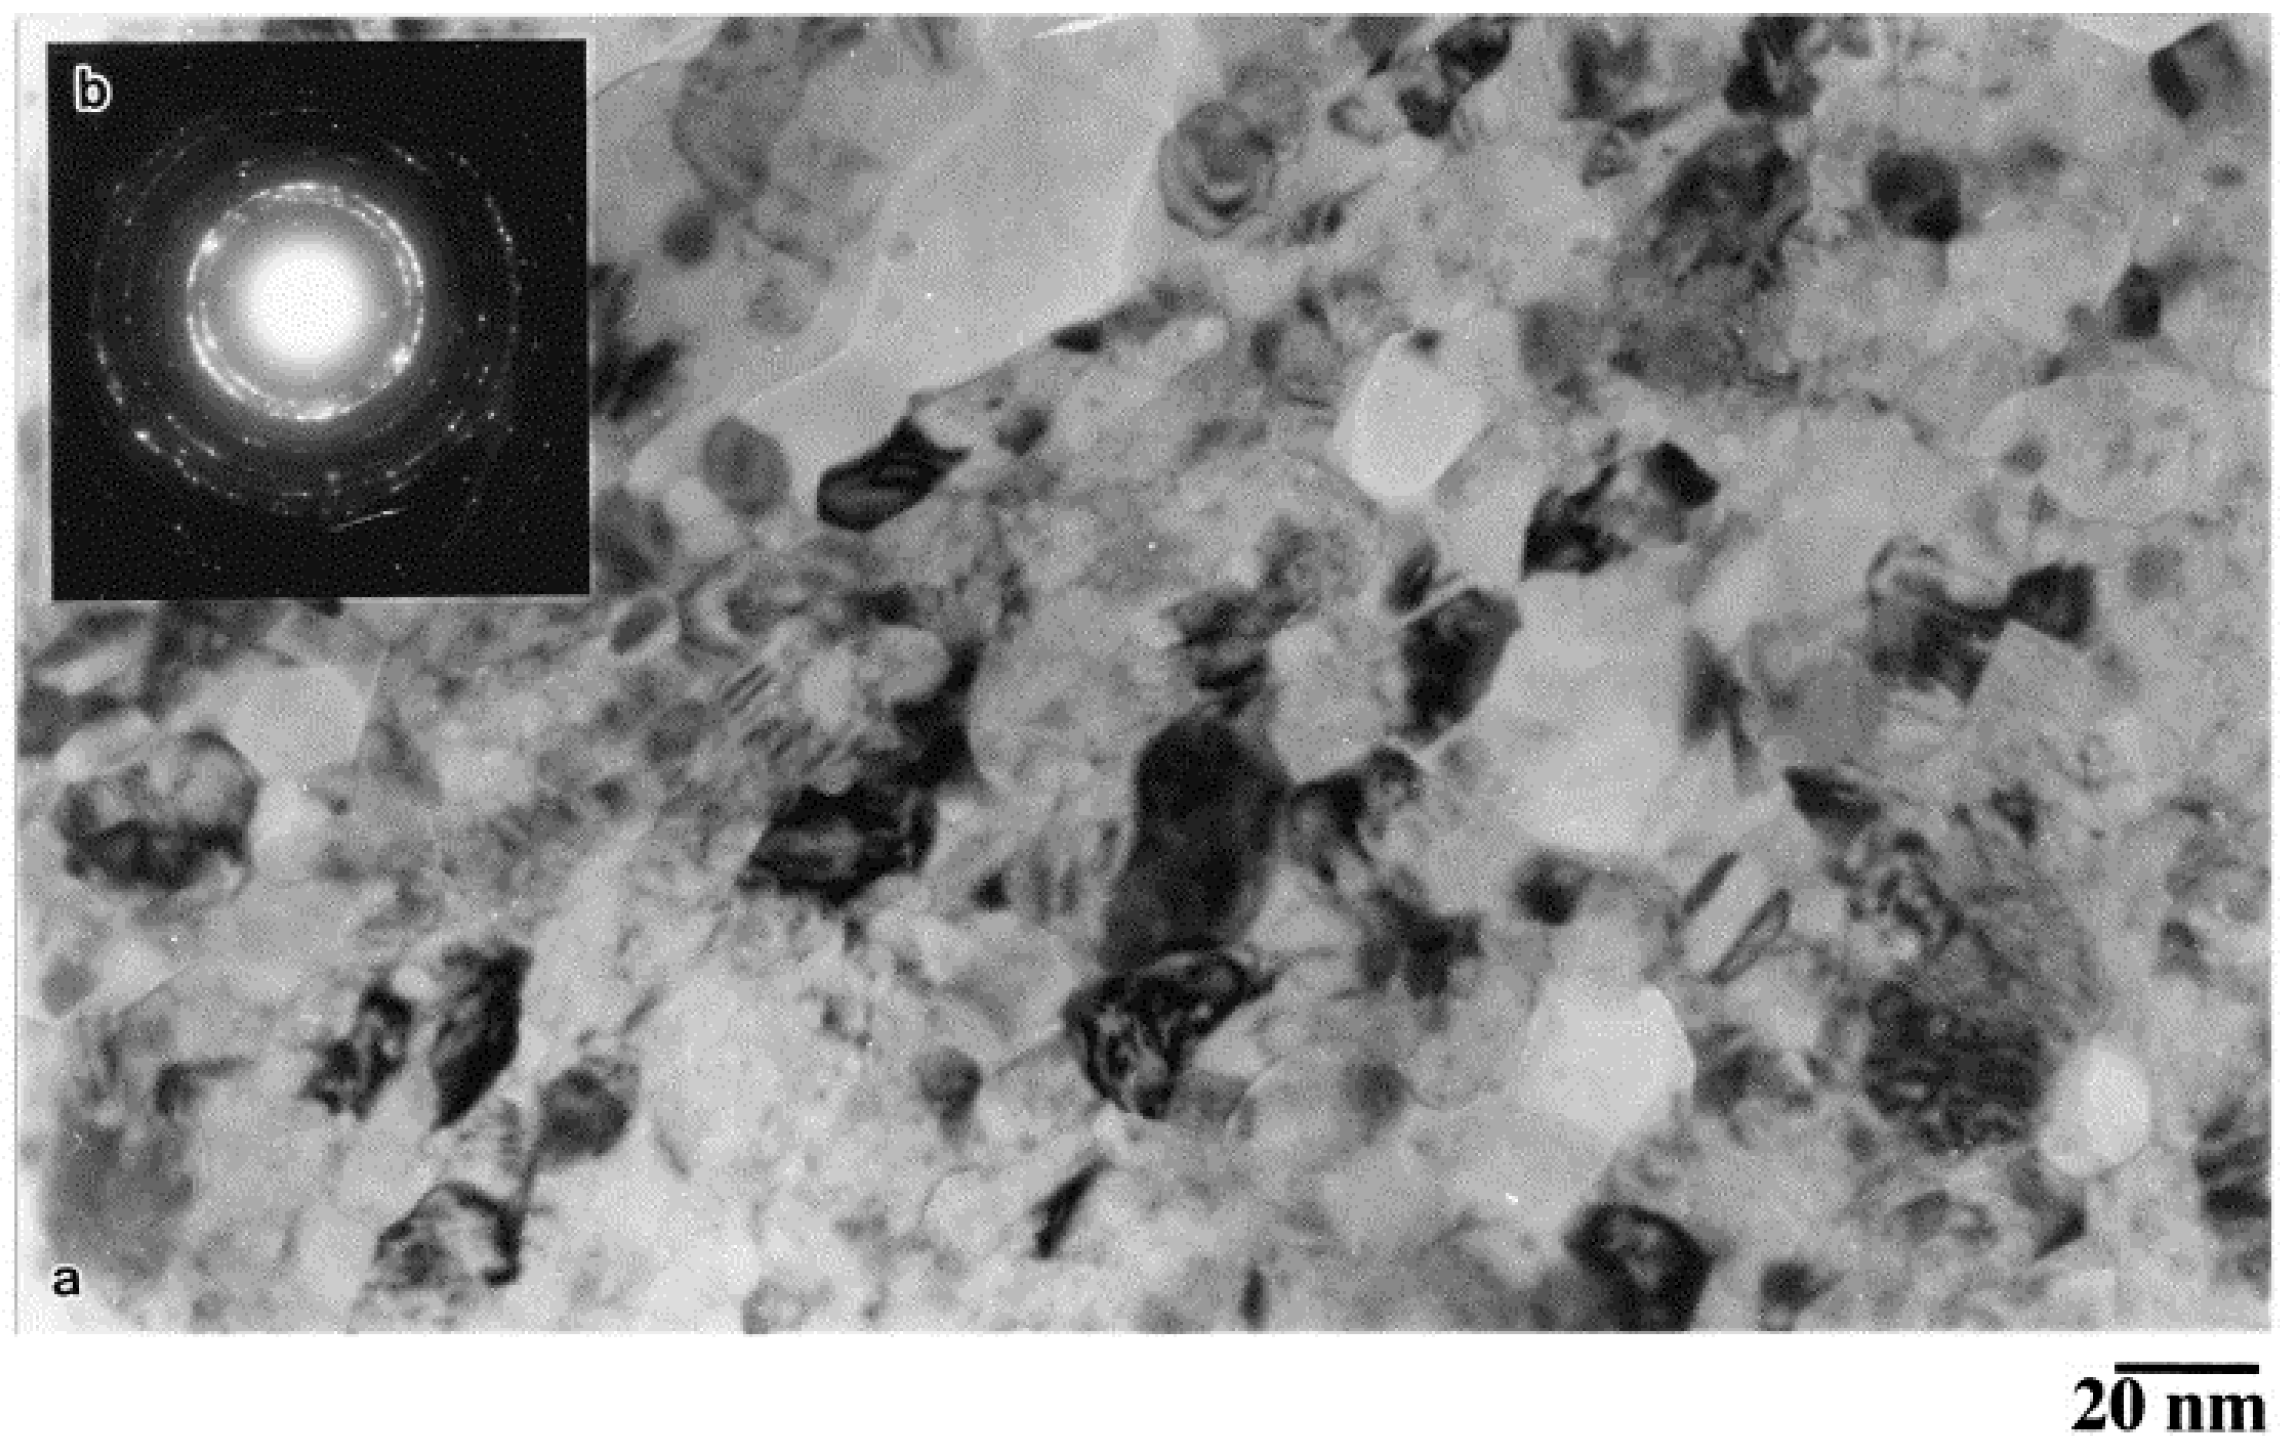
| SiC/Al | high energy ball milling; plasma activated sintering | SEM and TEM | bulk | well-dispersed | [35 ] |
| CNT/Cu | molecular level mixing and vacuum sintering | TEM | bulk | well-dispersed | [34 ] |
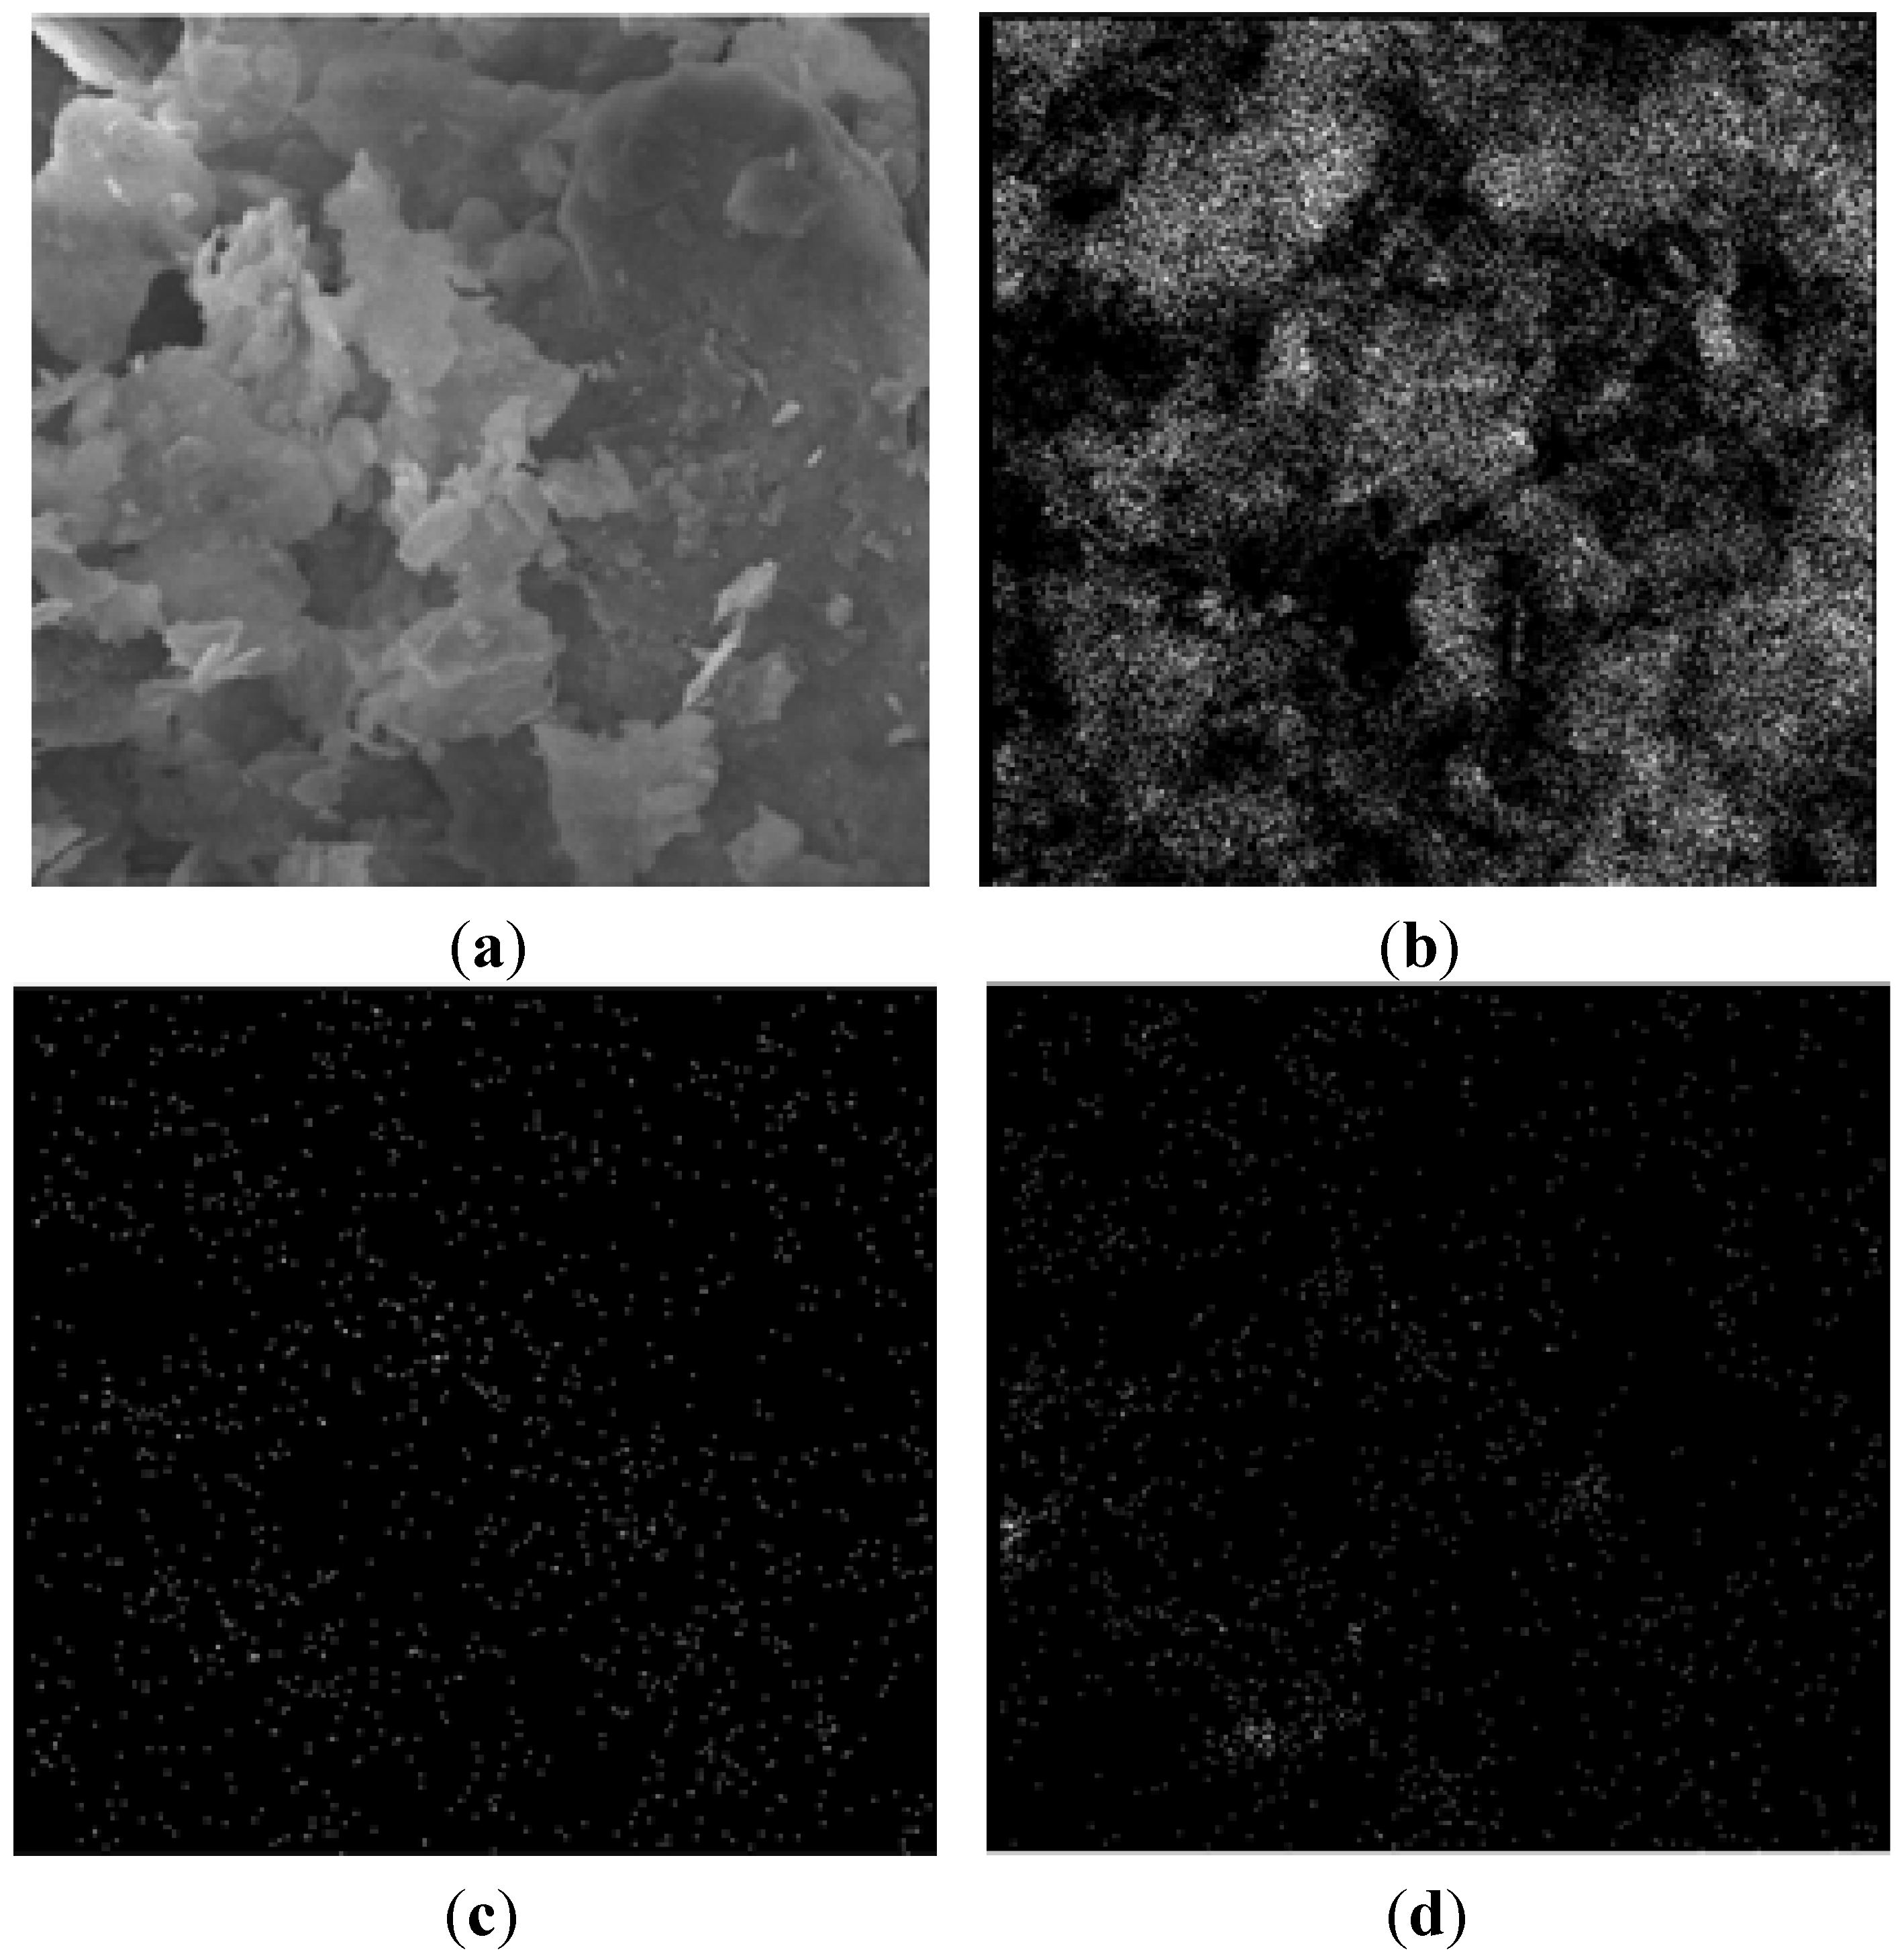
| Al2O3/Fe | high frequency induction heated sintering | SEM and X-ray mapping | bulk | well-dispersed | [70 ] |
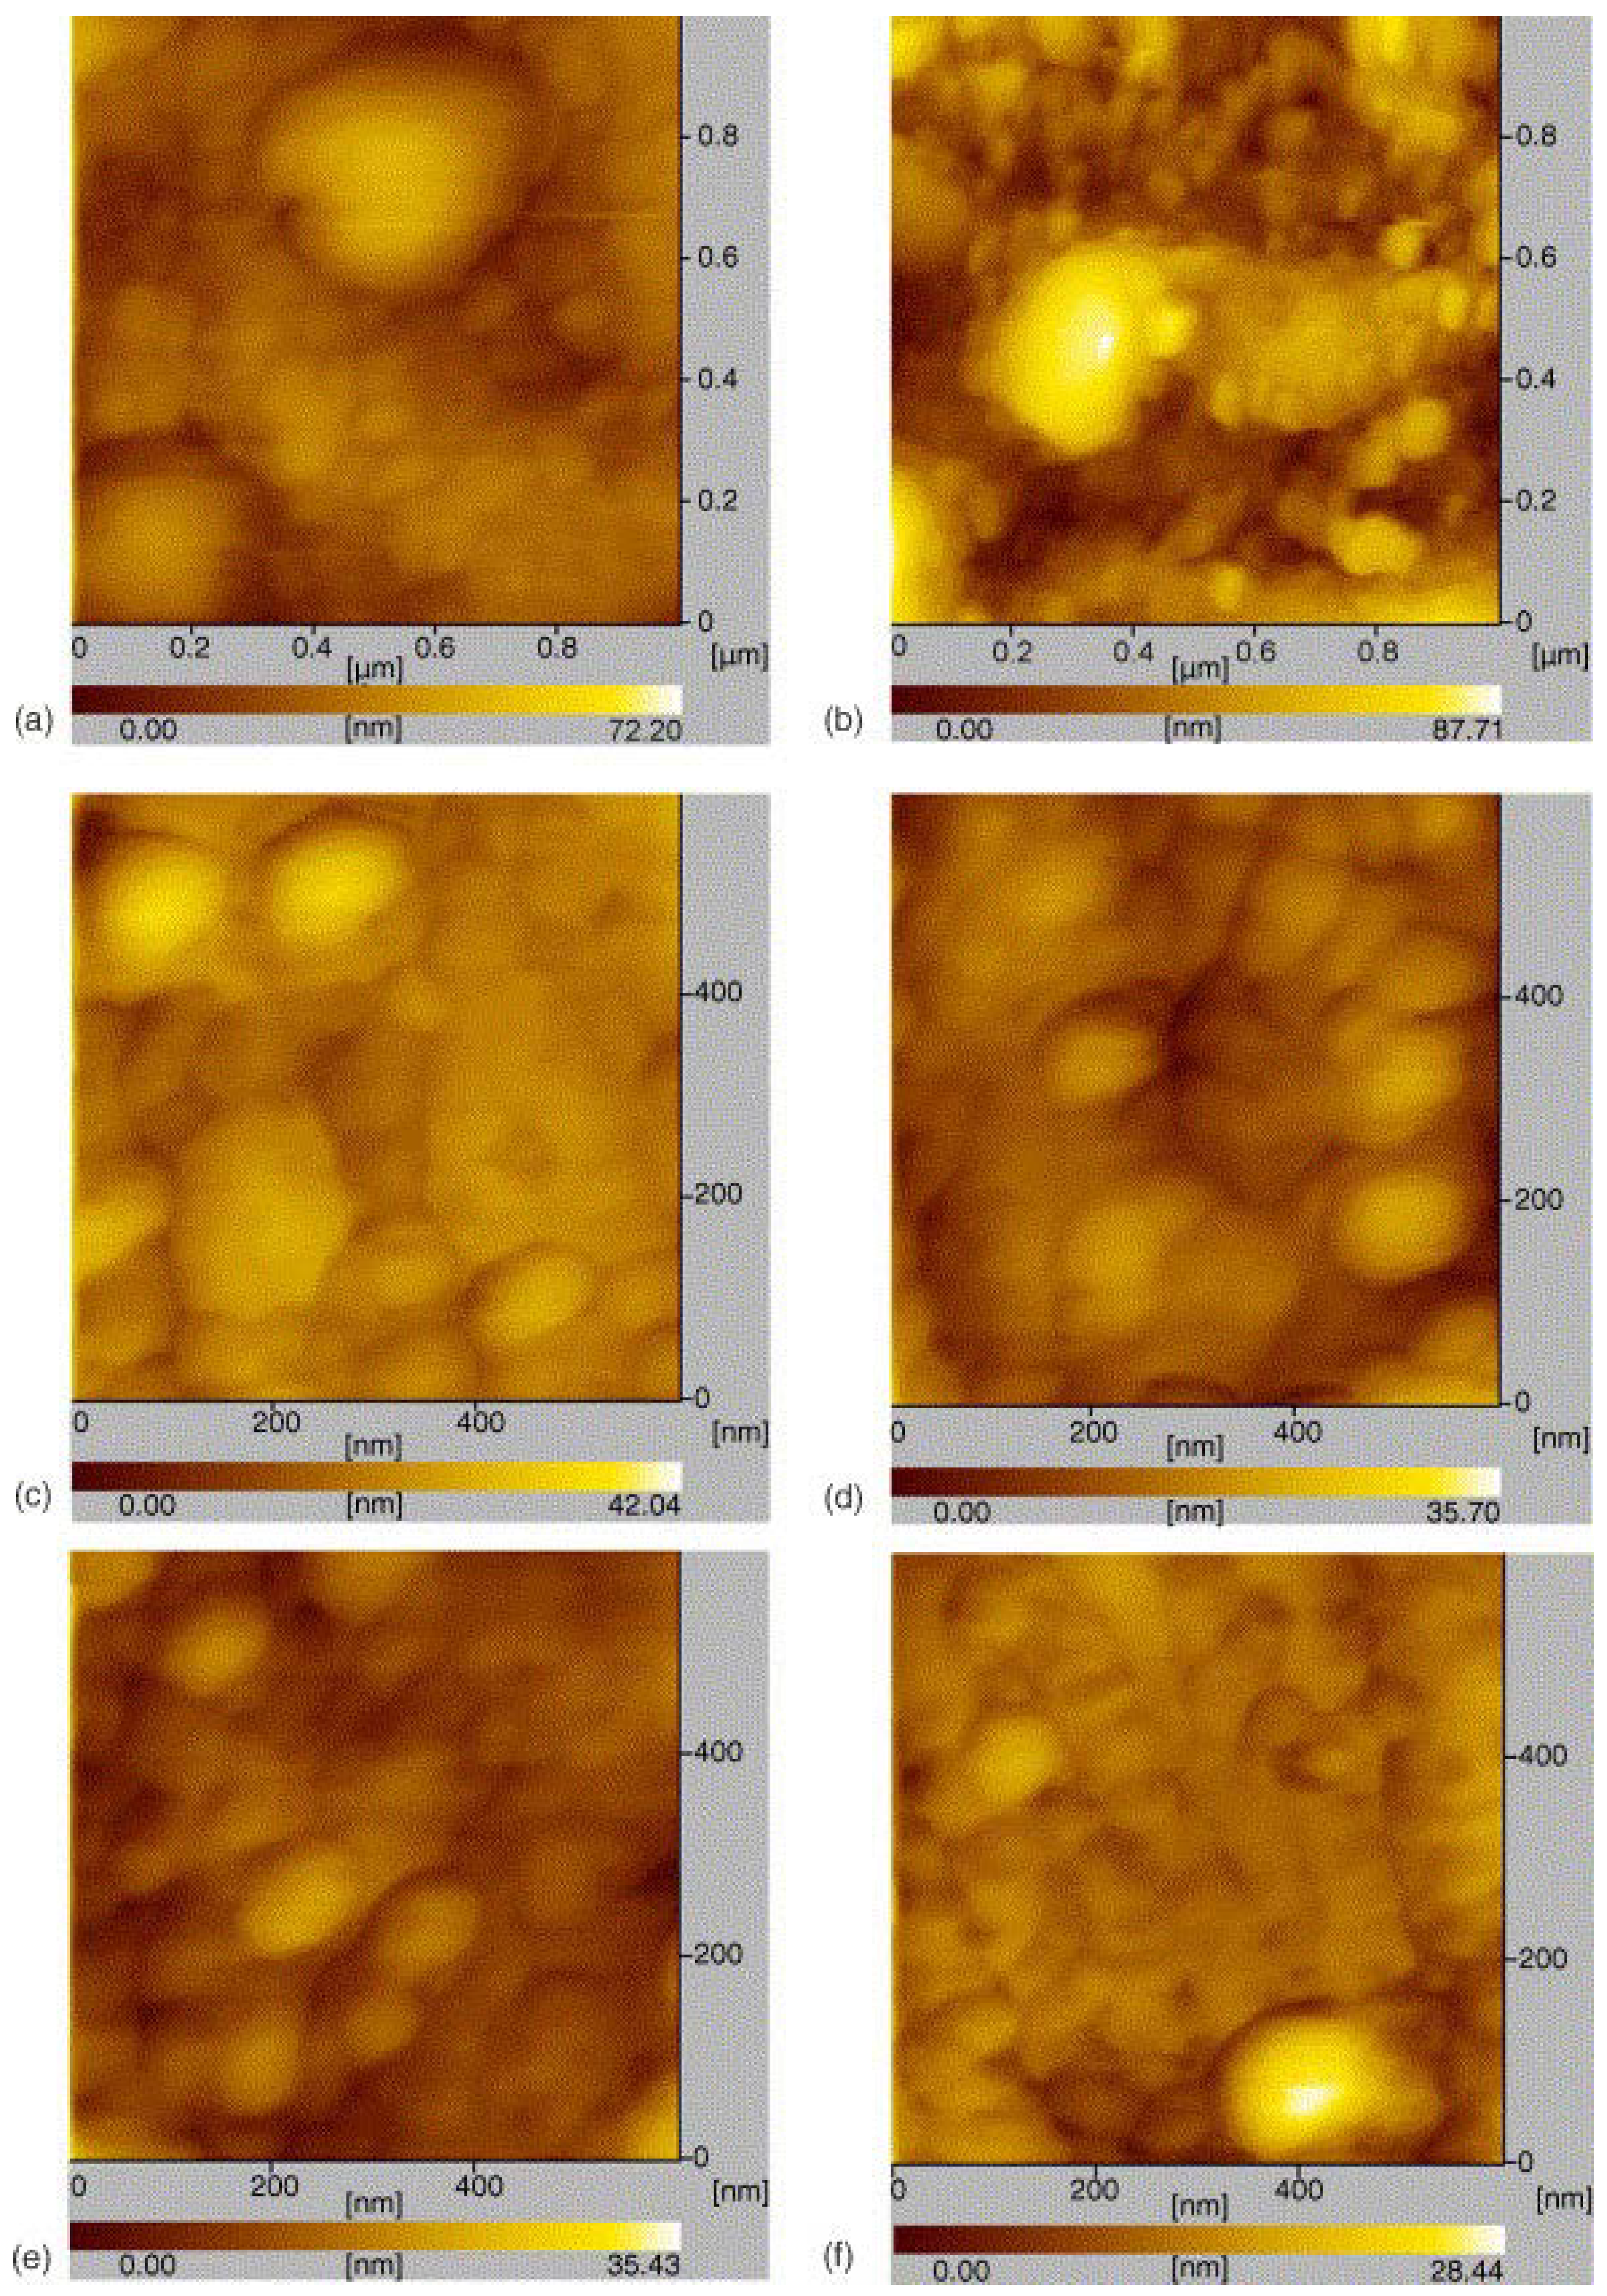
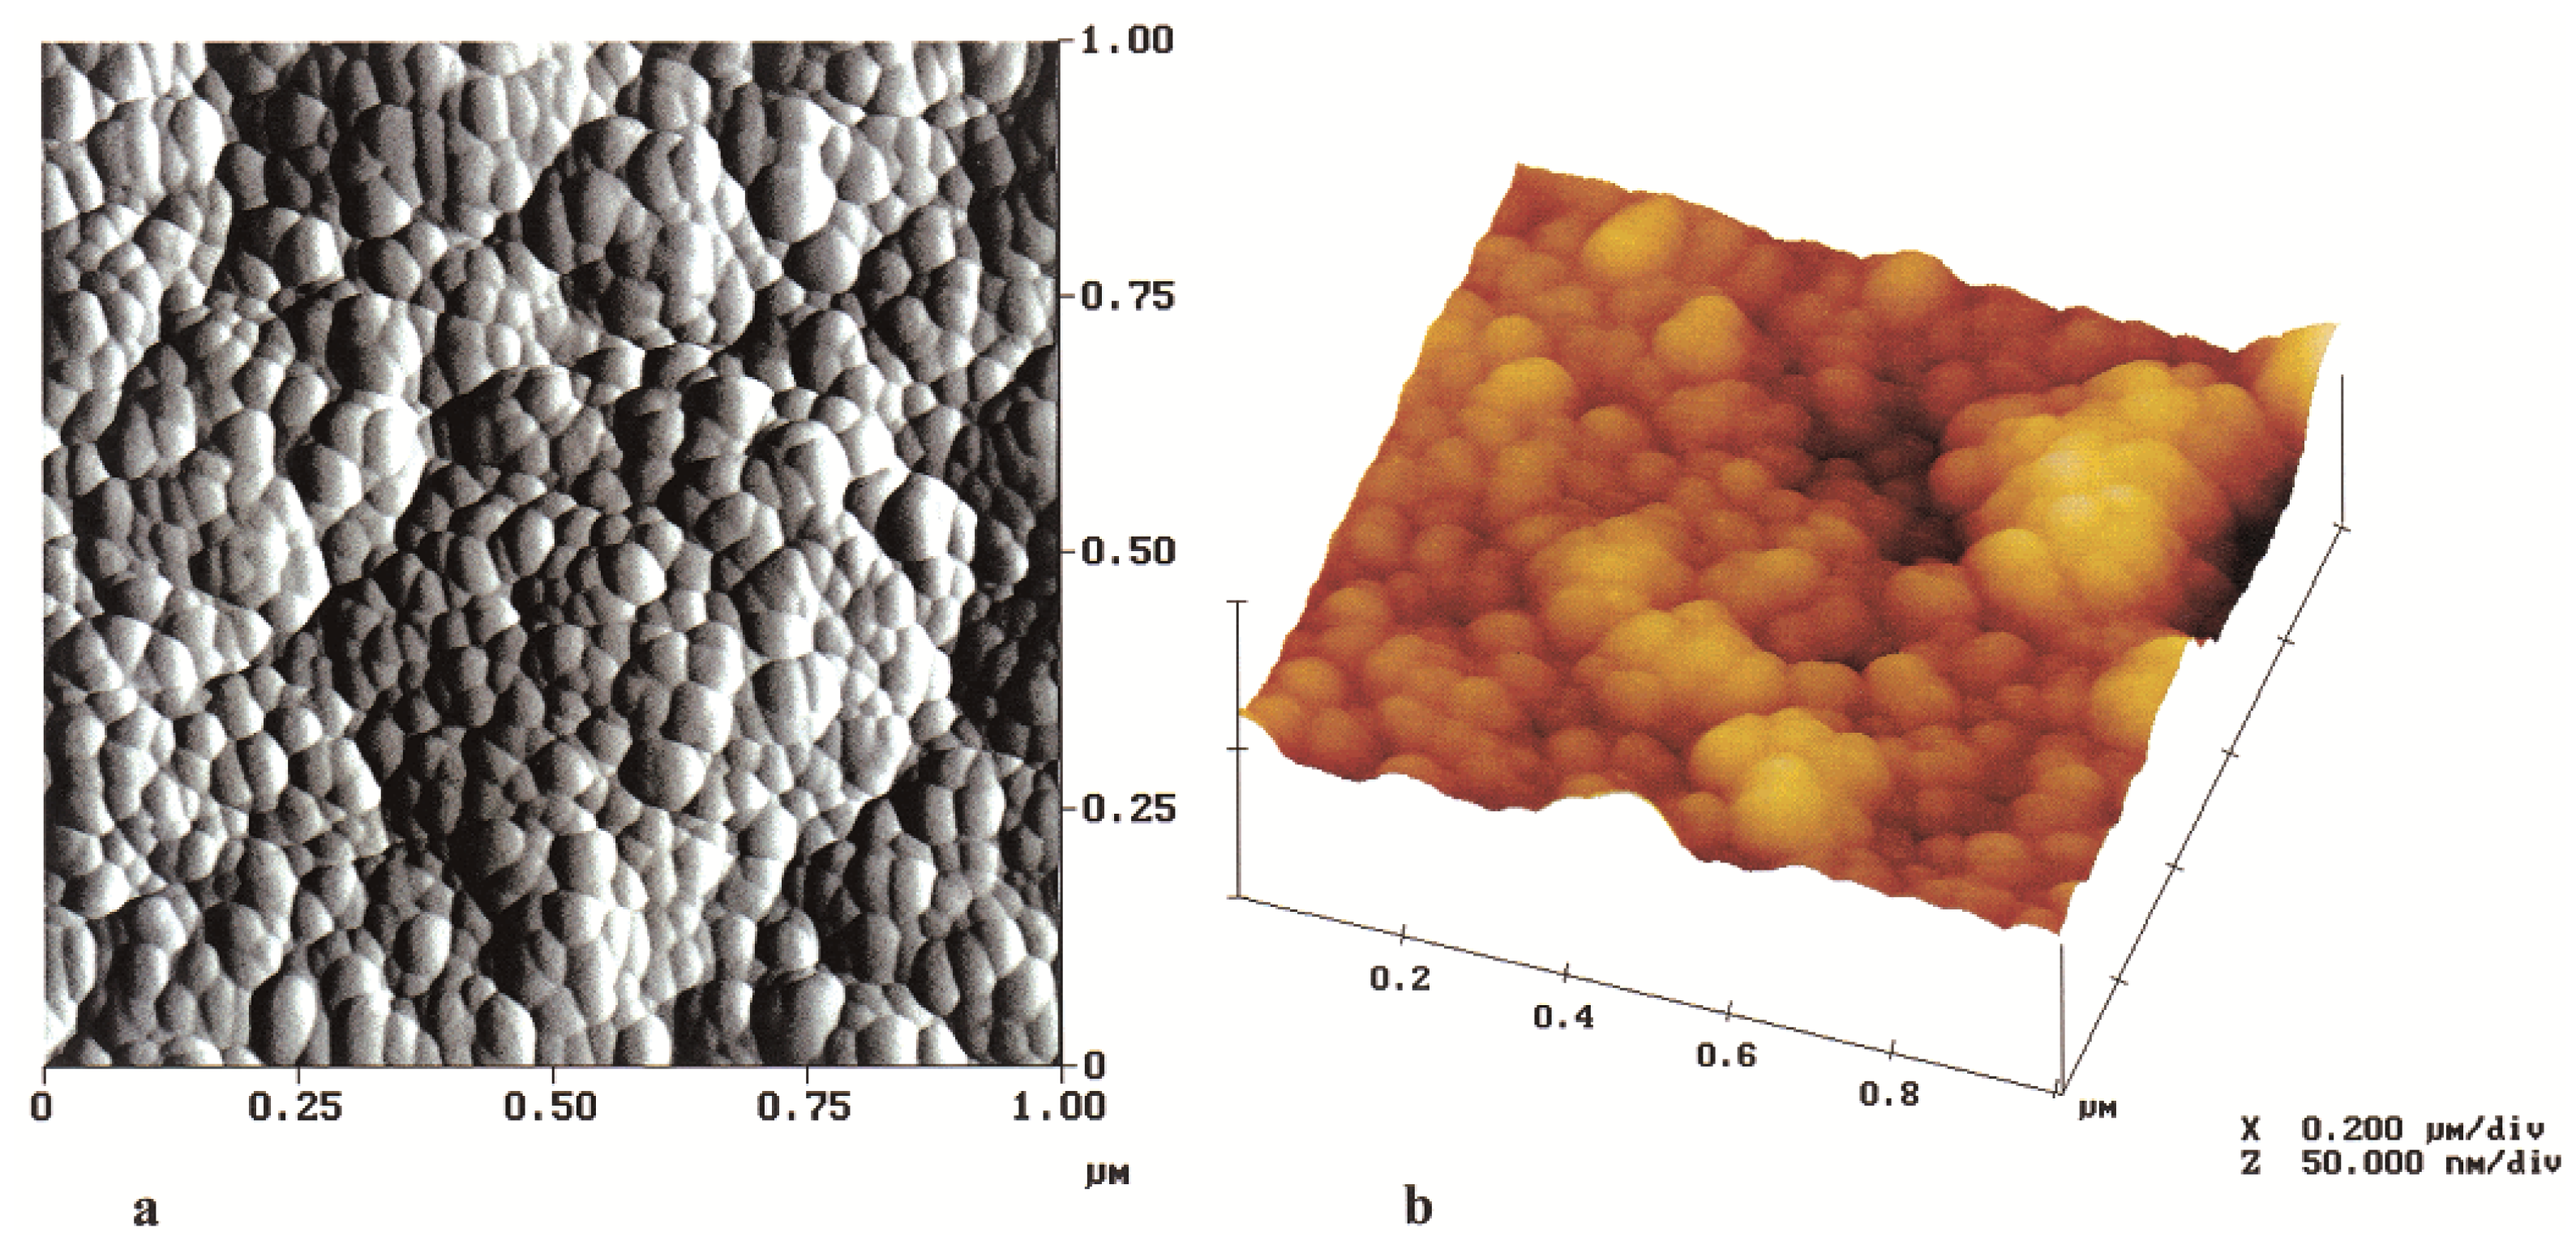
| WC-10% Co/Cu | direct metal laser sintering | AFM | bulk | aggregated for 40 wt%; well-dispersed for 30 wt% | [5 ] |
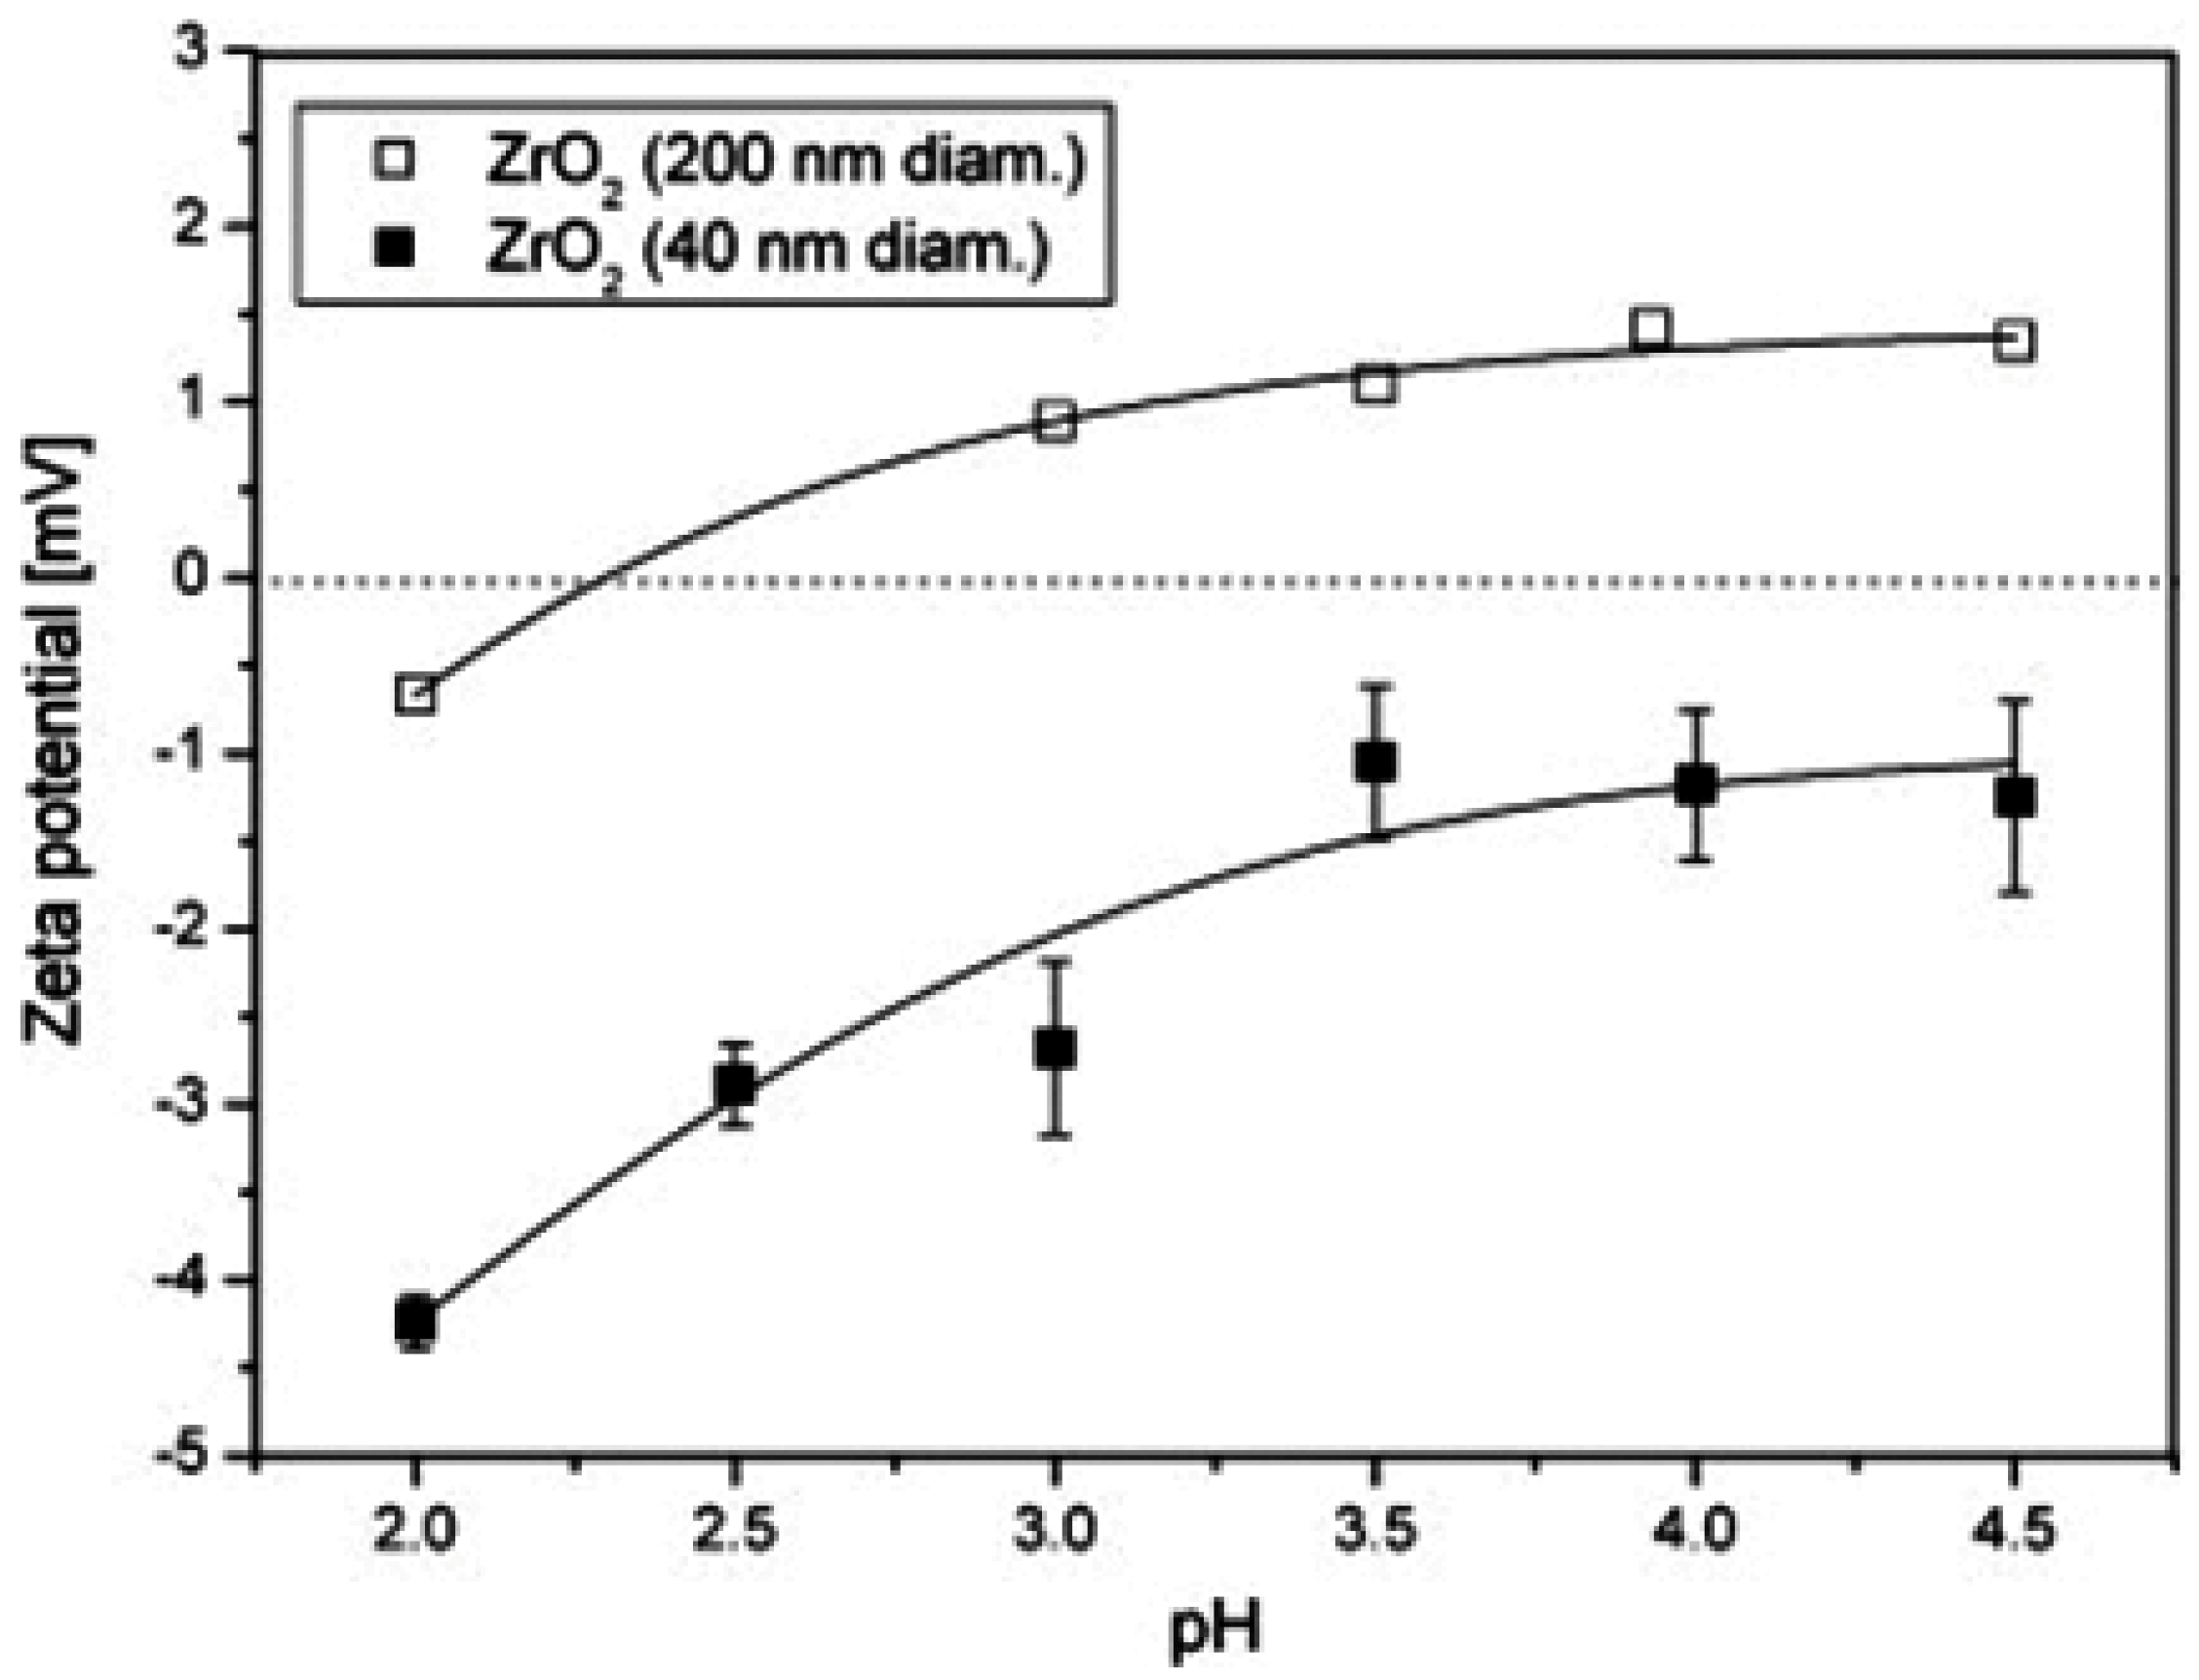
| ZrO2/Ni | electrochemical plating process | zeta potential measurements | powder | well-dispersed for pH value = 2; aggregated for pH value = 3.5 | [6 ] |
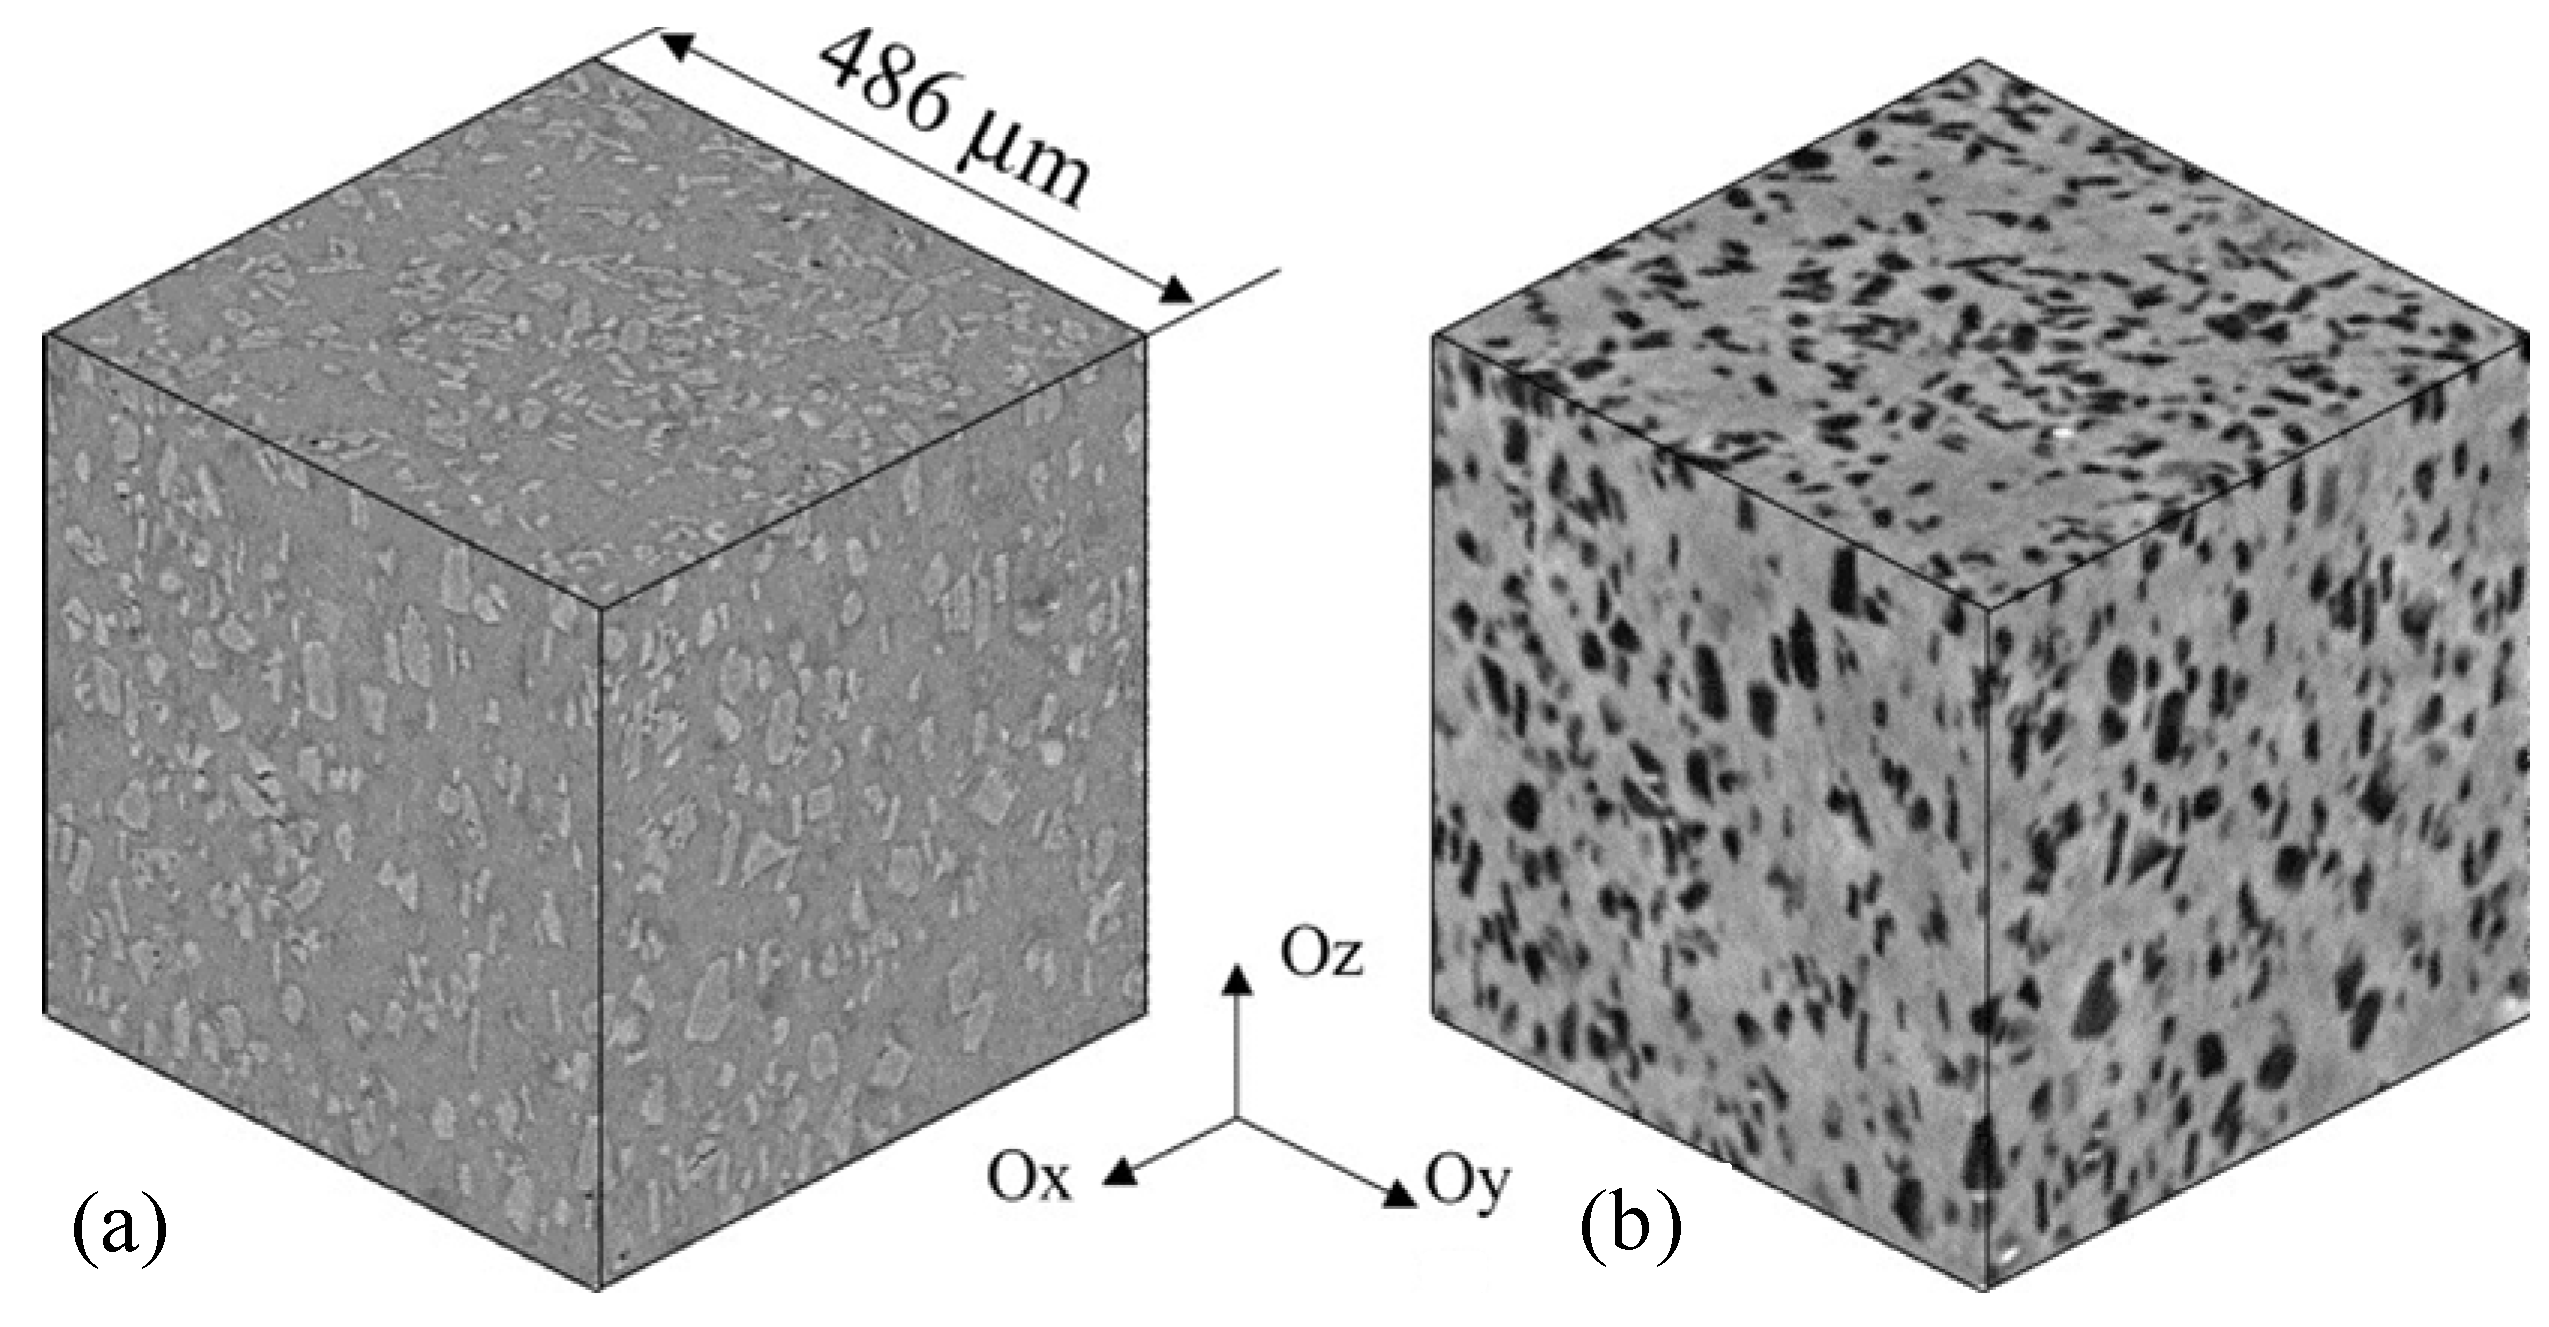
| Al2O3/Al | stir casting | Holotomography and phase contrast tomography | bulk | well-dispersed | [66 ] |
| Fly ash/Al | wet blending, cold compaction and sintering | SEM and AFM | bulk | well-dispersed | [75 ] |
| SiC/Al | pressure-die casting | AFM, SEM and X-ray mapping | bulk | not reported | [76 ] |
| Ni/Al alloy | blending, cold-pressing and extrusion | SEM and phase contrast tomography | bulk | particles oriented in the extrusion direction | [77] |
| Si-Zr/Al | blending, hot-pressing and extrusion | phase contrast tomography | bulk | homogeneous | [78] |
| SiC/Al alloy | rheocasting and extrusion | phase contrast tomography and SEM | bulk | well-dispersed | [79] |
| SiC/Al and Ta/Al | melt-stirring | SEM and X-ray mapping | bulk | well-dispersed | [80] |
| Al2O3/Al | high-energy ball milling | SEM and X-ray mapping | powder | well-dispersed | [13] |
| Al2O3/Al alloy | squeeze casting | SEM and TEM | bulk | well-dispersed and intentionally agglomerated | [81] |
| Al2O3/Fe-Cr | high-energy ball milling and pulsed current activated sintering | SEM and X-ray mapping | bulk | well-dispersed | [82] |
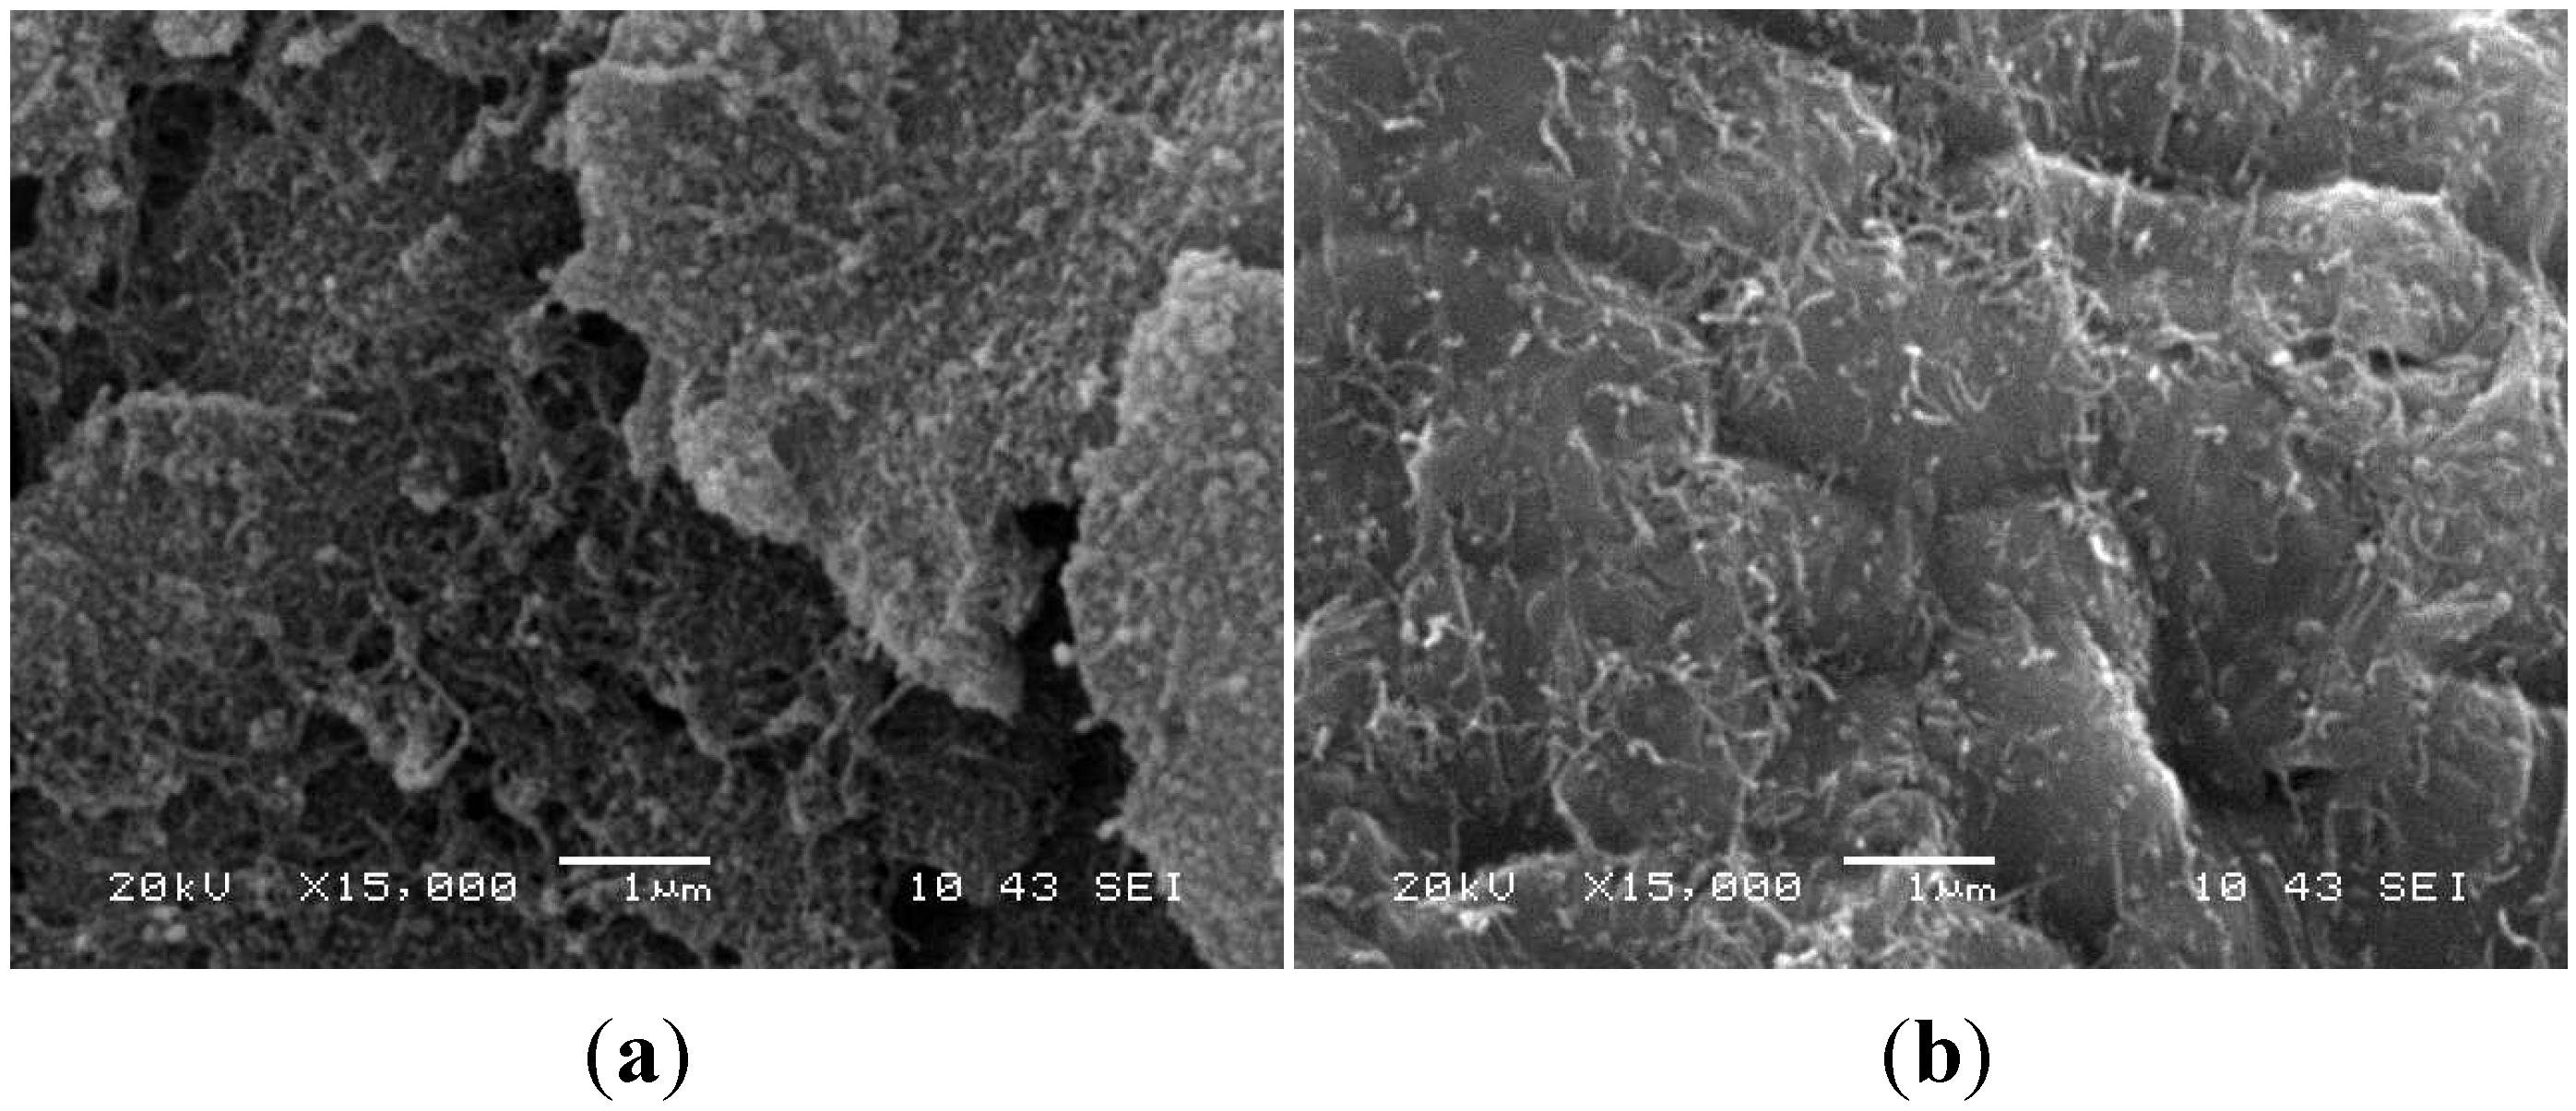
| CNT/Cu | molecular level mixing and spark plasma sintering | SEM and TEM | bulk | well-dispersed | [83] |
| Cu-Ni | reduction of mixed metal oxides | SEM | powder | mix of agglomerates and dispersed particles | [12] |
| CNT/W-Cu | wet ball-milling and hot-pressing | SEM | bulk | well-dispersed | [84] |
| W/Cu | wet ball-milling of oxide powder and reduction | SEM and TEM | powder | well-dispersed | [85] |
| AlN/Al alloy | cryomilling and hot-pressing | TEM | bulk | well-dispersed | [86] |
| Al2O3/Cu | wet chemical processing, cold pressing, and pressureless sintering | TEM, STEM, X-ray mapping | bulk | well-dispersed | [14] |
| CNT/Al | ultrasonication, wet ball-milling, cold compaction and sintering | SEM, TEM and X-ray mapping | bulk | well-dispersed | [87] |
2.3. Ceramic Matrix Nanocomposites


| Nanocomposite | Fabrication process | Characterization technique | Composite form | Dispersion quality | Reference |
|---|---|---|---|---|---|
| SiO/Graphene | In situ chemical synthesis | SEM; TEM | bulk | uniform | [91] |
| MWCNT/Al2O3 | SPS | TEM; zeta potential | bulk | uniform | [9] |
| Si3N4/Graphene | SPS | SEM | bulk | uniform | [92] |
| CNT/YSZ | In situ growth of CNTs on zirconia SPS | FESEM; TEM | bulk | uniform | [89] |
| Si-C-N/MWCNT | ball milling pyrolysis | SEM; confocal raman mapping | bulk | uniform for 10% CNTs not uniform for 5% CNTs | [7] |
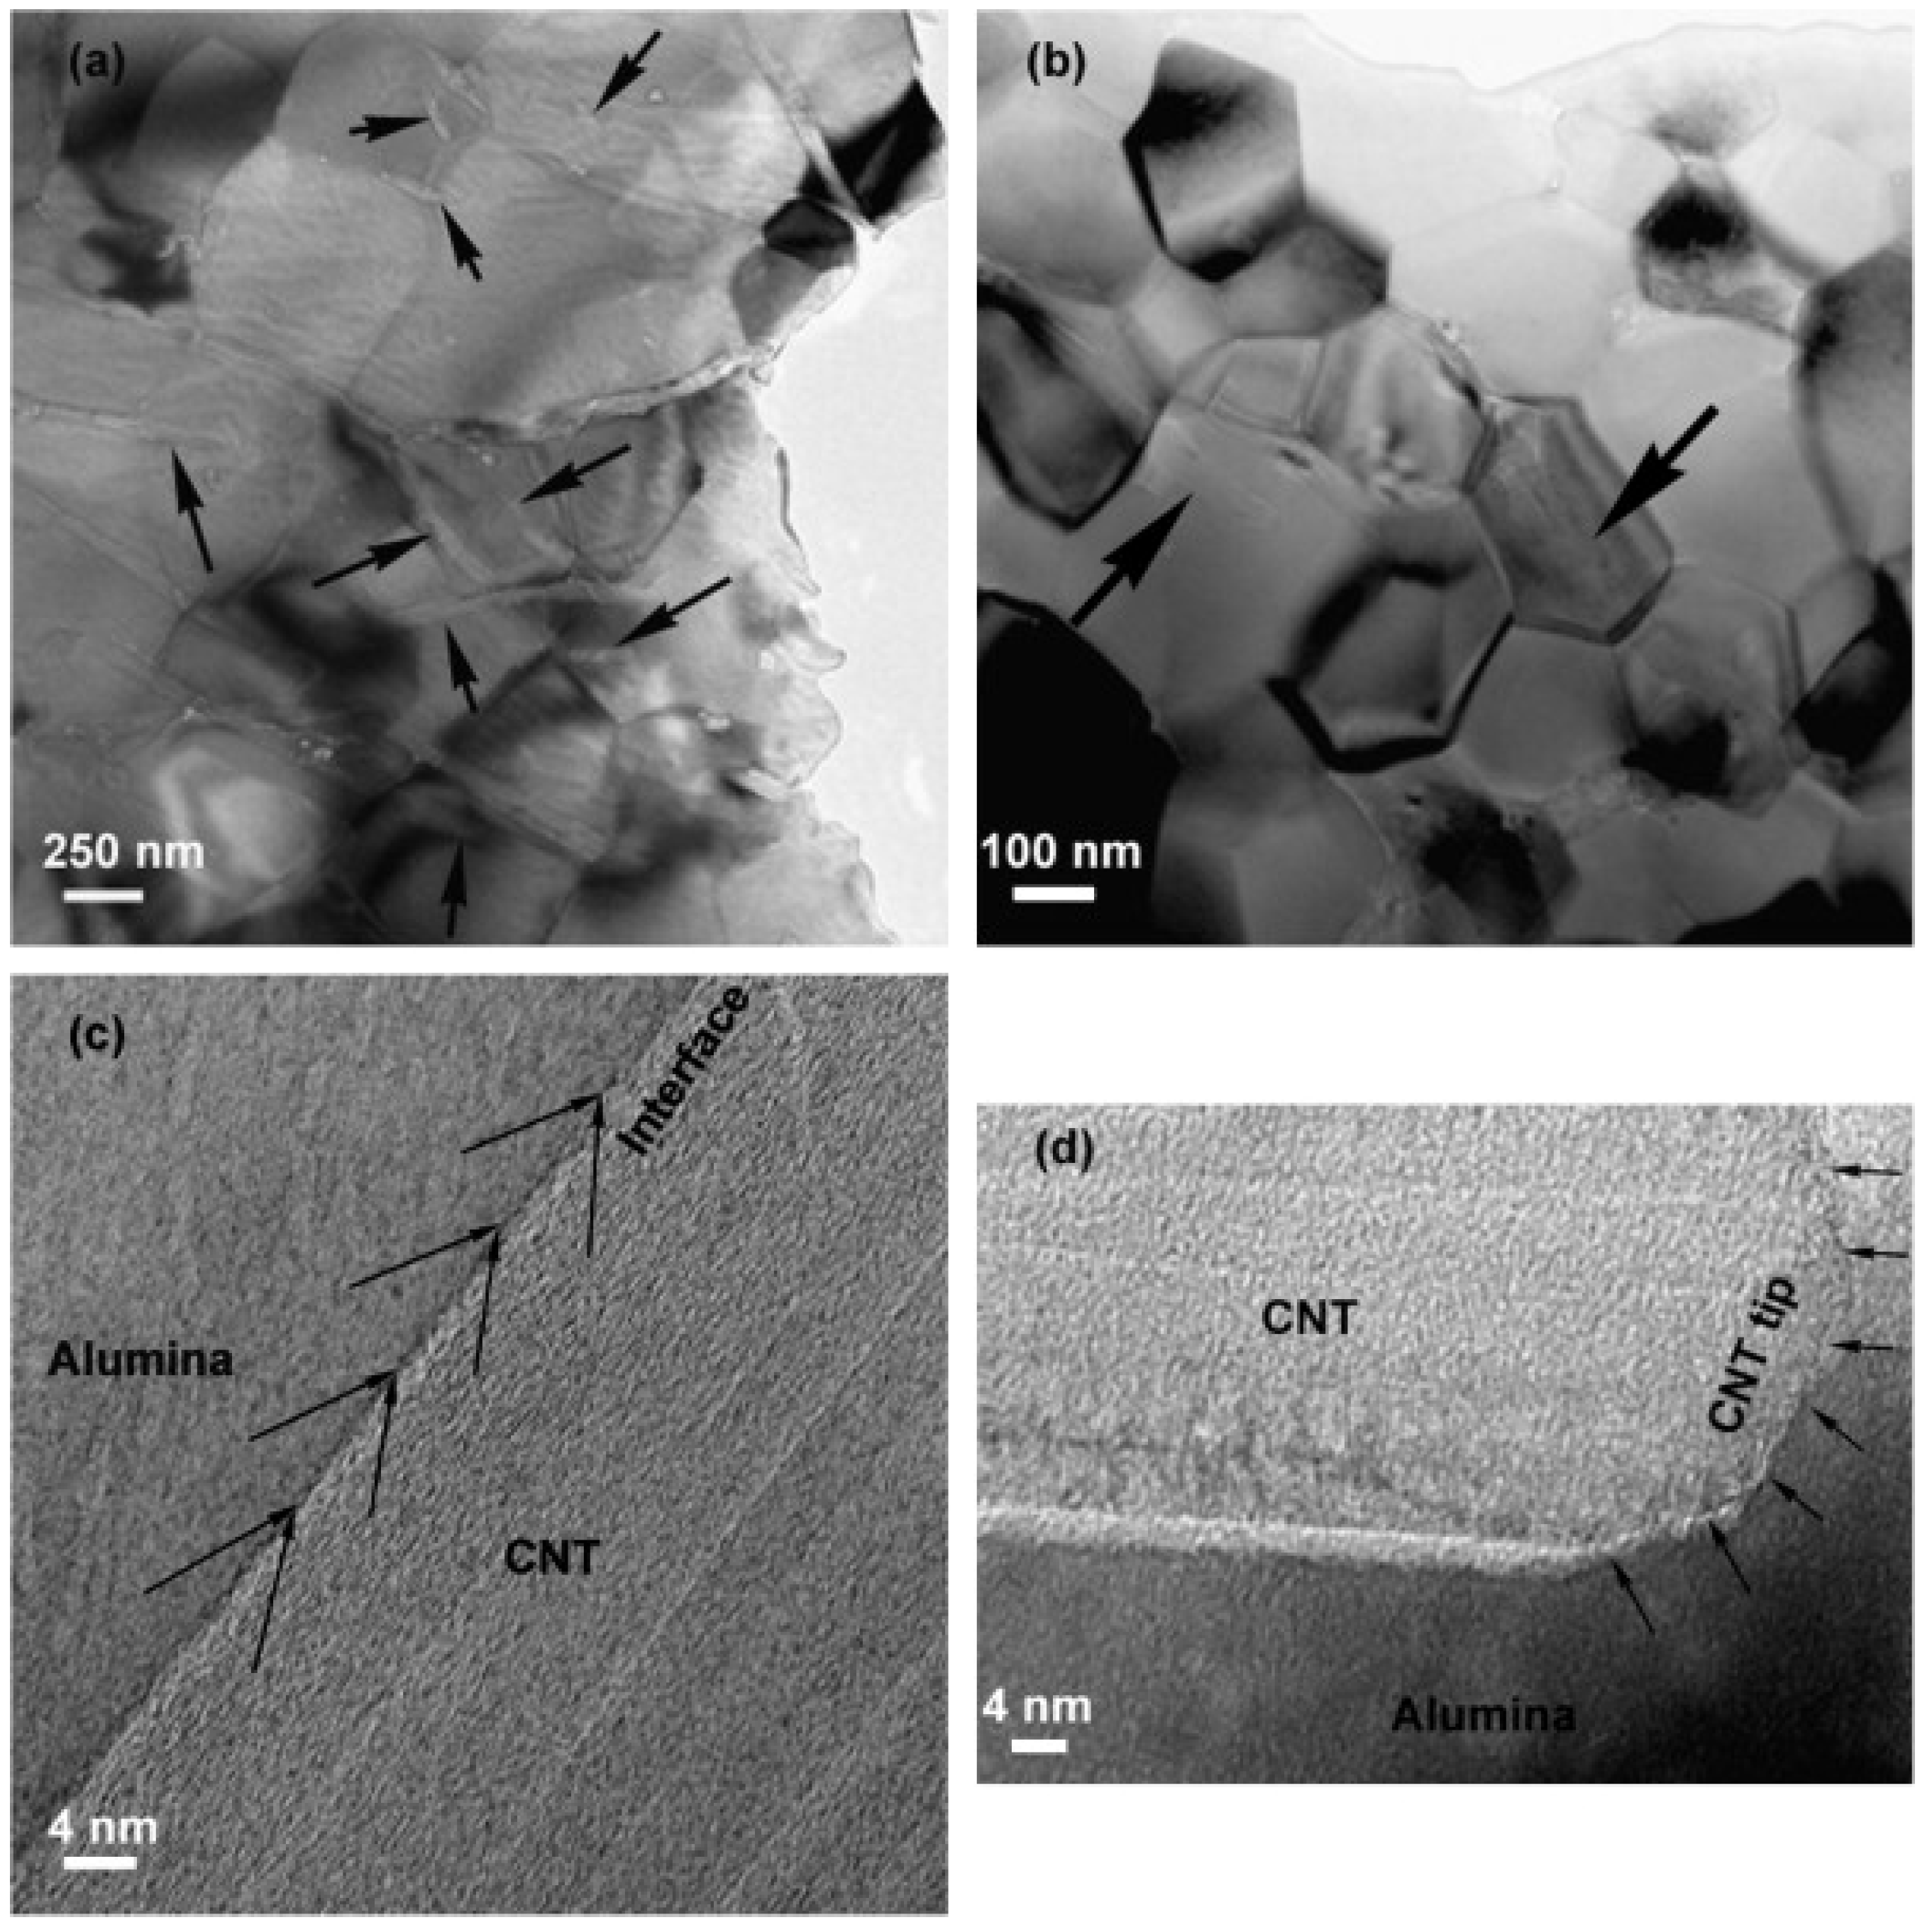
| CNT/Al2O3 | SPS of individually alumina decorated CNTs | SEM; TEM; Zeta Potential | bulk | uniform for 2.6%–15% CNTs | [11,88] |
| CNT/Al2O3 | sol-gel process | SEM | bulk | uniform | [93] |
| Fe/MgO | spray pyrolysis | SEM | powder | uniform | [10] |
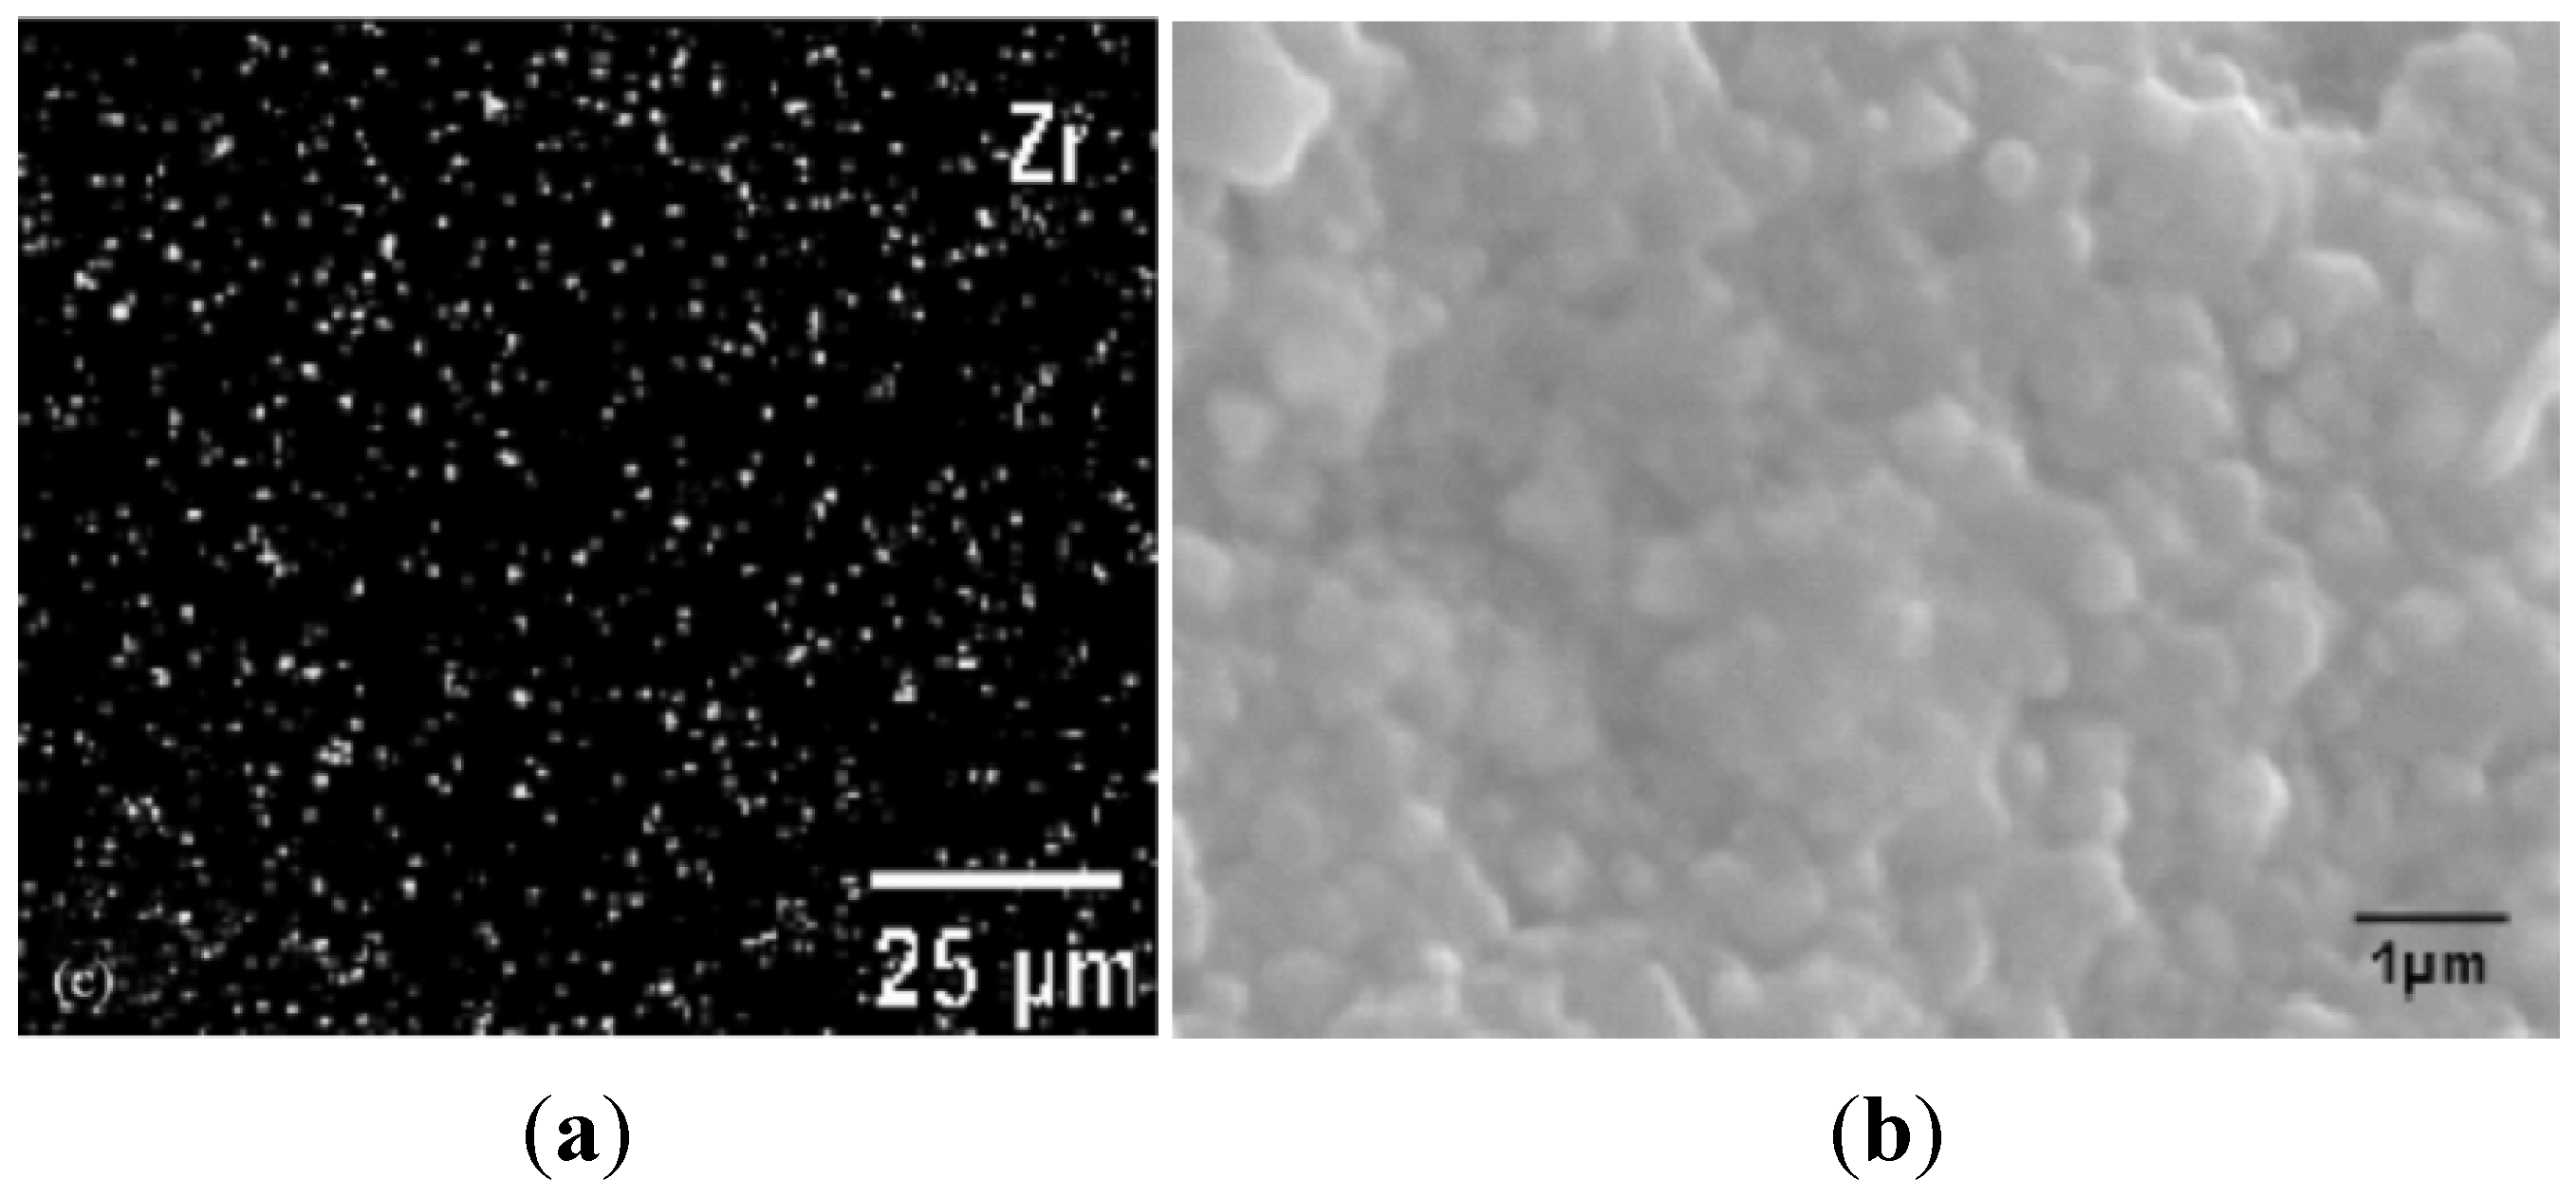
| ZrO2/WC | SPS | SEM; X-ray mapping | bulk | uniform | [39] |
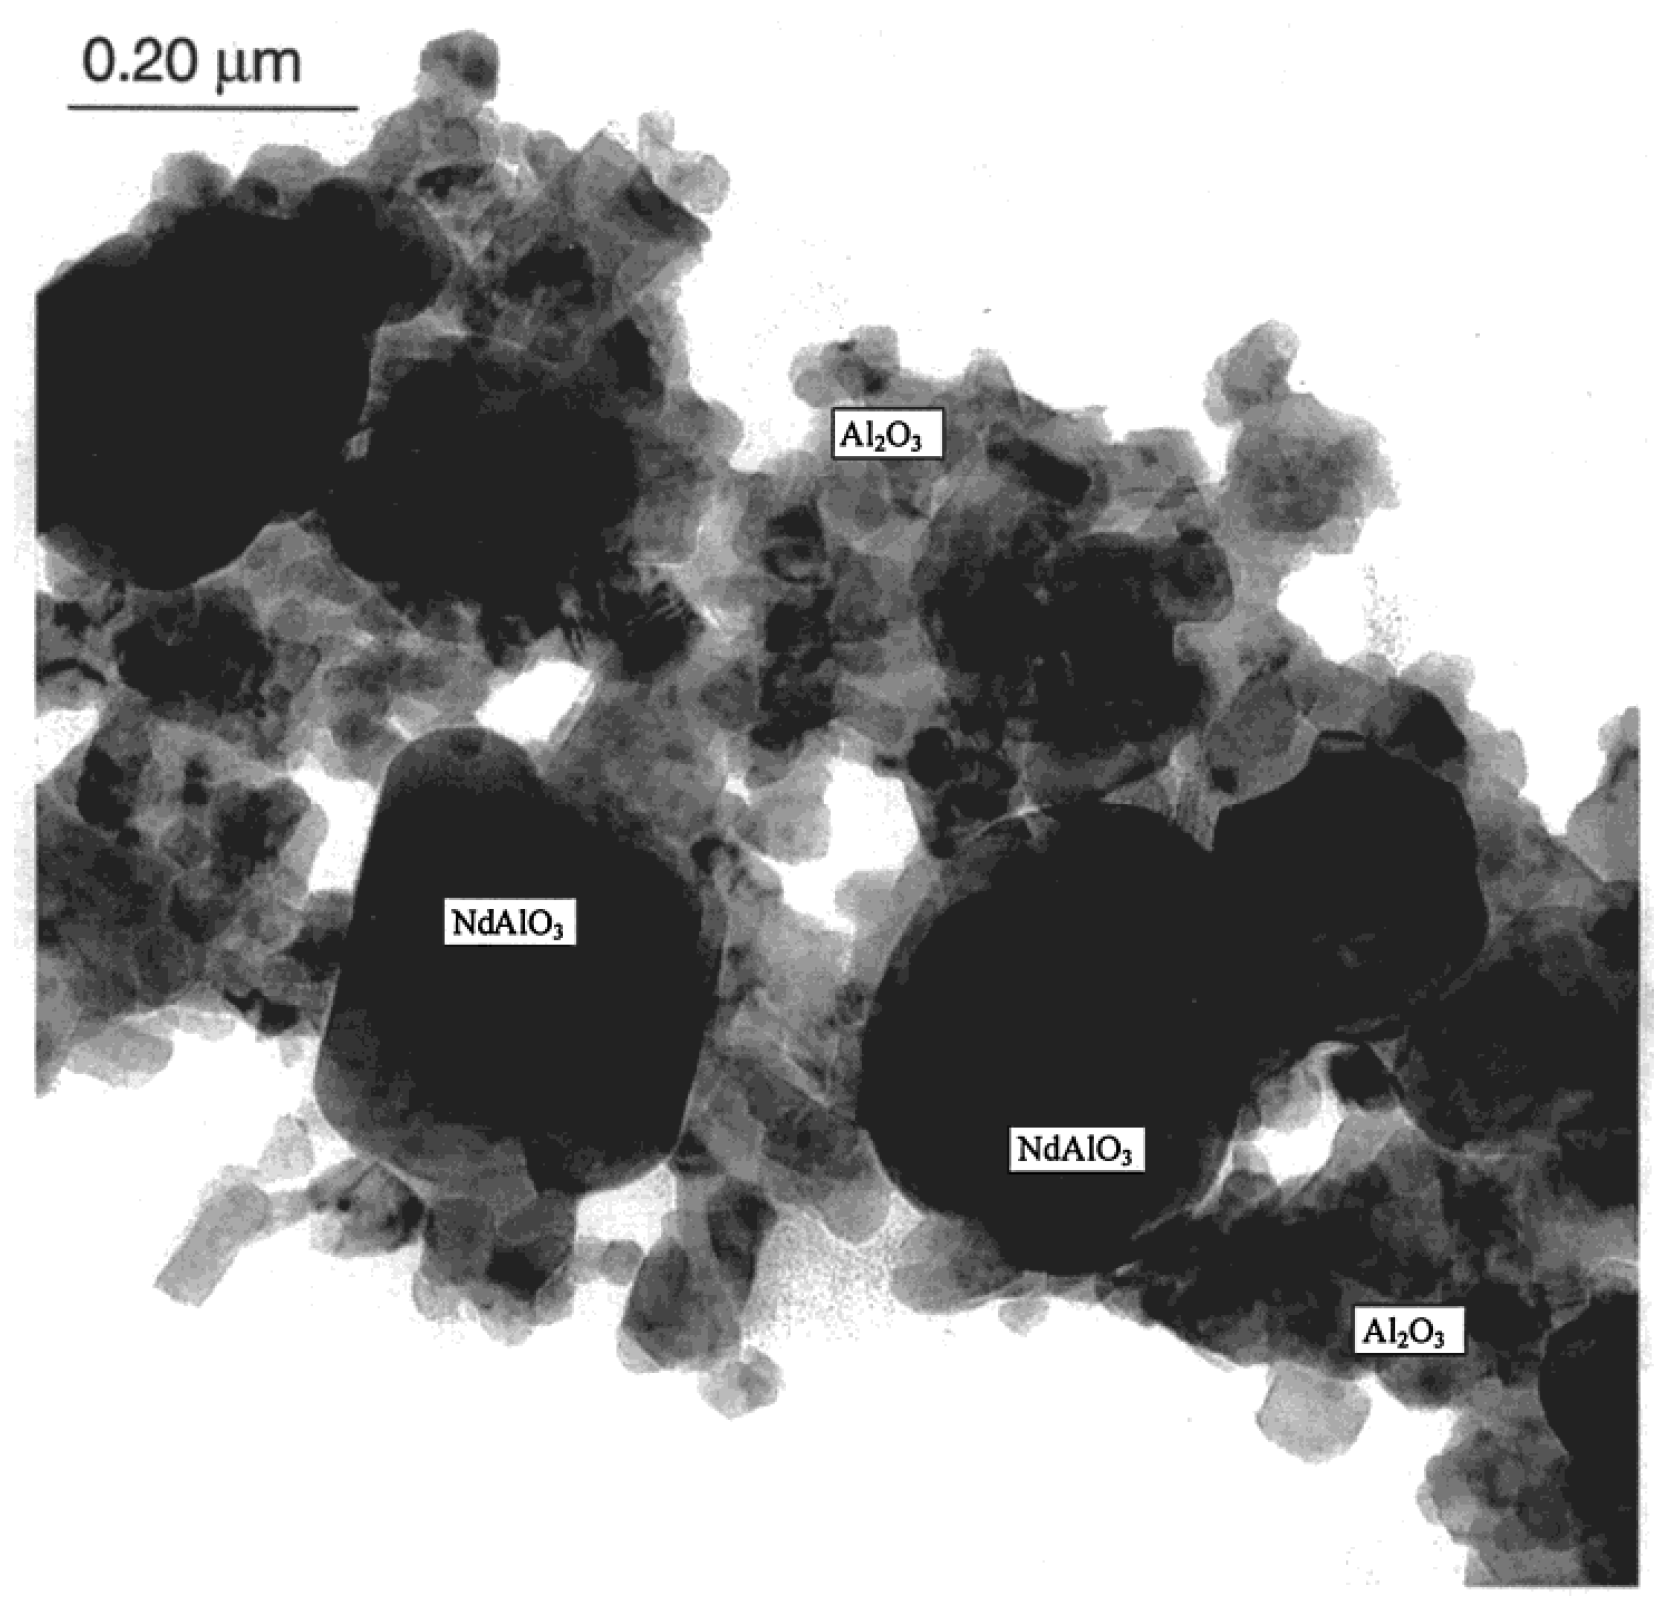
| NdAlO3/AL2O3 | CVD | AFM; TEM | bulk | uniform | [44] |
| Pt/Al2O3 | Co-sputtering | SAXS | thin film | uniform | [90] |
3. Quantitative Analysis
3.1. Local Area Fraction Method

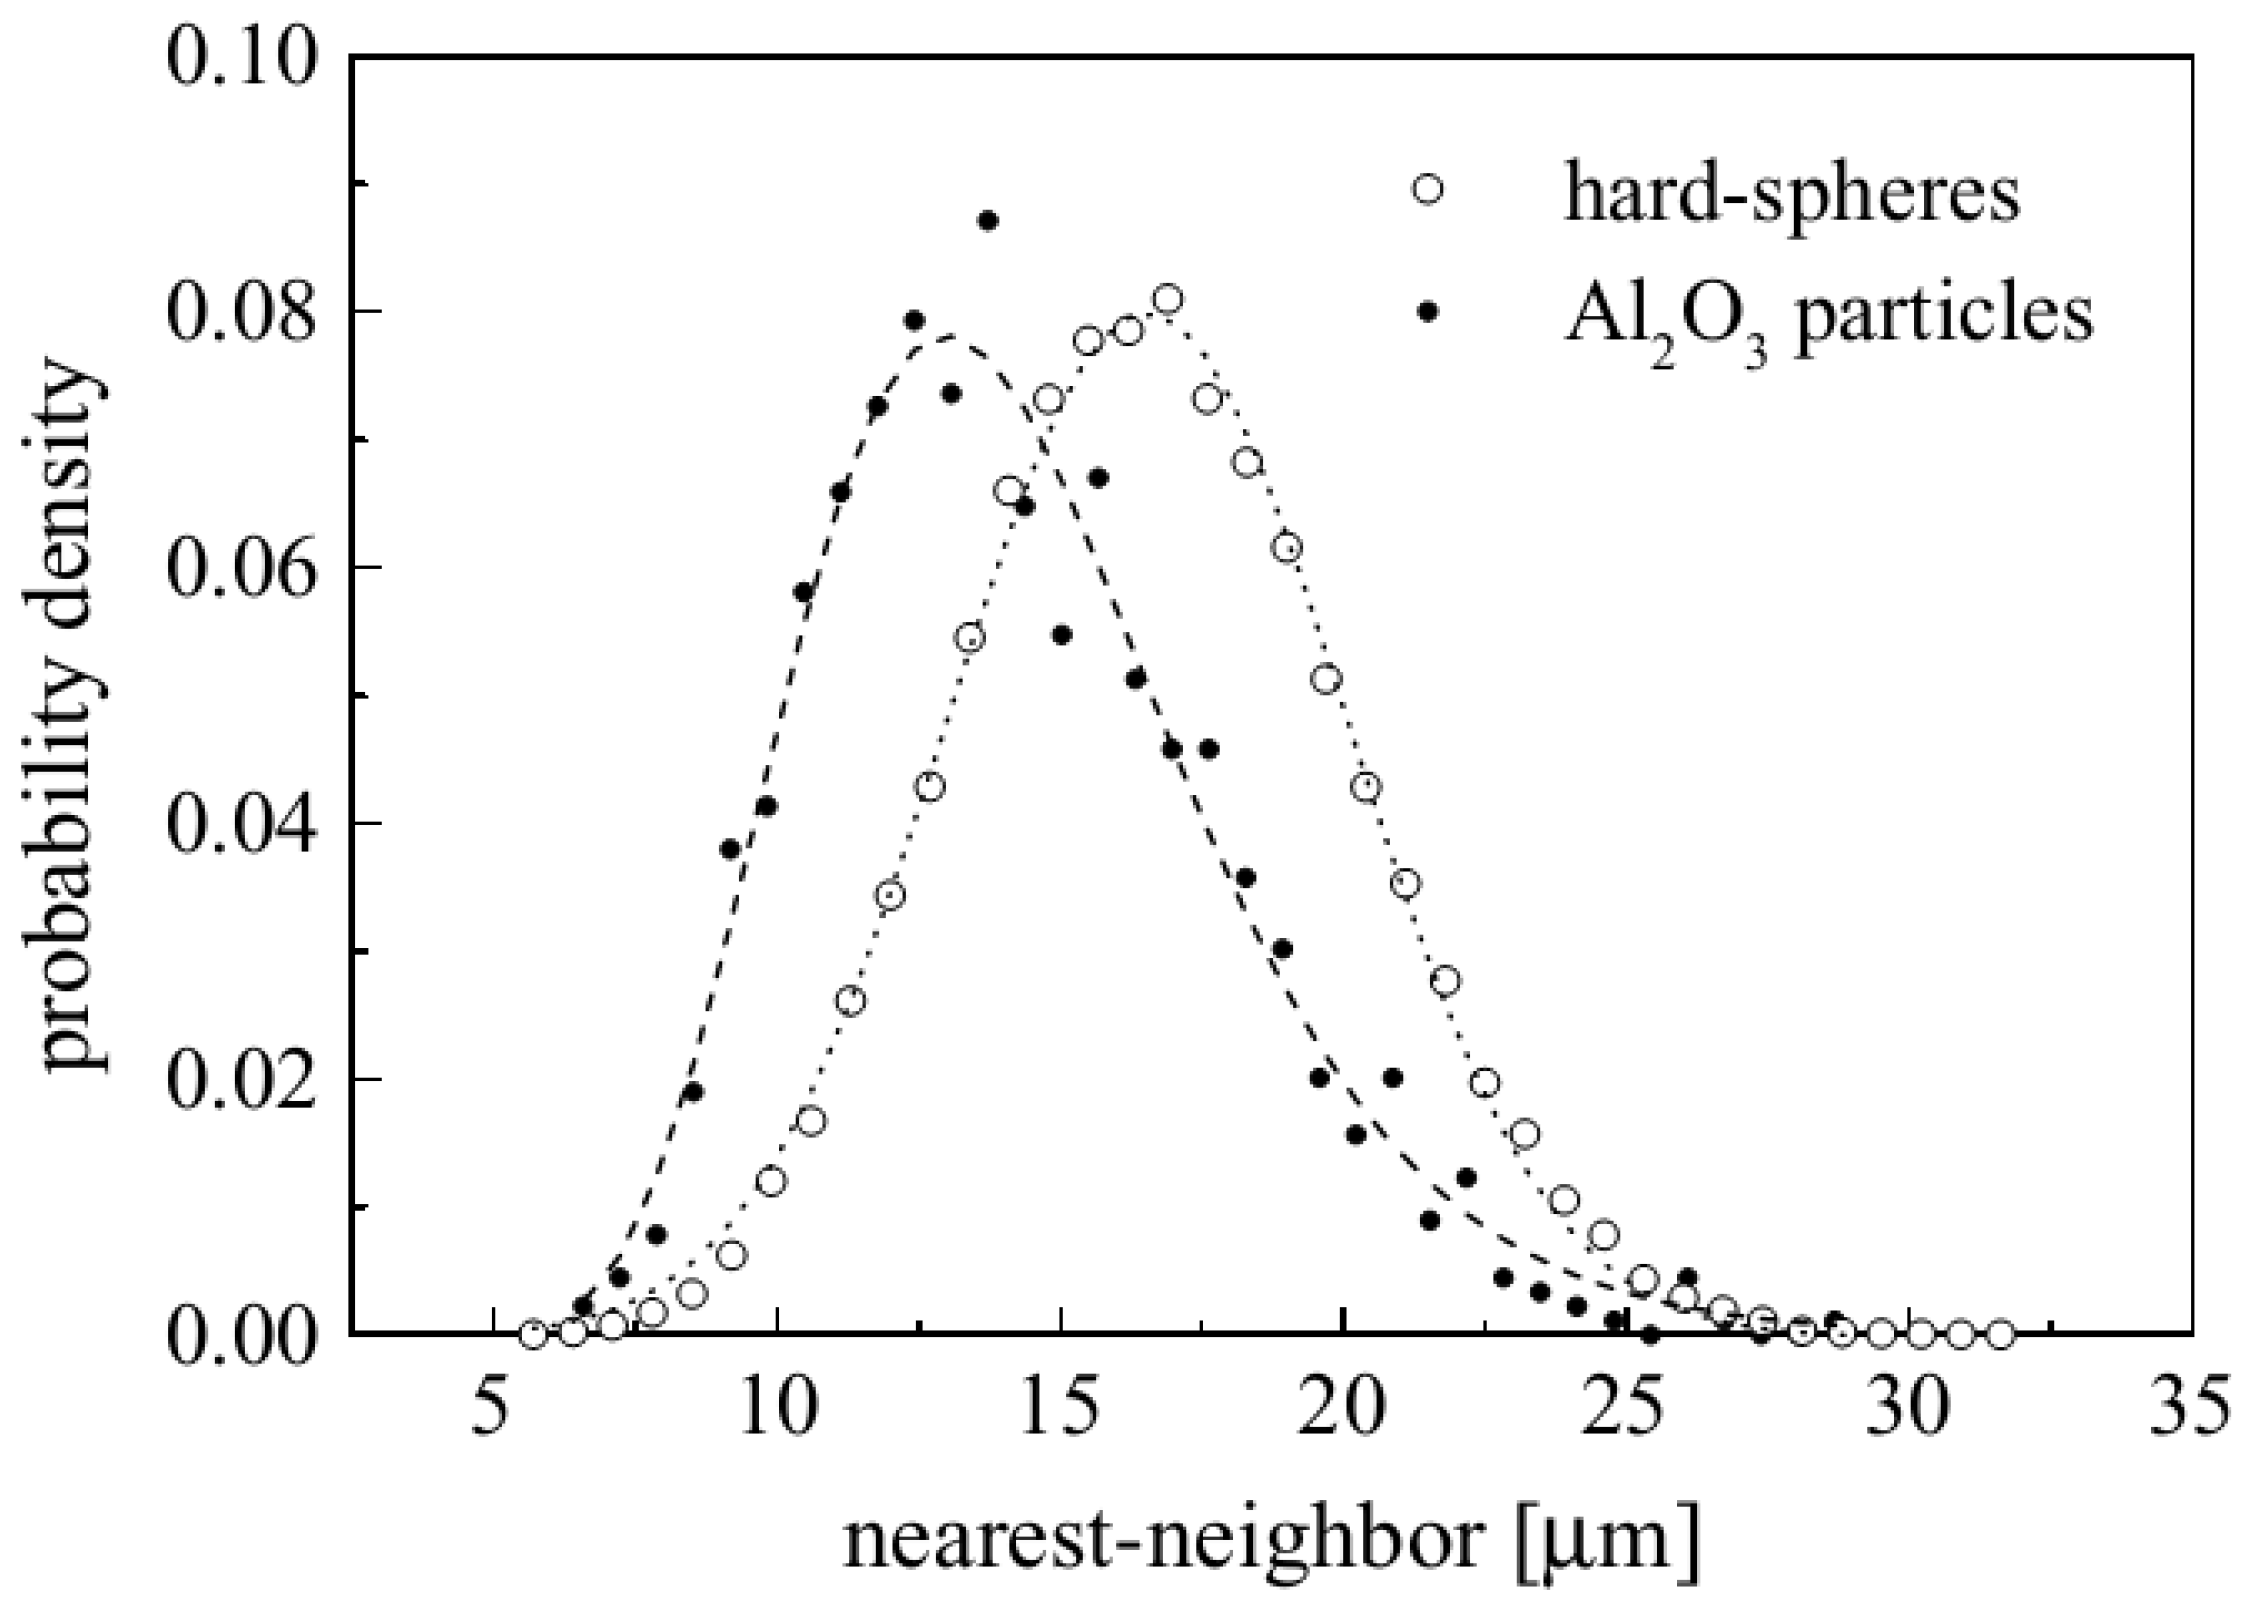
3.2. Nearest-Neighbor Distance and Near-Neighbor Distance Methods

3.3. Mean Intercept Length Method
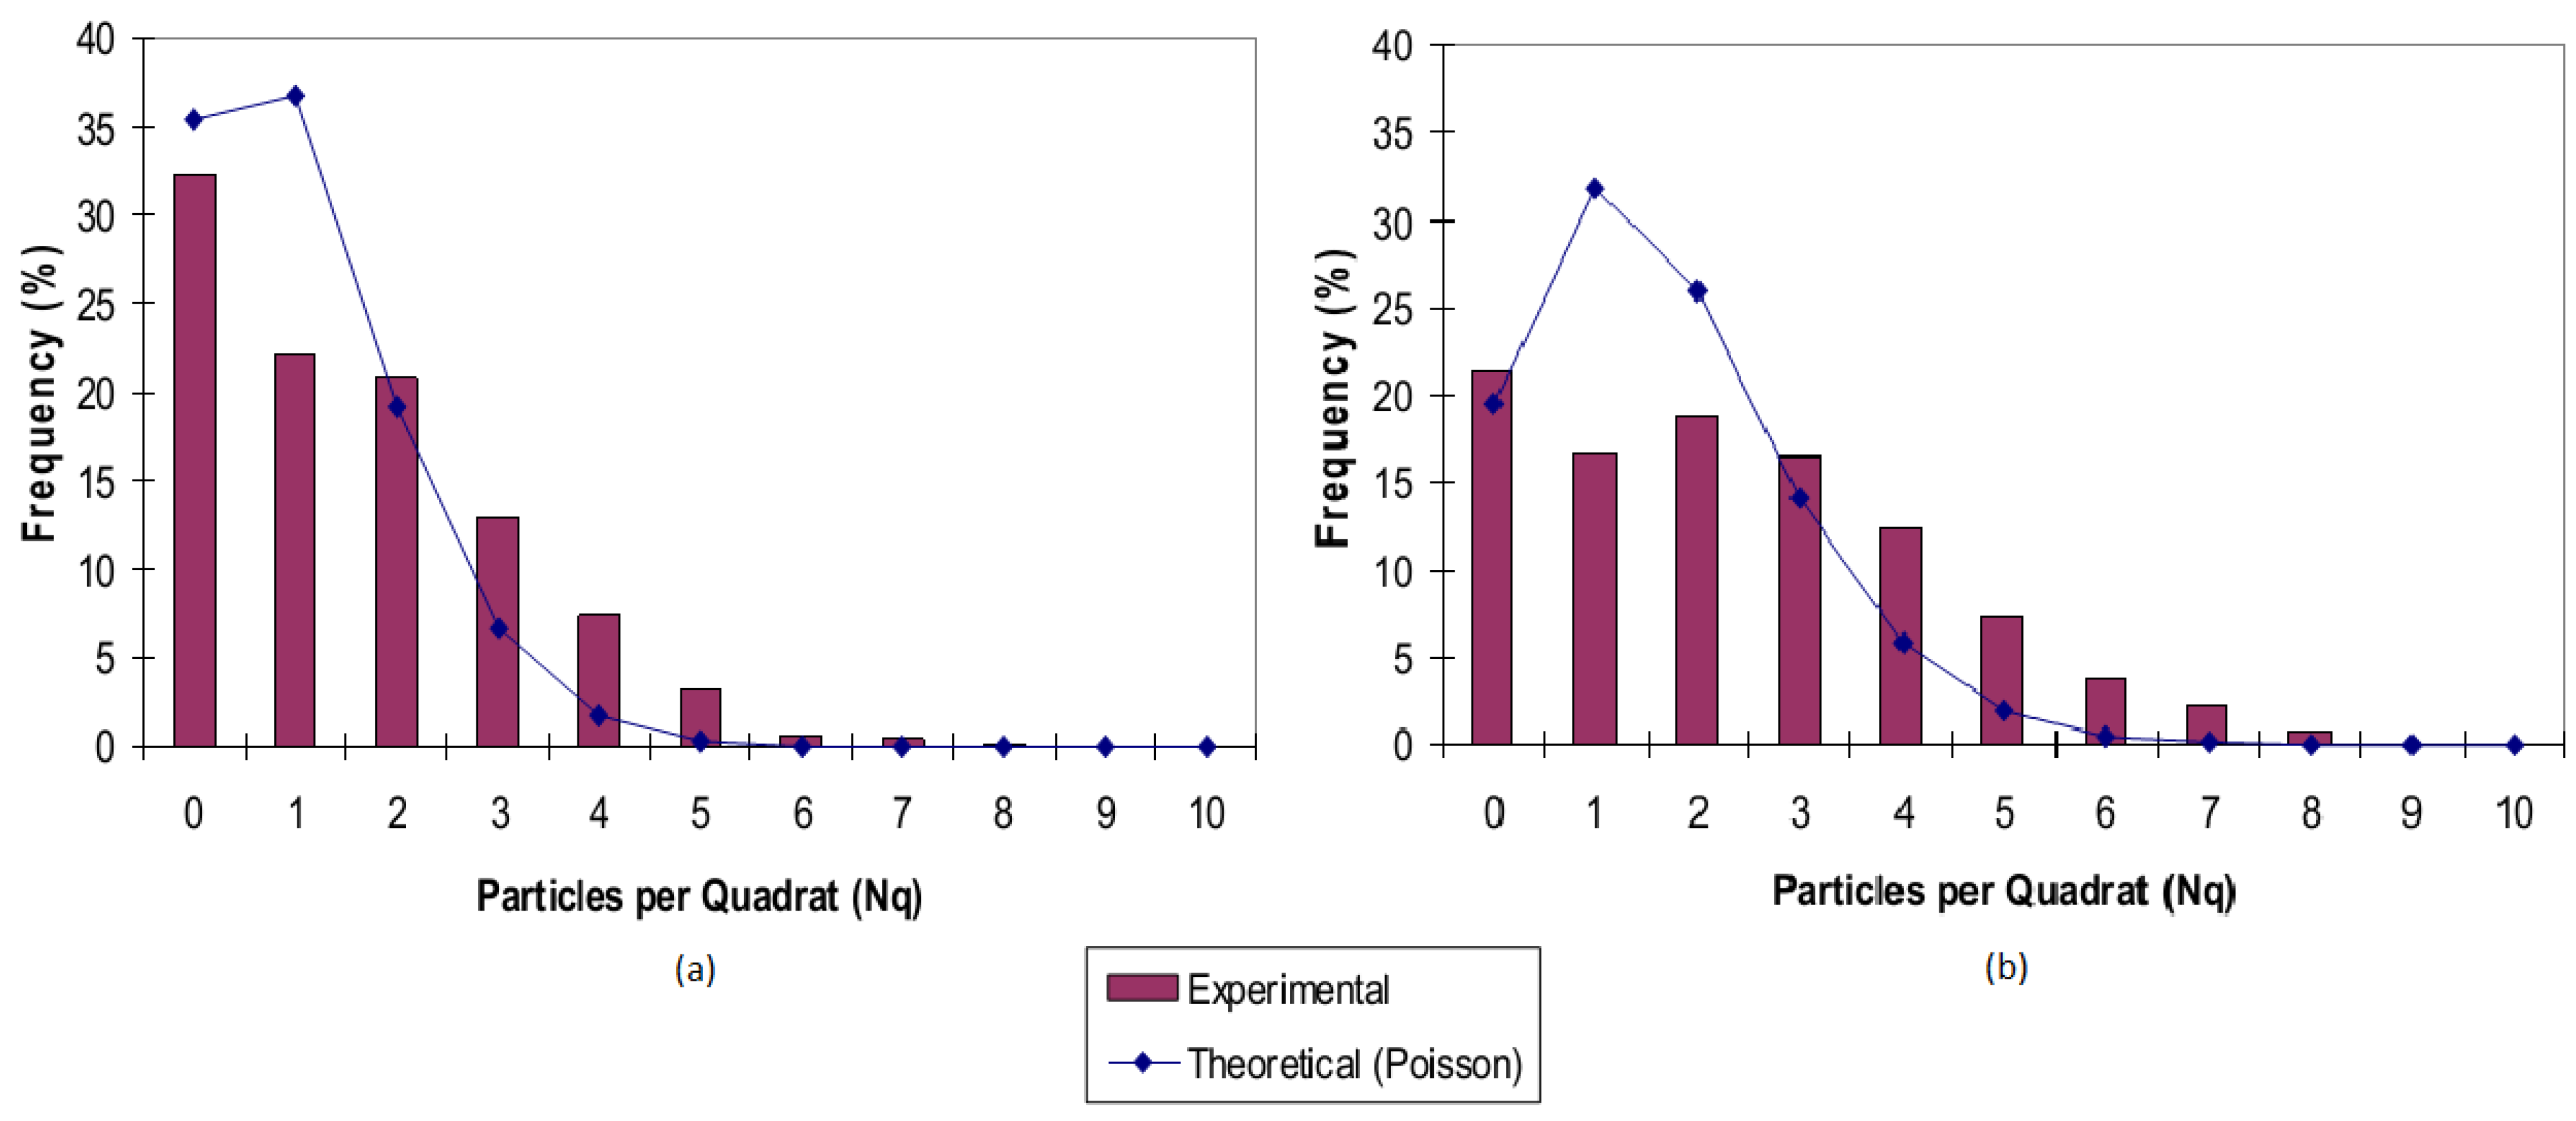
3.4. Quadrat Method

3.5. Radial Distribution Function

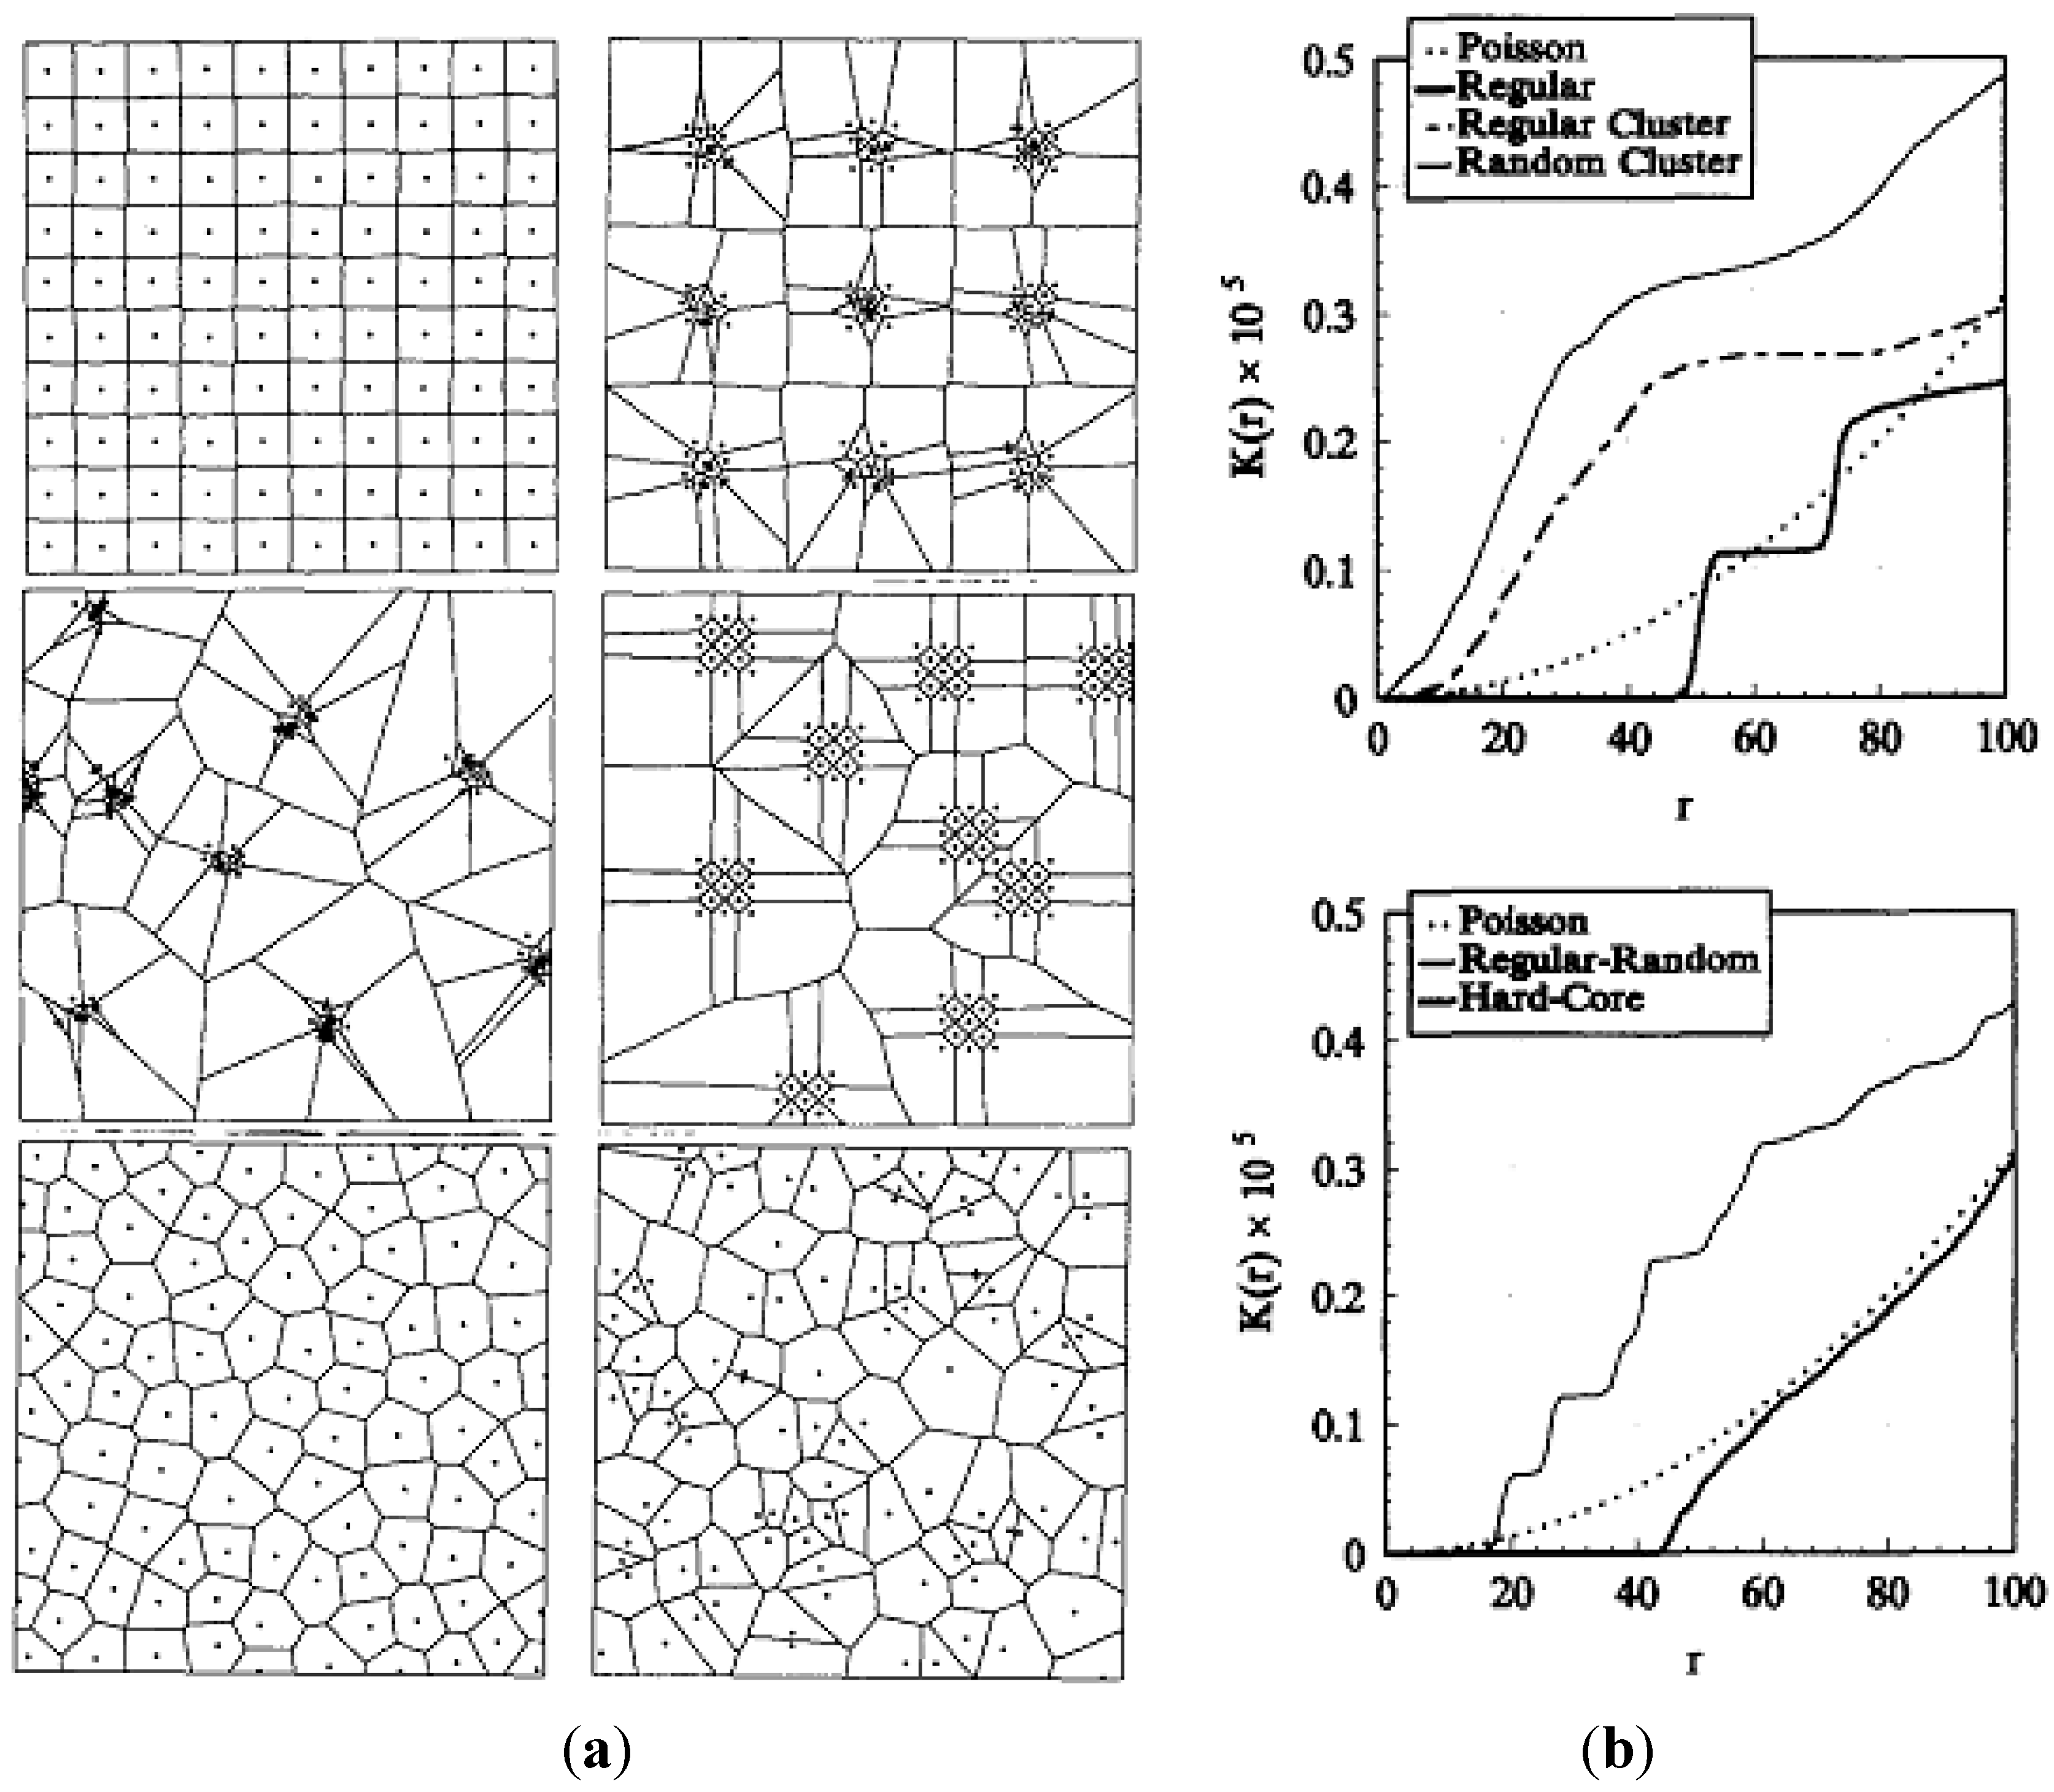
3.6. Second Order Intensity Function

4. Future Directions
5. Conclusions
- -
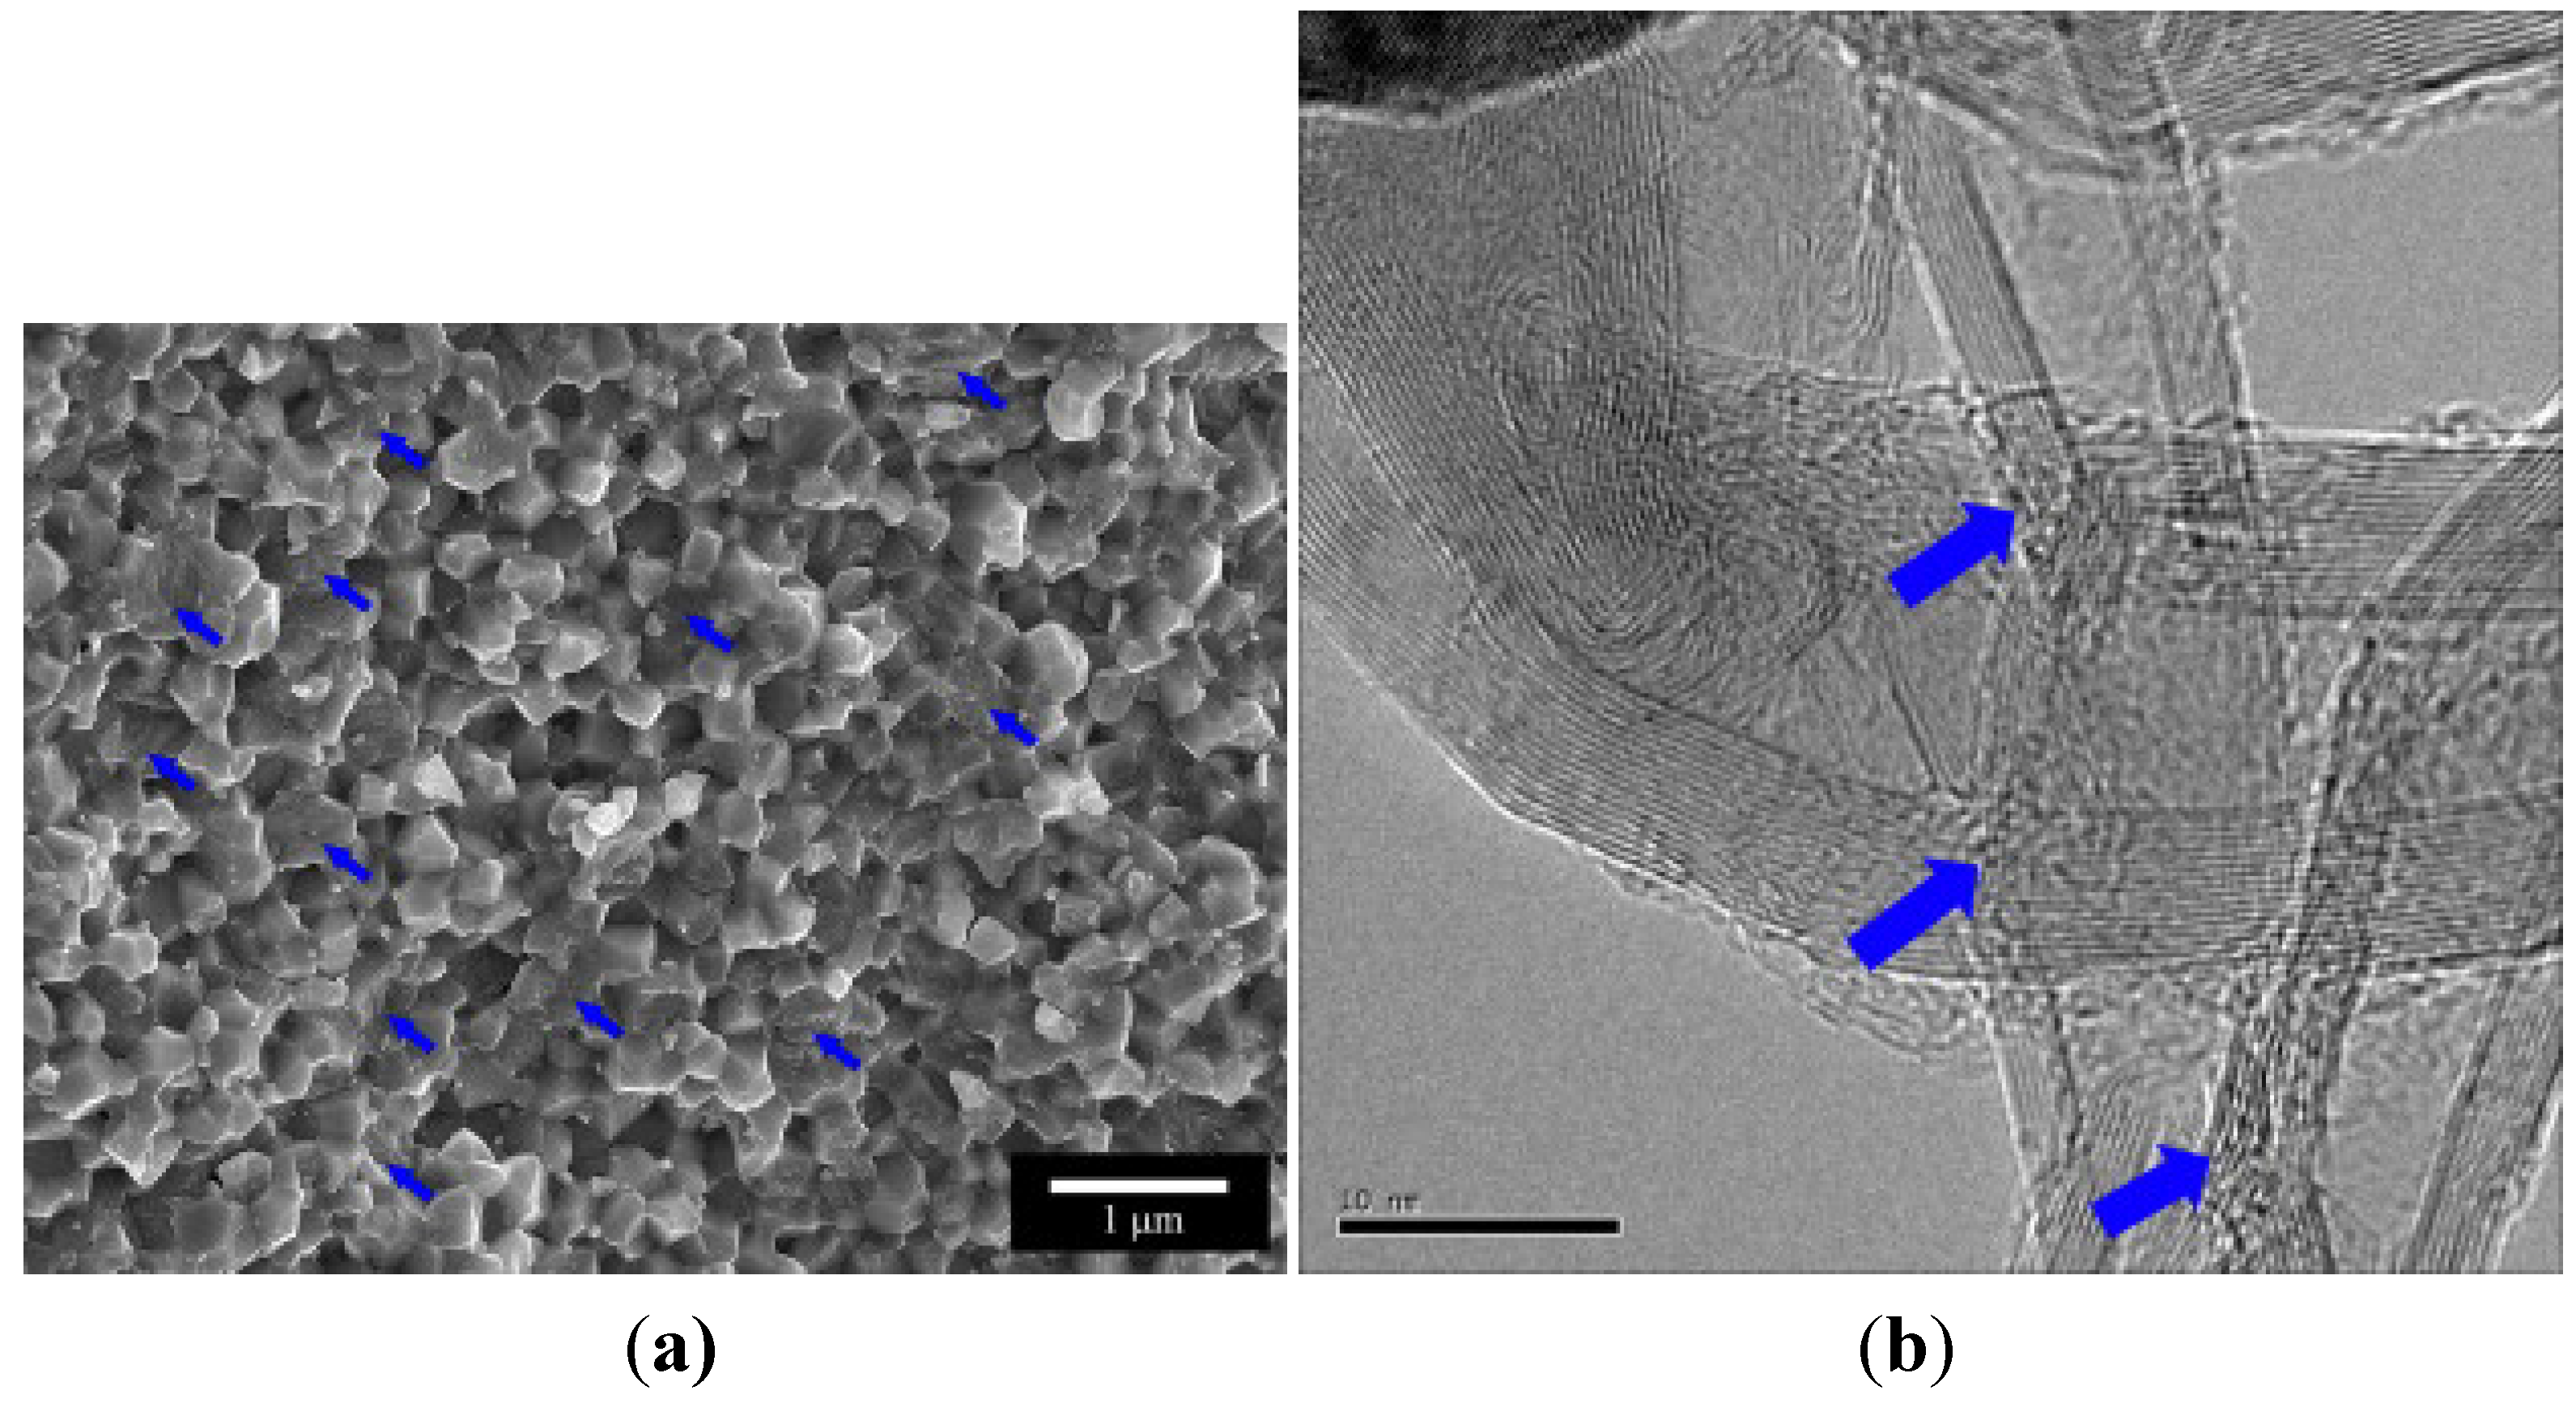
- The SEM and TEM remain the most widely used techniques although both of them cannot be regarded as self-sufficient techniques for a reliable characterization owing to the size limitation of the selected cross-sectional area of the bulk sample which leads to sampling bias in the results.
- -
- Techniques, which provide a broader view of the distribution in the bulk volume, can lead to much more reliable prediction of the properties of nanocomposites. Some of these characterization techniques, which can yield a relatively large-scale distribution analysis in nanocomposites, directly result in a pictorial image of the distribution (for example Confocal Raman Microscopy and Atomic Force Microscopy). Other techniques rely on an indirect analysis for distribution characterization in the bulk volume (like Small-angle X-ray Scattering and Zeta-Potential measurement).
- -
- The X-ray microcomputed tomography is currently only applicable for micro- and macro-composites analysis. However, X-ray nanocomputed tomography may result in a very efficient and reliable three-dimensional pictorial image of the nanoreinforcement distribution within bulk volume of nanocomposite.
- -
- Zeta potential measurement technique offers a two-fold advantage of not only analyzing the distribution of nanoreinforcement in the overall bulk volume of nanocomposite before its consolidation but also yielding a highly reliable measurement of interfacial bond strength between the matrix and the reinforcement phase.
- -
- Qualitative characterization techniques suffer from a common drawback of inability to quantify the distribution of the reinforcement phase within the host matrix—a necessary prerequisite needed for practically feasible evaluation of bulk mechanical properties of nanocomposites.
- -
- Quantitative characterization techniques used for conventional composites involve analyses of microstructure images from which various quantitative measures, either deterministic or probabilistic, are calculated. Deterministic measures include quantities such as mean-intercept lengths in Dirichlet tessellations or local area fractions, while probabilistic measures include probability density functions or frequency distributions in techniques, such as the quadrat method or the nearest neighbor distances.
- -
- There is a potential to modify and upgrade quantitative characterization techniques used for conventional composites to extend their use for nanocomposites.
Acknowledgments
Author Contributions
Conflicts of Interest
References
- Suryanarayana, C.; Al-Aqeeli, N. Mechanically alloyed nanocomposites. Prog. Mater. Sci. 2013, 58, 383–502. [Google Scholar] [CrossRef]
- Tjong, S.C. Carbon Nanotube Reinforced Composites: Metal and Ceramic Matrices; Wiley-VCH Verlag GmbH: Weinheim, Germany, 2009. [Google Scholar]
- Tjong, S.C. Novel nanoparticle-reinforced metal matrix composites with enhanced mechanical properties. Adv. Eng. Mater. 2007, 9, 639–652. [Google Scholar] [CrossRef]
- Mishra, R.S.; Lesher, C.E.; Mukherjee, A.K. High-pressure sintering of nanocrystalline γ-Al2O3. J. Am. Ceram. Soc. 1996, 79, 2989–2992. [Google Scholar] [CrossRef]
- Gu, D.; Shen, Y. Influence of reinforcement weight fraction on microstructure and properties of submicron WC-Cop/Cu bulk MMCs prepared by direct laser sintering. J. Alloys Compd. 2007, 431, 112–120. [Google Scholar] [CrossRef]
- Simunkova, H.; Pessenda-Garcia, P.; Wosik, J.; Angerer, P.; Kronberger, H.; Nauer, G.E. The fundamentals of nano- and submicro-scaled ceramic particles incorporation into electrodeposited nickel layers: Zeta potential measurements. Surf. Coat. Technol. 2009, 203, 1806–1814. [Google Scholar]
- Ionescu, E.; Francis, A.; Riedel, R. Dispersion assessment and studies on AC percolative conductivity in polymer-derived Si–C–N/CNT ceramic nanocomposites. J. Mater. Sci. 2009, 44, 2055–2062. [Google Scholar] [CrossRef]
- Camargo, P.H.C.; Satyanarayana, K.G.; Wypych, F. Nanocomposites: Synthesis, structure, properties and new application opportunities. Mater. Res. 2009, 12, 1–39. [Google Scholar]
- Yamamoto, G.; Hashida, T. Carbon nanotube reinforced alumina composite materials. In Composites and Their Properties; Hu, N., Ed.; InTech: Rijeka, Croatia, 2012. [Google Scholar]
- Choa, Y.H.; Yang, J.K.; Kim, B.H.; Jeong, Y.K.; Lee, J.S.; Nakayama, T. Preparation and characterization of metal/ceramic nanoporous nanocomposite powders. J. Magn. Magn. Mater. 2003, 266, 12–19. [Google Scholar] [CrossRef]
- Estili, M.; Kawasaki, A. An approach to mass-producing individually alumina-decorated multi-walled carbon nanotubes with optimized and controlled compositions. Scr. Mater. 2008, 58, 906–909. [Google Scholar] [CrossRef]
- Cangiano, M.D.L.; Ojeda, M.W.; Carreras, A.C.; González, J.A.; Ruiz, M.D.C. A study of the composition and microstructure of nanodispersed Cu-Ni alloys obtained by different routes from copper and nickel oxides. Mater. Charact. 2010, 61, 1135–1146. [Google Scholar] [CrossRef]
- Prabhu, B.; Suryanarayana, C.; An, L.; Vaidyanathan, R. Synthesis and characterization of high volume fraction Al-Al2O3 nanocomposite powders by high-energy milling. Mater. Sci. Eng. A 2006, 425, 192–200. [Google Scholar] [CrossRef]
- Jena, P.; Brocchi, E.; Solórzano, I.; Motta, M. Identification of a third phase in Cu-Al2O3 nanocomposites prepared by chemical routes. Mater. Sci. Eng. A 2004, 371, 72–78. [Google Scholar] [CrossRef]
- Lu, H.; Huang, W.M.; Liang, F.; Yu, K. Nanoscale design of nano-sized particles in shape-memory polymer nanocomposites driven by electricity. Materials 2013, 6, 3742–3754. [Google Scholar] [CrossRef]
- Corcione, C.E.; Frigione, M. Characterization of nanocomposites by thermal analysis. Materials 2012, 5, 2960–2980. [Google Scholar] [CrossRef]
- Wei, L.; Hu, N.; Zhang, Y. Synthesis of polymer—Mesoporous silica nanocomposites. Materials 2010, 3, 4066–4079. [Google Scholar] [CrossRef]
- Jeon, I.-Y.; Baek, J.-B. Nanocomposites derived from polymers and inorganic nanoparticles. Materials 2010, 3, 3654–3674. [Google Scholar] [CrossRef] [Green Version]
- Bikiaris, D. Microstructure and properties of polypropylene/carbon nanotube nanocomposites. Materials 2010, 3, 2884–2946. [Google Scholar] [CrossRef]
- Jones, W.E., Jr.; Chiguma, J.; Johnson, E.; Pachamuthu, A.; Santos, D. Electrically and thermally conducting nanocomposites for electronic applications. Materials 2010, 3, 1478–1496. [Google Scholar] [CrossRef]
- Tonoyan, A.; Schiсk, C.; Davtyan, S. Intercalated nanocomposites based on high-temperature superconducting ceramics and their properties. Materials 2009, 2, 2154–2187. [Google Scholar] [CrossRef]
- Kim, J.Y. Carbon nanotube-reinforced thermotropic liquid crystal polymer nanocomposites. Materials 2009, 2, 1955–1974. [Google Scholar] [CrossRef]
- Mittal, V. Polymer layered silicate nanocomposites: A review. Materials 2009, 2, 992–1057. [Google Scholar] [CrossRef]
- Sternitzke, M. Review: Structural ceramic nanocomposites. J. Eur. Ceram. Soc. 1997, 17, 1061–1082. [Google Scholar] [CrossRef]
- Moya, J.S.; Lopez-Esteban, S.; Pecharromán, C. The challenge of ceramic/metal microcomposites and nanocomposites. Prog. Mater. Sci. 2007, 52, 1017–1090. [Google Scholar] [CrossRef]
- Bogue, R. Nanocomposites: A review of technology and applications. Assem. Autom. 2011, 31, 106–112. [Google Scholar] [CrossRef]
- Rodriguez-Suarez, T.; Bartolomé, J.F.; Moya, J.S. Mechanical and tribological properties of ceramic/metal composites: A review of phenomena spanning from the nanometer to the micrometer length scale. J. Eur. Ceram. Soc. 2012, 32, 3887–3898. [Google Scholar] [CrossRef]
- Parveen, S.; Rana, S.; Fangueiro, R. A review on nanomaterial dispersion, microstructure, and mechanical properties of carbon nanotube and nanofiber reinforced cementitious composites. J. Nanomater. 2013, 2013, 710175:1–710175:19. [Google Scholar]
- Van der Biest, O. Nanoceramics: Issues and opportunities. Int. J. Appl. Ceram. Technol. 2013, 10, 565–576. [Google Scholar] [CrossRef]
- Wang, S.F.; Zhang, J.; Luo, D.W.; Gu, F.; Tang, D.Y.; Dong, Z.L.; Tan, G.E.B.; Que, X.Y.; Zhang, T.S.; Li, S.; et al. Transparent ceramics: Processing, materials and applications. Prog. Solid State Chem. 2013, 41, 20–54. [Google Scholar] [CrossRef]
- Dong, X.; Huang, W.; Chen, P. In situ synthesis of reduced graphene oxide and gold nanocomposites for nanoelectronics and biosensing. Nanoscale Res. Lett. 2010, 6. [Google Scholar] [CrossRef]
- Loos, J.; Alexeev, A.; Grossiord, N.; Koning, C.E.; Regev, O. Visualization of single-wall carbon nanotube (SWNT) networks in conductive polystyrene nanocomposites by charge contrast imaging. Ultramicroscopy 2005, 104, 160–167. [Google Scholar] [CrossRef]
- Rana, S.; Karak, N.; Cho, J.W.; Kim, Y.H. Enhanced dispersion of carbon nanotubes in hyperbranched polyurethane and properties of nanocomposites. Nanotechnology 2008, 19. [Google Scholar] [CrossRef]
- Lal, M.; Singhal, S.K.; Sharma, I.; Mathur, R.B. An alternative improved method for the homogeneous dispersion of CNTs in Cu matrix for the fabrication of Cu/CNTs composites. Appl. Nanosci. 2013, 3, 29–35. [Google Scholar]
- El-Eskandarany, M.S. Mechanical solid state mixing for synthesizing of SiCp/Al nanocomposites. J. Alloys Compd. 1998, 279, 263–271. [Google Scholar] [CrossRef]
- Ludwig, R. Scanning Electron Microscopy, 2nd ed.; Springer: Berlin, Germany, 1998. [Google Scholar]
- Ludwig, R. Transmission Electron Microscopy, 5th ed.; Springer: Berlin, Germany, 2008. [Google Scholar]
- Friel, J.J.; Lyman, C.E. X-ray mapping in electron-beam instruments. Microsc. Microanal. 2006, 12, 2–25. [Google Scholar] [CrossRef]
- Venkateswaran, T.; Sarkar, D.; Basu, B. Tribological properties of WC-ZrO2 nanocomposites. J. Am. Ceram. Soc. 2005, 88, 691–697. [Google Scholar] [CrossRef]
- Leng, Y. Materials Characterization: Introduction to Microscopic and Spectroscopic Methods; John Wiley & Sons, Ltd.: Singapore, 2008. [Google Scholar]
- Eaton, P.; West, P. Atomic Force Microscopy; Oxford University Press: Oxford, UK, 2010. [Google Scholar]
- Foster, J.; Singamaneni, S.; Kattumenu, R.; Bliznyuk, V. Dispersion and phase separation of carbon nanotubes in ultrathin polymer films. J. Colloid Interface Sci. 2005, 287, 167–172. [Google Scholar] [CrossRef]
- Natile, M.; Glisenti, A. New NiO/Co3O4 and Fe2O3/Co3O4 nanocomposite catalysts: Synthesis and characterization. Chem. Mater. 2003, 15, 2502–2510. [Google Scholar] [CrossRef]
- Veith, M.; Mathur, S.; Lecerf, N. Synthesis of a NdAlO3/Al2O3 ceramic-ceramic composite by single-source precursor CVD. Chem. Mater. 2000, 12, 271–274. [Google Scholar] [CrossRef]
- Deing, T.; Hollricher, O.; Toporski, J. Confocal Raman Microscopy, 1st ed.; Springer: Berlin, Germany, 2011. [Google Scholar]
- Puech, P.; Bassil, A.; Barrau, S.; Demont, P.; Bacsa, R.R.; Flahaut, E.; Bacsa, W.S. Diagnostics of Carbon Nanotube Composites by Raman Spectroscopy. In Proceedings of the World of Coal Ash Conference, NSTI-Nanotech, Boston, MA, USA, 7–11 May 2006.
- Agarwal, U.; Sabo, R. Raman Analysis and Mapping of Cellulose Nanocrystal-Polypropylene Composite. In Proceedings of the 15th International Symposium on Wood, Fiber and Pulping Chemistry, Oslo, Norway, 15–18 July 2009.
- Liu, Y.; Zhou, Y.; Jia, D.; Huang, Z.; Fang, M. Characterization of domain configurations in LiTaO3/Al2O3 ceramic composites. Mater. Chem. Phys. 2011, 125, 143–147. [Google Scholar] [CrossRef]
- Akcora, P.; Kumar, S.K.; Moll, J.; Lewis, S.; Schadler, L.S.; Li, Y.; Benicewicz, B.C.; Sandy, A.; Narayanan, S.; Ilavsky, J.; et al. “Gel-like” mechanical reinforcement in polymer nanocomposite melts. Macromolecules 2010, 43, 1003–1010. [Google Scholar] [CrossRef]
- García-Gutiérrez, M.; Ruiz, A.N. X-ray scattering applied to the analysis of carbon nanotubes, polymers and nanocomposites. Opt. Pura Y Apl. 2007, 40, 195–205. [Google Scholar]
- Golosova, A.A.; Adelsberger, J.; Sepe, A.; Niedermeier, M.A.; Lindner, P.; Funari, S.S.; Jordan, R.; Papadakis, C.M. Dispersions of polymer-modified carbon nanotubes: A small-angle scattering investigation. J. Phys. Chem. C 2012, 116, 15765–15774. [Google Scholar] [CrossRef]
- Ohnuma, M.; Hono, K.; Onodera, H.; Ohnuma, S.; Fujimori, H.; Pedersen, J.S. Microstructures and magnetic properties of Co-Al-O granular thin films. J. Appl. Phys. 2000, 87, 817–823. [Google Scholar] [CrossRef]
- Hazra, S.; Gibaud, A.; Desert, A. Morphology of nanocermet thin films: X-ray scattering study. Phys. B 2000, 283, 97–102. [Google Scholar]
- Hunter, R.J. Zeta Potential in Colloid Science: Principles and Applications, 3rd ed.; Academic Press: London, UK, 1981. [Google Scholar]
- Lewis, S.; Haynes, V.; Wheeler-Jones, R.; Sly, J.; Perks, R.M.; Piccirillo, L. Surface characterization of poly(methylmethacrylate) based nanocomposite thin films containing Al2O3 and TiO2 nanoparticles. Thin Solid Films 2010, 518, 2683–2687. [Google Scholar] [CrossRef]
- Godnjavec, J.; Znoj, B.; Vince, J.; Steinbucher, M.; Venturini, P. Stabilization of rutile TiO2 nanoparticles with glymo in polyacrylic clear coating. Mater. Technol. 2012, 46, 19–24. [Google Scholar]
- Mandzy, N.; Grulke, E.; Druffel, T. Breakage of TiO2 agglomerates in electrostatically stabilized aqueous dispersions. Powder Technol. 2005, 160, 121–126. [Google Scholar] [CrossRef]
- Othman, S.H.; Abdul Rashid, S.; Mohd Ghazi, T.I.; Abdullah, N. Dispersion and stabilization of photocatalytic TiO2 nanoparticles in aqueous suspension for coatings applications. J. Nanomater. 2012, 2012, 718214:1–718214:10. [Google Scholar]
- Wakily, H.; Mehrali, M.; Metselaar, H. Preparation of homogeneous dense composite of zirconia and alumina (ZTA) using colloidal filtration. World Acad. Sci. Eng. Technol. 2010, 46, 140–145. [Google Scholar]
- Chen, T.; Somasundaran, P. Preparation of novel core-shell nanocomposite particles by controlled polymer bridging. J. Am. Ceram. Soc. 1998, 81, 140–144. [Google Scholar] [CrossRef]
- Girardin, E. Characterization of porosity in a laser sintered MMCp using X-ray synchrotron phase contrast microtomography. Mater. Sci. Appl. 2011, 2, 1322–1330. [Google Scholar]
- Holzer, L.; Muench, B.; Wegmann, M.; Gasser, P.; Flatt, R.J. FIB-nanotomography of particulate systems-part I: Particle shape and topology of interfaces. J. Am. Ceram. Soc. 2006, 89, 2577–2585. [Google Scholar] [CrossRef]
- Attwood, D. Nanotomography comes of age. Nature 2006, 442, 642–644. [Google Scholar] [CrossRef]
- Roeder, R.; Converse, G.; Kane, R.; Yue, W. Hydroxyapatite-reinforced polymer biocomposites for synthetic bone substitutes. JOM J. Miner. 2008, 60, 38–45. [Google Scholar] [CrossRef]
- Pakzad, A.; Parikh, N.; Heiden, P.A.; Yassar, R.S. Revealing the 3D internal structure of natural polymer microcomposites using X-ray ultra microtomography. J. Microsc. 2011, 243, 77–85. [Google Scholar] [CrossRef]
- Borbély, A.; Csikor, F.; Zabler, S.; Cloetens, P.; Biermann, H. Three-dimensional characterization of the microstructure of a metal–matrix composite by holotomography. Mater. Sci. Eng. A 2004, 367, 40–50. [Google Scholar] [CrossRef]
- Justice, I.; Derby, B.; Davis, G.; Anderson, P.; Elliott, J. Characterisation of void and reinforcement distributions in a metal matrix composite by X-ray edge-contrast microtomography. Scr. Mater. 2003, 48, 1259–1264. [Google Scholar] [CrossRef]
- Gupta, G.; Zbib, A.; El-Ghannam, A.; Khraisheh, M.; Zbib, H. Characterization of a novel bioactive composite using advanced X-ray computed tomography. Compos. Struct. 2005, 71, 423–428. [Google Scholar] [CrossRef]
- Schladitz, K. Quantitative micro-CT. J. Microsc. 2011, 243, 111–117. [Google Scholar] [CrossRef]
- Park, N.; Jeona, S.; Park, J.; Kim, W.; Shon, I.-J. Simultaneous synthesis and consolidation of a nanostructured 4Fe-Al2O3 composite from mechanically activated powders by high frequency induction heated Sintering. J. Ceram. Process. Res. 2009, 10, 774–779. [Google Scholar]
- Arif, T.M.; Saheb, N. Processing and Characterization of Ni-Al2O3 Nanocomposites; USRG 1202, Final Report; King Fahd University of Petroleum and Minerals: Dhahran, Saudi Arabia, 2014. [Google Scholar]
- Saheb, N.; Laoui, T.; Al-Aqeeli, N.; Atieh, M.A.; Al-Qutub, A. Development of Aluminum Based Nanocomposites through Powder Metallurgy and Novel Sintering Technologies for Structural and Tribological Applications; ARP-28-122, Final Report; King Abdulaziz City for Science and Technology: Riyadh, Saudi Arabia, 2013. [Google Scholar]
- Saheb, N.; Al-Aqeeli, N.; Fida, H.S. Optimization of Processing Parameters for the Development of Al-SiC Nanocomposites with Improved Mechanical Properties; IN 121008, Final Report; King Fahd University of Petroleum and Minerals: Dhahran, Saudi Arabia, 2014. [Google Scholar]
- Nelson, G.; Harris, W.; Lombardo, J.; Izzo, J.; Chiu, W.K.; Tanasini, P.; Cantoni, M.; van Herle, J.; Comninellis, C.; Andrews, J.; et al. Comparison of X-ray nanotomography and FIB-SEM in quantifying the composite LSM/YSZ SOFC cathode microstructure. ECS Trans. 2011, 35, 2417–2421. [Google Scholar]
- Marin, E.; Lekka, M.; Andreatta, F. Electrochemical Behaviour of Aluminum-Fly Ash Composites Produced by Powder Metallurgy. In Proceedings of the World of Coal Ash Conference, Denver, CO, USA, 9–12 May 2011.
- Pardo, A.; Merino, M.C.; Arrabal, R.; Viejo, F.; Carboneras, M.; Muñoz, J.A. Influence of Ce surface treatments on corrosion behaviour of A3xx.x/SiCp composites in 3.5 wt% NaCl. Corros. Sci. 2006, 48, 3035–3048. [Google Scholar] [CrossRef]
- Buffière, J.; Maire, E.; Cloetens, P. Characterization of internal damage in a MMCp using X-ray synchrotron phase contrast microtomography. Acta Mater. 1999, 47, 1613–1625. [Google Scholar] [CrossRef]
- Babout, L.; Maire, E.; Fougères, R. Damage initiation in model metallic materials: X-ray tomography and modelling. Acta Mater. 2004, 52, 2475–2487. [Google Scholar]
- Watson, I.; Lee, P.; Dashwood, R.; Young, P. Simulation of the mechanical properties of an aluminum matrix composite using X-ray microtomography. Metall. Mater. Trans. 2006, 37, 14–17. [Google Scholar]
- Yu, H. Processing Routes for Aluminum based Nano-Composites; Worchester Polytechnic Institute: Worcester, MA, USA, 2010. [Google Scholar]
- Zhou, Z.; Peng, H.X.; Fan, Z.; Li, D.X. MMCs with controlled non-uniform distribution of submicrometre Al2O3 particles in 6061 aluminium alloy matrix. Mater. Sci. Technol. 2000, 16, 908–912. [Google Scholar] [CrossRef]
- Ko, I.; Shon, I.; Doh, J. Consolidation of a nanostructured Al2O3 reinforced Fe-Cr composite by rapid sin-tering and its mechanical properties. J. Ceram. Process. Res. 2011, 12, 70–73. [Google Scholar]
- Kim, K.T.; Eckert, J.; Liu, G.; Park, J.M.; Lim, B.K.; Hong, S.H. Influence of embedded-carbon nanotubes on the thermal properties of copper matrix nanocomposites processed by molecular-level mixing. Scr. Mater. 2011, 64, 181–184. [Google Scholar] [CrossRef]
- Shi, X.L.; Yang, H.; Shao, G.Q.; Duan, X.L.; Yan, L.; Xiong, Z.; Sun, P. Fabrication and properties of W-Cu alloy reinforced by multi-walled carbon nanotubes. Mater. Sci. Eng. A 2007, 457, 18–23. [Google Scholar] [CrossRef]
- Hong, S.H.; Kim, B.K. Fabrication of W-20 wt%Cu composite nanopowder and sintered alloy with high thermal conductivity. Mater. Lett. 2003, 57, 2761–2767. [Google Scholar] [CrossRef]
- Goujon, C.; Goeuriot, P. Solid state sintering and high temperature compression properties of Al-alloy5000/AlN nanocomposites. Mater. Sci. Eng. A 2001, 315, 180–188. [Google Scholar] [CrossRef]
- Javadi, A.; Mirdamadi, S.; Faghisani, M.; Shakhesi, S. Investigation of new method to achieve well dispersed multiwall carbon nanotubes reinforced Al matrix composites. World Acad. Sci. Eng. Technol. 2011, 59, 16–22. [Google Scholar]
- Estili, M.; Kawasaki, A.; Sakamoto, H.; Mekuchi, Y.; Kuno, M.; Tsukada, T. The homogeneous dispersion of surfactantless, slightly disordered, crystalline, multiwalled carbon nanotubes in α-alumina ceramics for structural reinforcement. Acta Mater. 2008, 56, 4070–4079. [Google Scholar] [CrossRef]
- Datye, A.; Wu, K.H.; Gomes, G.; Monroy, V.; Lin, H.T.; Vleugels, J.; Vanmeensel, K. Synthesis, microstructure and mechanical properties of Yttria Stabilized Zirconia (3YTZP)—Multi-Walled Nanotube (MWNTs) nanocomposite by direct in-situ growth of MWNTs on Zirconia particles. Compos. Sci. Technol. 2010, 70, 2086–2092. [Google Scholar] [CrossRef]
- Gibaud, A.; Hazra, S.; Sella, C.; Laffez, P.; Désert, A.; Naudon, A.; van Tendeloo, G. Particle layering in the ceramic-metal thin film Pt-Al2O3. Phys. Rev. B 2001, 63. [Google Scholar] [CrossRef]
- Guo, C.; Wang, D.; Wang, Q. A SiO/graphene nanocomposite as a high stability anode material for lithium-ion batteries. Int. J. Electrochem. Sci. 2012, 7, 8745–8752. [Google Scholar]
- Walker, L.S.; Marotto, V.R.; Rafiee, M.A.; Koratkar, N.; Corral, E.L. Toughening in graphene ceramic composites. ACS Nano 2011, 5, 3182–3190. [Google Scholar] [CrossRef]
- Mo, C.B.; Cha, S.I.; Kim, K.T.; Lee, K.H.; Hong, S.H. Fabrication of carbon nanotube reinforced alumina matrix nanocomposite by sol-gel process. Mater. Sci. Eng. A 2005, 395, 124–128. [Google Scholar] [CrossRef]
- Ghosh, S.; Nowak, Z.; Lee, K. Quantitative characterization and modeling of composite microstructures by Voronoi cells. Acta Mater. 1997, 45, 2215–2234. [Google Scholar] [CrossRef]
- Spitzig, W.; Kelly, J.; Richmond, O. Quantitative characterization of second-phase populations. Metallography 1985, 18, 235–261. [Google Scholar] [CrossRef]
- Ganguly, P.; Poole, W. Characterization of reinforcement distribution inhomogeneity in metal matrix composites. Mater. Sci. Eng. A 2002, 332, 301–310. [Google Scholar] [CrossRef]
- Bakshi, S.R.; Batista, R.G.; Agarwal, A. Quantification of carbon nanotube distribution and property correlation in nanocomposites. Compos. Part A Appl. Sci. Manuf. 2009, 40, 1311–1318. [Google Scholar] [CrossRef]
- Yang, N.; Boselli, J.; Sinclair, I. Simulation and quantitative assessment of homogeneous and inhomogeneous particle distributions in particulate metal matrix composites. J. Microsc. 2001, 201, 189–200. [Google Scholar] [CrossRef]
- Al-Ostaz, A.; Diwakar, A.; Alzebdeh, K.I. Statistical model for characterizing random microstructure of inclusion–matrix composites. J. Mater. Sci. 2007, 42, 7016–7030. [Google Scholar] [CrossRef]
- Besterci, M.; Velgosová, O. Microstructural parameters of Cu-Al2O3 dispersion strengthened materials. Adv. Powder Technol. 2003, 416–418, 1–6. [Google Scholar]
- Karnezis, P.; Durrant, G.; Cantor, B. Characterization of reinforcement distribution in cast Al-alloy/SiCp composites. Mater. Charact. 1998, 58, 97–109. [Google Scholar] [CrossRef]
- Olszówka-Myalska, A.; Szala, J.; Cwajna, J. Characterization of reinforcement distribution in Al/(Al2O3)p composites obtained from composite powder. Mater. Charact. 2001, 46, 189–195. [Google Scholar] [CrossRef]
- Wray, P.; Richmond, O.; Morrison, H. Use of the Dirichlet tessellation for characterizing and modeling nonregular dispersions of second-phase particles. Metallography 1983, 16, 39–58. [Google Scholar] [CrossRef]
- Lucey, T.; Wuhrer, R.; Yeung, W. A quadrat analysis on particle distribution of cold rolled SiCp/Zn-22 wt%Al composites. Mater. Forum 2008, 32, 98–104. [Google Scholar]
- Cetin, A.; Kalkanli, A. Multi-scale characterization of particle clustering in discontinuously reinforced composites. Mater. Charact. 2009, 60, 568–572. [Google Scholar] [CrossRef]
- Pyrz, R. Quantitative description of the microstructure of composites. Part I: Morphology of unidirectional composite systems. Compos. Sci. Technol. 1994, 50, 197–208. [Google Scholar] [CrossRef]
© 2014 by the authors; licensee MDPI, Basel, Switzerland. This article is an open access article distributed under the terms and conditions of the Creative Commons Attribution license (http://creativecommons.org/licenses/by/3.0/).
Share and Cite
Saheb, N.; Qadir, N.U.; Siddiqui, M.U.; Arif, A.F.M.; Akhtar, S.S.; Al-Aqeeli, N. Characterization of Nanoreinforcement Dispersion in Inorganic Nanocomposites: A Review. Materials 2014, 7, 4148-4181. https://doi.org/10.3390/ma7064148
Saheb N, Qadir NU, Siddiqui MU, Arif AFM, Akhtar SS, Al-Aqeeli N. Characterization of Nanoreinforcement Dispersion in Inorganic Nanocomposites: A Review. Materials. 2014; 7(6):4148-4181. https://doi.org/10.3390/ma7064148
Chicago/Turabian StyleSaheb, Nouari, Najam Ul Qadir, Muhammad Usama Siddiqui, Abul Fazl Muhammad Arif, Syed Sohail Akhtar, and Nasser Al-Aqeeli. 2014. "Characterization of Nanoreinforcement Dispersion in Inorganic Nanocomposites: A Review" Materials 7, no. 6: 4148-4181. https://doi.org/10.3390/ma7064148