Structural Rheology of the Smectic Phase

Abstract
: In this review article, we discuss the rheological properties of the thermotropic smectic liquid crystal 8CB with focal conic domains (FCDs) from the viewpoint of structural rheology. It is known that the unbinding of the dislocation loops in the smectic phase drives the smectic-nematic transition. Here we discuss how the unbinding of the dislocation loops affects the evolution of the FCD size, linear and nonlinear rheological behaviors of the smectic phase. By studying the FCD formation from the perpendicularly oriented smectic layers, we also argue that dislocations play a key role in the structural development in layered systems. Furthermore, similarities in the rheological behavior between the FCDs in the smectic phase and the onion structures in the lyotropic lamellar phase suggest that these systems share a common physical origin for the elasticity.1. Introduction
Rheology is a fundamental issue in soft matter science. One of the most successful achievements in the rheology of soft matter is the Doi-Edwards model, which describes the viscoelastic response of entangled polymer melts [1]. This model guides further theories and experiments which contribute not only to the industrial application of polymer materials but also to the progress of the basic polymer science. In contrast to the success in the polymer systems, the rheology of soft matter with meso-scale structures is still a developing field. Structured fluids such as foam, emulsions and colloidal systems as well as polymers have been also widely studied for many industrial applications [2–5]. However, the attempt to describe their universal rheological properties has only started using the concept of “soft glassy rheology” [5,6]. Besides these glassy materials, the rheology of surfactant systems which exhibit the gyroid phase with a three-dimensional periodic structure, or the sponge phase with randomly connected bicontinuous interface remains unexplored except for some pioneered studies [7–12]. Their unique viscoelastic responses arise predominantly from deformation of meso-scale internal structures whose rearrangement can be easily induced under deformation or flow.
The rheology of soft matter looks for a fundamental understanding in terms of the micro/meso structures of the systems. Representative examples of “structural rheology” include emulsions, foams, colloidal dispersions, surfactant solutions, and liquid crystals. Molecular systems such as a lubricant confined in a narrow space also exhibit various responses depending on their microstructure [13–15]. Since there are many different structures, to unify the rheology of structured fluids is an attractive yet challenging subject. Furthermore, as the soft structures can also evolve in the flow, a good selection of the structure unit is essential to understand the system. If we can establish a fundamental principle for the “structural rheology”, the significance of the soft matter in the industrial application will increase. In this review, we take defects as the key structures to understand the smectic rheology.
In this review article, we discuss the structural rheology of thermotropic smectic liquid crystal as a typical example [16–19]. Among various soft materials which spontaneously form internal structures such as lamellar, hexagonal, cubic, and gyroid phases [20–23], the simplest one-dimensional periodic structure is the smectic-A phase in thermotropic liquid crystals. The smectic liquid crystals exhibit a solid-like response in the layer perpendicular direction and a fluid-like response within the layers. Although the solid and the fluid-like responses do not mix for the smectic with a perfect alignment, self-organized textures combine these responses and give rise to the viscoelasticity. Even in such simple systems, phenomena such as shear-thinning and the orientation transition of the smectic layer are observed once a flow field is applied [24–29]. In lyotropic lamellar phases, it is known that bilayer membranes form multi-lamellar vesicles (onions) under shear flow [30–34].
As Horn and Kleman [35] pointed out in their pioneering work, smectic rheology is influenced by defects in the bulk. It has been explained that shear-thinning behavior depends on the defect dynamics and/or the defect density [25,36–38]. Although the importance of defects in the smectic rheology is a common understanding, there are relatively few studies that focus on the role of defects either explicitly or systematically [39–42]. Meyer et al. and Lu et al. [36–38] studied the shear-thinning behavior by considering the dynamics of screw dislocations and dislocation loops. They found that the theoretically predicted shear-thinning behavior γ̇ ∼ σm, where γ̇ is the shear rate and σ the shear stress, was consistent with the experimental results within a limited range of the shear rate.
The thermotropic smectic liquid crystal 8CB changes from the crystalline phase to the smectic phase at T =21.5 °C, and further to the nematic phase at TSN =33.4 °C. In this review article, using 8CB as a typical example of smectics, we summarize the structural observation, the linear and nonlinear rheological behavior of the smectic-A phase close to (but below) TSN. In the next section, we briefly explain the defects in the smectic liquid crystal phase. The temperature and the shear rate dependences of the defect size are discussed in Section 3. In Section 4, the nonlinear rheology of the smectic phase is investigated from the viewpoint of unbinding of dislocations, and summarize them in a dynamic phase diagram. The physical origin of the elasticity of the smectic phase with defects is suggested in Section 5. In the following section, we explain the dynamics of defect formation induced by a non-equilibrium phase transition in the smectic phase under flow. Finally, we mention the similarities between textural defects in the thermotropic smectic phase and the onion structures in the lyotropic lamellar phase.
In our study, we did not perform any surface treatment of the shear cell. The lack of the surface anchoring may induce the misalignment of the smectic layers and lead to the nucleation of focal conic domains (FCDs). However, in our experiment, reproducible results could be obtained by applying the pre-shear even without any anchoring treatment.
2. Defect Structures in the Smectic Phase
A liquid crystal has fluidity of a liquid and elasticity of a crystal. It also contains defects which locally break the translational symmetry and form reconnected layers [43]. Smectic-A phase with a layered structure is perturbed by two types of line defects; edge dislocations and screw dislocations which are parallel and perpendicular to the layer surface, respectively. These line defects appear in pairs with opposite signs so that two screw dislocations with opposite signs linked by edge dislocations form a dislocation loop. Since the dislocation loop locally compresses the layer thickness, an increase in the dislocation loop density causes the accumulation of strain energy. Furthermore, FCDs are formed to relax the compression deformation [44,45]. FCDs are visible under an optical microscope and have sizes from a few micrometers to a hundred micrometers.
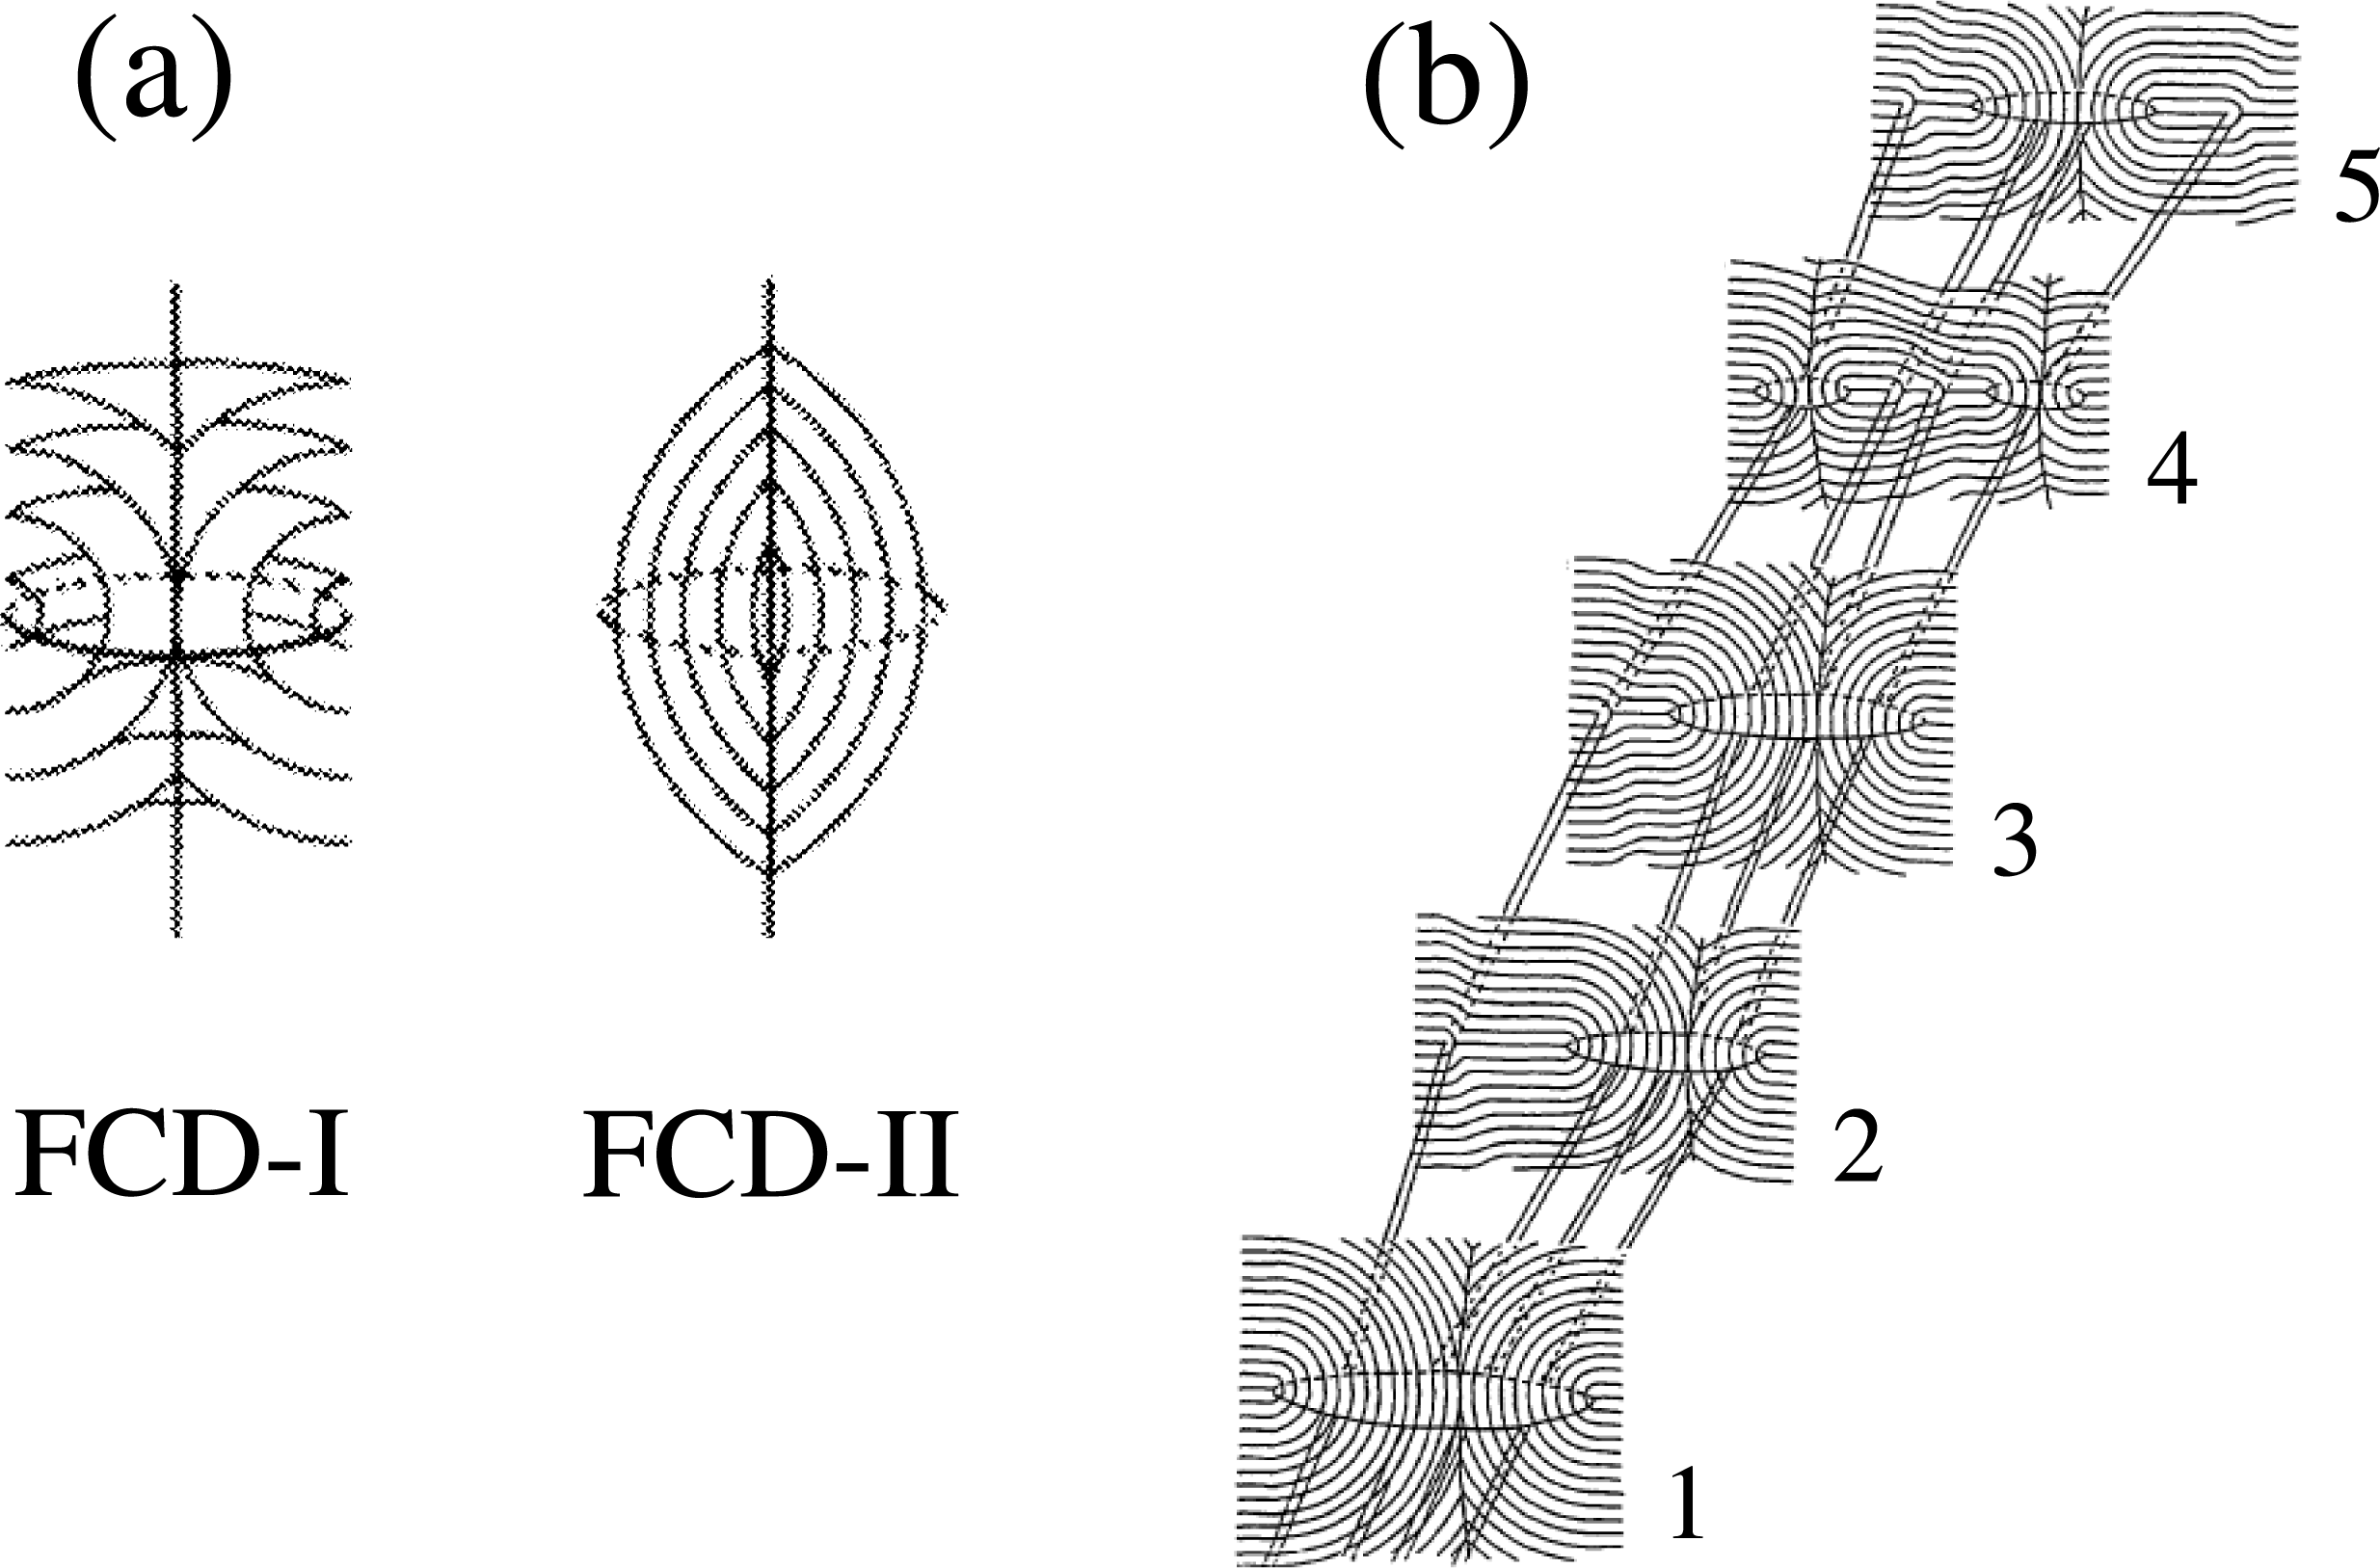
As shown in Figure 1, there are two types of FCDs which can be distinguished by the sign of the Gaussian curvature of the layers. The first type, FCD-I, has negative Gaussian curvature forming a toroidal shape, and is frequently observed in thermotropic liquid crystals. Whereas the second type, FCD-II, has a concentric sphere like onion structure which is observed only in lyotropic lamellar phases. As presented in Figure 1b, FCD-Is are connected by edge dislocations to form “oily streaks” which are commonly observed both in thermotropic and lyotropic systems [46].
Not only the edge dislocations but also the screw dislocations also affect the FCD structure. In the FCDs, the layers are folded into Dupin cyclides with ellipse and hyperbola which can be identified as disclinations. Kleman et al. [47] and Meyer et al. [48] experimentally observed that the interaction between FCDs and dislocations creates kinks on disclinations. As a result of this interaction, the screw dislocations will align along the kink. Unbinding of the dislocation loops will thus increase the kink density and may affect the FCD shape.
It has been recognized that formation of dislocation loops plays an important role in the smectic-nematic (SN) transition [49]. Helfrich [50] proposed that an increase in the dislocation loop density destroys the smectic order, and the unbinding of dislocation loops drives the SN-transition. In his model, the stability of dislocation loops is determined by its energy per unit length, i.e., line tension. When the temperature is increased, the line tension decreases and becomes negative above T = TSN. This leads to the spontaneous nucleation and proliferation of dislocation loops, and the decay of the smectic order is reflected by the temperature dependence of the layer compression modulus B. Benzekri et al. [51,52] showed that B decreases according to a power-law behavior with a critical exponent given by the Nelson-Toner model [53]. Using freeze-fracture transmission electron microscopy technique, Moreau et al. [54] showed that dislocation loop size indeed increases in the vicinity of the SN-transition for a lyotropic liquid crystal.
3. FCDs under Shear Flow
As Horn and Kleman presented [35], the FCD density increases by applying a shear flow. Their experimental observations suggest that non-equilibrium textural defects is additionally induced by the shear flow. Hence the smectic structures are strongly affected by the formation of non-equilibrium defects. In this section, we discuss the relation between the proliferation of dislocation loops and the FCD size and the shear rate [16].
Figure 2 shows polarized light microscope images of 8CB in the smectic phase under shear flow. These images were obtained immediately after applying different shear rates for 10 min for various temperatures ranging from the room temperature to TSN. The vertical and the depth directions correspond to the flow and the velocity gradient directions, respectively. It can be seen that strings of FCDs along the flow direction fill the space. We also note that the FCD size decreases with increasing the shear rate at each temperature. Under constant shear rate, on the other hand, the FCD size increases as the temperature approaches TSN.
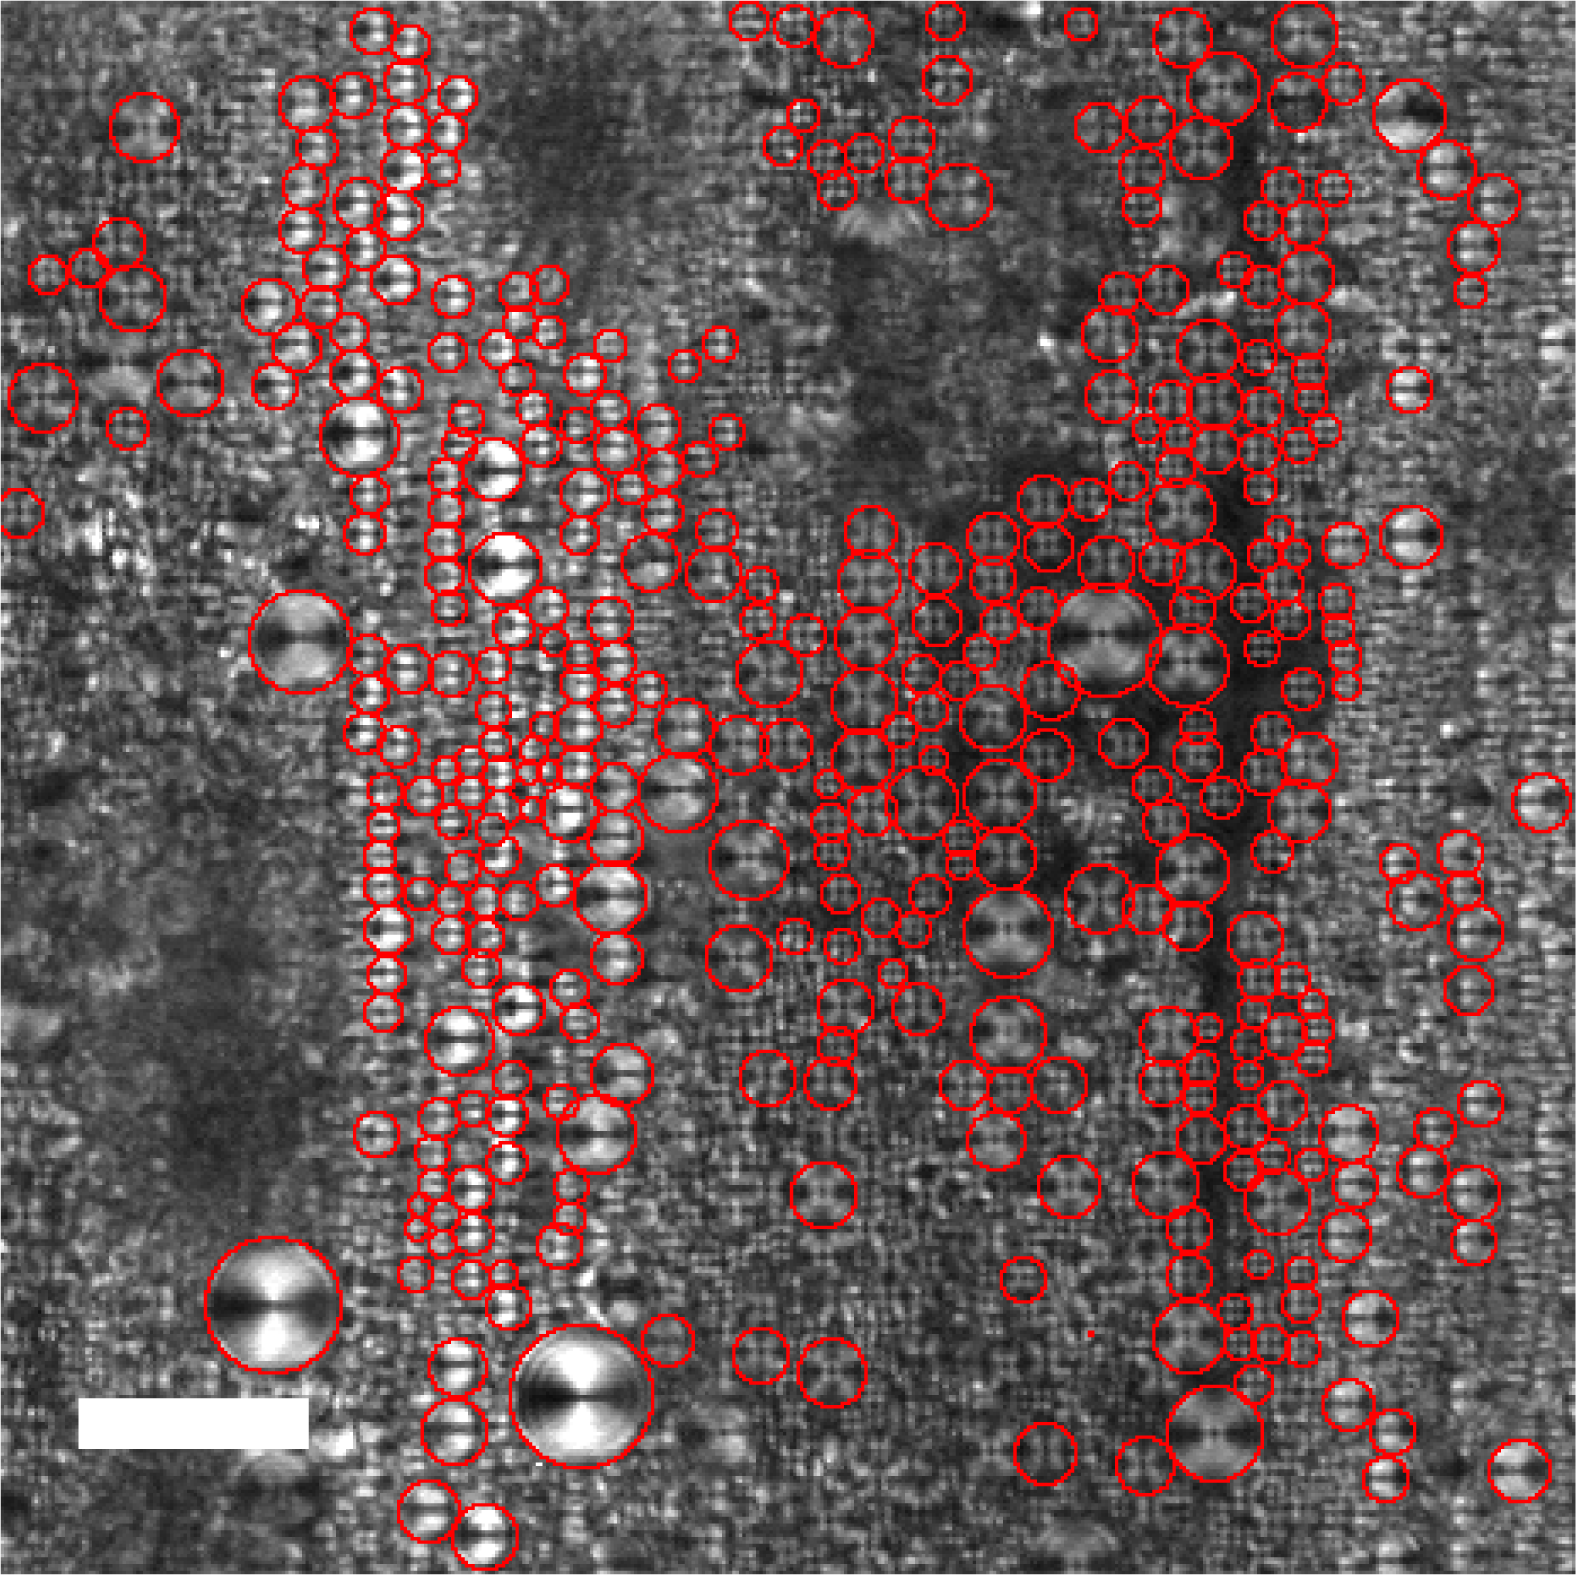
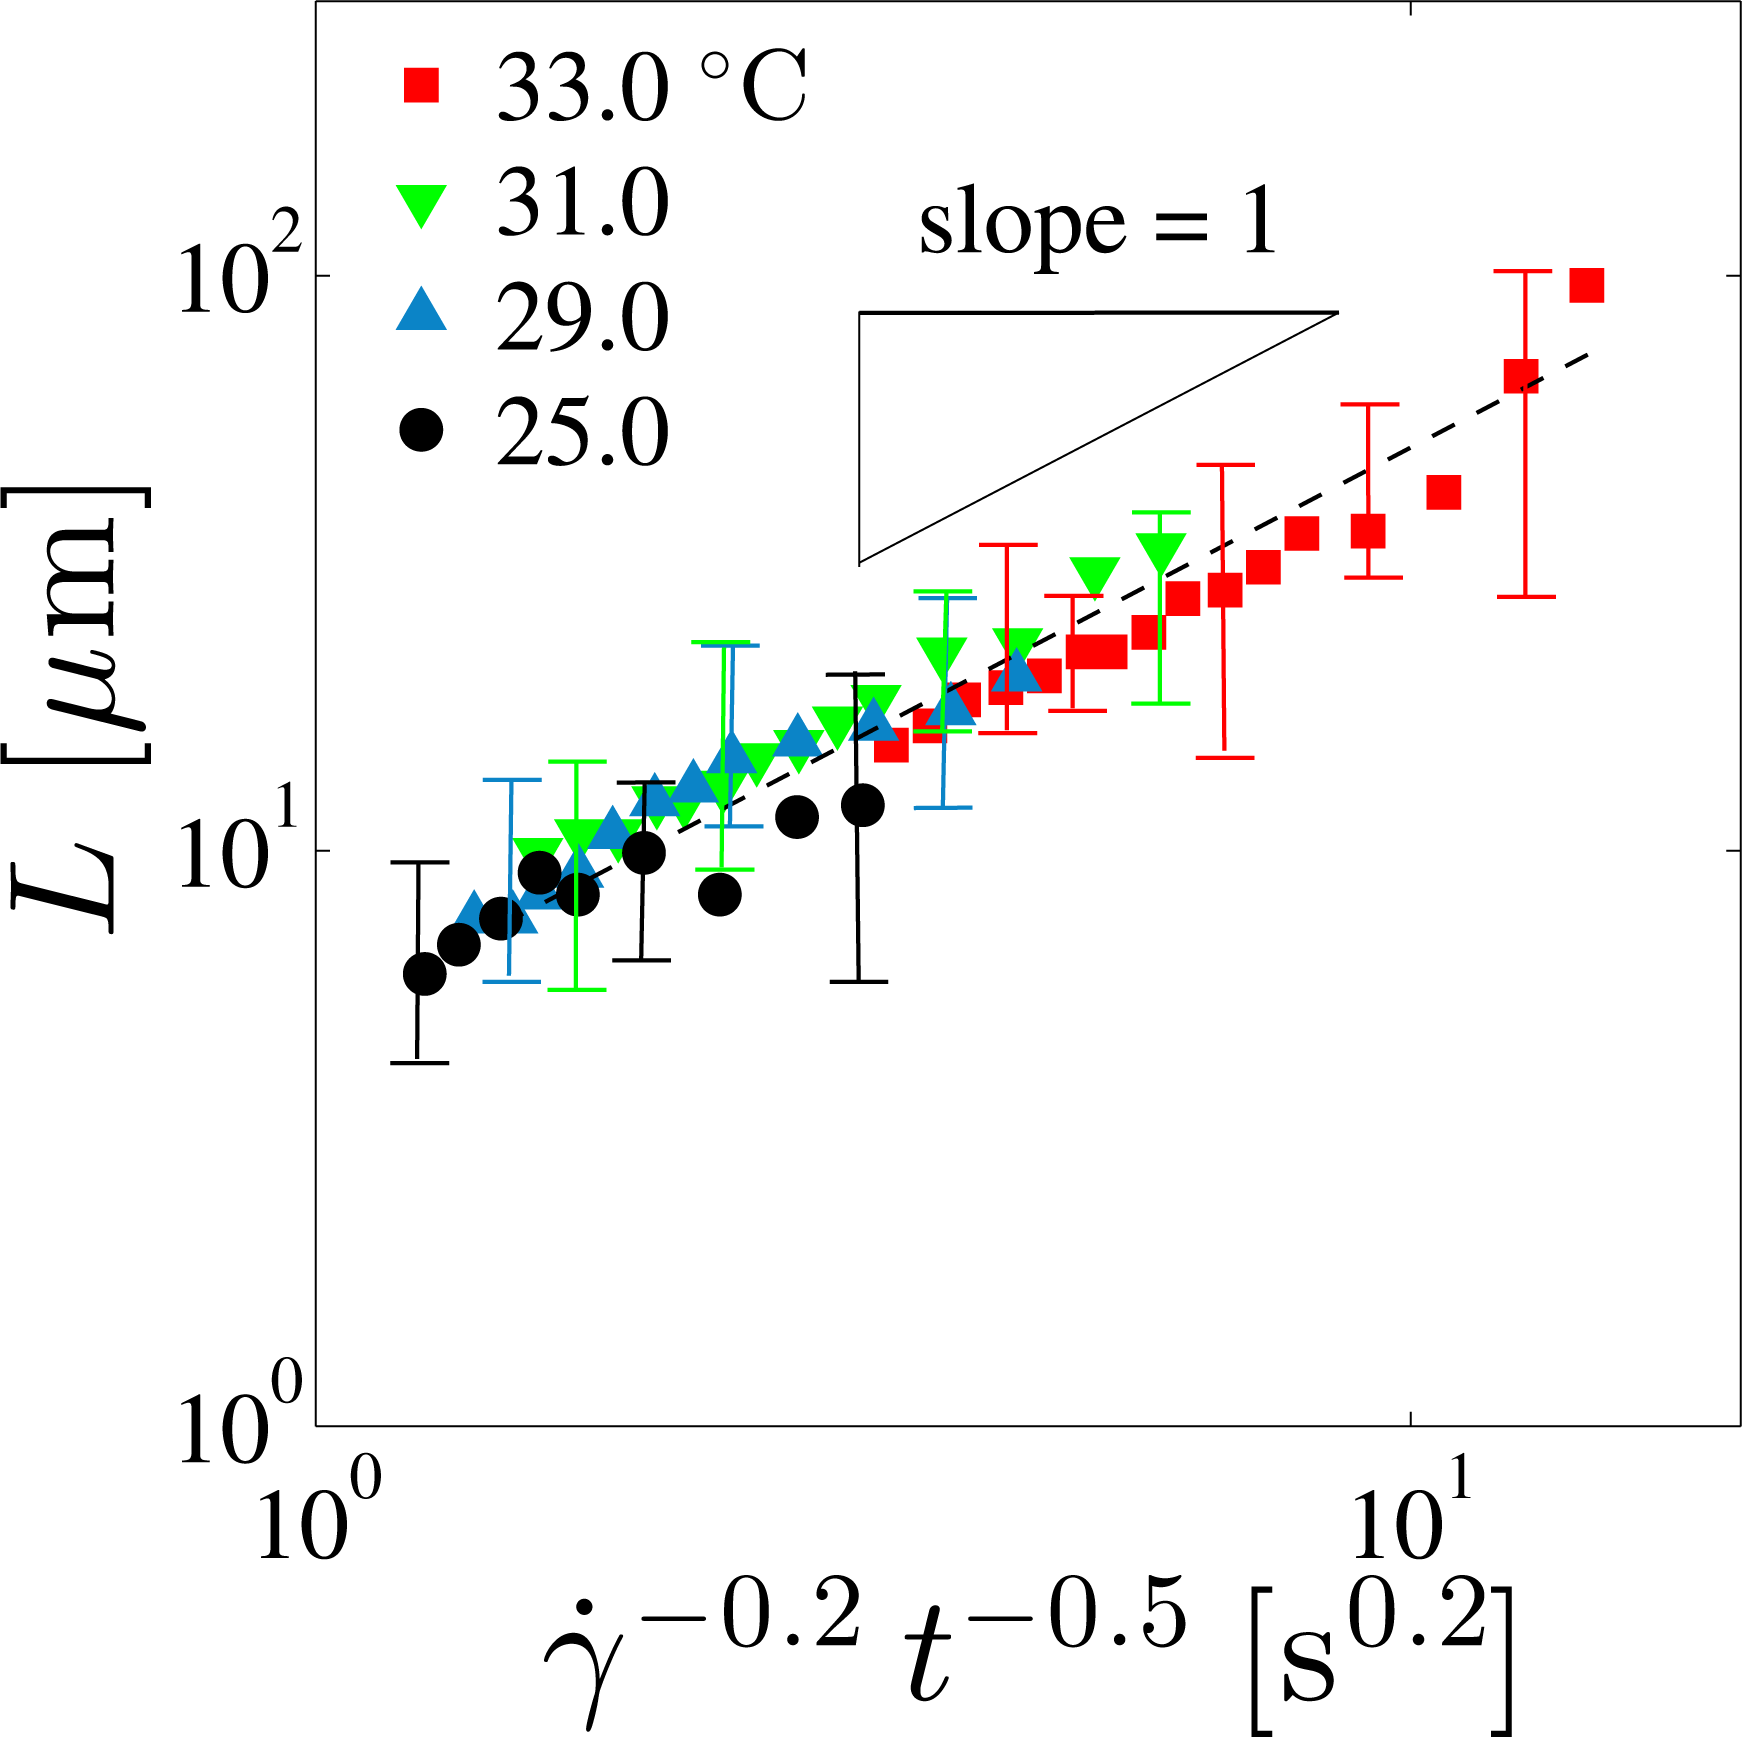
To systematically study the effects of the temperature and shear rate on the FCD size, it is necessary to determine the mean diameter L of FCDs. A microscope image taken under the shear rate γ̇=0.1 s−1 is presented in Figure 3 as an example in order to show how to obtain L. As shown in the figure, the average of L can be estimated by tracing the distinguishable outlines of the FCDs with circles. Some FCDs are not used because their boundary contrast is too low. These FCDs are located either above or below the focus plane. We calculate L as the number average within the focus plane region. Close to the transition temperature TSN, one expects that the correlation length of the fluctuation and the dislocation size behave similarly to obey the scaling law in terms of the reduced temperature t = (TSN − T)/TSN [55,56]. From our experiment, we found that L depends on t and γ̇ as L ∼ γ̇−0.2 (at each temperature) and L ∼ t−0.5 (at each shear rate), respectively. As presented in Figure 4, the FCD size L can be scaled by the combined variable γ̇−0.2t−0.5 .
Although there is no theory on the shear rate and/or temperature dependence of L, an analogous scaling relation with the same exponent was predicted for the defect spacing which varies as ∼ γ̇−0.2 [36,37]. Moreover, the average dislocation loop size diverges as ∼ t−0.5 according to the defect model by Helfrich [50]. We remind that dislocation loops are formed by pairs of edge and screw dislocations, and FCDs are linked by edge dislocations. Since the accumulation of the strain energy due to an increase in the defect density is the driving force for the FCD formation, the agreement of these exponents (0.2 and 0.5) suggests that the proliferation of dislocation loops controls the FCD size. Incidentally, it has been suggested that the non-equilibrium structural transition of lyotropic lamellar phase under shear is governed by the dislocation size [29].
4. Nonlinear Rheology of the Smectic Phase
It is known that the smectic phase exhibits both shear-thinning behavior and yield stress [24–26,28,35]. Although it has been anticipated that such rheological behavior is influenced by defects [41,42], we have further shown in the previous section that these structures are FCDs which originate from dislocation loops. In this section, we discuss how the presence of FCDs are reflected in the rheology of the smectic phase [16].
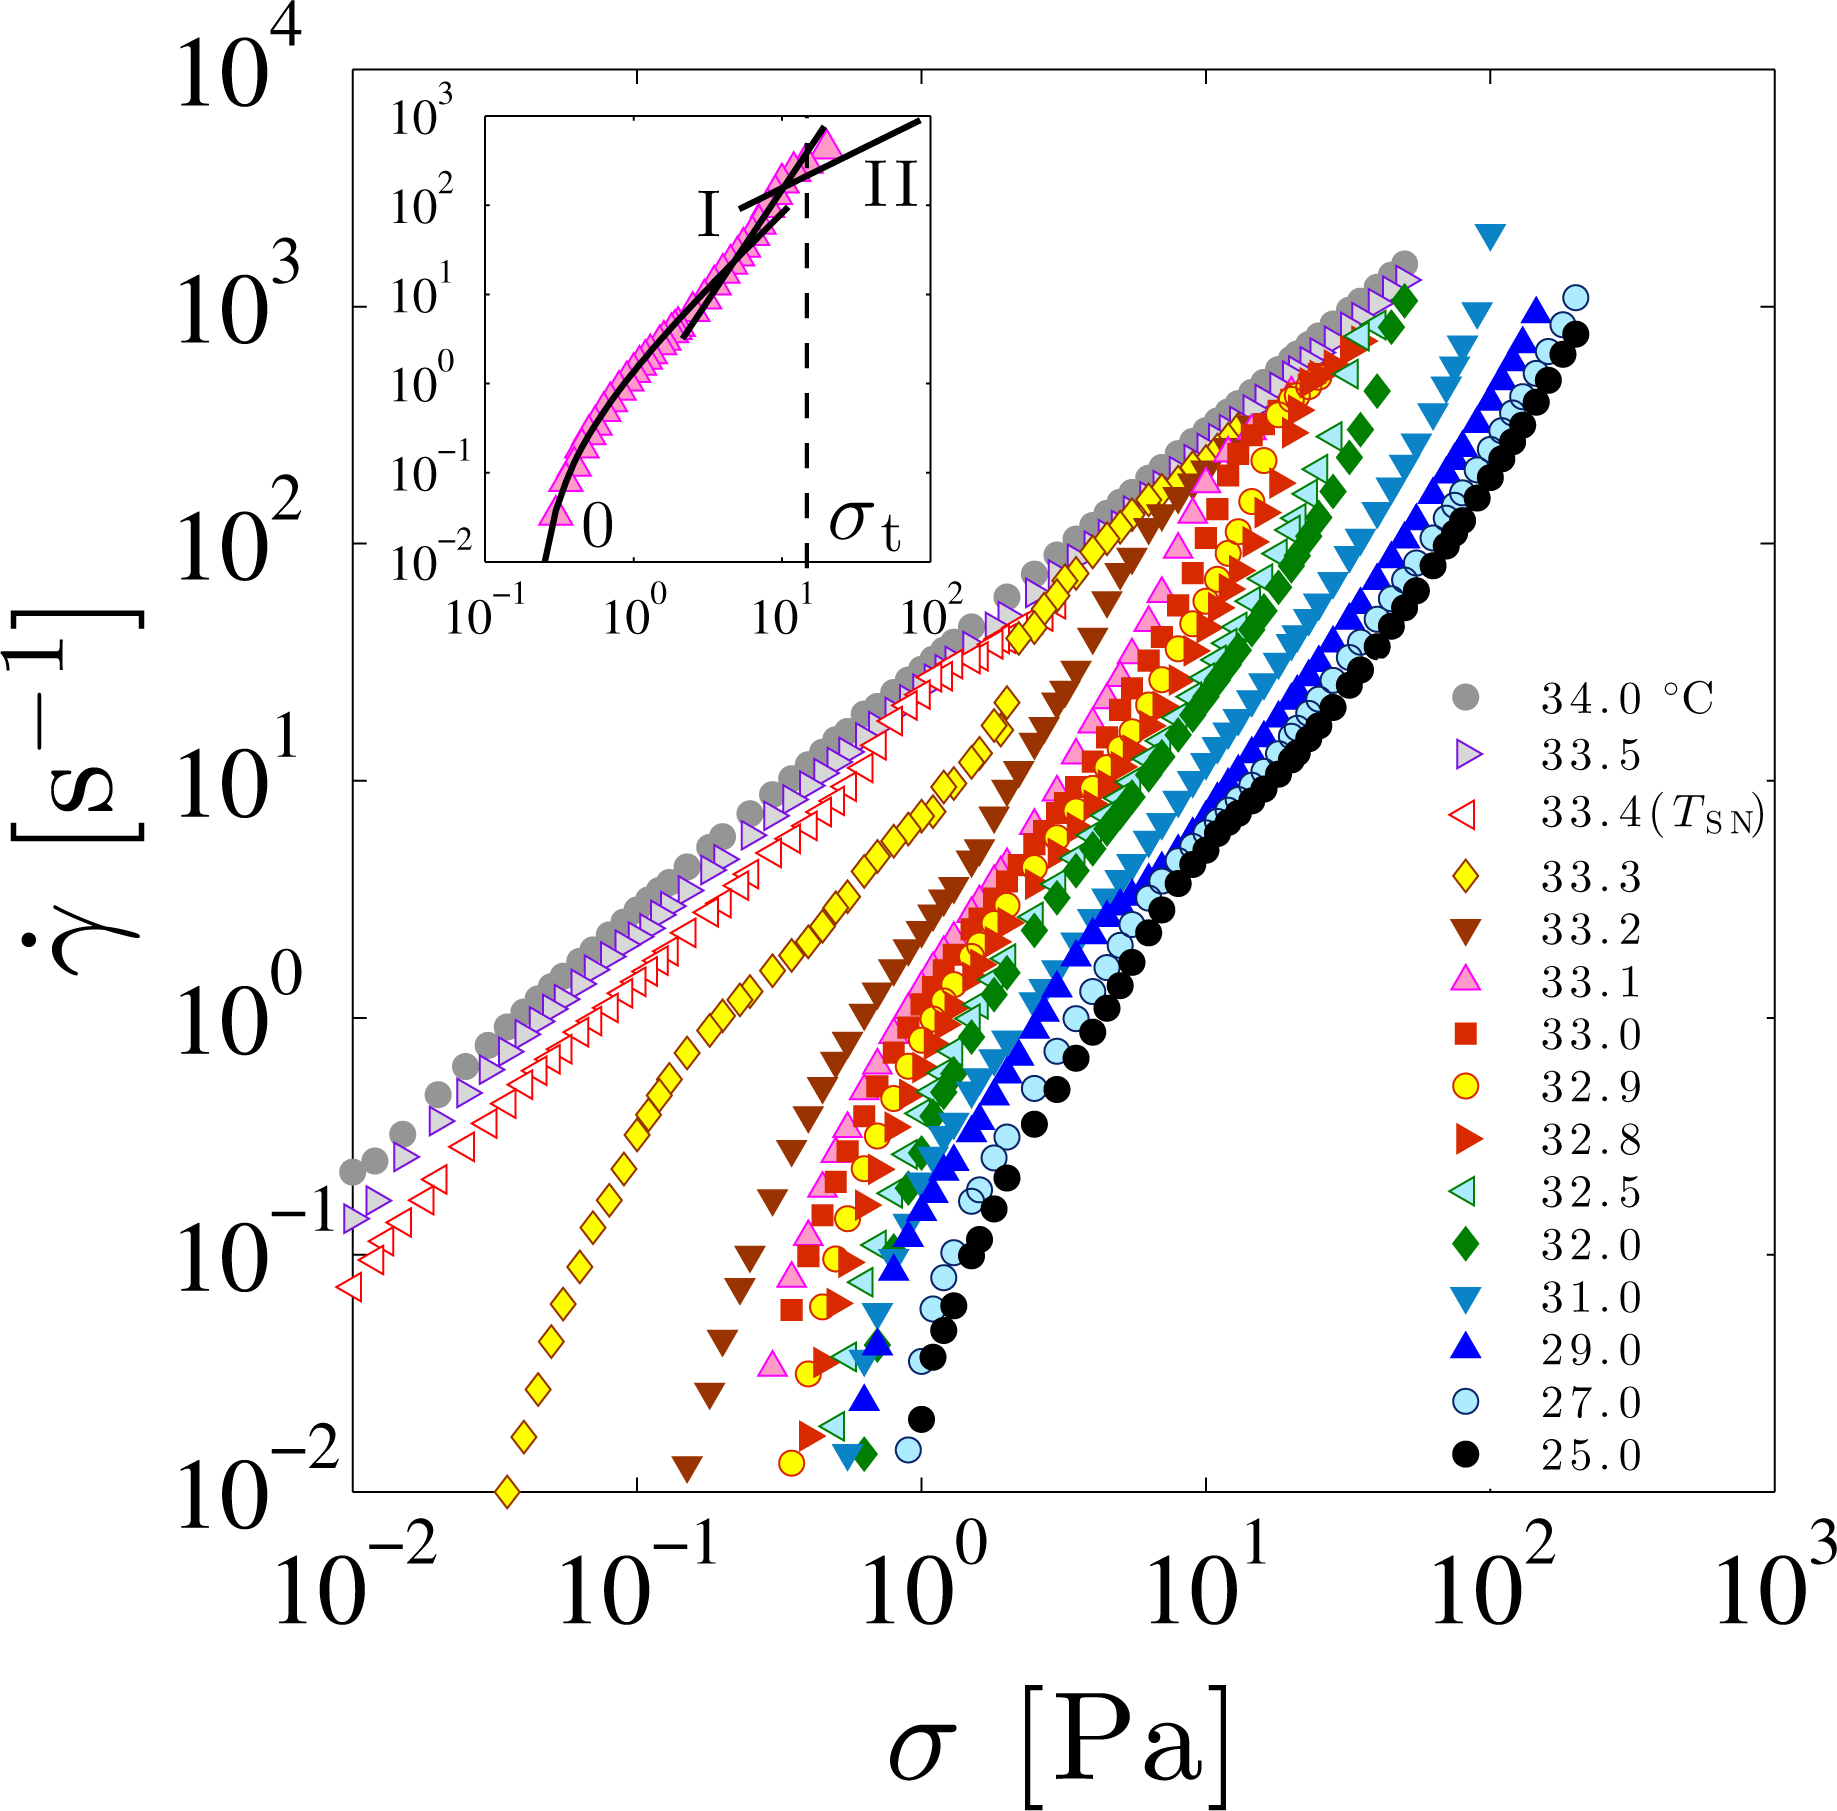
Figure 5 shows the flow curves in the temperature range from 25.0 °C to 34.0 °C across the SN-transition temperature TSN =33.4 °C. These flow curves are obtained by measuring the steady-state value of the shear rate γ̇ when various values of the shear stress σ are applied. Within the power-law behavior γ̇ ∼ σm, m > 1 and m = 1 correspond to the shear-thinning and the Newtonian behaviors, respectively. Since m > 1 for T < TSN, the smectic phase exhibits a shear-thinning behavior.
It should be noted that the flow curves are not fully described by a single power-law since the slope in Figure 5 gradually changes as a function of the shear stress. Colby et al. [24] also observed a similar behavior of the flow curve. In order to discuss the nonlinear rheological response in more detail, we focus on the flow curve at T =25.0 °C as a typical example. First we realize that this flow curve reaches to a finite stress value when the shear rate is extrapolated to zero. This means that there is a yield stress σy, below which the flow ceases. Previously, Horn and Kleman [35] or Colby et al. [25] reported that the smectic phase shows the yield stress. The flow curves for other temperatures also exhibit yield stress; it decreases at higher temperatures and vanishes at TSN. Furthermore, focusing on the high-shear flow curves near the transition point (e.g., T =33.0 °C), we see that the rheological behavior changes from shear-thinning to Newtonian at a specific shear stress. The corresponding threshold stress value σt required to become Newtonian shifts toward the lower value when approaching TSN. In the nematic phase at higher temperatures, only Newtonian behavior is observed.
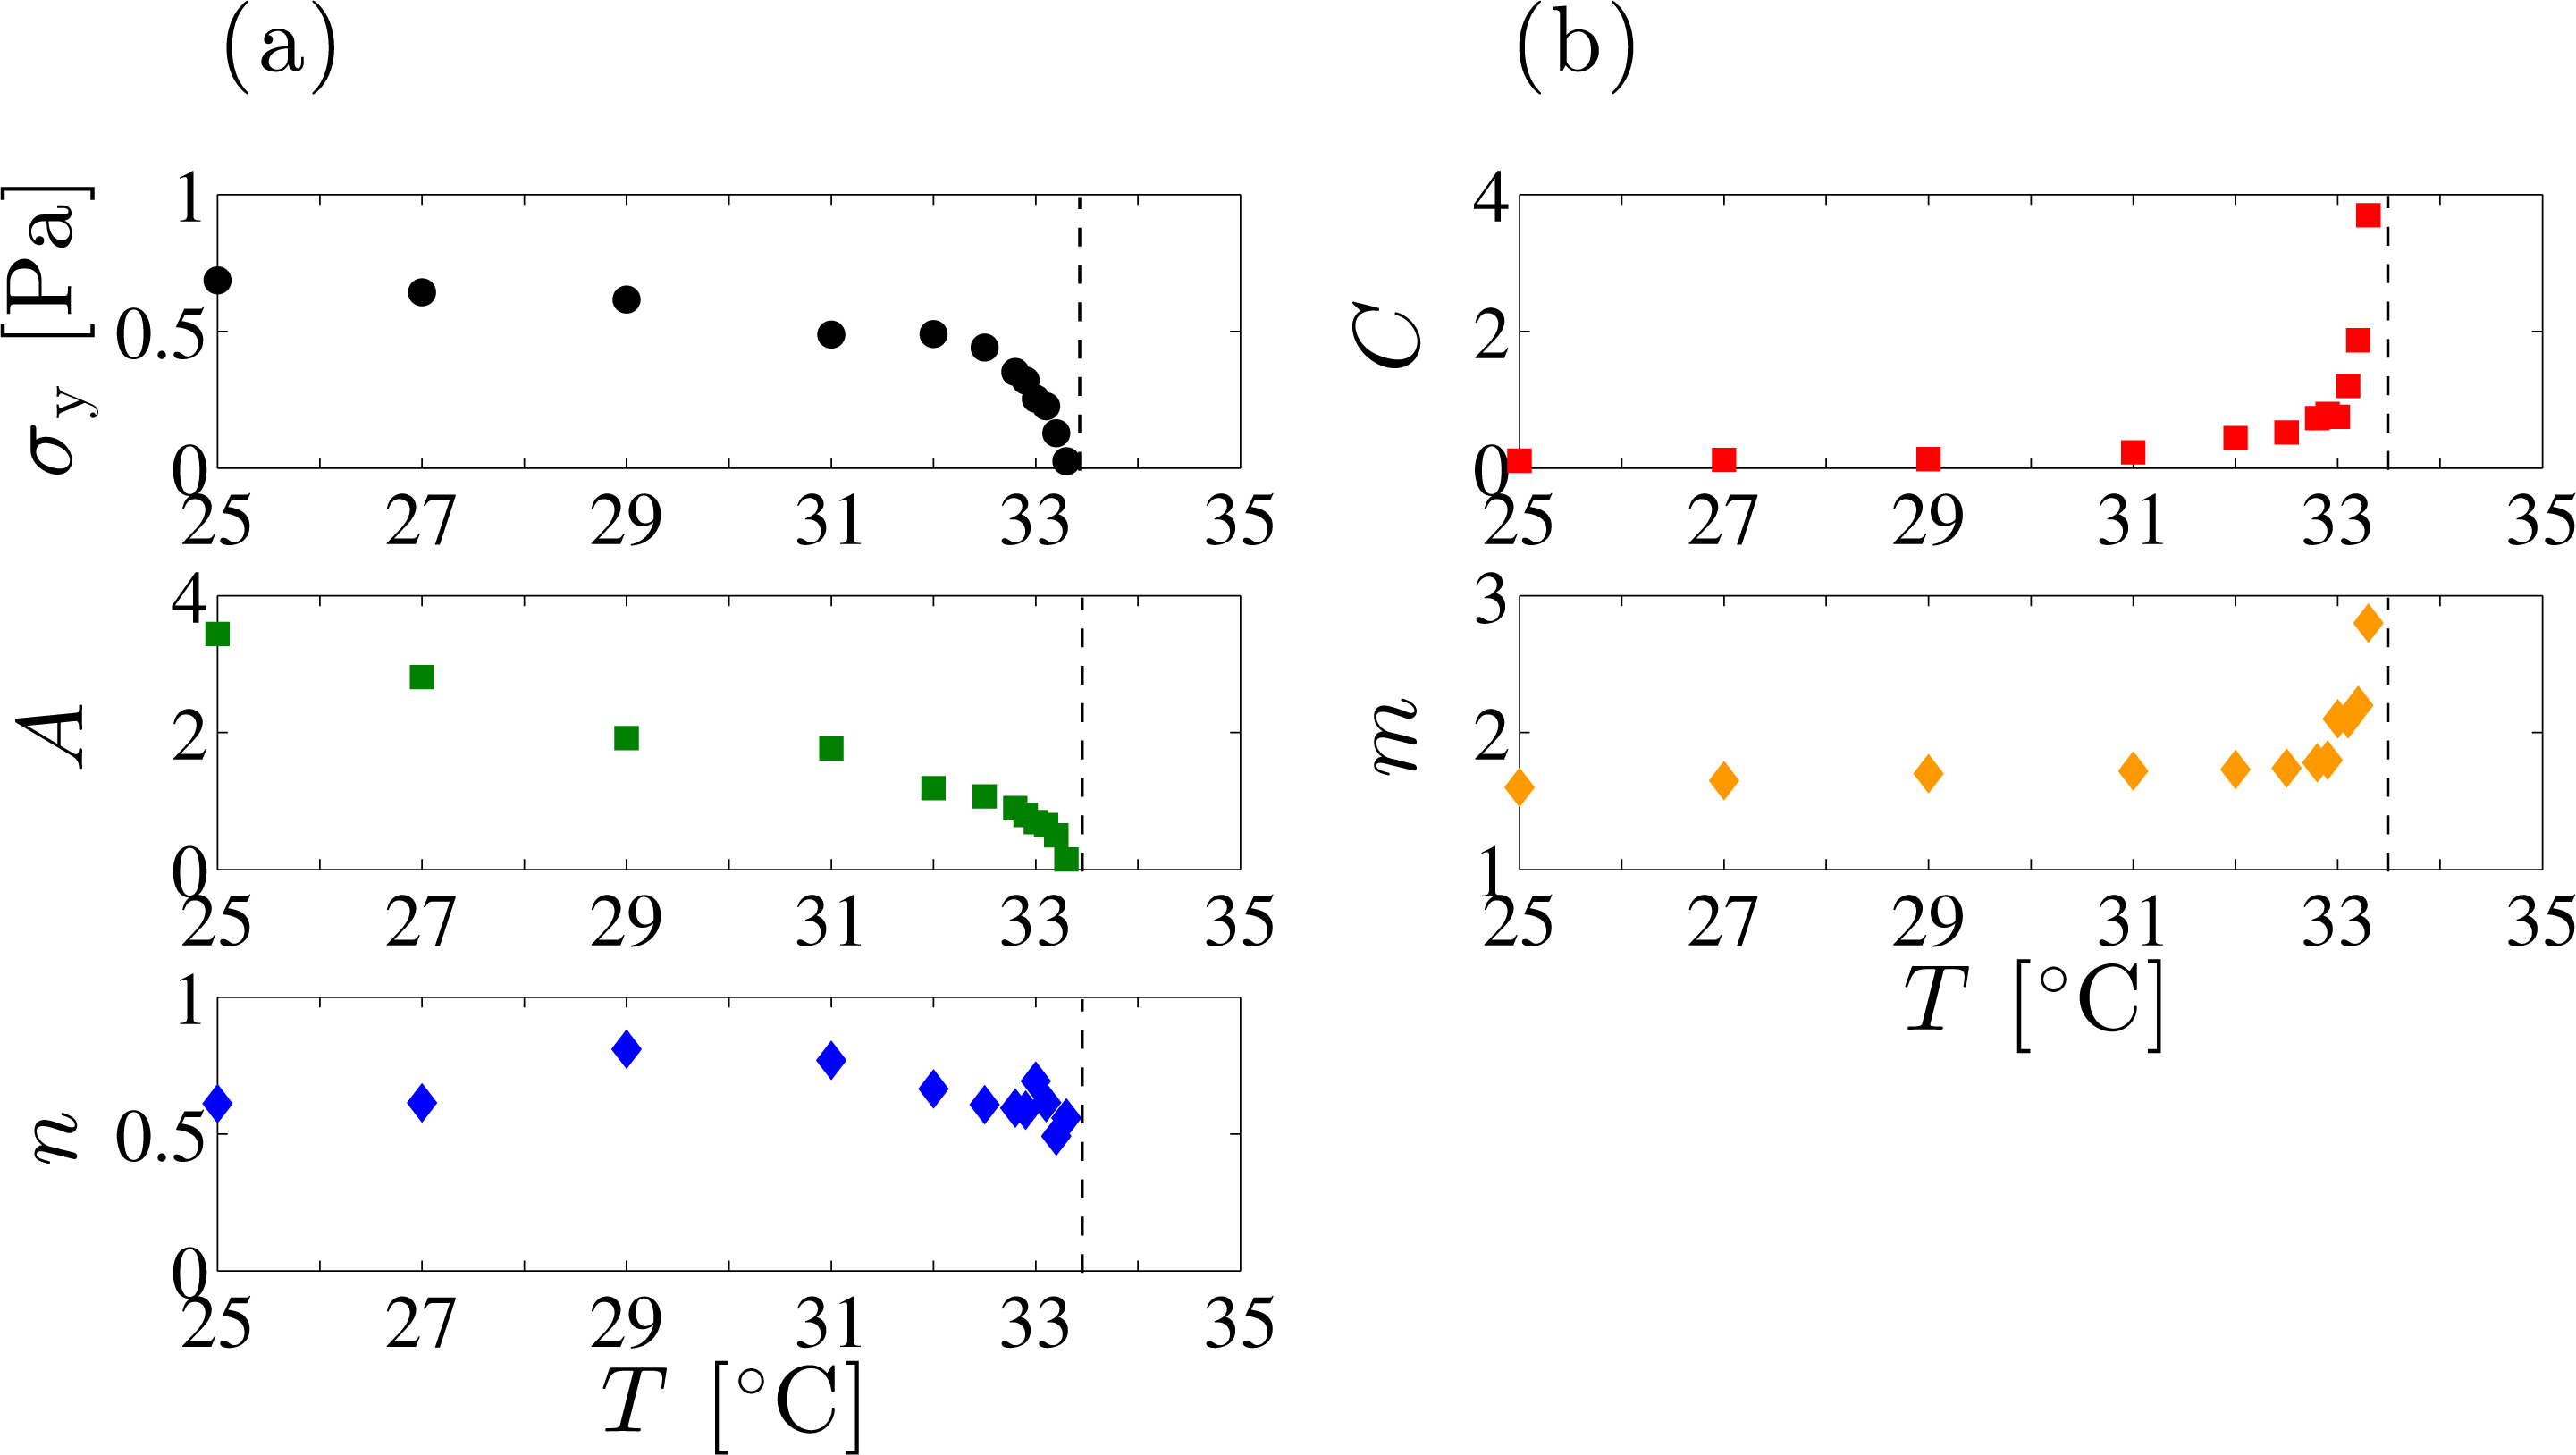
To extract the temperature dependence of the power-law exponent and the yield stress, the flow curve was divided into three regions: shear-thinning region (Regime 0) showing the yield stress, shear-thinning region (Regime I) described by a power-law, and Newtonian region (Regime II). Notice that σt represents the boundary value between Regime I and Regime II. To estimate the yield stress in Regime 0, we use the empirical Herschel-Bulkley (HB) model
The temperature dependence of each parameter is summarized in Figure 6. Whereas σy and A rapidly decrease and vanish at TSN, the exponent n does not show a simple temperature dependence. On the other hand, C and m are almost constant up to around T =32.0 °C and show a significant increase as TSN is approached from below. The abrupt increase of C and m near TSN indicates that the enhanced critical fluctuation or the proliferation of dislocation loops significantly affects the shear-thinning behavior. The shear-thinning exponent m ≈ 1.7 obtained at the low-temperature region coincides with the theoretically predicted exponent m = 5/3 by Kleman et al. [36,37].
As discussed in the previous section, the growth of dislocation loops causes the increase of the FCD size. Horn and Kleman employed a dimensional argument to relate the yield stress σy and the FCD size L by σy ∼ K/L2, where K is the bending modulus of the smectic phase [35]. Notice that the value of K is only weakly dependent on the temperature [60]. According to this relation, we see that a decrease of σy near TSN corresponds to a rapid increase of L. Qualitatively, this temperature dependence of L agrees with the direct observations of FCDs in Figures 2 and 4. Hence we expect that the growth of dislocation loops influences the temperature dependence of σy through the increase of the FCD size. We shall further discuss the elasticity of FCDs in the next section.
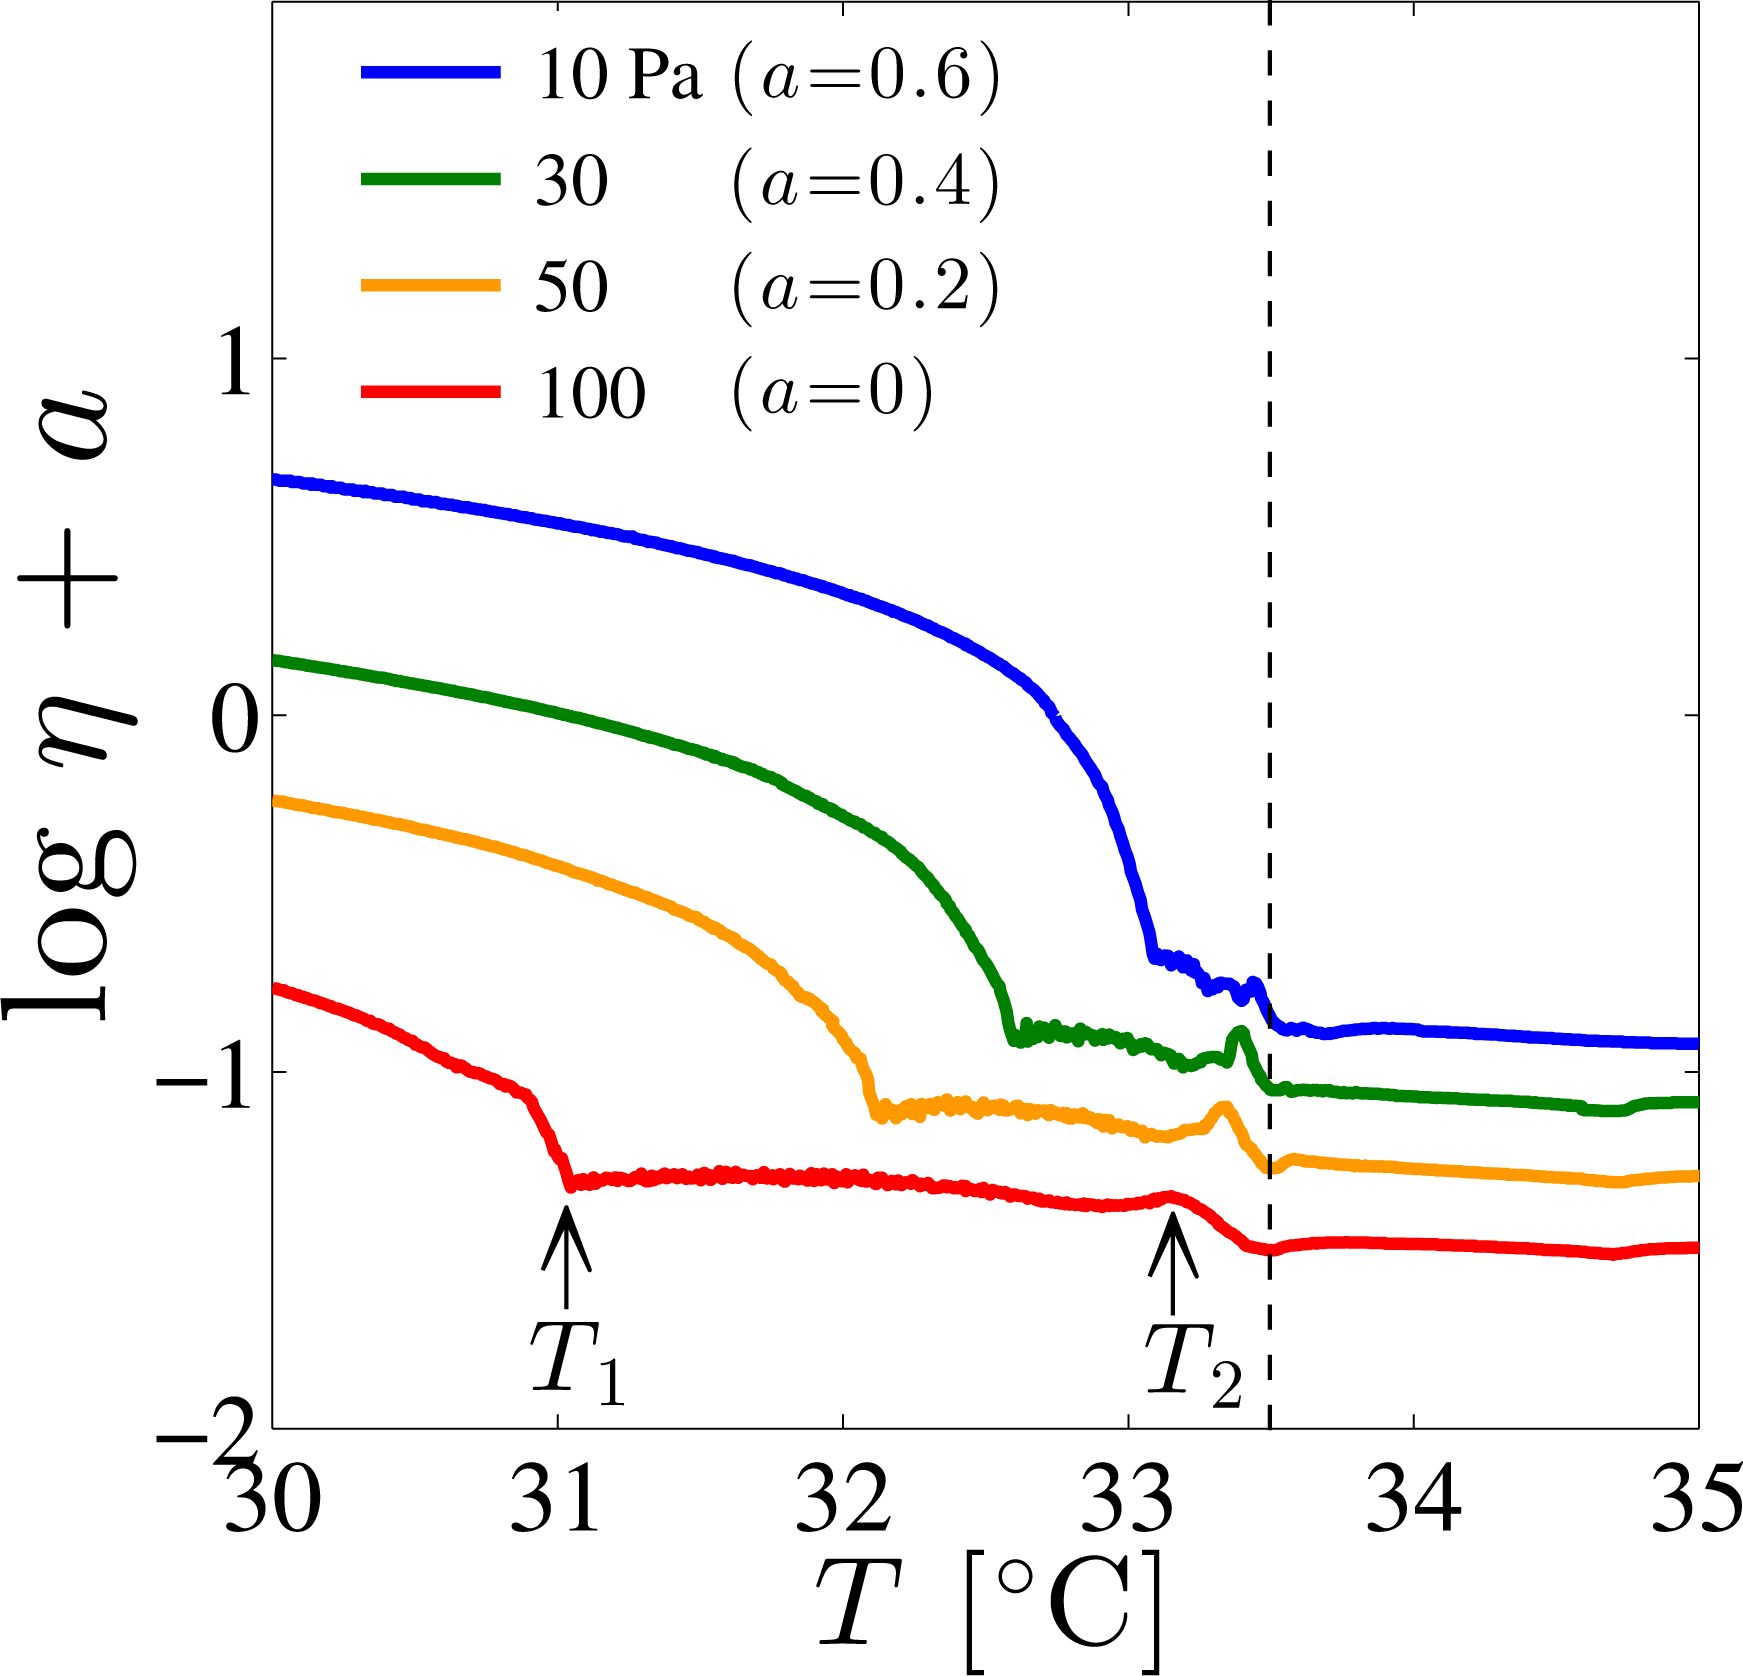
Next we discuss the transition from shear-thinning (Regime I) to Newtonian behavior (Regime II) using the dynamic phase diagram. In addition to σt obtained from Figure 5, the temperature dependence of the viscosity η under constant shear stress was measured to construct non-equilibrium phase diagram. The temperature dependence of η measured at shear stress of σ =10, 30, 50, and 100 Pa is shown in Figure 7. Several results are found; (i) at low temperatures, η decreases as the temperature increases; (ii) above a certain temperature T1, η is almost constant; and (iii) at T2 slightly lower than TSN, a peak is observed. The two characteristic temperatures T1 and T2 shift toward lower values as the shear stress is increased.
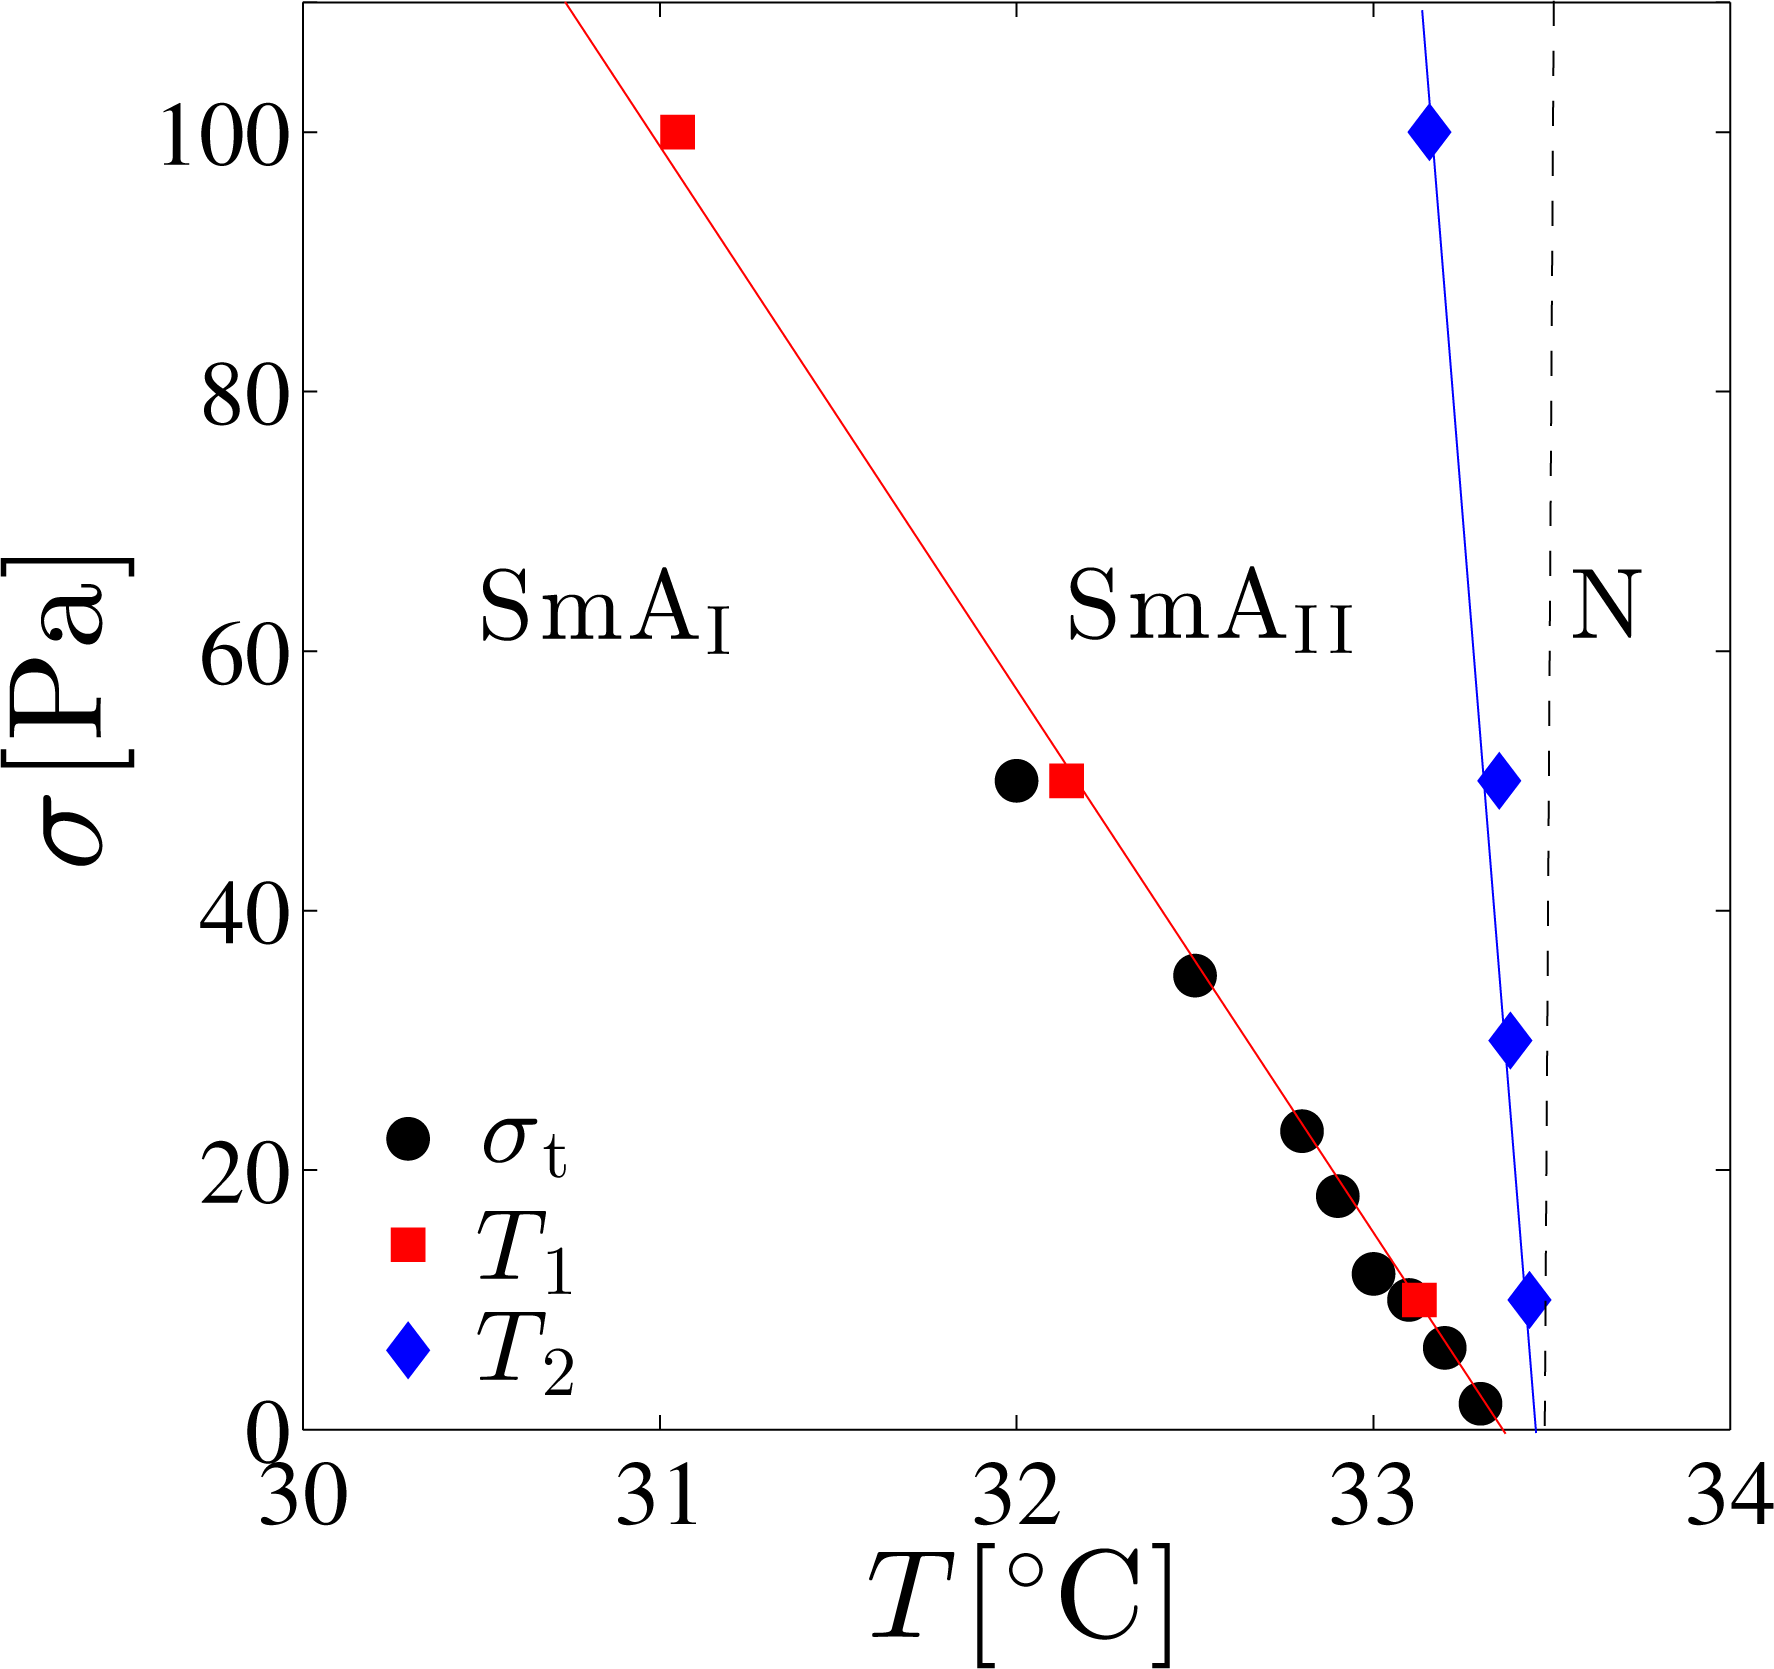
The above results are summarized in the dynamic phase diagram presented in Figure 8. Here we find that the shear stress dependence of T1 and the temperature dependence of σt are almost identical to each other. Furthermore, both T1 and T2 change linearly with respect to σ. The temperature estimated by extrapolating T1 and T2 to zero shear stress coincides with TSN at quiescent state, and the phase diagram can be divided into three regimes. Comparing with the flow curves of Figure 5 and the temperature dependence of η in Figure 7, we see that the low-temperature region (T ≤ T1) corresponds to the shear-thinning region (Regime I), while the temperature region T1 ≤ T ≤ T2 exhibits the Newtonian behavior (Regime II). For convenience, these two regions are denoted by “SmAI phase” and “SmAII phase”, respectively.
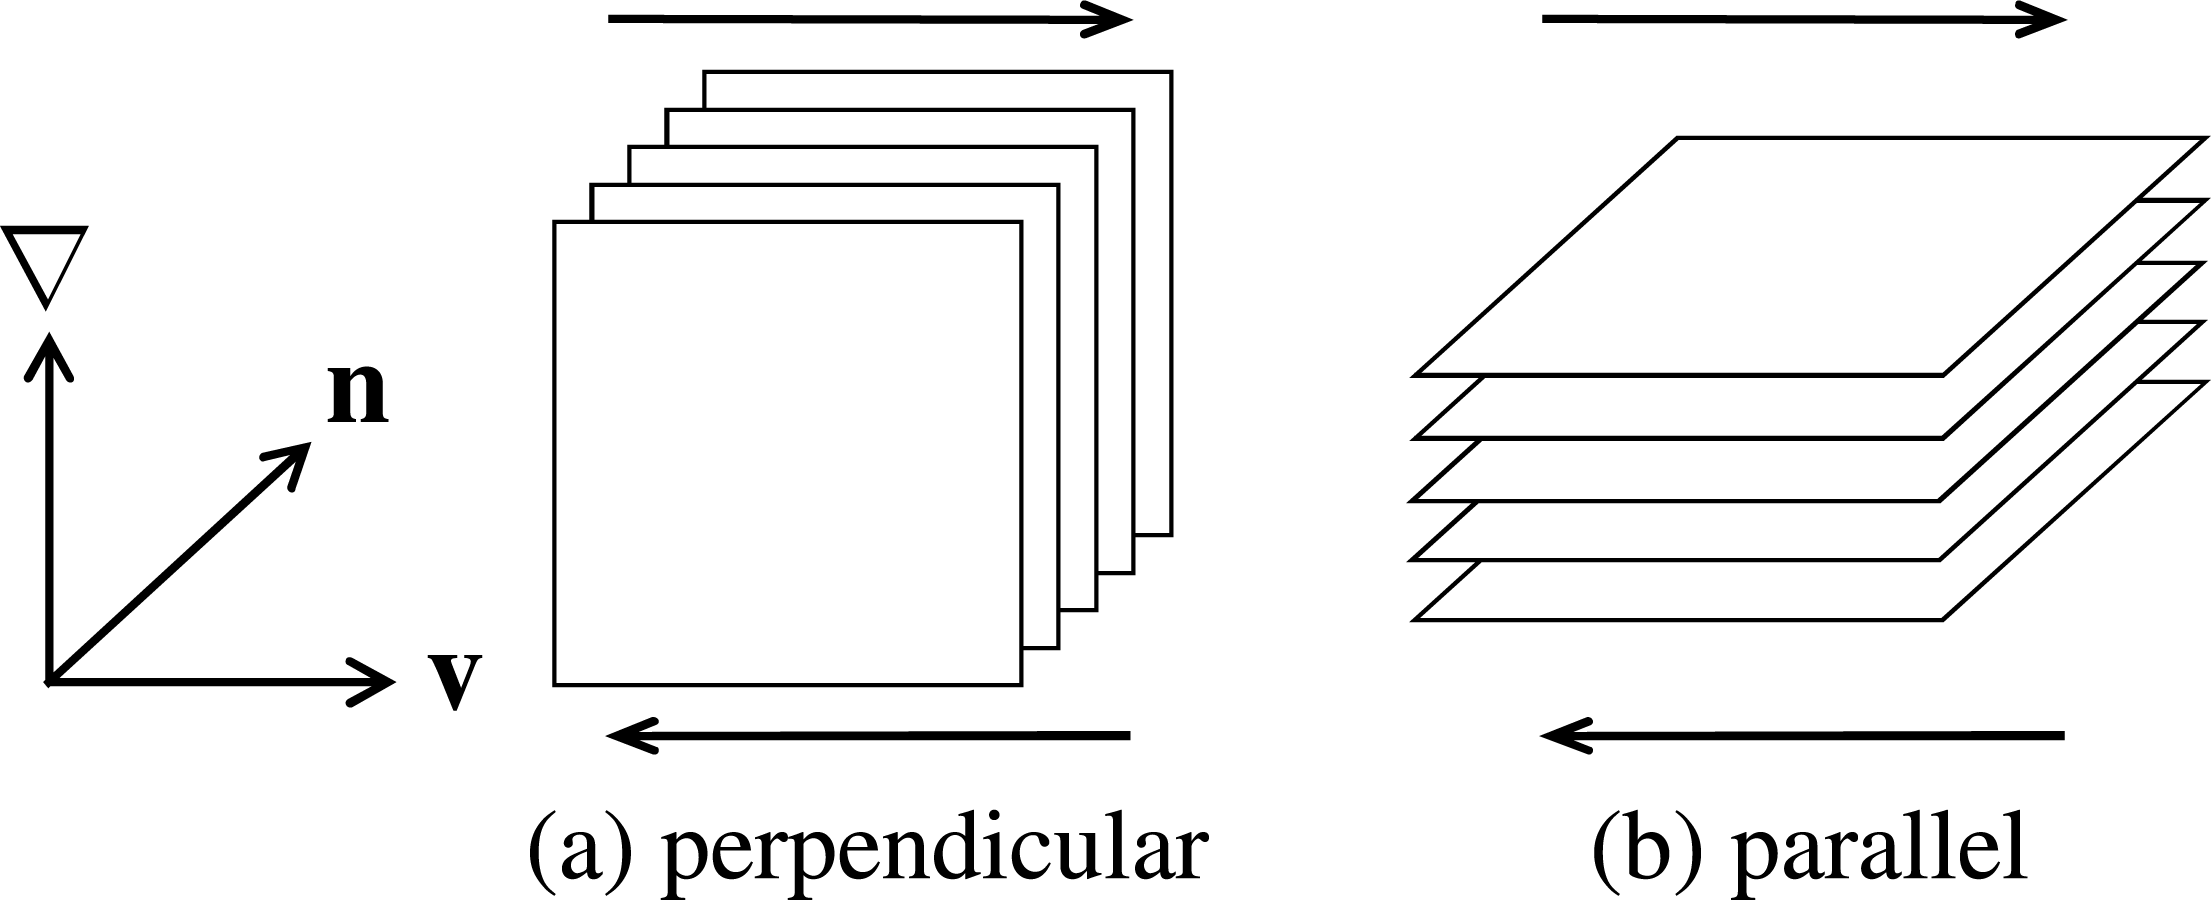
Previously, dynamic orientation diagram of the smectic phase was constructed with the use of rheo-physical methods such as small angle X-ray scattering under shear flow by Safinya et al. [27] and Panizza et al. [26], or rheo-dielectric measurement by Negita et al. [61]. Our dynamic phase diagram qualitatively agrees with their results. Although Safinya et al. [27] and Negita et al. [61] presented their diagrams as a function of the temperature and the shear rate, we also confirmed that our diagram roughly coincides with them by mapping the shear stress to the shear rate using the flow curves in Figure 5. As shown in Figure 9, it is known that two orientation states are possible in the smectic phase: perpendicular orientation in which the layer normal is perpendicular to both the velocity gradient and flow direction, and parallel orientation in which it is parallel to the velocity gradient direction [62,63].
Since the dynamic phase diagram obtained in Figure 8 and the orientation diagrams based on rheo-physical methods coincide, SmAI phase is a mixture of the perpendicular and parallel orientations, or a leak structure for which layers are cylindrically rounded [26]. On the other hand, SmAII phase consists of the perpendicular orientation. From this finding, we realize that the rheological behavior and the layer orientation are closely linked to each other. Furthermore, since T2 coincides with TSN for sufficiently low-shear stress (σ =10 Pa), we anticipate that the peak in η reflects the precession motion of the monomers in the SN-transition [27,61]. The shift of T2 toward lower temperatures when subjected to high-shear stress implies that the SN-transition is induced by the shear flow. In addition to the proliferation of dislocation loops in thermal equilibrium state, the shear-induced SN-transition is due to the creation of non-equilibrium dislocation loops caused by the shear flow. The shear-induced SN-transition originates from the unbinding of dislocation loops which are created both under equilibrium and out-of-equilibrium conditions. A rich rheological behavior associated with the shear-induced layer orientation has been also found in the lyotropic lamellar phases [64–66].
5. Linear Viscoelasticity of the Smectic Phase
In this section, we discuss the influence of FCDs on the linear viscoelasticity of the smectic phase [17]. We also argue the physical origin of the elasticity of the smectic phase with FCDs. As described in the previous section, the dynamical smectic phase changes from the SmAI phase to SmAII phase as a function of the shear stress and temperature. Since the SmAII phase exhibits only Newtonian behavior, we mainly concentrate on the viscoelasticity of the SmAI phase.
In rheological measurements, the shear modulus G can be obtained by the ratio between the shear stress σ and the strain γ as G = σ/γ. On the other hand, σ is given by the product of the viscosity η and the shear rate γ̇, i.e., σ = ηγ̇. Viscoelastic materials exhibit both elastic and viscous responses which can be measured by applying oscillating strain with an angular frequency ω and an amplitude of γ0; γ = γ0 sin(ωt). The dynamic storage modulus G′ and the loss modulus G″ are determined by the following relation:
Figure 10 shows the frequency dependence of G′ and G″ measured after the system is subjected to a given pre-shear stress. For all temperatures, G′ is always larger than G″. Moreover, a plateau region is observed in the low-frequency range, as Colby et al. also reported [24]. This solid-like viscoelastic behavior is strongly correlated with the defect density. In fact, Larson et al. [28] showed that both G′ and G″ decrease when the defects are removed by applying a large amplitude oscillatory shear. Hence the plateau modulus reflects the defect density.
Concerning the pre-shear stress dependence of the plateau value of G′ (denoted as G0) at different temperatures, G0 becomes larger with increasing the pre-shear stress. However, as the temperature approaches to TSN such as at T =33.0 °C, it decreases at high pre-shear stress and deviates from a simple scaling suggested in Figure 11. Comparing the pre-shear stress dependence of G0 to Figures 5 and 8, we notice that the shear stress value where G0 decreases is located near the boundary between the SmAI and the SmAII phases. Thus, the plateau value of G′ reflects the defects associated with orientations of the layers. As discussed before, FCDs fill the SmAI phase under shear flow, whereas they are not observed in the SmAII phase. Hence, FCDs dominate the elasticity of the SmAI phase. Once the orientation transition of the smectic layers takes place to become SmAII, the elasticity due to FCDs vanishes.
Similar to the temperature dependence of the yield stress, G0 also decreases as TSN is approached. Since the FCD size L influences the shear modulus G, a similar scaling behavior found in Figure 4 is expected to hold. Here the value of G′ at ω =0.1 s−1 was chosen as G0 which is plotted in Figure 11 as a function of the combined variable of γ̇ and t. Adopting the result of Figure 5, the measured steady shear rate γ̇ for each applied pre-shear stress σ can be used for the scaling plot. To obtain the scaling plot for G0, we first determined the power-law dependence G0 ∼ γ̇0.2 at each temperature. Then the power-law behavior of G0 as a function of t with an exponent 0.7 was extracted so that all the data points fall onto a straight line with a slope of unity, i.e., G0 ∼ γ̇0.2t0.7. Except for the data close to the border between the SmAI and SmAII phases, all G0 values fall on a straight line. Below, we discuss the physical meaning of these scaling behaviors for G0 and L.
When comparing the two scaling relations G0 ∼ γ̇0.2t0.7 and L ∼ γ̇−0.2t−0.5 obtained from independent measurements, it appears that G0 is almost inversely proportional to L, G0 ∼ 1/L, although the temperature exponent is slightly different. In order to satisfy this relation, the proportionality coefficient on the right hand side must have the dimension of surface tension, i.e., energy per unit area. For layered systems such as the smectic phase or the lamellar phase, de Gennes and van der Linden proposed an effective surface tension given by , where K and B are the bending and the compression moduli, respectively [55,67,68]. Here the numerical pre-factor is dropped. Thus the plateau shear modulus of the smectic phase G0 should obey the following relation:
Based on our experimental result, we conclude that the physical origin of the elasticity in the smectic phase is the effective surface tension of the FCDs. An analogous picture also holds for the elasticity of concentrated emulsions [69,70]. Furthermore, a similar relation to Equation (4) has also been observed for the onion phase in surfactant solutions which can be identified with FCD-II [71,72]. The proportionality coefficient C′ for the onion phase is about C′ ≈ 0.4 – 1.2, which is fairly close to C′ =0.456/1.97 ≈ 0.23 obtained for the FCDs. The relatively small value of C′ for 8CB may be due to the polydispersity of the FCD size. We mentioned before that FCD-I can be observed not only in the thermotropic smectic phase but also in the lyotropic lamellar phase, while FCD-II appears only in the lyotropic systems. Formation of these textures depend both on the bending and the Gaussian moduli. As shown in Figure 1, the main geometrical difference between FCD-I with toroidal shape and FCD-II with spherical shape is the sign of the Gaussian curvature. Therefore, the energy cost for the deformation of FCDs, as determined by , dominates the elasticity in these two systems in spite of the geometrical difference. We expect that the origin of elasticity is a universal feature that is common to different layered systems.
Equation (4) for the elastic modulus G0 is different from the relation for the yield stress σy ∼ K/L2 predicted by Horn and Kleman [35]. It should be noted, however, that G0 in our case was measured within a linear regime, whereas the non-linear effect cannot be ignored in the estimation of yield stress. Generally, the shear modulus and the yield stress are not proportional to each other.
6. FCD Formation Induced by Shear Quench
In the previous sections, we mentioned that the FCDs induced by the unbinding of dislocations influence the viscoelasticity of the smectic phase. In this section, we explain our results in the non-equilibrium FCD formation when the system is subjected to shear stress-quench from high to low values [18]. Some studies on the FCD formation behavior under shear have been also reported [73,74].
Microscope images in Figure 12a,b show the time sequences of snap shots after quenching the system from σ =85 to 0.1 Pa at T =33.0 °C, and from σ =85 to 1.5 Pa at T =31.0 °C, respectively. Comparing with the dynamic phase diagram in Figure 8, one sees that conditions of the stress-quench in (a) correspond to the FCD formation starting from the SmAII phase, while (b) is the FCD growth inside the SmAI phase. The brightness in the image represents the birefringence intensity.
The microscope image at t =0 s in Figure 12a is considerably bright because of the perpendicular orientation of the smectic layers [16,26,27]. After the stress-quench, the birefringence intensity quickly decays within a few seconds. Such a relaxation of the birefringence is caused by a flip of smectic layers from the perpendicular orientation to the parallel one. After the relaxation, a parabolic pattern appears around t =50 s, showing the appearance of FCDs whose number density increases as a function of time. At t =0 s in Figure 12b, on the other hand, the birefringence intensity is inhomogeneous. In later times, we see parabolic patterns as well as circular objects which are also FCDs with smaller sizes. There is a distribution of the FCD size, and the population of larger sizes increases with time. Around t =900 s in both cases, there are large FCDs aligned along the flow direction.
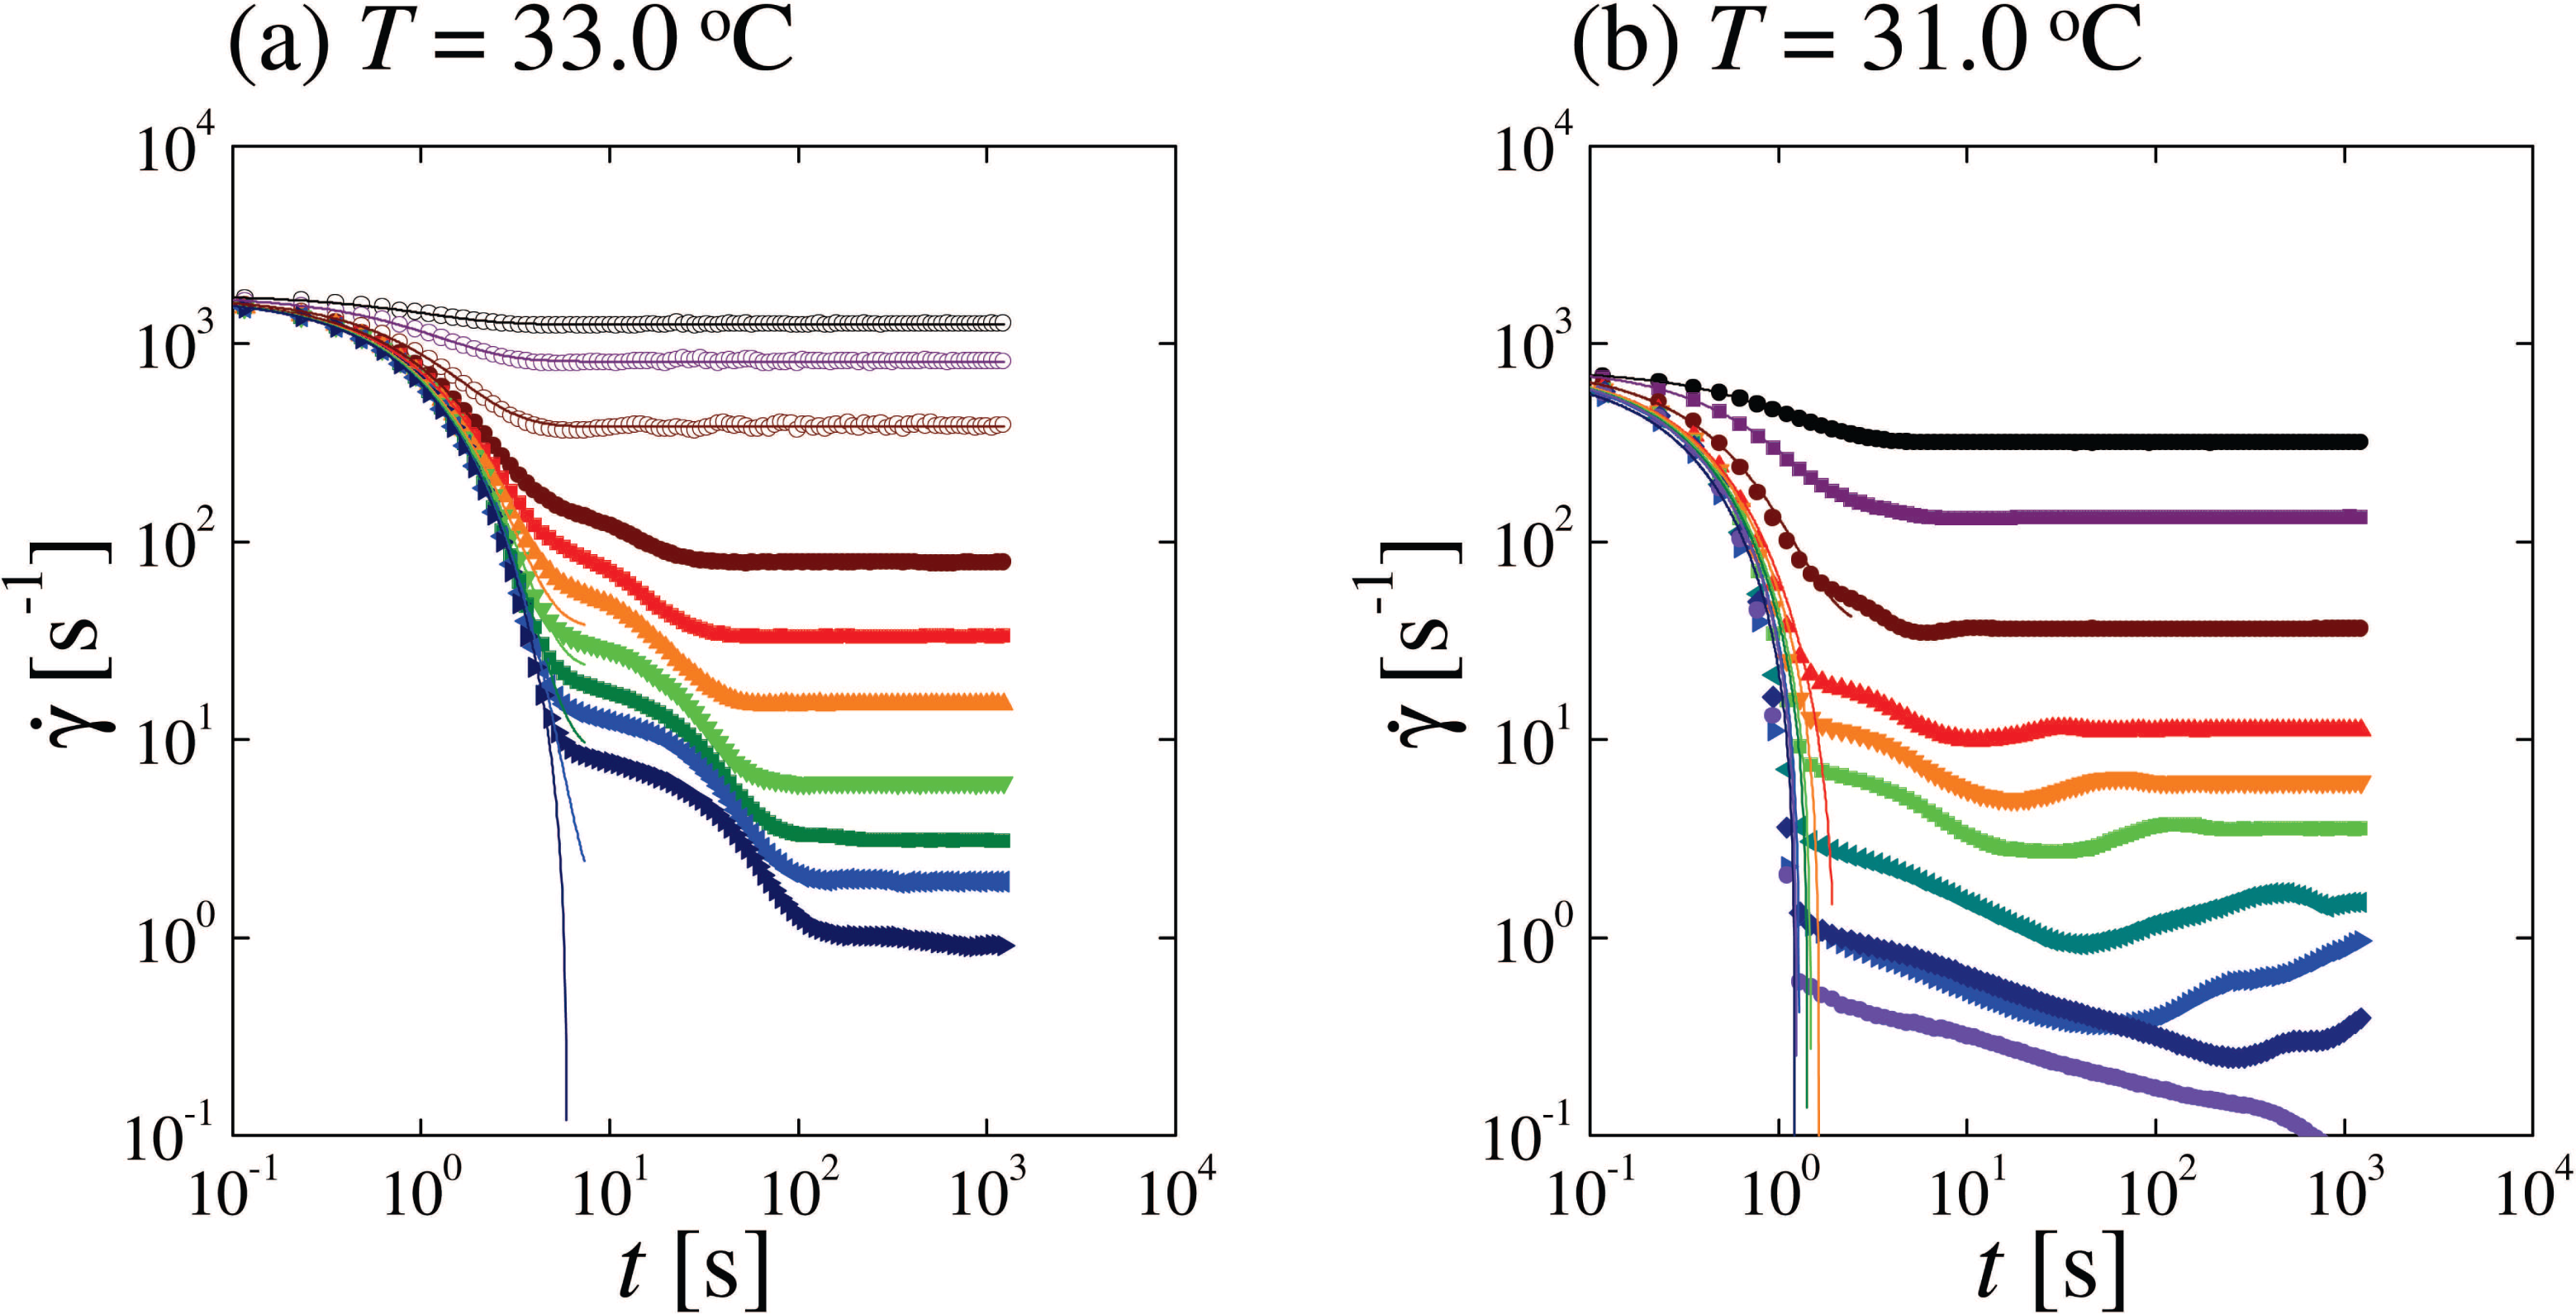
Figure 13 shows the measured shear rate γ̇ as a function of time t for stress-quenches at the same temperatures as in Figure 12. In Figure 13a for T =33.0 °C, open symbols correspond to the stress-quench within the SmAII phase, while closed symbols indicate the stress-quench from the SmAII phase to the SmAI phase. As drawn in the graph, the initial decay of γ̇ can be fitted by a single exponential function which is called the first mode. On the other hand, when the system undergoes a non-equilibrium transition from the SmAII to SmAI phases, the shear rate exhibits a second decay mode as observed in Figure 13. In comparison with the microscope observations, we notice that the second mode appears when the formation of FCDs starts. As the terminal stress is decreased, the fraction of the second mode gradually increases.
The obtained relaxation time for the first mode shows a slowing down at TSN. Since the smectic layers in the SmAII phase consist of a perpendicular orientation, the relaxation of the layer orientation accompanies a creation of edge dislocations before the FCD formation. It is known that the dislocations exhibit climb motion under shear stress [75,76]. The characteristic time for the climb motion of edge dislocation under stress is described by
When the system is quenched within the SmAI phase at T =31.0 °C as shown in Figure 13b, the shear rate shows anomalous behavior depending on the stress-quench depth. As the quench depth is increased, the two decay modes are observed similar to those for T =33.0 °C. However, there is a distinct third mode in which the shear rate increases (rather than decreases) after the double relaxation. Since this third mode corresponds to the time region when the alignment of FCDs takes place, it can be attributed to the formation of oily streaks. The third mode becomes slower when the temperature is decreased. Notice that oily streaks consist of FCDs connected by edge dislocations as depicted in Figure 1b. Hence the alignment of FCDs is affected by the dislocation unbinding [46]. Slowing down of these characteristic times in the vicinity of the SN-transition indicates that the dislocation unbinding dominates not only the SN-transition but also the dynamics of textural defects.
Here we shall qualitatively discuss the eccentricity of FCDs under shear flow. In Figure 12, elliptic FCDs can be seen with minor axis aligned along the flow direction. The eccentricity of the FCDs is caused by the shear since the FCDs at quiescent state are mostly circles as shown in Figure 3. When the shear stress is quenched, the layers will first disassemble along the velocity gradient direction, and may reconnect with the slightly tilted state to accommodate FCDs with the large Burger vectors [18]. Asymmetry of the FCDs along the vorticity direction would reflect the tilted layers in the FCDs. Moreover, the dynamic coupling between the dislocation loops and the shear flow may induce the distortion of the FCDs since the dislocation loops can adapt to the applied shear stress [38]. Kleman et al. [47] and Meyer et al. [48] indeed pointed out that the interaction of the FCDs with dislocations causes the distortion of the FCD shape. Detailed analysis on the eccentricity would clarify how the dislocation loops attribute to the FCD structure.
Finally, it is interesting to point out the similarity between the FCD (FCD-I) formation from the perpendicularly oriented layers and the onion (FCD-II) formation from the planar lamellae with parallel orientation. In our experiment, the double decay modes in the shear rate at fixed shear stress indicate that the viscosity increases with two steps. Such a behavior is also observed in the shear-induced onion formation at fixed shear rate [31,32]. Especially, the creation of dislocations prior to the FCD formation coincidences with the previous observation in the lyotropic system in which the increase of the defect density is essential for the onion formation [33]. Hence the proliferation of the dislocations plays an important role in the structural development from the planar layers for both thermotropic and lyotropic cases. A qualitatively similar time evolution of the viscosity in these systems suggests that the structural development dominated by defects is an universal mechanism in the layered systems.
7. Conclusions and Outlook
In this review article, we have discussed that the following properties are closely related to the unbinding of the dislocation loops; (i) scaling behavior of the FCD size; (ii) temperature dependence of the yield stress; (iii) shear-induced SN-transition; (iv) physical origin of elasticity; and (v) FCD formation from the SmAII phase. In particular, we have clarified the physical origin of the elasticity by comparing the scaling relations for the FCD size and the shear modulus. This result indicates that the defects significantly affect the smectic rheology. Furthermore, the similarity in the rheological properties between FCDs and onions is a noteworthy consequence.
It should be noted that the origin of the nonlinear rheological behavior still remains to be clarified. Both the yield stress and the plateau shear modulus, commonly used to characterize the elasticity, depend on the FCD size. The shear modulus originates from the effective surface tension, whereas the source of the yield stress is poorly understood. Nonetheless, the estimated yield stress using an empirical relation σy ∼ K/L2 with L ≈ 10 – 102 μm roughly coincides with our experimental observation in Figure 6. More detailed study will shed light on the yield stress in the smectic phase. By the same token, the shear-induced onion formation in lyotropic systems is strongly concerned with interactions of defects such as dislocations and oily streaks [30,33]. Understanding the origin of the nonlinearity in the smectic phase with defects will also lead to the elucidation of the shear-induced structural transition.
We expect that the concept of structural rheology is applicable not only to the smectic phase but also to other structured fluids [2,3,5,77–79]. One of the most interesting systems, which could be tackled by a similar concept, is the rheology of the blue phase in cholesteric nematic liquid crystals. In this phase, the interaction between disclinations generates the yield stress, and anomalous rheological behavior is expected depending on the type of disclination networks [80,81]. Especially, shear-induced breakup and reconnection of the disclination network may induce a new non-equilibrium structure, as observed under electric field [82]. Soft glassy nature of the amorphous blue phase due to the disordered disclination network is also an interesting issue related to the defect-mediated rheology. Melting of the amorphous blue phase due to shear can be explained by the proliferation of disclinations as in the lyotropic hexagonal phase [23].
Thanks to the development in visualization technology and microrheology method, better understanding of the stress response due to meso-scale structures has become possible in recent years [22,83–87]. Simultaneous measurements of the viscoelasticity and image acquisition will give us a time resolved spatial information under shear [77–79,88]. These technological developments are expected to contribute to the fundamental science of non-equilibrium soft matter in the future.
Acknowledgments
We thank Y. Ishii for useful discussion, and T. Takahashi, H. Orihara, M. Imai, and Anton Paar Co. Ltd. for the use of their rheometer and the microscopy devices. This work was mainly supported by Grant-in-Aid for Scientific Research (B) grant No. 25287107 from MEXT of Japan. Shigeyuki Komura would like to further acknowledge support from the Grant-in-Aid for Scientific Research on Innovative Areas “Fluctuation & Structure” (grant No. 25103010), Grant-in-Aid for Scientific Research (C) grant No. 24540439 from the MEXT of Japan, and the JSPS Core-to-Core Program “International research network for non-equilibrium dynamics of soft matter”.
Author Contributions
Shuji Fujii performed the experiments. Shigeyuki Komura gave the concept on the structural rheology. Chun-Yi David Lu gave pertinent comments on the data analysis and interpretations. Shuji Fujii and Shigeyuki Komura wrote the manuscript. All the authors discussed the results and analysis and commented on the manuscript.
Conflicts of Interest
The authors declare no conflict of interest.
References
- Doi, M.; Edwards, S.F. The Theory of Polymer Dynamics; Clarendon Press: Oxford, UK, 1986. [Google Scholar]
- Cohen-Addad, S.; Pitois, O.; Höhler, R. Flow in foams and flowing foams. Annu. Rev. Fluid Mech 2013, 45, 241–267. [Google Scholar]
- Lespiat, R.; Cohen-Addad, S.; Höhler, R. Jamming and flow of randomly close packed spherical bubbles: An analogy with granular materials. Phys. Rev. Lett 2011, 106, 148320. [Google Scholar] [CrossRef]
- Besseling, R.; Isa, L.; Weeks, E.R.; Poon, W.C.K. Quantitative imaging of colloidal flows. Adv. Colloid Int. Sci 2009, 146, 1–17. [Google Scholar]
- Mason, T.G. New fundamental concepts in emulsion rheology. Curr. Opin. Colloid Int. Sci. 1999, 4, 231–238. [Google Scholar]
- Sollich, P.; Lequeux, F.; Hebraud, P.; Cates, M.E. Rheology of soft glassy materials. Phys. Rev. Lett 1997, 78, 2020–2023. [Google Scholar]
- Yamamoto, J.; Tanaka, H. Shear effects on layer undulation fluctuations of a hyper-swollen lamellar phase. Phys. Rev. Lett 1995, 74, 932–935. [Google Scholar]
- Tamate, R.; Yamada, K.; Vinals, J.; Ohta, T. Structural rheology of microphase separated diblock copolymers. J. Phys. Soc. Jpn 2008, 77, 034802:1–034802:6. [Google Scholar]
- Eskimergen, R.; Mortensen, K.; Vigild, M.E. Shear instability of a gyroid diblock copolymer. Macromolecules 2005, 38, 1286–1291. [Google Scholar]
- Fredrickson, G.H.; Bates, F.S. Dynamics of block copolymers: Theory and experiments. Annu. Rev. Mater. Sci 1996, 26, 501–550. [Google Scholar]
- Diat, O.; Roux, D. Effect of shear on dilute sponge phase. Langmuir 1995, 11, 1392–1395. [Google Scholar]
- Porcar, L.; Hamilton, W.A.; Butler, P.D. Scaling of shear-induced transformations in membrane phases. Phys. Rev. Lett 2002, 89, 168301. [Google Scholar] [CrossRef]
- Cui, C.T.; Cummings, H.D.; Cochran, H.D. Molecular simulation of the transition from liquid like to solid like behavior in complex fluids confined to nanoscale gaps. J. Chem. Phys 2001, 114, 7189. [Google Scholar] [CrossRef]
- Jabbarzadeh, A.; Harrowell, P.; Tanner, R.I. Crystal bridges, tetra tic order, and elusive equilibria: The role of structure in lubrication films. J. Phys. Chem. B 2007, 111, 11354–11365. [Google Scholar]
- Jabbarzadeh, A.; Tanner, R.I. Thin lubricant films confined between crystalline surfaces: Gold versus mica. Tribol. Intern 2011, 44, 711–719. [Google Scholar]
- Fujii, S.; Ishii, Y.; Komura, S.; Lu, C.-Y.D. Smectic rheology close to the smectic-nematic transition. EPL 2010, 90, 64001. [Google Scholar] [CrossRef]
- Fujii, S.; Komura, S.; Ishii, Y.; Lu, C.-Y.D. Elasticity of smectic liquid crystals with focal conic domains. J. Phys.: Condens. Matter 2011, 23, 235105. [Google Scholar] [CrossRef]
- Fujii, S.; Komura, S.; Lu, C.-Y.D. Structural rheology of focal conic domains: Stress-quench experiment. Soft Matter 2014, 10, 5289–5295. [Google Scholar]
- Fujii, S. Structural rheology of smectic liquid crystalline phase. J. Soc. Rheol. Jpn 2012, 40, 229–237. (In Japanese). [Google Scholar]
- Jones, J.L.; McLeish, T.C.B. Rheological response of surfactant cubic phases. Langmuir 1995, 11, 785–792. [Google Scholar]
- Radiman, S.; Toprakcioglu, C.; McLeish, T.C.B. Rheological study of ternary cubic phases. Langmuir 1994, 10, 61–67. [Google Scholar]
- Mohammad, M.A.; Mezzenga, R. Particle tracking microrheology of lyotropic liquid crystals. Langmuir 2011, 27, 6171–6178. [Google Scholar]
- Ramos, L.; Molino, F. Shear melting of a hexagonal columnar crystal by proliferation of dislocations. Phys. Rev. Lett 2004, 92, 018301. [Google Scholar] [CrossRef]
- Colby, R.H.; Ober, C.K.; Gillmor, J.R.; Connelly, R.W.; Duong, T.; Galli, G.; Laus, M. Smectic rheology. Rheol. Acta 1997, 36, 498–504. [Google Scholar]
- Colby, R.H.; Nentwich, L.M.; Clingman, S.R.; Ober, C.K. Defect-mediated creep of structured materials. Europhys. Lett 2001, 54, 269. [Google Scholar] [CrossRef]
- Panizza, P.; Archambault, P.; Roux, R. Effects of shear on the smectic-A phase of thermotropic liquid crystals. J. Phys. II France 1995, 5, 303–311. [Google Scholar]
- Safinya, C.R.; Sirota, E.B.; Plano, R.J. Nematic to smectic-A phase transition under shear flow: A nonequilibrium synchrotron x-ray study. Phys. Rev. Lett 1991, 66, 1986–1989. [Google Scholar]
- Larson, R.G.; Wineyl, K.I.; Patel, S.S.; Watanabe, H.; Bruinsma, R. The rheology of layered liquids: Lamellar block copolymers and smectic liquid crystals. Rheol. Acta 1993, 32, 245–253. [Google Scholar]
- Dhez, O.; Nallet, F.; Diat, O. Influence of screw dislocations on the orientation of a sheared lamellar phase. Europhsy. Lett 2001, 55, 821–826. [Google Scholar]
- Diat, O.; Roux, D.; Nallet, F. Effect of shear on a lyotropic lamellar phase. J. Phys. II France 1993, 3, 1427–1452. [Google Scholar]
- Nettesheim, F.; Zipfel, J.; Olsson, U.; Renth, F.; Lindner, P.; Richtering, W. Pathway of the shear-induced transition between planar lamellae and multilamellar vesicles as studied by time-resolved scattering techniques. Langmuir 2003, 19, 3603–3618. [Google Scholar]
- Fujii, S.; Koschoreck, S.; Lindner, P.; Richtering, W. Influence of a triblock copolymer on phase behavior and shear-induced topologies of a surfactant lamellar phase. Langmuir 2009, 25, 5476–5483. [Google Scholar]
- Fujii, S.; Mitsumasu, D.; Isono, Y.; Richtering, W. Shear-induced onion formation of polymer-grafted lamellar phase. Soft Matter 2012, 8, 5381–5390. [Google Scholar]
- Kosaka, Y.; Ito, M.; Kawabata, Y.; Kato, T. Lamellar-to-onion transition with increasing temperature under shear flow in a nonionic surfactant/water system. Langmuir 2010, 26, 3835–3842. [Google Scholar]
- Horn, R.G.; Kleman, M. Observation on shear-induced textures and rheology of a smectic-A phase. Ann. Phys 1978, 3, 229–234. [Google Scholar]
- Meyer, C.; Asnacios, S.; Bourgaux, C.; Kleman, M. Rheology of lyotropic and thermotropic lamellar phases. Rheol. Acta 2000, 39, 223–233. [Google Scholar]
- Meyer, C.; Asnacios, S.; Kleman, M. Universal properties of lamellar systems under weak shear. Eur. Phys. J. E 2001, 6, 245–254. [Google Scholar]
- Lu, C.-Y.D.; Chen, P.; Ishii, Y.; Komura, S.; Kato, T. Non-linear rheology of lamellar liquid crystals. Eur. Phys. J. E 2008, 25, 91–102. [Google Scholar]
- Basappa, G.; Suneel; Kumaran, V.; Nott, P.R.; Ramaswamy, S.; Naik, V.M.; Rout, D. Structure and rheology of the defect-gel states of pure and particle-dispersed lyotropic lamellar phases. Eur. Phys. J. B 1999, 12, 269–276. [Google Scholar]
- Ramos, L.; Zapotocky, M.; Lubensky, T.C.; Weitz, D.A. Rheology of defect networks in cholesteric liquid crystals. Phys. Rev. E 2002, 66, 031711. [Google Scholar] [CrossRef]
- Medronho, B.; Migule, M.G.; Olsson, U. Viscoelasticity of a nonionic lamellar phase. Langmuir 2007, 23, 5270–5274. [Google Scholar]
- Medronho, B.; Rodrigues, M.; Migule, M.G.; Olsson, U.; Schmidt, C. Shear-induced defect formation in a nonionic lamellar phase. Langmuir 2010, 26, 1477–1481. [Google Scholar]
- Kleman, M.; Lavrentovich, O.D. Soft Matter Physics: An Introduction; Springer: Berlin/Heidelberg, Germany, 2002. [Google Scholar]
- Williams, C.E.; Kleman, M. Dislocations, grain boundaries and focal conics in smectic-A. J. Phys 1975, 36, C1:315–C1:320. [Google Scholar]
- Boltenhagen, P.; Kleman, M.; Lavrentovich, O.D. Freeze-fracture observations in the Lα phase of a swollen surfactant in the vicinity of the L3 and the L1 phase transitions. J. Phys. II France 1994, 4, 1439–1448. [Google Scholar]
- Boltenhagen, P.; Lavrentovich, O.D.; Kleman, M. Oily streaks and focal conic domains in Lα lyotropic liquid crystals. J. Phys. II France 1991, 1, 1233–1252. [Google Scholar]
- Kleman, M.; Meyer, C.; Nastishin, Y.A. Imperfections in focal conic domains: The role of dislocations. Philos. Mag 2006, 86, 4439–4458. [Google Scholar]
- Meyer, C.; Nastishin, Y.; Kleman, M. Kinked focal conic domains in a SmA. Mol. Cryst. Liq. Cryst 2007, 477, 43/[537]–53/[547]. [Google Scholar]
- Holyst, R. Dislocations in lamellar and liquid crystal films: Equilibrium location, edge profiles, and phase transitions. Phys. Rev. Lett 1994, 26, 4097–4100. [Google Scholar]
- Helfrich, W. Defect model of the smectic-A-nematic phase transition. J. Phys 1978, 39, 1199–1208. [Google Scholar]
- Benzekri, M.; Marcerou, J.P.; Nguyen, H.T.; Rouillon, J.C. Critical behavior of the layer compressional elastic constant B at the smectic-A-nematic phase transition. Phys. Rev. B 1990, 41, 9032–9037. [Google Scholar]
- Benzekri, M.; Claverie, T.; Marcerou, J.P.; Rouillon, J.C. Nonvanishing of the layer compressional elastic constant at the smectic-A-to-nematic phase transition: A consequence of Landau-Peierls instability? Phys. Rev. Lett 1992, 68, 2480–2483. [Google Scholar]
- Nelson, D.R.; Torner, J. Bond-orientational order, dislocation loops, and melting of solids and smectic-A liquid crystals. Phys. Rev. B 1981, 24, 363–387. [Google Scholar]
- Moreau, P.; Navailles, L.; Giermanska-Kahn, J.; Mondain-Monval, O.; Nallet, F.; Roux, D. Dislocation-loop-mediated smectic melting. EPL 2006, 73, 49–54. [Google Scholar]
- De Gennes, P.G.; Prost, J. The Physics of Liquid Crystals; Clarendon Press: London, UK, 1993. [Google Scholar]
- Davidov, D.; Safinya, C.R.; Kaplan, M.; Dana, S.S.; Schaetzing, R.; Birgeneau, R.J.; Litster, J.D. High-resolution x-ray and light-scattering study of critical behavior associated with the nematic-smectic-A transition in 4-cyano-4’-octylbiphenyl. Phys. Rev. B 1979, 19, 1657–1663. [Google Scholar]
- Herschel, W.H.; Bulkley, B. Measurement of consistency as applied to rubber-benzene solution. Proc. Am. Assoc. Test Mater 1926, 26, 621–633. [Google Scholar]
- Moller, P.C.F.; Mewis, J.; Bonn, D. Yield stress and thixotropy: On the difficulty of measuring yield stresses in practice. Soft Matter 2006, 2, 274–283. [Google Scholar]
- Moller, P.; Fall, A.; Chikkadi, V.; Derks, D.; Bonn, D. An attempt to categorize yield stress fluid behavior. Philos. Trans. R. Soc. A 2009, 367, 5139–5155. [Google Scholar]
- Zywocinski, A.; Picano, F.; Oswald, P.; Geminard, J.C. Edge dislocation in a vertical smectic-A film: Line tension versus temperature and film thickness near the nematic phase. Phys. Rev. E 2000, 62, 8133–8140. [Google Scholar]
- Negita, K.; Kaneko, H. Rheodielectric study on shear-induced structural change in the smectic-A phase of 4-n-octyl-4’-cyanobiphenyl (8CB). Phys. Rev. E 2009, 80, 011705. [Google Scholar] [CrossRef]
- Bruinsma, R.; Rabin, Y. Shear-flow enhancement and suppression of fluctuations in smectic liquid crystals. Phys. Rev. Lett 1992, 45, 994–1008. [Google Scholar]
- Goulian, M.; Milner, S.T. Shear alignment and instability of smectic phases. Phys. Rev. Lett. 1995. [Google Scholar]
- Ramaswamy, S. Shear-induced collapse of the dilute lamellar phase. Phys. Rev. Lett 1992, 69, 112–115. [Google Scholar]
- Porcar, L.; Warr, G.G.; Hamilton, W.A.; Butler, P.D. Shear-induced collapse in a lyotropic lamellar phase. Phys. Rev. Lett 2005, 95, 078302. [Google Scholar] [CrossRef]
- Berghausen, J.; Zipfel, J.; Lindner, P.; Richtering, W. Shear-induced orientations in a lyotropic defective lamellar phase. Europhys. Lett 1998, 43, 683–689. [Google Scholar]
- van der Linden, E.; Droege, J.H.M. Deformability of lamellar droplets. Physica A 1993, 193, 439–447. [Google Scholar]
- van der Linden, E.; Hogervorst, W.T.; Lekkerkerker, H.N.W. Relation between the size of lamellar droplets in onion phases and their effective surface tension. Langmuir 1996, 12, 3127–3130. [Google Scholar]
- Princen, H.M.; Kiss, A.D. Rheology of foams and highly concentrated emulsions: III. Static shear modulus. J. Colloid Interface Sci. 1986, 112, 427–437. [Google Scholar]
- Princen, H.M.; Kiss, A.D. Rheology of foams and highly concentrated emulsions: IV. An experimental study of the shear viscosity and yield stress of concentrated emulsions. J. Colloid Interface Sci. 1989, 128, 176–187. [Google Scholar]
- Panizza, P.; Roux, D.; Vuillaume, V.; Lu, C.-Y.D.; Cates, M. Viscoelasticity of the onion phase. Langmuir 1996, 12, 248–252. [Google Scholar]
- Leng, J.; Nallet, F.; Roux, D. Anomalous elasticity of an ordered lamellar liquid foam. Eur. Phys. J. E 2001, 4, 337–342. [Google Scholar]
- Chatterjee, S.; Anna, S.L. Formation and ordering of topological defect arrays produced by dilatational strain and shear flow in smectic-A liquid crystals. Phys. Rev. E 2012, 85, 011701. [Google Scholar] [CrossRef]
- Chatterjee, S.; Anna, S.L. Interaction of toroidal focal conic defects with shear flow. Soft Matter 2012, 8, 2698–2705. [Google Scholar]
- Oswald, P.; Kleman, M. Experimental evidence for helical instability of screw dislocation lines in a smectic-A phase. J. Phys. Lett. (France) 1984, 45, L319–L328. [Google Scholar]
- Oswald, P.; Kleman, M. Lubrication theory of smectic-A phases. J. Phys. Lett. (France) 1982, 43, L411–L415. [Google Scholar]
- Aida, K.; Na, Y.H.; Nagaya, T.; Orihara, H. Droplet coalescence process under electric fields in an immiscible polymer blend. Phys. Rev. E 2010, 82, 031805. [Google Scholar] [CrossRef]
- Aida, K.; Na, Y.H.; Nagaya, T.; Orihara, H. Storage shear modulus of columnar structure formed in an immiscible polymer blend under electric fields. Phys. Rev. E 2009, 80, 041807:1–041807:5. [Google Scholar]
- Orihara, H.; Takikawa, Y. Brownian motion in shear flow: Direct observation of anomalous diffusion. Phys. Rev. E 2011, 84, 061120:1–061120:5. [Google Scholar]
- Henrich, O.; Stratford, K.; Cates, M.; Marenduzzo, D. Structure of blue phase III of cholesteric liquid crystals. Phys. Rev. Lett 2011, 106, 107801:1–107801:4. [Google Scholar]
- Henrich, O.; Stratford, K.; Coveney, P.V.; Cates, M.; Marenduzzo, D. Rheology of cubic blue phases. Soft Matter 2013, 9, 10243–10256. [Google Scholar]
- Kitzerow, H.-S.; Crooker, P.P.; Heppke, G. Line shapes of filed-induced blue-phase III selective reflections. Phys. Rev. Lett 1991, 67, 2151–2154. [Google Scholar]
- Mason, T.G.; Weitz, D.A. Optical measurement of frequency-dependent linear viscoelastic moduli of complex fluids. Phys. Rev. Lett 1995, 74, 1250–1253. [Google Scholar]
- Crocker, J.C.; Valentine, M.T.; Weeks, E.; Gisler, T.; Kaplan, P.D.; Yodh, A.G.; Weitz, D.A. Two-point microrheology of inhomogeneous soft materials. Phys. Rev. Lett 2000, 85, 888–891. [Google Scholar]
- Sonn-Segev, A.; Groswasser, A.B.; Diamant, H.; Roichman, Y. Response of a compilex fluid at intermediate distances. Phys. Rev. Lett 2014, 112, 088301:1–088301:5. [Google Scholar]
- Kimura, Y.; Mizuno, D. Microrheology of a swollen lyotropic lamellar phase. Mol. Cryst. Liq. Cryst 2007, 478, 759–769. [Google Scholar]
- Yamamoto, N.; Ichikawa, M.; Kimura, Y. Local mechanical properties of a hyperswollen lyotropic lamellar phase. Phys. Rev. E 2010, 82, 021506. [Google Scholar] [CrossRef]
- Dutta, S.K.; Mbi, A.; Arevalo, R.C.; Blair, D.L. Development of a confocal rheometer for soft and biological materials. Rev. Sci. Instrum 2013, 84, 063702:1–063702:7. [Google Scholar]


© 2014 by the authors; licensee MDPI, Basel, Switzerland This article is an open access article distributed under the terms and conditions of the Creative Commons Attribution license (http://creativecommons.org/licenses/by/3.0/).
Share and Cite
Fujii, S.; Komura, S.; Lu, C.-Y.D. Structural Rheology of the Smectic Phase. Materials 2014, 7, 5146-5168. https://doi.org/10.3390/ma7075146
Fujii S, Komura S, Lu C-YD. Structural Rheology of the Smectic Phase. Materials. 2014; 7(7):5146-5168. https://doi.org/10.3390/ma7075146
Chicago/Turabian StyleFujii, Shuji, Shigeyuki Komura, and Chun-Yi David Lu. 2014. "Structural Rheology of the Smectic Phase" Materials 7, no. 7: 5146-5168. https://doi.org/10.3390/ma7075146