
Tissue-Like Phantoms as a Platform for Inserted Fluorescence Nano-Probes


Abstract
:1. Introduction
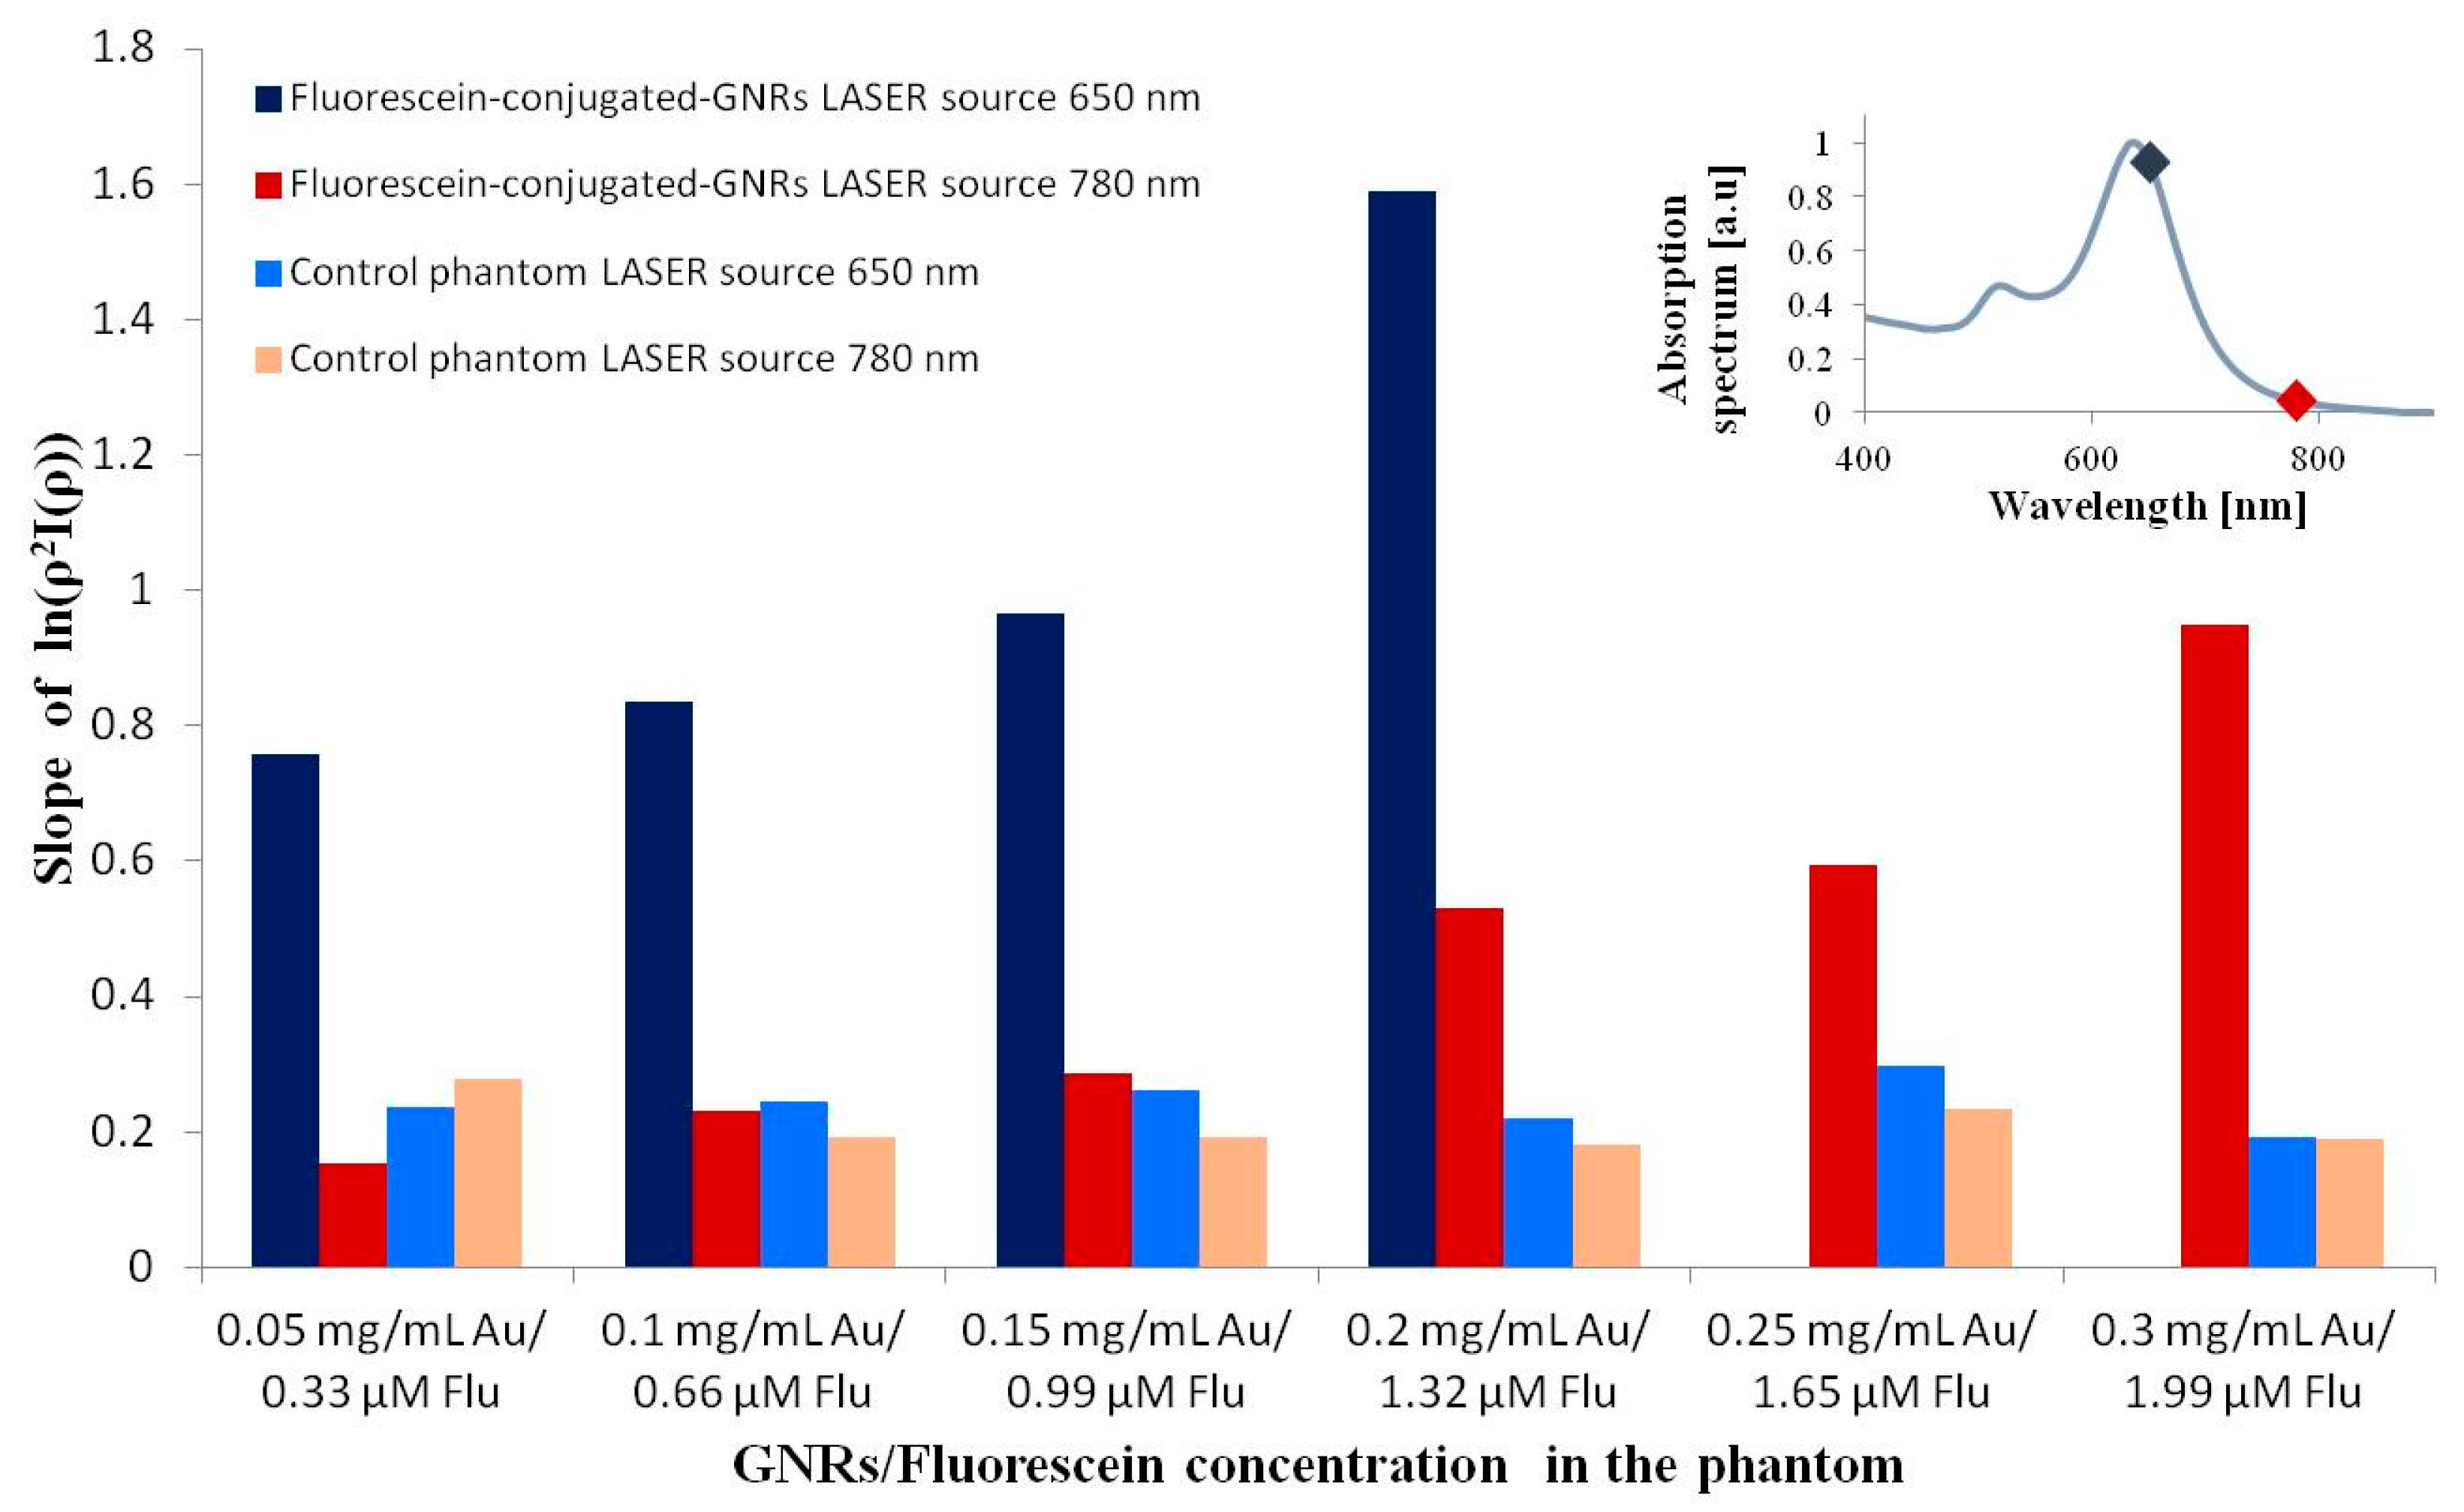
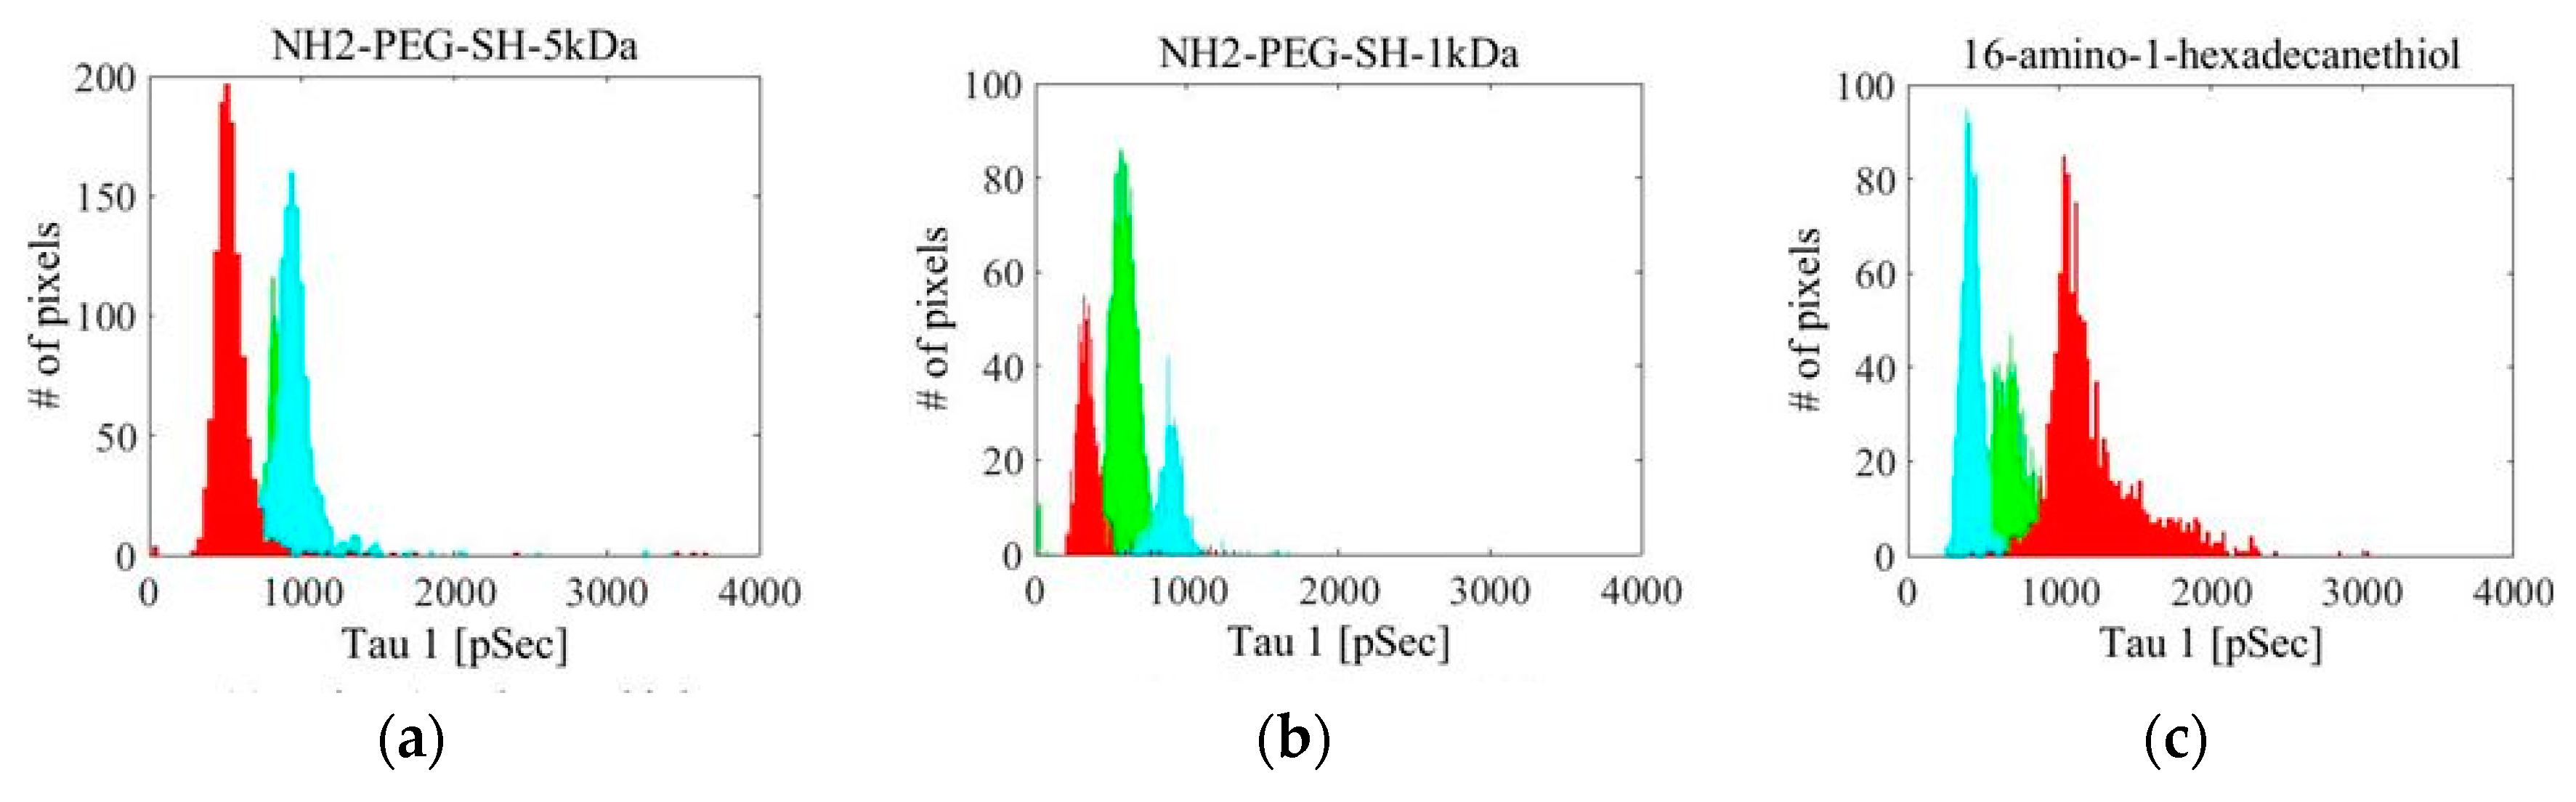
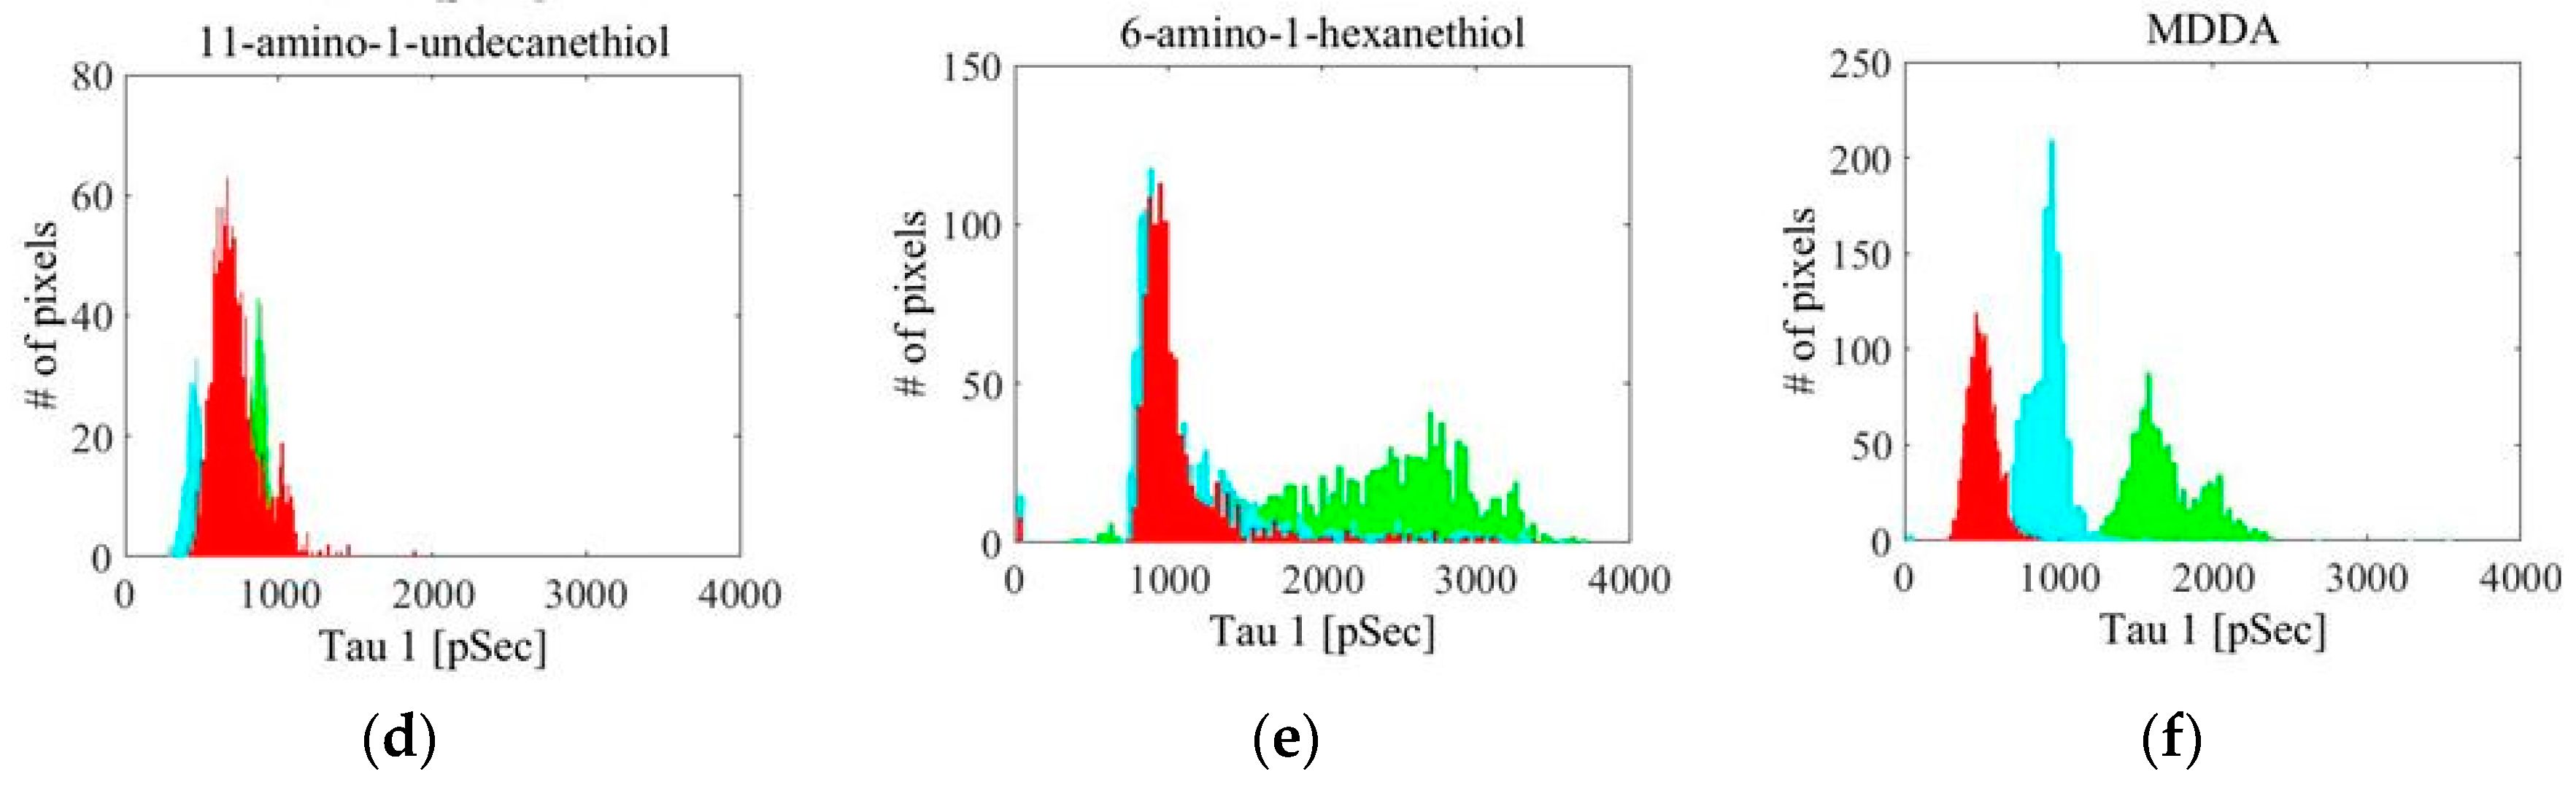
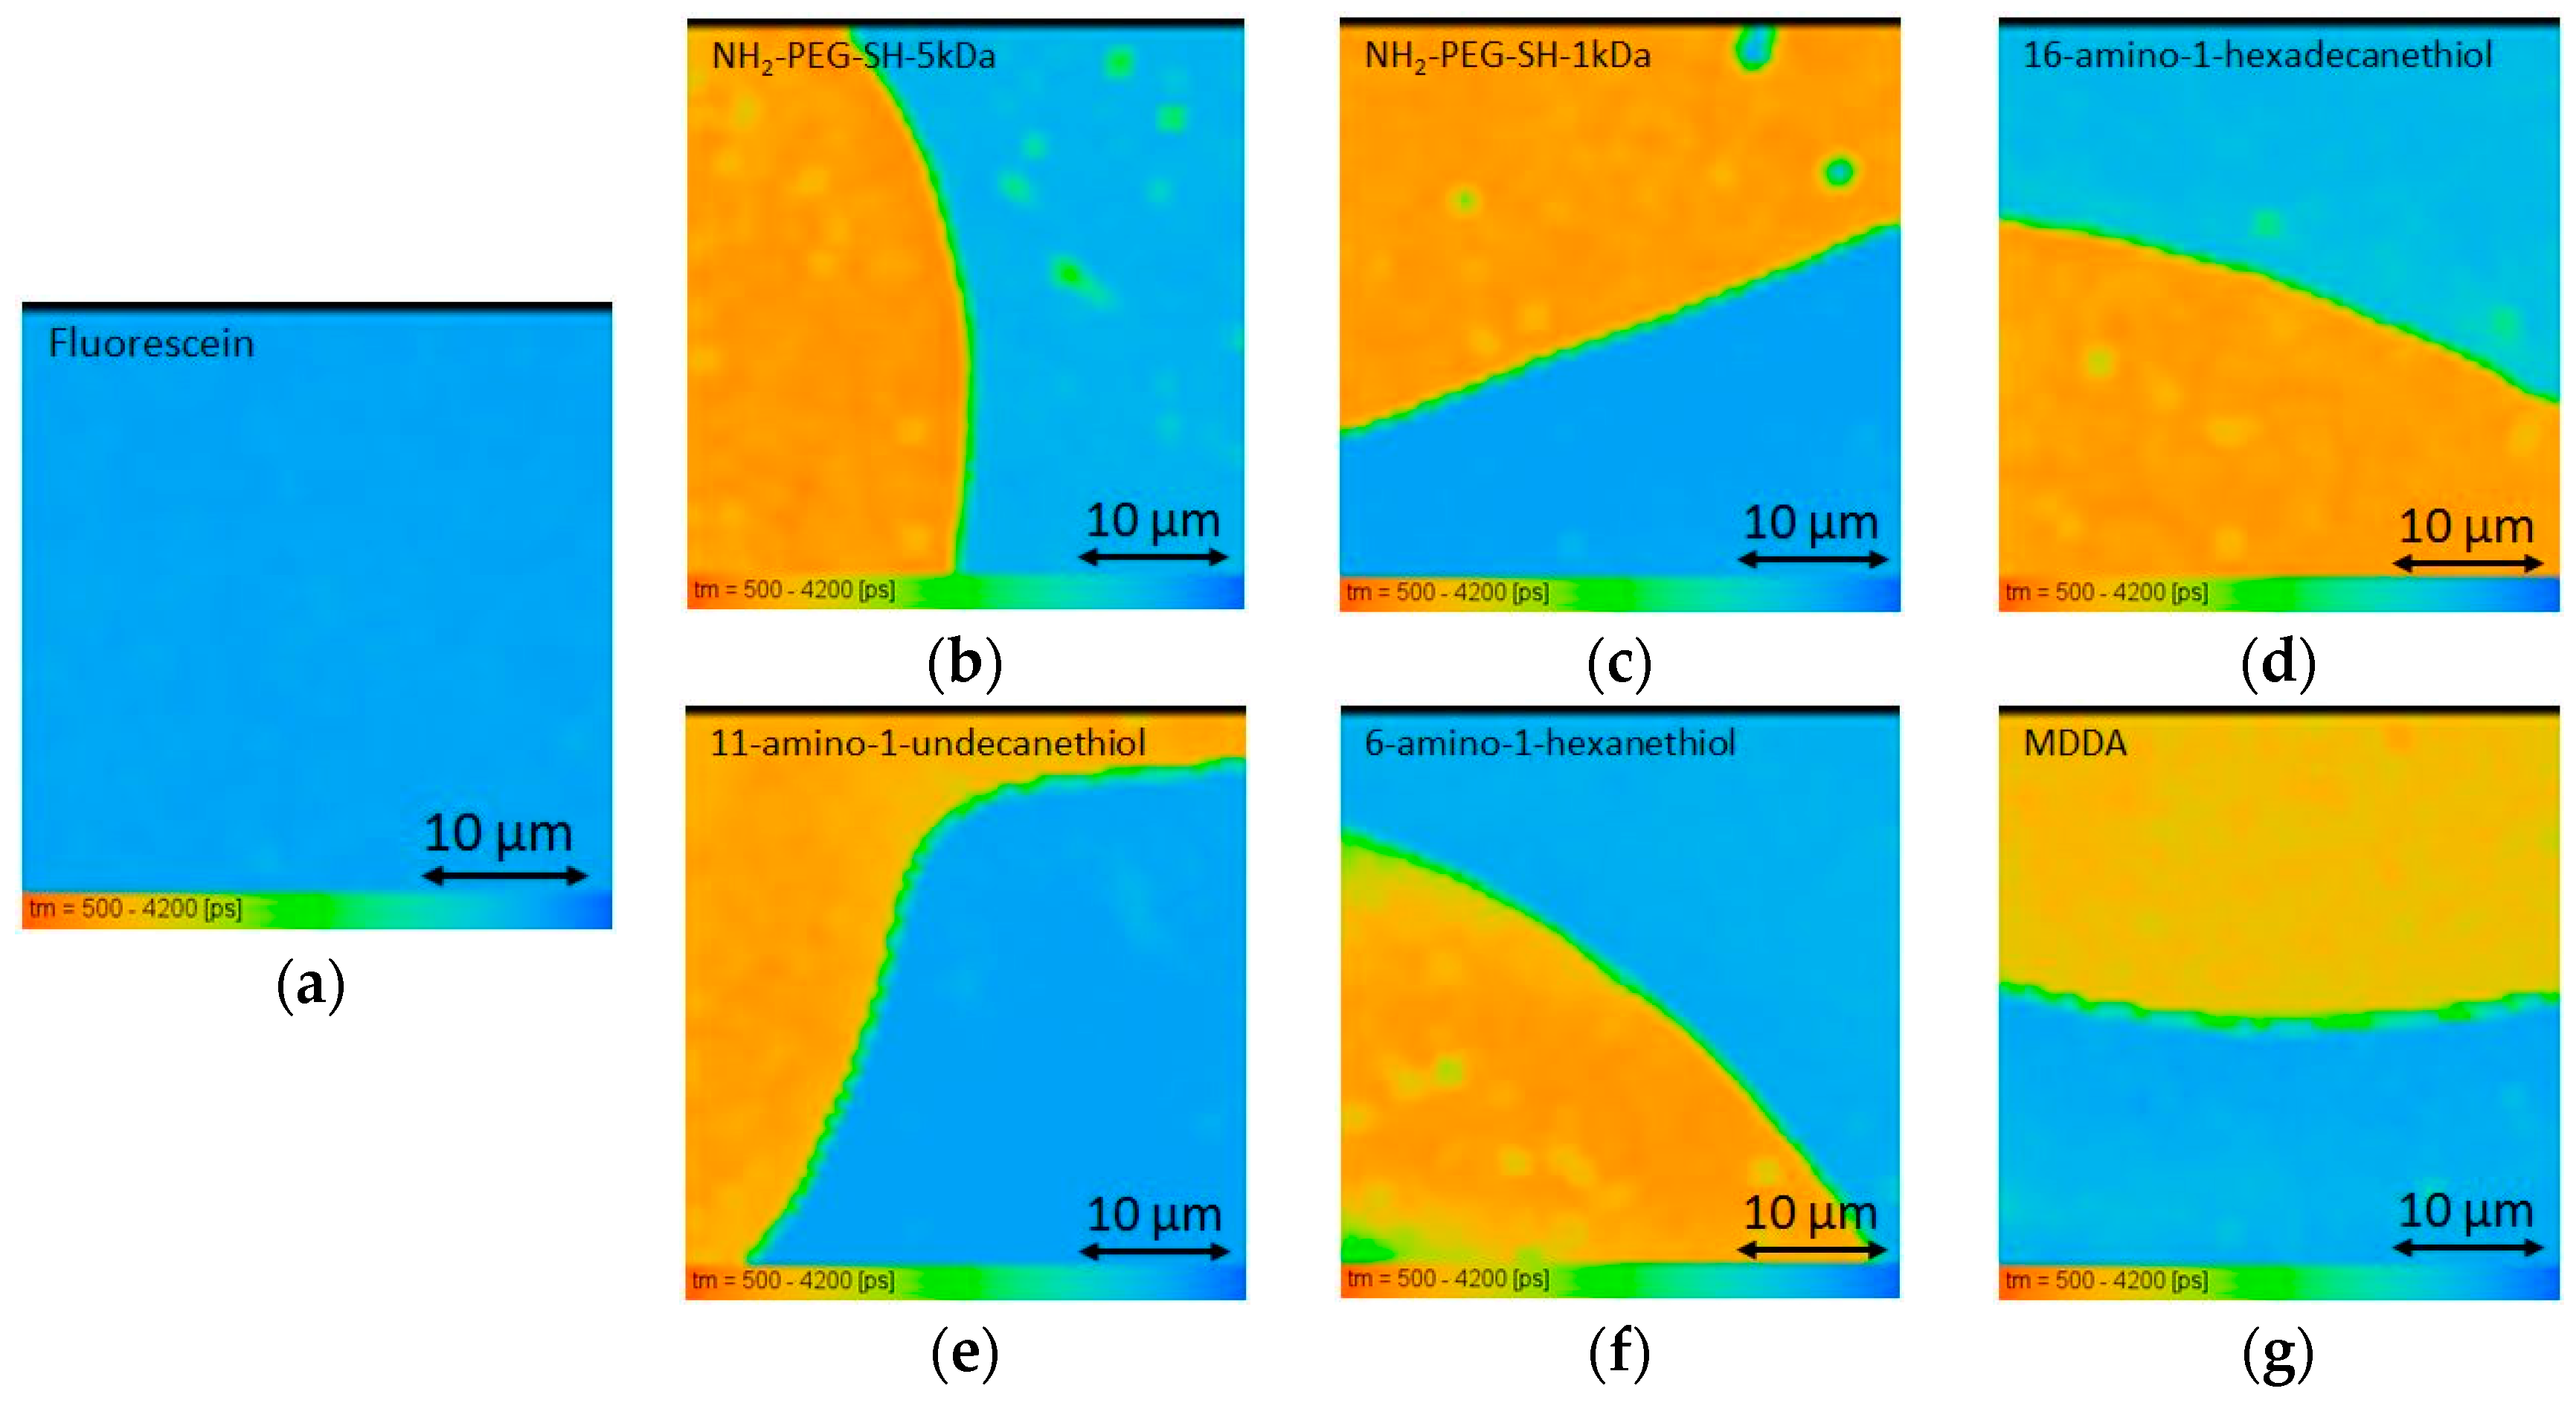
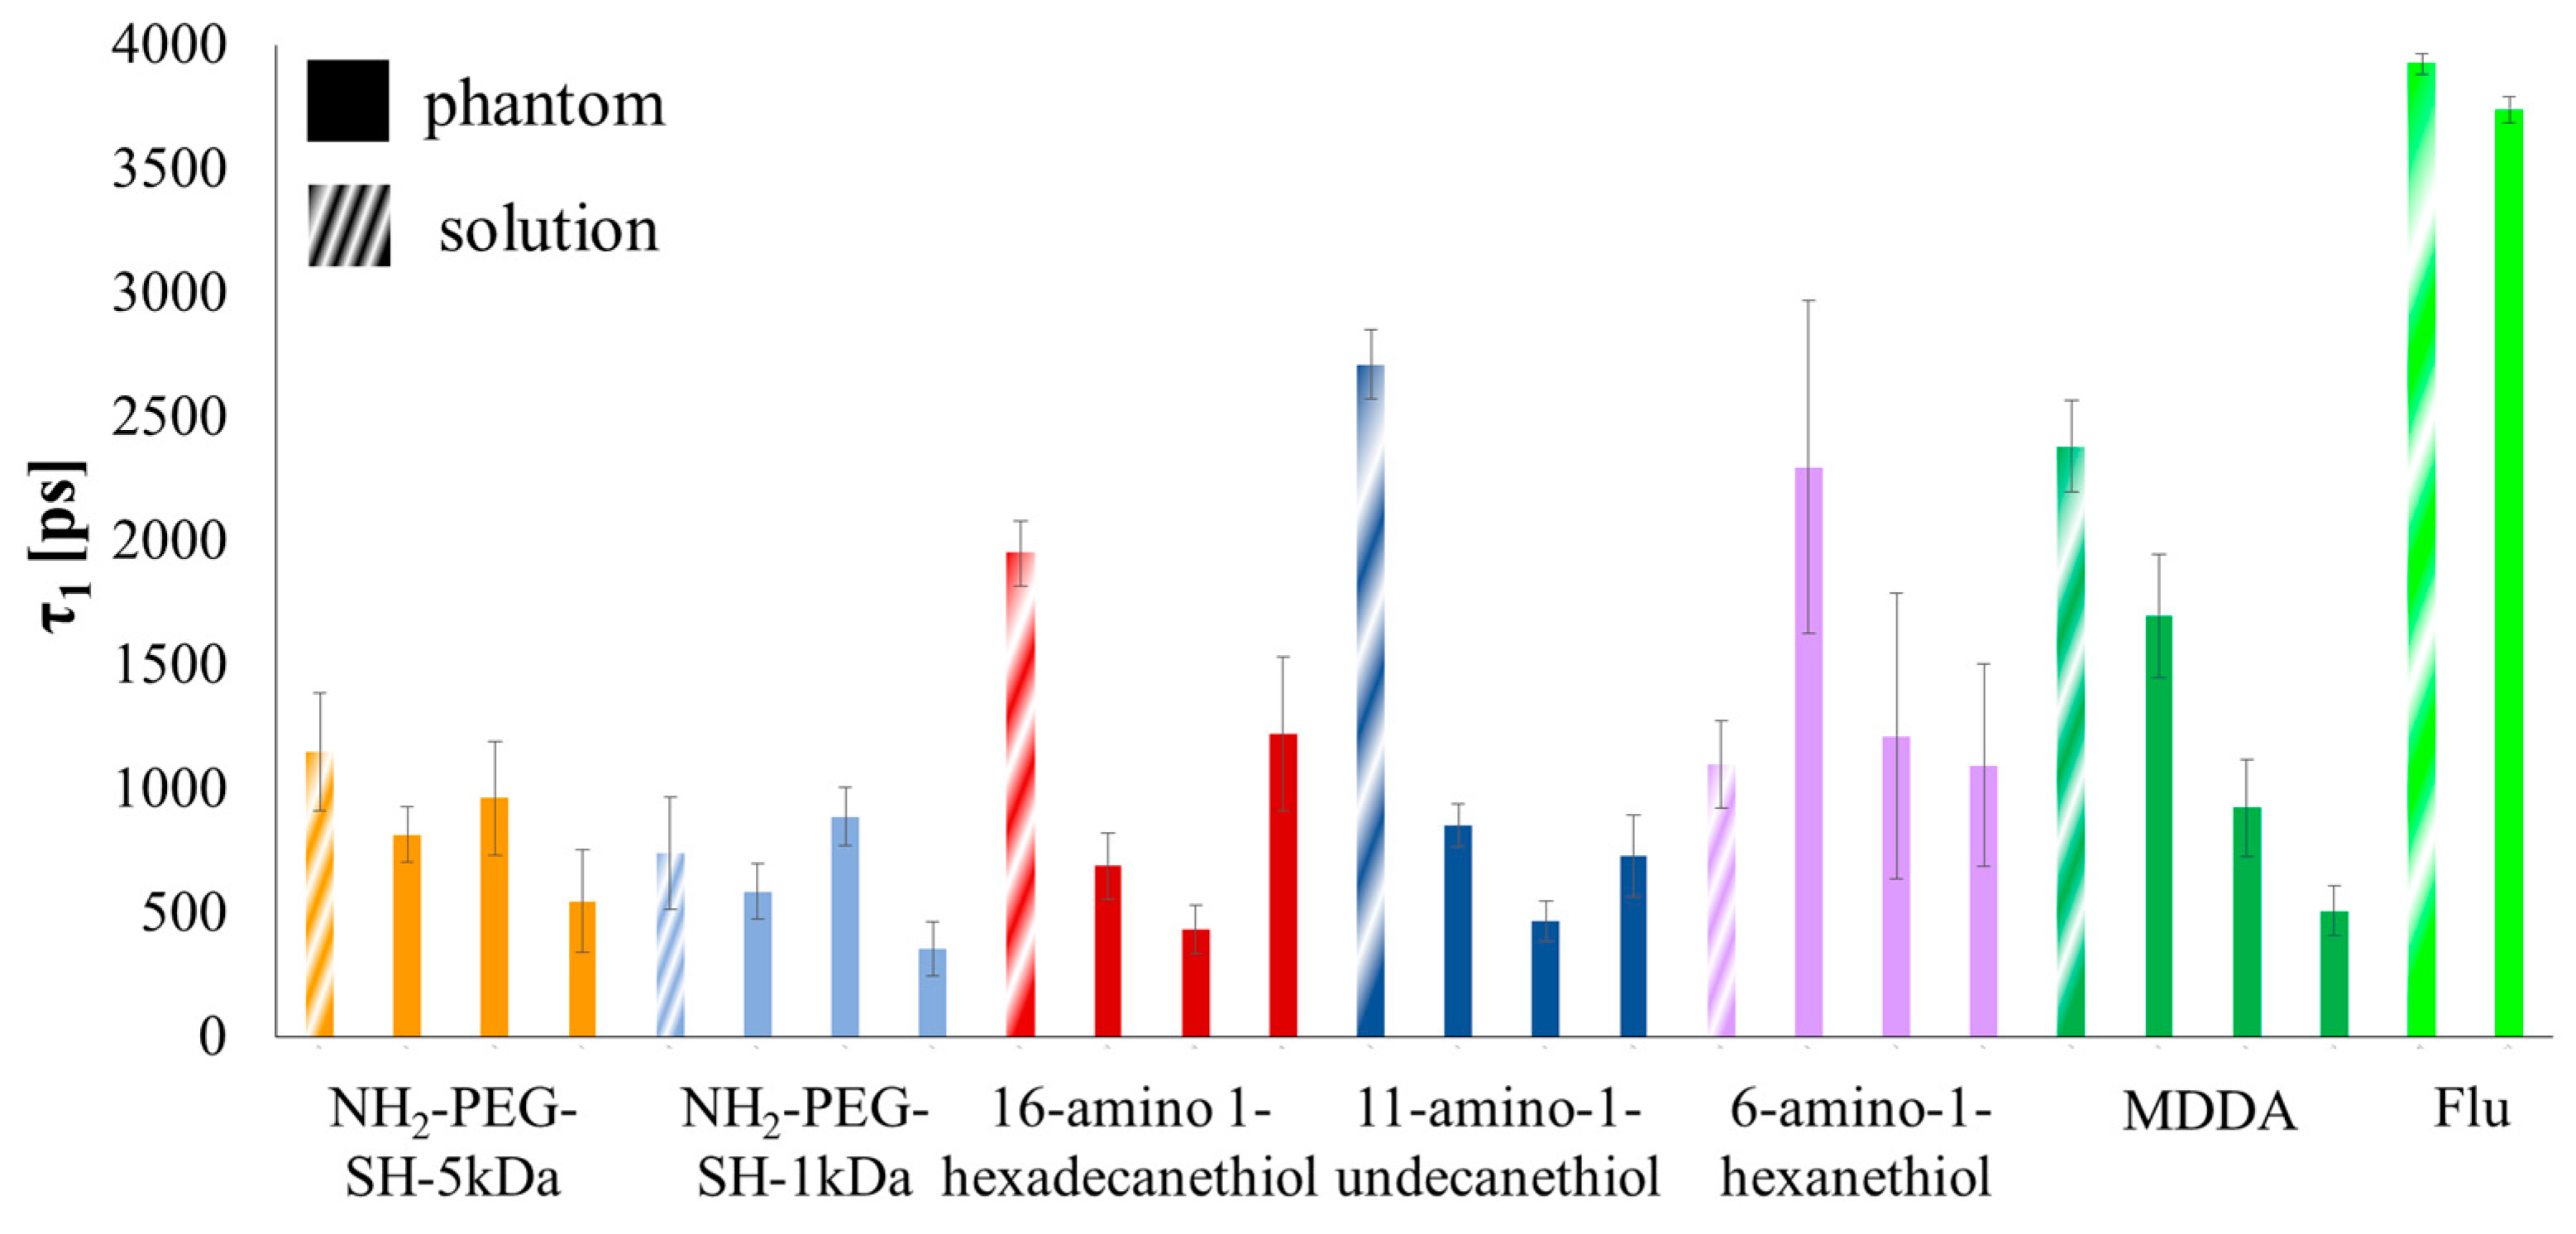
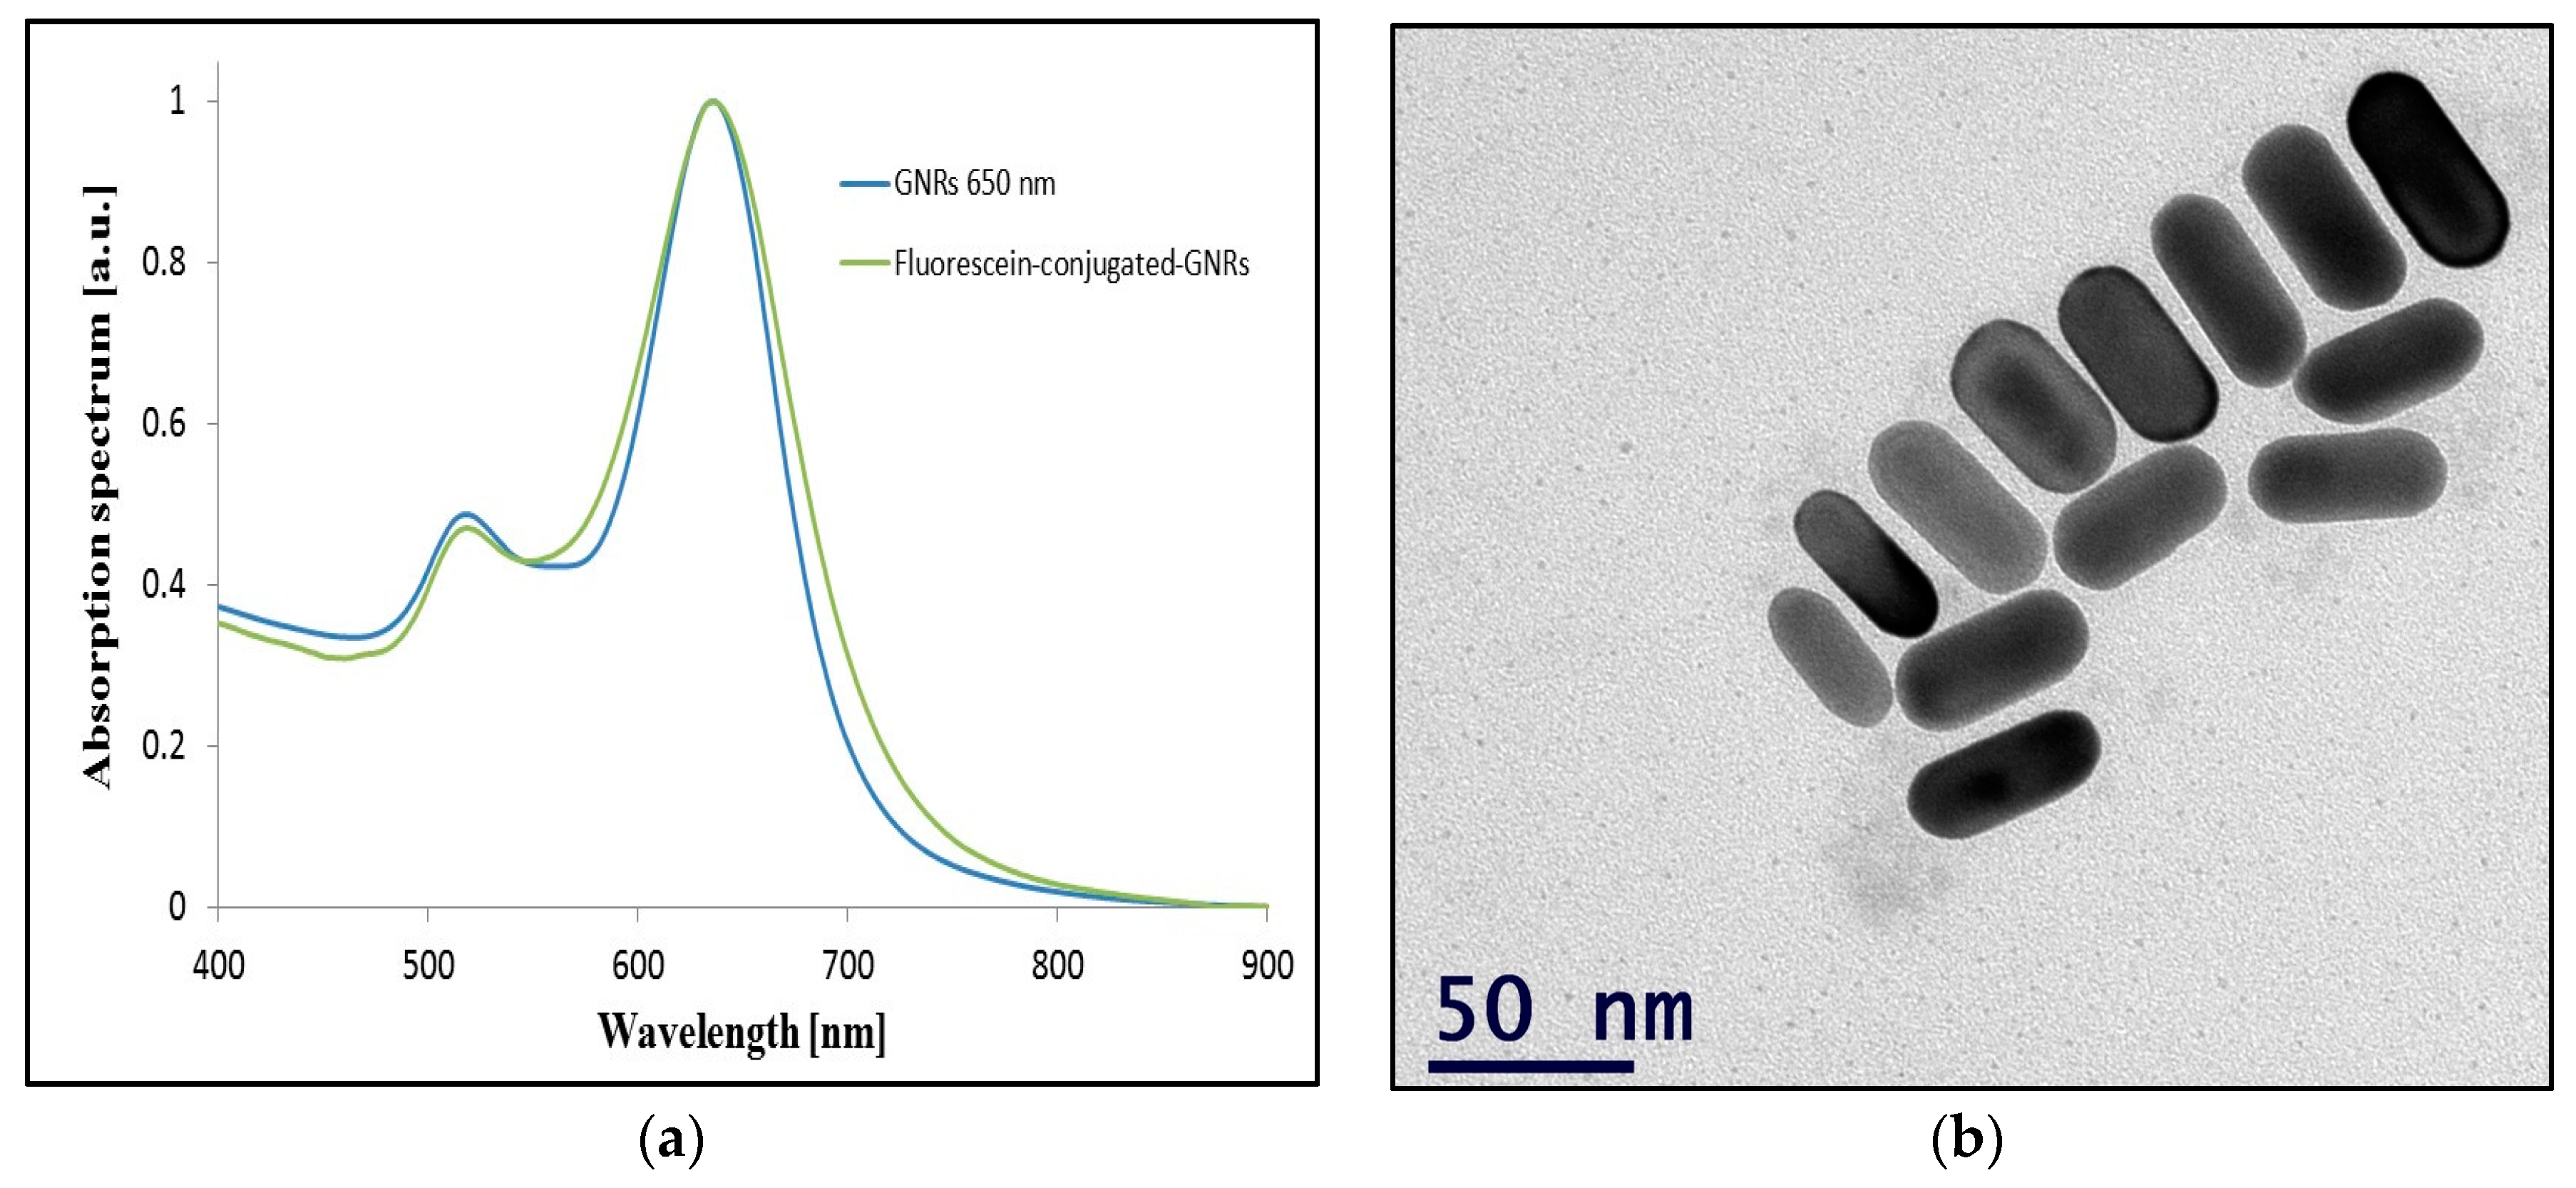
2. Results
3. Discussion and Conclusions
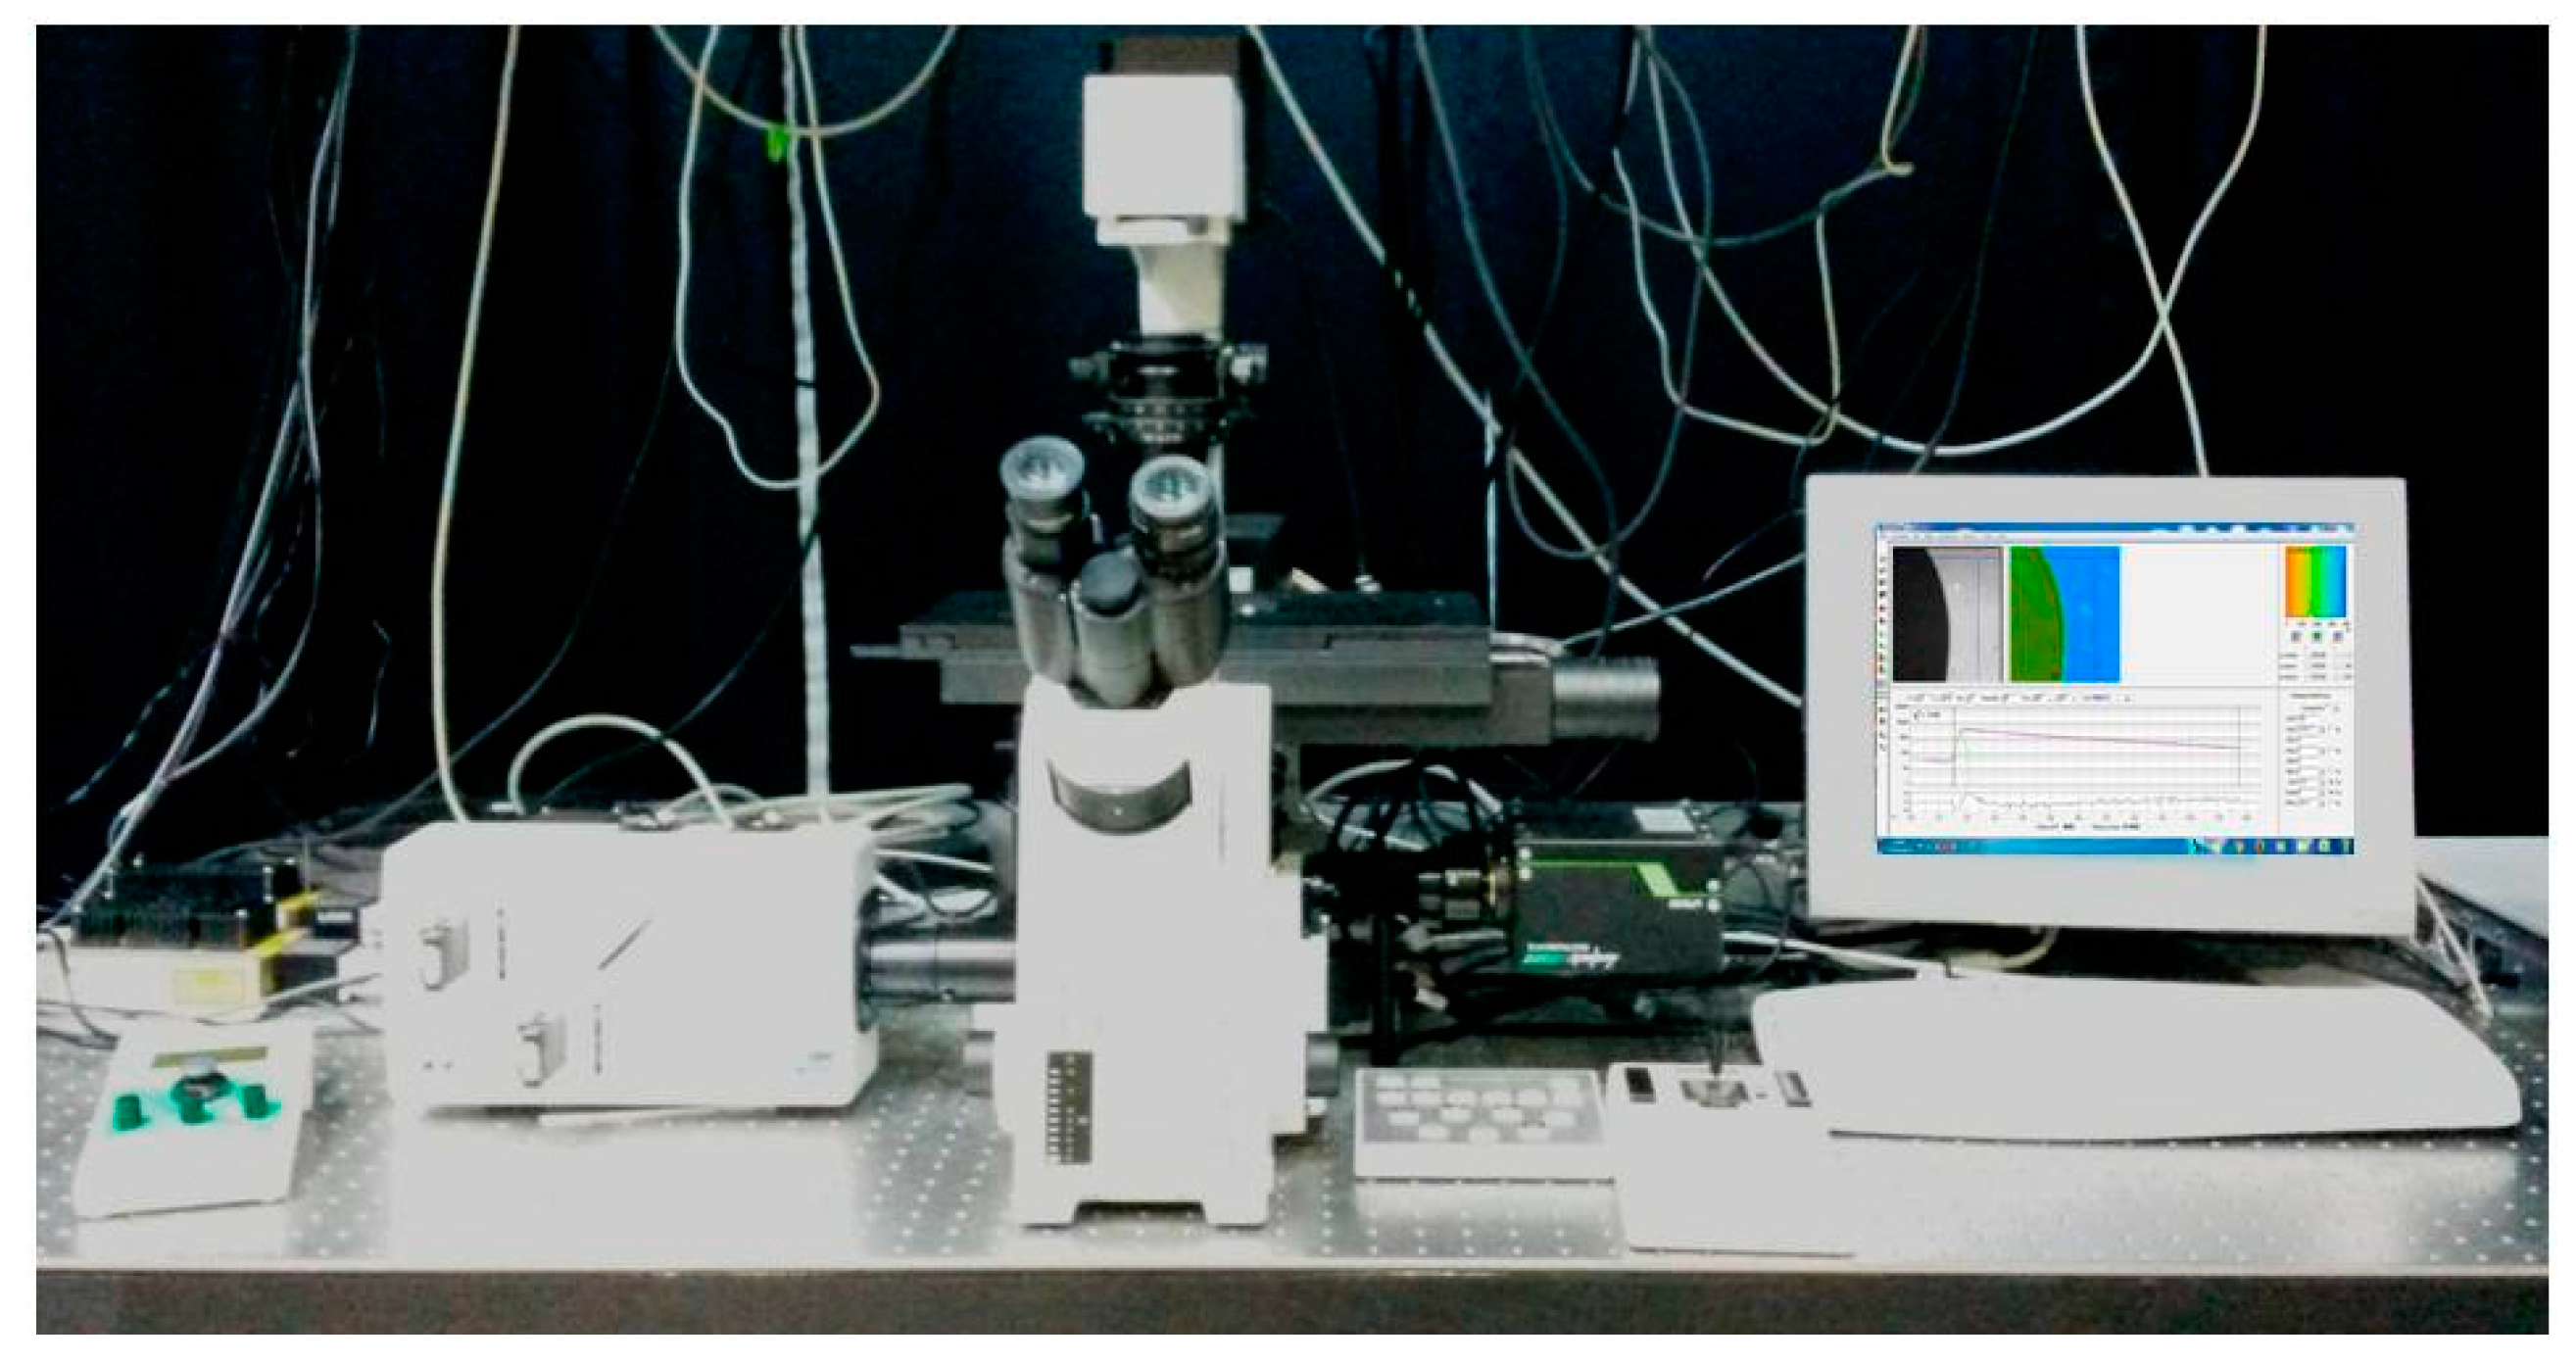
4. Materials and Methods
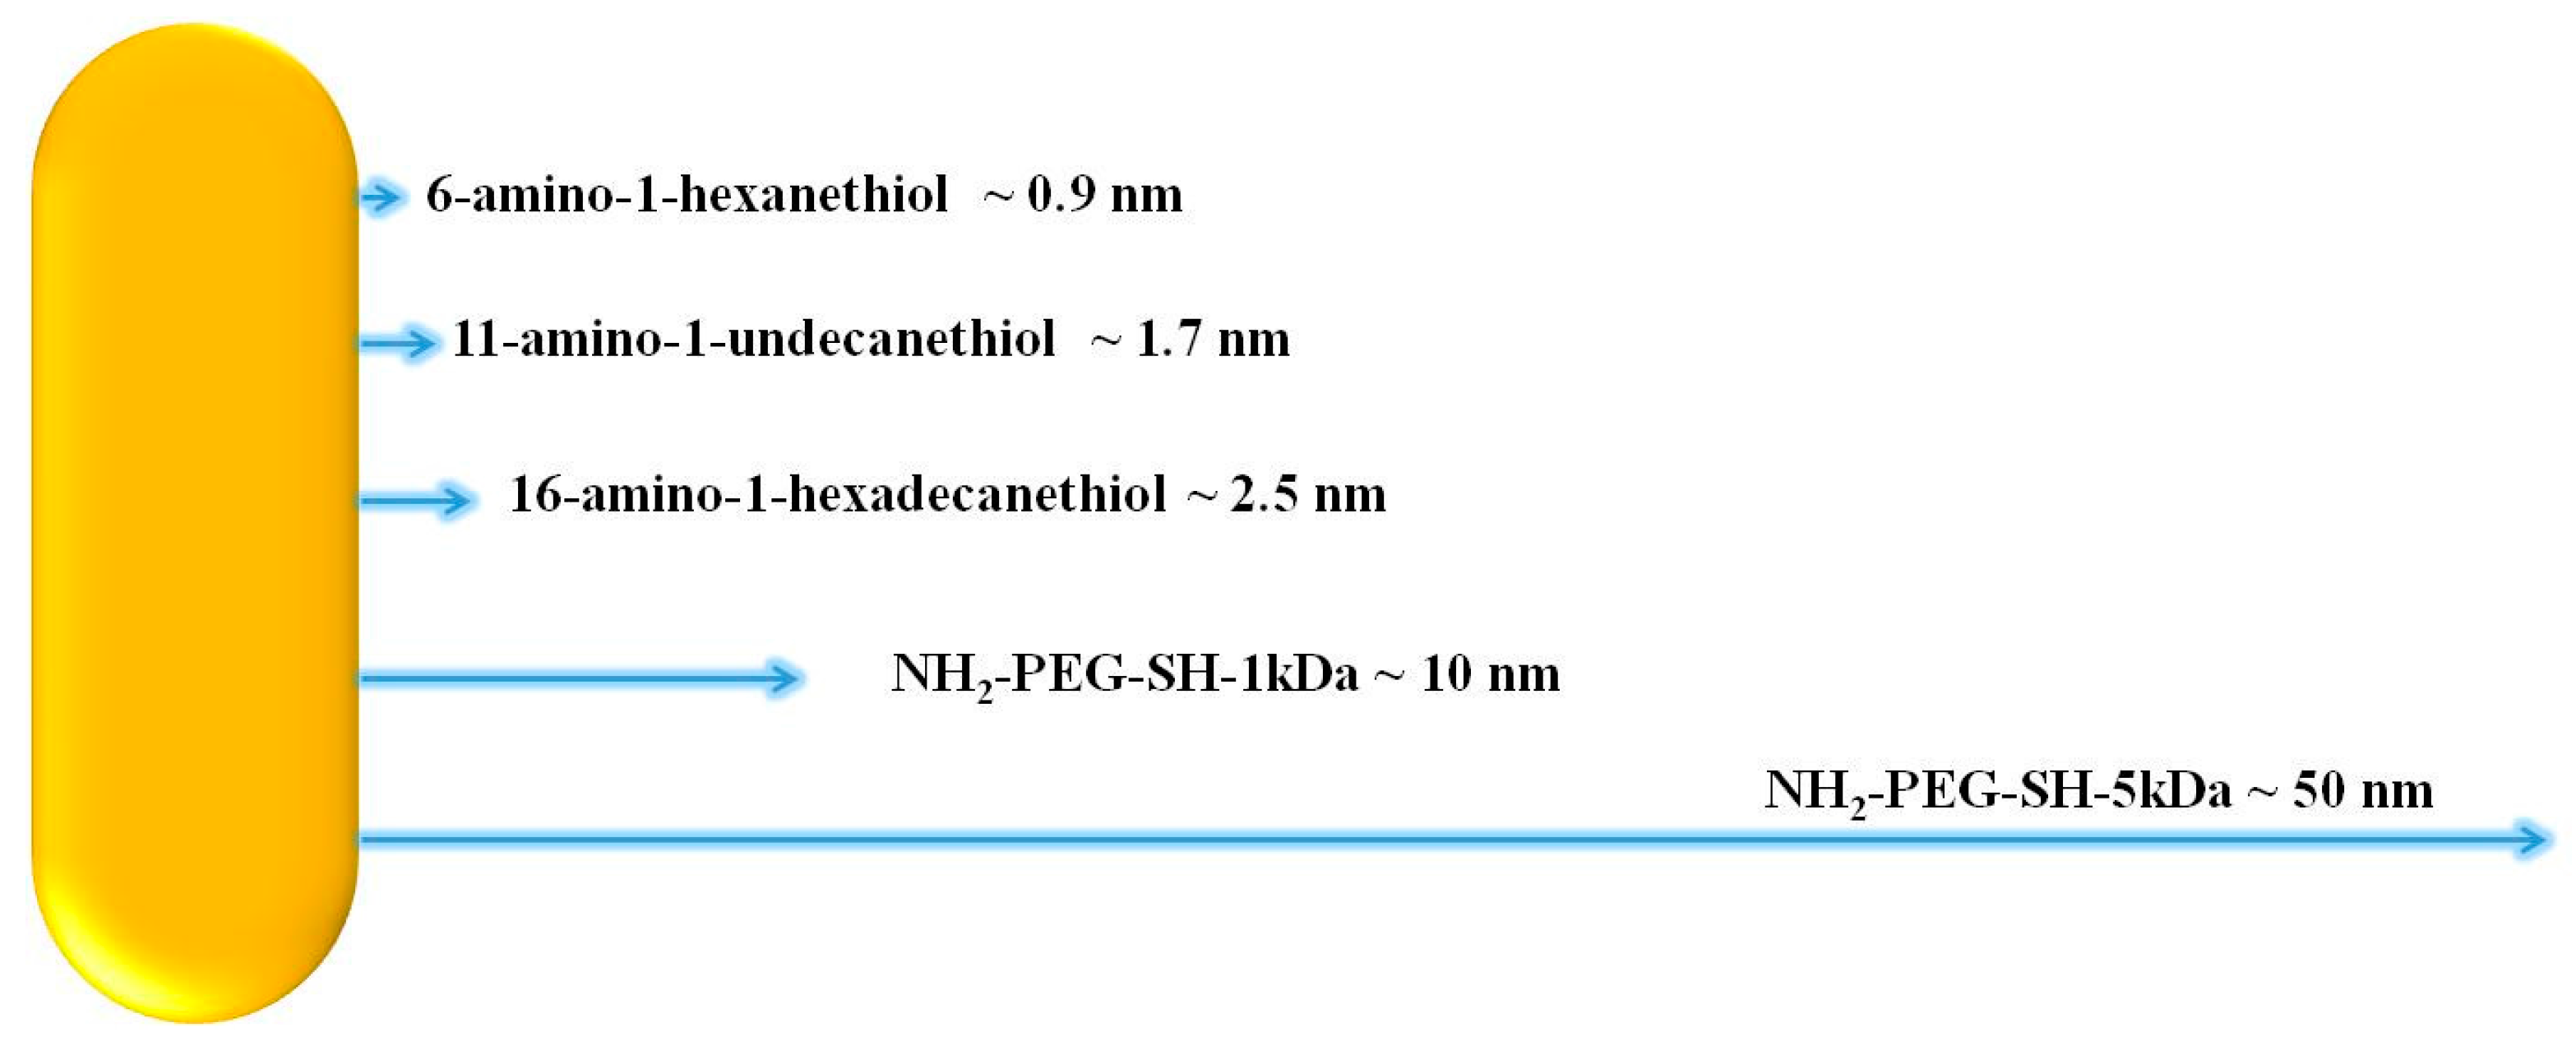
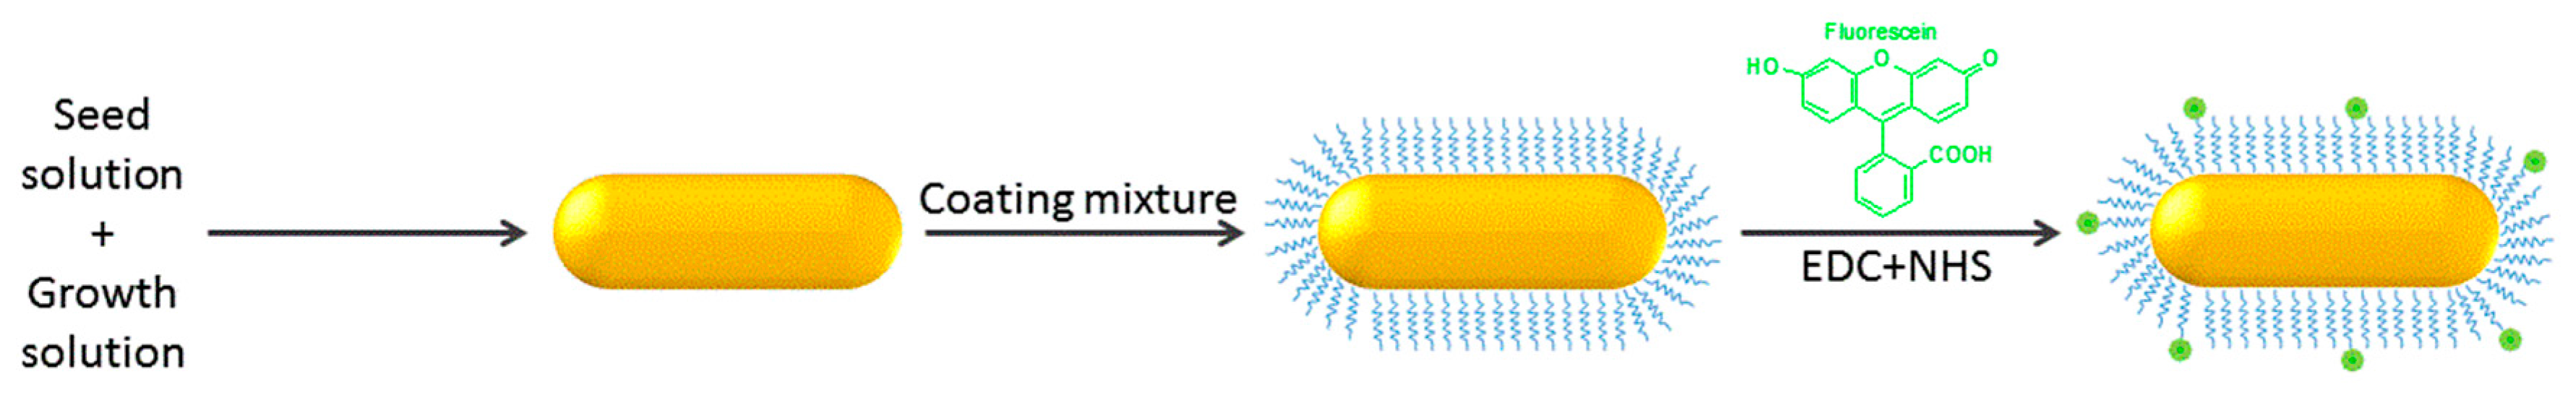
4.1. GNRs Fabriction
4.2. Flourescein Conjugation to GNRs
4.3. Solid Tissue-Like Phantom Preparation
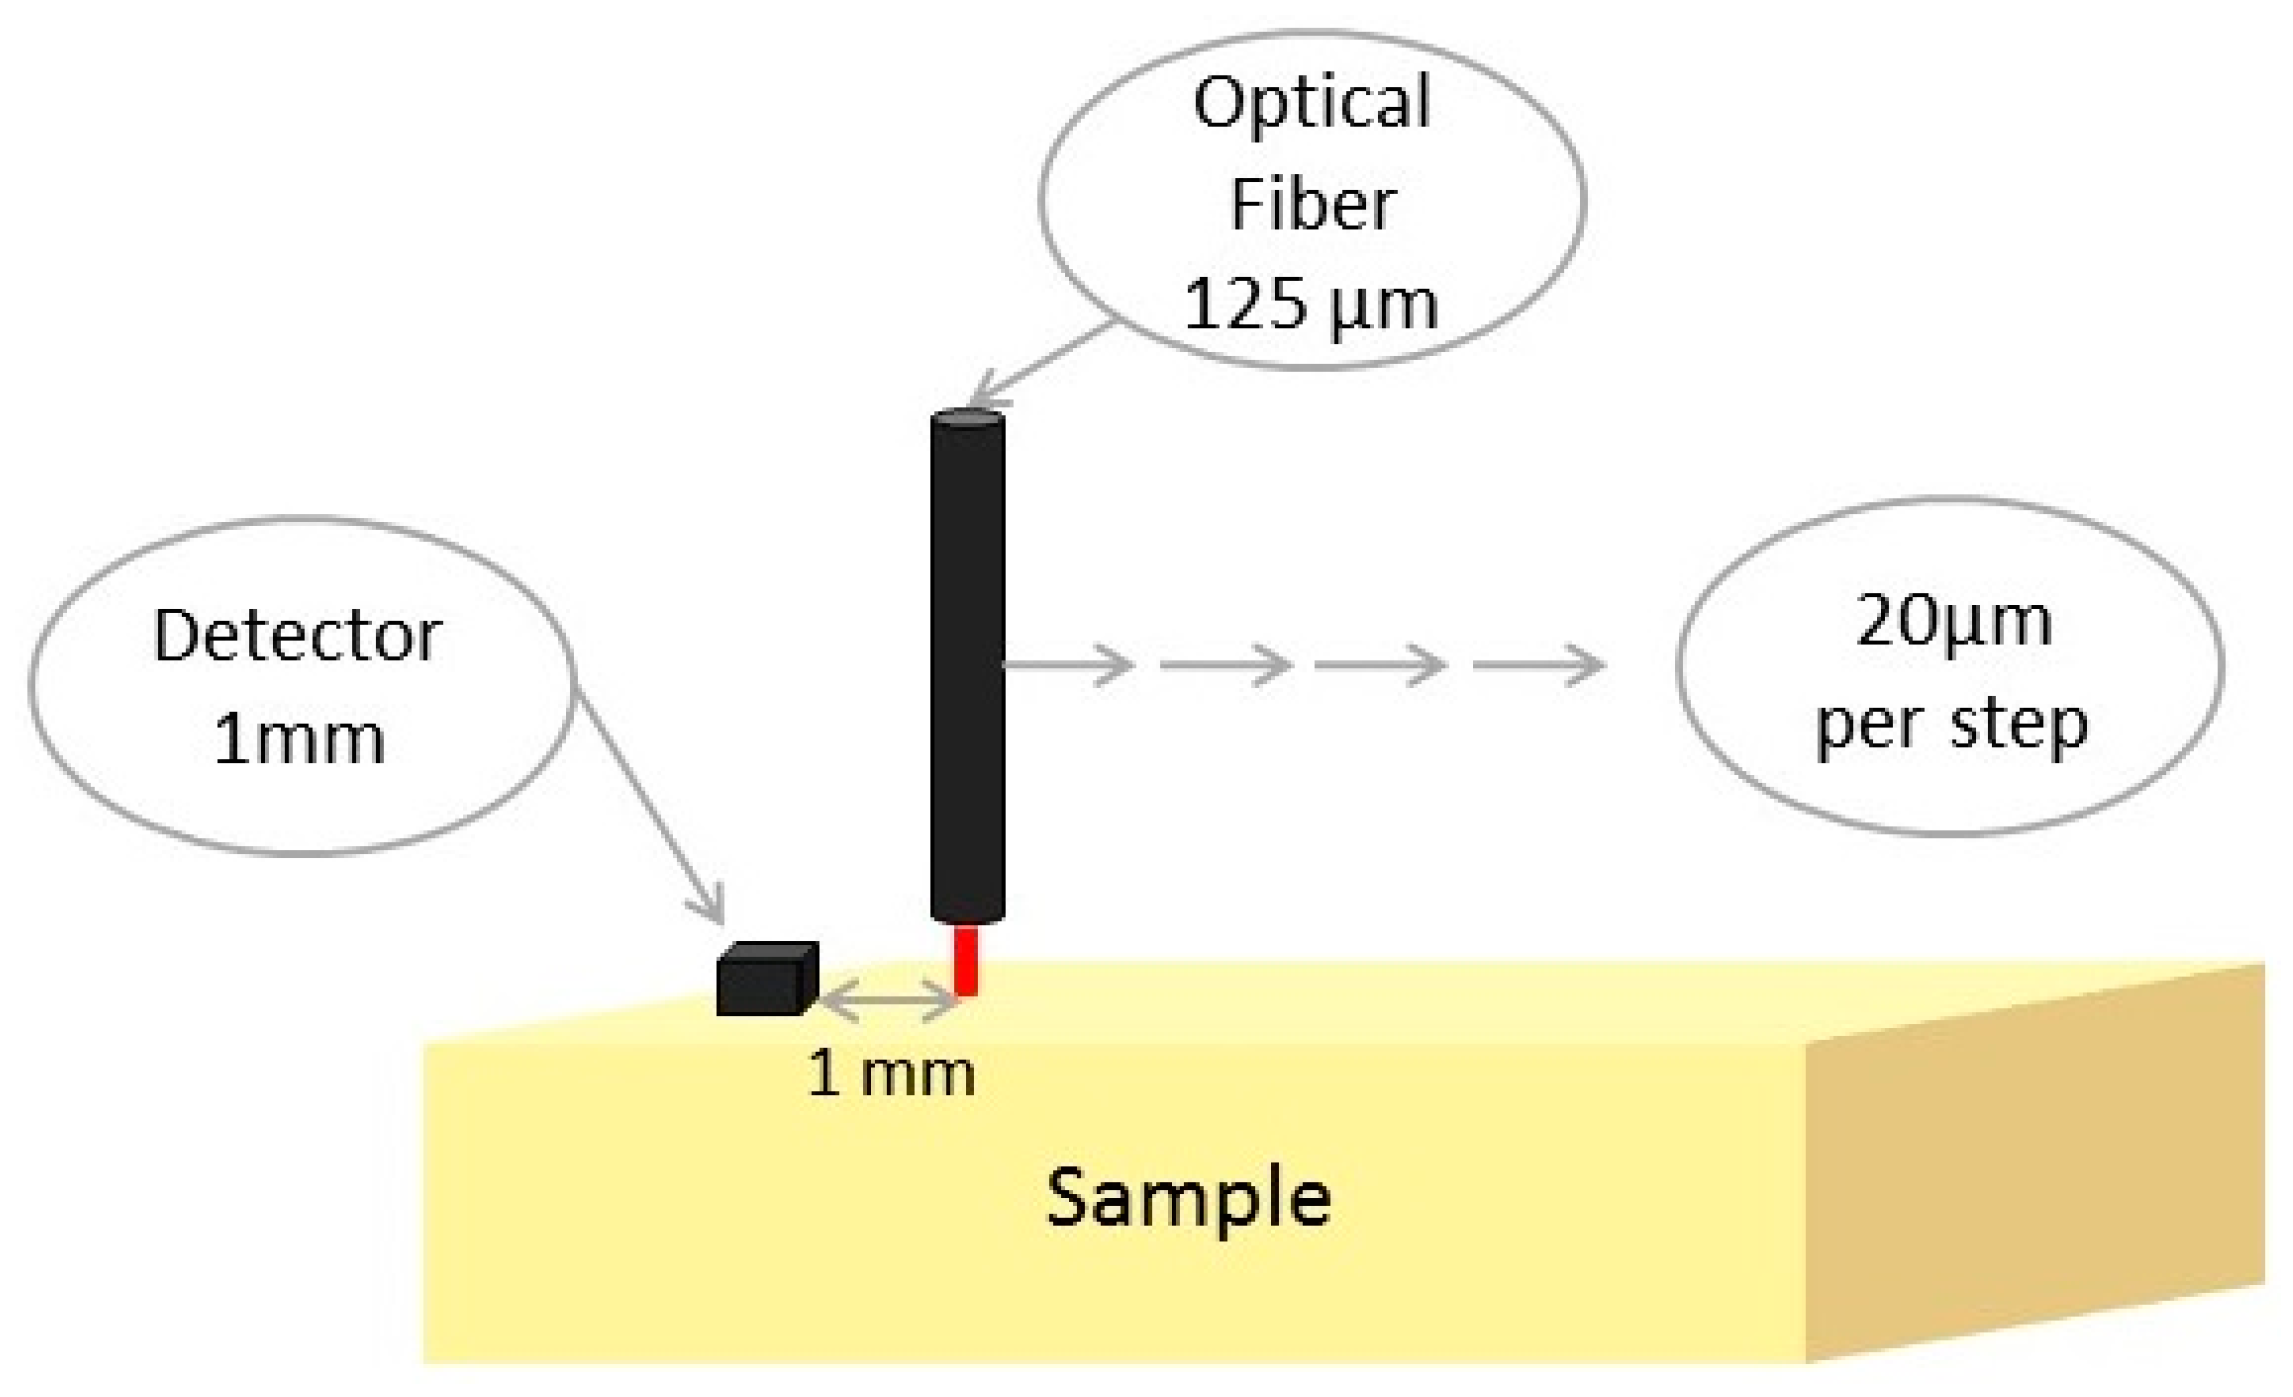
4.4. DR Measurments
4.5. FLIM Measurments
Author Contributions
Conflicts of Interest
References
- Pogue, B.W.; Patterson, M.S. Review of tissue simulating phantoms for optical spectroscopy, imaging and dosimetry. J. Biomed. Opt. 2006. [Google Scholar] [CrossRef] [PubMed]
- Cerussi, A.E.; Warren, R.; Hill, B.; Roblyer, D.; Leproux, A.; Durkin, A.F.; O’Sullivan, T.D.; Keene, S.; Haghany, H.; Quang, T.; et al. Tissue phantoms in multicenter clinical trials for diffuse optical technologies. Biomed. Opt. Express 2012, 3, 966–971. [Google Scholar] [CrossRef] [PubMed]
- Cubeddu, R.; Pifferi, A.; Taroni, P.; Torricelli, A.; Valentini, G. A solid tissue phantom for photon migration studies. Phys. Med. Biol. 1997, 42, 1971–1979. [Google Scholar] [CrossRef] [PubMed]
- Mano, I.; Goshima, H.; Nambu, M.; Iio, M. New polyvinyl alcohol gel material for mri phantoms. Magn. Reson. Med. 1986, 3, 921–926. [Google Scholar] [CrossRef] [PubMed]
- Ankri, R.; Taitelbaum, H.; Fixler, D. Reflected light intensity profile of two-layer tissues: Phantom experiments. J. Biomed. Opt. 2011. [Google Scholar] [CrossRef] [PubMed]
- Pan, Y.; Birngruber, R.; Rosperich, J.; Engelhardt, R. Low-coherence optical tomography in turbid tissue: Theoretical analysis. Appl. Opt. 1995, 34, 6564–6574. [Google Scholar] [CrossRef] [PubMed]
- Schmitt, J.; Lee, S.; Yung, K. An optical coherence microscope with enhanced resolving power in thick tissue. Opt. Commun. 1997, 142, 203–207. [Google Scholar] [CrossRef]
- Bays, R.; Wagnières, G.; Robert, D.; Theumann, J.F.; Vitkin, A.; Savary, J.F.; Monnier, P.; van den Bergh, H. Three-dimensional optical phantom and its application in photodynamic therapy. Lasers Surg. Med. 1997, 21, 227–234. [Google Scholar] [CrossRef]
- Surry, K.; Austin, H.; Fenster, A.; Peters, T. Poly(vinyl alcohol) cryogel phantoms for use in ultrasound and mr imaging. Phys. Med. Biol. 2004, 49, 5529–5546. [Google Scholar] [CrossRef] [PubMed]
- Kennedy, B.F.; Loitsch, S.; McLaughlin, R.A.; Scolaro, L.; Rigby, P.; Sampson, D.D. Fibrin phantom for use in optical coherence tomography. J. Biomed. Opt. 2010. [Google Scholar] [CrossRef] [PubMed]
- Leung, C.K.-S.; Cheung, C.Y.-L.; Weinreb, R.N.; Qiu, Q.; Liu, S.; Li, H.; Xu, G.; Fan, N.; Huang, L.; Pang, C.-P.; et al. Retinal nerve fiber layer imaging with spectral-domain optical coherence tomography: A variability and diagnostic performance study. Ophthalmology 2009, 116, 1257–1263. [Google Scholar] [CrossRef] [PubMed]
- Mayhew, T.M.; Mühlfeld, C.; Vanhecke, D.; Ochs, M. A review of recent methods for efficiently quantifying immunogold and other nanoparticles using tem sections through cells, tissues and organs. Ann. Anat.-Anat. Anz. 2009, 191, 153–170. [Google Scholar] [CrossRef] [PubMed]
- Ng, E.-K. A review of thermography as promising non-invasive detection modality for breast tumor. Int. J. Therm. Sci. 2009, 48, 849–859. [Google Scholar] [CrossRef]
- Cherry, S.R. Multimodality in vivo imaging systems: Twice the power or double the trouble? Annu. Rev. Biomed. Eng. 2006, 8, 35–62. [Google Scholar] [CrossRef] [PubMed]
- Kim, J.; Piao, Y.; Hyeon, T. Multifunctional nanostructured materials for multimodal imaging, and simultaneous imaging and therapy. Chem. Soc. Rev. 2009, 38, 372–390. [Google Scholar] [CrossRef] [PubMed]
- Lee, D.-E.; Koo, H.; Sun, I.-C.; Ryu, J.H.; Kim, K.; Kwon, I.C. Multifunctional nanoparticles for multimodal imaging and theragnosis. Chem. Soc. Rev. 2012, 41, 2656–2672. [Google Scholar] [CrossRef] [PubMed]
- Srinivas, M.; Melero, I.; Kaempgen, E.; Figdor, C.G.; Vries, I.J.M. Cell tracking using multimodal imaging. Contrast Media Mol. Imaging 2013, 8, 432–438. [Google Scholar] [CrossRef] [PubMed]
- Jennings, L.E.; Long, N.J. ‘Two is better than one’—Probes for dual-modality molecular imaging. Chem. Commun. 2009, 3511–3524. [Google Scholar] [CrossRef] [PubMed]
- Louie, A. Multimodality imaging probes: Design and challenges. Chem. Rev. 2010, 110, 3146–3195. [Google Scholar] [CrossRef] [PubMed]
- Glickson, J.D.; Lund-Katz, S.; Zhou, R.; Choi, H.; Chen, I.W.; Li, H.; Corbin, I.; Popov, A.V.; Cao, W.; Song, L.; et al. Lipoprotein nanoplatform for targeted delivery of diagnostic and therapeutic agents. Mol. Imaging 2008, 7, 101–110. [Google Scholar] [PubMed]
- Al-Jamal, W.T.; Kostarelos, K. Liposome-nanoparticle hybrids for multimodal diagnostic and therapeutic applications. Nanomedicine 2007, 2, 85–98. [Google Scholar] [CrossRef] [PubMed]
- Kaneda, M.M.; Caruthers, S.; Lanza, G.M.; Wickline, S.A. Perfluorocarbon nanoemulsions for quantitative molecular imaging and targeted therapeutics. Ann. Biomed. Eng. 2009, 37, 1922–1933. [Google Scholar] [CrossRef] [PubMed]
- Hughes, M.; Caruthers, S.; Tran, T.; Marsh, J.; Wallace, K.; Cyrus, T.; Partlow, K.; Scott, M.; Lijowski, M.; Neubauer, A. Perfluorocarbon nanoparticles for molecular imaging and targeted therapeutics. Proc. IEEE 2008, 96, 397–415. [Google Scholar] [CrossRef]
- Mulder, W.J.; Strijkers, G.J.; van Tilborg, G.A.; Cormode, D.P.; Fayad, Z.A.; Nicolay, K. Nanoparticulate assemblies of amphiphiles and diagnostically active materials for multimodality imaging. Acc. Chem. Res. 2009, 42, 904–914. [Google Scholar] [CrossRef] [PubMed]
- Hüber, M.M.; Staubli, A.B.; Kustedjo, K.; Gray, M.H.; Shih, J.; Fraser, S.E.; Jacobs, R.E.; Meade, T.J. Fluorescently detectable magnetic resonance imaging agents. Bioconj. Chem. 1998, 9, 242–249. [Google Scholar] [CrossRef] [PubMed]
- Uzgiris, E.E.; Sood, A.; Bove, K.; Grimmond, B.; Lee, D.; Lomnes, S. A multimodal contrast agent for preoperative MR imaging and intraoperative tumor margin delineation. Technol. Cancer Res. Treat. 2006, 5, 301–309. [Google Scholar] [CrossRef] [PubMed]
- Fixler, D.; Nayhoz, T.; Ray, K. Diffusion reflection and fluorescence lifetime imaging microscopy study of fluorophore-conjugated gold nanoparticles or nanorods in solid phantoms. ACS Photonics 2014, 1, 900–905. [Google Scholar] [CrossRef] [PubMed]
- Barnoy, E.; Fixler, D.; Popovtzer, R.; Nayhoz, T.; Ray, K. An ultra-sensitive dual imaging system of diffusion reflection and fluorescence lifetime imaging microscopy using metal enhanced fluorescence in solid phantoms. Nano Res. 2015, 8, 3912–3921. [Google Scholar] [CrossRef] [PubMed]
- Ray, K.; Lakowicz, J.R. Metal-enhanced fluorescence lifetime imaging and spectroscopy on a modified SERs substrate. J. Phys. Chem. C 2013, 117, 15790–15797. [Google Scholar] [CrossRef] [PubMed]
- Kühn, S.; Håkanson, U.; Rogobete, L.; Sandoghdar, V. Enhancement of single-molecule fluorescence using a gold nanoparticle as an optical nanoantenna. Phys. Rev. Lett. 2006, 97, 017402. [Google Scholar] [CrossRef] [PubMed]
- Zhou, Z.; Huang, H.; Chen, Y.; Liu, F.; Huang, C.Z.; Li, N. A distance-dependent metal-enhanced fluorescence sensing platform based on molecular beacon design. Biosens. Bioelectron. 2014, 52, 367–373. [Google Scholar] [CrossRef] [PubMed]
- Seelig, J.; Leslie, K.; Renn, A.; Kühn, S.; Jacobsen, V.; van de Corput, M.; Wyman, C.; Sandoghdar, V. Nanoparticle-induced fluorescence lifetime modification as nanoscopic ruler: Demonstration at the single molecule level. Nano Lett. 2007, 7, 685–689. [Google Scholar] [CrossRef] [PubMed]
- Lakowicz, J.R. Radiative decay engineering 5: Metal-enhanced fluorescence and plasmon emission. Anal. Biochem. 2005, 337, 171–194. [Google Scholar] [CrossRef] [PubMed]
- Lakowicz, J.R. Radiative decay engineering: Metal-enhanced fluorescence. In Principles of Fluorescence Spectroscopy, 3rd ed.; Springer: New York, NY, USA, 2006; pp. 841–859. [Google Scholar]
- Lakowicz, J.R.; Ray, K.; Chowdhury, M.; Szmacinski, H.; Fu, Y.; Zhang, J.; Nowaczyk, K. Plasmon-controlled fluorescence: A new paradigm in fluorescence spectroscopy. Analyst 2008, 133, 1308–1346. [Google Scholar] [CrossRef] [PubMed]
- Lakowicz, J.R. Introduction to fluorescence. In Principles of Fluorescence Spectroscopy, 3rd ed.; Springer: New York, NY, USA, 2006; pp. 1–24. [Google Scholar]
- Nikoobakht, B.; El-Sayed, M.A. Preparation and growth mechanism of gold nanorods (NRS) using seed-mediated growth method. Chem. Mater. 2003, 15, 1957–1962. [Google Scholar] [CrossRef]
- Thermo Fisher Scientific. Available online: http://www.Piercenet.Com/product/nhs-sulfo-nhs (accessed on 19 September 2016).
- Shilo, M.; Motiei, M.; Hana, P.; Popovtzer, R. Transport of nanoparticles through the blood–brain barrier for imaging and therapeutic applications. Nanoscale 2014, 6, 2146–2152. [Google Scholar] [CrossRef] [PubMed]
- Ankri, R.; Duadi, H.; Motiei, M.; Fixler, D. In-vivo tumor detection using diffusion reflection measurements of targeted gold nanorods—A quantitative study. J. Biophotonics 2012, 5, 263–273. [Google Scholar] [CrossRef] [PubMed]


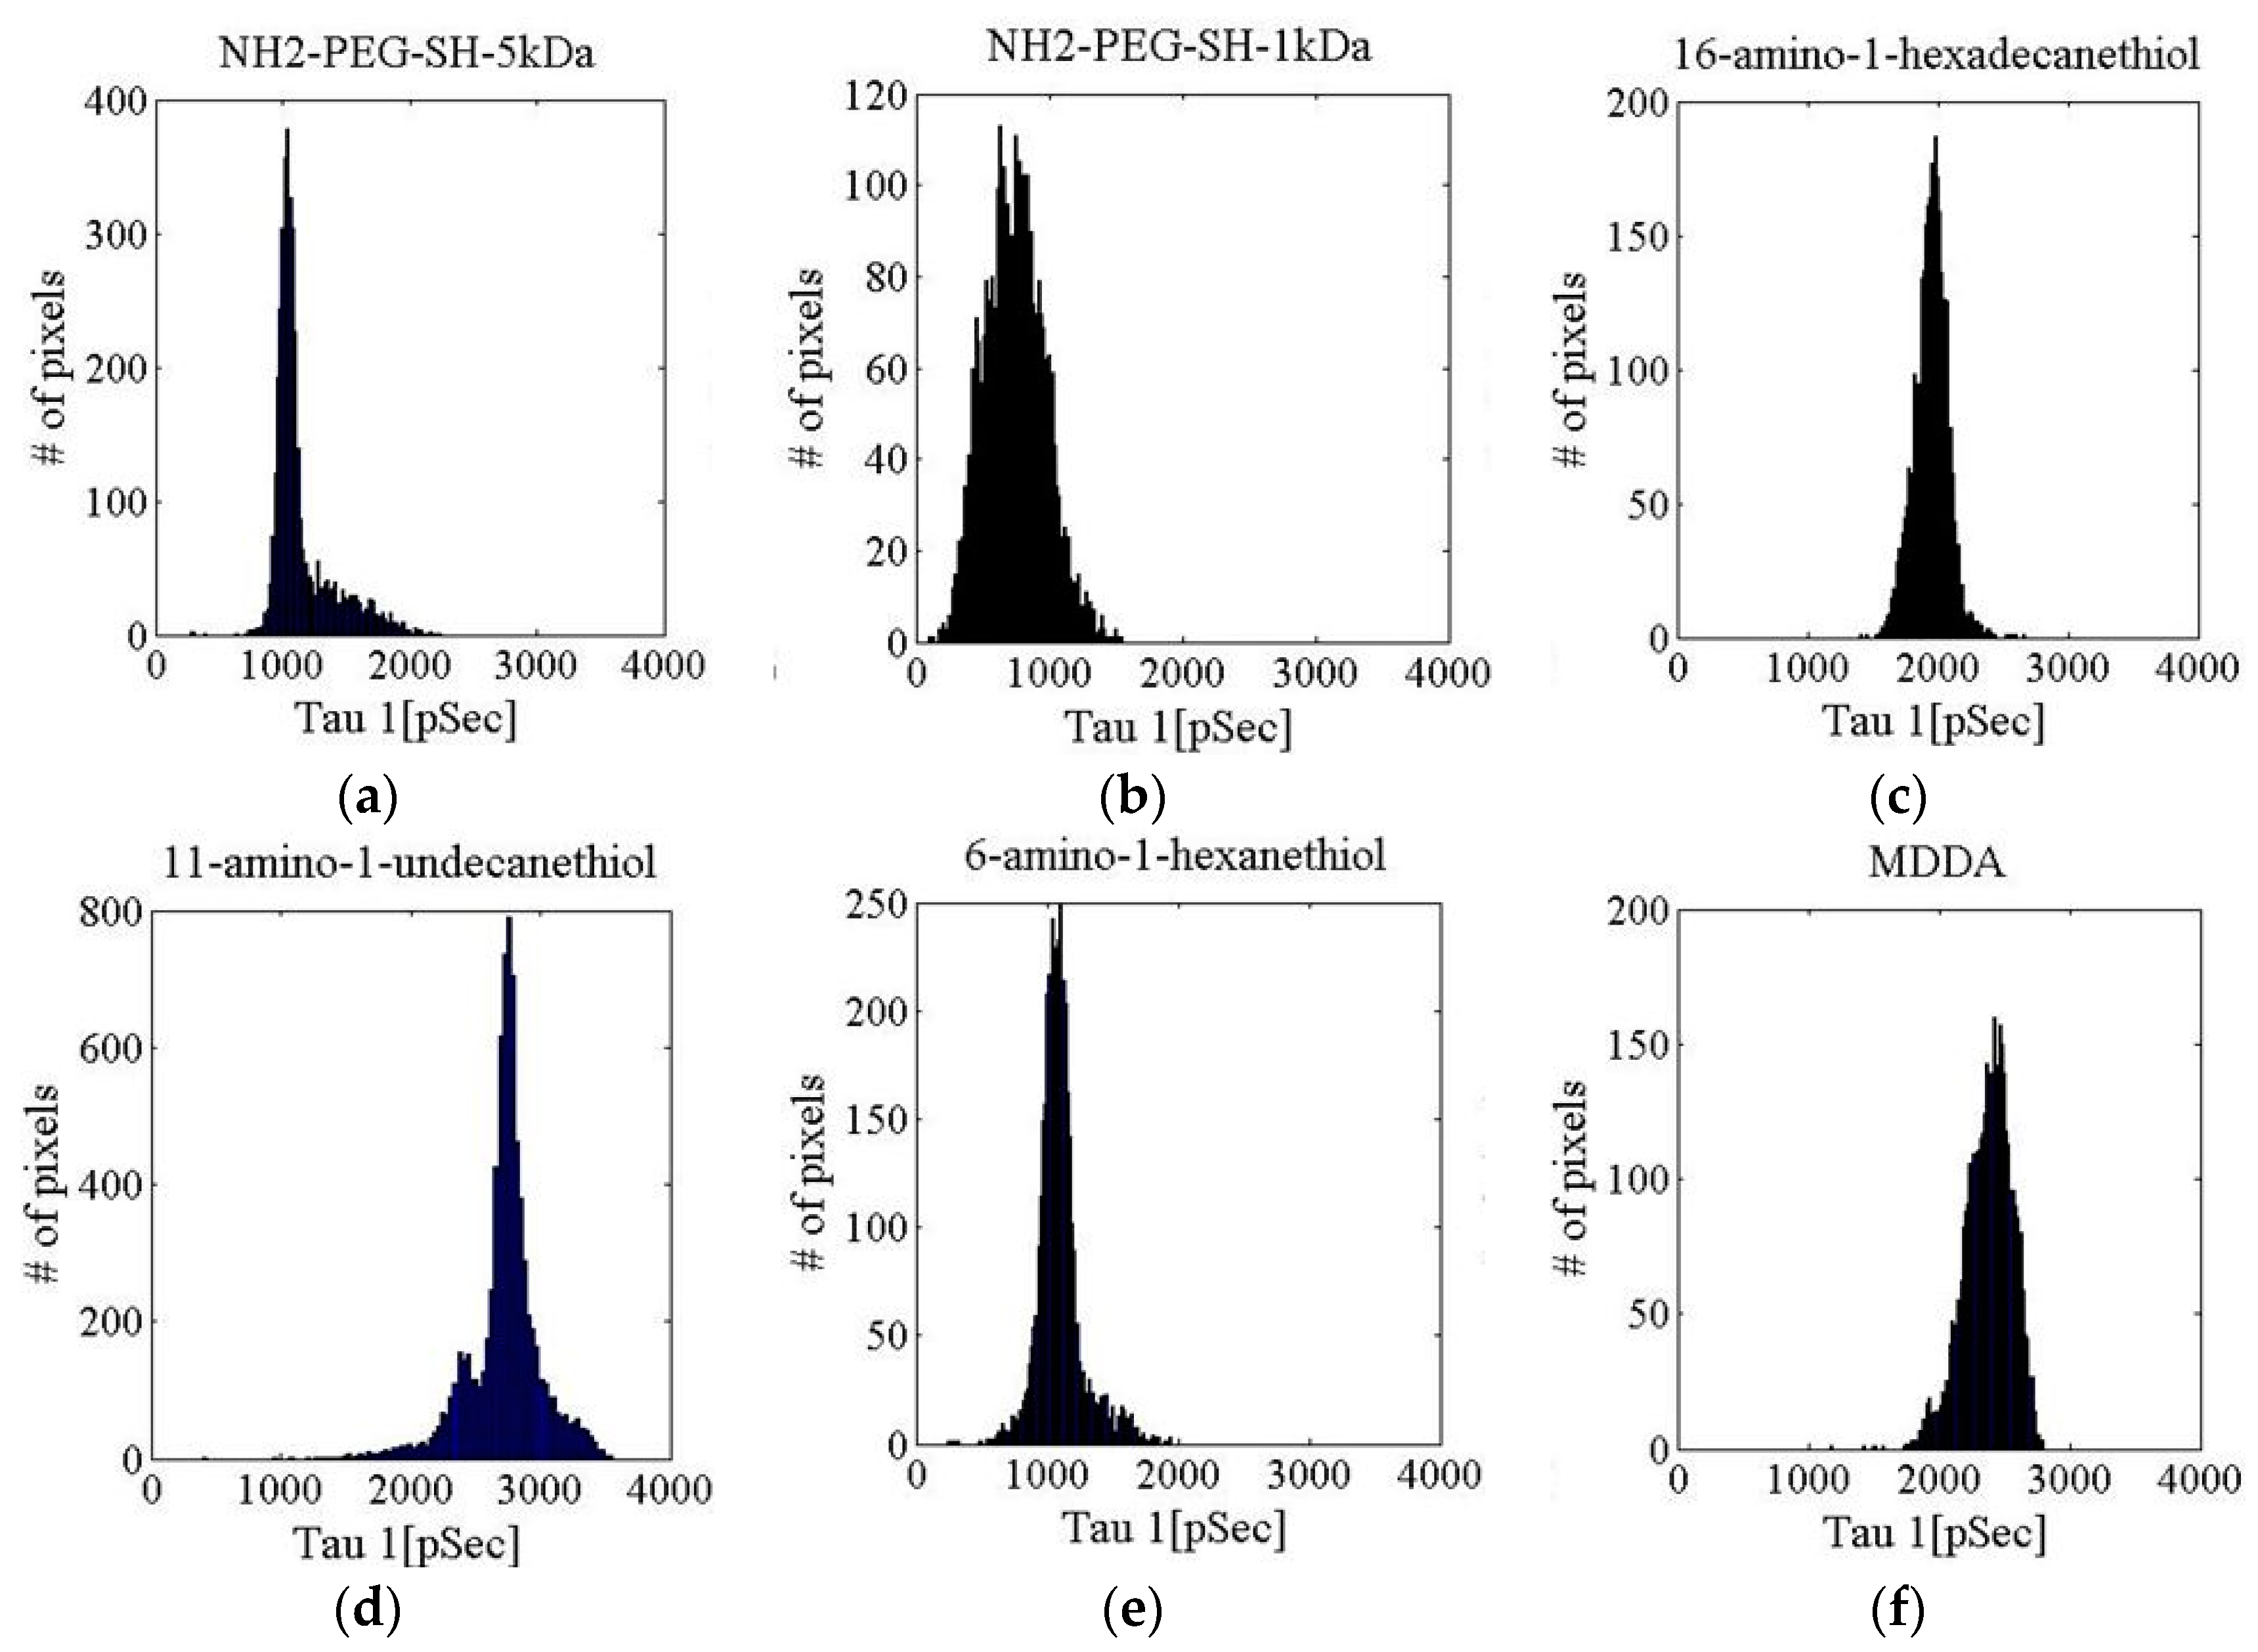
| Linker Type | Estimated Linker Length [nm] | a1%—Average | a1%—STD | τ1—Average [ns] | τ1—STD [ns] | χ2—Average | χ2—STD |
|---|---|---|---|---|---|---|---|
| NH2-PEG-SH-5 kDa | 50 | 81.16 | 6.13 | 1.15 | 0.24 | 1.312 | 0.535 |
| NH2-PEG-SH-1 kDa | 10 | 91.15 | 6.52 | 0.74 | 0.23 | 1.461 | 0.327 |
| 16-amino-1-hexadecanethiol | 2.5 | 87.02 | 3.55 | 1.95 | 0.13 | 1.609 | 0.149 |
| 11-amino-1-undecanethiol | 1.7 | 66.13 | 13.49 | 2.72 | 0.28 | 1.366 | 0.332 |
| 6-amino-1-hexanethiol | 0.9 | 81.03 | 6.46 | 1.10 | 0.17 | 1.259 | 0.360 |
| 3,4-methylenedioxy-N,N-dimethylamphetamine (MDDA) | Unkown | 80.84 | 6.84 | 2.38 | 0.18 | 1.124 | 0.132 |
| Linker Type | a1%—Average | a1%—STD | τ1—Average [ns] | τ1—STD [ns] | χ2—Average | χ2—STD |
|---|---|---|---|---|---|---|
| NH2-PEG-SH-5 kDa (1) | 81.31 | 5.00 | 0.81 | 0.11 | 5.25 | 1.02 |
| NH2-PEG-SH-5 kDa (2) | 78.18 | 7.57 | 0.96 | 0.23 | 2.86 | 0.53 |
| NH2-PEG-SH-5 kDa (3) | 70.10 | 10.31 | 0.54 | 0.21 | 2.71 | 0.55 |
| NH2-PEG-SH-1 kDa (1) | 65.29 | 8.31 | 0.58 | 0.11 | 1.25 | 0.13 |
| NH2-PEG-SH-1 kDa (2) | 81.77 | 3.72 | 0.89 | 0.11 | 2.75 | 0.37 |
| NH2-PEG-SH-1 kDa (3) | 74.38 | 3.33 | 0.35 | 0.11 | 1.67 | 0.21 |
| 16-amino-1-hexadecanethiol (1) | 78.15 | 3.84 | 0.69 | 0.13 | 3.74 | 0.70 |
| 16-amino-1-hexadecanethiol (2) | 72.23 | 4.48 | 0.43 | 0.10 | 2.12 | 0.34 |
| 16-amino-1-hexadecanethiol (3) | 77.46 | 8.68 | 1.22 | 0.31 | 2.01 | 0.36 |
| 11-amino-1-undecanethiol (1) | 79.80 | 3.71 | 0.85 | 0.08 | 7.29 | 1.37 |
| 11-amino-1-undecanethiol (2) | 65.91 | 3.63 | 0.46 | 0.08 | 3.38 | 0.60 |
| 11-amino-1-undecanethiol (3) | 67.60 | 6.82 | 0.73 | 0.16 | 4.40 | 0.87 |
| 6-amino-1-hexanethiol (1) | 50.15 | 18.90 | 2.29 | 0.67 | 1.19 | 0.18 |
| 6-amino-1-hexanethiol (2) | 50.99 | 13.16 | 1.21 | 0.57 | 1.60 | 0.65 |
| 6-amino-1-hexanethiol (3) | 52.15 | 10.57 | 1.09 | 0.41 | 1.35 | 0.79 |
| MDDA (1) | 82.41 | 9.83 | 1.69 | 0.25 | 1.20 | 0.16 |
| MDDA (2) | 74.63 | 9.08 | 0.92 | 0.19 | 3.90 | 0.79 |
| MDDA (3) | 60.76 | 3.29 | 0.51 | 0.10 | 1.81 | 0.24 |
| Linker A | % Coating A | Estimated Linker Length [nm] | Linker B | % Coating B | % Coating Fluorescein | Binding Type |
|---|---|---|---|---|---|---|
| NH2-PEG-SH-5 kDa (MW 5000 g/mol) | 10% | 50 | mPEG-SH-5 kDa (MW 5000 g/mol) | 90% | 10% | Covalent binding |
| NH2-PEG-SH-1 kDa (MW 5000 g/mol) | 10% | 10 | mPEG-SH-1 kDa (MW 1000 g/mol) | 90% | 10% | Covalent binding |
| 16-amino-1-hexadecanethiol (MW 309.98 g/mol) | 10% | 2.5 | 1-octanethiol 98.5+% (MW 146.29 g/mol) | 90% | 10% | Covalent binding |
| 11-amino-1-undecanethiol (MW 239.85 g/mol) | 10% | 1.7 | 1-octanethiol 98.5+% (MW 146.29 g/mol) | 90% | 10% | Covalent binding |
| 6-amino-1-hexanethiol (MW 169.72 g/mol) | 10% | 0.9 | 1-octanethiol 98.5+% (MW 146.29 g/mol) | 90% | 10% | Covalent binding |
| 3,4-methylenedioxy-N,N-dimethylamphetamine (MDDA) (MW 207.26888 g/mol) | 100% | - | - | - | 10% | Overlap binding |
| IL | India Ink (Diluted to 0.1%) | Wanted Solution | DDW | Agarose Powder |
|---|---|---|---|---|
| 10% of the total volume | 3% of the total volume | X% of the total volume (depends on the wanted concentration in the phantom) | (87−X)% of the total volume | 1% (defined as 1 g per 100 mL) |
© 2016 by the authors; licensee MDPI, Basel, Switzerland. This article is an open access article distributed under the terms and conditions of the Creative Commons Attribution (CC-BY) license (http://creativecommons.org/licenses/by/4.0/).
Share and Cite
Nayhoz, T.; Barnoy, E.A.; Fixler, D. Tissue-Like Phantoms as a Platform for Inserted Fluorescence Nano-Probes. Materials 2016, 9, 926. https://doi.org/10.3390/ma9110926
Nayhoz T, Barnoy EA, Fixler D. Tissue-Like Phantoms as a Platform for Inserted Fluorescence Nano-Probes. Materials. 2016; 9(11):926. https://doi.org/10.3390/ma9110926
Chicago/Turabian StyleNayhoz, Tsviya, Eran A. Barnoy, and Dror Fixler. 2016. "Tissue-Like Phantoms as a Platform for Inserted Fluorescence Nano-Probes" Materials 9, no. 11: 926. https://doi.org/10.3390/ma9110926
APA StyleNayhoz, T., Barnoy, E. A., & Fixler, D. (2016). Tissue-Like Phantoms as a Platform for Inserted Fluorescence Nano-Probes. Materials, 9(11), 926. https://doi.org/10.3390/ma9110926