Article

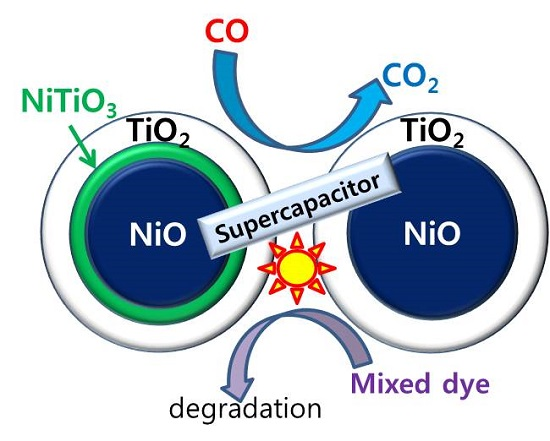
Application of Ni-Oxide@TiO2 Core-Shell Structures to Photocatalytic Mixed Dye Degradation, CO Oxidation, and Supercapacitors

1
Department of Chemistry, Yeugnam University, Gyeongsan 38541, Korea
2
Department of Mechanical Engineering, Chungnam National University, Daejeon 34134, Korea
*
Authors to whom correspondence should be addressed.
Materials 2016, 9(12), 1024; https://doi.org/10.3390/ma9121024
Submission received: 14 October 2016 / Revised: 20 November 2016 / Accepted: 16 December 2016 / Published: 20 December 2016
(This article belongs to the Section Advanced Composites)

Abstract

:
Performing diverse application tests on synthesized metal oxides is critical for identifying suitable application areas based on the material performances. In the present study, Ni-oxide@TiO2 core-shell materials were synthesized and applied to photocatalytic mixed dye (methyl orange + rhodamine + methylene blue) degradation under ultraviolet (UV) and visible lights, CO oxidation, and supercapacitors. Their physicochemical properties were examined by field-emission scanning electron microscopy, X-ray diffraction analysis, Fourier-transform infrared spectroscopy, and UV-visible absorption spectroscopy. It was shown that their performances were highly dependent on the morphology, thermal treatment procedure, and TiO2 overlayer coating.

Graphical Abstract

1. Introduction

Core-shell nanostructures have been developed to obtain synergistic effects between core materials and interfacial formations by controlling the shell thickness [1,2,3,4,5,6,7]. Core-shell materials obtained by hybridization of two different materials can provide substantial advantages. Hybridization of Ni oxide (or Ni) and TiO2 has been studied and applied to the development of energy storage materials, ultraviolet detectors, CO2 reduction, various catalytic reactions such as hydrogen production and CO methanation, and photocatalysis [4,5,6,7,8,9,10,11,12,13,14,15,16,17,18,19]. Various hybridization methods were employed to synthesize materials with diverse morphologies [20], including template-assisted electrodeposition [11], anodizing process [21,22], hydrothermal method [4,6,9], and flame spray pyrolysis [12]. To synthesize three-dimensional (3D) Ni/TiO2 nanowires, Wang et al. employed Ni electrodeposition by using a porous anodic alumina template, followed by TiO2 coating by atomic layer deposition; notably, they reported substantial increases in areal discharging capacity and rate capability [11]. Kim et al. fabricated NiO-TiO2 nanotube arrays (NTAs) by anodizing Ni-Ti foils at potentials in the range of 20–80 V, and used them in supercapacitors [8]. Li-storage performance (areal discharge capacity) and stability (cyclic performance) of 3D NiO nanostructures were found to substantially increase upon loading of TiO2 nanoparticles (NPs) [9]. Ke et al. synthesized TiO2@Ni(OH)2 core-shell nanowire arrays by hydrothermal method and chemical bath deposition, obtaining a supercapacitor with a high capacity of 264 mA·h·g−1 [4]. Ni-Ti-O NTAs by electrochemical anodization were also used for catalytic electro-oxidation of methanol [22]. Enhanced photocatalytic degradation of methyl orange (MO) was reported when using NiO-TiO2 NTAs [23]. The enhanced efficiency (compared with that of bare TiO2 NTAs) was attributed to the interfacial charge transfer of photogenerated electrons from TiO2 to NiO [23]. Yu et al. used a hierarchical porous flower-like NiO/TiO2 p-n junction for photocatalytic removal of p-chlorophenol, and observed remarkable photocatalytic activity as well as cycling stability [24]. Disinfection of bacteria (e.g., Escherichia coli) was demonstrated by using NiO-TiO2 composite NPs [25]. Chockalingam et al. showed that composite NPs were more efficient than bare TiO2 NPs for photocatalytic degradation of phenol [25]. However, their photocatalytic efficiency was poorer than that of bare TiO2 for the degradation of rhodamine B (RhB) and methylene blue (MB) [25]. Shinde and Madrad prepared Ni NPs supported on TiO2 by low-temperature sonication method, reporting higher stability and activity for the CO methanation reaction which was attributed to the strong metal-support interaction, and created oxygen defects [14]. Ong et al. prepared CNT@Ni/TiO2 nanocomposites by coprecipitation and subsequent chemical vapor deposition, reporting high CH4 production (from CO2) yield of 0.145 μmol·g−1·h−1 [15]. Gao et al. demonstrated the use of nanoporous NiO/TiO2 layers as a glucose sensor with a detection limit of 1.0 μM and a sensitivity of 252.0 μA·mM−1·cm−2 [26]. Other various TiO2-based core-shell structures such as SiO2@TiO2 microspheres and PS/Au/TiO2 nanospheres have been successfully applied for photocatalysis, light trapping, and advanced diagnostics [27,28,29,30,31]. For example, Alessandri prepared SiO2@TiO2 core-shell microspheres by atomic layer deposition and found a remarkable enhancement of Raman scattering without plasmonic enhancers [29,30].
Although NiO@TiO2 and TiO2@NiO core-shell materials were reported, until now, thorough studies on the diverse applications of the same materials treated with different methods have not been reported. The novelty of the present study stems from the use of NiO@TiO2 core-shells in three different application areas—i.e., photocatalytic dye degradation for water treatment, CO oxidation for air treatment, and supercapacitors for energy storage. In addition, the application efficiency was found to be affected by the thermal treatment procedure. The results obtained here can be very useful for the development of hybrid materials in various fields.

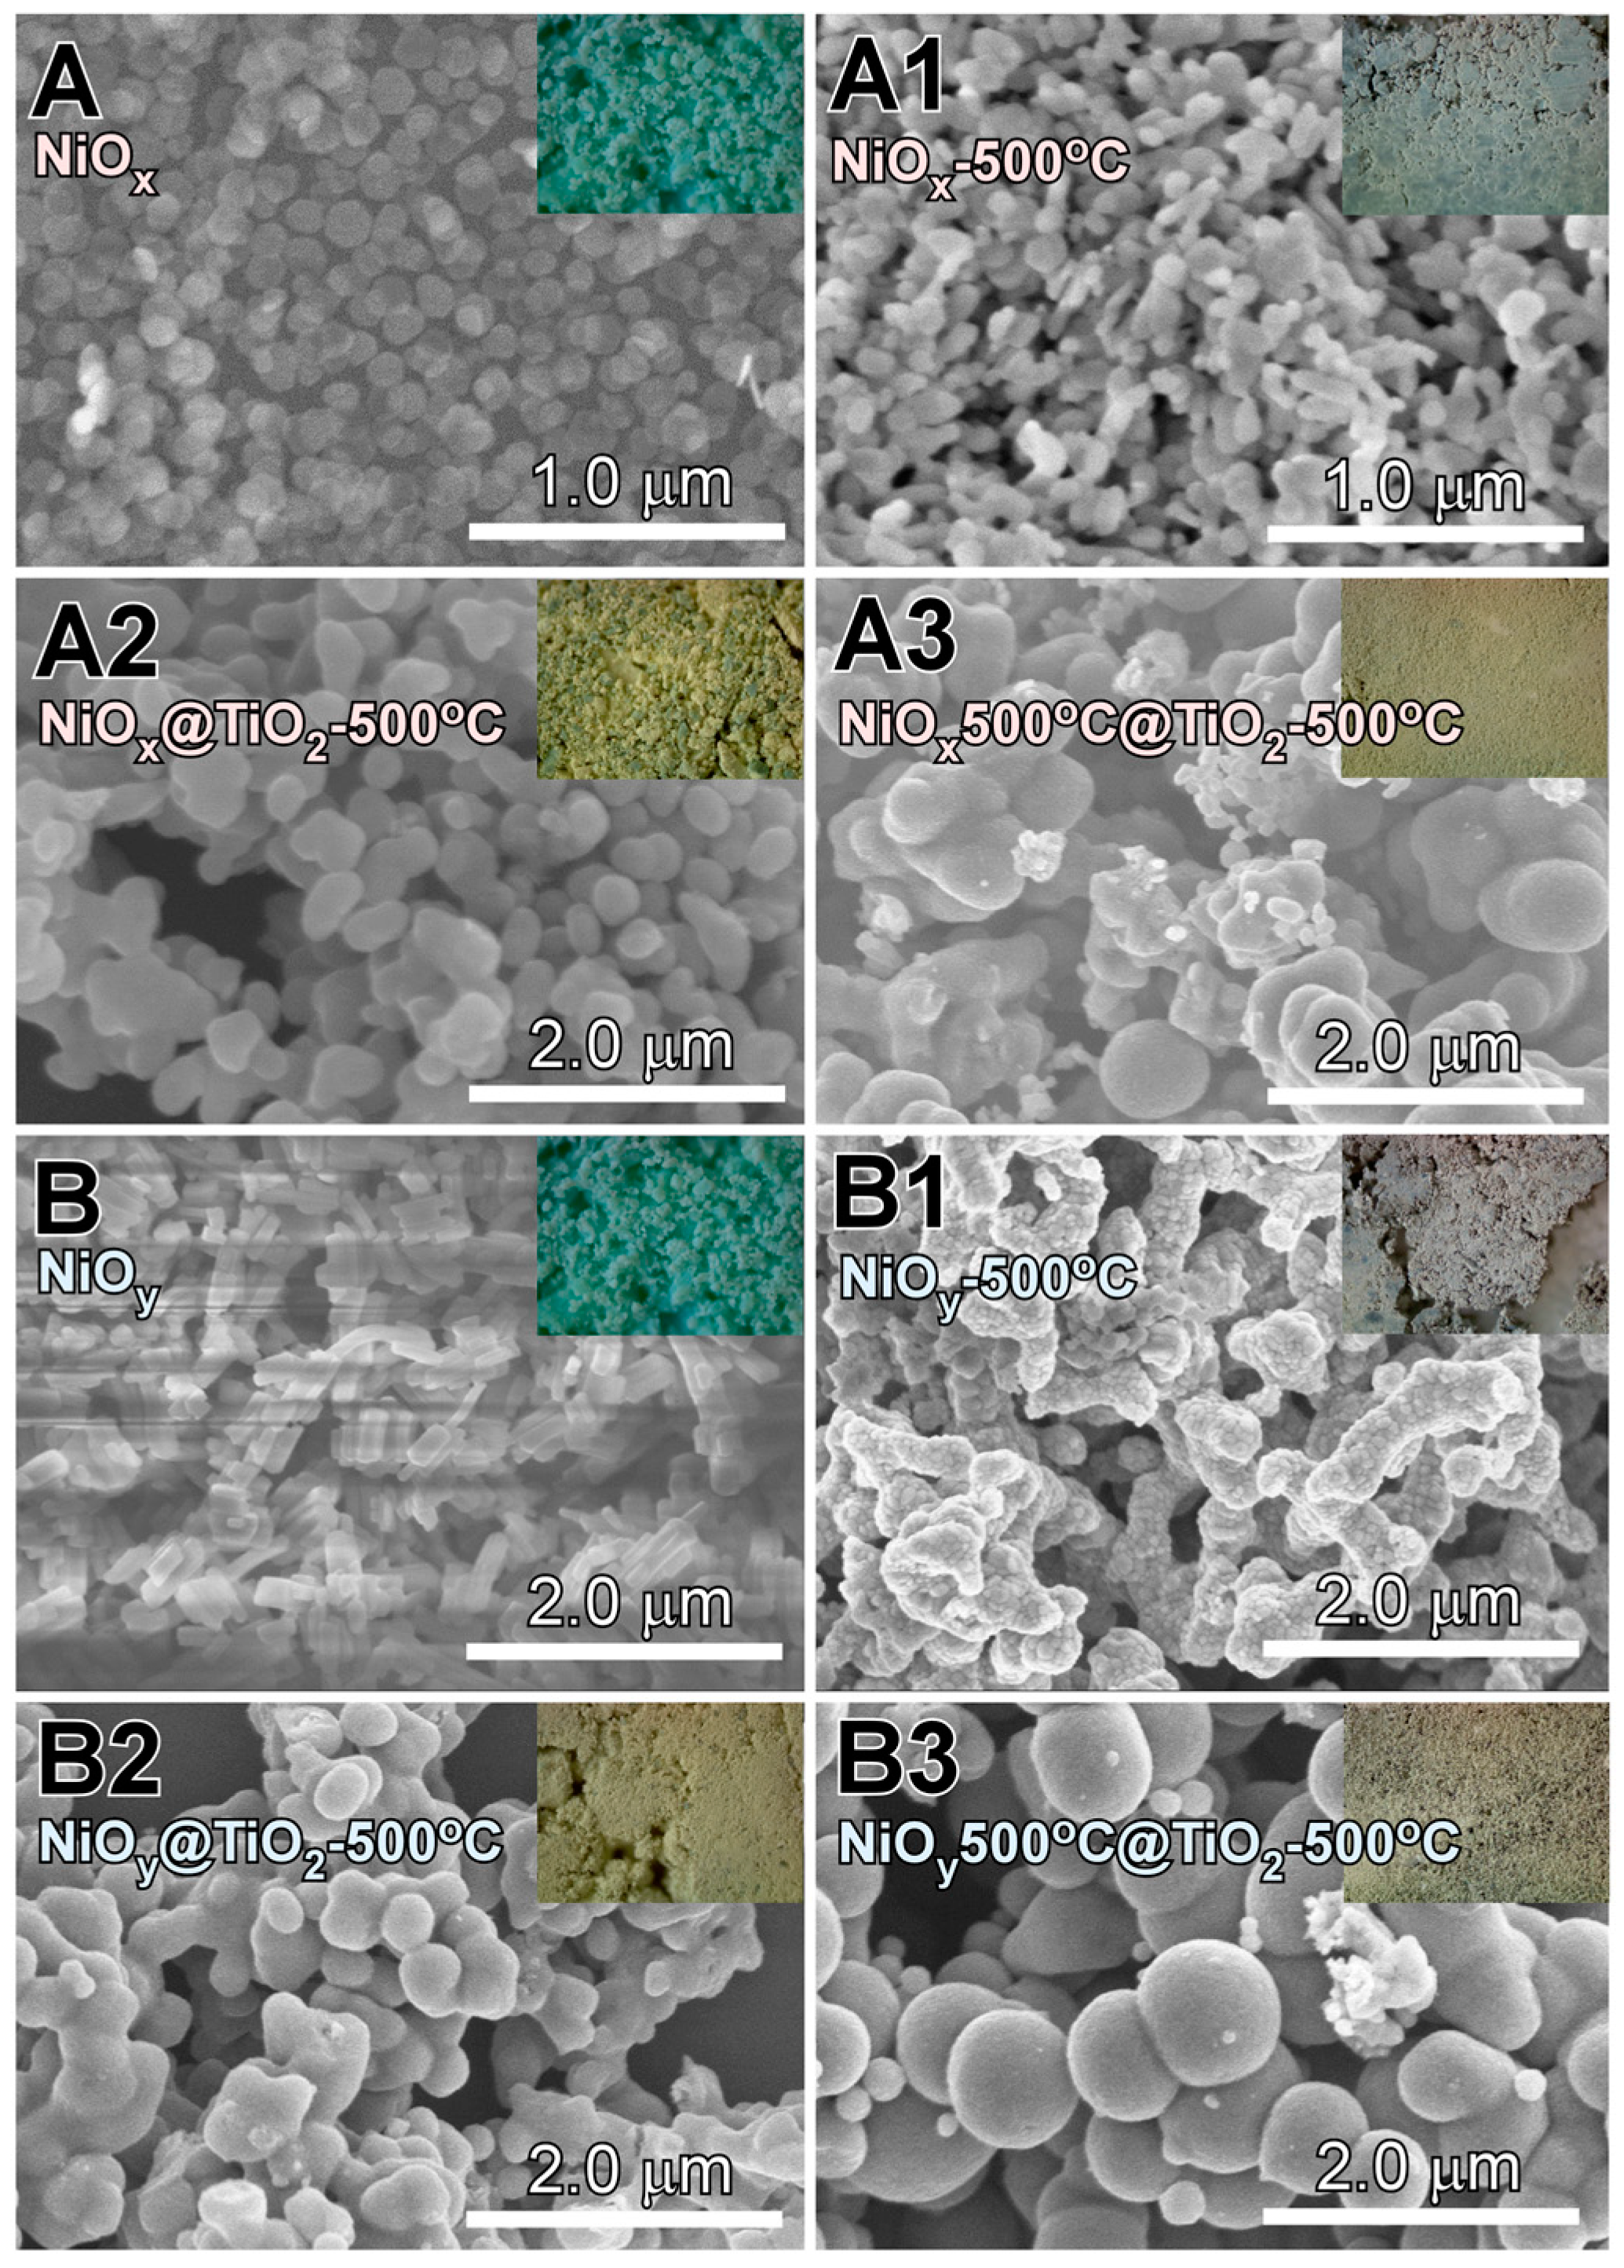
2. Results and Discussion

Scanning electron microscopy (SEM) analysis was conducted to examine the sample morphology (Figure 1). The morphologies of the as-synthesized A (NiOx) and B (NiOy) samples resembled hexagonal plates and short rods, respectively, while their color appeared bluish-green, which is characteristic of Ni(II) complexes [32,33]. Hexagonal plate morphology was also reported for a Ni-rich Ni-Co complex with green color [33]. When the A and B samples were annealed at 500 °C—denoted as A1 (NiOx-500 °C) and B1 (NiOy-500 °C)—the color changed to grey, indicating a modification in crystal structure. In addition, the morphologies underwent some changes, exhibiting particles of various sizes and worm-like structures of 1–2 μm, respectively. In the case of the A2 (NiOx@TiO2-500 °C) and B2 (NiOy@TiO2-500 °C) samples, obtained by coating with TiO2 and subsequently annealing (500 °C) the A and B samples, the colors changed to dark yellow. The particle sizes (100–300 nm) of sample A2 were bigger than those of sample A1. Sample B2 showed an aggregated sphere-like morphology, with sizes of 100–400 nm. The samples obtained upon TiO2 coating and annealing of the A1 and B1 samples are denoted as A3 (NiOx500 °C@TiO2-500 °C) and B3 (NiOy500 °C@TiO2-500 °C). The A3 and B3 samples had a similar yellowish-grey color as well as a sphere-like morphology with some small particles.
Figure 2 shows the X-ray diffraction (XRD) patterns of the materials in Figure 1. The XRD pattern of sample A matched that of hexagonal Ni(OH)2 (reference code: 98-016-1897) [34,35,36,37]. The peaks at 2θ = 19.2°, 33.0°, and 38.5° can be assigned to the (001), (010), and (011) crystal planes of the hexagonal crystal phase, respectively. The XRD pattern of sample B was close to that of monoclinic Ni oxalate dehydrate (reference code: 98-015-0590) with a nearly overlapped strong peak at 2θ = 18.8°, assignable to the (200)/( 20 2 ¯ ) crystal planes. The A1 (NiOx-500 °C) and B1 (NiOy-500 °C) samples had identical XRD patterns matching that of cubic NiO (reference code: 98-064-6098). The three major peaks at 2θ = 37.3°, 43.0°, and 62.9° can be assigned to the (111), (002), and (022) planes of the cubic crystal phase, respectively. The different Ni complexes of Ni hydroxide and oxalate assumed the same NiO structure upon thermal annealing at 500 °C. Cui et al. synthesized Ni(OH)2 nanosheets and flower-like microspheres by hydrothermal method, using ammonia and polyvinylpyrrolidone at 150 °C for 15 h, and obtained NiO nanosheets and NiO microspheres by thermally annealing the corresponding samples at 500 °C [34]. For the other four TiO2-coated samples (A2, A3, B2, and B3), XRD patterns corresponding to that of tetragonal anatase TiO2 (reference code: 98-020-2243) were observed. The strongest peak at 2θ = 25.3° for TiO2 corresponds to the (011) plane of the tetragonal phase. For samples A2 (NiOx@TiO2-500 °C) and B2 (NiOy@TiO2-500 °C), additional XRD peaks were observed and attributed to hexagonal Ni(II) titanate NiTiO3 (reference code: 98-006-6198). Kim et al. also reported the formation of the NiTiO3 phase for thermally annealed NiO-TiO2 NTAs at 600 °C [8]. This indicates that the NiTiO3 phase is commonly formed by heating NiO and TiO2 via NiO + TiO2 + heat → NiTiO3. Based on the above results, the A2 and B2 samples were NiO@TiO2 core-shell structures with interfacial NiTiO3, whereas the A3 and B3 samples were NiO@TiO2 core-shell structures with no XRD detectable interface species.
Figure 3 shows the Fourier-transform infrared (FT-IR) spectra for the eight samples in Figure 1. The samples with identical XRD patterns showed similar FT-IR spectra—namely, the A1, A2, and A3 spectra—were similar to the B1, B2, and B3 spectra, respectively. The formation of the Ni oxalate complex of the B sample was more advanced than that of the A sample. Ni–OH stretching vibrations were observed at 3630 and 3380 cm−1 for the A and B samples, respectively [33,38]. For samples A1 and B1, the Ni–O vibration peak was observed at ~560 cm−1 [33,38]. For the TiO2-coated samples, broad peaks were commonly observed at ~650 cm−1, and attributed to the Ti–O–Ti vibration of the TiO2 lattice [39].
Ultraviolet-visible (UV-Vis) absorption spectra (Figure 4) were obtained to further characterize the samples showing different sample colors. For the as-synthesized samples A (NiOx) and B (NiOy), two strong absorption regions were observed at ~400 and ~700 nm, attributed to the d-orbital bonding transitions commonly observed for Ni(II) complexes [40]. For the other samples with NiO crystal phase (A1, A2, A3, B1, B2, and B3), broad absorption peaks were observed at ~700–800 nm, which could be attributed to the various transitions (e.g., from the ground state of 3A2g to the excited states of 3T2g and 3T1g) of Ni(II) with octahedral coordination [34]. For the NiO@TiO2 core-shell structures (A2, A3, B2, and B3), band gap absorption edges were observed near 500 nm.
As TiO2 is widely used in photocatalysis, the NiO@TiO2 core-shells (A2, A3, B2, and B3) were tested for photocatalytic dye degradation [41,42,43,44,45,46,47,48,49,50,51]. To increase the novelty of this work, as pure dyes have been extensively investigated, we selected rarely studied mixed dyes, which are also more practical [41,42,43,44,45]. Figure 5 shows the UV-Vis absorption spectra of mixed dye solutions containing dispersions of A2 and B2 samples, and A3 and B3 samples, at increasing visible-light (>400 nm) exposure times. The mixed dye solution was a mixture of MO (5 ppm = 5 mg/L), RhB (5 ppm), and MB (5 ppm); its UV-Vis spectrum showed three absorption peaks at 450, 550, and 650 nm, corresponding to the absorption centers of MO, RhB, and MB, respectively [41,42,43,44,45]. The three peak positions were selected to analyze the degradation rate of each dye. Figure 6 displays the analyzed data for the corresponding UV-Vis absorption spectra in Figure 5. The UV-absorption spectra (Figure 5) were taken upon achieving adsorption-desorption equilibrium for 1 h under dark conditions. MO was negligibly adsorbed on the A2, A3, and B3 samples, while 15% of MO was adsorbed on the B2 sample (Figure 6). MB showed relatively good adsorption. Adsorption performance has commonly been explained by electrostatic interactions between the dyes and the catalysts surface [49,50]. Because MB and RhB molecules are more positively charged than MO, the negatively surface-charged catalyst will adsorb MB and RhB more strongly than MO. For the increased adsorption of MO for B2 sample, the combination of NiO/NiTiO3/TiO2 could govern the surface interactions between MO and the B2 sample surface. The order of dye adsorption was found to be MO < RhB < MB for the A2, A3, and B3 samples, and RhB < MO < MB for the B2 sample. The B2 sample showed the best adsorption performance. More interesting results were observed by increasing the visible-light exposure time. Among the three dyes, MO was the fastest to degrade, showing a similar behavior on all the samples. The degradation rate typically showed the following order: RhB < MB << MO. In addition, MB exhibited similar degradation in all the samples; conversely, RhB showed drastic differences between the different samples. The photocatalytic activity for RhB showed an order of B3 << A3 < A2 < B2. The B3 sample showed negligible photocatalytic activity for RhB, while the B2 sample showed a good catalytic activity, comparable to that of MB. The A2 sample showed better activity than the A3 sample for photocatalytic RhB degradation. It appeared that the interfacial NiTiO3 phase formation (for A2 and B2) facilitated the RhB degradation. For all three dyes, the B2 sample showed the best catalytic performance for mixed dye degradation. Some studies on catalysts for the photocatalytic degradation of mixed dyes are summarized in Table 1 [41,42,43,44,52].
As the dyes and samples absorb visible light, photogenerated electron hole pairs can be formed by direct visible-light absorption by mixed dye and NiO@TiO2. The electron (e) and hole (h+) pairs are separated by interfacial charge transfer at the interface of the p-n junction [5,6,18,46]. The electrons in the mixed dye can transfer to the conduction band (CB) of NiO@TiO2; they are then captured by oxygen to generate active •O2 (or •O), which can further react with H+ to form •O2H (or •OH). Consequently, the active species of •O2, h+, and •OH are used for dye degradation. The summarized mechanism is written below [47,48,49,50,51]:
Mixed dye + visible light → mixed dye (eCB + h+VB)
NiO@TiO2 + visible light → NiO@TiO2 (eCB + h+VB) and charge separation at the interface
Adsorbed mixed dye (eCB + h+VB) + NiO@TiO2 → NiO@TiO2 (eCB) + Mixed dye (h+VB)
NiO@TiO2 (eCB) + adsorbed or surface O2 (or O) → •O2 (or •O) + NiO@TiO2
•O2 (or •O) + H+ → •O2H (or •OH)
H2O + NiO@TiO2 (h+VB) → H+ + •OH
•O2, h+, and •OH + adsorbed mixed dye/dye+ → degradation products
Photocatalytic mixed dye degradation under UV light (365 nm) was also tested (Figure 7). Unlike under visible-light conditions, the photocatalytic activity showed different behavior under UV-light conditions. MO did not show the fastest degradation rate. The A2 sample showed better photocatalytic activity for RhB than the other samples. The B3 sample showed better photocatalytic activity for MO and MB than the other samples. The B2 sample showed the poorest photocatalytic activity for the mixed dye solution under UV light (Figure 7); however, it showed the best photocatalytic activity under visible light (Figure 5 and Figure 6). Based on these results, the photocatalyst selection depends on the light wavelength.
The materials were tested as CO oxidation catalysts. Figure 8 displays the first and second CO oxidation reaction run profiles. CO2 (mass = 44 amu) production by CO oxidation was monitored with the increasing reaction temperature by using mass spectrometry [33,53,54,55,56]. Qualitative analysis was performed using the mass profile data. For the first runs of the as-synthesized samples—i.e., A (NiOx) and B (NiOy)—the CO2 production onsets were observed at 265 and 300 °C, respectively; while, in the second runs, they were observed at 300 and 250 °C, respectively. In the second run, sample A showed degraded activity (by +35 °C), whereas sample B showed enhanced activity (by −50 °C). The Ni hydroxide (sample A) and Ni oxalate (sample B) complexes were found to change to the same NiO crystal phase after the CO oxidation reactions, based on the XRD results. For sample A1, the onsets were observed above 470 °C in the first and second CO oxidation runs. The catalytic activity dramatically degraded for sample A1 with NiO crystal phase. For sample B1, the onsets were observed at 300 and 350 °C in the first and second runs, respectively. Although the B1 sample showed the same NiO crystal phase, its catalytic activity was considerably superior to that of sample A1. Similarly, samples A2 and B2 showed an onset above 450 °C and at 300 °C, respectively. Samples A3 and B3 showed similar onsets near 400 °C for the first and second runs. As a result, the sample preparation method is crucial to determine the catalytic activity. In the present study, the TiO2 coating on the B2 sample did not to degrade the CO oxidation activity. However, when Ni(OH)2 plates were used as starting material, the CO oxidation activity significantly decreased.
Furthermore, supercapacitor performance tests were briefly performed. The related results of cyclic voltammograms (CVs), galvanostatic charge/discharge curves (CD), and impedance plots are shown in Figure 9. For the selected samples (A1 and B3), cyclic voltammetry curves were obtained at various scan rates. Broad anodic and cathodic peaks were typically observed, associated with the redox reactions of NiO + OH → NiOOH + e + H2O [33,57]. The other samples showed similar qualitative behaviors. The symmetrical peaks indicated reversible redox reactions. The peak current increased with the increasing scan rate, and the gap between the anodic and cathodic peak positions became wider, revealing a diffusion-controlled pseudocapacitive behavior of the material [4,22,57]. The galvanostatic CD curves were obtained at the current density of 0.83 A/g. The measured specific capacitance (F/g) was found to be in the following order: A2 ≈ A3 < B2 < B1 < B3 < A1. For sample A1 with NiO crystal phase, the specific capacitance was measured to be 320 F/g, while, the specific capacitances of the other two TiO2-coated samples (A2 and A3) were found to be identical, 50 F/g. For sample B1 with NiO crystal phase, the specific capacitance was measured to be 189 F/g, lower than that of the A1 sample (320 F/g). However, the other two TiO2 coated samples, B2 and B3, exhibited values of 211 F/g and 134 F/g, respectively, which were higher than those of the A1 and A2 samples (50 F/g). Kim et al. reported specific capacitances in the range of 40–100 F/g for NiO-TiO2 NTAs and 120–300 F/g for NiO-TiO2 nanotube films [8], very close to the values observed in the present study. Some literature values for TiO2–NiO hybrid materials are summarized in Table 2, where TiO2 was mainly core [4,7,8,58,59]. To the best of our knowledge, the specific capacitance for NiO@TiO2 core-shell structures has not been reported. The high-frequency region of the impedance Nyquist plots with real (Z′) and imaginary (Z′′) parts are shown in Figure 9. Ascending straight lines were commonly observed (not shown here) for all the samples in the low-frequency region, corresponding to Warburg diffusion resistance [33,53]. Sample A3 clearly showed a semicircle before and after CD measurements, corresponding to charge transfer resistance. The other samples showed no clear semicircles. The interfacial resistance of the A1 sample was smaller than those of the other two samples (A2 and A3). The resistance of the B2 sample was larger than those of the B1 and B3 samples. Thus, the resistance in the impedance plots was found to be consistent with the order of the measured specific capacitance values.

3. Experimental Section

3.1. Synthesis of Ni Oxide and TiO2 Coating

Two different Ni oxide complexes—i.e., NiOx (A) and NiOy (B)—were synthesized by hydrothermal method as described below, and then used as starting materials. For material A, 0.475 g of NiCl2·6H2O (GR 98%, Duksan Pure Chemical Co., Ansan, Korea) was dissolved in 40 mL of deionized water, and 2 mL of 1.0 M NaOH solution was added to it. The solution was then transferred to a Teflon-lined stainless autoclave and placed in an oven setting at 120 °C for 12 h. For material B (NiOy), 0.951 g of NiCl2·6H2O was dissolved in a mixed solvent (20 mL of H2O + 20 mL of ethylene glycol); then, 1.0 mL of 0.1 M NaOH solution and 0.238 g of oxalic acid (≥99%, Sigma-Aldrich, St. Louis, MO, USA) were added to it. Upon complete dissolution, the entire solution was transferred to a Teflon-lined stainless autoclave and placed in an oven setting at 120 °C for 12 h. After the hydrothermal reaction, the obtained precipitates were fully washed with deionized water and ethanol, and then centrifuged, repeatedly. The washed sample powders were dried in an oven at 70 °C for two days. For materials A1 (NiOx-500 °C) and B1 (NiOy-500 °C), the dried sample powders were thermally treated at 500 °C in an electric furnace for 4 h. For materials A2 (NiOx@TiO2-500 °C) and B2 (NiOy@TiO2-500 °C), the dried A and B sample powders (0.1 g) were dispersed in ethanol solvent, and 0.5 mL of titanium (IV) isopropoxide (TTIP; 97%, Sigma-Aldrich, St. Louis, MO, USA) was added to it. While stirring the solution, water vapor was slowly introduced using a humidifier for 2 h. After the reaction, the samples were fully washed with ethanol solvent to remove uncoated TTIP. Then, the collected sample was dried and thermally annealed at 500 °C for 4 h. For materials A3 (NiOx500 °C@TiO2-500 °C) and B3 (NiOy500°C@TiO2-500°C), the A1 and B1 sample powders were used for TiO2 coating. The other procedures were the same as those used for the A2 and B2 samples.

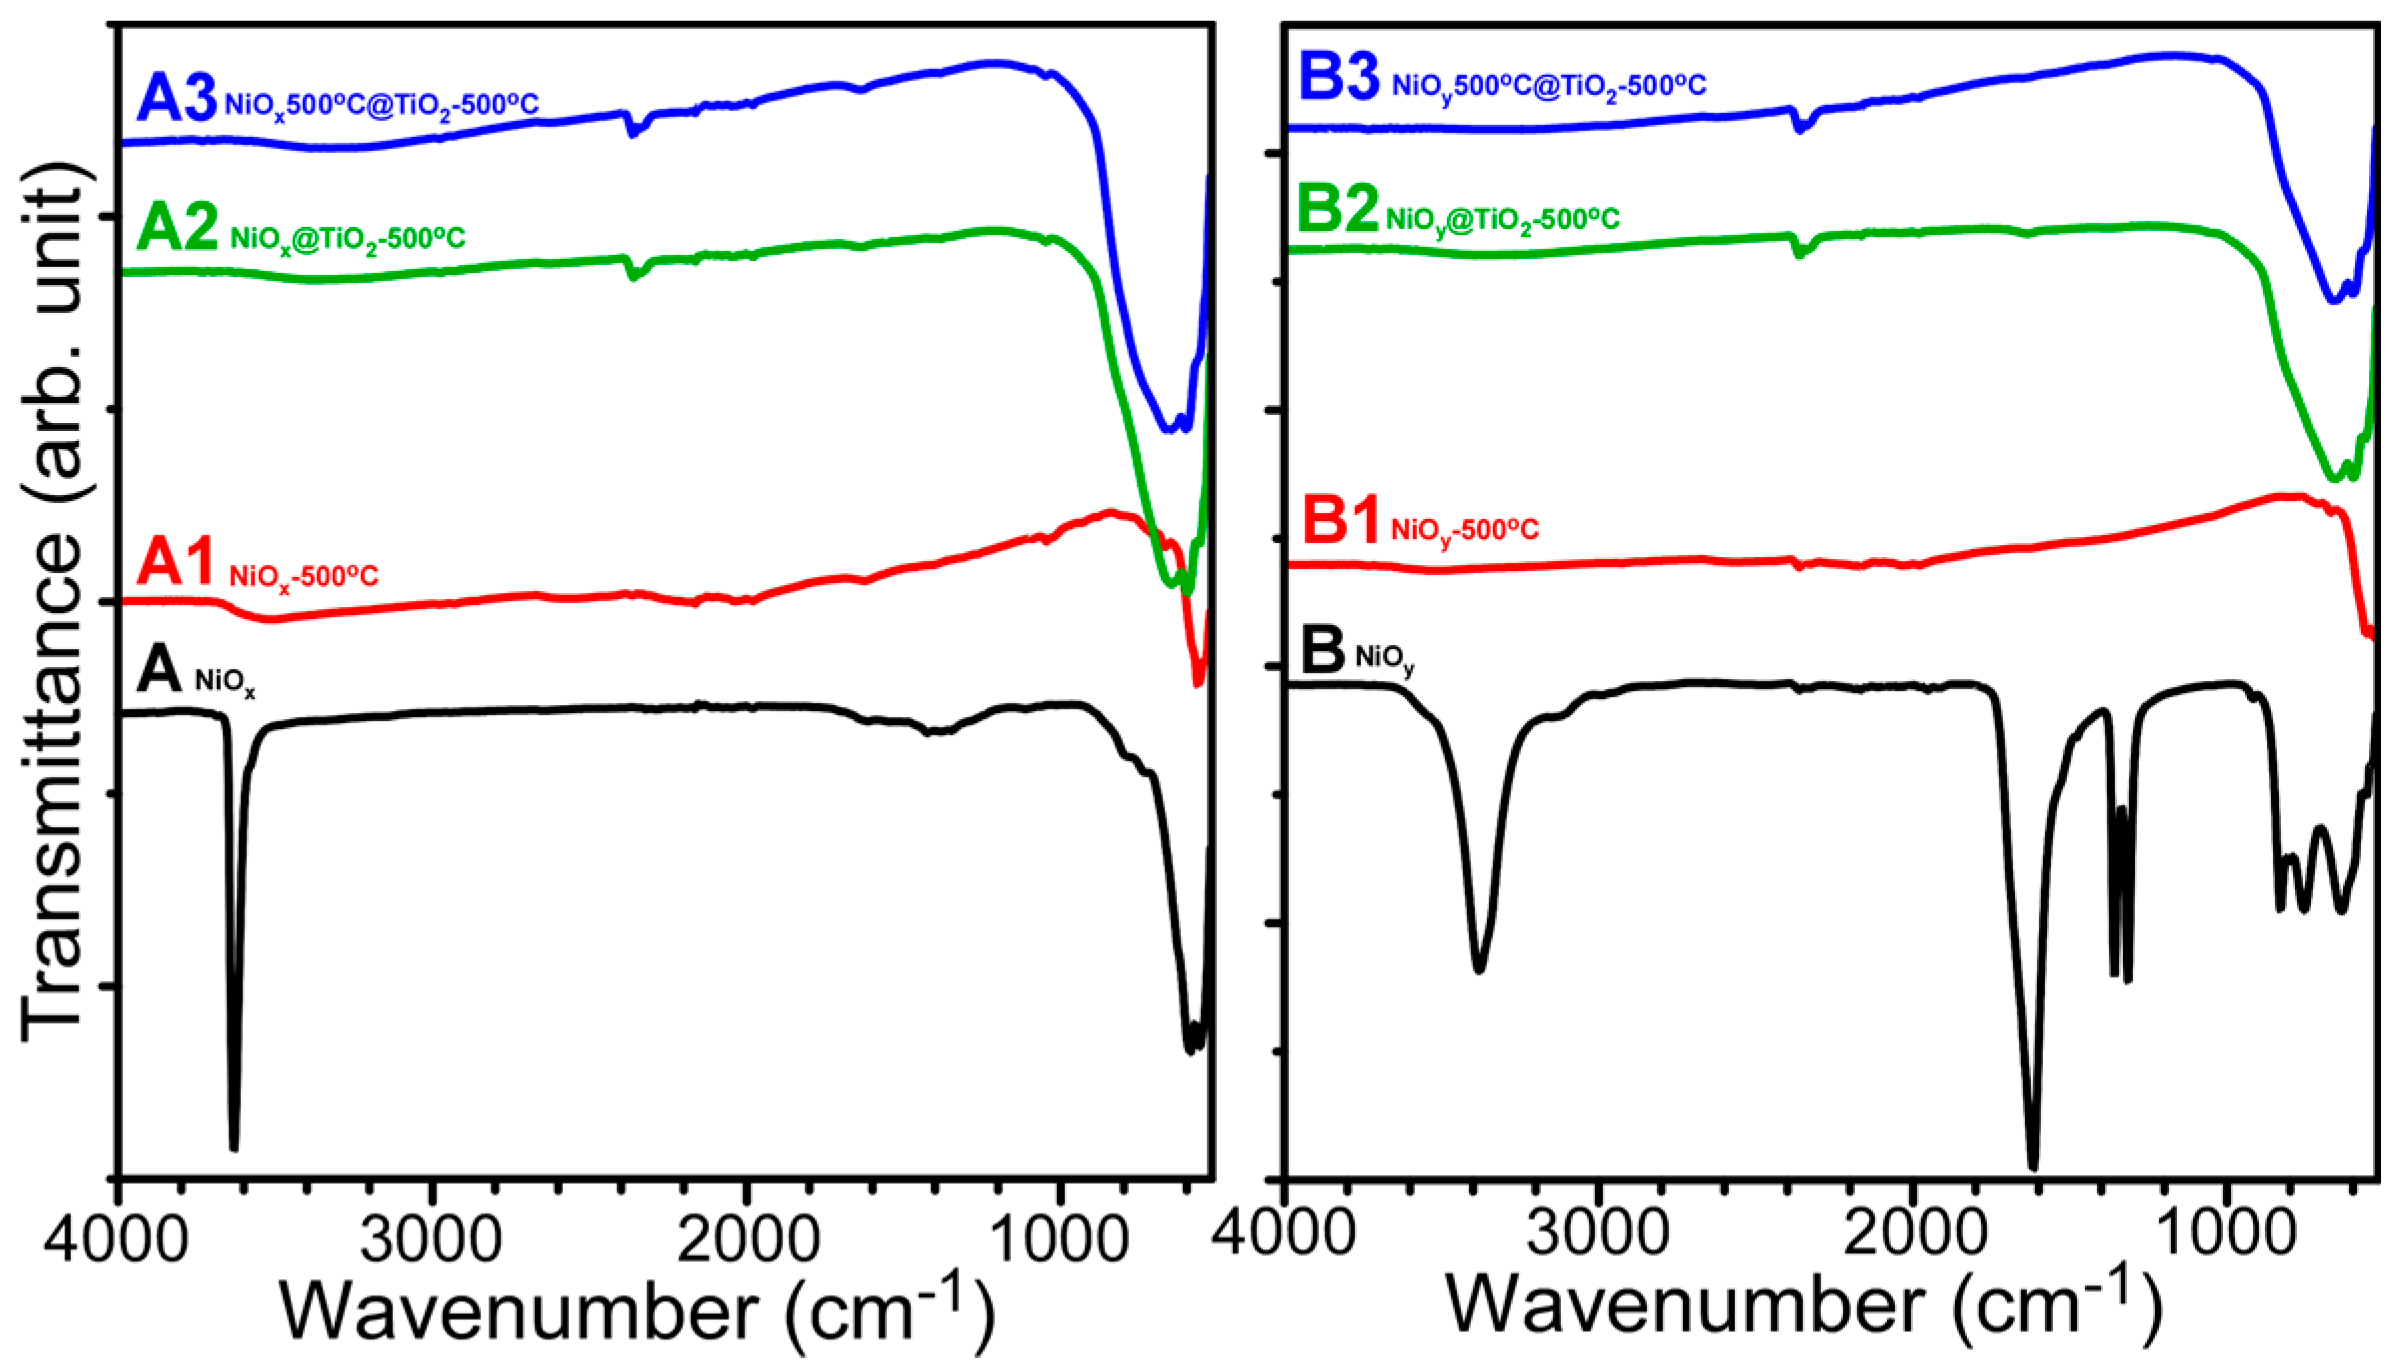
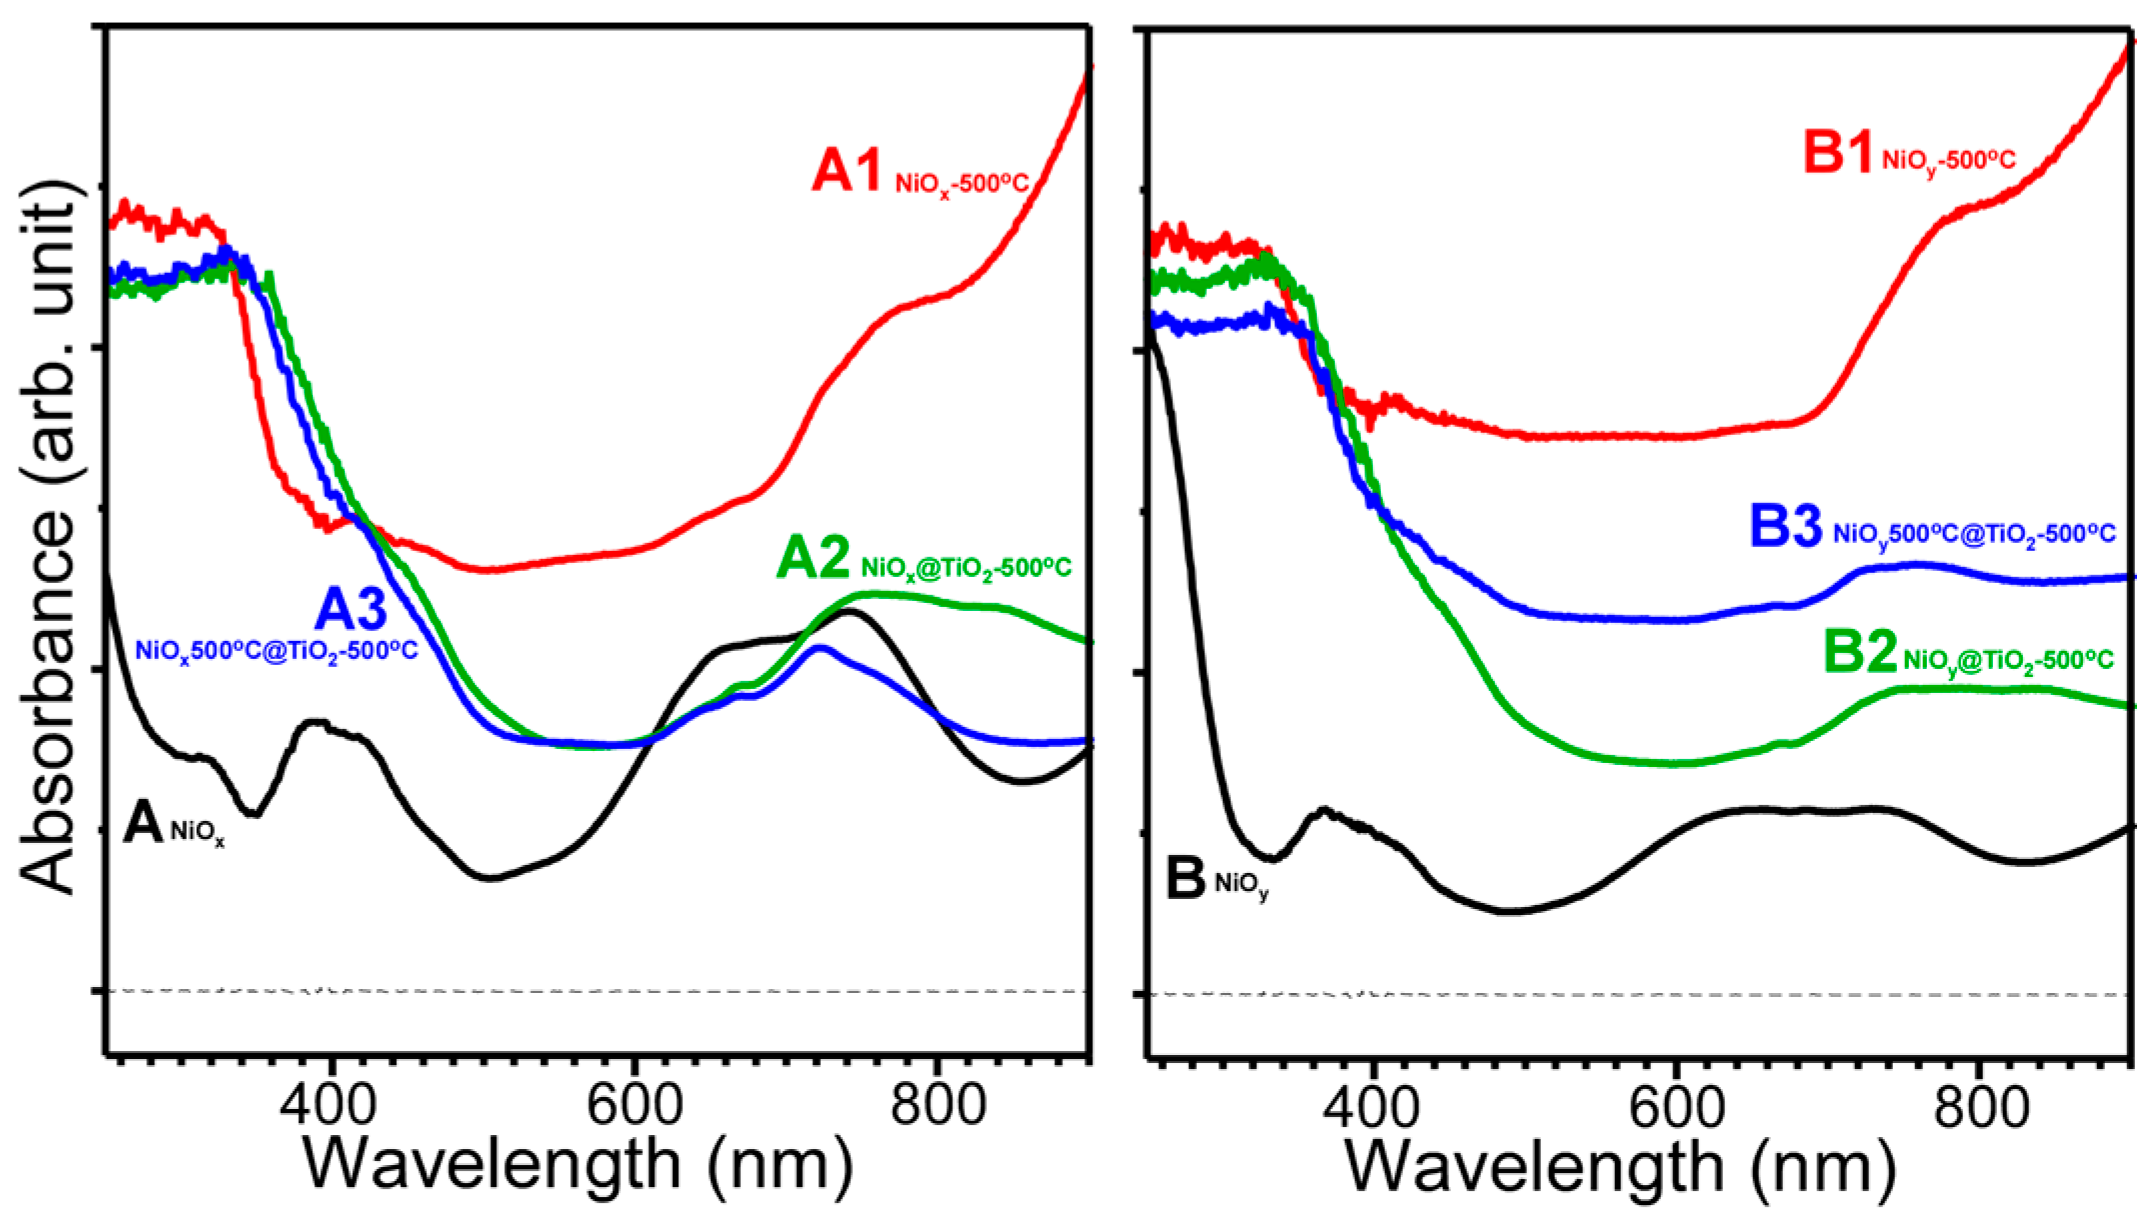
3.2. Characterization of the Materials

The morphology of the prepared samples was examined using field-emission SEM (FE-SEM, Hitachi SE-4800, Tokyo, Japan). The samples were placed on an HF-etched Si substrate. The crystal phases were identified using powder XRD; the patterns were obtained by using a PANalytical X’Pert Pro MPD diffractometer (PANalytical Inc., Westborough, MA, USA) equipped with a Cu Kα radiation source. FT-IR spectra were measured using a Nicolet iS 10 FT-IR spectrometer (Thermo Scientific, West Palm Beach, FL, USA) with an attenuated total reflection mode between 500 and 4000 cm−1. UV-Vis absorption spectra of the samples were recorded using a Neosys-2000 double beam UV-Vis spectrometer (Scinco, Seoul, Korea).

3.3. Photocatalytic Dye Degradation, CO Oxidation, and Supercapacitor Performance Tests

For photocatalytic mixed dye degradation, equal amounts of three different dye (i.e., MO, RhB, and MB) solutions with concentrations of 5 mg/L (=ppm) were mixed to prepare a mixed dye test solution. Then, 20 mg of sample powder was dispersed in 50 mL of the mixed dye solution to achieve adsorption-desorption equilibrium under dark conditions for 1 h. Upon achieving the equilibrium, 2 mL of the solution was taken and centrifuged to remove the residual powder, and a UV-Vis absorption spectrum was recorded by using a V-530 UV-Vis spectrometer (Jasco, Tokyo, Japan). As the equilibrium was reached, the mixed dye solution was examined under UV (or visible) irradiation. For visible light irradiation, a 500 W Halogen lamp (>400 nm) was used and the distance from the lamp and the dye solution in 100 mL beaker (a diameter of 5.5 cm) was fixed at about 30 cm. For UV light irradiation, four 6W UV (365 nm) lamps were used. Every 2 h, 2 mL of the solution was collected to record the UV-Vis absorption spectrum. For the CO oxidation reaction, 10 mg of sample powder was loaded in a flow-type quartz U-tube with an inner diameter of 4 mm. CO oxidation experiments were performed by increasing the temperature up to 500 °C at the rate of 10 °C·min−1 under flow of CO (1%) and O2 (2.5%) mixed gas in N2 balance. The reaction gas products, such as CO2 (mass = 44 amu), were examined using an SRS RGA200 quadrupole mass spectrometer (Stanford Research System, Sunnyvale, CA, USA). After the first CO oxidation run, the sample was naturally cooled to room temperature; then, the second CO oxidation run was performed. The electrochemical measurements were conducted using a CHI 660D electrochemical work station (CH Instruments, Austin, TX, USA) with a conventional three-electrode configuration (Ag/AgCl reference electrode, Pt wire counter electrode, and sample mounted on a Ni-foam working electrode) in 6.0 M KOH electrolyte solution. For the working electrode, the sample powder (60 wt %) was fully mixed with acetylene black (20 wt %) and poly(vinylidene fluoride) (20 wt %) in 2 mL of N-methyl-2-pyrrolidone solvent. The dispersion was slowly dropped onto Ni foam (1 × 1 cm2), dried, and pressed to fabricate a thin Ni foam sheet. The CVs were obtained between −0.2 and 6.0 V, galvanostatic CD experiments were conducted with potentials ranging from 0.1 to 0.4 V at the charge density of 0.83 A·g−1, and electrochemical impedance measurements were performed over a frequency range from 0.1 MHz to 0.01 Hz.

4. Conclusions

In this work, we investigated the preparation method, characteristics, and various application performances of NiO@TiO2 core-shell nanostructures. Generally, TiO2 coating on Ni(OH)2 plates and on annealed NiO showed poor photocatalytic, thermocatalytic, and supercapacitor performances. Therefore, it is advisable to use rod-shaped Ni oxalate complex as a starting material for TiO2 coating. The main findings are as follows:
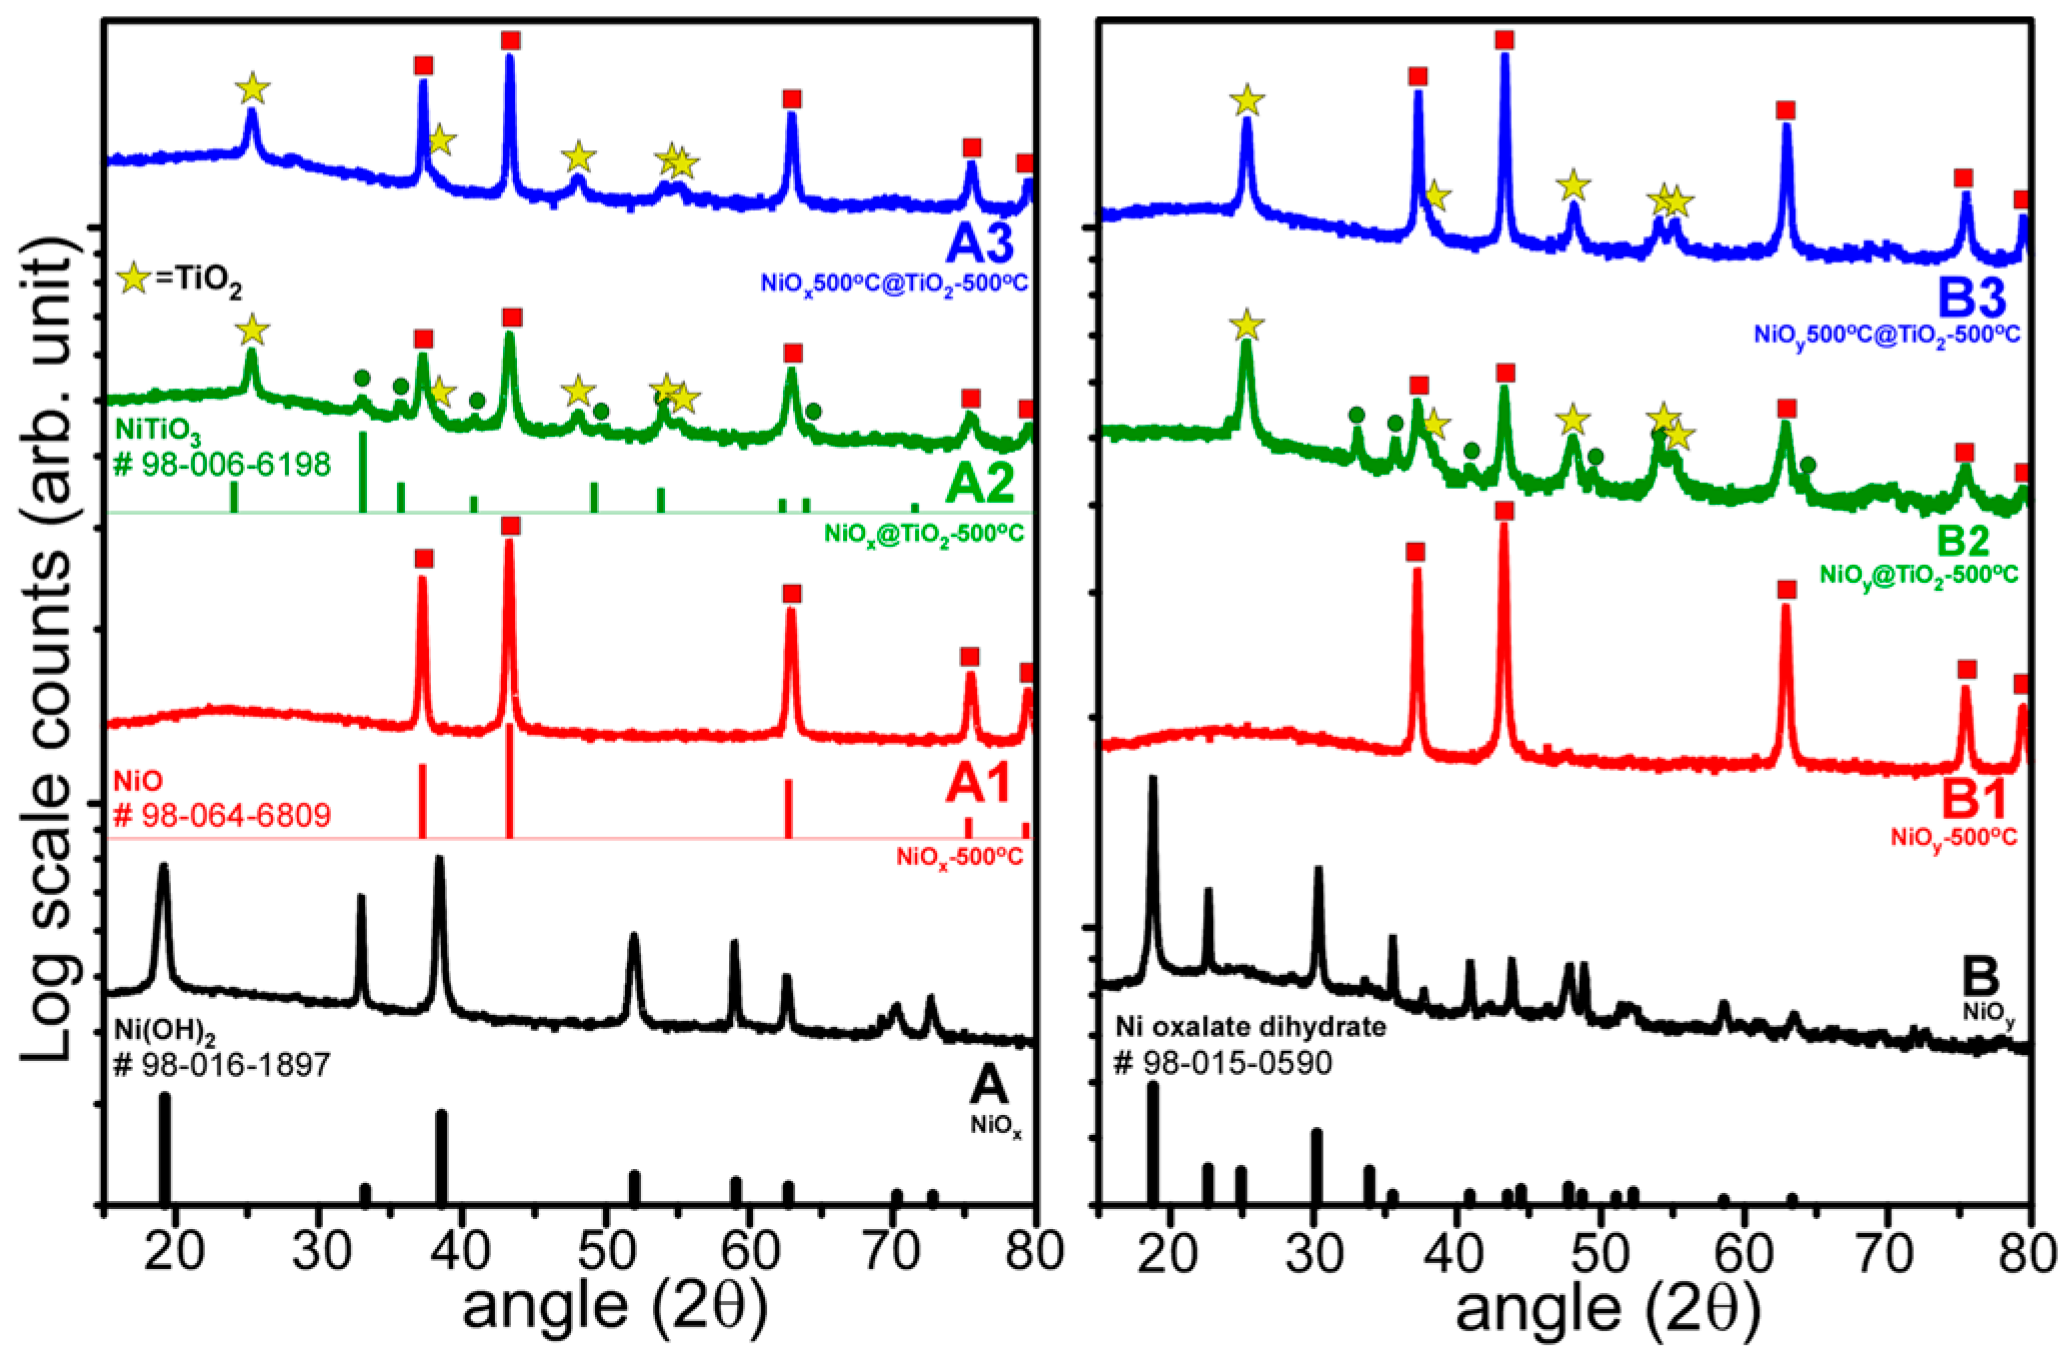
  • Nanoplates and nanorods were synthesized by hydrothermal method, and showed XRD patterns of Ni(OH)2 and Ni oxalate complexes, respectively. NiO crystal phase was commonly obtained by thermal annealing at 500 °C.
  • NiO@TiO2 core-shells with interfacial NiTiO3 could be prepared by TiO2 coating on as-synthesized Ni samples, followed by thermal annealing at 500 °C. TiO2 coating on annealed (500 °C) NiO, followed by thermal annealing at 500 °C, showed no XRD detectable NiTiO3 at the interface.
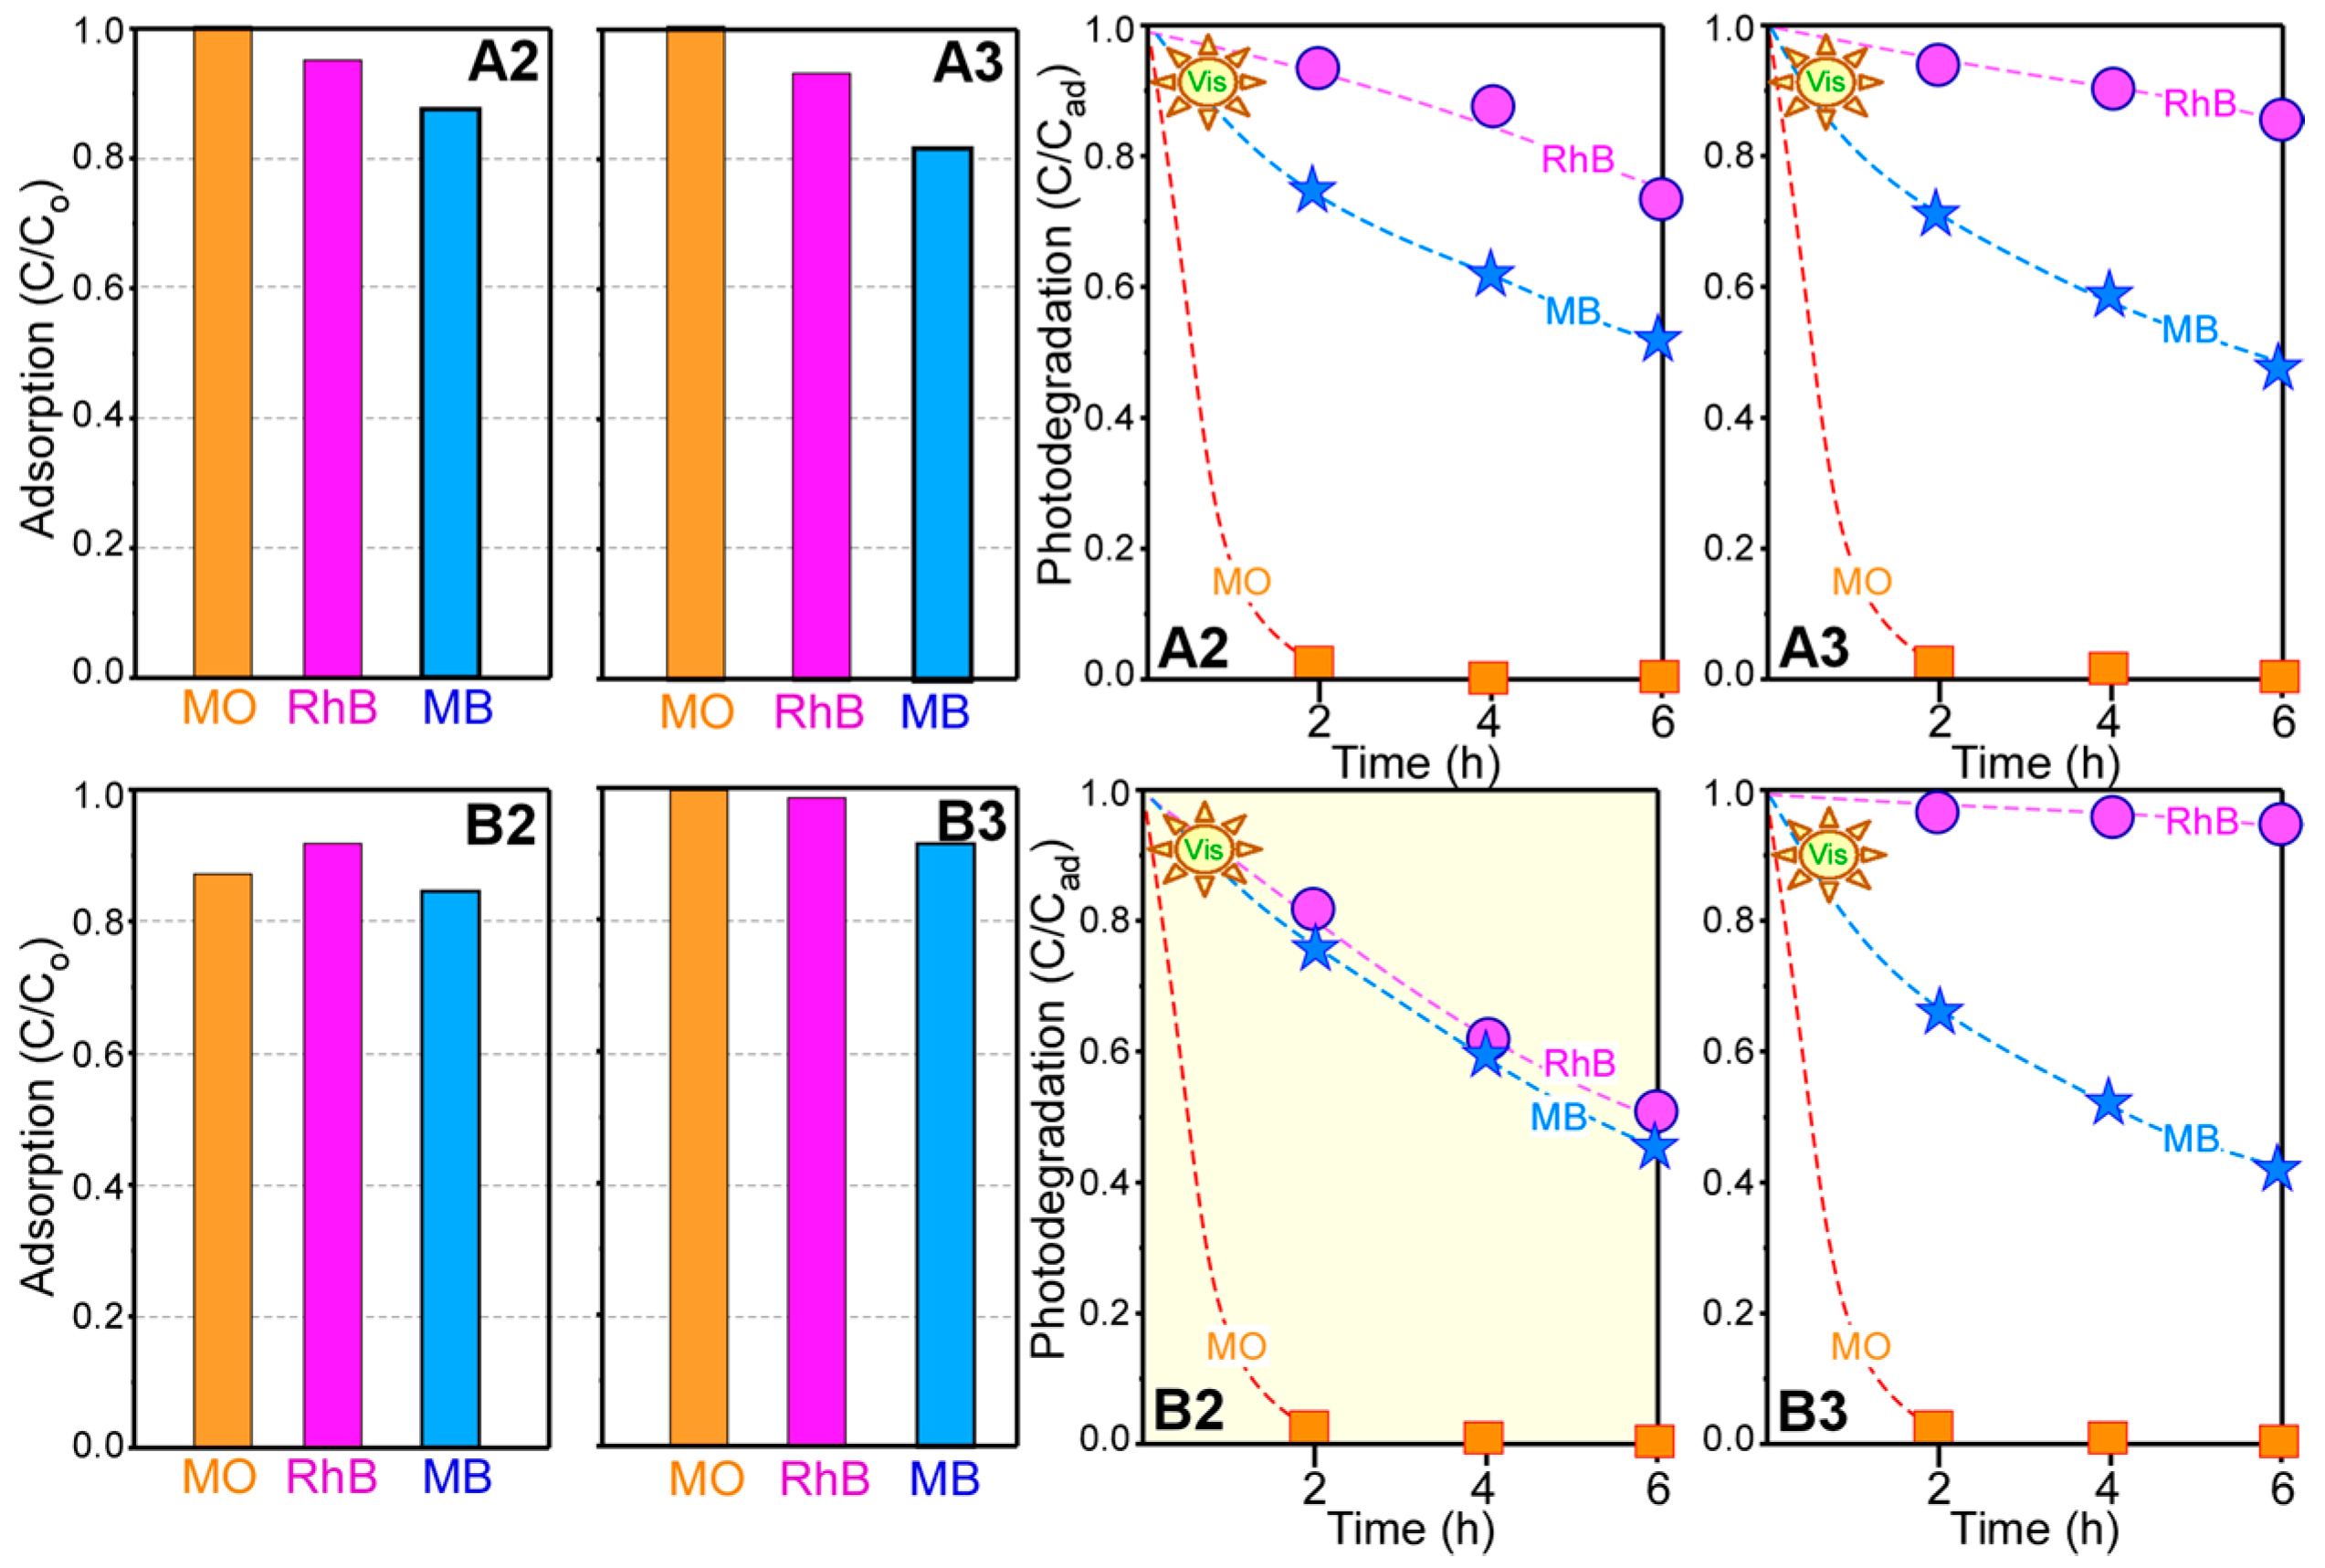
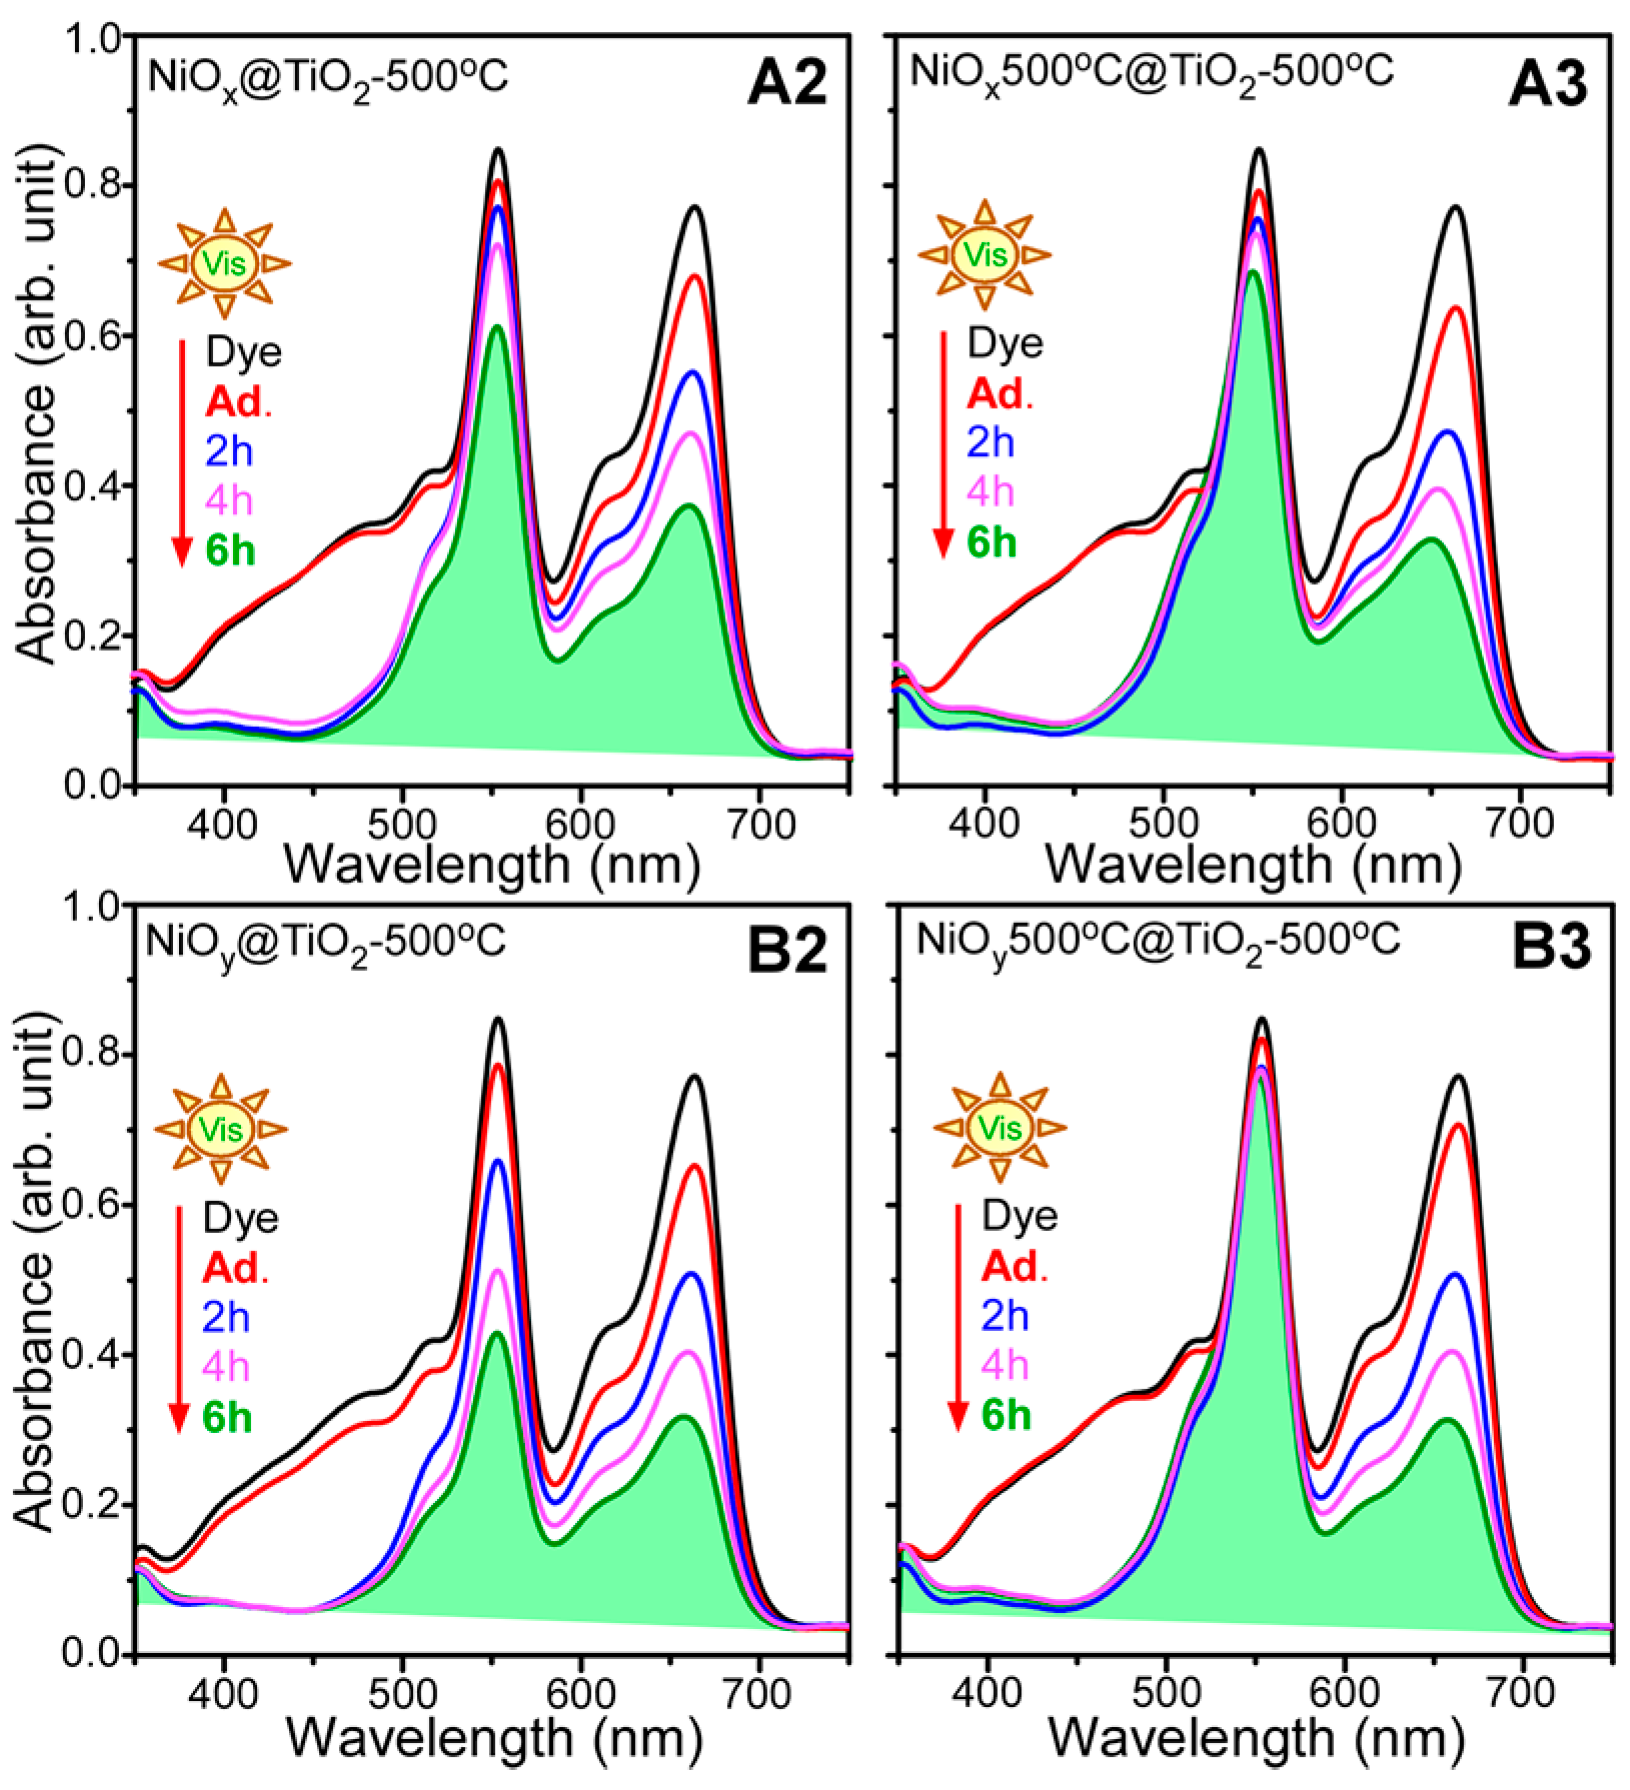
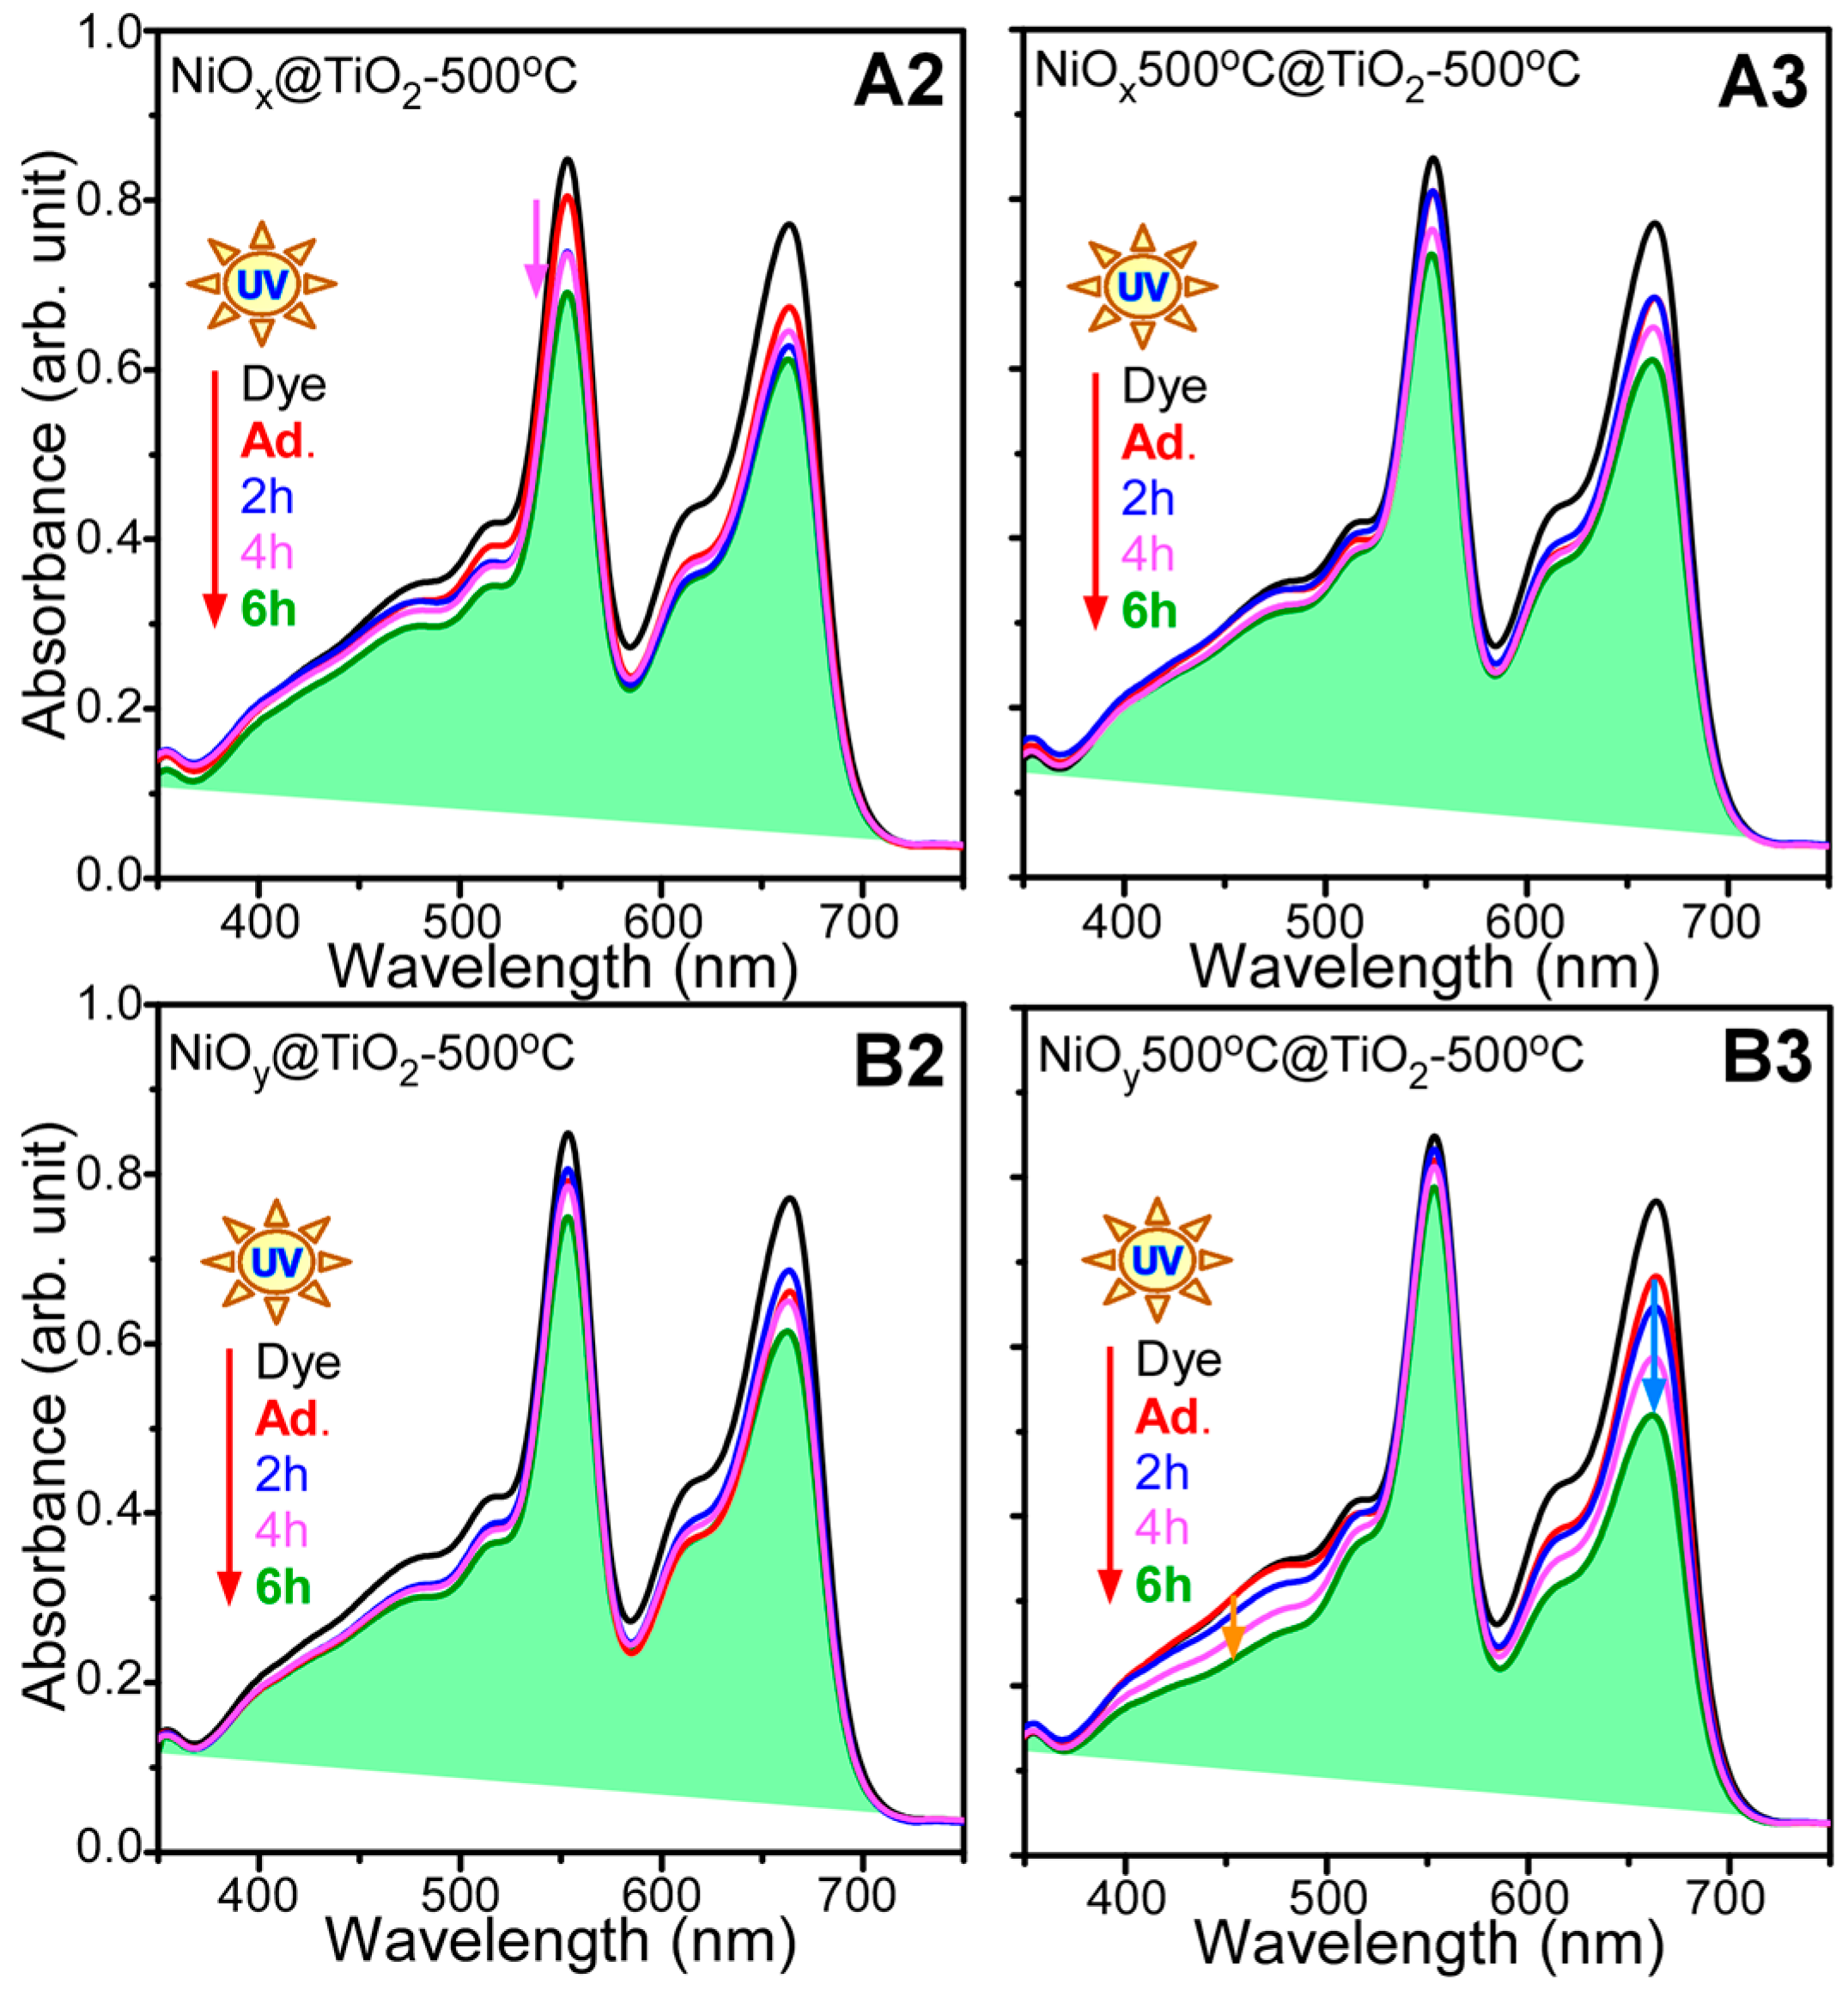
  • For photocatalytic dye degradation, TiO2 coating on Ni oxalate complex followed by thermal annealing (sample B2) showed the best photocatalytic activity for mixed dye degradation under visible light.
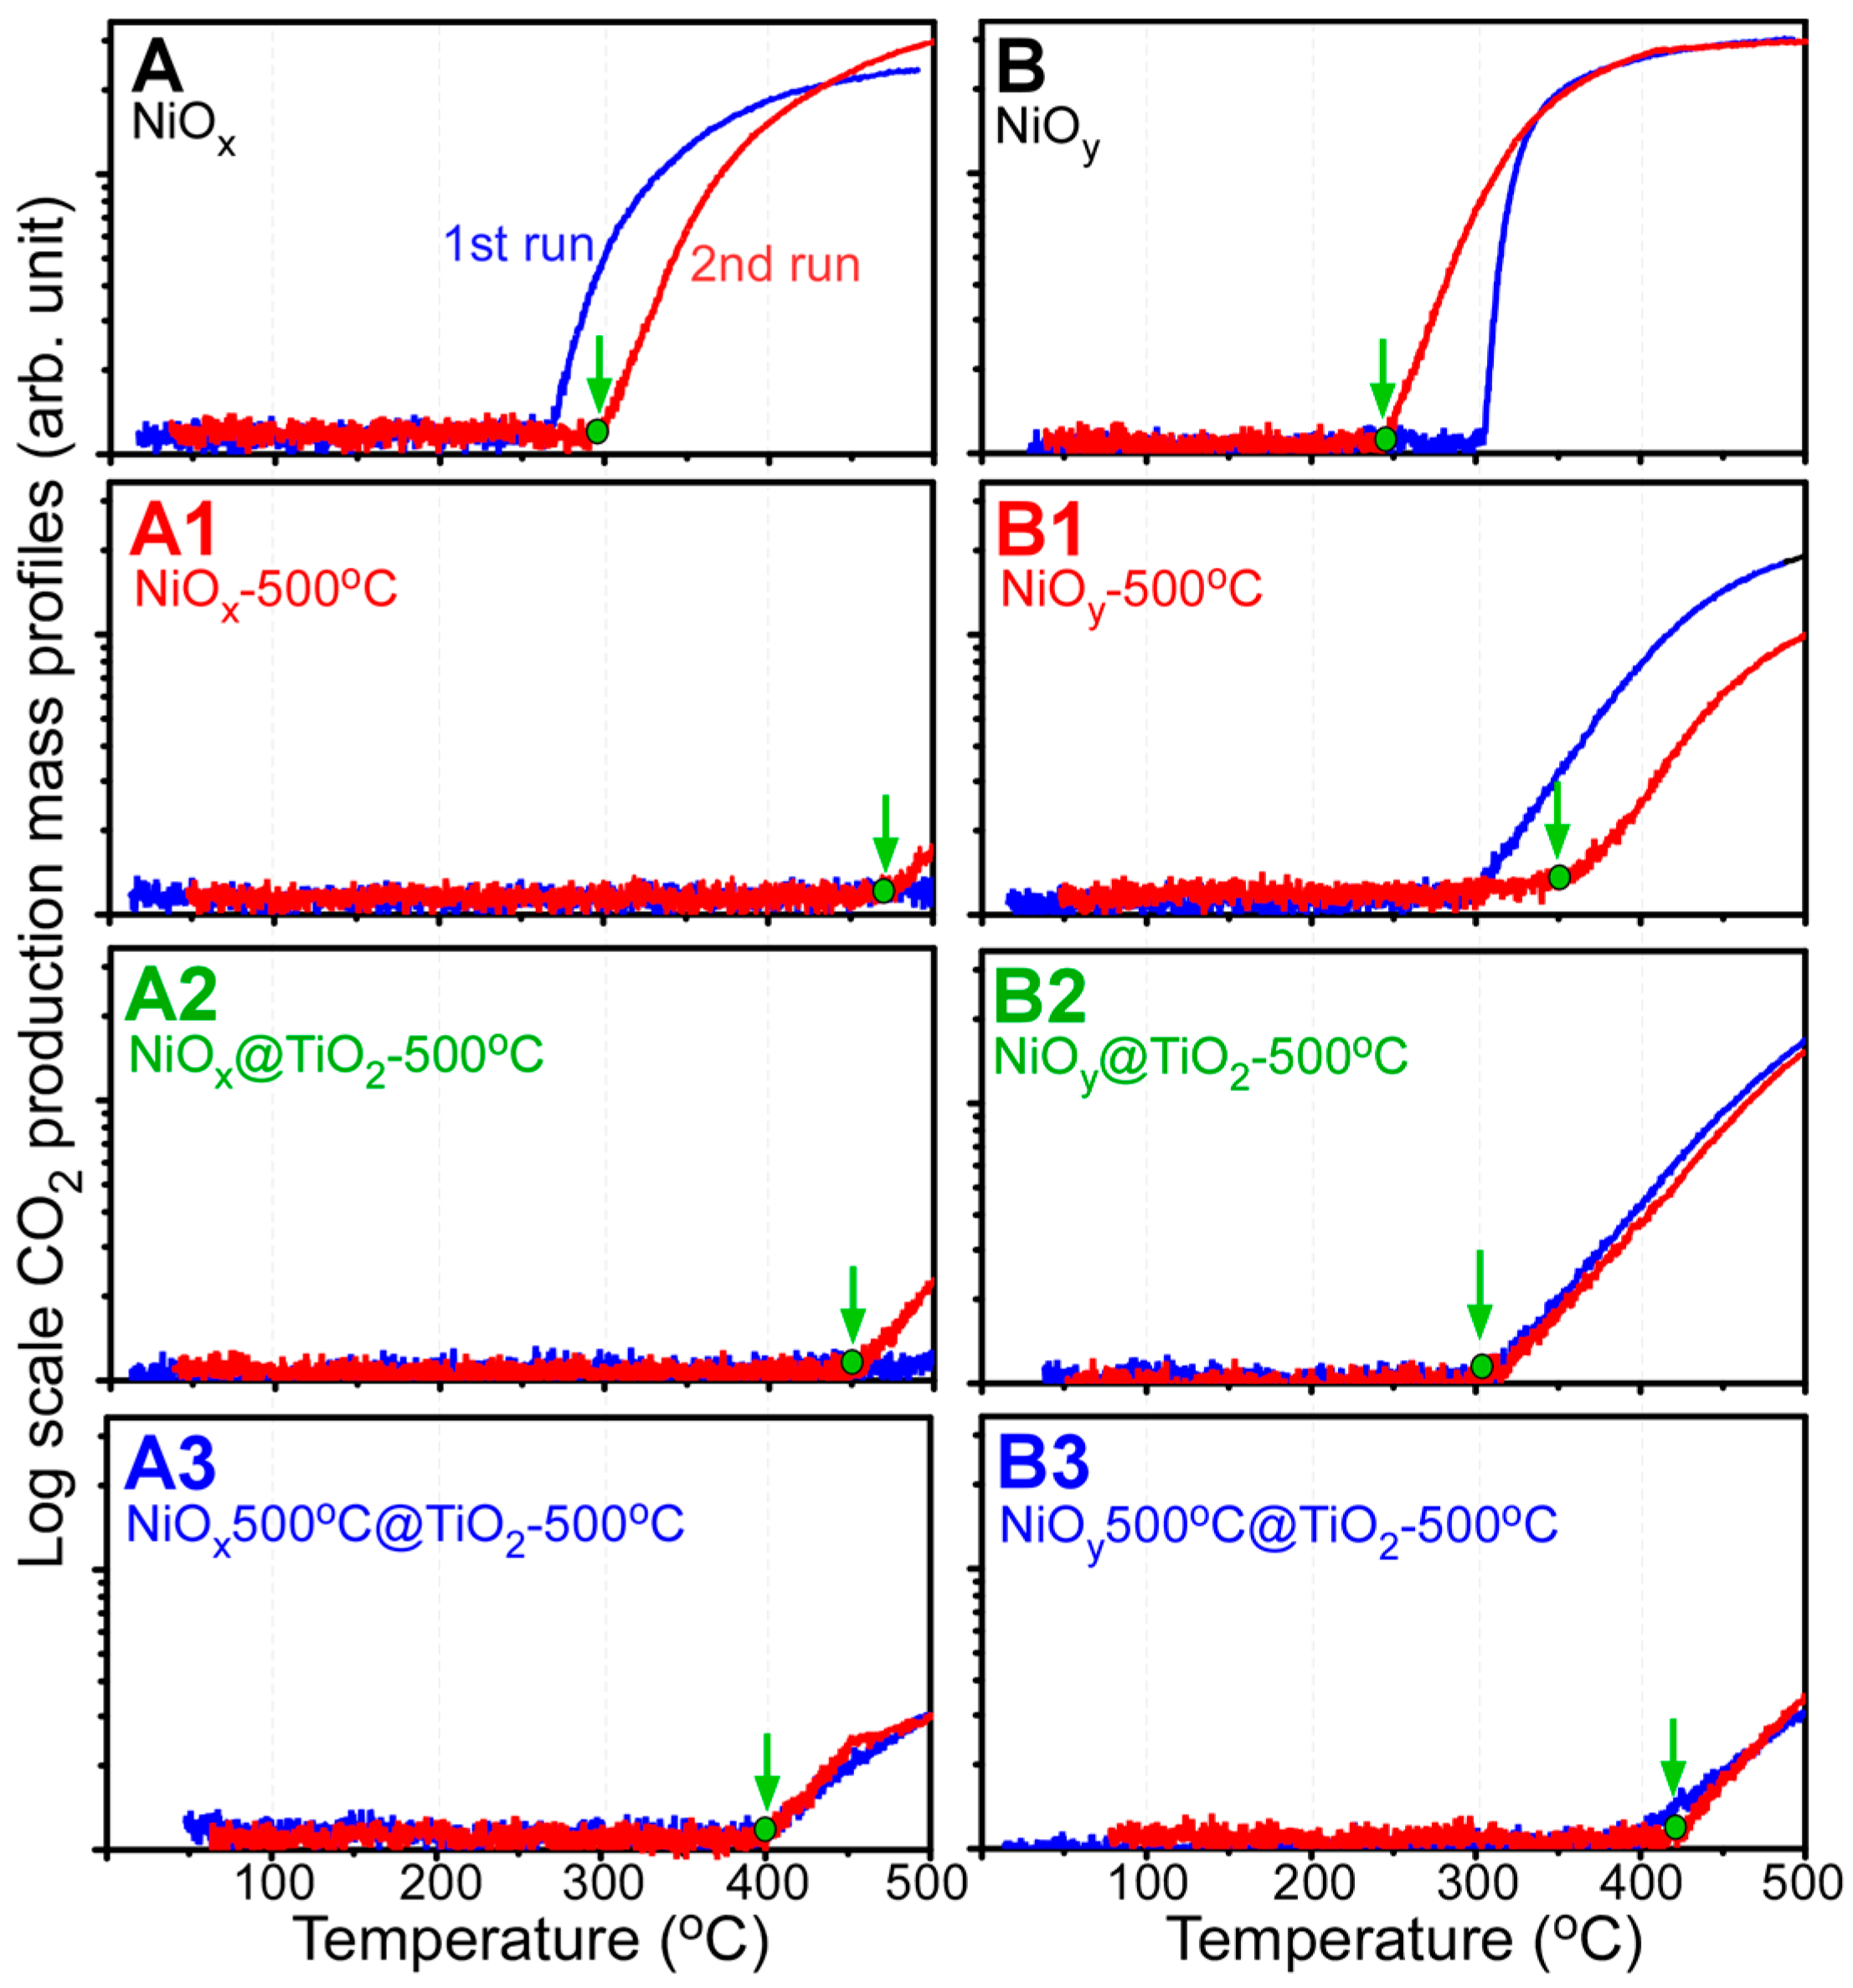
  • For CO oxidation, the B2 sample (NiOy@TiO2-500 °C) was also more efficient for CO oxidation than other samples.
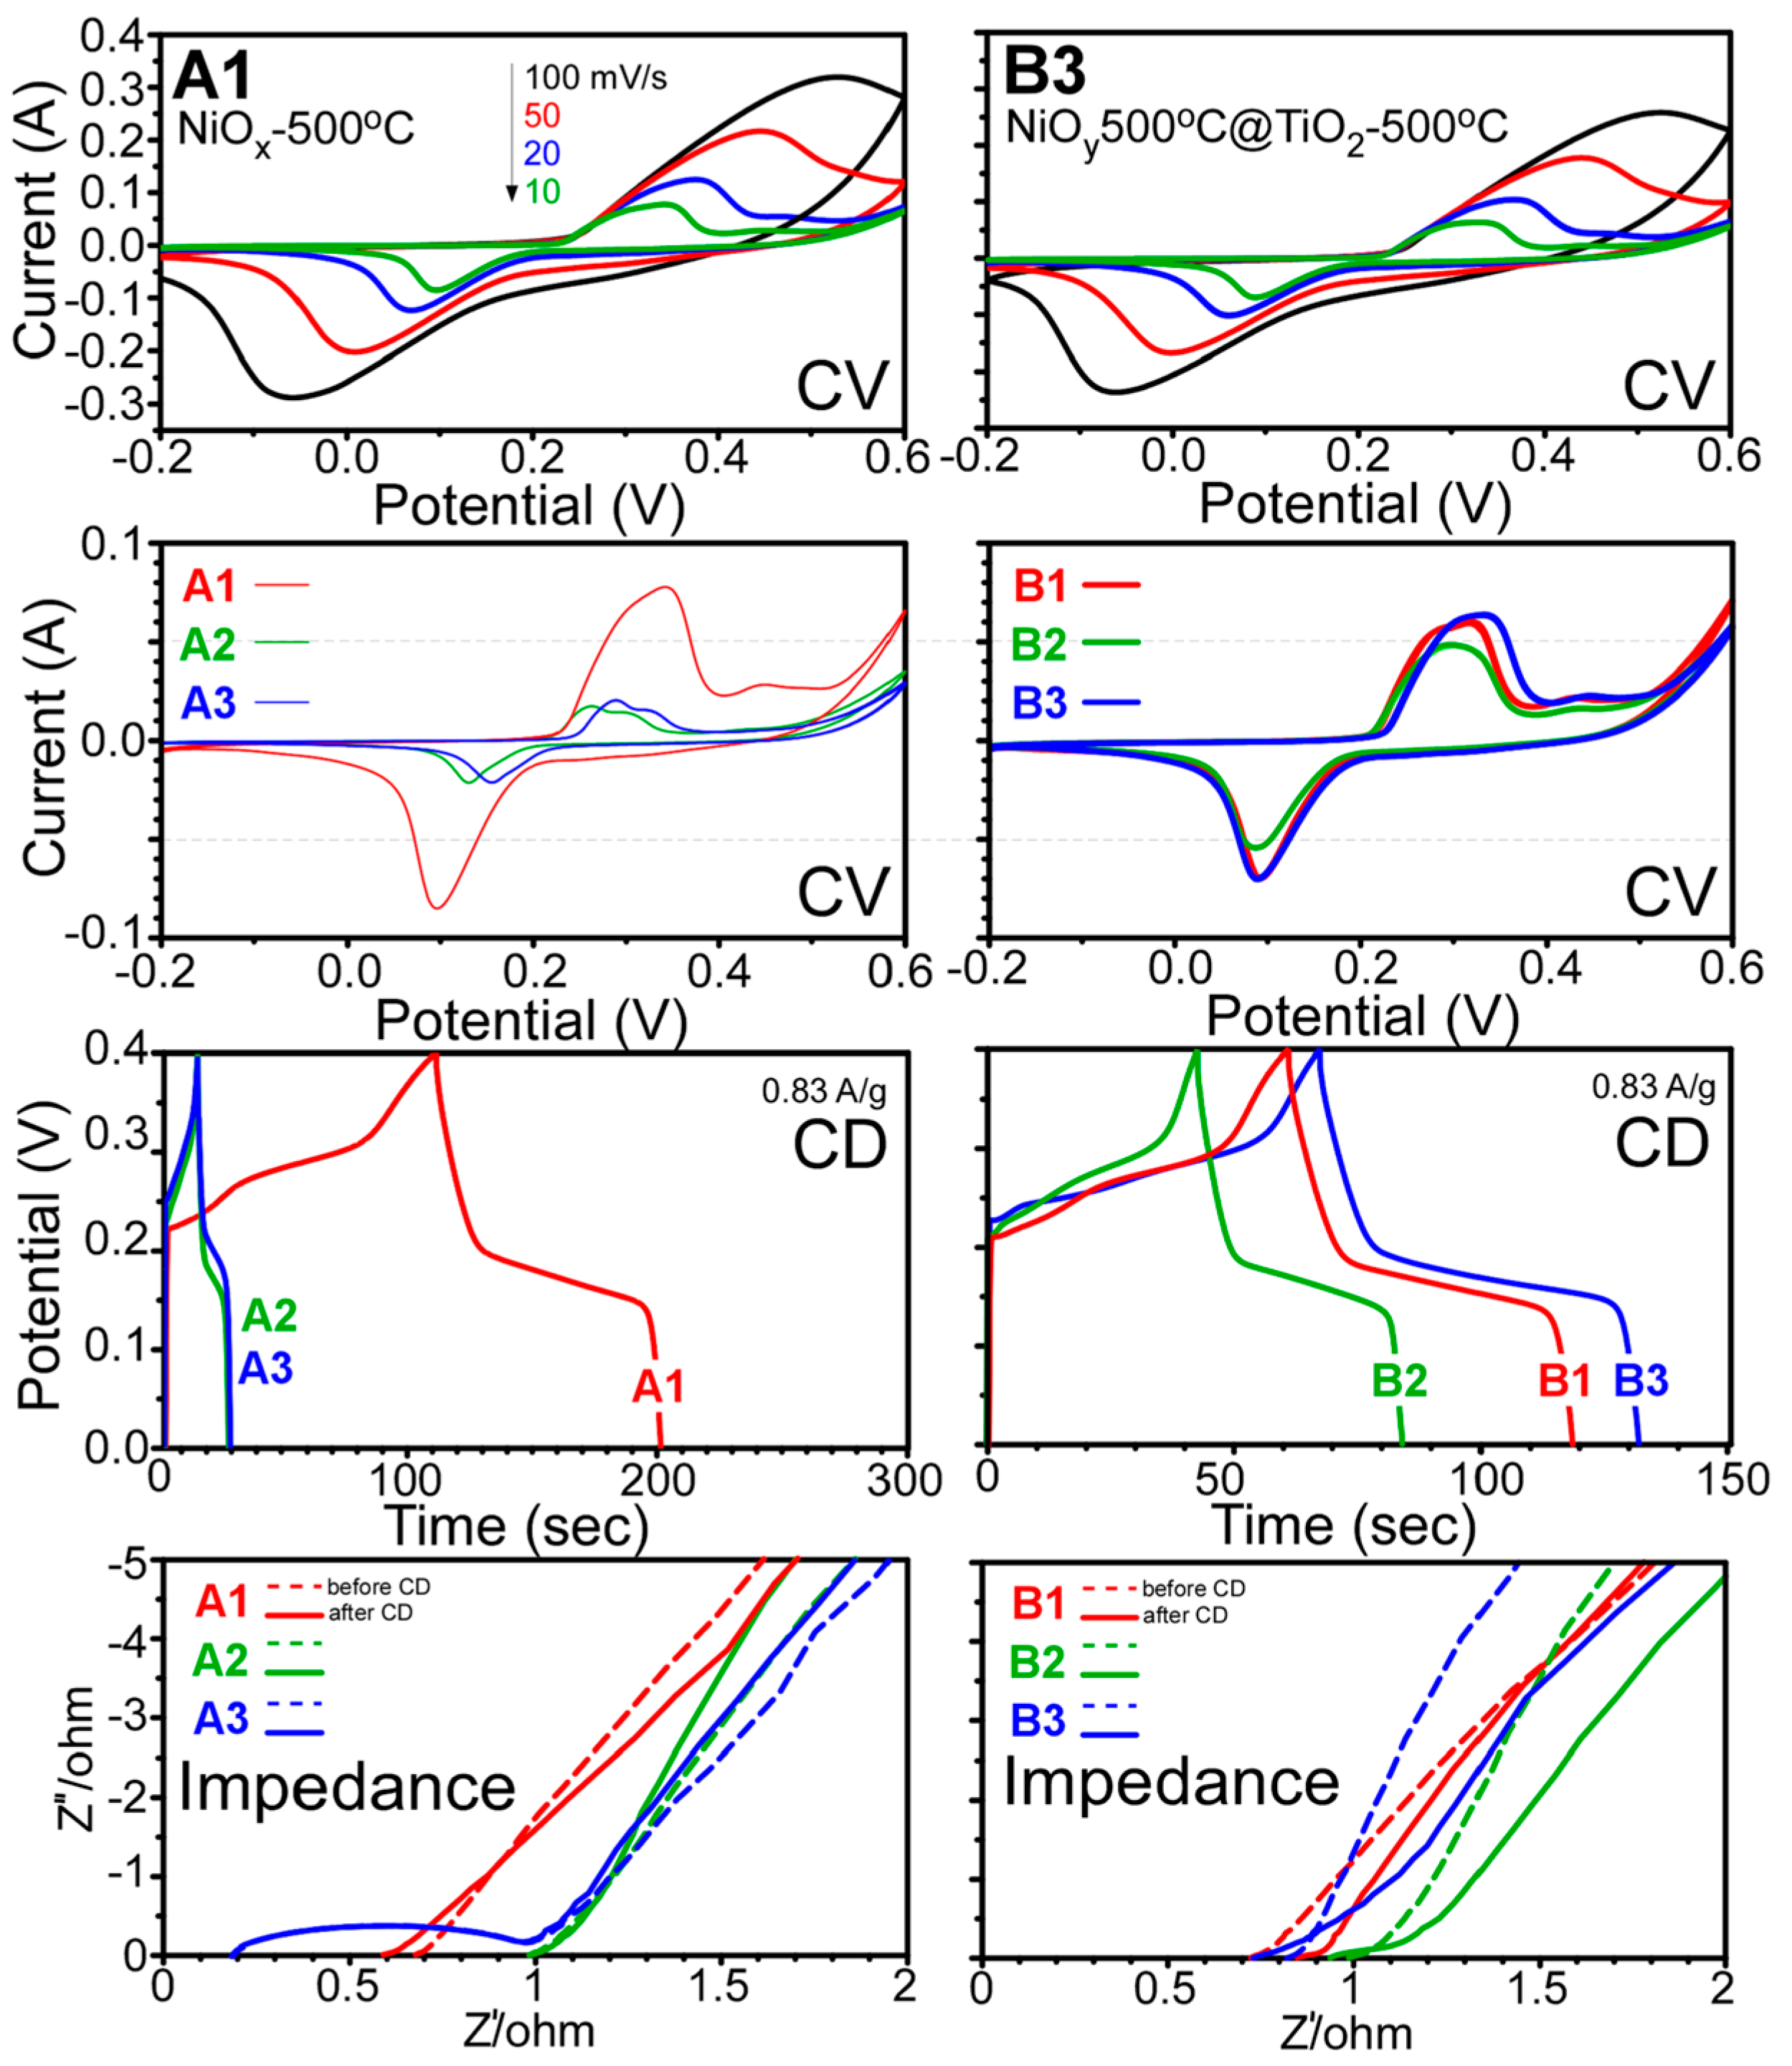
  • For the case of specific capacitance, the B3 sample (NiOx500°C@TiO2-500°C) was more efficient for specific capacitance than other samples. Specific capacitances were obtained to be in the range of 50–320 F/g. When Ni(OH)2 plates were used as starting material, the TiO2 coating showed a specific capacitance of only 50 F/g. However, when rod-shaped Ni oxalate complex was used, the TiO2 coating showed specific capacitance values of 211 and 134 F/g.
Briefly, the present study showed that the sample preparation procedures and the annealing steps vary greatly in the application fields to achieve a higher performance. The obtained valuable information on the preparation methods of the investigated core-shell structures could be extended to other transition metal oxide core-shell structures, promoting their development and diverse applications.

Acknowledgments

This work was financially supported by the National Research Foundation of Korea (NRF) grant funded by the Korean government (MEST) (NRF-2014R1A1A2055923).

Author Contributions

Y.S. and W.G.S. designed the experiments and wrote the paper; S.L. performed most of the experiments; J.L. and K.N. supported S.L. during the experiments.

Conflicts of Interest

The authors declare no conflict of interest.

References

  1. Xu, H. Multilayered metal core-shell nanostructures for inducing a large and tunable local optical field. Phys. Rev. B 2005, 72, 073405. [Google Scholar] [CrossRef]
  2. Su, L.; Jing, Y.; Zhou, Z. Li ion battery materials with core–shell nanostructures. Nanoscale 2011, 3, 3967–3983. [Google Scholar] [CrossRef] [PubMed]
  3. Zhang, J.; Tang, Y.; Lee, K.; Ouyang, M. Nonepitaxial growth of hybrid core-shell nanostructures with large lattice mismatches. Science 2010, 327, 1634–1638. [Google Scholar] [CrossRef] [PubMed]
  4. Ke, Q.; Zheng, M.; Liu, H.; Guan, C.; Mao, L.; Wang, J. 3D TiO2@Ni(OH)2 core-shell arrays with tunable nanostructure for hybrid supercapacitor application. Sci. Rep. 2015, 5, 13940. [Google Scholar] [CrossRef] [PubMed]
  5. Chen, W.X.; Yu, J.S.; Hu, W.; Chen, Z.L.; Memon, H.; Chen, G.L. Titanate nanowire/NiO nanoflake core/shell heterostructured nanonanocomposite catalyst for methylene blue photodegradation. RSC Adv. 2016, 6, 67827–67832. [Google Scholar] [CrossRef]
  6. Wang, M.; Hu, Y.; Han, J.; Guo, R.; Xiong, H.; Yin, Y. TiO2/NiO hybrid shells: p–n junction photocatalysts with enhanced activity under visible light. J. Mater. Chem. A 2015, 3, 20727–20735. [Google Scholar] [CrossRef]
  7. Wu, J.B.; Guo, R.Q.; Huang, X.H.; Lin, Y. Construction of self-supported porous TiO2/NiO core/shell nanorod arrays for electrochemical capacitor application. J. Power Sources 2013, 243, 317–322. [Google Scholar] [CrossRef]
  8. Kim, J.-H.; Zhu, K.; Yan, Y.; Perkins, C.L.; Frank, A.J. Microstructure and pseudocapacitive properties of electrodes constructed of oriented NiO-TiO2 nanotube arrays. Nano Lett. 2010, 10, 4099–4104. [Google Scholar] [CrossRef] [PubMed]
  9. Balogun, M.-S.; Qiu, W.; Luo, Y.; Huang, Y.; Yang, H.; Li, M.; Yu, M.; Liang, C.; Fang, P.; Liu, P.; et al. Improving the lithium-storage properties of self-grown nickel oxide: A back-up from TiO2 nanoparticles. Chem. Electro. Chem. 2015, 2, 1243–1248. [Google Scholar] [CrossRef]
  10. Kong, X.; Liu, C.; Dong, W.; Zhang, X.; Tao, C.; Shen, L.; Zhou, J.; Fei, Y.; Ruan, S. Metal-semiconductor-metal TiO2 ultraviolet detectors with Ni electrodes. Appl. Phys. Lett. 2009, 94, 123502. [Google Scholar] [CrossRef]
  11. Wang, W.; Tian, M.; Abdulagatov, A.; George, S.M.; Lee, Y.-C.; Yang, R. Three-dimensional Ni/TiO2 nanowire network for high areal capacity lithium ion microbattery applications. Nano Lett. 2012, 12, 655–660. [Google Scholar] [CrossRef] [PubMed]
  12. Choi, S.H.; Lee, J.-H.; Kang, Y.C. One-pot rapid synthesis of core–shell structured NiO@TiO2 nanopowders and their excellent electrochemical properties as anode materials for lithium ion batteries. Nanoscale 2013, 5, 12645–12650. [Google Scholar] [CrossRef] [PubMed]
  13. Urasaki, K.; Tanpo, Y.; Nagashima, Y.; Kikuchi, R.; Satokawa, S. Effects of preparation conditions of Ni/TiO2 catalysts for selective CO methanation in the reformate gas. J. Appl. Catal. A 2103, 452, 174–178. [Google Scholar] [CrossRef]
  14. Shinde, V.M.; Madras, G. CO methanation toward the production of synthetic natural gas over highly active Ni/TiO2 catalyst. AIChE J. 2014, 60, 1027–1035. [Google Scholar] [CrossRef]
  15. Ong, W.-J.; Gui, M.M.; Chai, S.-P.; Mohamed, A.R. Direct growth of carbon nanotubes on Ni/TiO2 as next generation catalysts for photoreduction of CO2 to methane by water under visible light irradiation. RSC Adv. 2013, 3, 4505–4509. [Google Scholar] [CrossRef]
  16. Sim, L.C.; Ng, K.W.; Ibrahim, S.; Saravanan, P. Preparation of improved p-n junction NiO/TiO2 nanotubes for solar-energy-driven light photocatalysis. Int. J. Photoenergy 2013, 2013, 659013. [Google Scholar] [CrossRef]
  17. Ku, Y.; Lin, C.-N.; Hou, W.-M. Characterization of coupled NiO/TiO2 photocatalyst for the photocatalytic reduction of Cr(VI) in aqueous solution. J. Mol. Catal. A 2011, 349, 20–27. [Google Scholar] [CrossRef]
  18. Chen, C.-J.; Liao, C.-H.; Hsu, K.-C.; Wu, Y.-T.; Wu, J.C.S. P–N junction mechanism on improved NiO/TiO2 photocatalyst. Catal. Commun. 2011, 12, 1307–1310. [Google Scholar] [CrossRef]
  19. Eskandarloo, H.; Badiei, A.; Behnajady, M.A. Study of the effect of additives on the photocatalytic degradation of a triphenylmethane dye in the presence of immobilized TiO2/NiO nanoparticles: Artificial neural network modeling. Ind. Eng. Chem. Res. 2014, 53, 6881–6895. [Google Scholar] [CrossRef]
  20. Hang, R.; Huang, X.; Tian, L.; He, Z.; Tang, B. Preparation, characterization, corrosion behavior and bioactivity of Ni2O3-doped TiO2 nanotubes on NiTi alloy. Electrochim. Acta 2102, 70, 382–393. [Google Scholar] [CrossRef]
  21. Hang, R.; Zong, M.; Bai, L.; Gao, A.; Liu, Y.; Zhang, X.; Huang, X.; Tang, B.; Chu, P.K. Anodic growth of ultra-long Ni-Ti-O nanopores. Electrochem. Commun. 2016, 71, 28–32. [Google Scholar] [CrossRef]
  22. Hou, G.-Y.; Xie, Y.-Y.; Wu, L.-K.; Cao, H.-Z.; Tang, Y.-P.; Zheng, G.-Q. Electrocatalytic performance of Ni-Ti-O nanotube arrays/NiTi alloy electrode annealed under H2 atmosphere for electro-oxidation of methanol. Int. J. Hydrogen Energy 2016, 41, 9295–9302. [Google Scholar] [CrossRef]
  23. Hou, L.; Li, S.; Lin, Y.; Wang, D.; Xie, T. Photogenerated charges transfer across the interface between NiO and TiO2 nanotube arrays for photocatalytic degradation: A surface photovoltage study. J. Colloid Interface Sci. 2016, 464, 96–102. [Google Scholar] [CrossRef] [PubMed]
  24. Yu, J.; Wang, W.; Cheng, B. Synthesis and enhanced photocatalytic activity of a hierarchical porous flowerlike p–n junction NiO/TiO2 photocatalyst. Chem. Asian J. 2010, 5, 2499–2506. [Google Scholar] [CrossRef] [PubMed]
  25. Chockalingam, K.; Ganapathy, A.; Paramasivan, G.; Govindasamy, M.; Viswanathan, A. NiO/TiO2 nanoparticles for photocatalytic disinfection of bacteria under visible light. J. Am. Ceram. Soc. 2011, 94, 2499–2505. [Google Scholar] [CrossRef]
  26. Gao, Z.-D.; Han, Y.; Wang, Y.; Xu, J.; Song, Y.-Y. One-Step to prepare self-organized nanoporous NiO/TiO2 layers and its use in non-enzymatic glucose sensing. Sci. Rep. 2013, 3, 3323. [Google Scholar] [CrossRef] [PubMed]
  27. Salmistraro, M.; Schwartzberg, A.; Bao, W.; Depero, L.E.; Weber-Bargioni, A.; Cabrini, S.; Alessandri, I. Triggering and monitoring plasmon-enhanced reactions by optical nanoantennas coupled to photocatalytic beads. Small 2013, 9, 3301–3307. [Google Scholar] [CrossRef] [PubMed]
  28. Alessandri, I.; Ferroni, M.; Depero, L.E. In situ plasmon-heating-induced generation of Au/TiO2 “hot spots” on colloidal crystals. Chem. Phys. Chem. 2009, 10, 1017–1022. [Google Scholar] [CrossRef] [PubMed]
  29. Alessandri, I. Enhancing Raman scattering without plasmons: Unprecedented sensitivity achieved by TiO2 shell-based resonators. J. Am. Chem. Soc. 2013, 135, 5541–5544. [Google Scholar] [CrossRef] [PubMed]
  30. Alessandri, I.; Depero, L.E. All-oxide Raman-active traps for light and matter: Probing redox homeostasis model reactions in aqueous environment. Small 2014, 10, 1294–1298. [Google Scholar] [CrossRef] [PubMed]
  31. Alessandri, I.; Lombardi, J.R. Enhanced Raman scattering with dielectrics. Chem. Rev. 2016. [Google Scholar] [CrossRef] [PubMed]
  32. Hu, L.; Wu, L.; Liao, M.; Hu, X.; Fang, X. Electrical transport properties of large, individual NiCo2O4 nanoplates. Adv. Funct. Mater. 2012, 22, 998–1004. [Google Scholar] [CrossRef]
  33. Lee, S.; Kang, J.S.; Leung, K.T.; Kim, S.K.; Sohn, Y. Magnetic Ni-Co alloys induced by water gas shift reaction, Ni-Co oxides by CO oxidation and their supercapacitor applications. Appl. Suf. Sci. 2016, 386, 393–404. [Google Scholar] [CrossRef]
  34. Cui, Y.; Wang, C.; Wu, S.; Liu, G.; Zhang, F.; Wang, T. Lotus-root-like NiO nanosheets and flower-like NiO microspheres: Synthesis and magnetic properties. CrystEngComm 2011, 13, 4930–4934. [Google Scholar] [CrossRef]
  35. Harvey, A.; He, X.; Godwin, I.J.; Backes, C.; McAteer, D.; Berner, N.C.; McEvoy, N.; Ferguson, A.; Shmeliov, A.; Lyons, M.E.G.; et al. Production of Ni(OH)2 nanosheets by liquid phase exfoliation: From optical properties to electrochemical applications. J. Mater. Chem. A 2016, 4, 11046–11059. [Google Scholar] [CrossRef]
  36. Xiong, X.; Ding, D.; Chen, D.; Waller, G.; Bu, Y.; Wang, Z.; Liu, M. Three-dimensional ultrathin Ni(OH)2 nanosheets grown on nickel foam for high-performance supercapacitors. Nano Energy 2015, 11, 154–161. [Google Scholar] [CrossRef]
  37. Sun, W.; Rui, X.; Ulaganathan, M.; Madhavi, S.; Yan, Q. Few-layered Ni(OH)2 nanosheets for high-performance supercapacitors. J. Power Sources 2015, 295, 323–328. [Google Scholar] [CrossRef]
  38. Gao, H.; Wang, G.; Yang, M.; Tan, L.; Yu, J. Novel tunable hierarchical Ni–Co hydroxide and oxide assembled from two-wheeled units. Nanotechnology 2012, 23, 015607. [Google Scholar] [CrossRef] [PubMed]
  39. Charpentier, P.A.; Burgess, K.; Wang, L.; Chowdhury, R.R.; Lotus, A.F.; Moula, G. Nano-TiO2/polyurethane composites for antibacterial and self-cleaning coatings. Nanotechnology 2012, 23, 425606. [Google Scholar] [CrossRef] [PubMed]
  40. Wezynfeld, N.E.; Goch, W.; Bal, W.; Frączyk, T. cis-Urocanic acid as a potential nickel(II) binding molecule in the human skin. Dalton Trans. 2014, 43, 3196–3201. [Google Scholar] [CrossRef] [PubMed]
  41. Choi, Y.I.; Lee, S.; Kim, S.K.; Kim, Y.I.; Cho, D.W.; Khan, M.M.; Sohn, Y. Fabrication of ZnO, ZnS, Ag-ZnS, and Au-ZnS microspheres for photocatalytic activities, CO oxidation and 2-hydroxyterephthalic acid synthesis. J. Alloys Compd. 2016, 675, 46–56. [Google Scholar] [CrossRef]
  42. Lee, S.; Park, Y.; Pradhan, D.; Sohn, Y. AgX (X = Cl, Br, I)/BiOX nanoplates and microspheres for pure and mixed (methyl orange, rhodamine B and methylene blue) dyes. J. Ind. Eng. Chem. 2016, 35, 231–252. [Google Scholar] [CrossRef]
  43. Choi, Y.I.; Jeon, K.H.; Kim, H.S.; Lee, J.H.; Park, S.J.; Roh, J.E.; Khan, M.M.; Sohn, Y. TiO2/BiOX (X = Cl, Br, I) hybrid microspheres for artificial waste water and real sample treatment under visible light irradiation. Sep. Purif. Technol. 2016, 160, 28–42. [Google Scholar] [CrossRef]
  44. Yoon, H.J.; Choi, Y.I.; Jang, E.S.; Sohn, Y. Graphene, charcoal, ZnO, and ZnS/BiOX (X = Cl, Br, and I) hybrid microspheres for photocatalytic simulated real mixed dye treatments. J. Ind. Eng. Chem. 2015, 32, 137–152. [Google Scholar] [CrossRef]
  45. Choi, Y.I.; Kim, Y.I.; Cho, D.W.; Kang, J.S.; Leung, K.T.; Sohn, Y. Recyclable magnetic CoFe2O4/BiOX (X = Cl, Br and I) microflowers for photocatalytic treatment of water contaminated with methyl orange, rhodamine B, methylene blue, and a mixed dye. RSC Adv. 2015, 5, 79624–79634. [Google Scholar] [CrossRef]
  46. Shifu, C.; Sujuan, Z.; Wei, L.; Wei, Z. Preparation and activity evaluation of p–n junction photocatalyst NiO/TiO2. J. Hazard. Mater. 2008, 155, 320–326. [Google Scholar] [CrossRef] [PubMed]
  47. Na, Y.; Kim, Y.; Cho, D.W.; Pradhan, D.; Sohn, Y. Adsorption/photocatalytic performances of hierarchical flowerlike BiOBrxCl1−x nanostructures for methyl orange, Rhodamine B and methylene blue. Mater. Sci. Semicond. Process. 2104, 27, 181–190. [Google Scholar] [CrossRef]
  48. Na, Y.; Lee, S.W.; Roy, N.; Pradhan, D.; Sohn, Y. Room temperature light-induced recrystallization of Cu2O cubes to CuO nanoribbons in water. CrystEngComm 2014, 16, 8546–8554. [Google Scholar] [CrossRef]
  49. Park, Y.; Na, Y.; Pradhan, D.; Min, B.-K.; Sohn, Y. Adsorption and UV/Visible photocatalytic performance of echinoid-like BiOI for methyl orange, Rhodamine B and methylene blue: Ag and Ti-loading effects. CrystEngComm 2014, 16, 3155–3167. [Google Scholar] [CrossRef]
  50. Kim, W.J.; Pradhan, D.; Min, B.-K.; Sohn, Y. Adsorption/photocatalytic activity and fundamental natures of BiOCl and BiOClxI1−x prepared in water and ethylene glycol environments, and Ag and Au-doping effects. Appl. Catal. B 2014, 147, 711–725. [Google Scholar] [CrossRef]
  51. Lee, S.; Cho, I.; Sohn, Y. Hierarchical BiOBr, AgBr/BiOBr and BiOBrxI1-x nano-assembled microspheres for photocatalytic methyl orange treatment. J. Nanosci. Nanotechnol. 2015, 15, 8362–8369. [Google Scholar] [CrossRef] [PubMed]
  52. Choi, Y.I.; Jung, H.J.; Shin, W.G.; Sohn, Y. Band gap-engineered ZnO and Ag/ZnO by ball-milling method and their photocatalytic and Fenton-like photocatalytic activities. Appl. Surf. Sci. 2015, 356, 615–625. [Google Scholar] [CrossRef]
  53. Lee, S.; Kang, J.-S.; Leung, K.T.; Lee, W.; Kim, D.; Han, S.; Yoo, W.; Yoon, H.J.; Nam, K.; Sohn, Y. Unique multi-phase Co/Fe/CoFe2O4 by water-gas shift reaction, CO oxidation and enhanced supercapacitor performances. J. Ind. Eng. Chem. 2016, 43, 69–77. [Google Scholar] [CrossRef]
  54. Kim, W.J.; Lee, S.W.; Sohn, Y. Metallic Sn spheres and SnO2@C core-shells by anaerobic and aerobic catalytic ethanol and CO oxidation reactions over SnO2 nanoparticles. Sci. Rep. 2015, 5, 13448. [Google Scholar] [CrossRef] [PubMed]
  55. Park, Y.; Lee, S.W.; Kim, K.H.; Min, B.-K.; Nayak, A.K.; Pradhan, D.; Sohn, Y. Understanding hydrothermal transformation from Mn2O3 particles to Na0.55Mn2O4·1.5H2O nanosheets, nanobelts, and single crystalline ultra-long Na4Mn9O18 nanowires. Sci. Rep. 2015, 5, 18275. [Google Scholar] [CrossRef] [PubMed]
  56. Park, Y.; Kim, S.K.; Pradhan, D.; Sohn, Y. Thermal H2-treatment effects on CO/CO2 conversion over Pd-doped CeO2 comparison with Au and Ag-doped CeO2. React. Kinet. Mech. Cat. 2014, 113, 85–100. [Google Scholar] [CrossRef]
  57. Ci, S.; Wen, Z.; Qian, Y.; Mao, S.; Cui, S.; Chen, J. NiO-microflower formed by nanowire-weaving nanosheets with interconnected Ni-network decoration as supercapacitor electrode. Sci. Rep. 2015, 5, 11919. [Google Scholar] [CrossRef] [PubMed]
  58. Xie, Y.; Huang, C.; Zhou, L.; Liu, Y.; Huang, H. Supercapacitor application of nickel oxide-titania nanocomposites. Compos. Sci. Technol. 2009, 69, 2108–2114. [Google Scholar] [CrossRef]
  59. Cui, L.H.; Wang, Y.; Shu, X.; Zhang, J.F.; Yu, C.P.; Cui, J.W.; Zheng, H.M.; Zhang, Y.; Wu, Y.C. Supercapacitive performance of hydrogenated TiO2 nanotube arrays decorated with nickel oxide nanoparticles. RSC Adv. 2016, 6, 12185–12192. [Google Scholar] [CrossRef]
Figure 1. Field-emission scanning electron microscopy (FE-SEM) images of as-prepared NiO (A and B), A and B after annealing at 500 °C (A1 and B1), TiO2-coated A and B followed by annealing at 500 °C (A2 and B2), and TiO2-coated A1 and B1 followed by annealing at 500 °C (A3 and B3). The starting materials A and B show different morphologies.
Materials 09 01024 g001
Figure 2. X-ray diffraction (XRD) patterns of as-prepared NiO (A and B), A and B after annealing at 500 °C (A1 and B1), TiO2-coated A and B followed by annealing at 500 °C (A2 and B2), and TiO2-coated A1 and B1 followed by annealing at 500 °C (A3 and B3) samples. Reference patterns are also shown at the bottom.
Materials 09 01024 g002
Figure 3. Fourier-transform infrared (FT-IR) spectra of as-prepared NiO (A and B), A and B after annealing at 500 °C (A1 and B1), TiO2-coated A and B followed by annealing at 500 °C (A2 and B2), and TiO2-coated A1 and B1 followed by annealing at 500 °C (A3 and B3).
Materials 09 01024 g003
Figure 4. Ultraviolet-visible absorption spectra of as-prepared NiO (A and B), A and B after annealing at 500 °C (A1 and B1), TiO2-coated A and B followed by annealing at 500 °C (A2 and B2), and TiO2-coated A1 and B1 followed by annealing at 500 °C (A3 and B3).
Materials 09 01024 g004
Figure 5. Ultraviolet-visible absorption spectra for photocatalytic mixed dye degradation under visible-light irradiation obtained using as-synthesized NiO followed by TiO2 coating and annealing at 500 °C (A2 and B2), and pre-annealed (500 °C) NiO followed by TiO2 coating and annealing at 500 °C (A3 and B3).
Materials 09 01024 g005
Figure 6. Adsorption (C/Co) and photodegradation (C/Cad) performance profiles of photocatalytic mixed dye solutions containing as-synthesized NiO followed by TiO2 coating and annealing at 500 °C (A2 and B2), and pre-annealed (500 °C) NiO followed by TiO2 coating and annealing at 500 °C (A3 and B3). The corresponding ultraviolet-visible (UV-Vis) absorption spectra are shown in Figure 5. C0 and Cad indicate the UV-Vis absorption intensities of the mixed solution before and after adsorption, respectively.
Materials 09 01024 g006
Figure 7. Ultraviolet (UV) visible absorption spectra for photocatalytic mixed dye degradation under UV-light irradiation obtained using as-synthesized NiO followed by TiO2 coating and annealing at 500 °C (A2 and B2), and pre-annealed (500 °C) NiO followed by TiO2 coating and annealing at 500 °C (A3 and B3).
Materials 09 01024 g007
Figure 8. CO2 production (by CO oxidation) mass profiles for as-prepared NiO (A and B), annealed (500 °C) A and B (A1 and B1), TiO2-coated A and B followed by annealing at 500 °C (A2 and B2), and TiO2-coated A1 and B1 followed by annealing at 500 °C (A3 and B3).
Materials 09 01024 g008
Figure 9. Cyclic voltammetry curves (voltage range: −0.2~0.6 V) at different scan rates (10, 20, 50, and 100 mV/s), charge-discharge curves at the current density of 0.83 A/g, and Nyquist impedance plots for annealed (500 °C) NiOx and NiOy samples (A1 and B1), TiO2-coated as-synthesized NiOx and NiOy samples followed by annealing at 500 °C (A2 and B2), and A1 and B1 samples followed by TiO2 coating and annealing at 500 °C (A3 and B3).
Materials 09 01024 g009
Table 1. Literature catalysts for the photocatalytic degradation of mixed dyes.
CatalystsOrder of Dye Degradation under Visible LightReference
ZnO, ZnS, Au-ZnS, Ag-ZnSRhB < MB << MO41
BiOX, AgX/BiOX (X = Cl, Br, I)RhB < MB << MO42
TiO2/BiOX (X = Cl, Br, I)RhB < MB << MO43
Graphene, Charcoal, ZnO, and ZnS/BiOX (X = Cl, Br, I)RhB < MB < MO44
Ag/ZnO by wet-milling methodMB < RhB < MO52
NiO@TiO2 core-shellsRhB < MB << MOThis study
Table 2. Literature specific capacitance for TiO2–NiO hybrid materials
SamplesPreparation MethodsSpecific CapacitanceReference
TiO2@Ni(OH)2 nanowire arraysHydrothermal synthesis and chemical bath deposition181 F/g at 5 mV/s4
TiO2/NiO nanorod arraysHydrothermal synthesis and electro-deposition methods611 F/g at 2 A/g7
flower-like NiO–TiO2 nanocompositeOne (or multi)-cycle alternate electrodeposition-oxidation and thermal dehydration46.3 mF·cm−258
NiOx decorated TiO2 nanotubesCyclic voltammetry electrochemical deposition process689.28 F/g at 1.5 A/g59
NiO-TiO2 nanotubesElectrochemical anodization and thermal annealing40–300 F/g8
NiO@TiO2 core-shellsWet chemical and thermal annealing50–211 F/g at 0.83 A/gThis study

