Hierarchical Gradient Similarity Based Video Quality Assessment Metric


1
College of Telecommunications and Information Engineering, Nanjing University of Posts and Telecommunications, Nanjing 210003, China
2
Nari Group Corporation (State Grid Electric Power Research Institute), Nanjing 210003, China
3
School of Computer Science, Nanjing University of Posts and Telecommunications, Nanjing 210003, China
*
Author to whom correspondence should be addressed.
Algorithms 2017, 10(3), 72; https://doi.org/10.3390/a10030072
Submission received: 18 April 2017
/
Revised: 19 June 2017
/
Accepted: 19 June 2017
/
Published: 23 June 2017
Abstract
:Video quality assessment (VQA) plays an important role in video applications for quality evaluation and resource allocation. It aims to evaluate video quality in a way that is consistent with human perception. In this letter, a hierarchical gradient similarity based VQA metric is proposed inspired by the structure of the primate visual cortex, in which visual information is processed through sequential visual areas. These areas are modeled with the corresponding measures to evaluate the overall perceptual quality. Experimental results on the LIVE database show that the proposed VQA metric significantly outperforms most of the state-of-the-art VQA metrics.
1. Introduction
Recently, video quality assessment (VQA) metrics which can evaluate the video quality consistent with the human perception have received increased attention. VQA metrics are generally classified into three categories, full-reference (FR), reduced-reference (RR), and no-reference (NR) metrics. A full-reference (FR) metric aims to evaluate the qualities of distorted videos with the full available reference videos. Peak signal-to-noise ratio (PSNR) and Mean square error (MSE) [1,2] are the most widely used FR metrics. These indices are simple to calculate and can be conveniently adopted in video and image applications, such as image processing and video coding [3,4,5]. However, they show poor consistency with subjective evaluations [6].
Many efforts have been made to investigate the FR VQA algorithms. Structural similarity index (SSIM) [7] is the most popular metric. The comparison functions of luminance, contrast, and structure are designed and combined to obtain the overall quality. SSIM-based VQA metrics have been proposed by introducing motion information, temporal weighting schemes, and multi-scales-based schemes [8,9,10]. These metrics are developed based on the assumption that the degradation of perceptual qualities is highly related to the change of the structural information. Moreover, gradient-based metrics have been proposed to describe the loss of the structural information [11,12]. In [12], edge-strength similarities were calculated for all pixels to acquire the overall quality score for each frame. In [13], the gradient-based 3-D structure tensors were decomposed to evaluate the video perceptual quality. Spatio-temporal gradient features were extracted to derive the 3-D structure tensor, and the corresponding eigenvalues and eigenvectors were used to evaluate the video perceptual quality.
In this letter, a VQA metric is designed based on a hierarchical gradient similarity model. This model is inspired by functional principles of the processing hierarchies in the primate visual system [14], which is characterized by a sequence of visual areas. These areas are modeled by hierarchical gradient measures to evaluate the score of each frame. The evaluation of visual attention similarity by an efficient measure is also involved in the proposed metric. Then, an averaging operation is performed to obtain the final score of the video sequence. Experimental results show that the proposed VQA metric outperforms the state-of-the-art VQA metrics.
2. Hierarchical Video Quality Assessment
As shown in Figure 1, the neuronal processing of visual information starts from the retina. Before the visual information reaches the visual cortex, it projects to a visual area named lateral geniculate nucleus (LGN). This stage is called precortical processing [14]. The occipital part of the primary visual cortex covers area V1–V4 and middle temporal (MT) area [15]. In the early visual areas, simple image features are extracted over small local regions. Then, this information is transmitted to the higher visual areas, in which more complex features are extracted covering larger and larger regions. The occipital part gives input to the ventral pathway (VP) and dorsal pathway (DP) [15]. The stream (V1→ V2→ V4) to the ventral pathway is critical for object discrimination, and the stream (V1→ V2→ MT) to the dorsal pathway is functionally related to visual motion [14]. This strongly indicates that these areas compute generic scene representations of visual information [16].
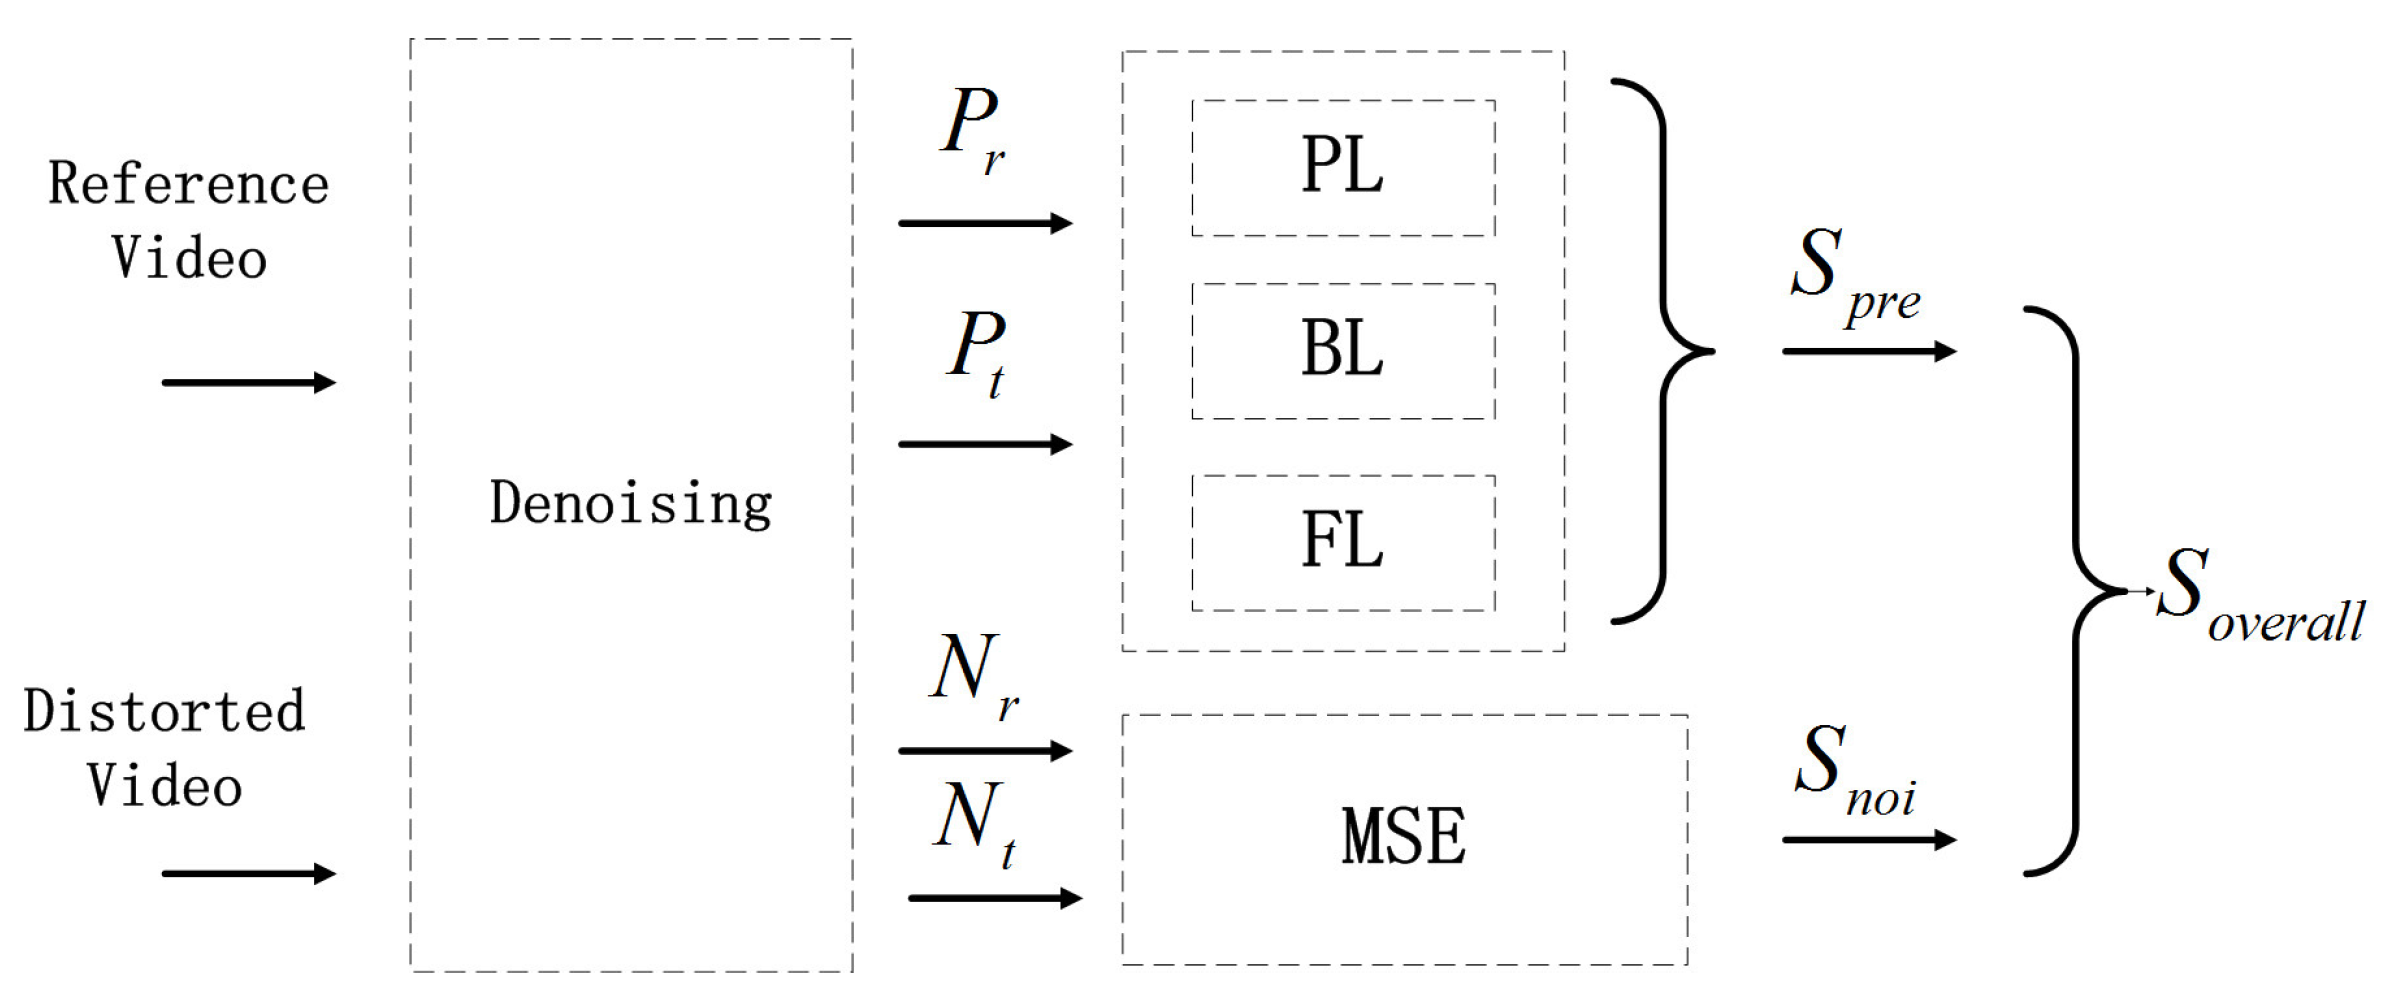
In this study, in order to assess the video quality in a manner consistent with human perception, the assessment of visual information is inspired by the hierarchical processing in the primate visual system. LGN is modeled as band-pass filtering, and the areas are modeled with hierarchical gradient measures. Furthermore, visual attention similarity evaluated by a new efficient measure is involved successively. As shown in Figure 2, the reference video and the distorted video are denoised respectively. Each video is divided into two parts: a prediction part (denoted as and respectively) and a noise part (denoted as and respectively). MSE between the noise parts is evaluated, and the hierarchical gradient measures are performed on the prediction parts. The hierarchical gradient measures consist of pixel level (PL) gradient similarity, block level (BL) gradient similarity and frame level (FL) gradient similarity. It should be noted that the proposed metric reacts in the same way to different types of distortion.
2.1. Modeling of the Precortical Processing
The precortical processing stage in the area LGN has a band-pass filtering characteristic for luminance stimuli [14]. This can be modeled by a denoising operation. A recent study [11] showed that perceptual distortion can be classified into content-dependent distortion and content-independent distortion. Content-independent distortion is mainly related to the additive noise. Thus, using the denoising operation, both the reference and distorted frames are decoupled into two parts: the prediction part and the noise part. In this paper, block-matching and 3D filtering algorithm (VBM3D) [17] is employed for denoising. Furthermore, since MSE presents a good match with the additive noise [18], the MSE is adopted to evaluate the degradation of the noise part:
where and are the noise part of the reference and test videos, respectively; denotes the MSE between and . The denominator is used to normalize the metric into the range [0,1]. In the numerator, adding 1 is to avoid to be smaller than 0. A approximately equal to 1 means the distortion is more weak.
2.2. Modeling the Stream to the Dorsal Pathway
Areas V1 and V2 contain cells that respond preferentially to linearly-oriented patterns, such as edges, bars, and gratings [14]. Edge detection such as Sobel filter can be used to model the processing of these areas. Furthermore, the MT area is dedicated to visual motion such as motion gradients, motion-defined edges, and locally opposite motions. Thus, the stream to the dorsal pathway can be modeled as a spatio-temporal gradient.
Since the spatio-temporal gradient vector also contains the components of the spatial version, the similarity of the spatio-temporal gradient vector is used to model the stream to the dorsal pathway. To balance the effect of the temporal and spatial gradients, each component is divided by the sum of positive filter coefficients, respectively. The similarity is evaluated as
where denotes the gradient similarity between and , which are the pixels in prediction parts of the reference frame and the distorted frame, respectively. The vectors and denote the corresponding spatio-temporal gradient vectors, which are calculated by the Sobel filter along x, y, and t directions, respectively; i.e., . The Sobel kernel for the t direction is a matrix [13]. The parameter is a small constant to avoid the denominator being zero, and is set as . The first term represents the similarity of the strengths between and . The second term represents the similarity of the directions between the two gradient vectors. Equation (2) can be further simplified to:
Using (3), each pixel will get the DP similarity.
2.3. Modeling the Stream to the Ventral Pathway
Both of the streams to the ventral and dorsal pathways contain the areas V1 and V2. Therefore, in order to reduce repetitive computation, only area V4 should be modeled. Area V4 is important for the perception of shape/curvature discrimination. The features are extracted over larger regions instead of local regions. In this study, it is modeled by the block-level gradient vectors similarities. The reference and distorted video frames are split into non-overlapped blocks. The mean values of the blocks construct down-sampled versions of the images. The spatial gradient of the down-sampled images are used to evaluate the similarity,
where denotes the block-level gradient similarity between the blocks and , which are the blocks in the prediction parts of the reference frame and the distorted frame, respectively. The formula is similar to Equation (3), whereas the difference is the vectors and are the 2-D spatial gradient vectors of the down-sampled images. Using (4), each block will get VP similarity.
2.4. Visual Attention Similarity
Representations in the visual cortex are known to be overcomplete. Visual attention models [19,20] show that the human visual system is more sensitive to salient regions. The similarities of only the salient pixels are selected to evaluate the perceptual quality. Similar to [13], pixels are determined to be the salient pixels if their spatio-temporal gradient magnitudes are above a threshold in either the reference video or the distorted video. The threshold is defined to be the average of the kth largest gradient magnitudes in the prediction parts of the reference frame and the distorted frame, respectively. It should be noted that the salient pixel detection is different from the traditional salient region and salient object detection methods. The proposed method is designed specially for video quality assessment so as to put more emphasis on important pixels, in which the salient pixels are distributed dispersedly. However, the salient pixels are concentrated in regions in the ground truth of the traditional saliency detection.
We denote the set of the salient pixels in and as and , respectively. The union of and —denoted as —is the set of the salient pixels selected to be processed. Furthermore, the averaging on the similarities of the salient pixels can be used to evaluate overall similarity. However, it may lose the changes of the visual attention, and cannot represent the degradation of the whole frame efficiently. Therefore, the similarity of the visual attention is introduced as
where denotes the attention similarity between the prediction parts and which are decoupled from the reference frame and the distorted frame, respectively. The numerator denotes the number of salient pixels in the reference frame. The denominator denotes the number of the salient pixels in the union set. The difference between the denominator and the numerator represents the newly increased salient pixels. Thus, the ratio between the denominator and the numerator represents the VA similarity. Since the salient pixels are detected as the pixels with high gradient magnitudes, the VA similarity is considered as the frame-level gradient similarity, as well as the visual attention similarity.
2.5. Overall Score
In the above subsections, degradations in different visual areas are modeled with the corresponding similarities. The final quality index of each frame can be calculated by combining these similarities. For the prediction similarity, the pixel-level similarity, the block level-similarity, and the visual attention similarity are multiplied to evaluate the prediction similarity as
where denotes the quality score of the prediction part which is decoupled from the distorted frame . The parameter denotes the salient pixel in the union set (i.e., only the salient pixels are considered in assessing video quality). The terms and denote the pixel-level similarity and the block-level similarity of the pixel x, respectively. The term denotes the visual attention similarity.
As in [11], the noise similarity is used as the exponent of the prediction similarity; i.e., the overall quality score of the frame is calculated as
where and denote the quality score of the prediction part and the noise part, respectively. Finally, all of the frame scores are averaged to give the final video quality index.
3. Experimental Results
The effectiveness of the proposed VQA metrics is evaluated by the consistency between the objective scores and the subjective scores, including Mean Opinion Score (MOS) and Difference Mean Opinion Score (DMOS). The consistency is measured by the Pearson correlation coefficient (PCC) and the Spearman rank order correlation coefficient (SROCC). The LIVE [21] and the EPFL-PoliMI [22,23] video quality assessment databases were used to evaluate the performance of the proposed VQA metric. There are 10 reference videos and 150 distorted videos in the LIVE database. All the video sequences are with the size of . There are four types of distortion: MPEG-2 compression, H.264 compression, and simulated transmission through error-prone IP networks and wireless networks. There are 12 reference videos and 144 distorted videos in the EPFL-PoliMI database. The video sequences have the resolutions of CIF and 4CIF. The videos are encoded using H.264/AVC. The bit streams are corrupted by dropping packets with loss values of 0.1%, 0.4%, 1%, 3%, 5%, and 10% [22]. Results with the state-of-the-art VQA metrics, including PSNR, SW-SSIM [8], MC-SSIM [9], STSI [13], VQM [24], MOVIE [25], ST-MAD [26], STAQ [27], and VRF [28] are compared. Since the reference methods are platform-independent, we copied the values from the reference articles. The results of PSNR and Picture Quality Analyzer are quoted from [13].
The mapping function adopted for regression of the computational quality score is a four-parameter mapping function, which is also used in STSI [13]
where are the fitting parameters.
Table 1 shows the PCC and SROCC of metrics performed on the LIVE database. It is observed that the proposed hierarchical VQA (HVQA) metric significantly outperforms all of the other metrics according to both indicators. The gradient similarity-based VQA metrics (HVQA and STSI) perform better than SSIM-based metrics such as SW-SSIM and MC-SSIM. This indicates that the change of the edge gradient is highly related to the degradation of the perceptual visual quality. This is reasonable for the areas V1 and V2 which are sensitive to the edge patterns. However, the proposed HVQA metric performs significantly better than STSI and ST-MAD. The reason is that degradations over the large regions (e.g., the packet-loss on the flat regions) cannot be represented efficiently by only the pixel-level gradient similarities. The similarities of area V4 and visual attention can improve the efficiency of the metrics. Furthermore, the proposed metric is compared with the optical flow-based VQA metric, MOVIE. HVQA significantly outperforms the MOVIE index (SROCC increment: 0.046), which performs the best in all of the comparison metrics.
To evaluate the effectiveness of the gradient similarities at each visual area, different combinations are reported in Table 1. The combinations can be classified into three categories. The category I methods use only one of the three measures, including DP, VP, VA. The category II methods use two of the three measures, including DP&VP, VP&VA, DP&VA. The category III method uses all three measures—that is, HVQA. It is observed that the average SROCC and PCC of the category I methods are 0.757. Thus, the similarities of single measure are efficient to represent the degradation of perceptual visual quality. The category II methods significantly outperform the category I methods. This indicates that the combination of two measures will improve the performance. The measures in different visual areas are not with the complete duplicate functions in visual evaluations. Furthermore, the category III method HVQA outperforms any other combinations. That is, the proposed metric is the most efficient for perceptual video quality evaluation.
Table 2 shows the PCC of state-of-the-art metrics performed on four kinds of distortion in the LIVE database, and Figure 3 shows the performance comparison between these metrics as bar charts. For three of the four distortion types, the proposed metric performs in the top three. For the IP distortion types, HVQA performs the best in the comparison metrics. For the wireless and MPEG2 distortion, HVQA performs the third best and is competitive with the best. For the MPEG2 distortion, the proposed HVQA metric is also competitive with the top three metrics. However, some of the comparison metrics show high performance on only one type of distortion. For example, VQM on MPEG2 type, STSI on IP type, and MOVIE on wireless type; each of them has a high performance on the correspondence distortion type, but do not perform well on the other types. Thus, the HVQA metric is rather robust to various types of video distortion. It is observed that the HVQA metric significantly outperforms the STSI index for all four types of distortion. This coincides with the former analysis showing that the similarities of the area V4 and visual attention can improve the performance. It should be noted that the proposed metric outperforms all of the compared metrics for all distortion types.
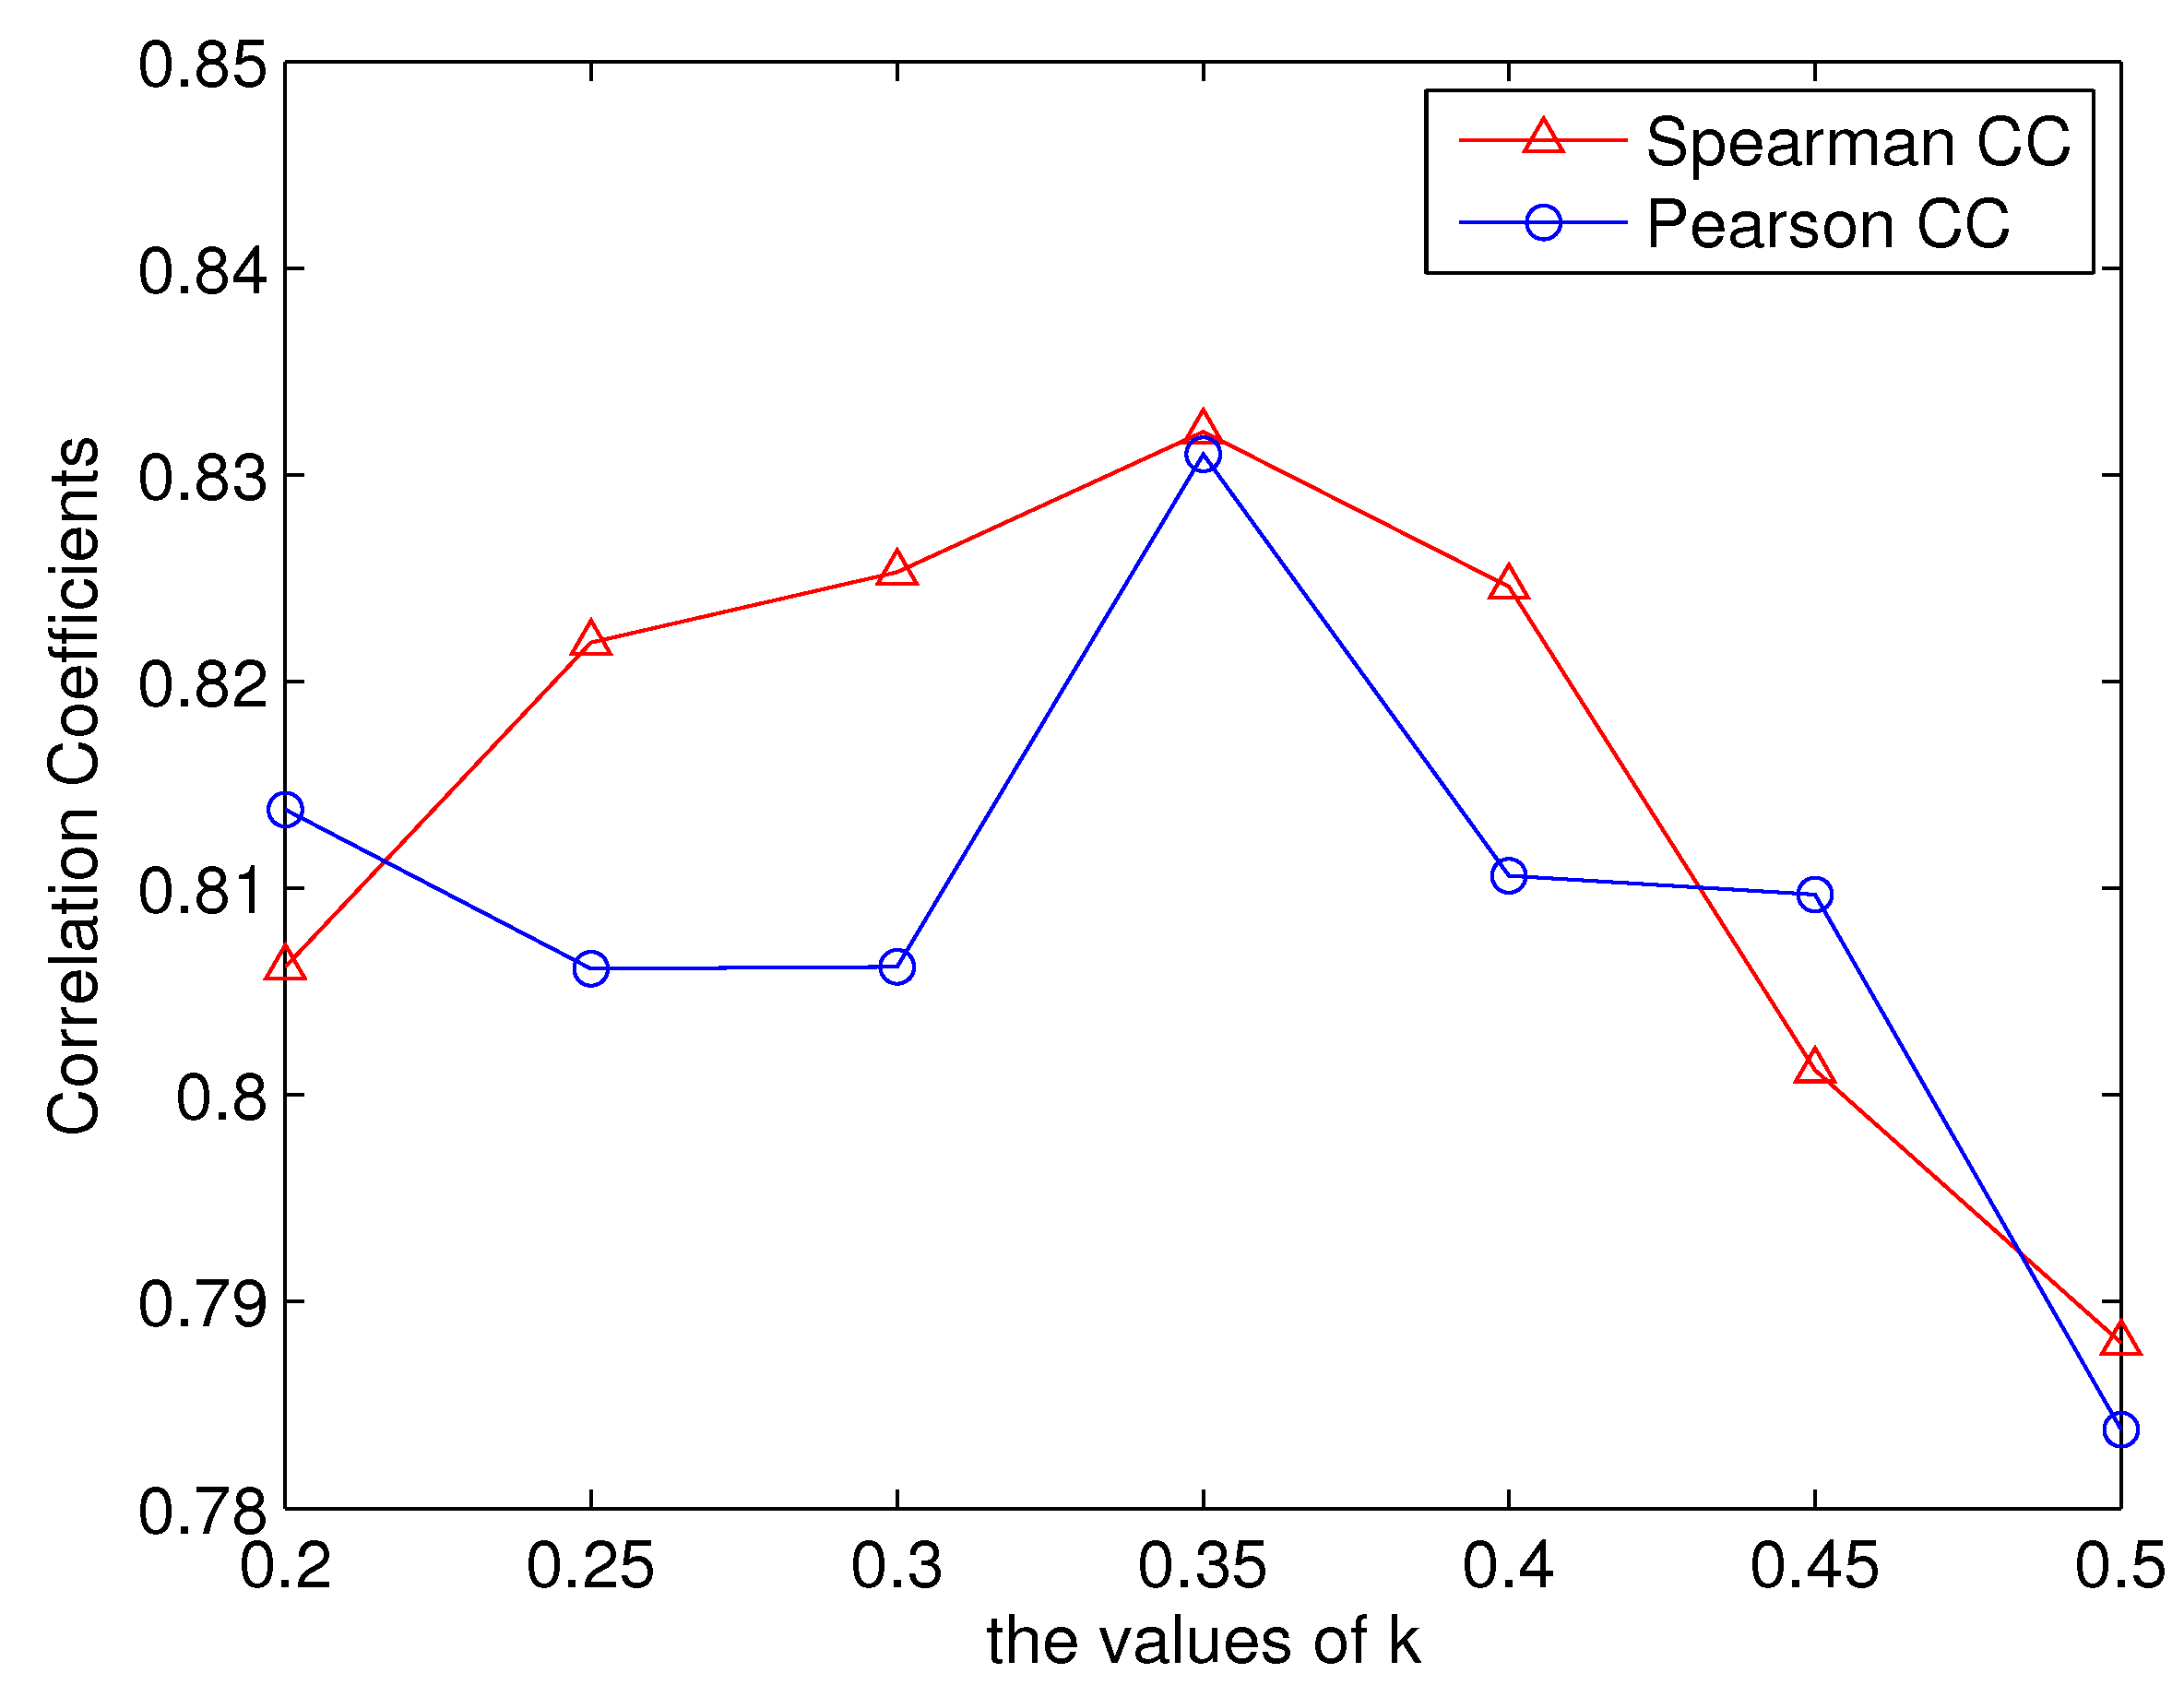
In saliency calculation, pixels with the high spatio-temporal gradient magnitudes are determined to be saliency pixels. The threshold is defined to be the average of the largest k gradient magnitudes. When k is set to 1, all the pixels are the saliency pixels (i.e., the visual attention is not included in the proposed metrics). As shown in Table 1, the metric evaluating visual attention significantly (denoted as Proposed (HVQA)) outperformed the metric without evaluating visual attention (denoted as Proposed (DP&VP)). It should be noted that the parameter k is set to through exhaustive experiments, which were performed on the LIVE database. Figure 4 shows the correlation coefficients of the proposed metrics when the parameter k is set to be different values. The values range from 0.2 to 0.5 with an interval of 0.05. It can be observed that when k is set to , both the SROCC and PCC are the largest. For k set from 0.2 to 0.4, the correlation coefficients are higher than 0.8. However, when k is larger than 0.4, the correlation coefficients become small (i.e., evaluating visual attention can improve the performance of the proposed metric). The robustness is also validated by evaluating the proposed metric on the EPFL-PoliMI database in the following paragraph.
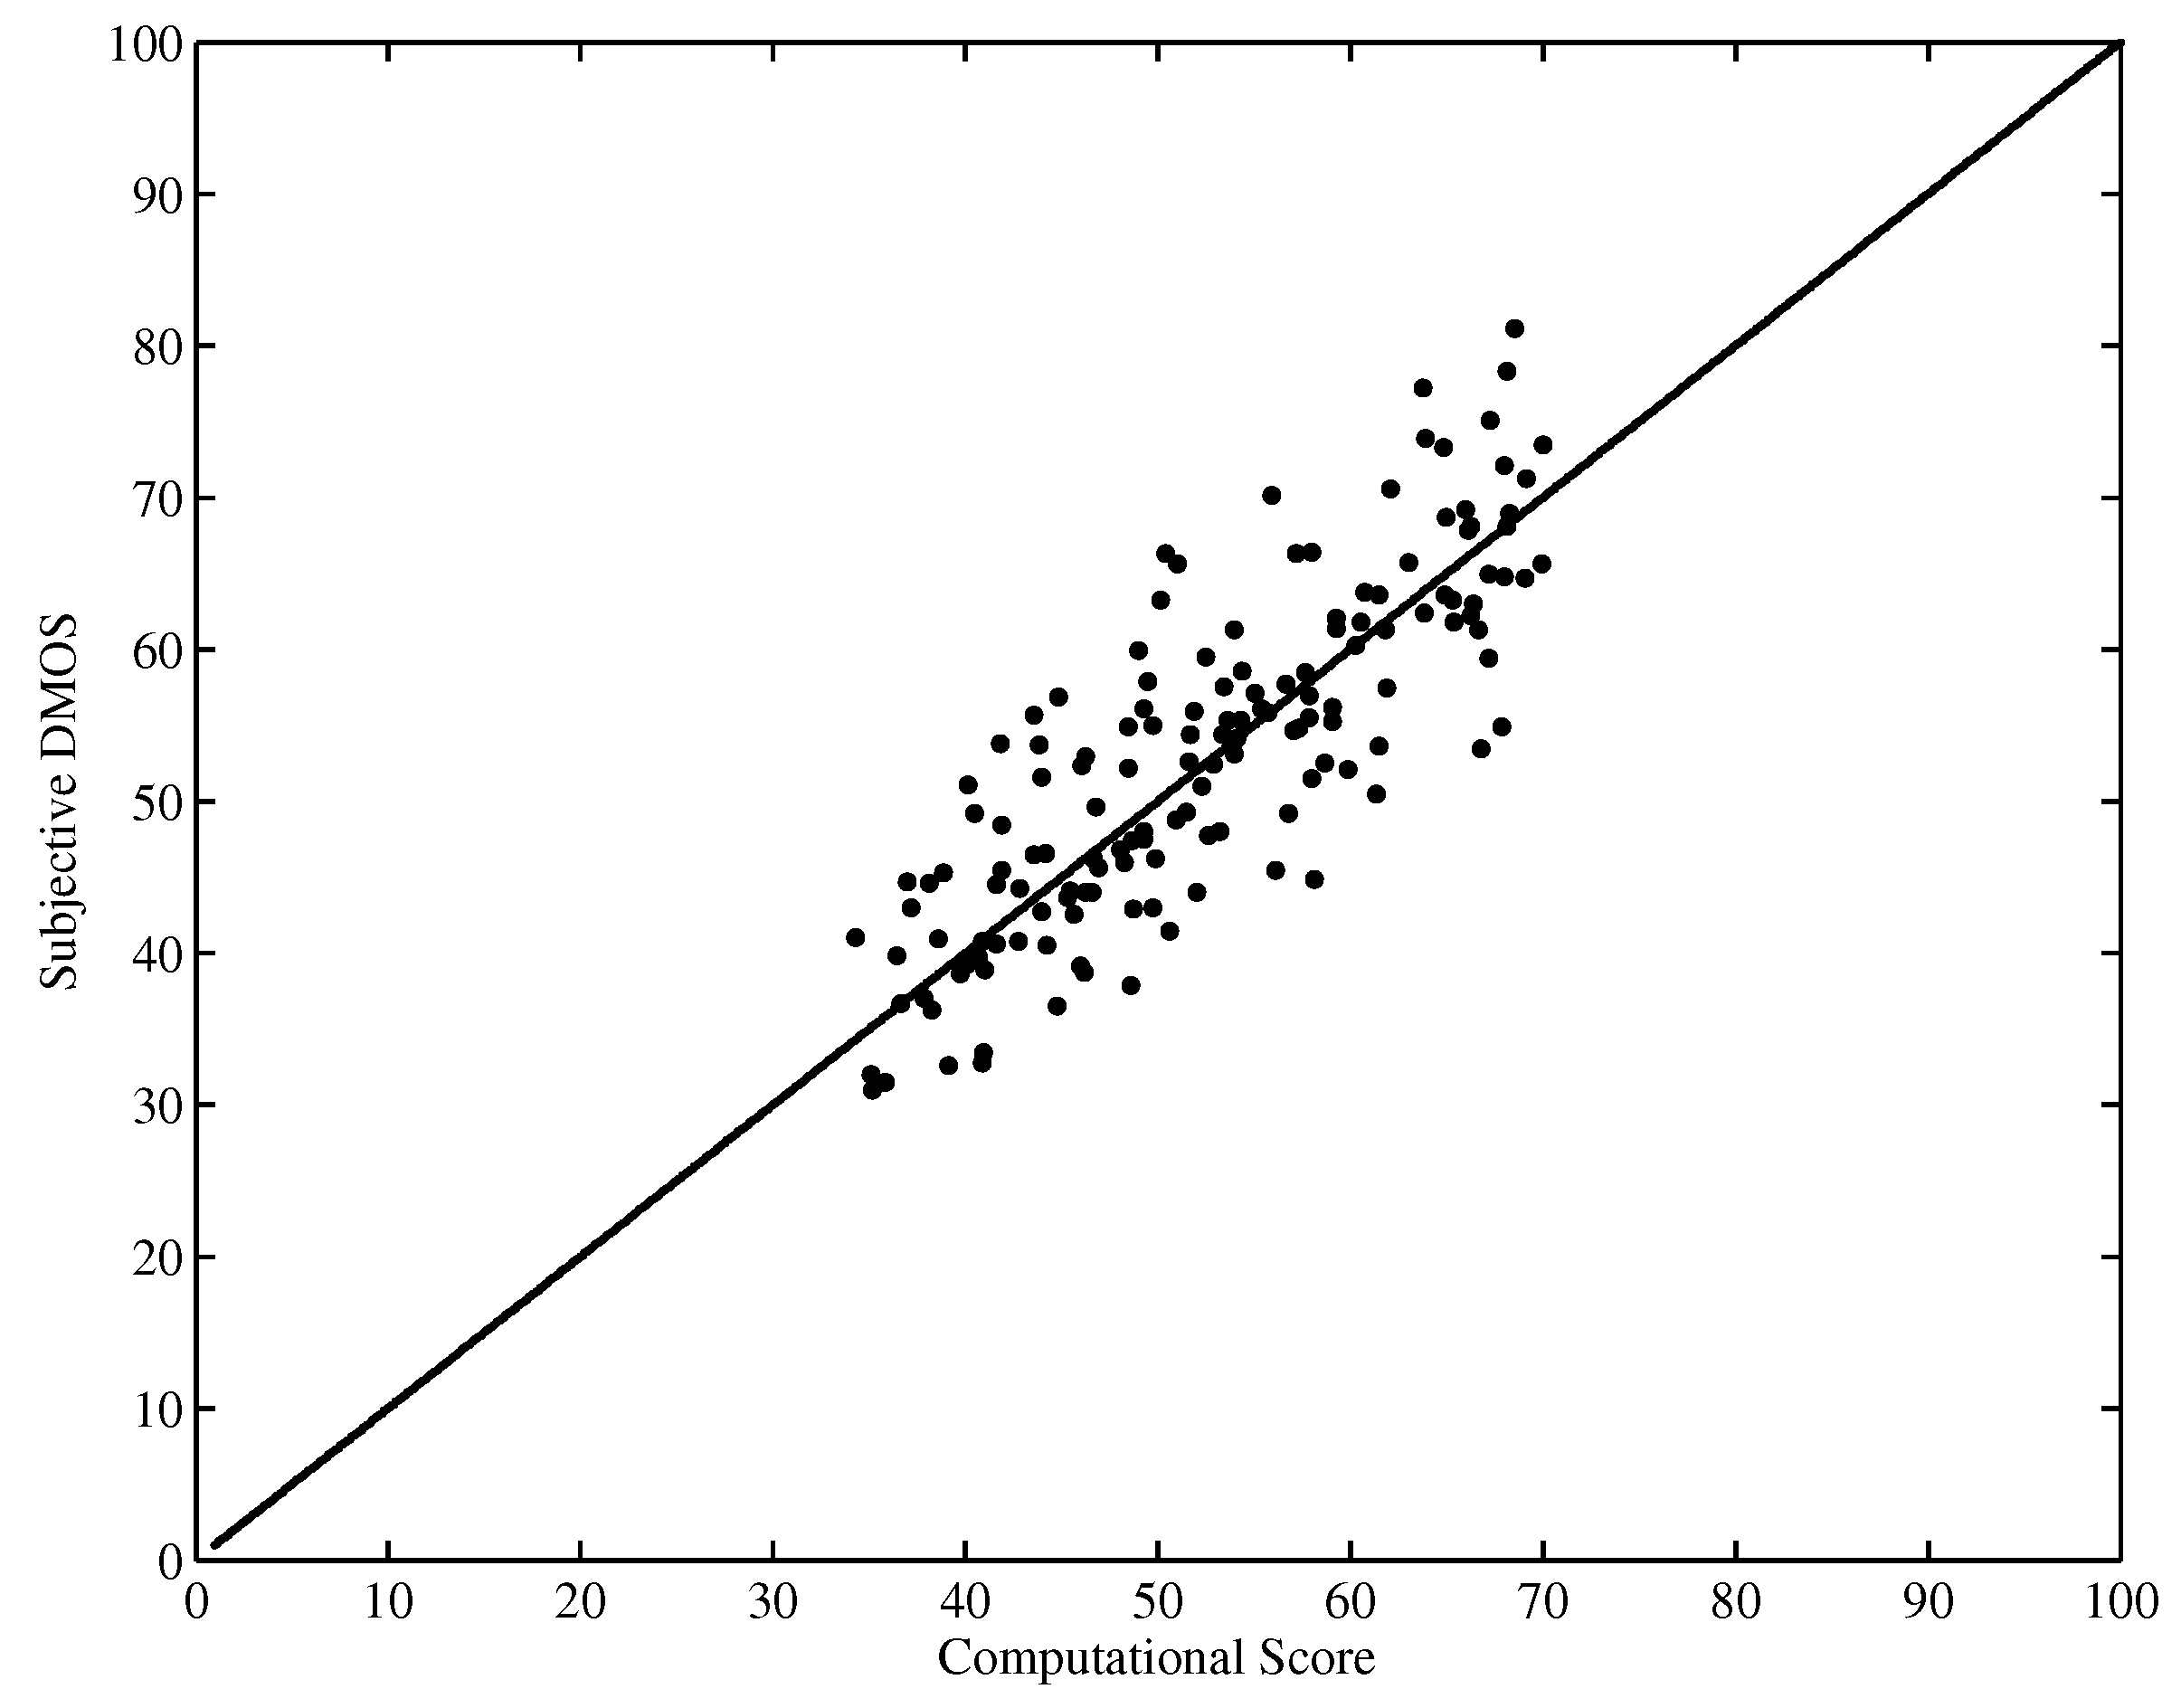
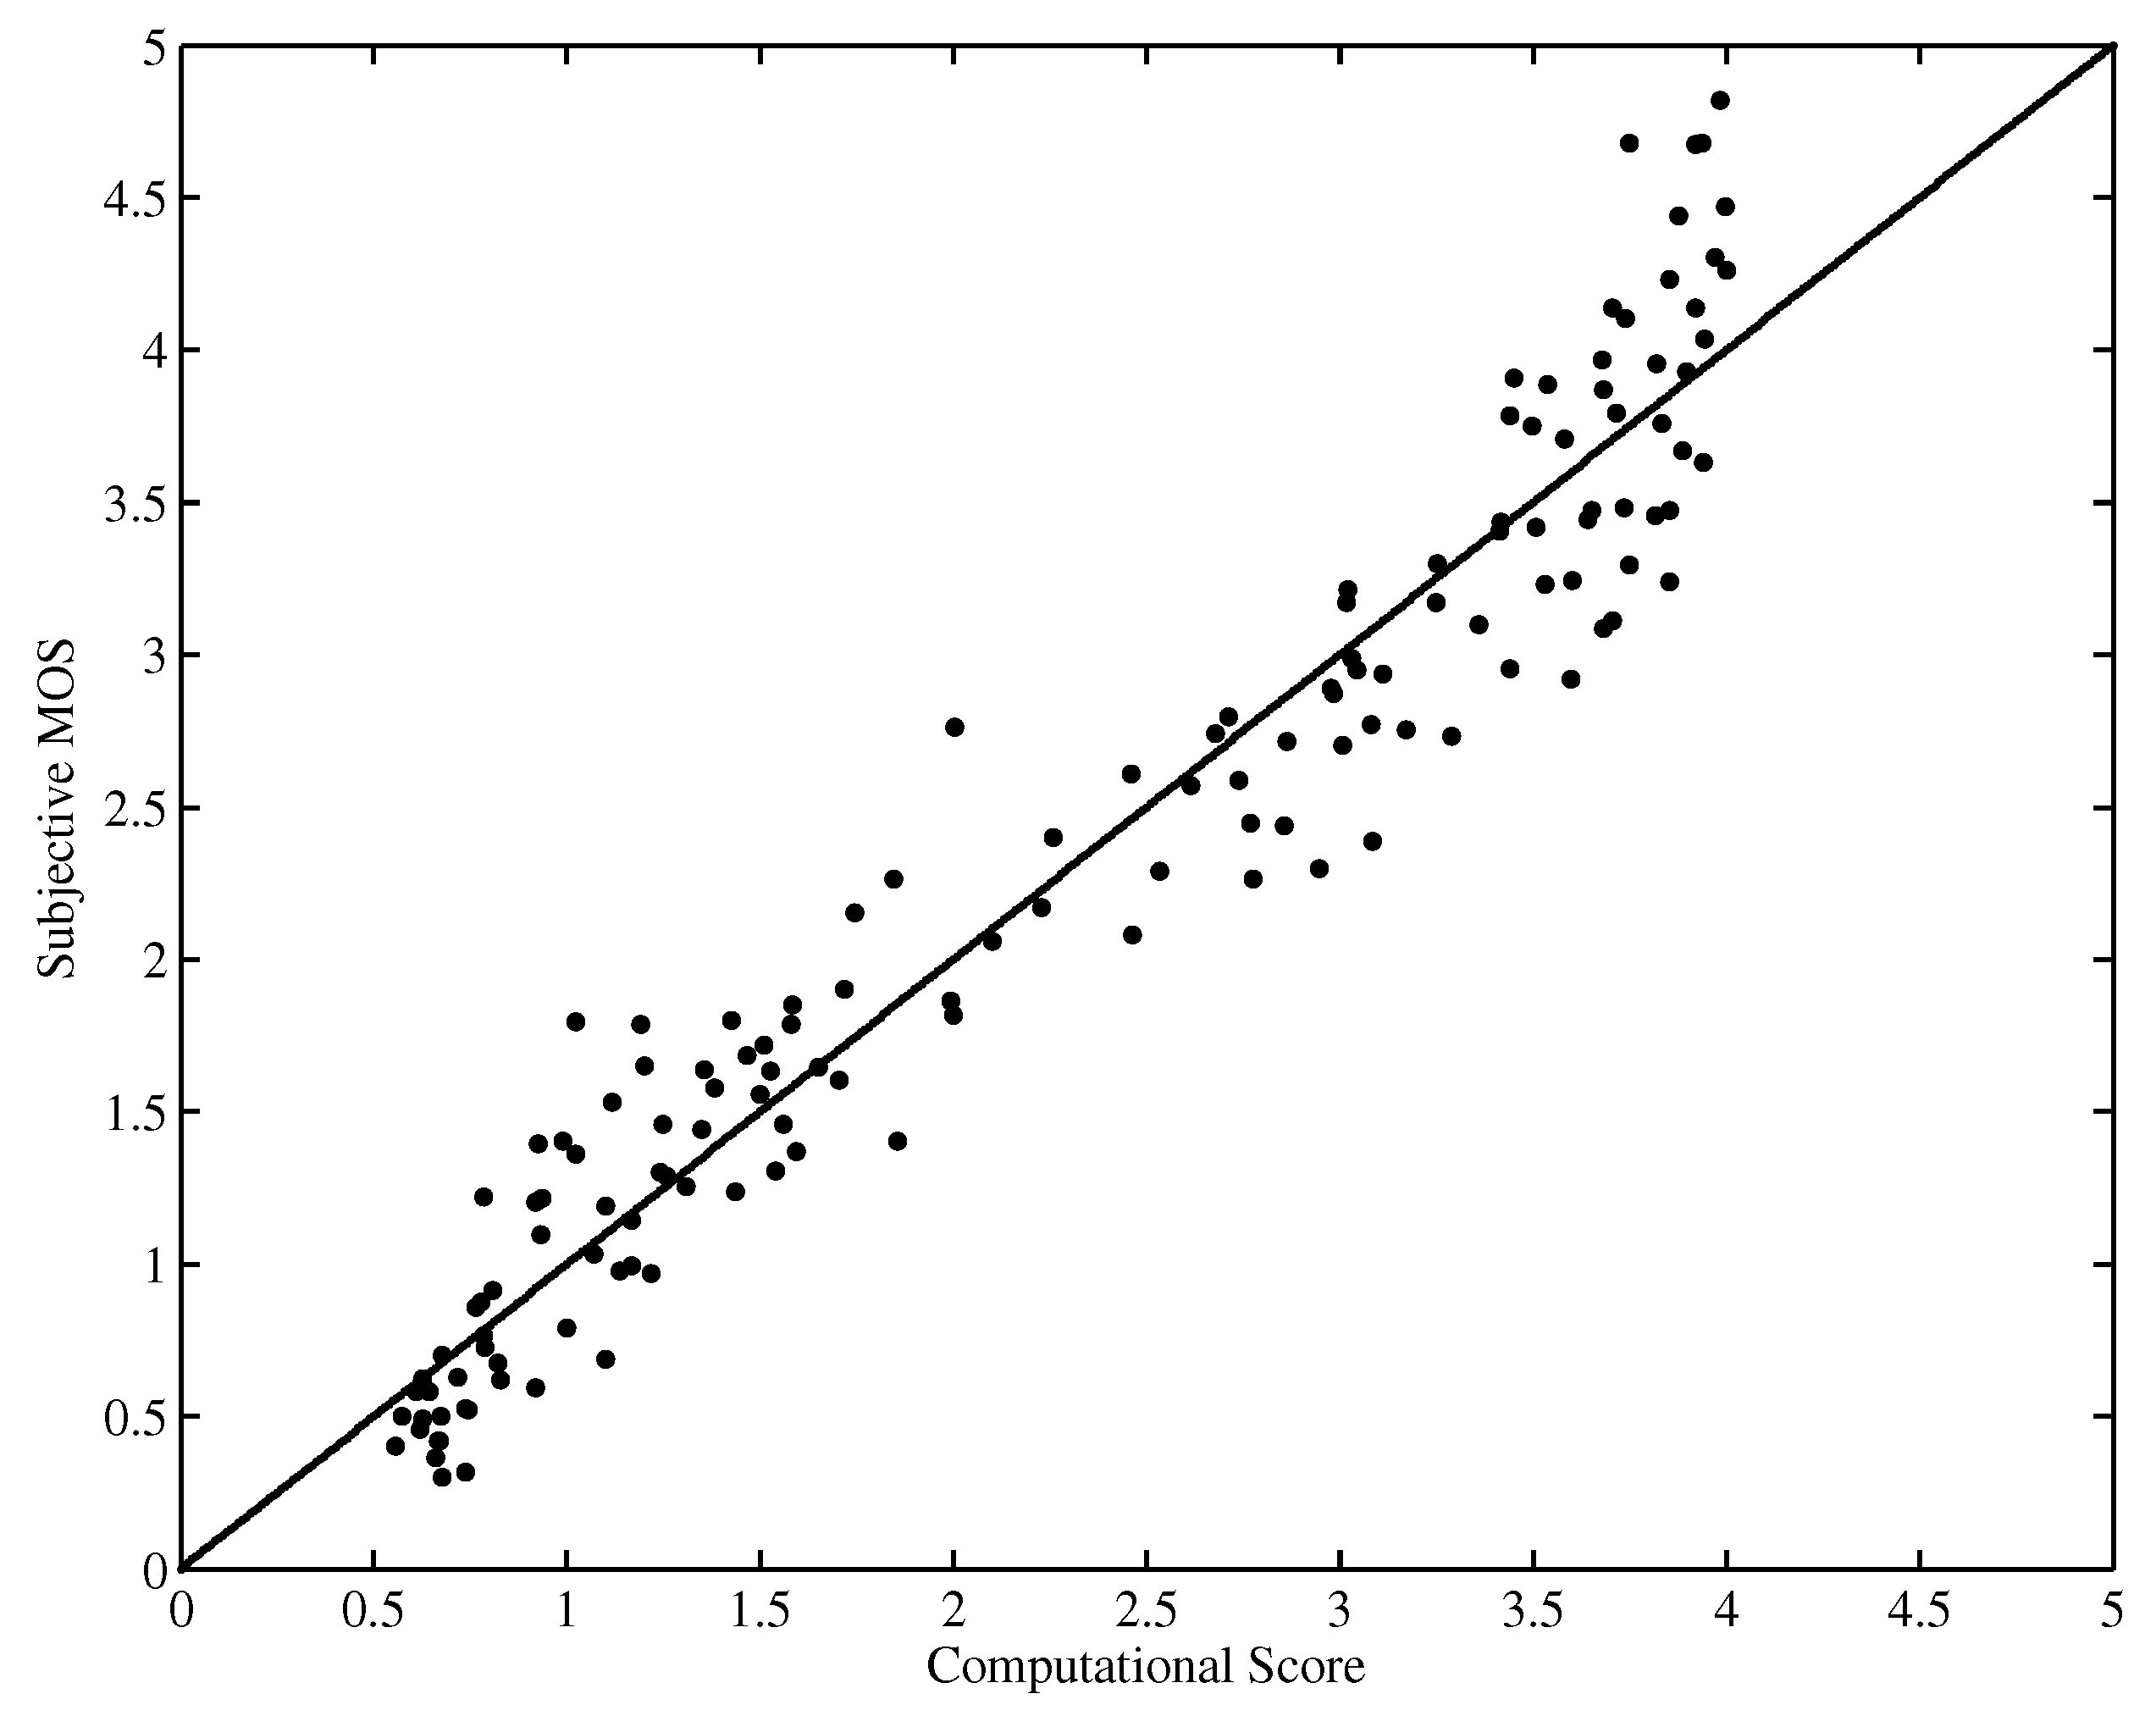
In order to further investigate the robustness of the proposed metric, it is also evaluated on the EPFL-PoliMI database. Table 3 shows the results of the proposed HVQA metrics as well as the comparison metrics (the reference values are copied from [29]). It can be observed that the PCC and SROCC of the HVQA metric are both higher than 0.965, which indicates high consistence with human perception. Furthermore, the proposed HVQA metric significantly outperforms the comparison results, including the MOVIE and MS-SSIM. Therefore, the proposed hierarchical gradient-based metric is robust and efficient.
Figure 5 and Figure 6 show the scatter plot of the DMOS (MOS) against the objective computational score performed on the LIVE database and EPFL-PoliMI database, respectively. It is observed that the proposed HVQA metric performs well on videos ranging from low quality to high quality for both databases.
4. Conclusions
In this letter, a hierarchical VQA metric has been proposed inspired by the primate visual cortex. The neuronal processing of the visual information in the sequential visual areas are modeled with the corresponding measures. Experimental results show that the proposed metric significantly outperforms the state-of-the-art VQA metrics.
Acknowledgments
This work was sponsored in part by NUPTSF (Grant No. NY215030), NUPTSF (Grant No. NY217019), and National Natural Science Foundation of China under grant 61401069.
Author Contributions
Jie Yang and Jian Xiong conceived and designed the experiments; Xianzhong Long performed the experiments; Guan Gui analyzed the data; Guan Gui, Wang Luo and Rongfang Song contributed reagents/materials/analysis tools; Jie Yang and Jian Xiong wrote the paper.
Conflicts of Interest
The authors declare no conflict of interest.
References
- Brotherton, M.D.; Huynh-Thu, Q.; Hands, D.S.; Brunnstrom, K. Subjective multimedia quality assessment. IEICE Trans. Fundam. Electron. Commun. Comput. Sci. 2006, 89, 2920–2932. [Google Scholar] [CrossRef]
- Yamada, T.; Miyamoto, Y.; Serizawa, M.; Nishitani, T. Reduced-reference video quality estimation using representative luminance. IEICE Trans. Fundam. Electron. Commun. Comput. Sci. 2006, 95, 961–986. [Google Scholar] [CrossRef]
- Xiong, J.; Li, H.; Wu, Q.; Meng, F. A fast HEVC inter CU selection method based on pyramid motion divergence. IEEE Trans. Multimedia 2014, 16, 559–564. [Google Scholar] [CrossRef]
- Xiong, J.; Li, H.; Meng, F.; Zhu, S.; Wu, Q.; Zeng, B. MRF-based fast HEVC inter CU decision with the variance of absolute differences. IEEE Trans. Multimedia 2014, 16, 2141–2153. [Google Scholar] [CrossRef]
- Xiong, J.; Li, H.; Meng, F.; Wu, Q.; Ngan, K.N. Fast HEVC inter CU decision based on latent SAD estimation. IEEE Trans. Multimedia 2015, 17, 2147–2159. [Google Scholar] [CrossRef]
- Wang, Z.; Brovik, A. Mean squared error: Love it or leave it? A new look at signal fidelity measures. IEEE Signal Process. Mag. 2009, 26, 98–117. [Google Scholar] [CrossRef]
- Wang, Z.; Bovik, A.; Sheikh, H.; Simoncelli, E. Image quality assessment: From error visibility to structural similarity. IEEE Trans. Image Process. 2004, 13, 600–612. [Google Scholar] [CrossRef] [PubMed]
- Wang, Z.; Li, Q. Video quality assessment using a statistical model of human visual speed perception. J. Opt. Soc. Am. A 2007, 24, B61–B69. [Google Scholar] [CrossRef]
- Moorthy, A.; Bovik, A. Efficient video quality assessment along temporal trajectories. IEEE Trans. Circuits Syst. Video Technol. 2010, 20, 1653–1658. [Google Scholar] [CrossRef]
- Wang, Z.; Simoncelli, E.P.; Bovik, A.C. Multiscale structural similarity for image quality assessment. In Proceedings of the Thrity-Seventh Asilomar Conference on Signals, Systems & Computers, Pacific Grove, CA, USA, 9–12 November 2003; Volume 2, pp. 1398–1402. [Google Scholar]
- Wu, J.; Lin, W.; Shi, G.; Liu, A. Perceptual quality metric with internal generative mechanism. IEEE Trans. Image Process. 2013, 22, 43–54. [Google Scholar] [PubMed]
- Zhang, X.; Feng, X.; Wang, W.; Xue, W. Edge strength similarity for image quality assessment. IEEE Signal Process. Lett. 2013, 22, 319–322. [Google Scholar] [CrossRef]
- Wang, Y.; Jiang, T.; Ma, S.; Gao, W. Novel spatio-temporal structural information based video quality metric. IEEE Trans. Circuits Syst. Video Technol. 2012, 22, 989–998. [Google Scholar] [CrossRef]
- Kruger, N.; Janssen, P.; Kalkan, S.; Lappe, M.; Leonardis, A.; Piater, J.; Rodriguez-Sanchez, A.J.; Wiskott, L. Deep hierarchies in the primate visual cortex: What can we learn for computer vision? IEEE Trans. Pattern Anal. Mach. Intell. 2013, 35, 1847–1871. [Google Scholar] [CrossRef] [PubMed]
- Felleman, D.J.; Van Essen, D.C. Distributed hierarchical processing in the primate cerebral cortex. Cereb. Cortex 2013, 1, 1–47. [Google Scholar] [CrossRef]
- Kandel, E.R.; Schwartz, J.H.; Jessell, T.M. (Eds.) Principles of Neural Science, 4th ed.; McGraw-Hill, Health Professions Division: New York, NY, USA, 2000. [Google Scholar]
- Dabov, K.; Foi, A.; Egiazarian, K. Video denoising by sparse 3D transform-domain collaborative filtering. In Proceedings of the 15th European Signal Processing Conference (EUSIPCO 2007), Poznan, Poland, 3–7 September 2007. [Google Scholar]
- Huynh-Thu, Q.; Ghanbari, M. Scope of validity of psnr in image/video quality assessment. Electron. Lett. 2008, 44, 800–801. [Google Scholar] [CrossRef]
- Li, H.; Ngan, K.N. Saliency model based face segmentation in head-and-shoulder video sequences. J. Vis. Commun. Image Represent. 2008, 19, 320–333. [Google Scholar] [CrossRef]
- Li, H.; Ngan, K.N. A co-saliency model of image pairs. IEEE Trans. Image Process. 2011, 20, 3365–3375. [Google Scholar] [CrossRef] [PubMed]
- Seshadrinathan, K.; Soundararajan, R.; Bovik, A.; Cormack, L. Study of subjective and objective quality assessment of video. IEEE Trans. Image Process. 2010, 19, 1427–1441. [Google Scholar] [CrossRef] [PubMed]
- De Simone, F.; Naccari, M.; Tagliasacchi, M.; Dufaux, F.; Tubaro, S.; Ebrahimi, T. Subjective assessment of H.264/AVC video sequence transmitted over a noisy channel. In Proceedings of the First International Workshop on Quality of Multimedia Experience (QoMEX 2009), San Diego, CA, USA, 29–31 July 2009. [Google Scholar]
- De Simone, F.; Tagliasacchi, M.; Naccari, M.; Tubaro, S.; Ebrahimi, T. H.264/AVC video database of the evaluation of quality metrics. In Proceedings of the 35th International Conference on Acoustics, Speech, and Signal Processing (ICASSP 2010), Dallas, TX, USA, 14–19 March 2010. [Google Scholar]
- Pinson, M.; Wolf, S. A new standardized method for objectively measuring video quality. IEEE Trans. Broadcast. 2004, 50, 312–322. [Google Scholar] [CrossRef]
- Seshadrinathan, K.; Bovik, A. Motion tuned spatio-temporal quality assessment of natural videos. IEEE Trans. Image Process. 2004, 19, 335–350. [Google Scholar] [CrossRef] [PubMed]
- Vu, P.V.; Vu, C.T.; Chandler, D.M. A spatiotemporal most-apparent-distortion model for video quality assessment. In Proceedings of the 2011 18th IEEE International Conference on Image Processing, Brussels, Belgium, 11–14 September 2011; pp. 2505–2508. [Google Scholar]
- Amirshahi, S.A.; Larabi, M.C. Spatial-temporal Video Quality Metric based on an estimation of QoE. In Proceedings of the 2011 Third International Workshop on Quality of Multimedia Experience, Mechelen, Belgium, 7–9 September 2011; pp. 84–89. [Google Scholar]
- Torkamani-Azar, F.; Imani, H.; Fathollahian, H. Video quality measurement based on 3-D. Singular value decomposition. J. Vis. Commun. Image Represent. 2015, 27, 1–6. [Google Scholar] [CrossRef]
- Zerman, E.; Konuk, B.; Nur, G.; Akar, G.B. A parametric video quality model based on source and network characteristics. In Proceedings of the 2014 IEEE International Conference on Image Processing (ICIP), Paris, France, 27–30 October 2014; pp. 595–599. [Google Scholar]
Figure 1.
Simplified hierarchical structure of the primate visual cortex and approximate area locations [14]. MT denotes the middle temporal area, and LGN denotes the lateral geniculate nucleus.
Figure 1.
Simplified hierarchical structure of the primate visual cortex and approximate area locations [14]. MT denotes the middle temporal area, and LGN denotes the lateral geniculate nucleus.
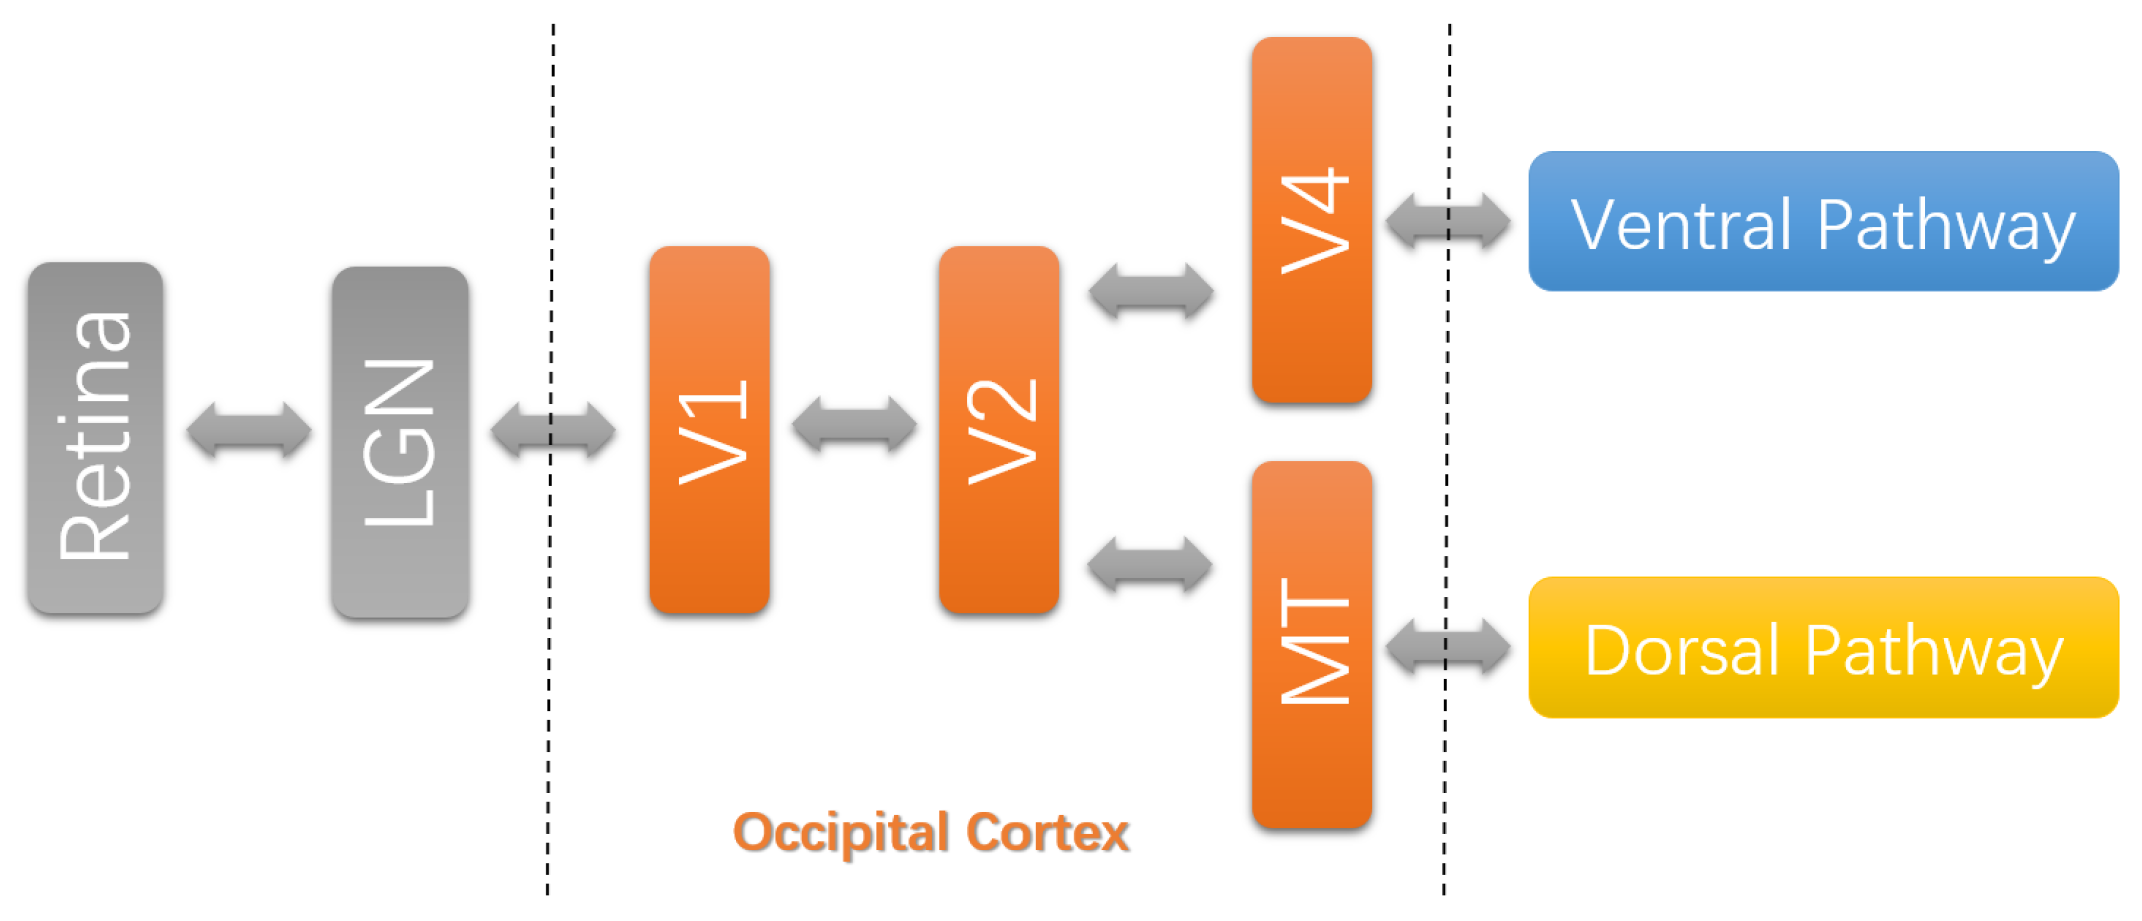
Figure 2.
Flowchart of the proposed hierarchical video assessment model. BL: block level gradient similarity; FL: frame level gradient similarity; MSE: mean square error. PL: pixel level gradient similarity.
Figure 2.
Flowchart of the proposed hierarchical video assessment model. BL: block level gradient similarity; FL: frame level gradient similarity; MSE: mean square error. PL: pixel level gradient similarity.

Figure 3.
Pearson correlation coefficient (PCC) scores of VQA metrics on each kind of distortion in live database.
Figure 3.
Pearson correlation coefficient (PCC) scores of VQA metrics on each kind of distortion in live database.
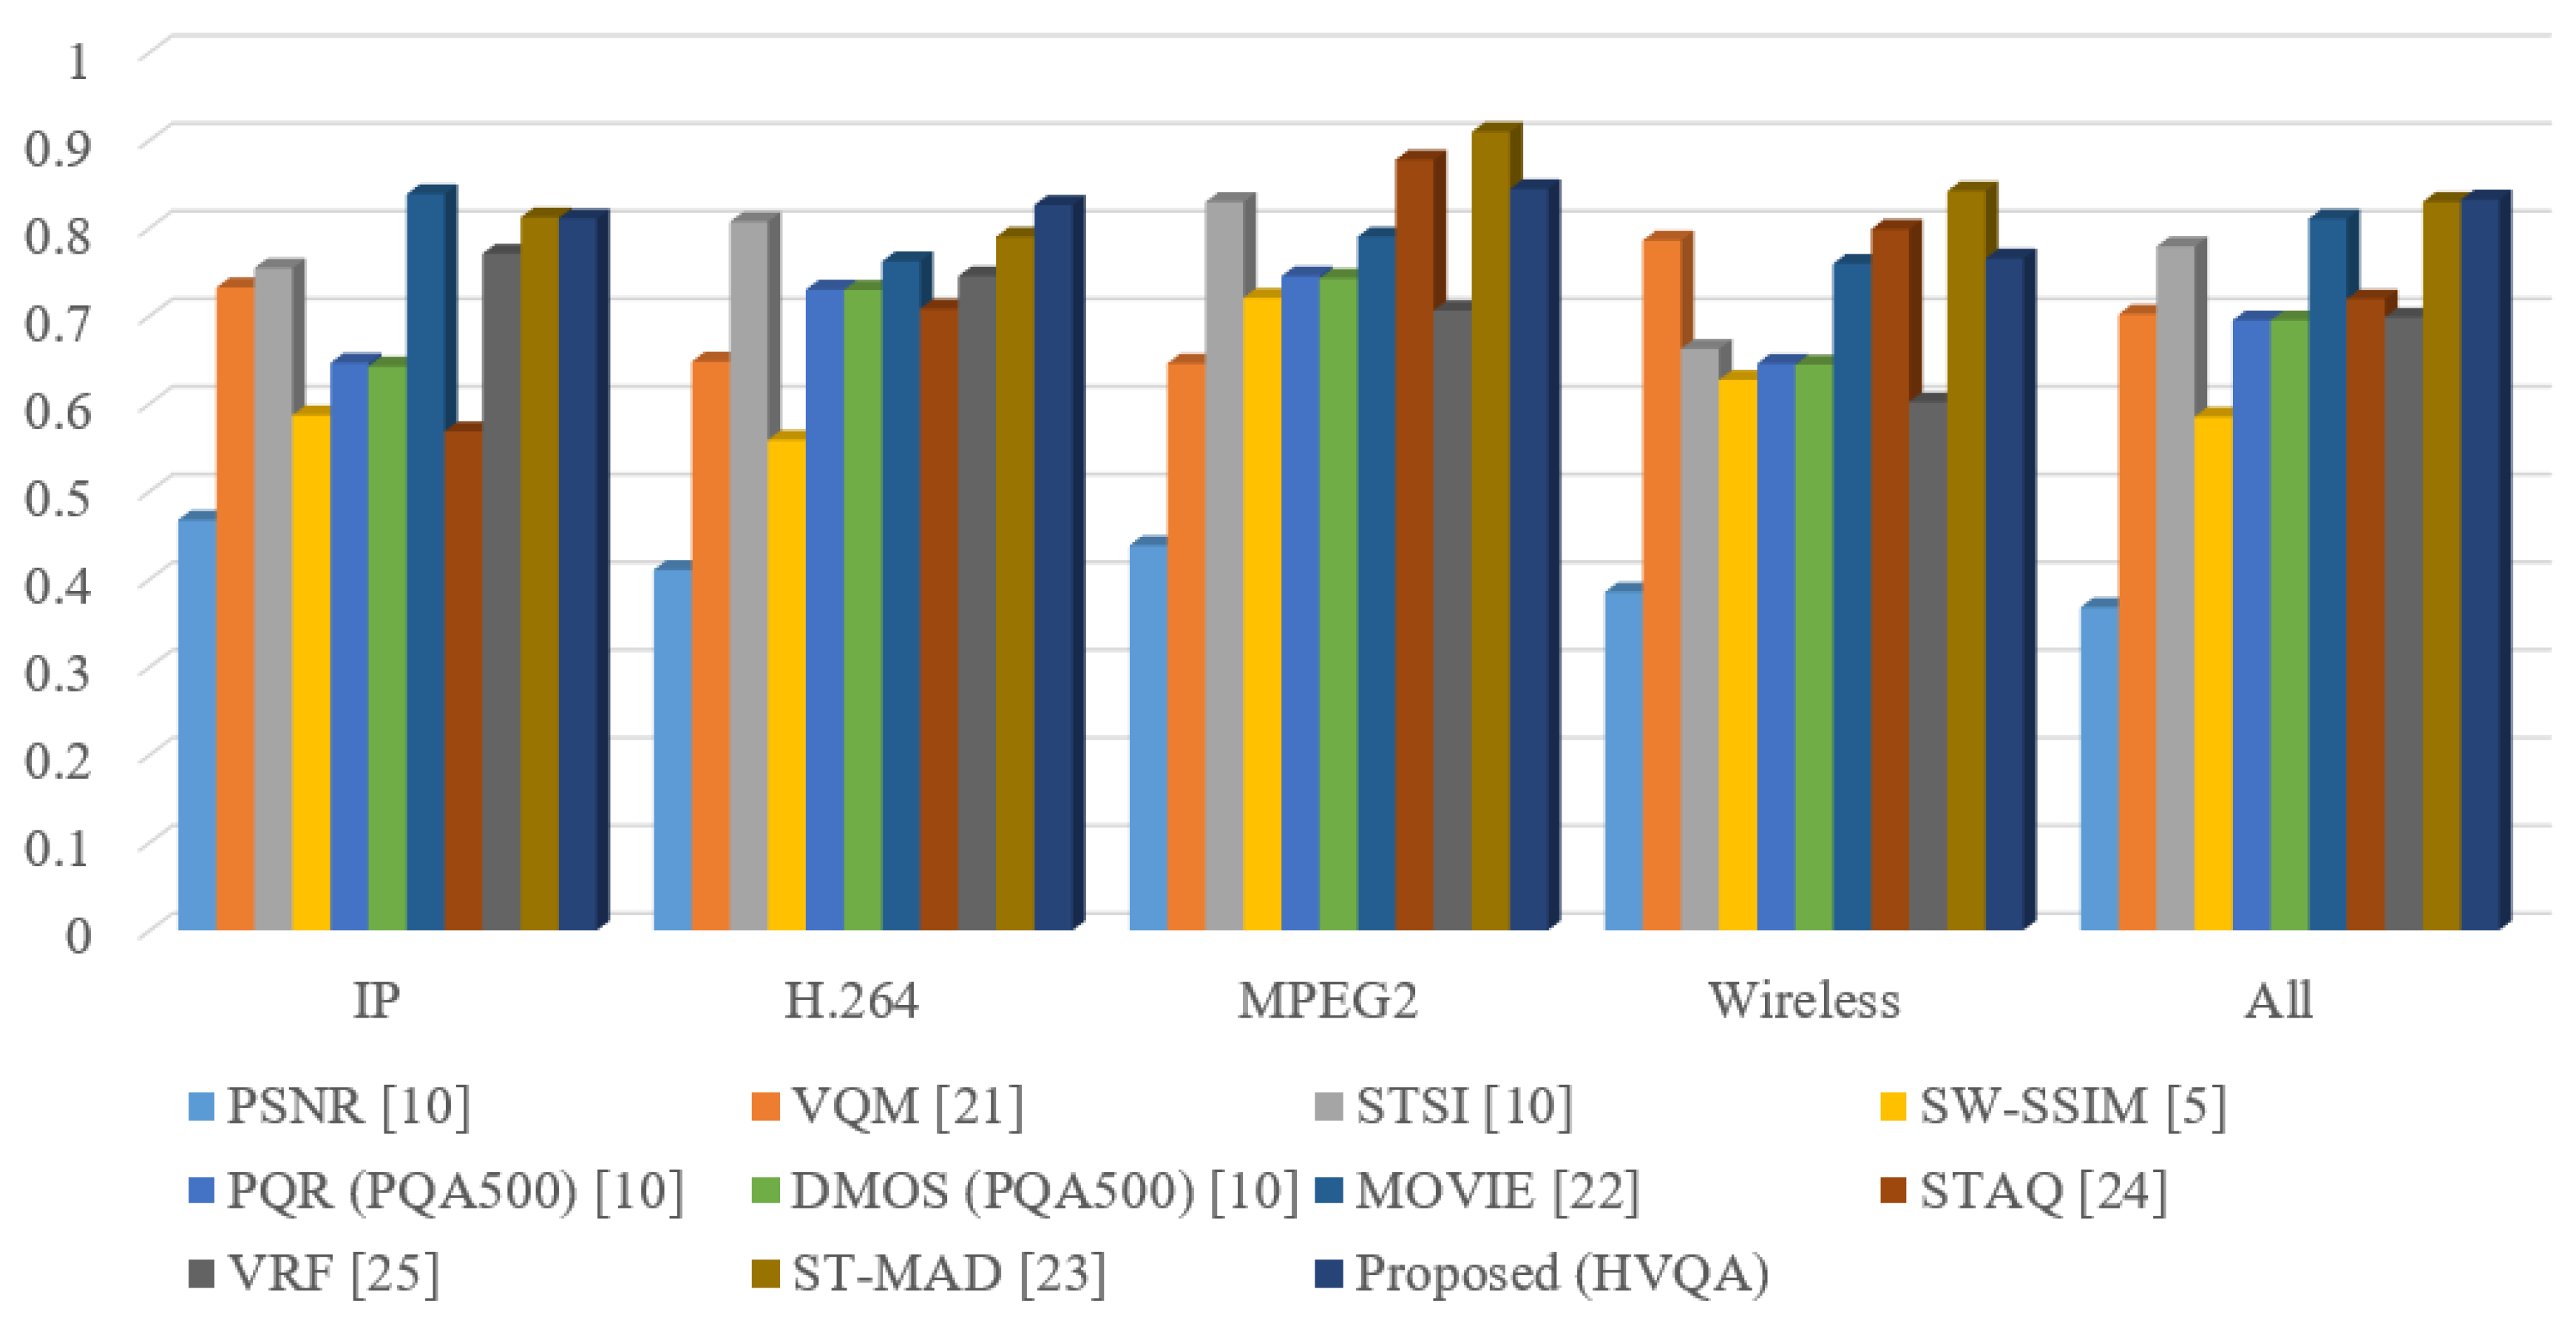
Figure 4.
The correlation coefficients with different k values (LIVE database).

Figure 5.
Scatter plot of DMOSs against scores predicted by HVQA (LIVE database).

Figure 6.
Scatter plot of MOSs against scores predicted by HVQA (EPFL-PoliMI database).


Table 1.
Performance comparison on the LIVE database.
| Methods | Pearson CC | Spearman CC |
|---|---|---|
| VQM [24] | 0.702 | 0.723 |
| MOVIE [25] | 0.786 | 0.810 |
| ST-MAD [26] | 0.830 | 0.824 |
| STAQ [27] | 0.719 | 0.5665 |
| STSI [13] | 0.779 | 0.778 |
| SW-SSIM [8] | 0.585 | 0.596 |
| MC-SSIM [9] | 0.679 | 0.698 |
| PSNR [13] | 0.368 | 0.404 |
| PQR (by PQA500) [13] | 0.695 | 0.712 |
| DMOS (by PQA500) [13] | 0.695 | 0.711 |
| Proposed (DP) | 0.775 | 0.769 |
| Proposed (VP) | 0.736 | 0.740 |
| Proposed (VA) | 0.759 | 0.761 |
| Proposed (DP&VP) | 0.810 | 0.807 |
| Proposed (VP&VA) | 0.804 | 0.811 |
| Proposed (DP&VA) | 0.817 | 0.816 |
| Proposed (HVQA) | 0.832 | 0.833 |
Table 2.
Pearson correlation coefficient (PCC) scores of video quality assessment (VQA) metrics on each kind of distortion in live database.
Table 2.
Pearson correlation coefficient (PCC) scores of video quality assessment (VQA) metrics on each kind of distortion in live database.
| Methods | Wireless | IP | H.264 | MPEG2 | All Data |
|---|---|---|---|---|---|
| PSNR [13] | 0.4675 | 0.4108 | 0.4385 | 0.3856 | 0.368 |
| VQM [24] | 0.7325 | 0.6480 | 0.6459 | 0.7860 | 0.702 |
| STSI [13] | 0.7544 | 0.8072 | 0.8298 | 0.6624 | 0.779 |
| SW-SSIM [8] | 0.5867 | 0.5587 | 0.7206 | 0.6270 | 0.585 |
| PQR (PQA500) [13] | 0.6464 | 0.7300 | 0.7455 | 0.6456 | 0.695 |
| DMOS (PQA500) [13] | 0.6426 | 0.7295 | 0.7427 | 0.6445 | 0.695 |
| MOVIE [25] | 0.8386 | 0.7622 | 0.7902 | 0.7595 | 0.8106 |
| STAQ [27] | 0.5684 | 0.7080 | 0.8778 | 0.7988 | 0.7192 |
| VRF [28] | 0.7708 | 0.7453 | 0.7062 | 0.6019 | 0.6983 |
| ST-MAD [26] | 0.8123 | 0.7900 | 0.9097 | 0.8422 | 0.8299 |
| Proposed (HVQA) | 0.8109 | 0.8264 | 0.8445 | 0.7654 | 0.8324 |
© 2017 by the authors. Licensee MDPI, Basel, Switzerland. This article is an open access article distributed under the terms and conditions of the Creative Commons Attribution (CC BY) license (http://creativecommons.org/licenses/by/4.0/).
Share and Cite
MDPI and ACS Style
Yang, J.; Xiong, J.; Gui, G.; Song, R.; Luo, W.; Long, X. Hierarchical Gradient Similarity Based Video Quality Assessment Metric. Algorithms 2017, 10, 72. https://doi.org/10.3390/a10030072
AMA Style
Yang J, Xiong J, Gui G, Song R, Luo W, Long X. Hierarchical Gradient Similarity Based Video Quality Assessment Metric. Algorithms. 2017; 10(3):72. https://doi.org/10.3390/a10030072
Chicago/Turabian StyleYang, Jie, Jian Xiong, Guan Gui, Rongfang Song, Wang Luo, and Xianzhong Long. 2017. "Hierarchical Gradient Similarity Based Video Quality Assessment Metric" Algorithms 10, no. 3: 72. https://doi.org/10.3390/a10030072
Note that from the first issue of 2016, this journal uses article numbers instead of page numbers. See further details here.