Solving Multi-Document Summarization as an Orienteering Problem


Department of Computer Science, College of Computer and Information Sciences, King Saud University, Riyadh 11543, Saudi Arabia
*
Author to whom correspondence should be addressed.
Algorithms 2018, 11(7), 96; https://doi.org/10.3390/a11070096
Submission received: 4 June 2018
/
Revised: 25 June 2018
/
Accepted: 28 June 2018
/
Published: 30 June 2018
Abstract
:With advances in information technology, people face the problem of dealing with tremendous amounts of information and need ways to save time and effort by summarizing the most important and relevant information. Thus, automatic text summarization has become necessary to reduce the information overload. This article proposes a novel extractive graph-based approach to solve the multi-document summarization (MDS) problem. To optimize the coverage of information in the output summary, the problem is formulated as an orienteering problem and heuristically solved by an ant colony system algorithm. The performance of the implemented system (MDS-OP) was evaluated on DUC 2004 (Task 2) and MultiLing 2015 (MMS task) benchmark corpora using several ROUGE metrics, as well as other methods. Its comparison with the performances of 26 systems shows that MDS-OP achieved the best F-measure scores on both tasks in terms of ROUGE-1 and ROUGE-L (DUC 2004), ROUGE-SU4, and three other evaluation methods (MultiLing 2015). Overall, MDS-OP ranked among the best 3 systems.
1. Introduction
Despite the availability of information today, users need tools that enable them to reach their desired content by automatically summarizing the important and relevant parts and discarding those that are similar. Text summarization, specifically multi-document text summarization (MDS), which creates a summary from a set of related documents, is a useful solution to the exponential growth of information on the Internet [1]. In more than half a century, several approaches have been used to automatically generate summaries, such as statistical and graph-based approaches. In addition, some summarization studies have followed a global selection approach of summary sentences whereby they are selected in a way that optimizes the overall score of the resulting summary. Studies in both global selection and graph-based approaches have achieved promising results (for more details, see Section 2.4 and Section 2.6.)
Motivated by the promising results of those studies, this paper proposes a novel graph-based MDS approach to produce extractive generic summaries that optimize information coverage objective. The summarization problem is reduced to an orienteering problem (OP), a variant of the traveling salesman problem (TSP) [2]. Different problems were modeled as an OP and many heuristics were proposed to approximate their solution [3,4]. Reducing the MDS problem into OP enables obtaining the benefits from all these studies. The proposed approach is based on a swarm intelligence (SI) meta-heuristic—more specifically, an ant colony system (ACS) [5]—to find an approximate solution to MDS. ACS is a variant of ant colony optimization (ACO) algorithms which are considered among the best SI algorithms applied to TSP [5]. ACS was applied for single text summarization and short document summarization; however, to the best of our knowledge, it has not been studied for MDS.
An MDS system, called MDS-OP, was implemented around the proposed solution. It was evaluated and tested on two benchmark corpora of DUC 2004 (Task 2) and multilingual multi-document summarization (MMS) task at MultiLing 2015, referred to as MultiLing 2015 (MMS task). Several performance evaluation metrics were used including ROUGE metrics [6], and AutoSummENG [7], MeMoG [8], and NPowER [9] methods. When compared to 26 rival systems, MDS-OP achieved the best F-measure scores on both corpora in terms of ROUGE-1, ROUGE-L (DUC 2004), and ROUGE-SU4 (MuliLing 2015).
The remainder of this paper is arranged as follows. Section 2 briefly presents some related studies. Section 3 and Section 4 describe OP and ACS, respectively. Section 5 describes the main steps of the proposed solution. Section 6 presents the experimental results. Finally, Section 7 concludes this study and outlines some future research directions.
2. Related Work
For more than half a century, several approaches have been used to automatically generate summaries. Different ways of classifying these approaches have been presented in the literature. Based on linguistic space levels, Mani [10] divided the summarization approaches into shallow approaches, deeper approaches, and hybrid approaches. The shallow approaches commonly generate extractive summaries, and their representation level is, at most, at the syntactic level. The deeper approaches produce abstractive summaries, and their representation level is, at least, at the semantic level. The hybrid approaches combine the two aforementioned approaches. In addition, based on the dominant techniques used in the summarization process, Lloret and Palomar [11] differentiated among five kinds of approaches: statistical-based, topic-based, graph-based, discourse-based, and machine learning-based systems. This section presents seven approaches for text summarization, including those based on SI meta-heuristics.
2.1. Statistical Approaches
This approach has been followed since the first development of the field [12,13]. An example of a statistical feature that has been used frequently in the summarization studies is word frequency. Litkowski [14] proposed a frequency-based method for sentence ranking , whereby the summary is generated by extracting the top ranked ones while checking and eliminating complete duplicates. Lacatusu et al. [15] proposed a summarization system which exploits the highest ranked terms, called topic signature terms. Each term is given a weight based on its relative frequency in a relevant cluster of documents. In more detail, the system scores sentences based on these terms. Then, to deal with the redundancies, it chooses a sentence to be part of the summary if the number of overlapped topic signature terms between this sentence and the already selected ones is below a predefined threshold. Another statistical feature used in summarization is term frequency times inverse document frequency (TF-IDF), which is an information-retrieval word importance measure that is also used to calculate sentence scores. Nobata and Sekine [16] used this feature along with other features to give a score to each sentence. Nevertheless, to improve the performance, the position feature is only used with document clusters in which the key sentences occur at the beginning of each document. Finally, the redundancy problem is handled by computing the similarity between sentences.
Conroy et al. [17] examined the effects of four different term weighting approaches, including term frequency and nonnegative matrix factorization, as well as different sentence segmentation and tokenization methods on the performance of multi-lingual single document and multi document summarizers. In the sentence extraction phase, they used OCCAMS [18] algorithm. Balikas and Amini [19] proposed an MDS approach in which enhanced text representations are produced by a neural network and used to extract summary sentences based on the cosine similarity measure. Each sentence is compared to the most frequent terms and to the title of the document to which it belongs. A text mining algorithm was also used. Hirao et al. [20] scored sentences based on a sequential pattern (n-grams and gappy n-grams), which is extracted using a text mining algorithm [20]. Wan et al. [21] examined the hierarchical Latent Dirichlet Allocation (hLDA) model for text summarization. A hierarchical topic tree is built for each set of documents. Each node represents a latent topic and each sentence is assigned to a path which starts at the root and ends at a leaf. Summary sentences are extracted in a way that maximizes the coverage of the important sub topics and ensures that the redundancy rate among these sentences is less than 0.5.
2.2. Machine Learning Approaches
Machine learning algorithms have been used in text summarization systems for different purposes, such as to select summary sentences or to assign weights to text terms. The CLASSY model [22] uses a hidden Markov model (HMM) along with the pivoted QR algorithm [23] to score and select summary sentences. The classifier was trained using the DUC 2003 corpus. In addition, CLASSY uses only one feature; the number of signature tokens, which are the tokens that are more likely to be found in the document to be summarized than in the corpus. Genetic algorithms (GAs) have been used in summarization. Litvak et al. [24] proposed a multilingual text summarization tool, called MUSEEC. This tool is an extension of the MUSE [25] summarization algorithm that gives a score for each sentence calculated based on a weighted linear combination of different language independent statistical features. MUSE follows a supervised learning approach that uses GA to find the best weights of these features. MUSEEC expands MUSE by adding a list of features based on Part-of-Speech tagging. Finally, deep learning has been recently introduced to text summarization. Zhong et al. [26] and Yousefi-Azar and Hamey [27] used different deep learning models with query-oriented single document and multi-document summarization, respectively.
2.3. Clustering Approaches
Clustering has been used in text summarization to identify the topics in a set of documents. Blair-Goldensohn et al. [28] proposed a system that divides the sentences into clusters and identifies one representative sentence for each cluster. Then, the proposed system ranks these representative sentences based on the size of the cluster they belong to. Finally, it creates a summary by selecting the top-ranked representative sentences. Aries et al. [29] proposed a method that uses a fuzzy clustering algorithm to cluster the input text into topics. The summary sentences are scored based on their coverage of these topics.
The centroid of the document cluster has been included in the solution of many text summarizers, such as in the summarization approach proposed by Saggion and Gaizauskas [30]. It ranks the sentences based on three features: the similarity to the cluster centroid, the similarity to the lead part of the document, and the sentence position. In addition to identifying text topics, Angheluta et al. [31] used a clustering to eliminate the redundancy in the summary sentences. In addition, the important sentences were chosen based on the number of keywords they contained, and keywords were detected using the authors’ topic segmentation module.
2.4. Graph-Based Approaches
Representing texts as graphs has become a widely used approach in the application of text processing [32]. In the field of text summarization, many studies have followed the graph-based approach and used different graph representations. For example, graph nodes can represent different types of textual units, such as sentences [33] or words [34]. Moreover, the edges between the nodes can be represented using different types of relationships, such as using the cosine similarity measure [33]. Furthermore, different kinds of graphs have been used, such as the bipartite graph between documents terms and sentences [35]. Several graph-based algorithms, such as random walk [36] and spreading activation [34], have been used to give a score for each node.
Vanderwende et al. [37] proposed a system that creates a semantic graph by connecting the nodes of the logical forms of text sentences with bidirectional edges that represent the semantic relationships and produces the summary by extracting and merging part of the logical forms. Wan et al. [38] proposed an iterative reinforcement solution that combines ideas similar to PageRank [39] and the HITS [40] graph-ranking algorithms. Erkan and Radev [33] proposed a new sentence centrality measure, LexPageRank, based on the concept of prestige or centrality in the social network field. This measure is similar to the PageRank [39] method, except that the edges in the sentence similarity graph are undirected edges that are added based on a predefined threshold.
Remus and Bordag [41] proposed an algorithm that starts by a clustering step where the input documents are ordered chronologically based on time references extracted from the text and then grouped based on their position on the time line. Then, it ranks the sentences in each cluster separately using FairTextRank algorithm, which is an iterative extension of the PageRank [39] algorithm. The summary is constructed by selecting sentences from each cluster. Overall, graph-based summarization approaches have been shown competitive with the other state-of-the-art approaches. For example, the graph-based summarization approach proposed by Wan et al. [42] outperformed the best three participating systems in DUC 2003 and DUC 2004 competitions.
2.5. Semantic Approaches
Lexical and co-reference chains have been investigated for text summarization. Chali and Kolla [43] extracted lexical chains from the text to give a score for each sentence, segment, and cluster (the documents to be summarized are divided into clusters). Then, summary sentences are selected by extracting the best sentences from the best segment of the best cluster. Bergler et al. [44] proposed a solution that consists in ranking the noun phrases (NPs) based on the NP cross-document co-reference chains and generating the summary by extracting the sentences with the top-ranked NPs.
2.6. Optimization-Based Approaches
Several summarization studies propose to solve the text summarization as an optimization problem. The selection of summary sentences has been reduced to different optimization problems. The summary sentences are selected according to one of the following approaches: (1) the greedy selection approach, in which the best textual units are selected one item at a time, and (2) the global optimal selection approach that searches for the best summary rather than the best sentences. The first approach rarely produces the best summaries [45] and, thus, most of the summarization studies are based on the second one. In the literature, several objectives have been studied and optimized using different optimization methods. Rautray and Balabantaray [46] described some of these objectives, including text coherence, which is the relatedness of summary contents (e.g., sentences) and significance, which is how relevant the summary content is to the documents to be summarized and to the user’s needs (e.g., user query). Nevertheless, in all these formulations, searching for the optimal summary is an NP-hard problem [47], and it is therefore essential to approximate the solution to MDS. Meta-heuristics can be used to find approximate solutions to NP-hard problems, such as GA [48] and a population-based method [49]. For example, Vanetik and Litvak [50] proposed a linear programming-based global optimization method to extract summary sentences.
Promising results have been produced from the global optimal selection approach. For example, the evaluation results of summaries produced by Shen and Li’s summarization framework [47] are not far from the results of the best methods in various DUC competitions. In addition, all the state-of-the-art methods on corpora from DUC 2004 through DUC 2007 in both generic and query-driven summarization were outperformed by the proposed solution of Lin and Bilmes [51], a monotone, non-decreasing submodular function for summarizing documents. Finally, in addition to the fact that obtaining approximate solutions are much faster than obtaining the exact one, some studies have shown that the results of both solutions are comparable [52]. Nevertheless, these experiments have been conducted on a limited size problem.
2.7. Swarm-Intelligence-Based Approaches
SI has been introduced to text summarization during the last decade. It produced promising results in several studies on different NLP problems, including text summarization [53,54,55,56,57]. The majority of SI-based summarization studies used particle swarm optimization (PSO). In these studies, PSO algorithms were used to select summary sentences [53,58] or set the weight of each feature extracted from the text to be summarized [54]. Alguliev et al. [53] proposed an optimization model to solve the summarization problem. This model uses a discrete PSO algorithm to generate multi-document summaries by maximizing their coverage and diversity. Using DUC 2001 and 2002 corpora, the model showed promising evaluation results. Binwahlan et al. [54] used a PSO algorithm as a machine learning technique and ROUGE-1 as a fitness function to investigate the best features’ weights. Asgari et al. [58] proposed an extractive single-document summarization method based on a multi-agent PSO.
Other SI meta-heuristics have also been used with text summarization, including artificial bee colony (ABC) [55,56], ACO [57,59], and cuckoo search (CS) [60]. Peyrard and Eckle-Kohler [55] proposed a general optimization framework to summarize a set of input documents using the ABC algorithm. Sanchez-Gomez et al. [56] also proposed an ABC based summarizer by formulating the summarization problem as a multi-objective one. ACO has also been used for single document [61] and short text [57,59] summarization problems. Finally, Rautray and Balabantaray [60] proposed a multi-document summarizer using CS meta-heuristic.
3. Orienteering Problem
The orienteering problem (OP) is an NP-hard problem which was introduced in 1987 by Golden et al. [62]. Its name came from the orienteering sport [63], which is the game where the competitors must find a path by visiting some of the control points within a limited amount of time. Each control point has a score or profit. Each competitor should start at a certain control point and return to another one. The competitors try to maximize the total collected profit gained from the visited control points without exceeding the time budget constraint. OP belongs to the family of problems called traveling salesman problems (TSPs) with profits [64]. These problems are variants of the TSP where each vertex has a profit and the solution can include a subset of the existing vertices. The objective function of OP is to maximize the collected scores while the travel cost (e.g., time) is a constraint to satisfy (e.g., time to not exceed) [3]. In other words, the OP asks to find a path starting from the first vertex and ending at the last one that maximizes the total collected scores while the total traveling time does not exceed a predefined time budget.
More formally, OP can be described as follows [3]. Given a graph where A is the set of the graph arcs, and is the set of the N graph vertices (i.e., the set of all control points in the problem). Each vertex has a profit . Each arc has a traveled time . A binary variable represents a traversed arc from vertex to vertex . OP asks to maximize the objective:
subject to the following constraints:
The aforementioned objective function maximizes the total profit of the selected vertices. Equation (2) represents the time constraint by ensuring that the total traveled time does not exceed a pre-defined time budget . Equation (3) guarantees that the vertices and are selected as the first and the last vertices of the solution path, respectively. Equation (4) ensures the connectivity of the solution path and the uniqueness of its vertices. Equations (5) and (6) guarantee that the solution path does not contain sub-tours where stands for the position of the vertex in the path.
4. Ant Colony Optimization
ACO is an SI meta-heuristic inspired from the collective behavior of real ant colonies. Ants use pheromone traces to communicate with each other to find the shortest path between their nest and food. There are several ACO algorithm variants for approximating solutions to optimization problems, such as the ant system (AS) and ACS [5].
ACS was proposed by Dorigo and Gambardella [5] as an improvement of the AS algorithm for solving large instances of the TSP. ACS modifies the three updating rules of AS: the state transition rule, the global updating rule, and the local updating rule. An ant k chooses to move from city r to city s by using the following rule:
where is the set of all cities that can be visited by the ant k, represents the desirability measure (the pheromone), stands for the heuristic value, q is a random number q uniformly distributed over , and is a parameter with a value between 0 and 1 (inclusive) to control the relative importance of exploration versus exploitation. The parameter has a value greater than zero and controls the relative weight of the pheromone with respect to the heuristic. S is a randomly selected city chosen according to the following probability distribution:
The state transition rule of ACS, formulated by Equations (7) and (8), is called pseudo-random proportional. The global updating rule is applied once all the ants complete their tours. In ACS, only the ant that produces the best tour, so far, is allowed to add an amount of pheromone according to the following equation:
where
is the pheromone decay parameter whose values range between 0 and 1, and is the cost of the best solution generated from the beginning of the trial. The local updating rule is applied during the construction of the solutions. The amounts of pheromone of the visited edges are updated as follows:
where the value of the parameter is between 0 and 1 (exclusive). A possible value for is the initial pheromone value .
5. The Proposed Solution
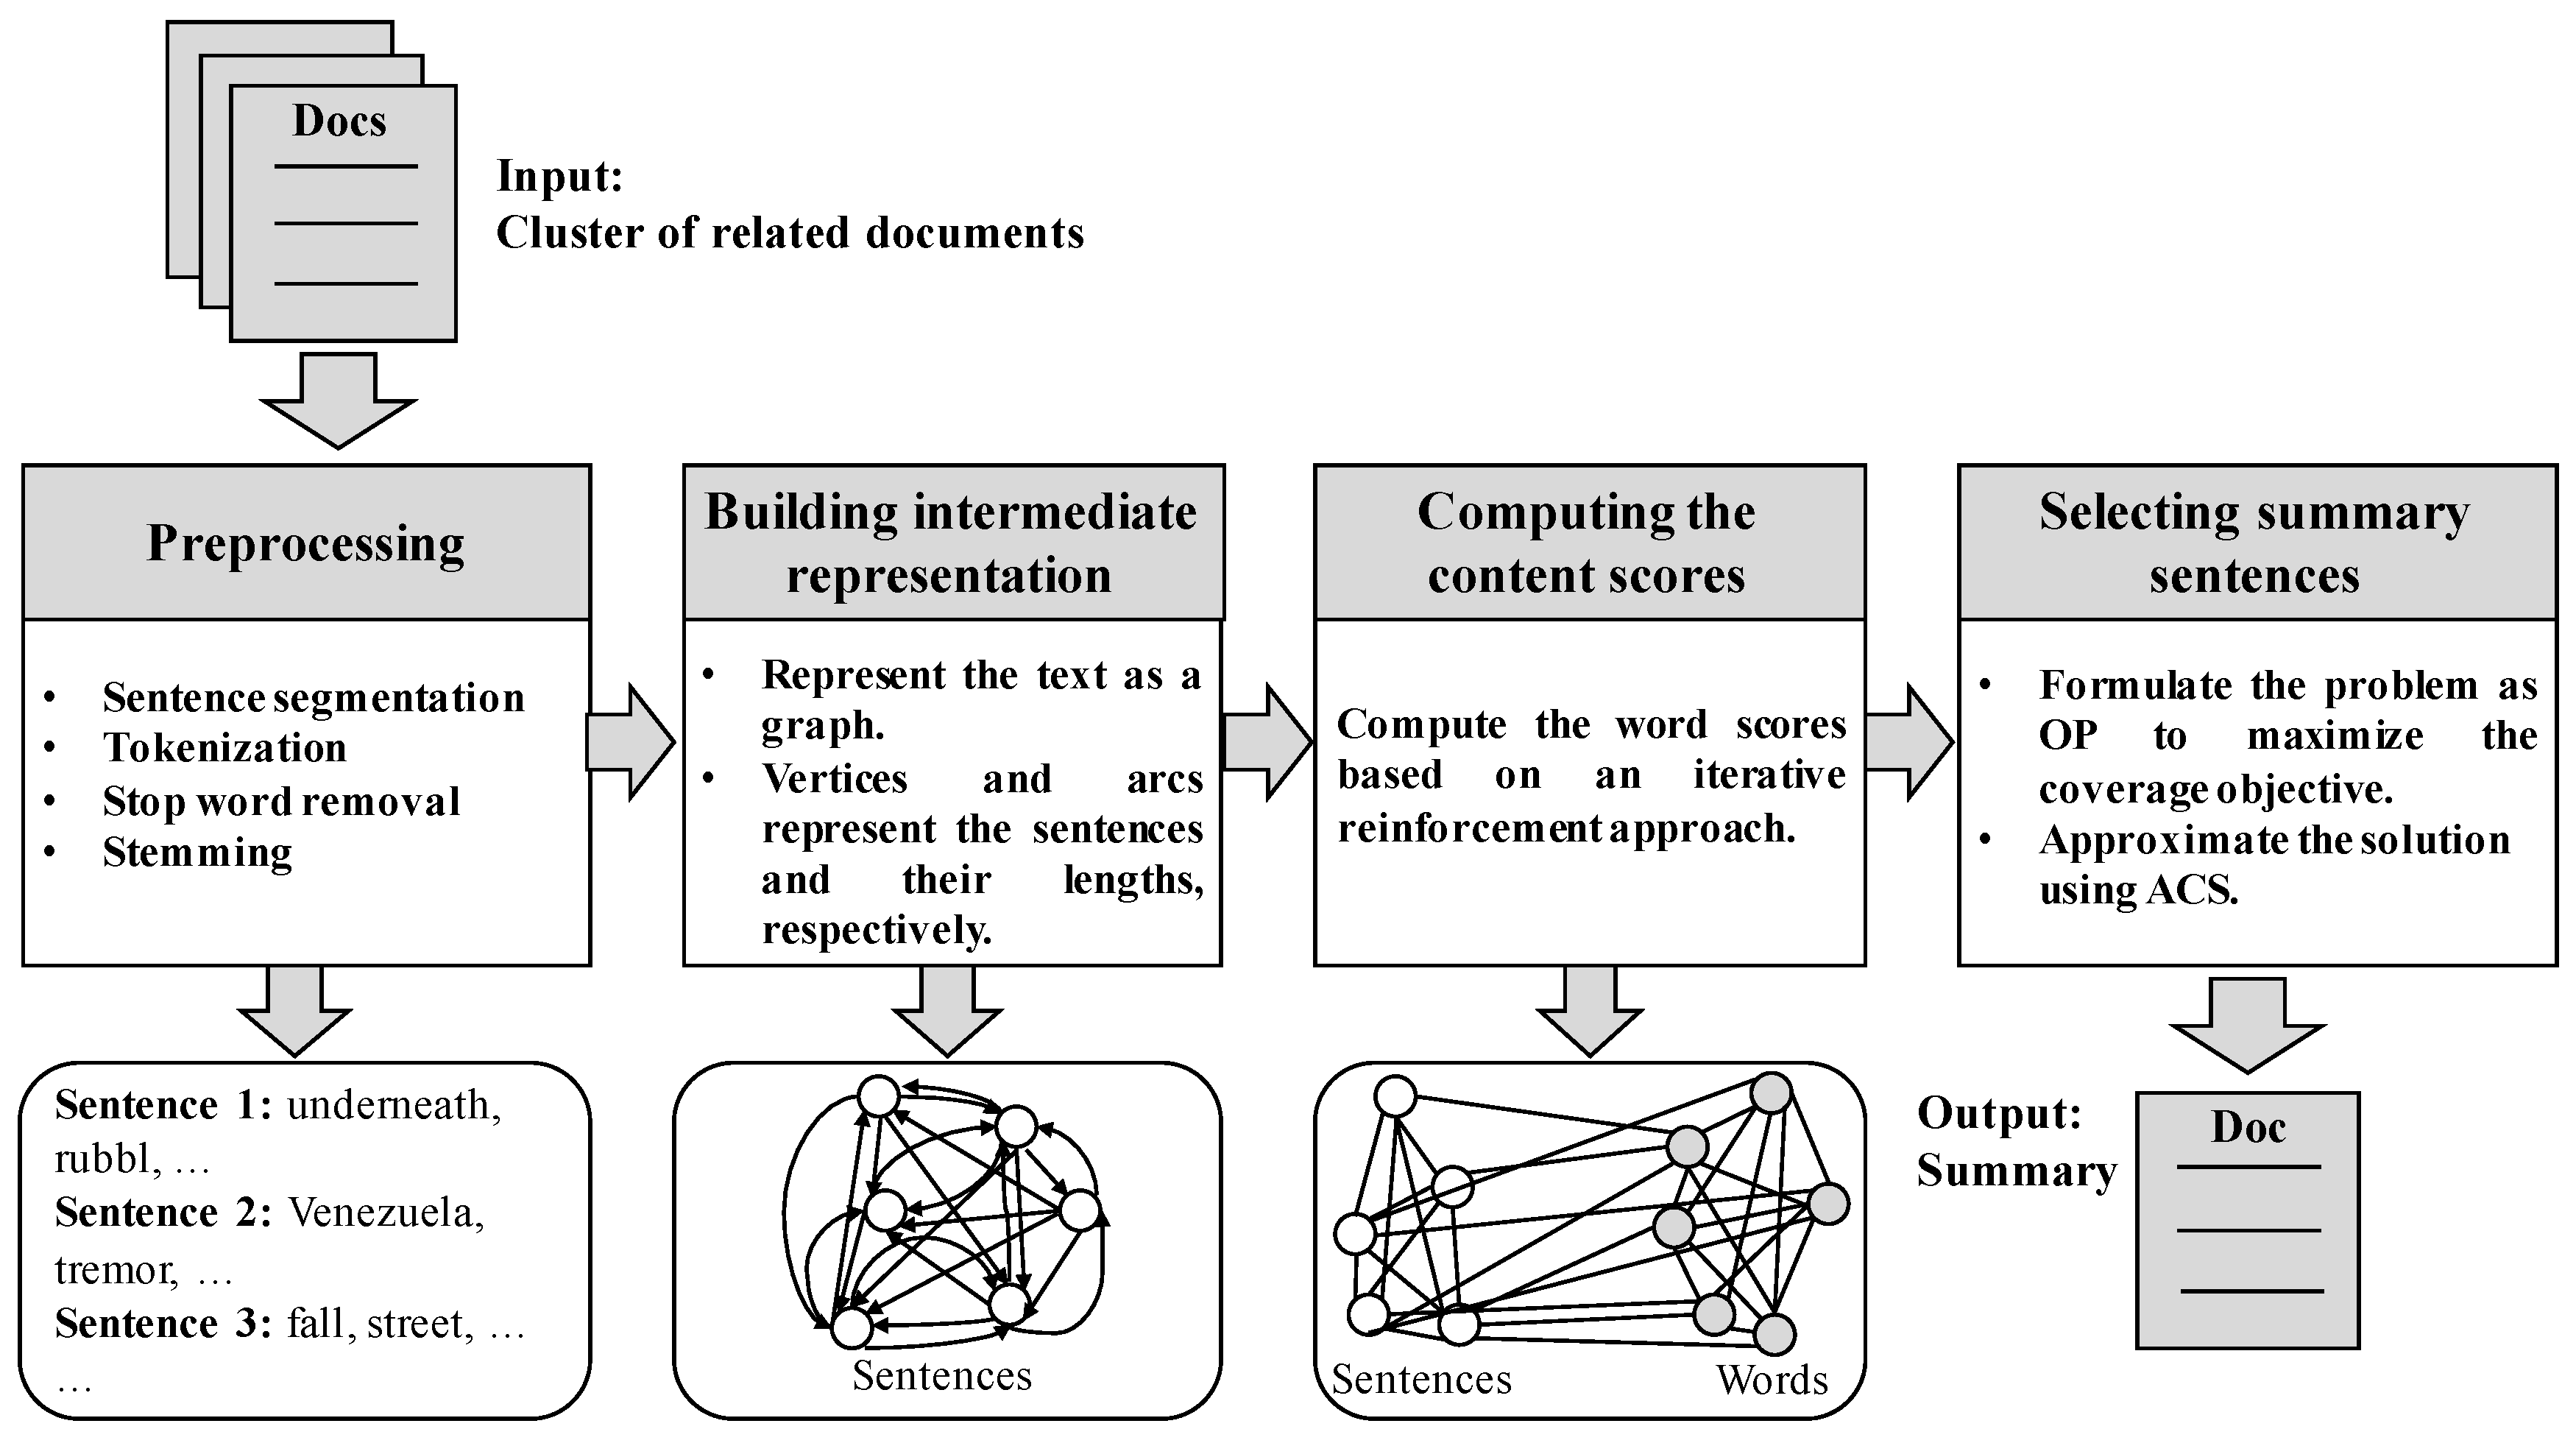
The contribution of this work consists of reducing an MDS instance into an OP instance and then optimizing the information coverage by using an ACS algorithm. Figure 1 illustrates the main components of the implemented system MDS-OP.
5.1. Preprocessing
Four preprocessing steps are applied including text segmentation, tokenization, stemming, and stop word removal. Text segmentation and tokenization divide the text into sentences and words, respectively, by using the Stanford CoreNLP tools [65]. Stop words are removed to filter out common words with low semantic weight [66]. Examples of these words are “and” “the” and “to”. An English stop word list (http://jmlr.csail.mit.edu/papersvolume5/lewis04a/a11-smart-stop-list/english.stop) from the SMART information retrieval system is used. Word stemming is performed by using Porter stemmer (https://tartarus.org/martin/PorterStemmer/). This step enables an equal treatment of the different variants of terms.
5.2. Building an Intermediate Representation
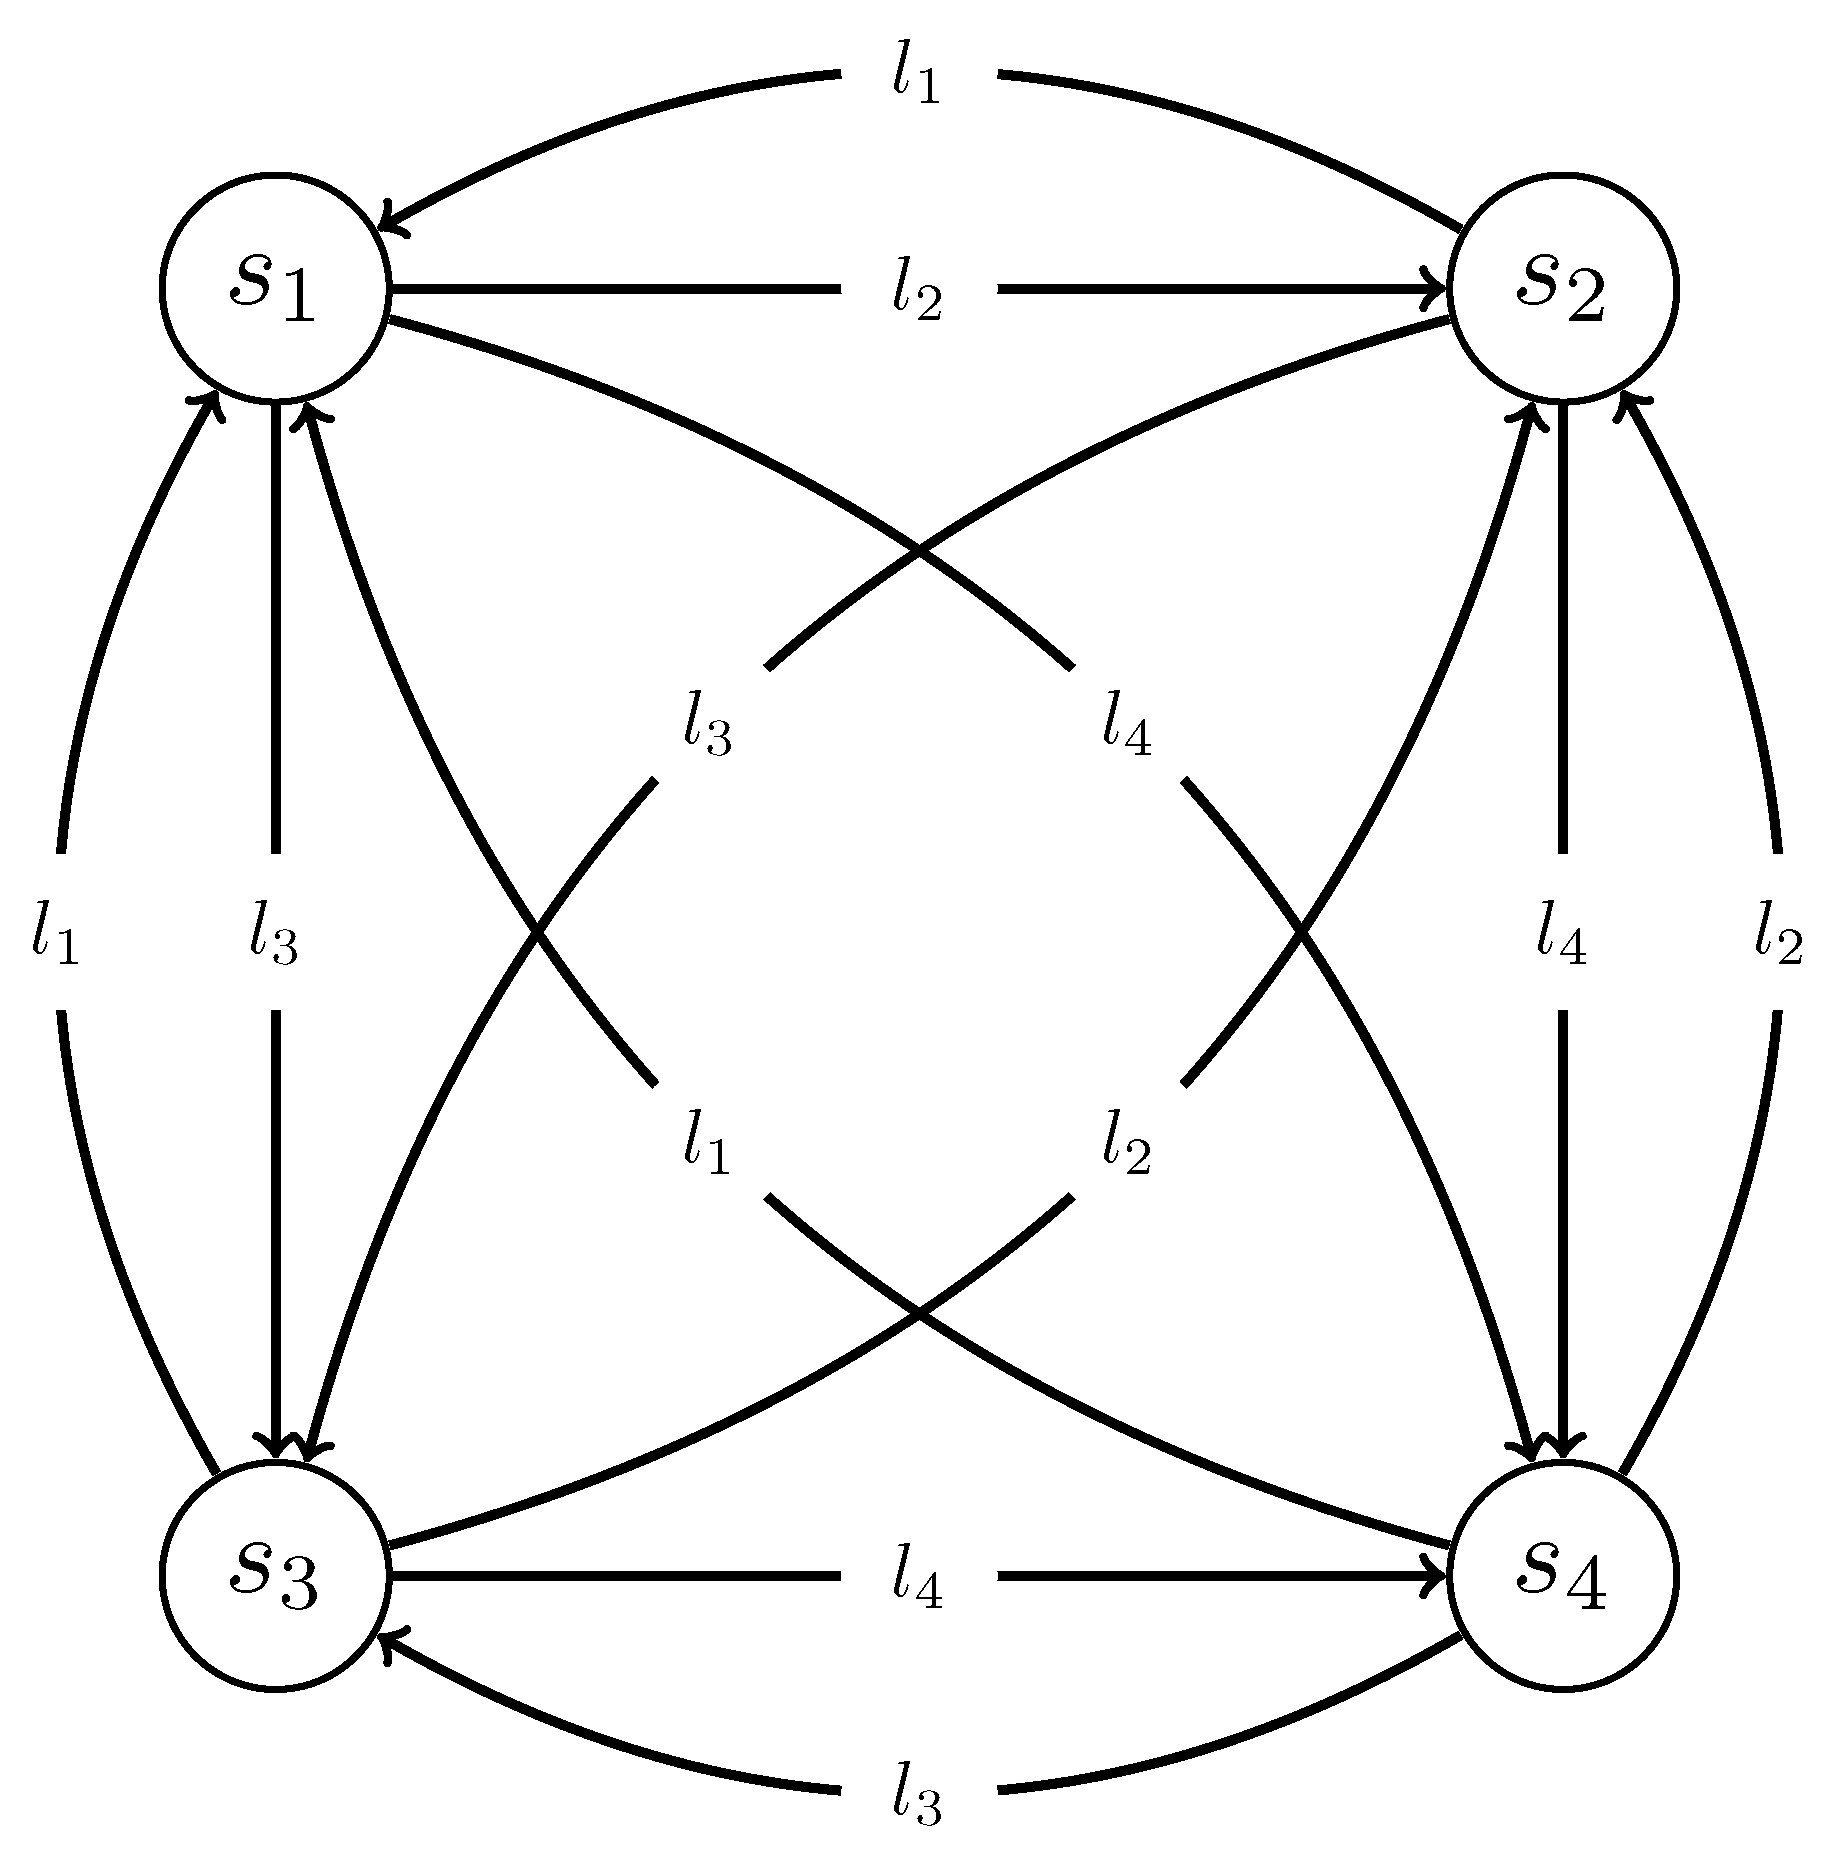
In this stage, the graph representation is built. The texts to be summarized are represented as a connected directed graph. Each sentence is added to the graph as a vertex with a weight representing its content score (i.e., its saliency). Regarding the graph arcs, two arcs in opposite directions are added between each pair of vertices (i.e., sentences). The weights of each vertex is calculated in the third stage (see Section 5.3) and used to optimize the information coverage of the output summaries. The weight of each arc stands for the length of the original sentence (i.e., before the preprocessing stage) that is represented by the vertex at the end of the arc. In other words, the weight of a graph arc from vertex to vertex is the length of the sentence . See Figure 2 for an example of input text with four sentences.
5.3. Computing the Content Scores
In this stage, the score of each word in the text is computed to get the content scores of the sentences. The content score for each sentence is based on the scores of the words it contains. The proposed algorithm to compute the scores of the words follows the iterative reinforcement approach proposed by Wan et al. [38]. It combines ideas similar to PageRank [39] and the HITS [40] graph-ranking algorithms. First, three graphs are built: (1) a sentence-to sentence graph to represent the relationship among the sentences, (2) a word-to-word graph to represent the relationship among the words, and (3) a sentence-to-word bipartite graph that connects each sentence with the words it contains. To compute the scores of the words, the algorithm applies a PageRank-based method to the sentence-to-sentence and word-to-word graphs, and an HITS-based method to the sentence-to-word graph, where hubs represent the sentences, and authorities represent the words.
The proposed algorithm computes the arcs weights of the sentence-to-sentence and the sentence-to-word graphs based on the TF-ISF scores and cosine similarity measure. For the word-to-word graph, the arc weights are equal to the longest common substring between the two connected words. The weights of the arcs in sentence-to-sentence, sentence-to-word, and word-to-word graphs are represented by three matrices: U, W, and V, respectively. The scores of the words (represented by matrix V) and sentences (represented by matrix U) are computed by applying the following two equations, which are calculated repeatedly until a convergence state is reached.
where , , and are the normalized version of the matrices U, W, and V, respectively. The normalized transposed of the matrix W is . The values of the vector and vector represent the values of the vector U at the iterations n and , respectively. Similarly, the values of the vector and vector represent the values of the vector V at the iterations n and , respectively. After each calculation of and , the two vectors are normalized. In addition, to emphasize the importance of the first sentences, the proposed algorithm gives more weight to the words of these sentences.
Several differences exist between the reinforcement approach of Wan et al. [38] and the proposed algorithm. The proposed algorithm generates multi-document summaries instead of single-document summaries. It uses the scores of the words to maximize the overall information coverage score of the resulting summary, whereas the reinforcement approach uses the scores of the sentences to generate the summaries. Moreover, it computes the similarities among the words in the word-to-word graph based on the longest common substring to keep the proposed solution language independent, instead of using knowledge-based or corpus-based measures.
5.4. Selecting Summary Sentences
In this stage, the MDS is formulated as an OP to maximize the content coverage of the produced summaries. ACS is then used to approximate a solution to OP. Consider an MDS instance. In this study, the textual unit chosen is the sentence. Therefore, each document is split into sentences. Let D be a set of related documents to summarize. , where represents sentence k () and is the total number of sentences in D. The MDS problem asks to create a sequence summary S of a maximum length L by extracting part of sentences from D such that the overall content coverage of S is maximized. More formally, it asks to optimize the following objective:
where is the content coverage score of sentence , and is a binary variable which equals 1 if is a summary sentence and 0 otherwise. The length of sentence is .
In this study, the content coverage score of each sentence is expressed by the total weight of its words that have not been covered by other sentences already in S. In other words, regardless of the number of occurrences of a covered by S, its weight is added only once to the total content coverage score. Therefore, instead of using the scores of sentences, the content coverage score of S is expressed by the total weight of words it covers as follows:
where is a binary variable defined as follows:
The constant equals 1 if the sentence contains the and 0 otherwise.
5.4.1. Encoding of an MDS Instance into an OP Instance
Algorithm 1 outlines the main steps to encode an MDS instance into an OP instance.
The computational complexity of Algorithm 1 can be estimated as follows. The number of iterations of the first loop is . The number of iterations of the second loop is , which is the number of the arcs in the graph that can be created by using the sentences as the vertices where two arcs are added between each pair of these vertices. Thus, Algorithm 1 runs in in the worst case.
| Algorithm 1 Encoding of an MDS instance into an OP instance. |
|
5.4.2. Decoding a Solution to OP into a Solution to MDS
Algorithm 2 presents the main steps to decode a solution to an instance of OP into a solution to an instance of MDS. In other words, this algorithm decodes a path of an OP instance into a summary of an MDS instance. The while loop in Algorithm 2 iterates at most , or in other words, times. Therefore, in the worst case, the algorithm runs in time.
| Algorithm 2 Decoding of a solution to OP into a solution to MDS. |
|
5.4.3. Correctness of the Reduction
The correctness of the reduction of an MDS instance into an OP instance is presented and proved as follows.
Theorem 1.
Let be an MDS instance where D is a set of related documents to be summarized and L is the maximum summary length. Let be an OP instance where represents its time budget, and V and A be the sets of vertices and arcs, respectively. An instance has a solution summary S with a length up to L and its content coverage is maximized if and only if its corresponding instance given by Algorithm 1 has a solution path P that maximizes the total gained profit, while the total traveled time is less than or equal to .
Proof of Theorem 1.
Suppose that an MDS instance has a solution summary S, which is a sequence of sentences where is a sentence at S and q is the number summary sentences. The corresponding instance given by Algorithm 1 has a solution path . Additionally, in P represents the summary sentence (i.e., ) of the corresponding instance. Based on Algorithm 1, the profit of in P represents the coverage score of in S. Moreover, the weight of the arc from, for example, vertex to vertex in P, represents the added length by including in S. Furthermore, time budget represents summary length L. Thus, the following can be concluded:
- The length of S is less than or equal to L, so the total traveled time of P is less than or equal to :
- Maximizing the overall content coverage score of S will maximize the total gained profit of P:
Conversely, suppose that the OP instance has a solution path P, which is a sequence of vertices , where represents the vertex at P and is the total number of visited vertices. Therefore, based on Algorithm 2, the corresponding MDS solution summary is created by appending a sequence of sentences that are represented by the visited vertices in P starting from the second vertex until reaching the vertex located before the last one (i.e., ignoring the starting and the ending vertices). In other words, the vertex in P represents the sentence in S. As a result,
- If the traveled time of P is less than or equal to , then the total length of S is less than or equal to L:
- Maximizing the gained profit of P will maximize the score of the overall content coverage of S:
☐
5.4.4. ACS for OP
An ACS algorithm is proposed to approximate a solution to an OP instance. The original ACS algorithm was proposed by Dorigo and Gambardella [5] for the TSP. The main steps of the proposed ACS algorithm for the OP are outlined by Algorithm 3. Specifically, due to the time constraint, each ant could terminate its path and become inactive at different times based on the vertices (i.e., sentences) it includes in its solution (i.e., path). A set, called , is used to keep track of the active ants, which are the ants whose own traveled time does not reach the time budget (i.e., max summary length), and thus can move further to another vertex and complete its solution. In addition, to maximize the coverage objective, the content score of each sentence (i.e., the profit of each vertex) is dynamic. This means that the coverage objective is updated at each cycle based on the last vertex that joins the path. Therefore, each ant has its own graph to keep track of the current profits values of the graph vertices. To satisfy the time constraint by ants, each has its own time . The path of is stored in the path . Moreover, each keeps track of the set of vertices that have not yet been visited.
| Algorithm 3 Approximating an OP solution using ACS. |
|
At the beginning, the first and last vertices are both removed from . Then, after adding the first vertex , each ant is moved to a different vertex. The number of ants is equal to the number of vertices minus 2 (representing the first and the last vertices.) The heuristic value used by each ant to move from its current location to a new vertex is based on the profit gained from the current vertex. For the ACS parameters, the same values recommended by Dorigo and Gambardella [5] were used, except the number of ants, which was set to the number of sentences in the input text (see Table 1.)
6. Experiments
Several experiments were conducted on a PC equipped with an Intel(R) Core(TM) i7-6500U CPU, a 2.5 Ghz processor, and 12 GB of RAM. MDS-OP was implemented by using the Java programming language.
6.1. Corpora
Since 1998, a number of conferences and workshops have been organized to address automatic summarization problems. In this study, two corpora were selected to evaluate the performance of MDS-OP. The first one is DUC 2004 (Task 2). DUCs (http://www.nlpir.nist.gov/projects/duc/index.html) were an important series of conferences that addressed issues of automatic summarization. They were held yearly between 2001 and 2007. Competitions were organized to compare summarization systems on different corpora related to different tasks. The corpus of Task 2 from DUC 2004 consists of 50 English clusters where each one of them contains around 10 documents, and the main task is to create a short summary with a length up to 665 bytes for each cluster. The published results include the scores of eight human summarizers, a baseline, and 16 participating systems (see Table 2).
The second corpus used to evaluate the algorithm is the corpus of the MMS task at MultiLing 2015 (http://multiling.iit.demokritos.gr/pagesview/1516/multiling-2015) [67], which is a special session at SIGdial 2015 (http://www.sigdial.org/workshops/conference16/). It was built upon the corpus of the MultiLing 2013 (http://www.nist.gov/tac/2011/Summarization/index.html) workshop at ACL 2013, which in turn is based on the TAC 2011 MultiLing Pilot (http://multiling.iit.demokritos.gr/pages/view/662/multiling-2013) corpus. This corpus contains sets of documents written in 10 languages. MDS-OP was evaluated on the English version which consists of 15 sets, each including 10 documents. The participants were asked to provide partially or fully language-independent multi-document summarizers, which produce at most 250 words summaries. Each summarizer was applied to at least two different languages. Ten teams participated to MMS task in MultiLing 2015 (see Table 3).
6.2. Evaluation Metrics
This study used ROUGE (Recall-Oriented Understudy for Gisting Evaluation) [6] to evaluate the performance of MDS-OP. ROUGE is a set of metrics used to automatically evaluate summarization systems by counting the overlapping units (e.g., n-gram) between the automatically produced summary (i.e., the peer) and one or a set of human created summaries (i.e., references). ROUGE has been adapted by DUC since DUC 2004 [68] and it comprises different metrics, including ROUGE-N (N-gram Co-Occurrence Statistics), ROUGE-L (Longest Common Subsequence), ROUGE-S (Skip-Bigram Co-Occurrence Statistics), and ROUGE-W (Weighted Longest Common Subsequence). The recall version of ROUGE-N measure, for example, evaluates a given summary by calculating the n-gram recall between the summary obtained and a set of reference (i.e., model) summaries as follows:
where is the maximum number of the shared n-grams between the summary to be evaluated and reference ones, is the sum of the number of n-grams in the reference summaries, and n is the n-gram length. ROUGE-L evaluates the summary based on the shared longest common subsequence (LCS). ROUGE-W is similar to ROUGE-L except it gives more weight to consecutive matches. Finally, ROUGE-S and ROUGE-SU evaluate the summary based on the shared skip-bigrams with and without the addition of unigram as counting unit, respectively.
The recent version of ROUGE software package (i.e., ROUGE 1.5.5) calculates the recall, precision, and F-measure scores. In this paper, for the DUC 2004 corpus, all the results of the baseline, humans, and rival systems were re-evaluated using this version so all the the comparison results are based on this version. The same values of ROUGE parameters provided at the competition were used. Different ROUGE metrics, similar to those used at the competition, were also used in this study. Specifically, ROUGE-1, ROUGE-2, ROUGE-3, ROUGE-4, ROUGE-L, and ROUGE-W were used. Similar evaluation process was applied to MultiLing 2015 corpus. The evaluation results are based on using the same ROUGE metrics (ROUGE-1, ROUGE-2, and ROUGE-SU4) and parameters used at the TAC 2011 MultiLing Pilot. The performance results of MDS-OP are reported in terms of the average F-measure scores of five runs.
In addition to ROUGE metrics, three official evaluation methods at MultiLing 2015 were used. The first one is AutoSummENG (AUTOmatic SUMMary Evaluation based on N-gram Graphs) [7], which is a language-independence method that creates an n-gram graph for each reference and peer summaries. It calculates the performance of a summary by averaging the similarities between this summary and each reference summaries. The second method is MeMoG (Merged Model Graph) [8], which is a variation of AutoSummENG where one merged graph represents all reference summaries. Finally, NPowER (N-gram graph Powered Evaluation via Regression) [9] is the third method, which is a machine-learning-based method where the features are the evaluation methods and the target is the human evaluation grade. It uses liner regressions to combine the previous two evaluation methods.
6.3. Evaluation Results
Teams that participated to DUC 2004 were allowed up to three runs (i.e., three variants of each system). In the comparison results depicted in Table 4 and Figure 3, Figure 4, Figure 5, Figure 6, Figure 7 and Figure 8, only the best results among the runs of these systems are presented. Similarly, several teams at MultiLing 2015 participated with several variants, so only the best variants are included in the evaluation. Moreover, three sets of documents (M001, M002, and M003) were not included in the evaluation since they were provided to the participants as a training set (see Table 5 and Table 6, and Figure 9, Figure 10, Figure 11, Figure 12, Figure 13 and Figure 14).
The F-measure scores achieved by MDS-OP and those of the 16 participated systems on DUC 2004 (Task 2) are presented in Table 4 in terms of ROUGE-1 (R-1), ROUGE-2 (R-2), ROUGE-3 (R-3), ROUGE-4 (R-4), ROUGE-L (R-L), and ROUGE-W (R-W). The relative improvement of MDS-OP over a system X is calculated as follows:
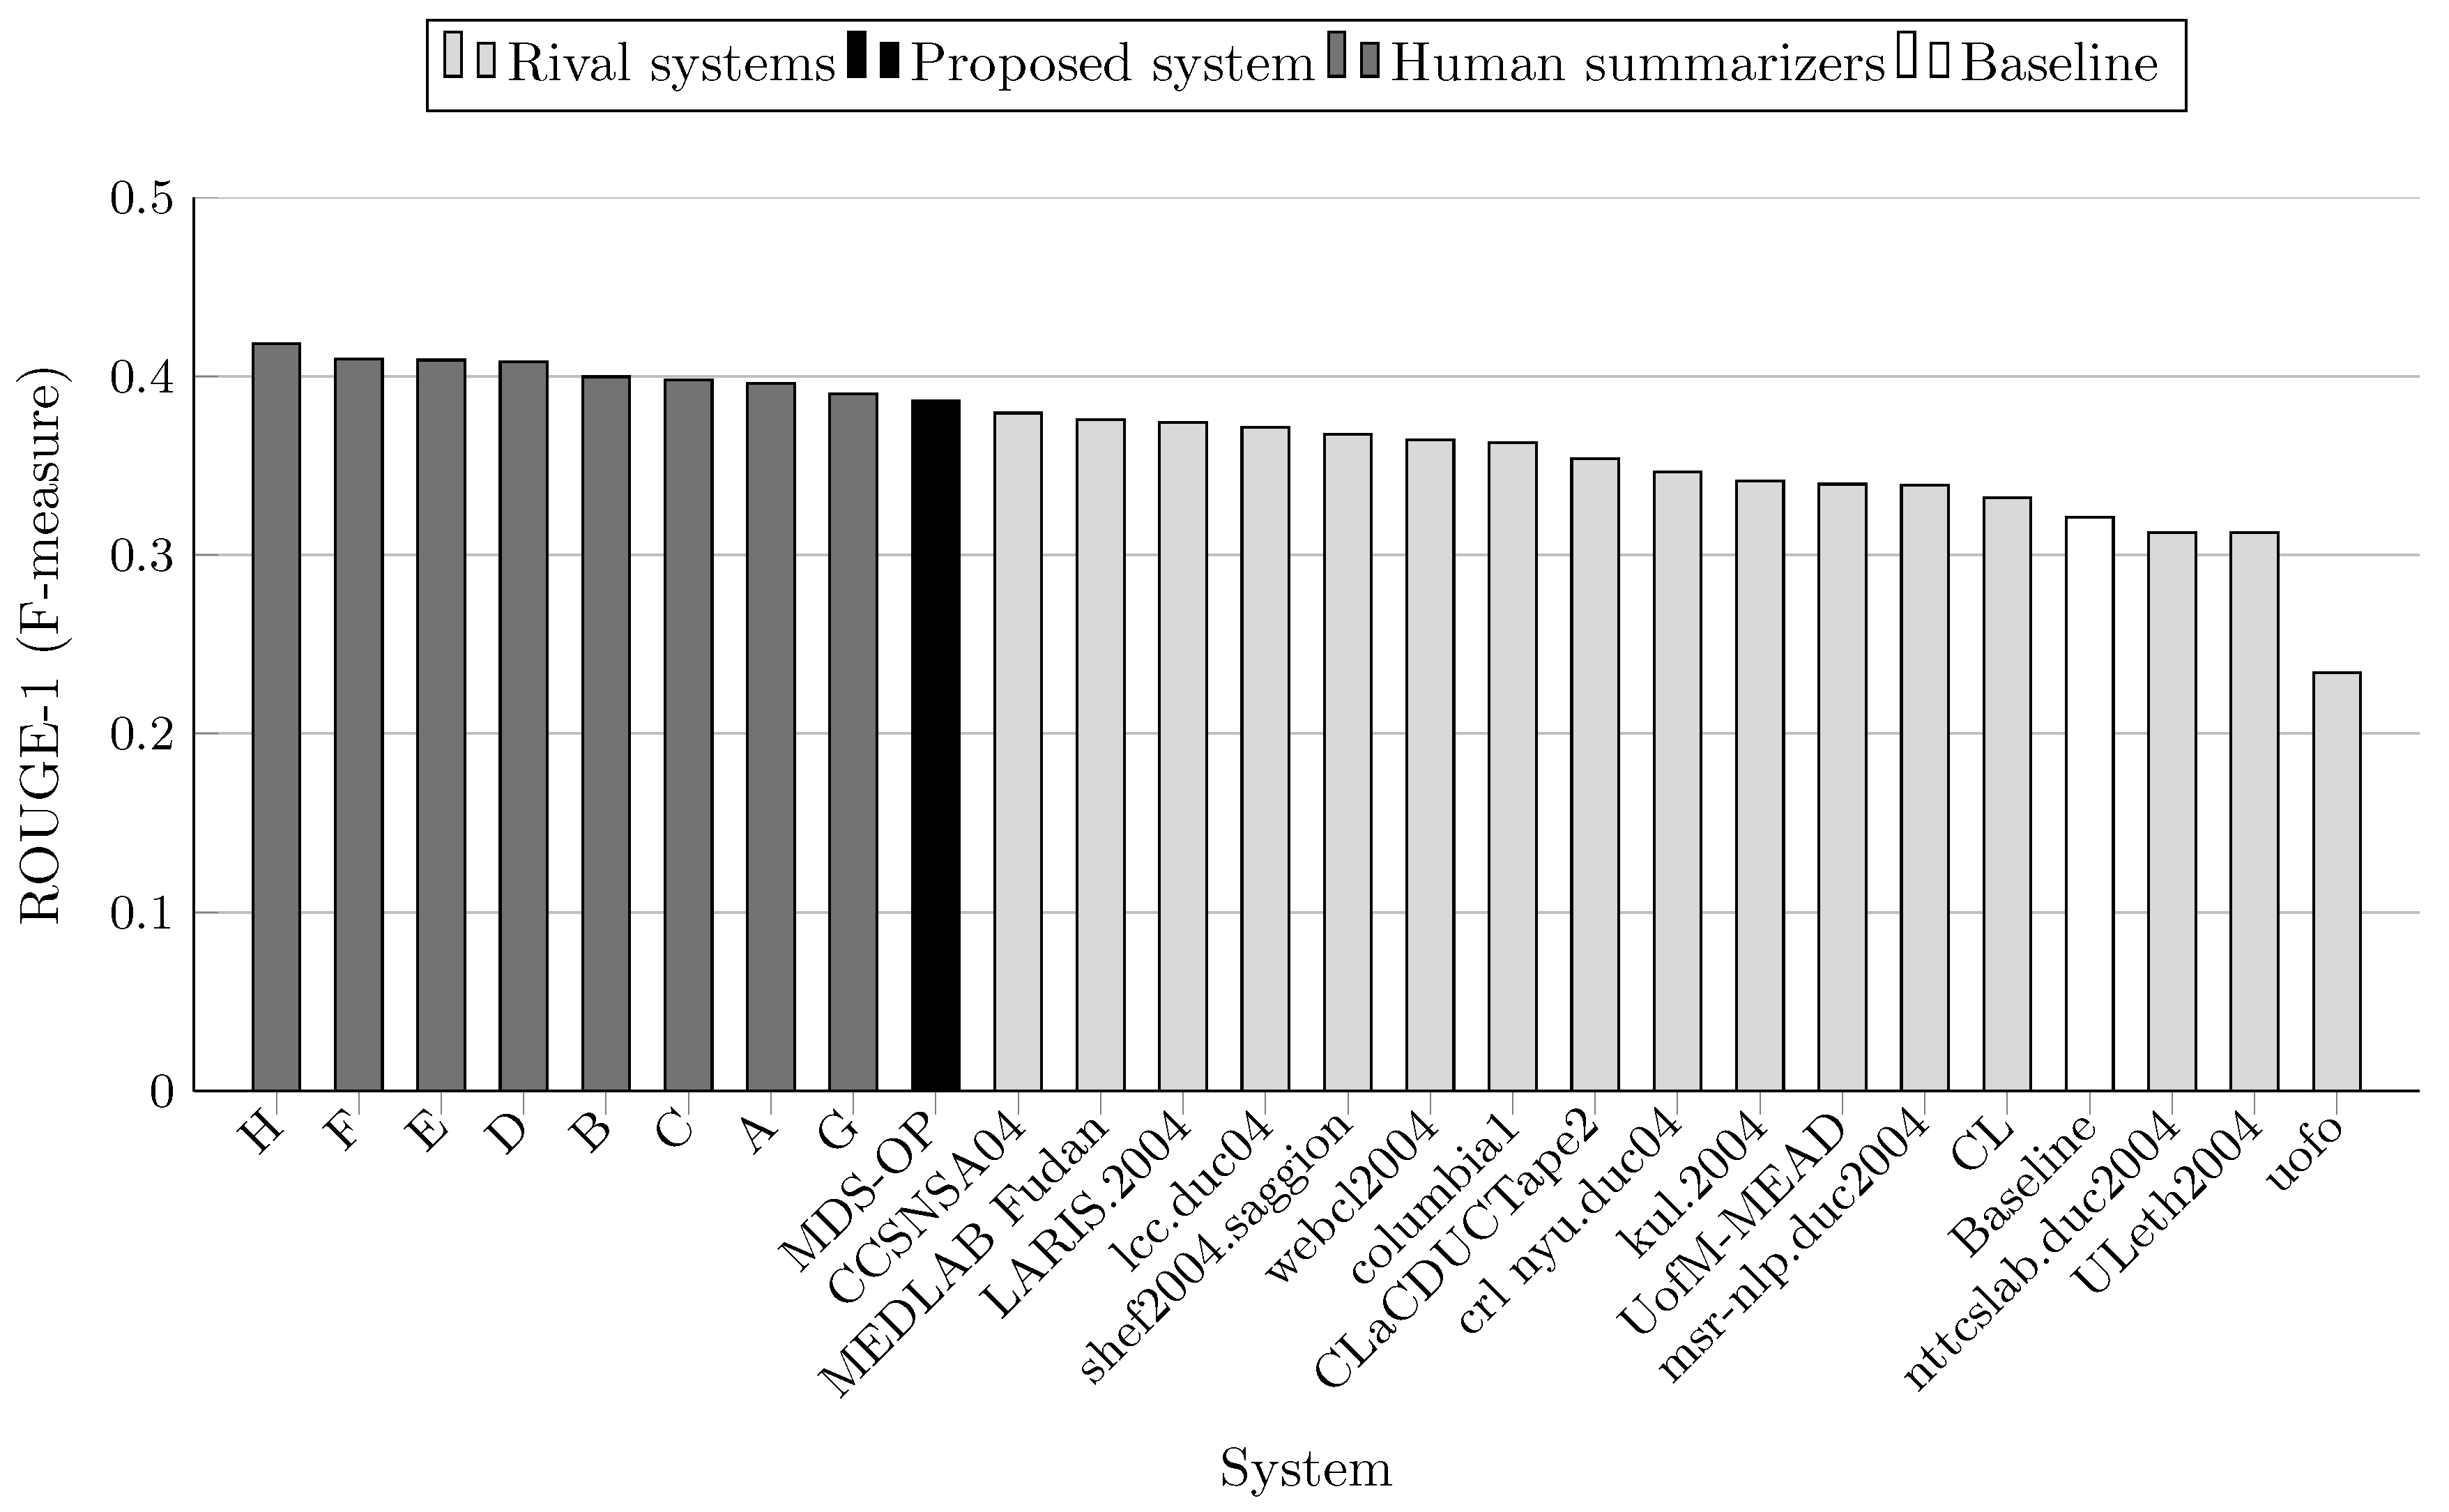
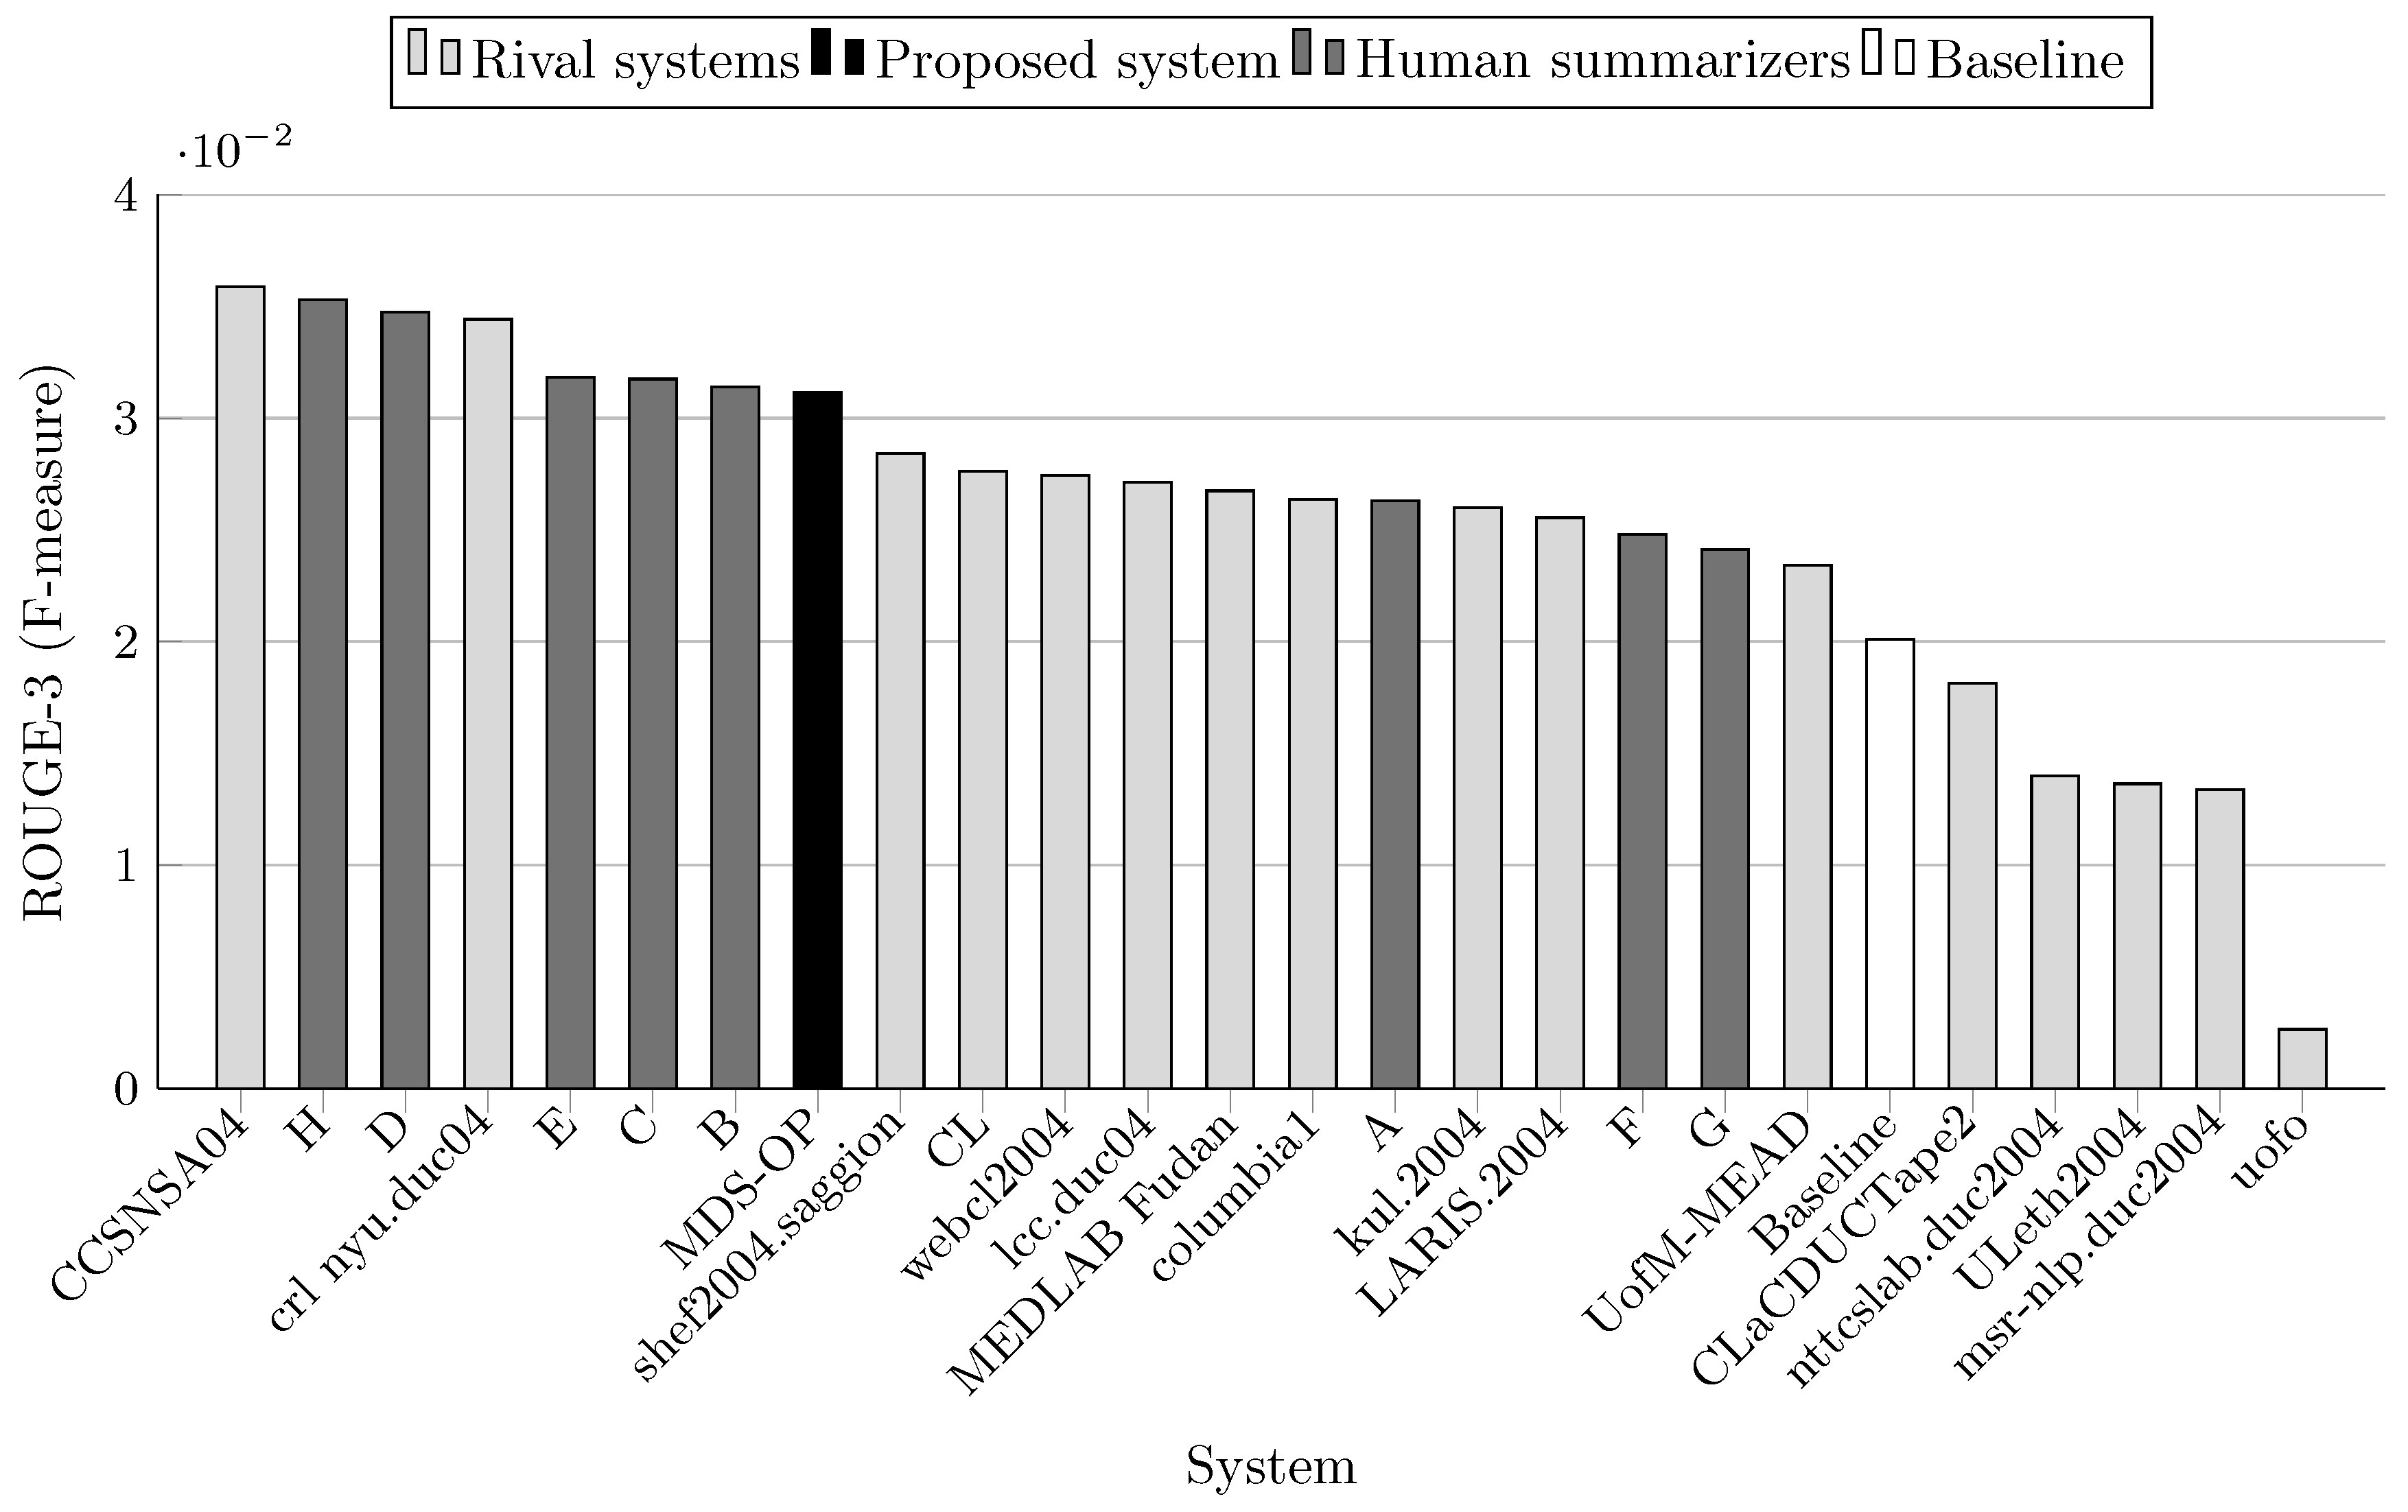
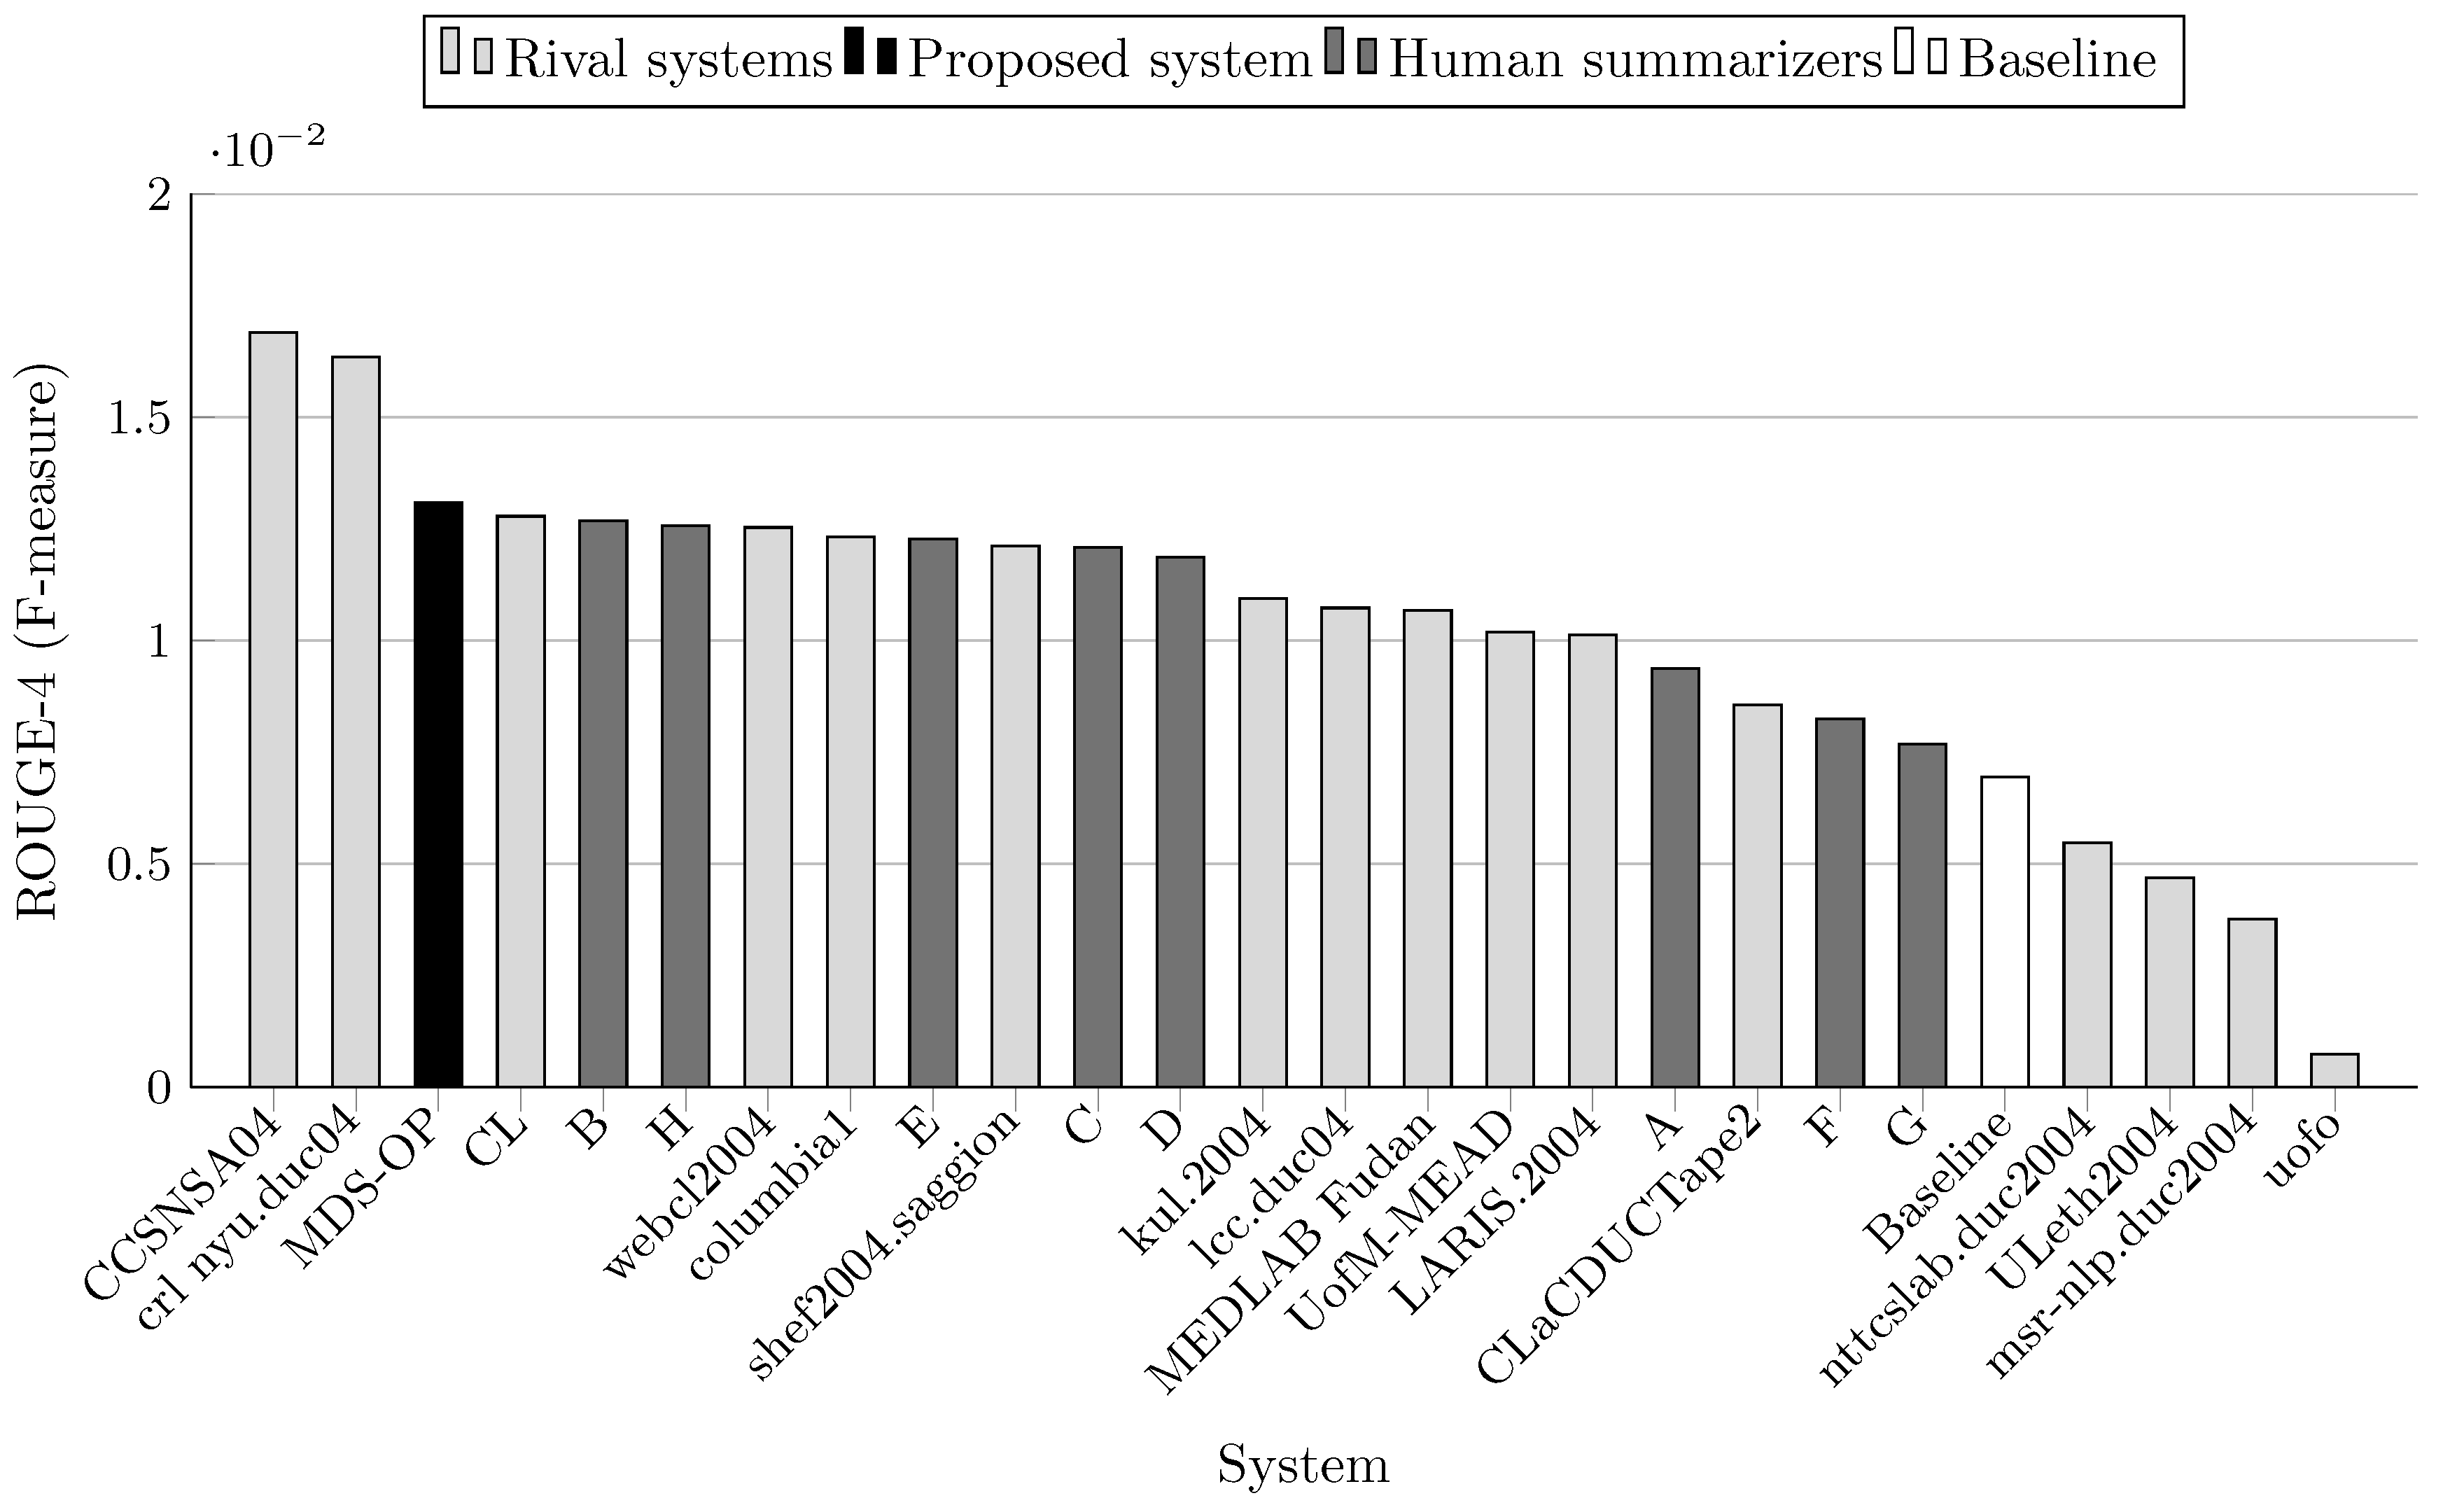
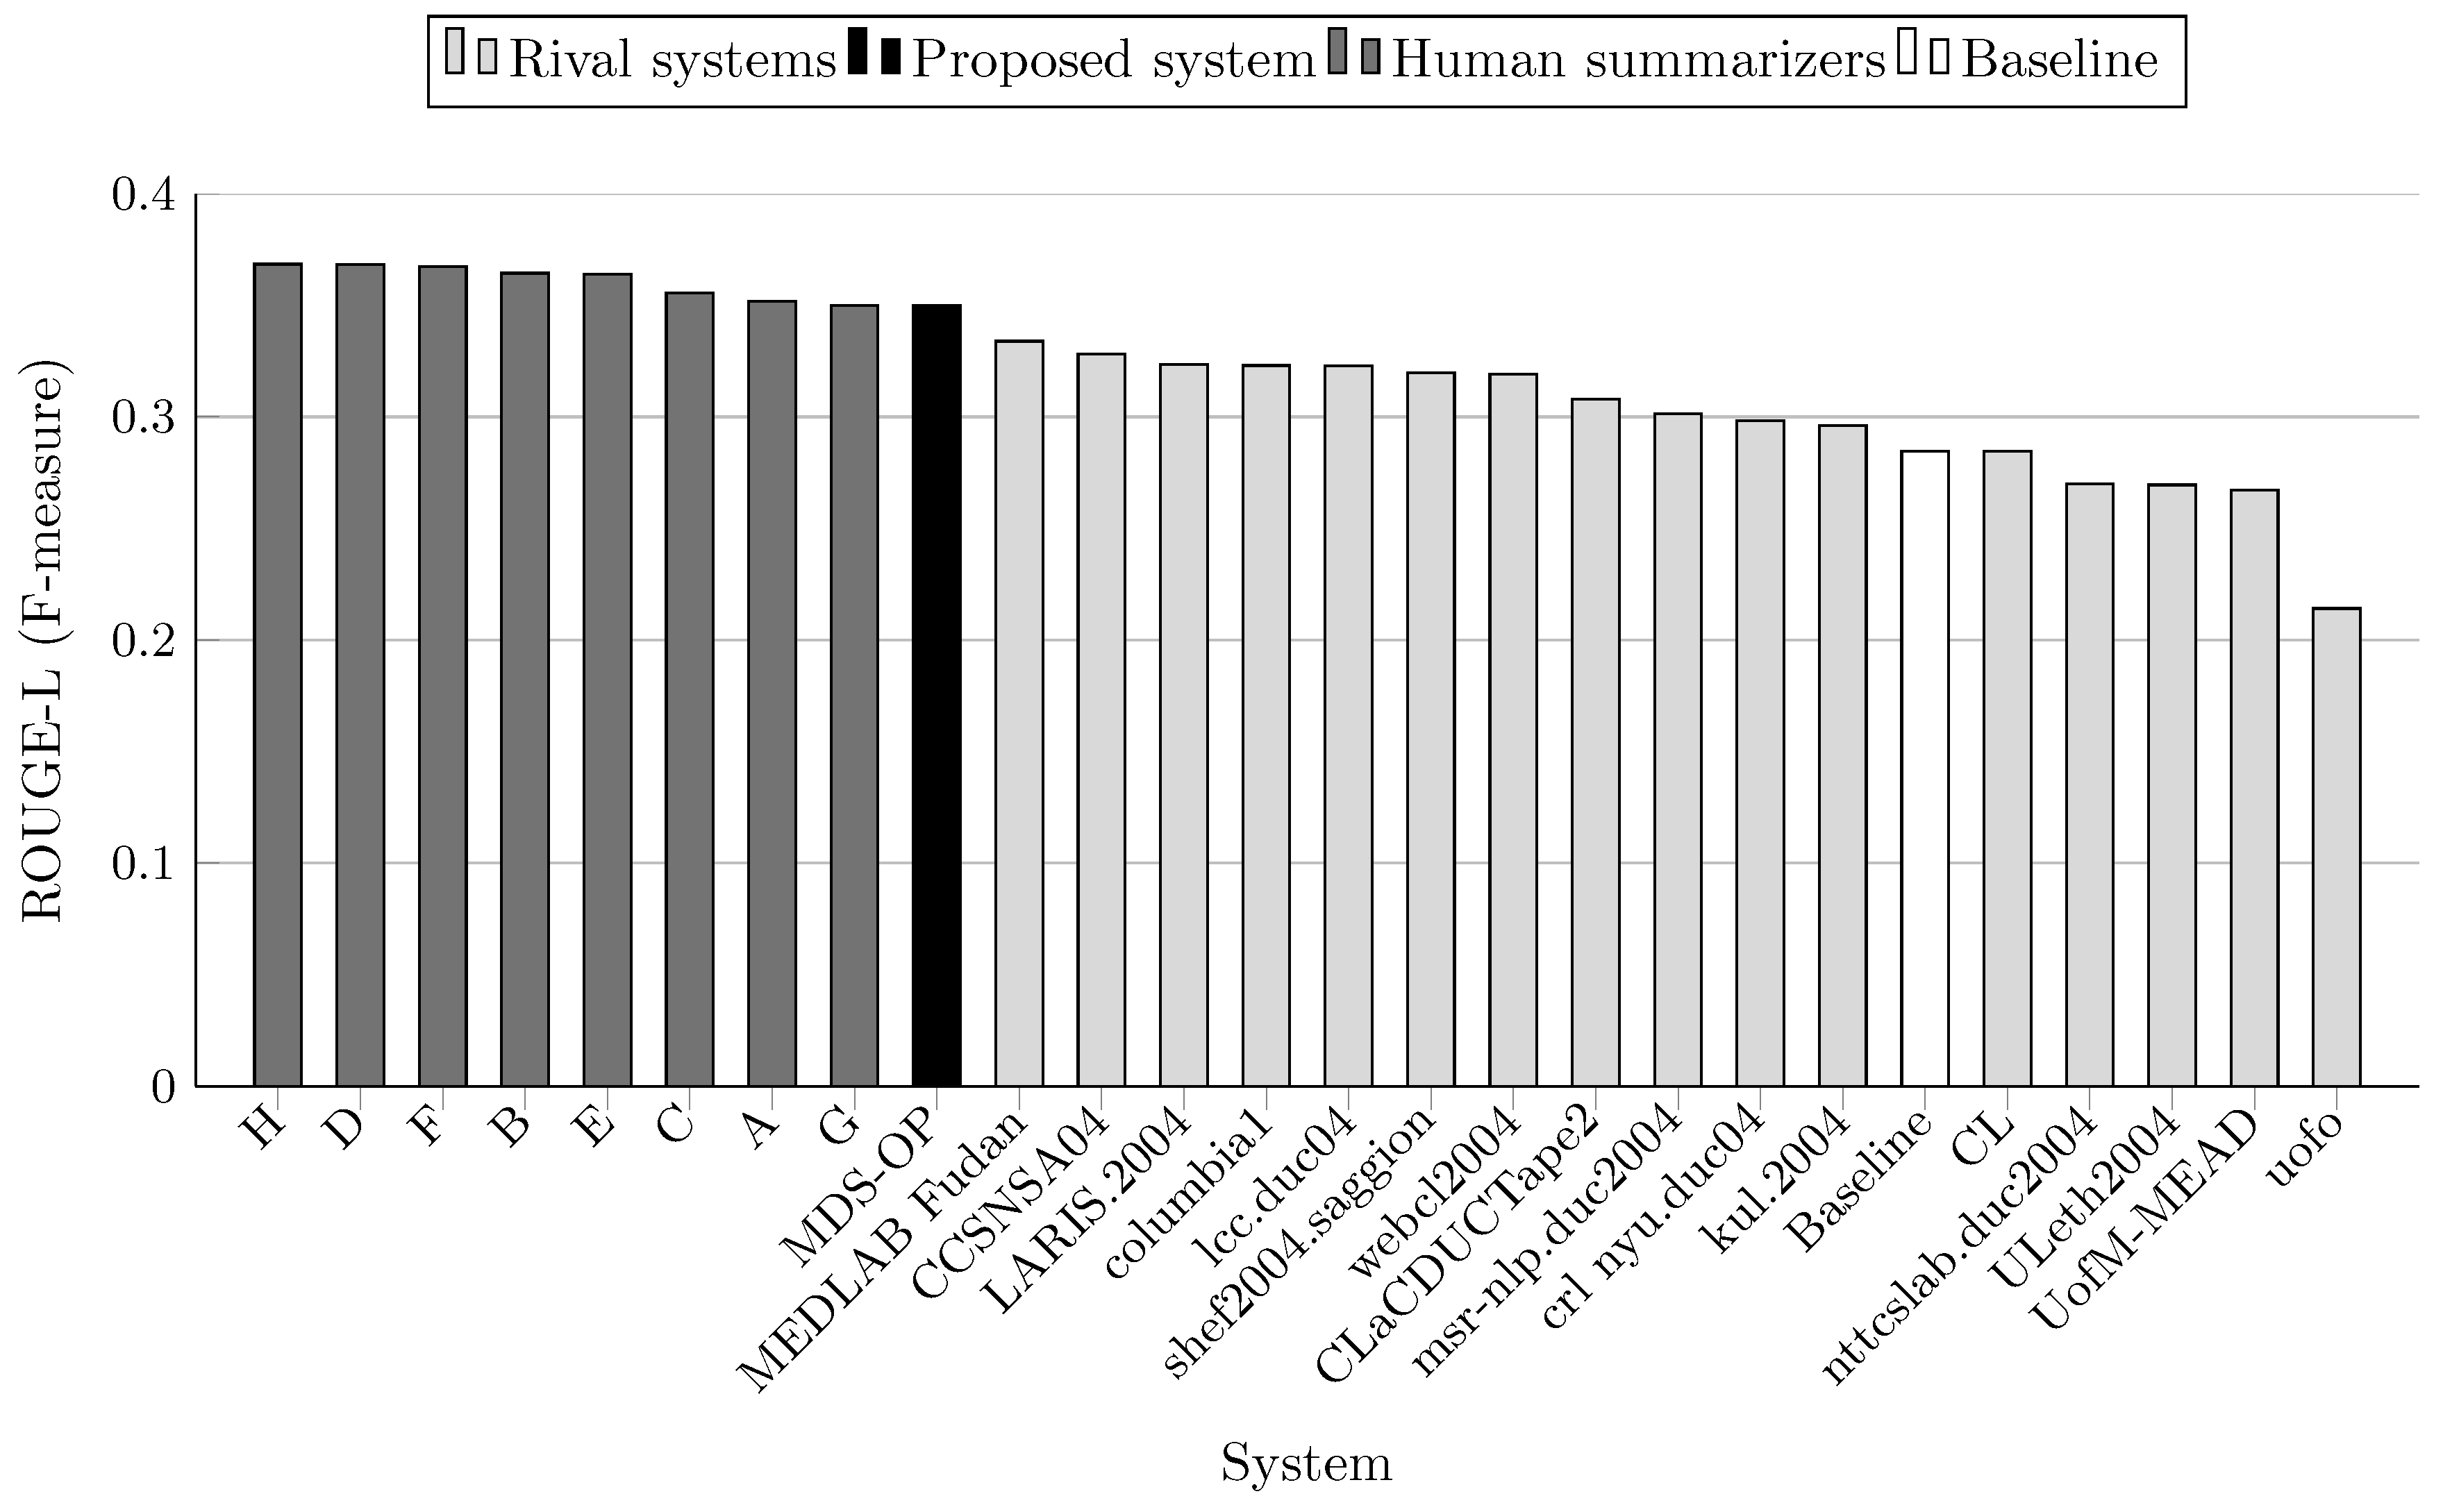
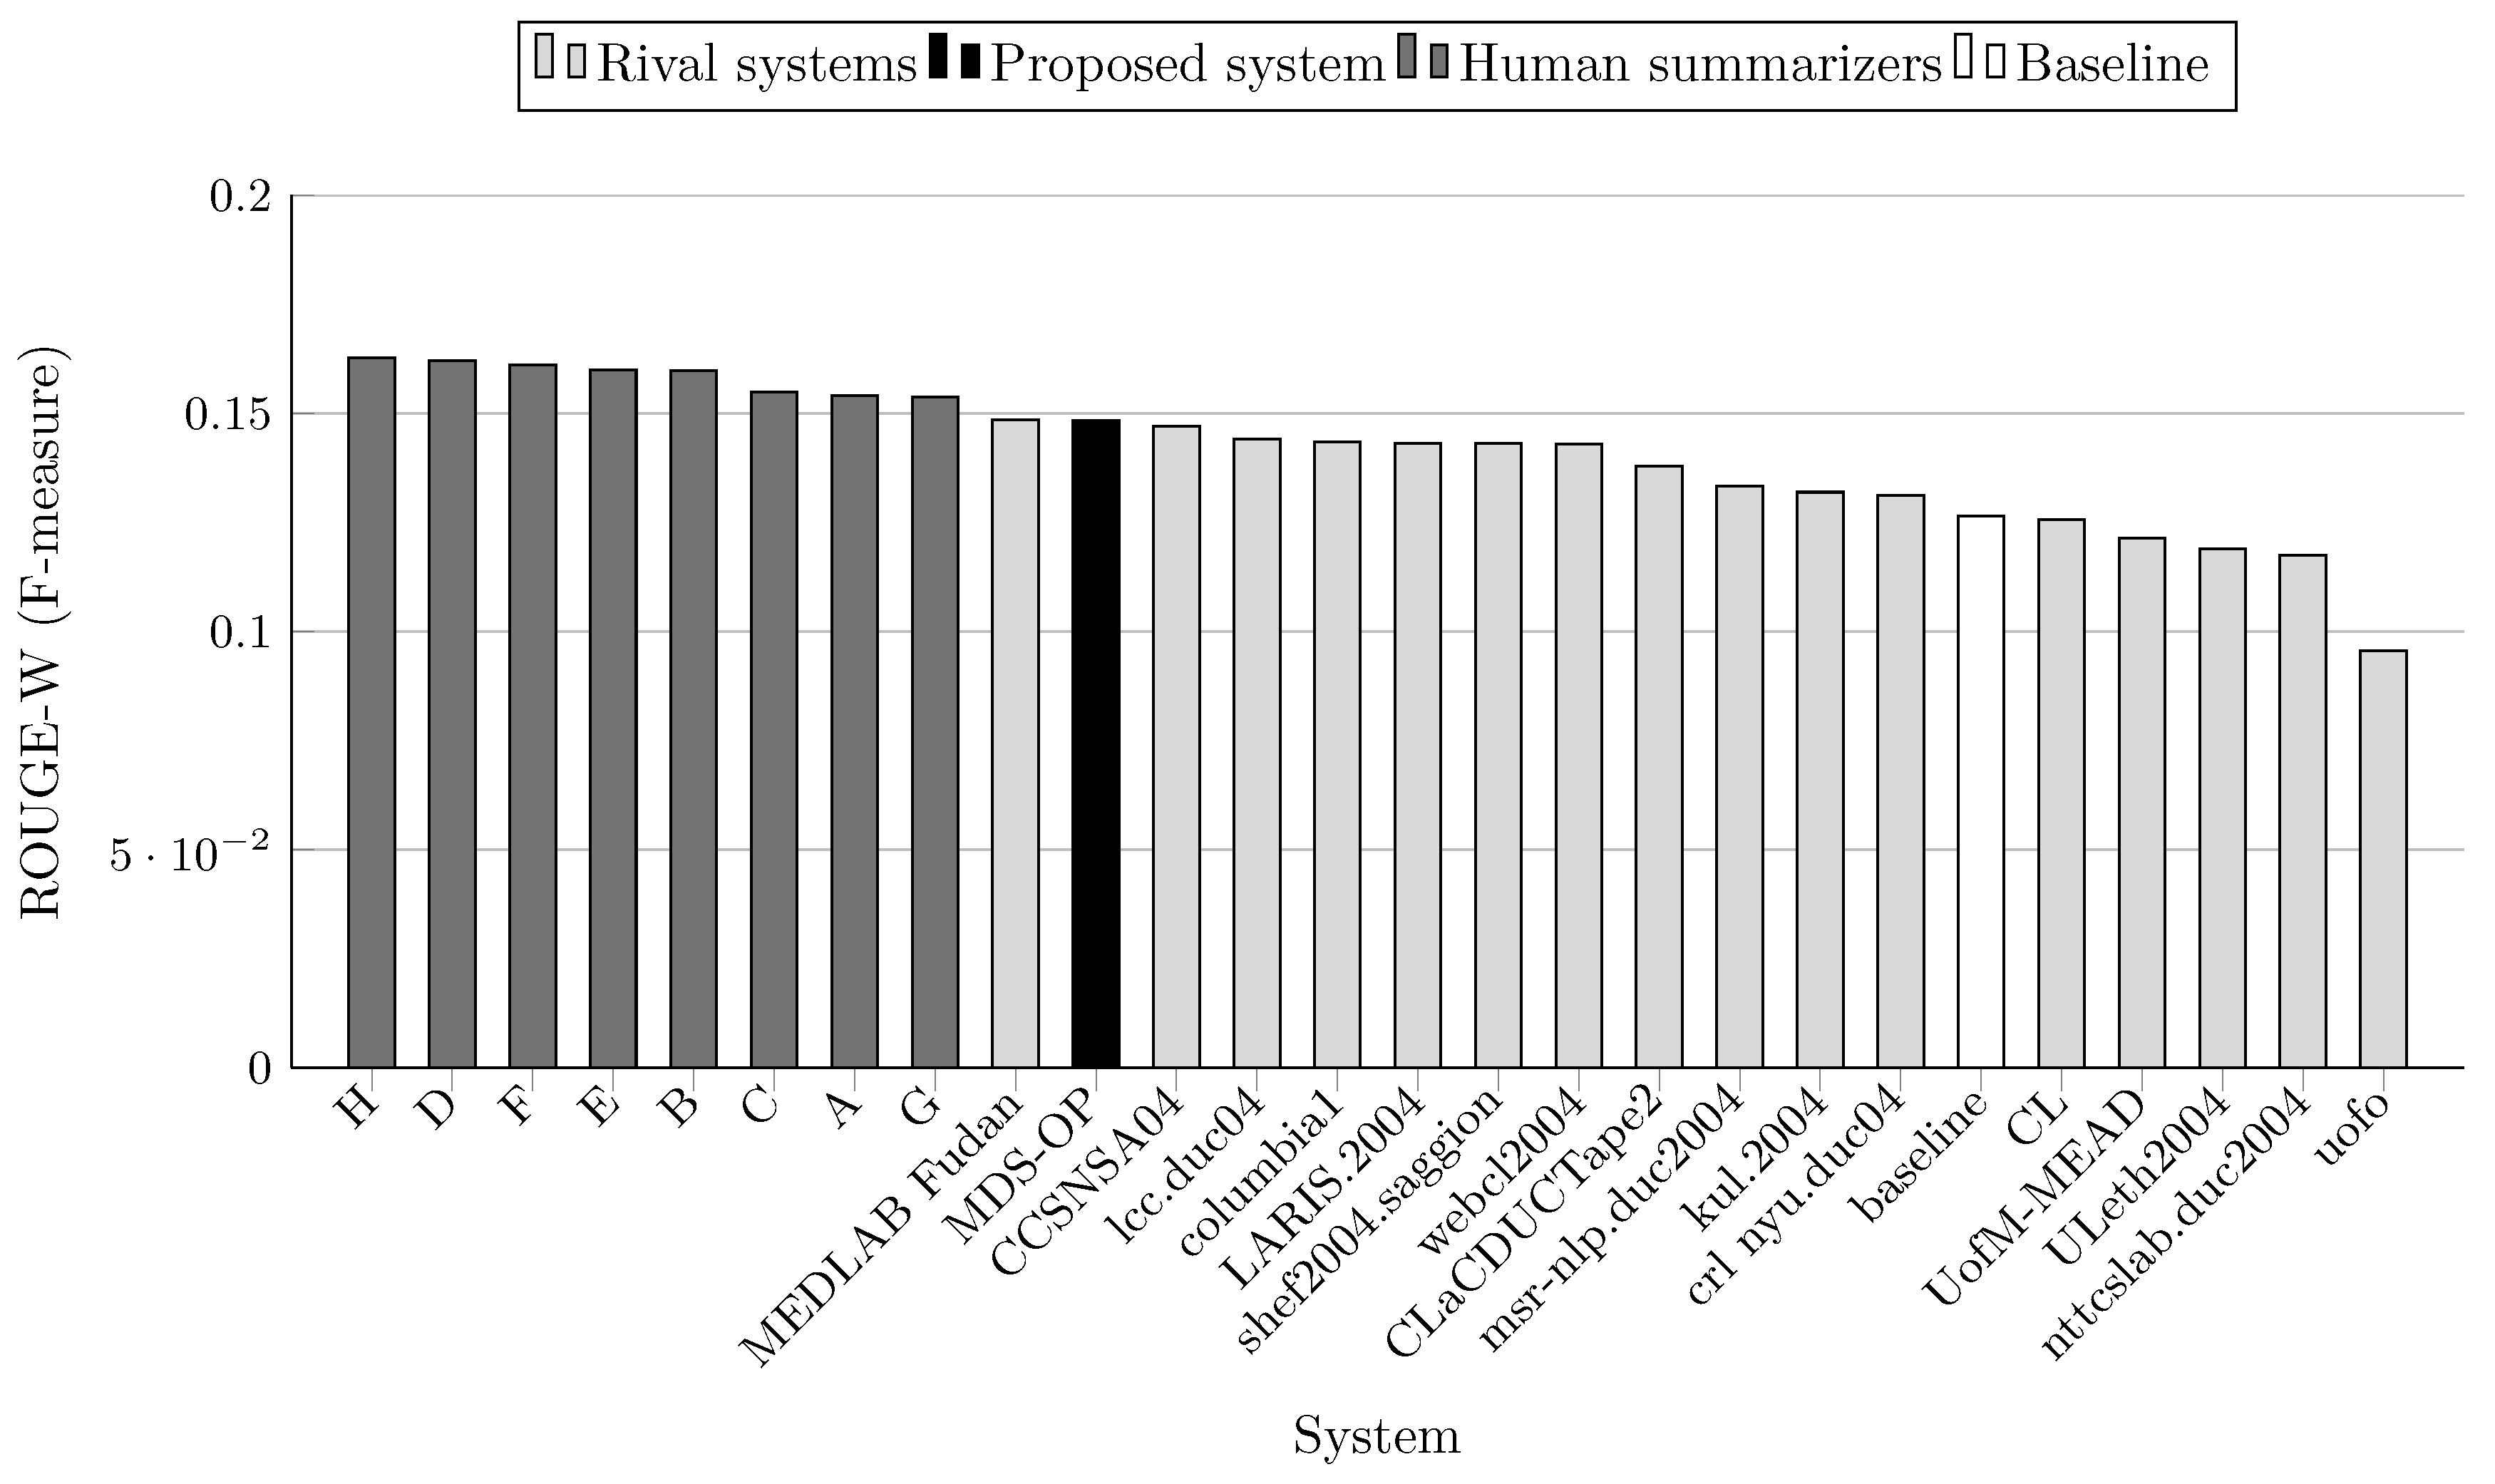
MDS-OP achieved the best ROUGE-1 and ROUGE-L scores in comparison to the 16 participated systems and a baseline system (Figure 3 and Figure 7). It obtained the second best ROUGE-2 and ROUGE-W-1.2 scores (Figure 4 and Figure 8), and the third best ROUGE-3 and ROUGE-4 scores (Figure 5 and Figure 6). Figure 4, Figure 5 and Figure 6 show that CCSNSA04 is the top ranked system based on ROUGE-2, ROUGE-3, and ROUGE-4 metrics. Figure 8 show that MEDLAB_Fudan is the top ranked system in regard to ROUGE-W. The relative improvements of MDS-OP over the systems CCSNSA04 and MEDLAB_Fudan are 1.78% (ROUGE-1) and 0.14% (ROUGE-L), respectively. The average improvements of MDS-OP over all the other systems are 14.06% (ROUGE-1) and 13.56% (ROUGE-L). An ANOVA test (p-value = 0.5) was performed on MDS-OP and the other participated systems, and MDS-OP significantly outperformed eight systems in terms of ROUGE-1, five systems in terms of ROUGE-2, five systems in terms of ROUGE-3, three systems in terms of ROUGE-4, nine systems in terms of ROUGE-L, and eight systems in terms of ROUGE-W. Finally, although MDS-OP was outperformed by CCSNSA04 (ROUGE-2, ROUGE-3, and ROUGE-4), MEDLAB_Fudan (ROUGE-W), and crl_nyu.duc04 (ROUGE-3 and ROUGE-4), there were no statistically significant differences between these systems and MDS-OP.
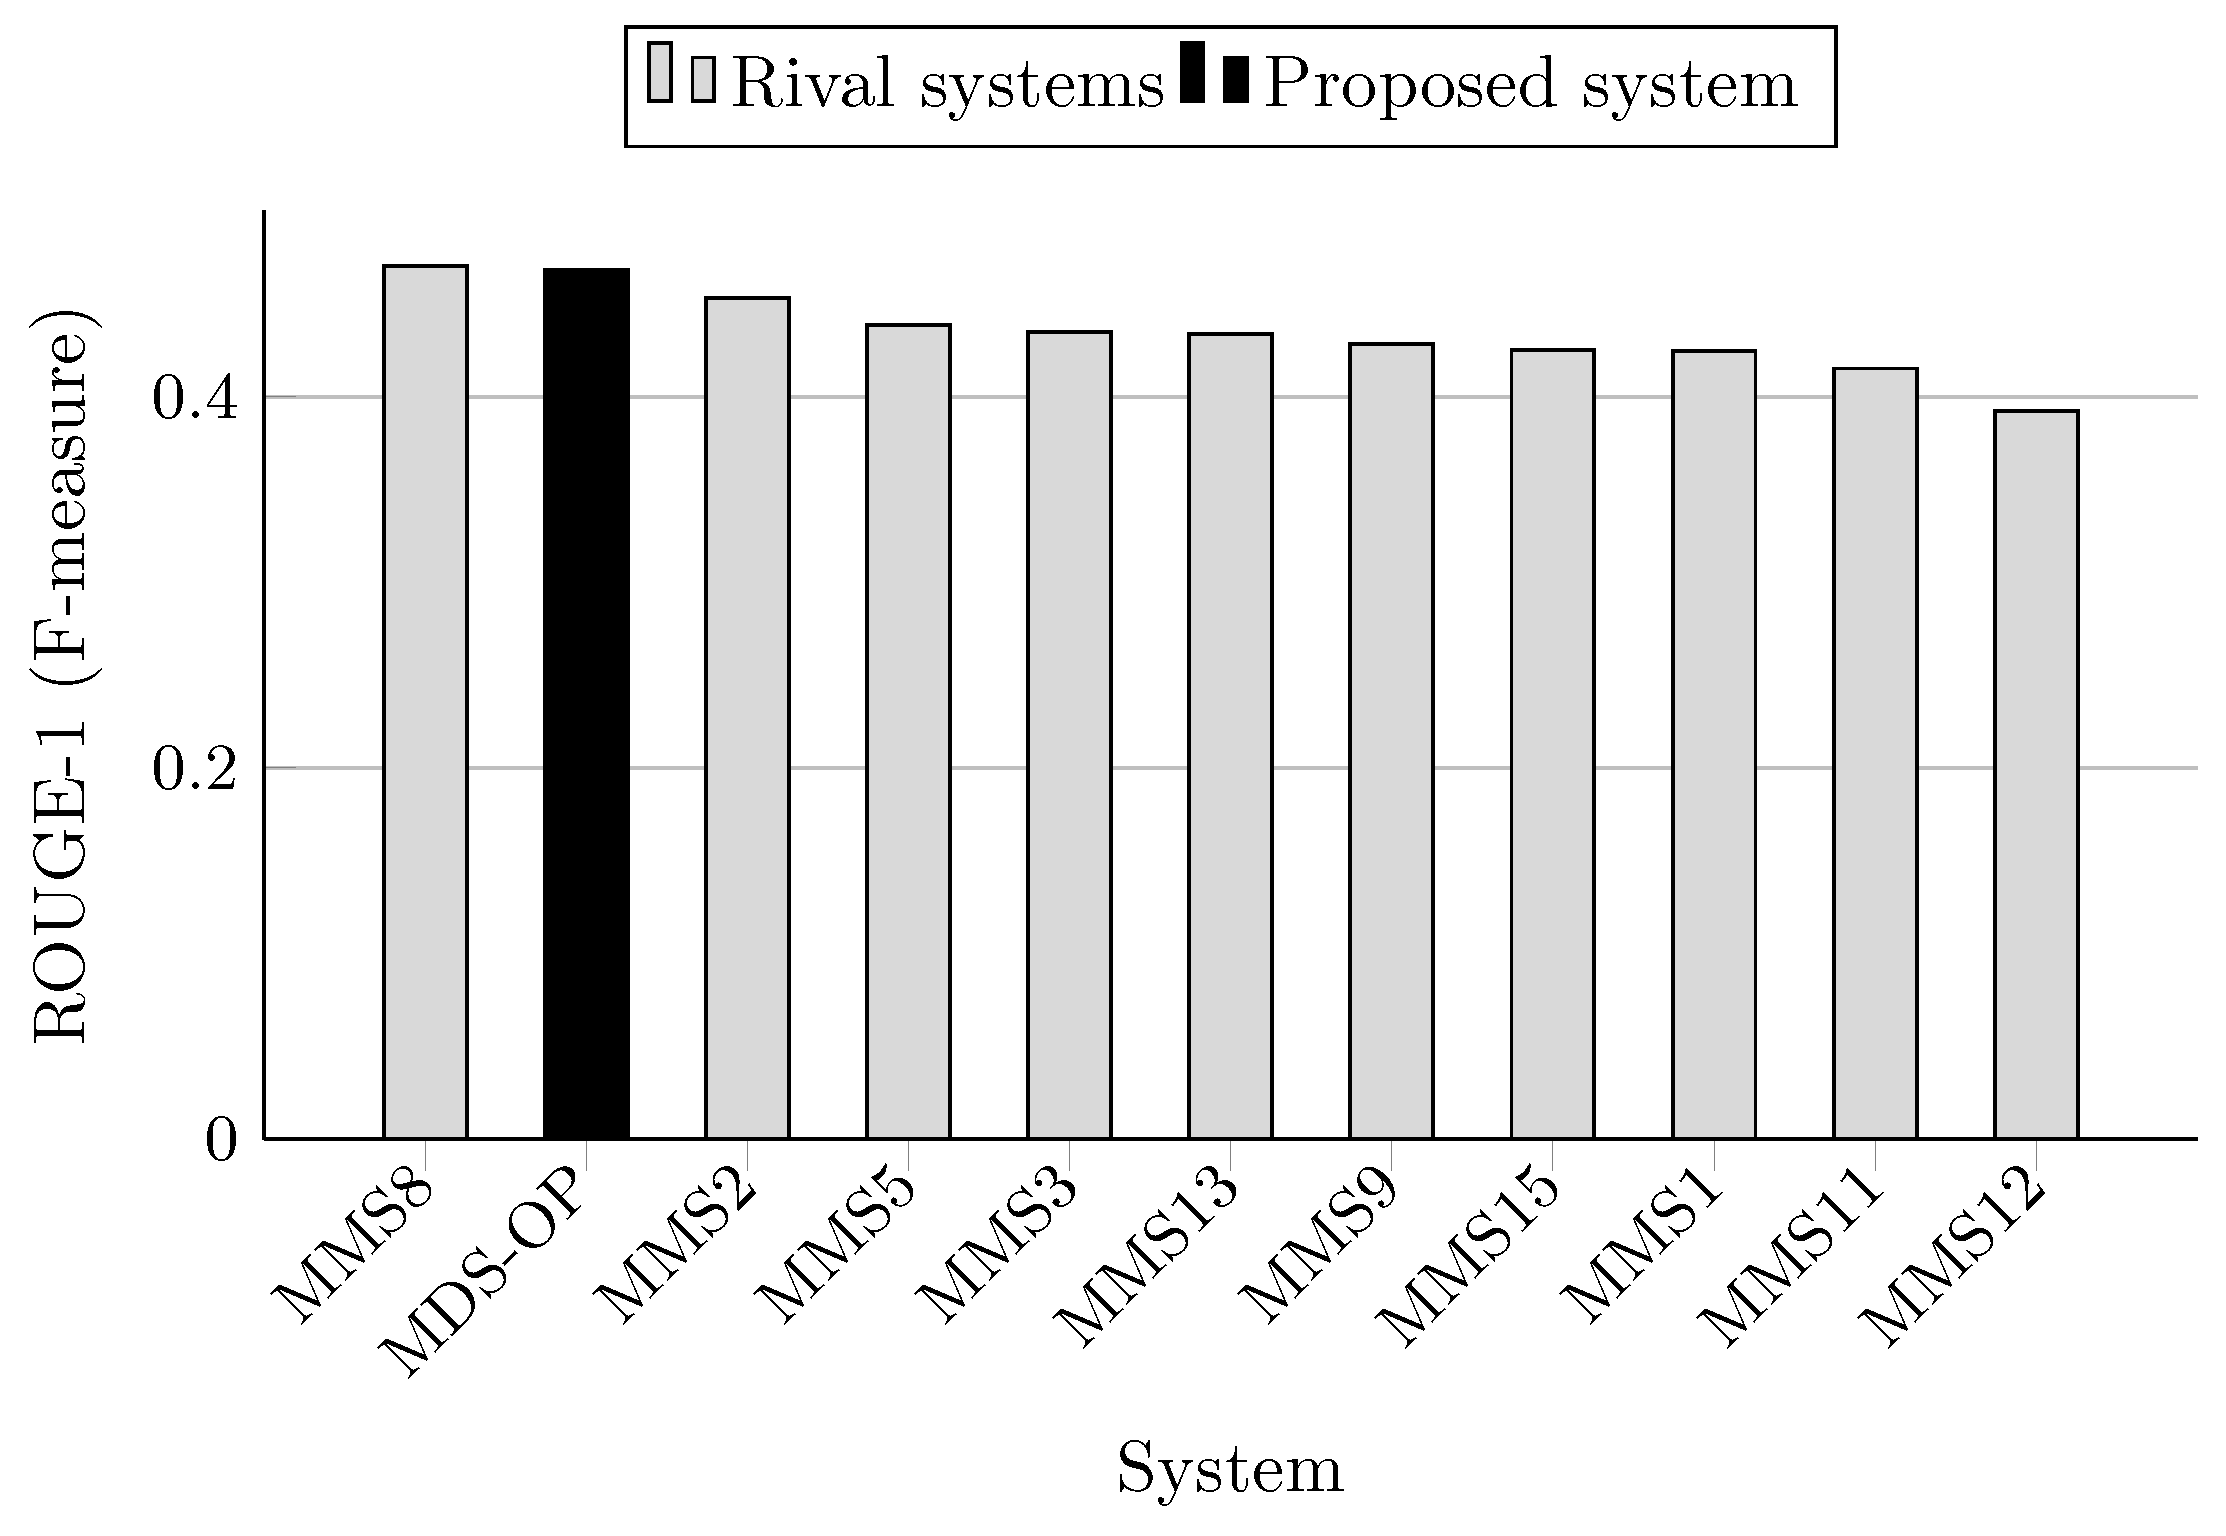
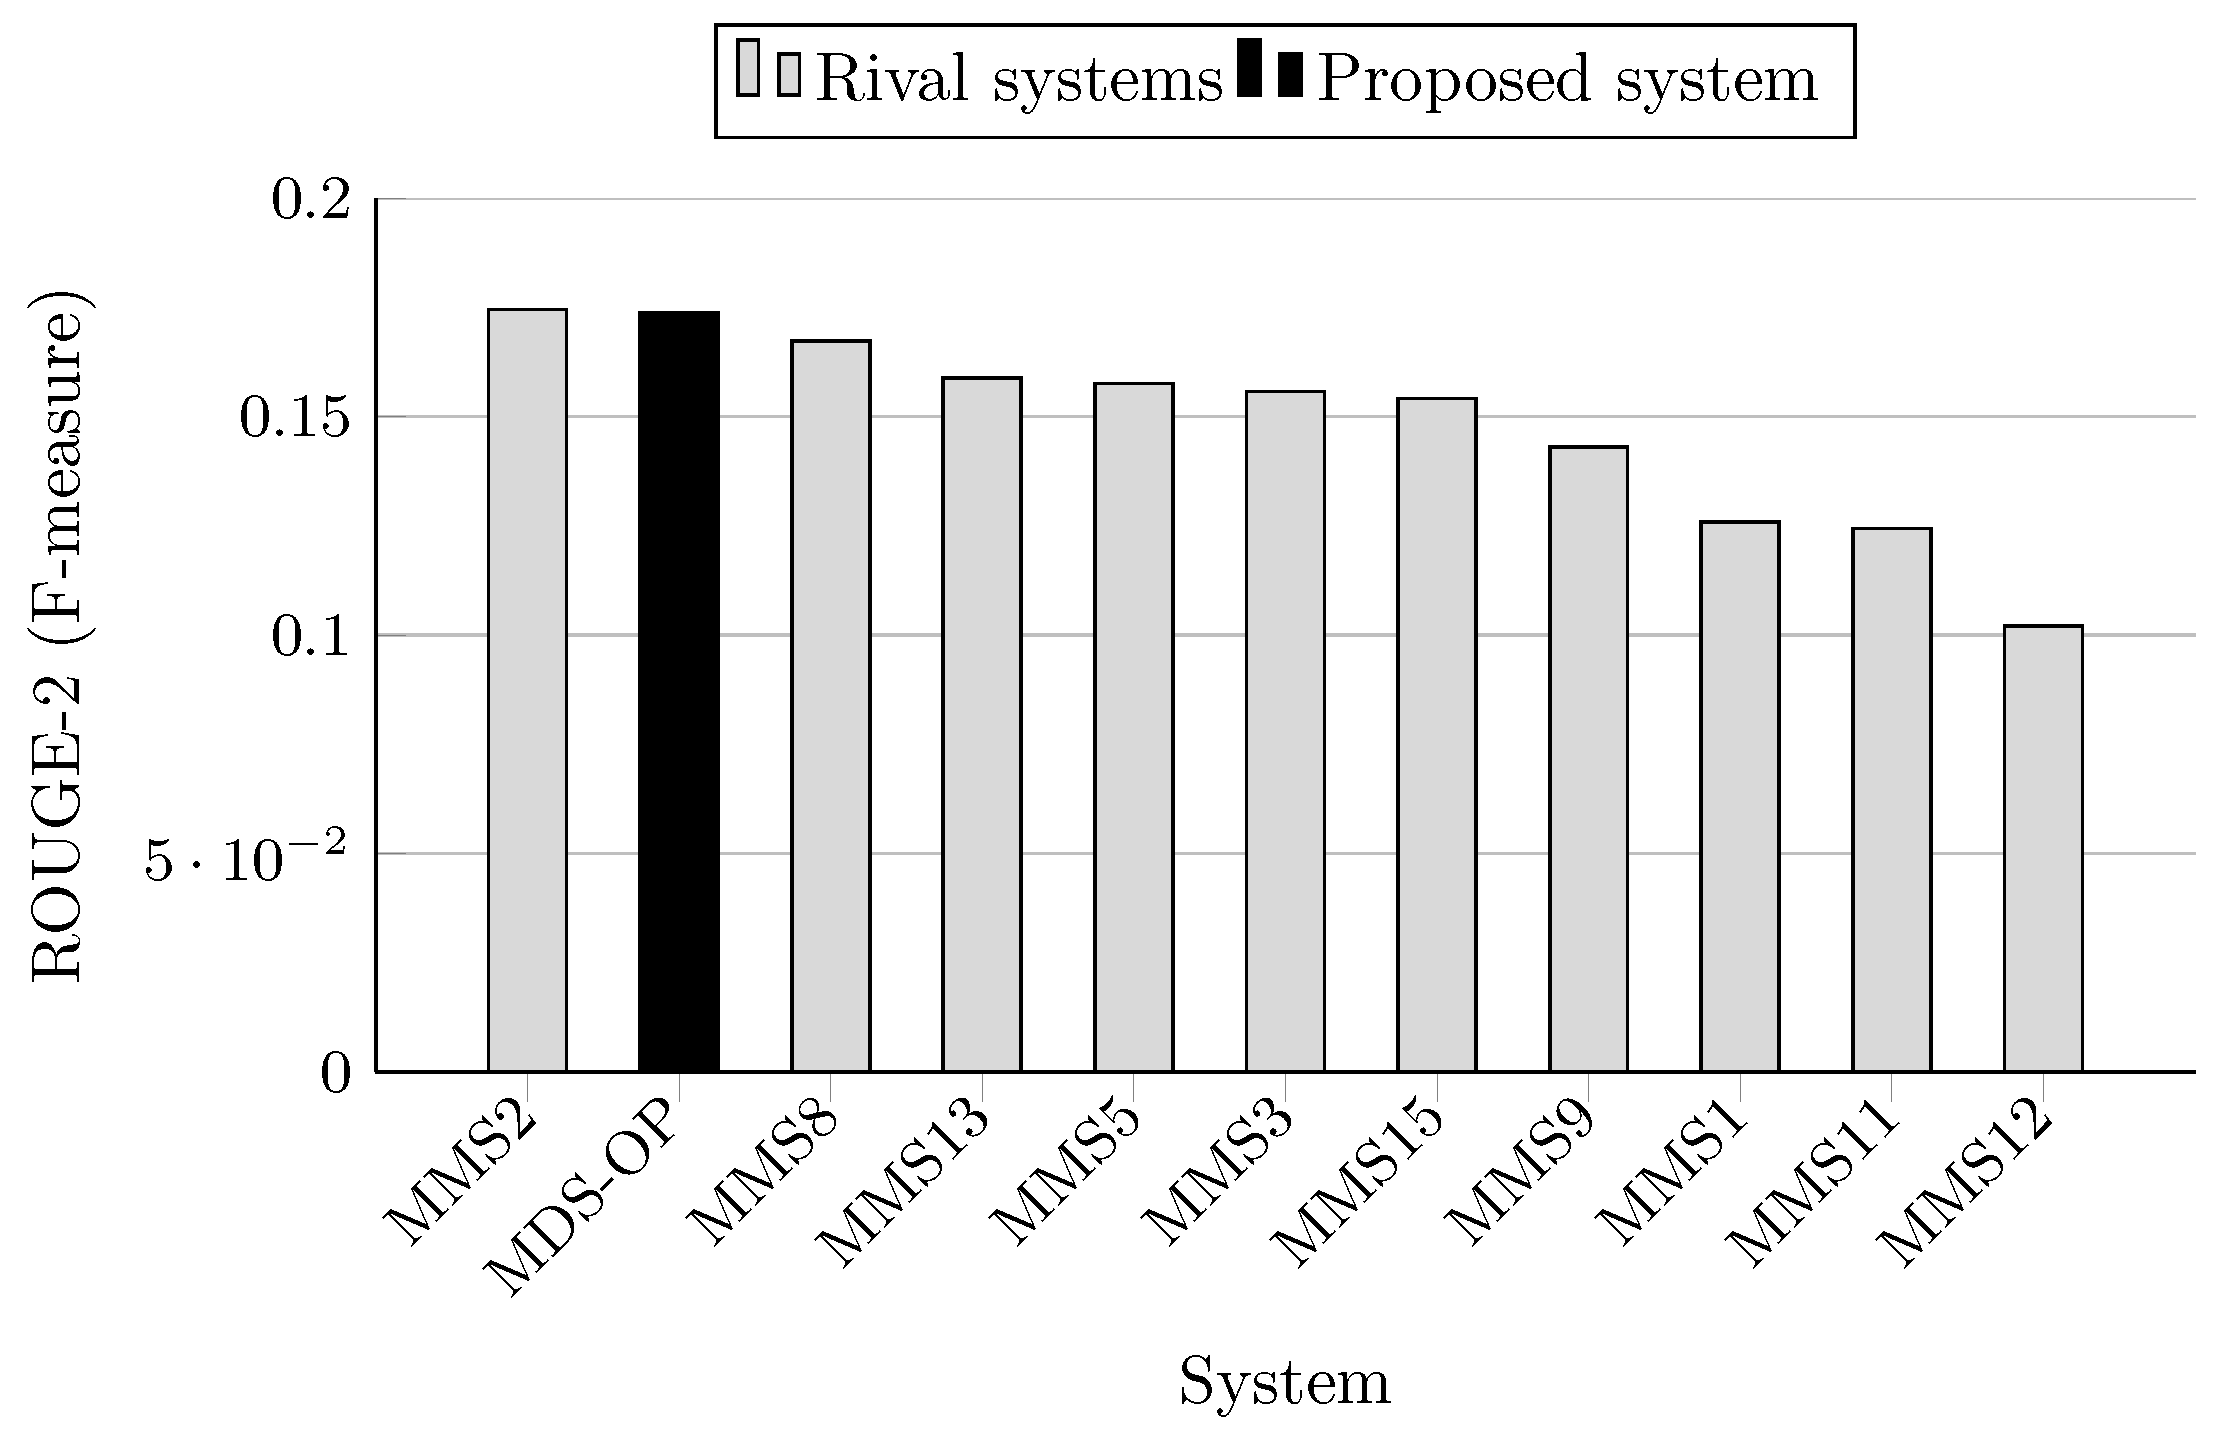
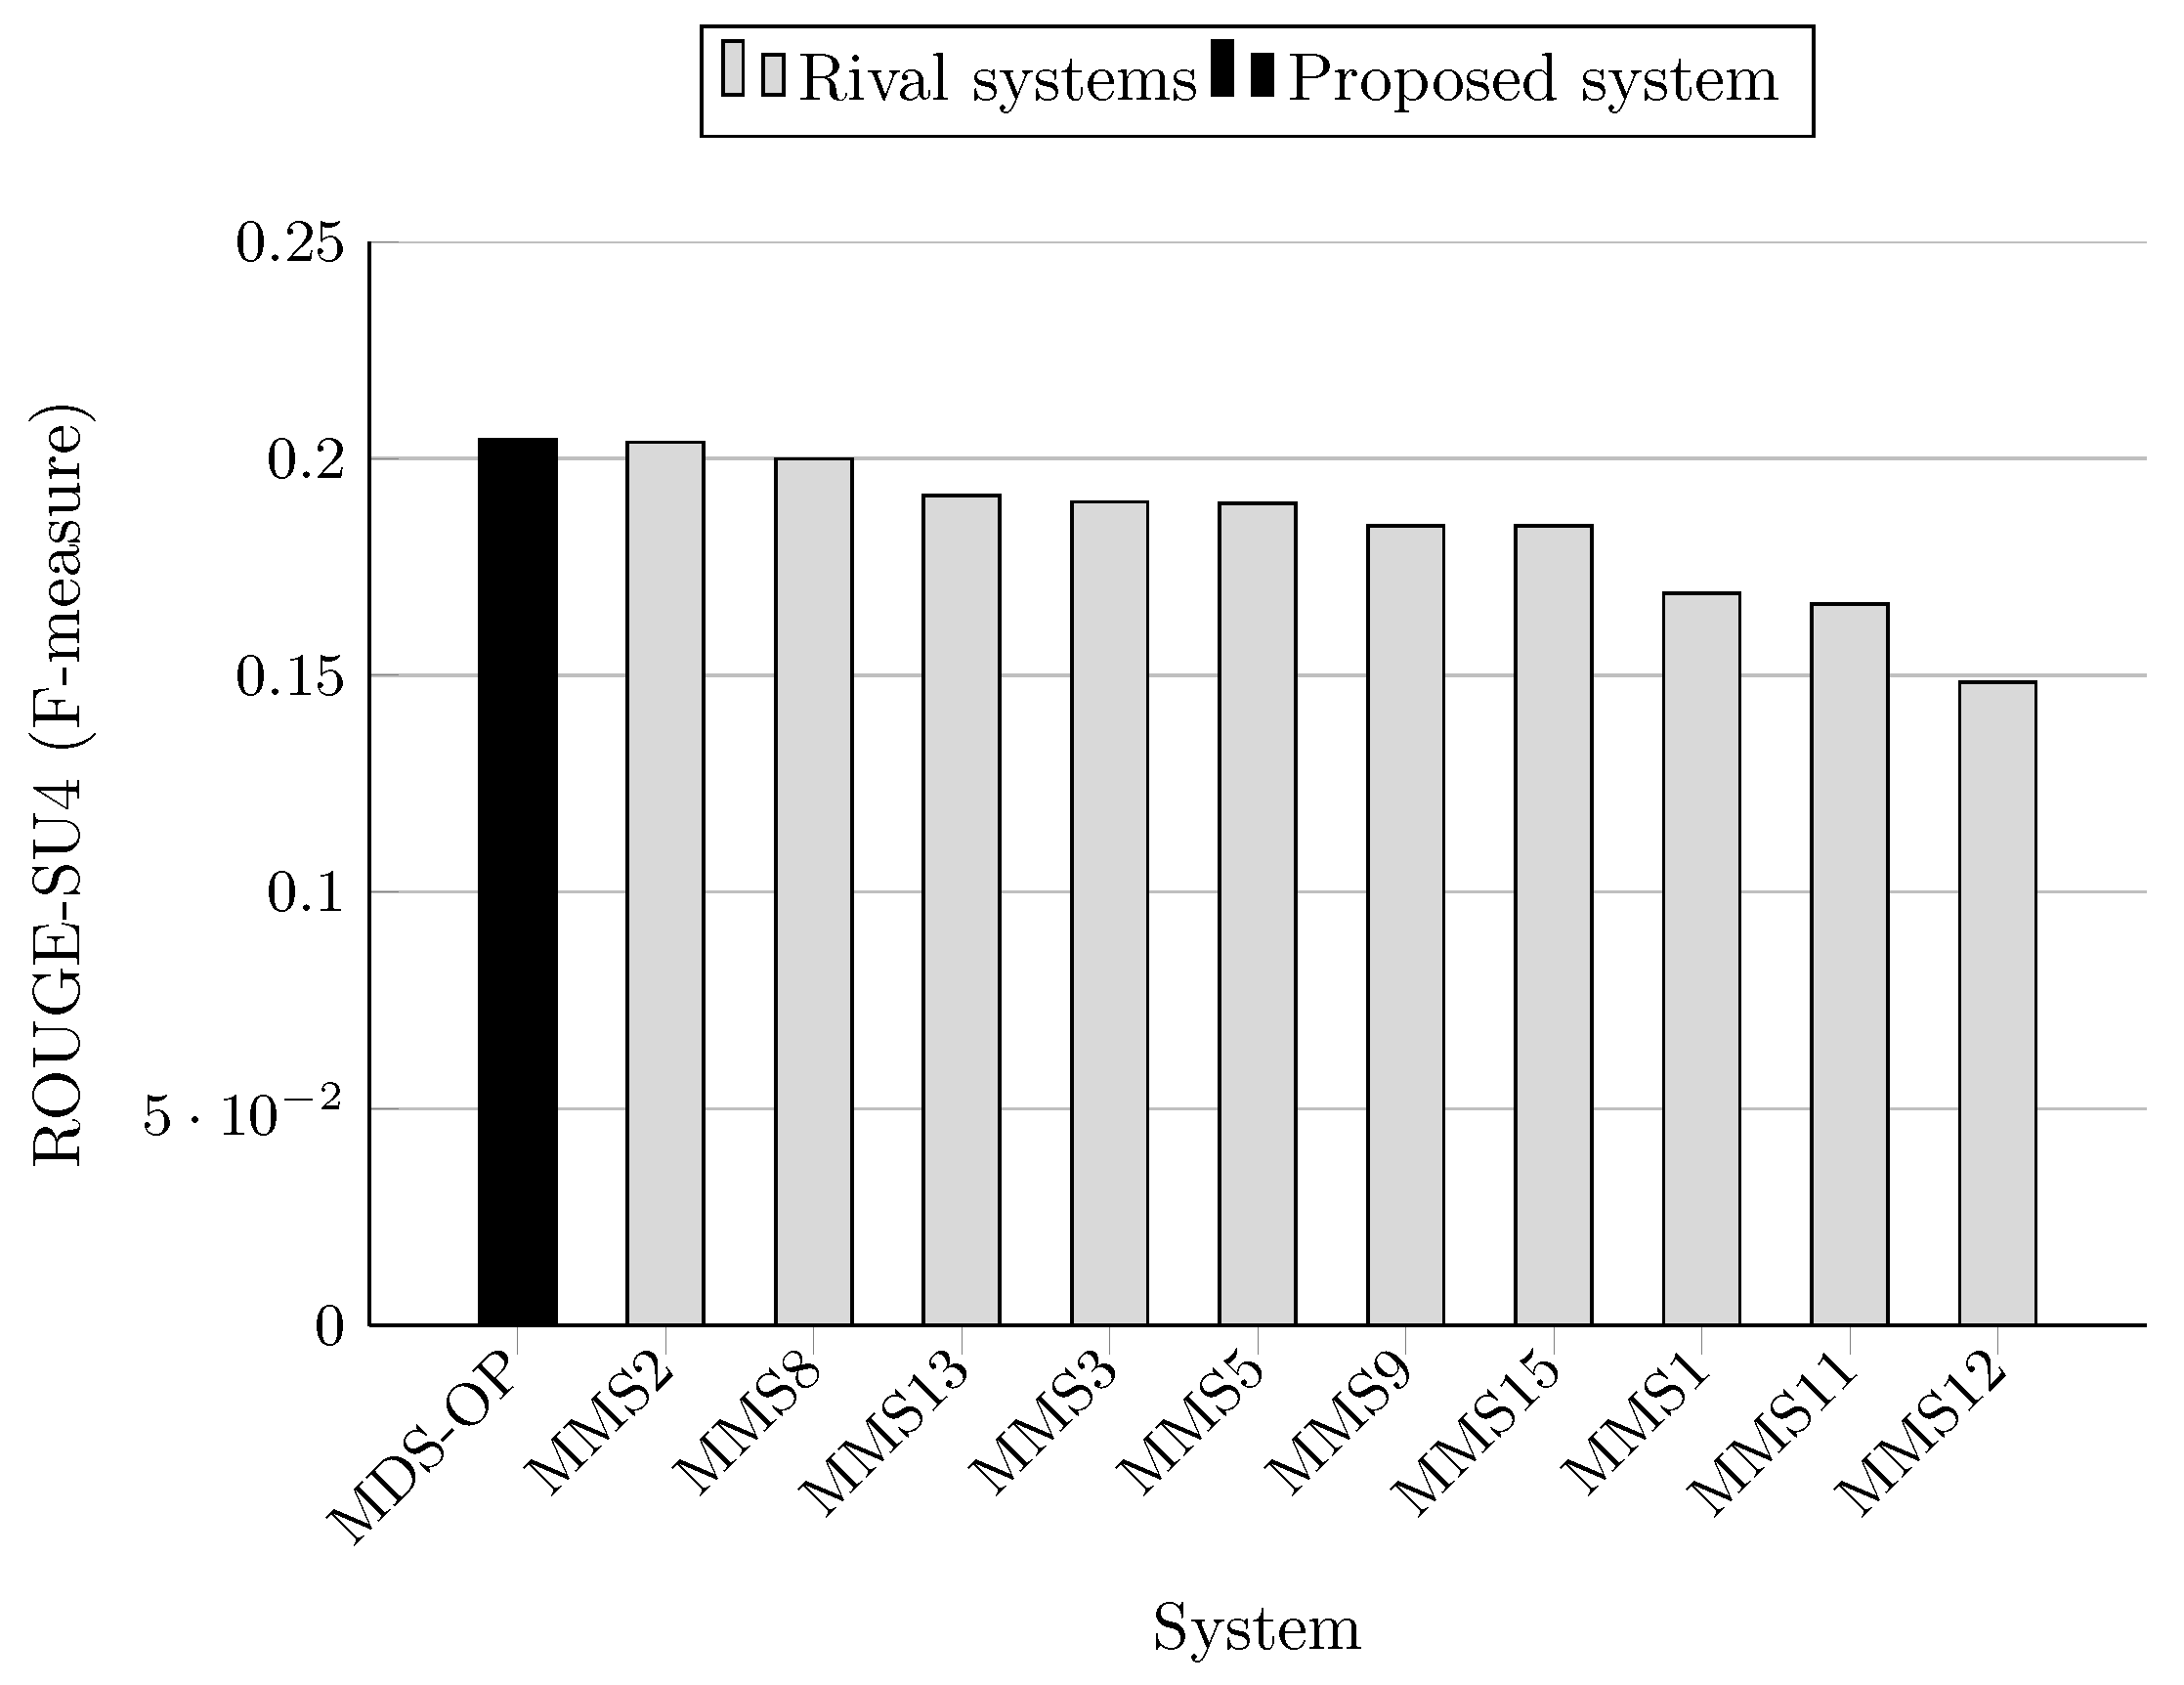
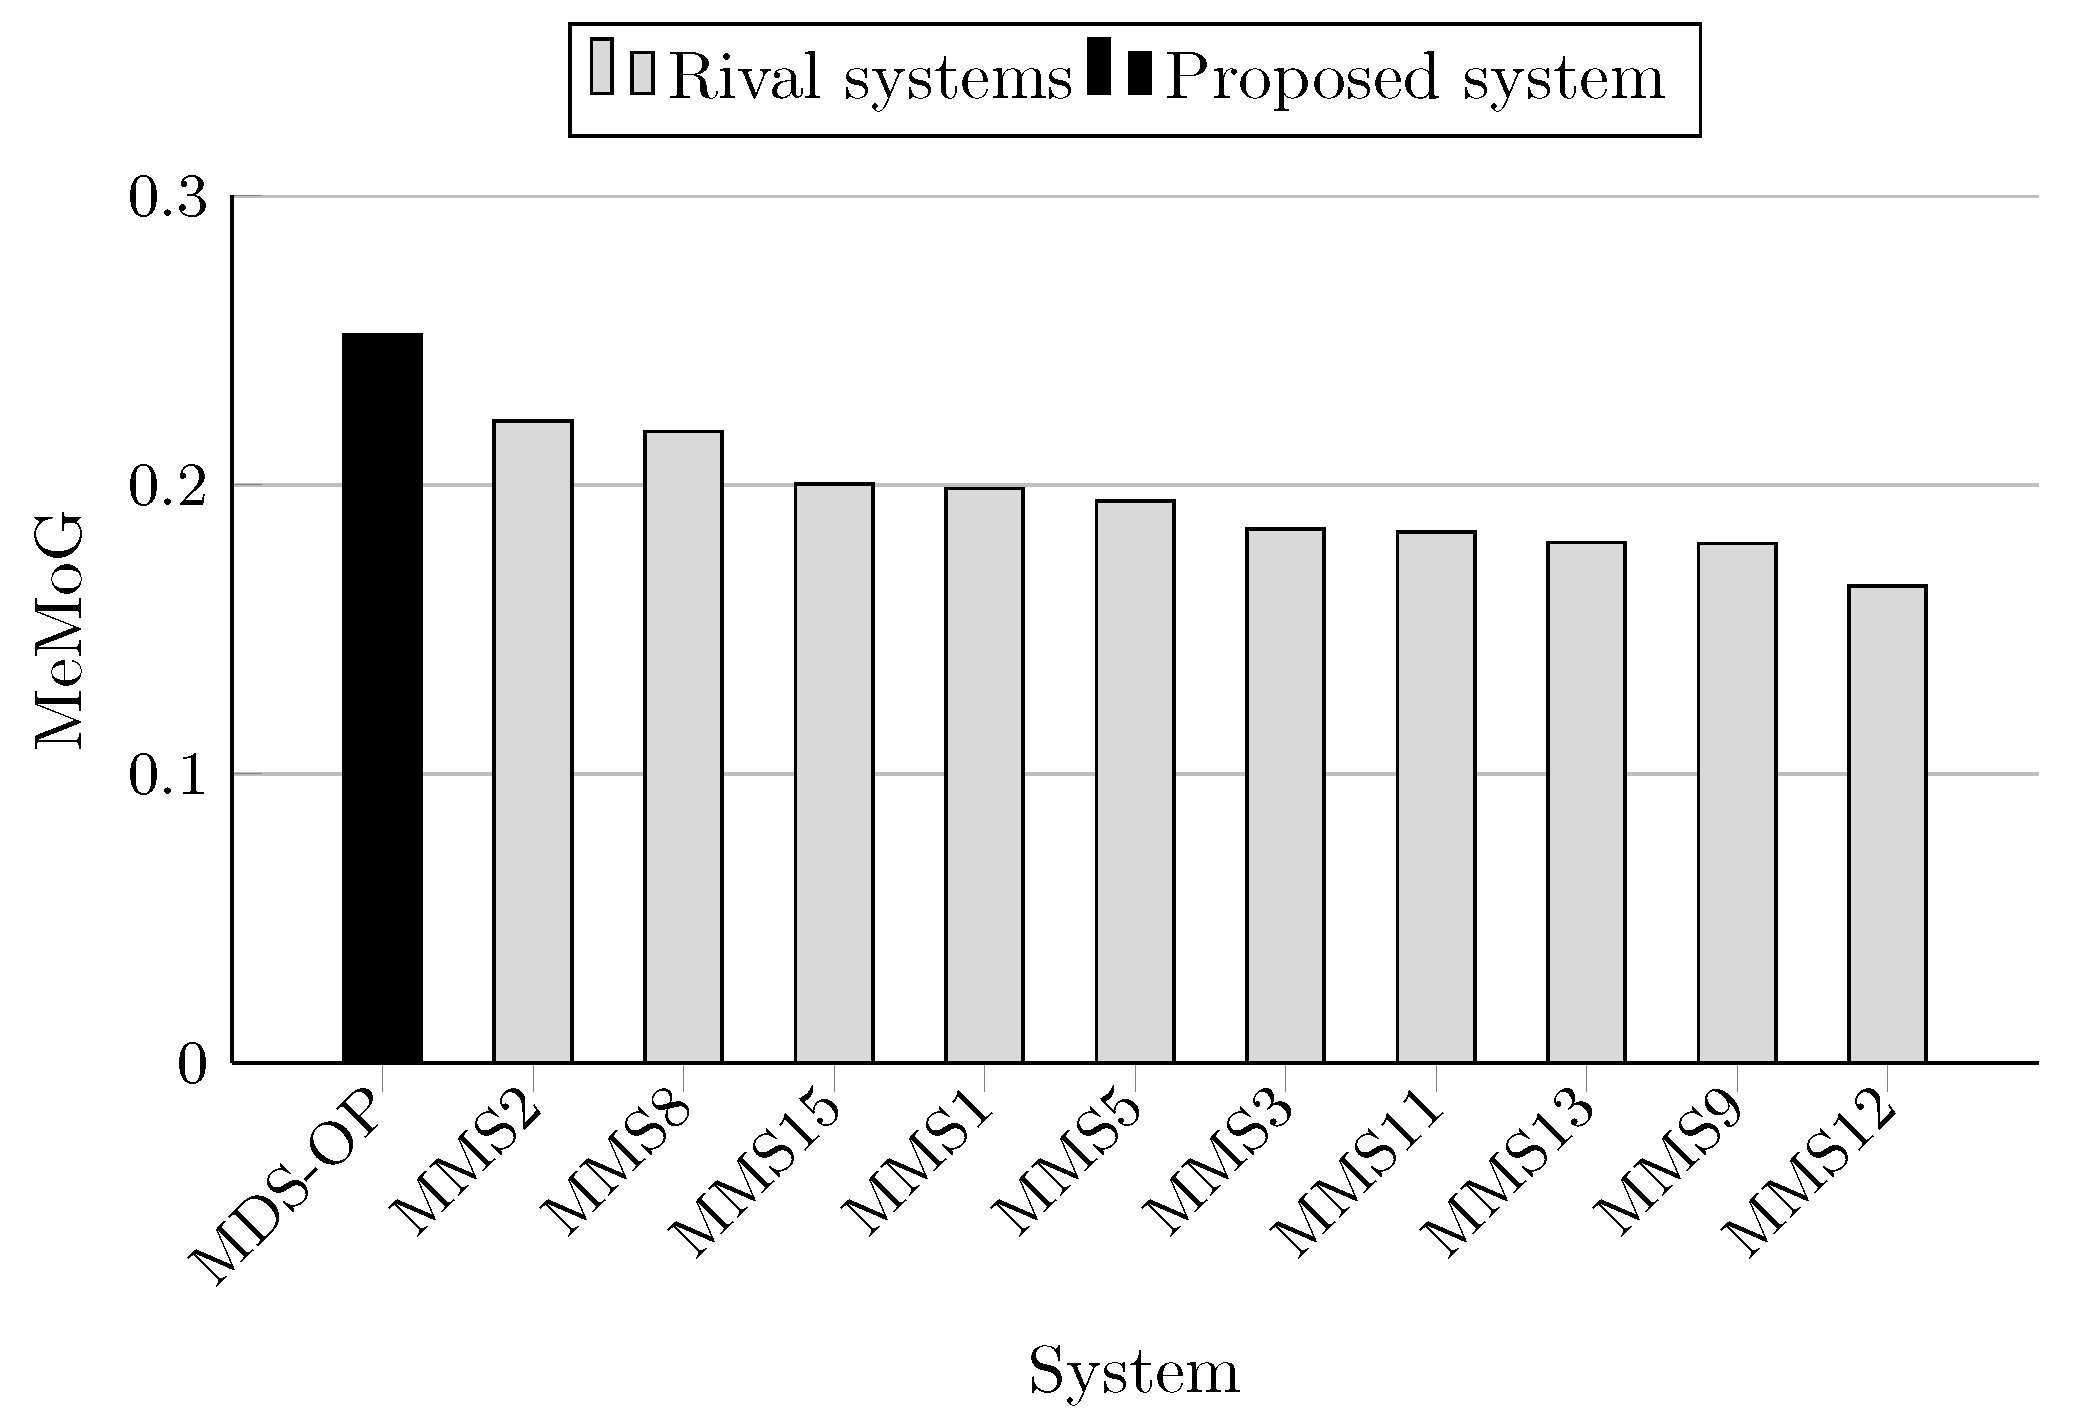
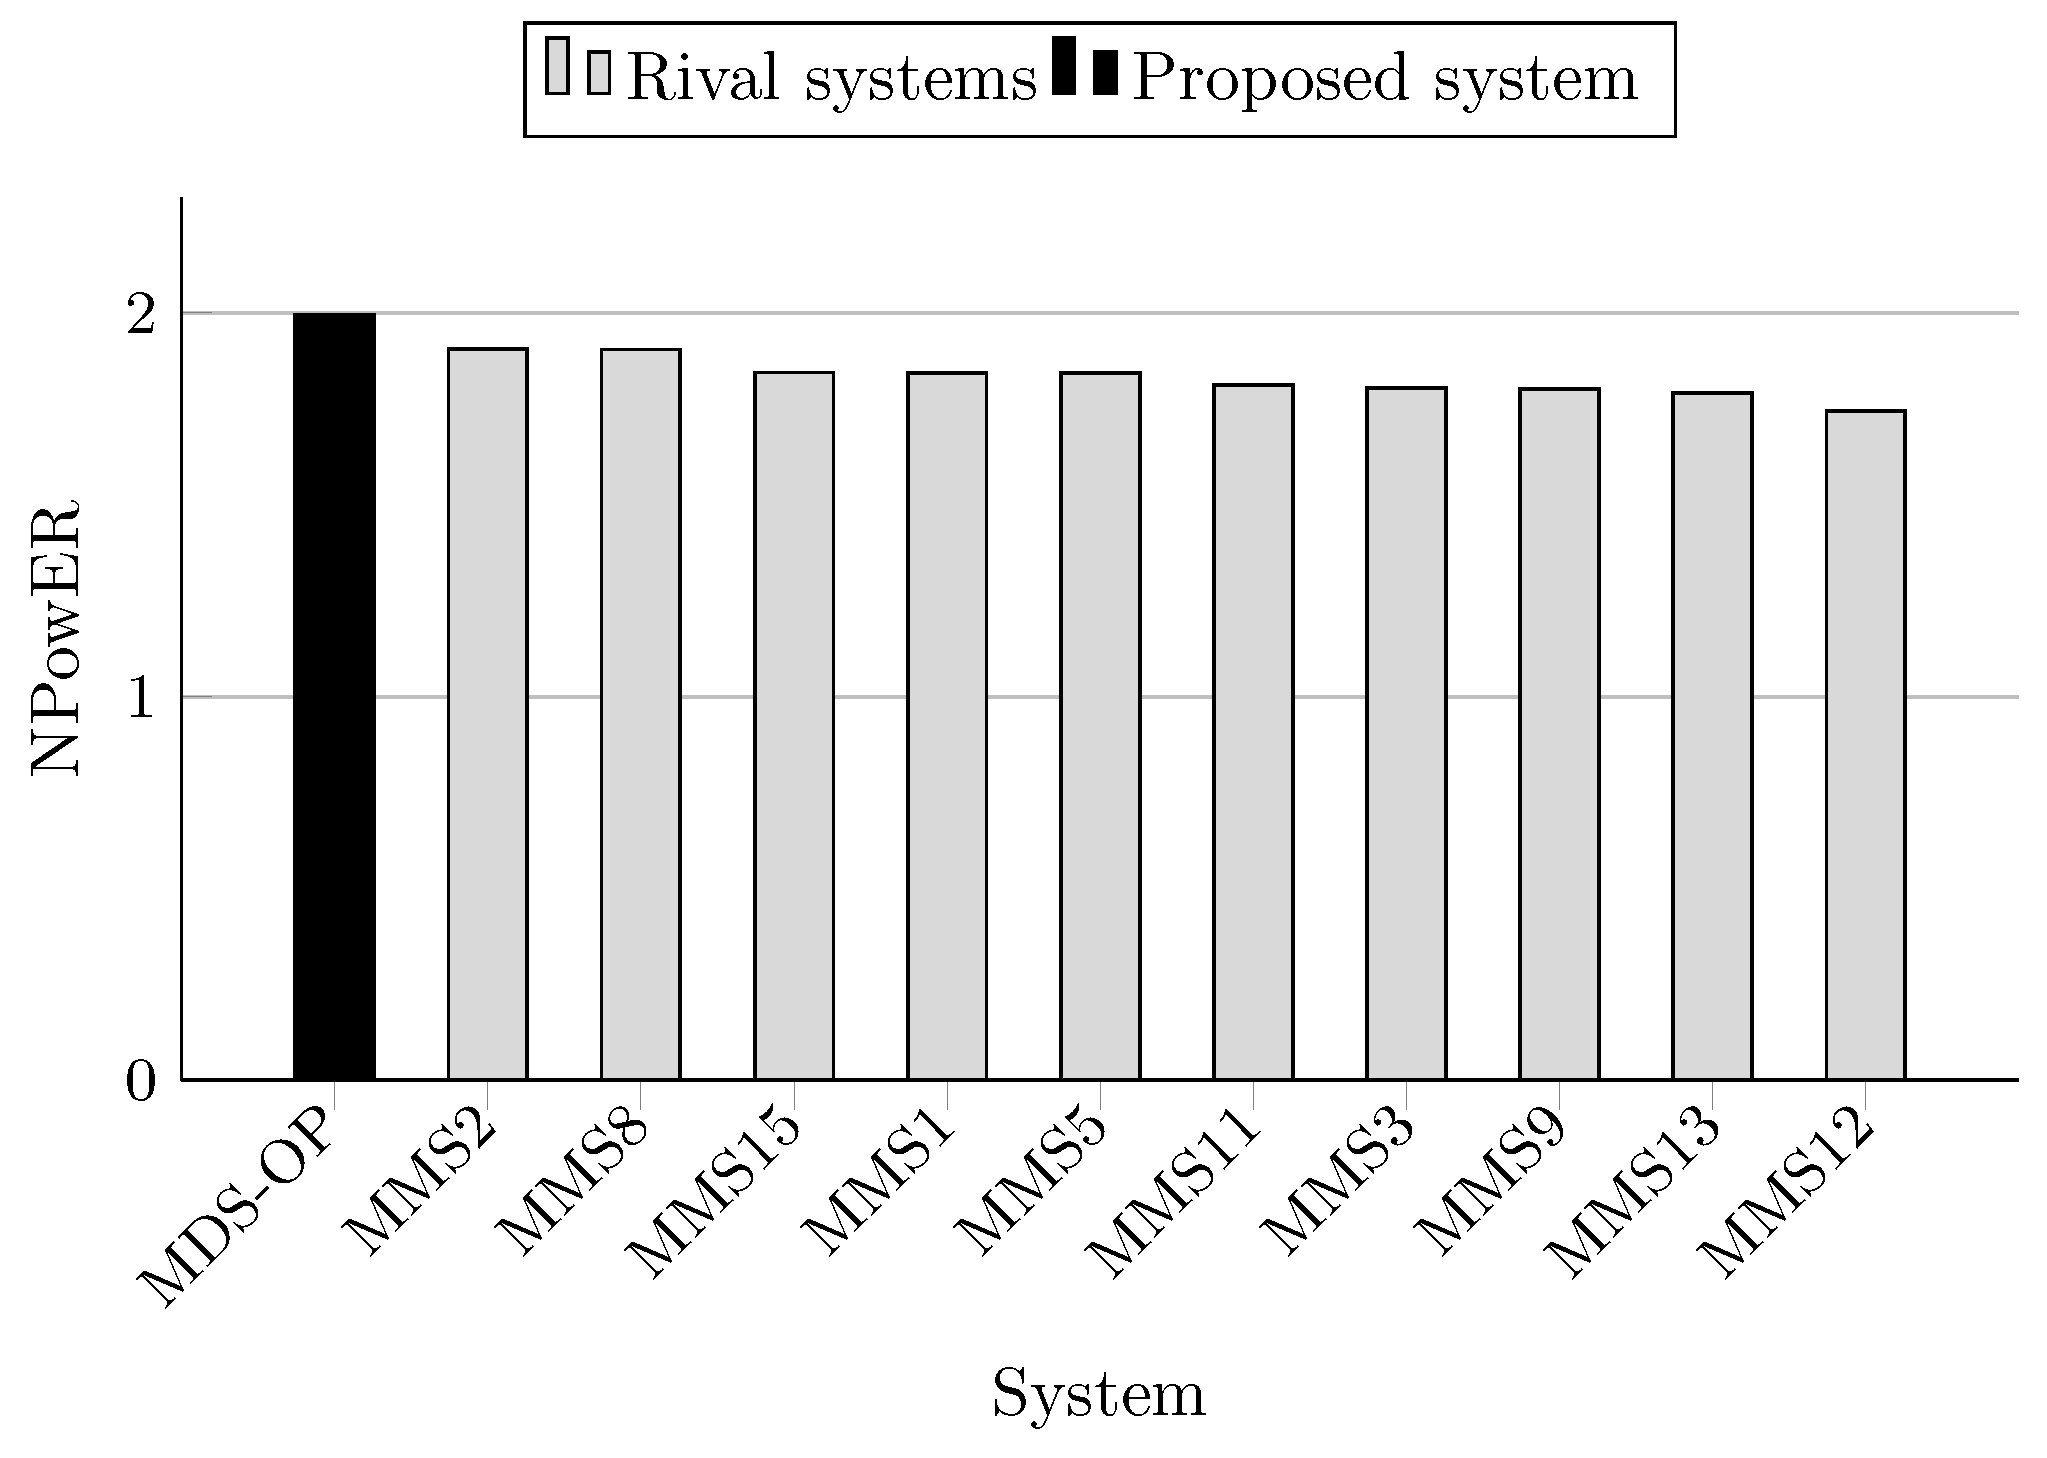
The F-measure scores achieved by MDS-OP and those of the 10 participated systems on MultiLing 2015 (MMS task) are presented in Table 5 in terms of ROUGE-1 (R-1), ROUGE-2 (R-2), and ROUGE-SU4 (R-SU4), and in Table 6 in terms of the evaluation methods AutoSummENG, MeMoG, and NPowER. MDS-OP produced the best ROUGE-SU4 scores (Figure 11), and the second best ROUGE-1 and ROUGE-2 scores (Figure 9 and Figure 10). The systems MMS8 and MMS2 are the top ranked in regard to ROUGE-1 and ROUGE-2, respectively. The relative improvements of MDS-OP over MMS2 and MMS8 in terms of ROUGE-SU4 are 0.3% and 2.22%, respectively . Moreover, MDS-OP outperformed all the other systems based on the evaluation methods AutoSummENG (Figure 12), MeMoG (Figure 13), and NPowER (Figure 14). It outperformed MMS8 (an improvement of 12.05% in terms of AutoSummENG) and MMS2 (an improvement of 13.56% in terms of MeMoG and an improvement of 4.66% in terms of NPowER). The average improvements of MDS-OP over all the other systems are 12.83% (ROUGE-SU4), 26.32% (AutoSummENG), 31.79% (MeMoG), and 9.07% (NPowER). ANOVA test was also conducted on the ROUGE results for this corpora, and it showed that MDS-OP significantly outperformed the systems MMS11 and MMS12 in terms of ROUGE-1 and the systems MMS1, MMS11, and MMS12 in terms of ROUGE-2 and ROUGE-SU4. Finally, in regard to the overall performance of MDS-OP on both corpora, the average ROUGE-1 and ROUGE-2 results are 0.42721 and 0.13084, respectively.
==
7. Conclusions
In this paper, we proposed to solve the extractive MDS problem by encoding it as an OP, and approximate its solution by an ACS meta-heuristic. The implemented system MDS-OP was evaluated on two benchmark corpora including DUC 2004 (Task 2) and MultiLing 2015 (MMS task) using several ROUGE metrics and the three official evaluation methods adopted at MultiLing 2015 (AutoSummENG, MeMoG, and NPowER). Its performance was compared to those of 26 systems, which participated in DUC 2004 and MultiLing 2015 competitions. The F-measure scores show that MDS-OP outperformed the 16 systems that participated at DUC 2004 (Task 2) in terms of ROUGE-1 and ROUGE-L. It also outperformed the 10 systems which participated at MultiLing 2015 (MMS task) in terms of ROUGE-SU4, AutoSummENG, MeMoG, and NPowER. The performance of MDS-OP in terms of other ROUGE metrics (ROUGE-2, ROUGE-3, ROUGE-4, and ROUGE-W) ranked it among the best three systems. These results demonstrate the effectiveness of the proposed approach for MDS.
MDS-OP does not need a training phase as required by machine-learning based systems. It relies on only statistical and graph-based features. However, the robustness of its performance depends on the tuning of the parameters of ACS.
In a future work, we plan to study other semantic features and their impact on the performance of MDS-OP, as well as other SI metaheuritics which were examined for solving OP. In addition, to improve the readability of a summary, the text coherency can be included as a second objective, which would motivate a bi-objective formulation and solving of the MDS problem. This would be performed by adding the coherence scores between pairs of sentences in the OP graph and optimizing the order of summary sentences. Different methods would be examined to calculate the local coherence scores between sentences pairs.
Author Contributions
Conceptualization, A.A.-S. and M.E.B.M.; Methodology, A.A.-S. and M.E.B.M.; Software, A.A.-S.; Validation, A.A.-S. and M.E.B.M.; Formal Analysis, A.A.-S.; Investigation, A.A.-S. and M.E.B.M.; Writing—Original Draft Preparation, A.A.-S.; Writing—Review & Editing, M.E.B.M.; Resources, A.A.-S., available benchmark data, and open source tools; Supervision, M.E.B.M.
Funding
This research received no external funding.
Conflicts of Interest
The authors declare no conflict of interest.
Abbreviations
The following abbreviations are used in this manuscript:
| ACO | Ant colony optimization |
| ACS | Ant colony system |
| ABC | Artificial bee colony |
| AS | Ant system |
| AutoSummENG | AUTOmatic SUMMary Evaluation based on N-gram Graphs |
| CS | Cuckoo search |
| DUC | Document understanding conference |
| GA | Genetic Algorithm |
| hLDA | Hierarchical Latent Dirichlet Allocation |
| HMM | Hidden Markov model |
| LCS | Longest common subsequence |
| MDS | Multi-document summarization |
| MeMoG | Merged Model Graph |
| MMS | Multilingual multi-document summarization |
| NP | Noun phrase |
| NPowER | N-gram graph Powered Evaluation via Regression |
| OP | Orienteering problem |
| PSO | Particle swarm optimization |
| ROUGE | Recall-Oriented Understudy for Gisting Evaluation |
| SI | Swarm intelligence |
| TAC | Text analysis conference |
| TSP | Traveling salesman problem |
| TF-IDF | Term frequency times inverse document frequency |
| TF-ISF | Term frequency times inverse sentence frequency |
References
- Wang, D.; Li, T. Weighted consensus multi-document summarization. Inf. Process. Manag. 2012, 48, 513–523. [Google Scholar] [CrossRef]
- Muthuswamy, S.; Lam, S.S. Discrete particle swarm optimization for the team orienteering problem. Memet. Comput. 2011, 3, 287–303. [Google Scholar] [CrossRef]
- Vansteenwegen, P.; Souffriau, W.; Oudheusden, D.V. The orienteering problem: A survey. Eur. J. Oper. Res. 2011, 209, 1–10. [Google Scholar] [CrossRef] [Green Version]
- Gunawan, A.; Lau, H.C.; Vansteenwegen, P. Orienteering Problem: A survey of recent variants, solution approaches and applications. Eur. J. Oper. Res. 2016, 255, 315–332. [Google Scholar] [CrossRef]
- Dorigo, M.; Gambardella, L.M. Ant colony system: A cooperative learning approach to the traveling salesman problem. IEEE Trans. Evolut. Comput. 1997, 1, 53–66. [Google Scholar] [CrossRef]
- Lin, C.Y. ROUGE: A Package for Automatic Evaluation of Summaries. In Proceedings of the ACL-04 Workshop on Text Summarization Branches Out, Barcelona, Spain, 25–26 July 2004; Marie-Francine Moens, S.S., Ed.; Association for Computational Linguistics: Barcelona, Spain, 2004; pp. 74–81. [Google Scholar]
- Giannakopoulos, G.; Karkaletsis, V.; Vouros, G.; Stamatopoulos, P. Summarization System Evaluation Revisited: N-gram Graphs. ACM Trans. Speech Lang. Process. 2008, 5, 5. [Google Scholar] [CrossRef]
- Giannakopoulos, G.; Karkaletsis, V. AutoSummENG and MeMoG in evaluating guided summaries. In MultiLing Summarisation Pilot Text Analysis Conference (TAC) 2011; NIST: Gaithersburg, MD, USA, 2011. [Google Scholar]
- Giannakopoulos, G.; Karkaletsis, V. Summary Evaluation: Together We Stand NPowER-ed. In Computational Linguistics and Intelligent Text Processing; Gelbukh, A., Ed.; Lecture Notes in Computer Science; Springer: Berlin/Heidelberg, Germnay, 2013; Volume 7817, pp. 436–450. [Google Scholar]
- Mani, I. Automatic Summarization; John Benjamins Publishing: Amsterdam, The Netherlands, 2001. [Google Scholar]
- Lloret, E.; Palomar, M. Text Summarisation in Progress: A Literature Review. Artif. Intell. Rev. 2012, 37, 1–41. [Google Scholar] [CrossRef]
- Luhn, H.P. The Automatic Creation of Literature Abstracts. IBM J. Res. Dev. 1958, 2, 159–165. [Google Scholar] [CrossRef]
- Edmundson, H.P. New Methods in Automatic Extracting. J. ACM 1969, 16, 264–285. [Google Scholar] [CrossRef]
- Litkowski, K.C. Summarization experiments in DUC 2004. In Proceedings of the 2004 Document Understanding Conference, Boston, MA, USA, 6–7 May 2004; NIST: Gaithersburg, MD, USA, 2004. [Google Scholar]
- Lacatusu, F.; Hickl, A.; Harabagiu, S.; Nezda, L. Lite-GISTexter at DUC 2004. In Proceedings of the 2004 Document Understanding Conference, Boston, MA, USA, 6–7 May 2004; NIST: Gaithersburg, MD, USA, 2004. [Google Scholar]
- Nobata, C.; Sekine, S. CRL/NYU summarization system at DUC-2004. In Proceedings of the 2004 Document Understanding Conference, Boston, MA, USA, 6–7 May 2004; NIST: Gaithersburg, MD, USA, 2004. [Google Scholar]
- Conroy, J.M.; Davis, S.T.; Kubina, J. Preprocessing and Term Weights in Multilingual Summarization. 2015. Available online: http://multiling.iit.demokritos.gr/file/download/1582 (accessed on 25 March 2018).
- Conroy, J.; Davis, S.T.; Kubina, J.; Liu, Y.K.; O’Leary, D.P.; Schlesinger, J.D. Multilingual Summarization: Dimensionality Reduction and a Step Towards Optimal Term Coverage. In Proceedings of the MultiLing 2013 Workshop on Multilingual Multi-Document Summarization, Sofia, Bulgaria, 9 August 2013; Association for Computational Linguistics: Sofia, Bulgaria, 2013; pp. 55–63. [Google Scholar]
- Balikas, G.; Amini, M.R. The Participation of UJF-Grenoble Team at Multiling 2015. 2015. Available online: http://multiling.iit.demokritos.gr/file/download/1585 (accessed on 1 April 2018).
- Hirao, T.; Suzuki, J.; Hideki, I.; Maeda, E. NTT’s Multiple Document Summarization System for DUC 2004. In Proceedings of the 2004 Document Understanding Conference, Boston, MA, USA, 6–7 May 2004; NIST: Gaithersburg, MD, USA, 2004. [Google Scholar]
- Wan, S.; Li, L.; Huang, T.; Gao, Z.; Mao, L.; Huang, F. CIST System Report for SIGdial MultiLing 2015. 2015. Available online: http://multiling.iit.demokritos.gr/file/download/1575 (accessed on 25 March 2018).
- Conroy, J.M.; Schlesinger, J.D.; Goldstein, J.; O’leary, D.P. Left-brain/right-brain multi-document summarization. In Proceedings of the 2004 Document Understanding Conference, Boston, MA, USA, 6–7 May 2004; NIST: Gaithersburg, MD, USA, 2004. [Google Scholar]
- Conroy, J.; O’Leary, D.P. Text Summarization via Hidden Markov Models and Pivoted QR Matrix Decomposition; Technical Report; University of Maryland: College Park, MA, USA, 2001. [Google Scholar]
- Litvak, M.; Dlikman, A.; Last, M. MUSEEC: A Multilingual Text Summarization Tool. 2015. Available online: http://www.aclweb.org/anthology/P16-4013 (accessed on 1 April 2018).
- Litvak, M.; Last, M. Cross-lingual training of summarization systems using annotated corpora in a foreign language. Inf. Retr. 2013, 16, 629–656. [Google Scholar] [CrossRef]
- Zhong, S.; Liu, Y.; Li, B.; Long, J. Query-oriented unsupervised multi-document summarization via deep learning model. Expert Syst. Appl. 2015, 42, 8146–8155. [Google Scholar] [CrossRef]
- Yousefi-Azar, M.; Hamey, L. Text summarization using unsupervised deep learning. Expert Syst. Appl. 2017, 68, 93–105. [Google Scholar] [CrossRef]
- Blair-Goldensohn, S.; Evans, D.; Hatzivassiloglou, V.; McKeown, K.; Nenkova, A.; Passonneau, R.; Schiffman, B.; Schlaikjer, A.; Siddharthan, A.; Siegelman, S. Columbia University at DUC 2004. In Proceedings of the 2004 Document Understanding Conference, Boston, MA, USA, 6–7 May 2004; NIST: Gaithersburg, MD, USA, 2004. [Google Scholar]
- Abdelkrime, A.; Zegour, D.E.; Hidouci, K.W. AllSummarizer system at MultiLing 2015: Multilingual single and multi-document summarization. In Proceedings of the SIGDIAL 2015 Conference, Dresden, Germany, 6–10 September 2015; pp. 237–244. [Google Scholar]
- Saggion, H.; Gaizauskas, R. Multi-document summarization by cluster/profile relevance and redundancy removal. In Proceedings of the 2004 Document Understanding Conference, Boston, MA, USA, 6–7 May 2004; NIST: Gaithersburg, MD, USA, 2004. [Google Scholar]
- Angheluta, R.; Mitra, R.; Jing, X.; Moens, M.F. KU Leuven summarization system at DUC 2004. In Proceedings of the 2004 Document Understanding Conference, Boston, MA, USA, 6–7 May 2004; NIST: Gaithersburg, MD, USA, 2004. [Google Scholar]
- Mihalcea, R.; Radev, D. Graph-Based Natural Language Processing and Information Retrieval; Cambridge University Press: Cambridge, UK, 2011. [Google Scholar]
- Erkan, G.; Radev, D.R. The University of Michigan at DUC 2004. In Proceedings of the 2004 Document Understanding Conference, Boston, MA, USA, 6–7 May 2004; NIST: Gaithersburg, MD, USA, 2004. [Google Scholar]
- Mani, I.; Bloedorn, E. Multi-document Summarization by Graph Search and Matching. In Proceedings of the Fourteenth National Conference on Artificial Intelligence and Ninth Conference on Innovative Applications of Artificial Intelligence, Providence, Rhode Island, 27–31 July 1997; AAAI Press: Palo Alto, CA, USA, 1997; pp. 622–628. [Google Scholar]
- Zha, H. Generic Summarization and Keyphrase Extraction Using Mutual Reinforcement Principle and Sentence Clustering. In Proceedings of the 25th Annual International ACM SIGIR Conference on Research and Development in Information Retrieval SIGIR ’02, Tampere, Finland, 11–15 August 2002; ACM: New York, NY, USA, 2002; pp. 113–120. [Google Scholar]
- Erkan, G.; Radev, D.R. LexRank: Graph-based Lexical Centrality As Salience in Text Summarization. J. Artif. Int. Res. 2004, 22, 457–479. [Google Scholar]
- Vanderwende, L.; Banko, M.; Menezes, A. Event-Centric Summary Generation; Working Notes of the Document Understanding Conference 2004; NIST: Gaithersburg, MD, USA, 2004. [Google Scholar]
- Wan, X.; Yang, J.; Xiao, J. Towards an Iterative Reinforcement Approach for Simultaneous Document Summarization and Keyword Extraction. In Proceedings of the 45th Annual Meeting of the Association of Computational Linguistics, Prague, Czech, 25–27 June 2007; Association for Computational Linguistics: Prague, Czech, 2007; pp. 552–559. [Google Scholar]
- Brin, S.; Page, L. The Anatomy of a Large-scale Hypertextual Web Search Engine. Comput. Netw. ISDN Syst. 1998, 30, 107–117. [Google Scholar] [CrossRef]
- Kleinberg, J.M. Authoritative Sources in a Hyperlinked Environment. J. ACM 1999, 46, 604–632. [Google Scholar] [CrossRef]
- Thomas, S.; Beutenmüller, C.; de la Puente, X.; Remus, R.; Bordag, S. ExB Text Summarizer. In Proceedings of the SIGDIAL 2015 Conference, Dresden, Germany, 6–10 September 2015; pp. 260–269. [Google Scholar]
- Wan, X.; Yang, J.; Xiao, J. Manifold-ranking Based Topic-focused Multi-document Summarization. In Proceedings of the 20th International Joint Conference on Artifical Intelligence IJCAI’07, Hyderabad, India, 6–12 January 2007; Morgan Kaufmann Publishers Inc.: San Francisco, CA, USA, 2007; pp. 2903–2908. [Google Scholar]
- Chali, Y.; Kolla, M. Summarization techniques at DUC 2004. In Proceedings of the 2004 Document Understanding Conference, Boston, MA, USA, 6–7 May 2004; NIST: Gaithersburg, MD, USA, 2004. [Google Scholar]
- Bergler, S.; Witte, R.; Li, Z.; Khalife, M.; Chen, Y.; Doandes, M.; Andreevskaia, A. Multi-ERSS and ERSS 2004. In Proceedings of the 2004 Document Understanding Conference, Boston, MA, USA, 6–7 May 2004; NIST: Gaithersburg, MD, USA, 2004. [Google Scholar]
- Huang, L.; He, Y.; Wei, F.; Li, W. Modeling Document Summarization as Multi-objective Optimization. In Proceedings of the 2010 Third International Symposium on Intelligent Information Technology and Security Informatics (IITSI), Jinggangshan, China, 2–4 April 2010; pp. 382–386. [Google Scholar]
- Rautray, R.; Balabantaray, R.C. Bio-Inspired Algorithms for Text Summarization: A Review. In Bio-Inspired Computing for Information Retrieval Applications; IGI Global: Hershey, PA, USA, 2017; pp. 71–92. [Google Scholar]
- Shen, C.; Li, T. Multi-document Summarization via the Minimum Dominating Set. In Proceedings of the 23rd International Conference on Computational Linguistics COLING ’10, Beijing, China, 23–27 August 2010; Association for Computational Linguistics: Stroudsburg, PA, USA, 2010; pp. 984–992. [Google Scholar]
- Jaoua, K.F.; Jaoua, M.; Ben Hamadou, A. Summarization at LARIS laboratory. In Proceedings of the 2004 Document Understanding Conference, Boston, MA, USA, 6–7 May 2004; NIST: Gaithersburg, MD, USA, 2004. [Google Scholar]
- John, A.; Premjith, P.; Wilscy, M. Extractive multi-document summarization using population-based multicriteria optimization. Expert Syst. Appl. 2017, 86, 385–397. [Google Scholar] [CrossRef]
- Vanetik, N.; Litvak, M. Multilingual Summarization with Polytope Model. In Proceedings of the SIGDIAL 2015 Conference, Dresden, Germany, 6–10 September 2015; pp. 227–231. [Google Scholar]
- Lin, H.; Bilmes, J. A Class of Submodular Functions for Document Summarization. In Proceedings of the 49th Annual Meeting of the Association for Computational Linguistics: Human Language Technologies HLT ’11, Portland, OR, USA, 19–24 June 2011; Association for Computational Linguistics: Stroudsburg, PA, USA, 2011; Volume 1, pp. 510–520. [Google Scholar]
- Takamura, H.; Okumura, M. Text Summarization Model Based on Maximum Coverage Problem and Its Variant. In Proceedings of the 12th Conference of the European Chapter of the Association for Computational Linguistics EACL ’09, Athens, Greece, 2 April 2009; Association for Computational Linguistics: Stroudsburg, PA, USA, 2009; pp. 781–789. [Google Scholar]
- Alguliev, R.M.; Aliguliyev, R.M.; Isazade, N.R. Formulation of document summarization as a 0–1 nonlinear programming problem. Comput. Ind. Eng. 2013, 64, 94–102. [Google Scholar] [CrossRef]
- Binwahlan, M.S.; Salim, N.; Suanmali, L. Fuzzy Swarm Diversity Hybrid Model for Text Summarization. Inf. Process. Manag. 2010, 46, 571–588. [Google Scholar] [CrossRef]
- Peyrard, M.; Eckle-Kohler, J. A General Optimization Framework for Multi-Document Summarization Using Genetic Algorithms and Swarm Intelligence. In Proceedings of the 26th International Conference on Computational Linguistics COLING 2016, Osaka, Japan, 11–16 December 2016; pp. 247–257. [Google Scholar]
- Sanchez-Gomez, J.M.; Vega-Rodríguez, M.A.; Pérez, C.J. Extractive multi-document text summarization using a multi-objective artificial bee colony optimization approach. Knowl. Based Syst. 2017. [Google Scholar] [CrossRef]
- Mosa, M.A.; Hamouda, A.; Marei, M. Ant colony heuristic for user-contributed comments summarization. Knowl. Based Syst. 2017, 118, 105–114. [Google Scholar] [CrossRef]
- Asgari, H.; Masoumi, B.; Sheijani, O. Automatic text summarization based on multi-agent particle swarm optimization. In Proceedings of the 2014 Iranian Conference on Intelligent Systems (ICIS), Bam, Iran, 4–6 February 2014; pp. 1–5. [Google Scholar]
- Mosa, M.A.; Hamouda, A.; Marei, M. Graph coloring and ACO based summarization for social networks. Expert Syst. Appl. 2017, 74, 115–126. [Google Scholar] [CrossRef]
- Rautray, R.; Balabantaray, R.C. An evolutionary framework for multi document summarization using Cuckoo search approach: MDSCS. Appl. Comput. Inf. 2017. [Google Scholar] [CrossRef]
- Tefrie, K.G.; Sohn, K.A. Autonomous Text Summarization Using Collective Intelligence Based on Nature-Inspired Algorithm. In Proceedings of the International Conference on Mobile and Wireless Technology, Kuala Lumpur, Malaysia, 26–29 June 2017; Kim, K.J., Joukov, N., Eds.; Springer: Singapore, 2018; pp. 455–464. [Google Scholar]
- Golden, B.L.; Levy, L.; Vohra, R. The orienteering problem. Nav. Res. Logist. 1987, 34, 307–318. [Google Scholar] [CrossRef]
- Chao, I.M.; Golden, B.L.; Wasil, E.A. A fast and effective heuristic for the orienteering problem. Eur. J. Oper. Res. 1996, 88, 475–489. [Google Scholar] [CrossRef]
- Feillet, D.; Dejax, P.; Gendreau, M. Traveling Salesman Problems with Profits. Transp. Sci. 2005, 39, 188–205. [Google Scholar] [CrossRef]
- Manning, C.D.; Surdeanu, M.; Bauer, J.; Finkel, J.; Bethard, S.J.; McClosky, D. The Stanford CoreNLP Natural Language Processing Toolkit; Association for Computational Linguistics (ACL) System Demonstrations: Stroudsburg, PA, USA, 2014; pp. 55–60. [Google Scholar]
- Jurafsky, D.; Martin, J.H. Speech and Language Processing: An Introduction to Natural Language Processing, Computational Linguistics, and Speech Recognition, 2nd ed.; Prentice-Hall, Inc.: Upper Saddle River, NJ, USA, 2009. [Google Scholar]
- Giannakopoulos, G.; Kubina, J.; Conroy, J.M.; Steinberger, J.; Favre, B.; Kabadjov, M.; Kruschwitz, U.; Poesio, M. MultiLing 2015: Multilingual Summarization of Single and Multi-Documents, On-line Fora, and Call-center Conversations. In Proceedings of the SIGDIAL 2015 Conference, Dresden, Germany, 6–10 September 2015; pp. 270–274. [Google Scholar]
- Over, P.; Dang, H.; Harman, D. DUC in context. Inf. Process. Manag. 2007, 43, 1506–1520. [Google Scholar] [CrossRef]
Figure 1.
The main architecture of multi-document text summarization–orienteering problem (MDS-OP).

Figure 2.
An example of the intermediate representation of an input text with four sentences. The length of Sentence 1 (), Sentence 2 (), Sentence 3 (), and Sentence 4 () are , , , and , respectively.
Figure 2.
An example of the intermediate representation of an input text with four sentences. The length of Sentence 1 (), Sentence 2 (), Sentence 3 (), and Sentence 4 () are , , , and , respectively.

Figure 3.
ROUGE-1 scores (F-measure) on DUC 2004 (Task 2).

Figure 4.
ROUGE-2 scores (F-measure) on DUC 2004 (Task 2).

Figure 5.
ROUGE-3 scores (F-measure) on DUC 2004 (Task 2).

Figure 6.
ROUGE-4 scores (F-measure) on DUC 2004 (Task 2).

Figure 7.
ROUGE-L scores (F-measure) on DUC 2004 (Task 2).

Figure 8.
ROUGE-W-1.2 scores (F-measure) on DUC 2004 (Task 2).

Figure 9.
ROUGE-1 scores (F-measure) on MultiLing 2015 (MMS task).

Figure 10.
ROUGE-2 scores (F-measure) on MultiLing 2015 (MMS task).

Figure 11.
ROUGE-SU4 scores (F-measure) on MultiLing 2015 (MMS task).

Figure 12.
AutoSummENG scores on MultiLing 2015 (MMS task).

Figure 13.
MeMoG scores on MultiLing 2015 (MMS task).

Figure 14.
NPowER scores on MultiLing 2015 (MMS task).


Table 1.
ACS parameter settings.
| Parameter | Value |
|---|---|
| Number of ants (m) | Number of sentences in the text to be summarized. |
| Initial pheromone value () | , is the overall coverage (i.e., total profit) of the summary generated by following the nearest neighbor heuristic, and n is the number of sentences in this summary. |
| Pheromone decay parameters ( and ) | 0.1 |
| Heuristic exponent () | 2 |
Table 2.
Systems that participated at DUC 2004 (Task 2).
| System ID | Research Group (Participant) | Reference |
|---|---|---|
| CCSNSA04 | NSA | [22] |
| MEDLAB_Fudan | Fudan University | * |
| CL | CL Research | [14] |
| LARIS.2004 | Laris Labs | [48] |
| ULeth2004 | University of Lethbridge | [43] |
| columbia1 | Columbia University | [28] |
| CLaCDUCTape2 | Concordia University | [44] |
| webcl2004 | ISI | * |
| kul.2004 | KU Leuven | [31] |
| lcc.duc04 | LCC | [15] |
| uofo | University of Ottawa | * |
| msr-nlp.duc2004 | Microsoft | [37] |
| crl_nyu.duc04 | CRL/NYU | [16] |
| nttcslab.duc2004 | NTT | [20] |
| shef2004.saggion | University of Sheffield | [30] |
| UofM-MEAD | University of Michigan | [33] |
* The official DUC website does not contain any details on these participants.
Table 3.
Systems that participated at MultiLing 2015 (MMS task).
| System ID | Participant | Reference |
|---|---|---|
| MMS1 | UJF-Grenoble | [19] |
| MMS2 | UWB | * |
| MMS3 | ExB | [41] |
| MMS5 | ESI-AllSummarizer | [29] |
| MMS8 | IDA-OCCAMS | [17] |
| MMS9 | GiauUngVan | * |
| MMS11 | SCE-Poly | [50] |
| MMS12 | BUPT-CIST | [21] |
| MMS13 | BGU-MUSE | [24] |
| MMS15 | NCSR/SCIFY-NewSumRerank | * |
* The official MultiLing 2015 website does not contain any details on these participants.
Table 4.
F-measure scores of ROUGE-1, ROUGE-2, and ROUGE-3, ROUGE-4, ROUGE-L, and ROUGE-W-1.2 metrics of MDS-OP, the baseline, and the participating systems at DUC 2004 (Task 2). The highest values are written in bold. The highest and the lowest improvements (%) of MDS-OP are indicated by ⋆ and *, respectively.
| System ID | R-1 | R-2 | R-3 | R-4 | R-L | R-W | Relative Improvement of | |||||
|---|---|---|---|---|---|---|---|---|---|---|---|---|
| MDS-OP (%) | ||||||||||||
| R-1 | R-2 | R-3 | R-4 | R-L | R-W | |||||||
| MDS-OP | 0.386142 | 0.08799 | 0.031144 | 0.013086 | 0.33438 | 0.15 | - | - | - | - | - | - |
| 2 (baseline) | 0.3212 | 0.06402 | 0.02011 | 0.00694 | 0.2847 | 0.12639 | +20.22 | +37.44 | +54.87 | +88.56 | +17.45 | +17.39 |
| CCSNSA04 | 0.37938 | 0.09215 | 0.03589 | 0.01689 | 0.32803 | 0.14707 | +1.78 * | −4.51 * | −13.22 * | −22.52 * | +1.94 | +0.88 |
| MEDLAB_Fudan | 0.37584 | 0.0839 | 0.02675 | 0.01068 | 0.3339 | 0.14853 | +2.74 | +4.87 | +16.43 | +22.53 | +0.14 * | −0.11 * |
| CL | 0.3319 | 0.07652 | 0.02762 | 0.01278 | 0.28452 | 0.12568 | +16.34 | + 14.99 | +12.76 | +2.39 | +17.52 | +18.05 |
| LARIS.2004 | 0.37422 | 0.08033 | 0.02555 | 0.01013 | 0.32356 | 0.14308 | +3.19 | +9.54 | +21.89 | +29.18 | +3.34 | +3.69 |
| ULeth2004 | 0.31238 | 0.0513 | 0.01364 | 0.00469 | 0.26949 | 0.11886 | +23.61 | +71.52 | +128.33 | +179.02 | +24.08 | +24.82 |
| columbia1 | 0.36282 | 0.07763 | 0.02637 | 0.01232 | 0.32299 | 0.14339 | +6.43 | +13.35 | +18.10 | +6.22 | +3.53 | +3.47 |
| CLaCDUCTape2 | 0.35387 | 0.07028 | 0.02047 | 0.00856 | 0.30801 | 0.13787 | +9.12 | +25.2 | +52.14 | +52.87 | +8.56 | +7.61 |
| webcl2004 | 0.3643 | 0.07987 | 0.02743 | 0.01253 | 0.31921 | 0.14298 | +6 | +10.17 | +13.54 | +4.44 | +4.75 | +3.77 |
| kul.2004 | 0.34142 | 0.07812 | 0.02599 | 0.01094 | 0.29622 | 0.13193 | +13.1 | +12.63 | +19.83 | +19.62 | +12.88 | +12.46 |
| lcc.duc04 | 0.37155 | 0.08528 | 0.02713 | 0.01073 | 0.32281 | 0.1441 | +3.93 | +3.18 | +14.8 | +21.96 | + 3.58 | +2.96 |
| uofo | 0.23412 | 0.01806 | 0.00265 | 0.00074 | 0.21411 | 0.09549 | +64.93 ⋆ | +387.21 ⋆ | +1075.25 ⋆ | +1668.38 ⋆ | +56.17 ⋆ | +55.37 ⋆ |
| msr-nlp.duc2004 | 0.33918 | 0.05853 | 0.01338 | 0.00377 | 0.30147 | 0.13339 | +13.85 | +50.338 | +132.77 | +247.11 | +10.92 | +11.23 |
| crl_nyu.duc04 | 0.34644 | 0.08608 | 0.03442 | 0.01635 | 0.29838 | 0.13124 | +11.46 | +2.22 | −9.52 | −19.96 | +12.07 | +13.05 |
| nttcslab.duc2004 | 0.31263 | 0.05376 | 0.014 | 0.00547 | 0.27008 | 0.11745 | +23.51 | +63.67 | +122.46 | +139.23 | +23.81 | +26.32 |
| shef2004.saggion | 0.36763 | 0.08255 | 0.02843 | 0.01212 | 0.31964 | 0.14306 | +5.04 | +6.59 | +9.55 | +7.97 | +4.61 | +3.71 |
| UofM-MEAD | 0.33962 | 0.07135 | 0.02342 | 0.01019 | 0.26726 | 0.12144 | +13.7 | +23.32 | +32.98 | +28.42 | +25.11 | +22.17 |
Table 5.
F-measure scores of ROUGE-1, ROUGE-2, and ROUGE-SU4 MDS-OP and the participating systems on MultiLing 2015 (MMS task). The highest values are written in bold. The highest and the lowest improvements (%) of MDS-OP are indicated by ⋆ and *, respectively.
Table 5.
F-measure scores of ROUGE-1, ROUGE-2, and ROUGE-SU4 MDS-OP and the participating systems on MultiLing 2015 (MMS task). The highest values are written in bold. The highest and the lowest improvements (%) of MDS-OP are indicated by ⋆ and *, respectively.
| System ID | R-1 | R-2 | R-SU4 | Relative Improvement of MDS-OP (%) | ||
|---|---|---|---|---|---|---|
| R-1 | R-2 | R-SU4 | ||||
| MDS-OP | 0.468276 | 0.173698 | 0.204328 | - | - | - |
| MMS1 | 0.42463 | 0.12593 | 0.16892 | +10.28 | +37.93 | +20.96 |
| MMS2 | 0.45302 | 0.17452 | 0.20371 | +3.37 | −0.47 * | +0.30 * |
| MMS3 | 0.43478 | 0.15572 | 0.19 | +7.7 | +11.55 | +7.54 |
| MMS5 | 0.43857 | 0.1576 | 0.18962 | +6.77 | +10.21 | +7.76 |
| MMS8 | 0.47035 | 0.1673 | 0.19989 | −0.44 * | +3.82 | +2.22 |
| MMS9 | 0.4281 | 0.14296 | 0.1844 | +9.38 | +21.50 | +10.81 |
| MMS11 | 0.41515 | 0.12438 | 0.1665 | +12.8 | +39.65 | +22.72 |
| MMS12 | 0.39243 | 0.10205 | 0.14846 | +19.33 ⋆ | +70.21 ⋆ | +37.63 ⋆ |
| MMS13 | 0.43376 | 0.15885 | 0.1914 | +7.96 | +9.35 | +6.75 |
| MMS15 | 0.42514 | 0.15414 | 0.18308 | +10.15 | +12.69 | +11.61 |
Table 6.
Scores of MDS-OP and the participating systems on MultiLing 2015 (MMS task) obtained with evaluation methods AutoSummENG, MeMoG, and NPowER. The highest values are written in bold. The highest and the lowest improvements (%) of MDS-OP are indicated by ⋆ and *, respectively.
Table 6.
Scores of MDS-OP and the participating systems on MultiLing 2015 (MMS task) obtained with evaluation methods AutoSummENG, MeMoG, and NPowER. The highest values are written in bold. The highest and the lowest improvements (%) of MDS-OP are indicated by ⋆ and *, respectively.
| System ID | AutoSummENG | MeMoG | NPowER | Relative Improvement of MDS-OP (%) | ||
|---|---|---|---|---|---|---|
| AutoSummENG | MeMoG | NPowER | ||||
| MDS-OP | 0.2157 | 0.2521 | 1.9942 | - | - | - |
| MMS1 | 0.1751 | 0.1988 | 1.8441 | +23.19 | +26.81 | +8.14 |
| MMS2 | 0.1909 | 0.222 | 1.9054 | +12.99 | +13.56 * | +4.66 * |
| MMS3 | 0.164 | 0.1848 | 1.8039 | +31.52 | +36.42 | +10.55 |
| MMS5 | 0.1778 | 0.1944 | 1.8436 | +21.32 | +29.68 | +8.17 |
| MMS8 | 0.1925 | 0.2185 | 1.9046 | +12.05 * | +15.38 | +4.7 |
| MMS9 | 0.1657 | 0.1797 | 1.8013 | +30.18 | +40.29 | +10.71 |
| MMS11 | 0.1688 | 0.1836 | 1.8125 | +27.78 | +37.31 | +10.02 |
| MMS12 | 0.1475 | 0.1651 | 1.7453 | +46.24 ⋆ | +52.7 ⋆ | +14.26 ⋆ |
| MMS13 | 0.1607 | 0.1801 | 1.7911 | +34.23 | +39.98 | +11.34 |
| MMS15 | 0.1744 | 0.2004 | 1.8446 | +23.68 | +25.8 | +8.11 |
© 2018 by the authors. Licensee MDPI, Basel, Switzerland. This article is an open access article distributed under the terms and conditions of the Creative Commons Attribution (CC BY) license (http://creativecommons.org/licenses/by/4.0/).
Share and Cite
MDPI and ACS Style
Al-Saleh, A.; Menai, M.E.B. Solving Multi-Document Summarization as an Orienteering Problem. Algorithms 2018, 11, 96. https://doi.org/10.3390/a11070096
AMA Style
Al-Saleh A, Menai MEB. Solving Multi-Document Summarization as an Orienteering Problem. Algorithms. 2018; 11(7):96. https://doi.org/10.3390/a11070096
Chicago/Turabian StyleAl-Saleh, Asma, and Mohamed El Bachir Menai. 2018. "Solving Multi-Document Summarization as an Orienteering Problem" Algorithms 11, no. 7: 96. https://doi.org/10.3390/a11070096
Note that from the first issue of 2016, this journal uses article numbers instead of page numbers. See further details here.