Revisiting Chameleon Sequences in the Protein Data Bank


Department of Pharmacological Sciences, Icahn School of Medicine at Mount Sinai, New York, NY 10029, USA
Algorithms 2018, 11(8), 114; https://doi.org/10.3390/a11080114
Submission received: 10 July 2018
/
Revised: 23 July 2018
/
Accepted: 26 July 2018
/
Published: 28 July 2018
Abstract
:The steady growth of the Protein Data Bank (PDB) suggests the periodic repetition of searches for sequences that form different secondary structures in different protein structures; these are called chameleon sequences. This paper presents a fast (nlog(n)) algorithm for such searches and presents the results on all protein structures in the PDB. The longest such sequence found consists of 20 residues.

1. Introduction
It is the accepted wisdom of structural biology that the amino acid sequence of a protein determines its three-dimensional structure. This is rather remarkable since individual peptides are quite flexible, as can be deduced from the fact that large areas of the Ramachandran [1] plot represent literally observed conformations, this being confirmed by many simulations [2]. This apparent conundrum can be resolved by assuming that for a sequence to be able to determine the structure it has to be long enough. The first attempt at clarifying this issue originated from the Paracelsus challenge of Creamer and Rose [3] where they posed the challenge of changing less than 50% of the sequence to cause a change in the fold (i.e., the tertiary structure). Not only was the challenge soon met, recent work found examples whereby changing only 10% of the sequence still changed the fold [4]. The complexity of the relationship between sequence and structure is further highlighted by the discovery of misfolded proteins; the importance of understanding misfolding, in some cases combined with (or helped by(?)) aggregation, stems from the fact that they are often involved in serious diseases like mad-cow disease [5] and Alzheimer’s [6], as well as Parkinson’s [7]. Another issue that somewhat muddies the sequence–structure relationship is the discovery of intrinsically disordered proteins (IDP), which highlights the important role the protein’s environment plays in forming its structure.
However, the prediction of the protein structure is a ‘Hard’ problem [8]. Thus, initial attention has been focused on the problem of predicting the secondary structure from the sequence [9]. Clearly, successful prediction of the secondary structure is a necessary, but not sufficient, condition of successfully predicting the tertiary structure. The usefulness of the ability to predict secondary structure from sequence is further highlighted by the hierarchical nature of protein folding [10], i.e., during folding, secondary structures form locally as the first step. Given the known flexibility of peptides (vide supra), it is not surprising that the reliability of such prediction is limited [11]. One limit on the reliability of sequence-based structure prediction is the existence of chameleon sequences, i.e., sequences that can form different secondary structures in different environments. In particular, the more reliable such predictions are, the less likely that a given peptide sequence, to be a chameleon. Given the fact that conformational promiscuity is often involved in diseases, the characterization of chameleon sequences can contribute both to the field of structure prediction and to the fight against misfolding-related diseases.
The Protein Data Bank (PDB) [12] has been searched for chameleons several times, starting with the work of Kabsch and Sander [13], and as the number of structures in the PDB grew several repeat searches where conducted (including one by this author) [14,15,16,17,18,19]. The longest chameleon sequences found involved 10 residues.
As the number of structures in the PDB grew, the searches were restricted [17,19] to non-redundant subsets like The Structural Classification of Proteins (SCOP) [20] or the set at NCBI (https://blast.ncbi.nlm.nih.gov/Blast.cgi). This sped up the search and also eliminated the problem of giving large weight to proteins whose structural variants (and their homologs) occur repeatedly. It has the drawback of possibly missing chameleons that only occur in a variant/homolog that was not included in the non-redundant set. The aim of this paper is to present a fast search algorithm, apply it to the proteins in the current PDB, and analyze the resulting chameleons. The chameleon search software will be available from the author’s website at the URL http://inka.mssm.edu/~mezei/cham.
2. Materials and Methods
The chameleon search requires the list of sequences and the identification of the secondary structure elements in each. The search can use the annotated list of sequences in the PDB, a file that can be downloaded from the PDB website https://cdn.rcsb.org/etl/KabschSander/ss.txt.gz with secondary structure annotations made with the DSSP (Define Secondary Structure of Proteins) algorithm [21] or the actual full structure files either in the legacy PDB format or in the more general PDBX/mmCIF format where the secondary structure element annotations are made by the author(s) submitting the structure. Note that the DSSP and authors’ annotations may differ in some instances. Following the procedure used in the author’s earlier publication [15], chameleons are in all-helix conformation in one structure and in all-sheet conformation in another; this is different from the convention that was used, e.g., in [16]. Note that when the annotated sequence file is used, helix includes α helix, 3/10 helix, and π helix.
The algorithm used searches for chameleons of a given length, referred to as L. The algorithm consists of the following steps.
- For each PDB entry, extract all helix (H) and sheet (S) sequences as L-character strings (using the 1-character amino acid symbols) and save the PDBid, chain id, and starting residue number for each.
- For each PDB entry that includes more than one chain, sort the list of sequences and eliminate sequences that occur repeatedly in different chains (as it is assumed that such duplicates are the result of chains repeated in polymeric proteins).
- Add the character ‘H’ or ‘S’ (indicating helix or sheet) to the L+1th place to each sequence remaining.
- Once all PDB entries are read, sort the L-residue peptide sequences using all L+1 characters.
- Partition the sorted list into segments of identical sequences. If the first and last member of the partition has a different character at the L+1th position a chameleon is found.
The list of chameleons obtained with this procedure will generally include chameleons that are actually parts of a longer chameleon. To filter out such chameleons, the following algorithm was used.
- Perform the chameleon search starting with the longest possible, Lmax. It is set to 24 in the current implementation to be larger than the longest chameleon found, but it can be raised with minimal change in the code if needed (at the expense of using more memory).
- For all chameleon lengths L, Lmin ≤ L ≤ Lmax, create an L-character list consisting of: (a) all chameleons just found of length L; and (b) all L-character substrings of the already found chameleons. Lmin can be any positive number ≤ Lmax.
- Sort this combined list.
- Scan the sorted list. Whenever more than one identical string is found, and one of these was from the just found L-residue chameleon list, that chameleon should be dropped as it is part of a longer chameleon.
However, sequences that were found to be parts of longer chameleons may not be extendable to longer chameleons in every protein they occur. Searching for such chameleons can be performed by the following algorithm.
- 6.
- For all chameleon lengths L < Lmax create an L + 1-character list consisting of: (a) two copies of all occurrences of chameleons just found of length L, where the residue string is extended in both directions with the residue at that position of the protein the chameleon copy was found; and (b) all L + 1-character substrings of the already found chameleons.
- 7.
- Sort this combined list.
- 8.
- Scan the sorted list. Whenever only one identical string is found and it came from an L-residue chameleon that occurrence was a non-extendable one.
This algorithm was not implemented into the chameleon search program.
The chameleon search was implemented in the Fortran77 program Cham, available at the author’s website http://inka.mssm.edu/~mezei/cham. The string handling and sorting code were imported from the program Simulaid [22]. The sortings were executed by the merge-sort algorithm that scales as nlog(n). Since the complexity of every other steps is linear in the database size, the complexity of the chameleon search is also nlog(n).
The chameleon search algorithm is based on the character string representation of sequences, thus it works equally well if a lower-resolution characterization of the sequence is used. The program CHAM can read a mapping of the 20 residues onto a smaller character set and perform the chameleon search on that basis. Since the search is quite fast (minutes), it is easy to explore different mappings.
It is also of interest to see the chameleon-forming propensities of the different residues. There are several different ways that such propensities can be characterized:
- (1)
- The number of occurrences of residue i in chameleons of length L NL,i divided by L × NCL, where NCL is the number of chameleons of exactly L residues, P1(L,i) = NL,i/( L × NCL) (or multiplied by 100 to obtain percentages).
- (2)
- P1(L,i) normalized by a measure of the overall propensity of residue i. There are different options:
- (2.1)
- P2(L,i) = P1(L,i)/0.05 (or 5 if percentages were used). This measure ignores the different probabilities of occurrences of the different amino acids. It was the measure used in [15].
- (2.2)
- P3(L,i) = P1(L,i)/P(i), where P(i) is the overall probability of occurrence of residue i.
- (2.3)
- P4(L,i) = P1(L,i)/PHS(i), where PHS(i) is the overall probability of occurrence of residue i in either a helix or in a sheet.
The program Cham calculates these propensities for each length and averages them cumulatively over all the lengths the chameleon search was performed.
3. Results
The program Cham was run on the file ss.txt downloaded from the PDB. The current analysis examined 138,870 PDBids and 394,364 chains. The number of sequences examined and the number of chameleons L > 4 found are shown in Table 1 for chameleon searches at three different resolutions: (1) 20 residues; (2) 4 types only (H, P, +, − for Hydrophobic, Polar, positive, negative, respectively); and (3) 3 types only (H, P, C for Hydrophobic, Polar, Charged, respectively).
Chameleons longer than eight residues are listed in Table 2. They were all examined visually using VMD (Visual Molecular Dynamics) [23] or Pymol [24]. Note, that in that process, several annotations were found to be incorrect; for now those PDBids are excluded from consideration by the program Cham.
The residue numbers in Table 2 refer to the residue positions in the ss.txt file. They may differ from the residue numbers in the full PDB file (usually because parts of the protein’s structure could not be determined). Table 2 also lists the number of structures in the PDB where this sequence is found. Multiple occurrences of long chameleons are likely to occur in homologous structures.
All chameleons longer than 10 were found for different structures of the same protein. The proteins showing such conformational heterogeneity are the amyloid beta-peptide (1amb, 5oqv, 2llm, 2beg, 2loh, 2lz4) which is involved in Alzheimer’s disease, alpha-synuclein (2kkw, 2n0a) which is involved in Parkinson’s disease, and CEL-III, a Ca2+-dependent and galactose-specific lectin (1vcl, 3w9t, 2z48, 2z49).
Chameleons involving seven or eight residues are listed in the Supplementary Materials. Chameleons shorter than seven residues, as well as the list of all occurrences of the chameleons found can be generated by running the program Cham, available at the URL http://inka.mssm.edu/~mezei/cham.
Besides searching for chameleons, the program Cham also gathers some statistics on the full set: the distribution of helix and sheet lengths and the overall probability of an amino acid occurring in a protein, in helix, or in sheet conformation. It should be emphasized that these data are much more biased than statistics generated on non-redundant sets, this being one a downside of using the full PDB. Since the main purpose of this work was the search for chameleons, using the full PDB was the only way to ensure that none were missed.
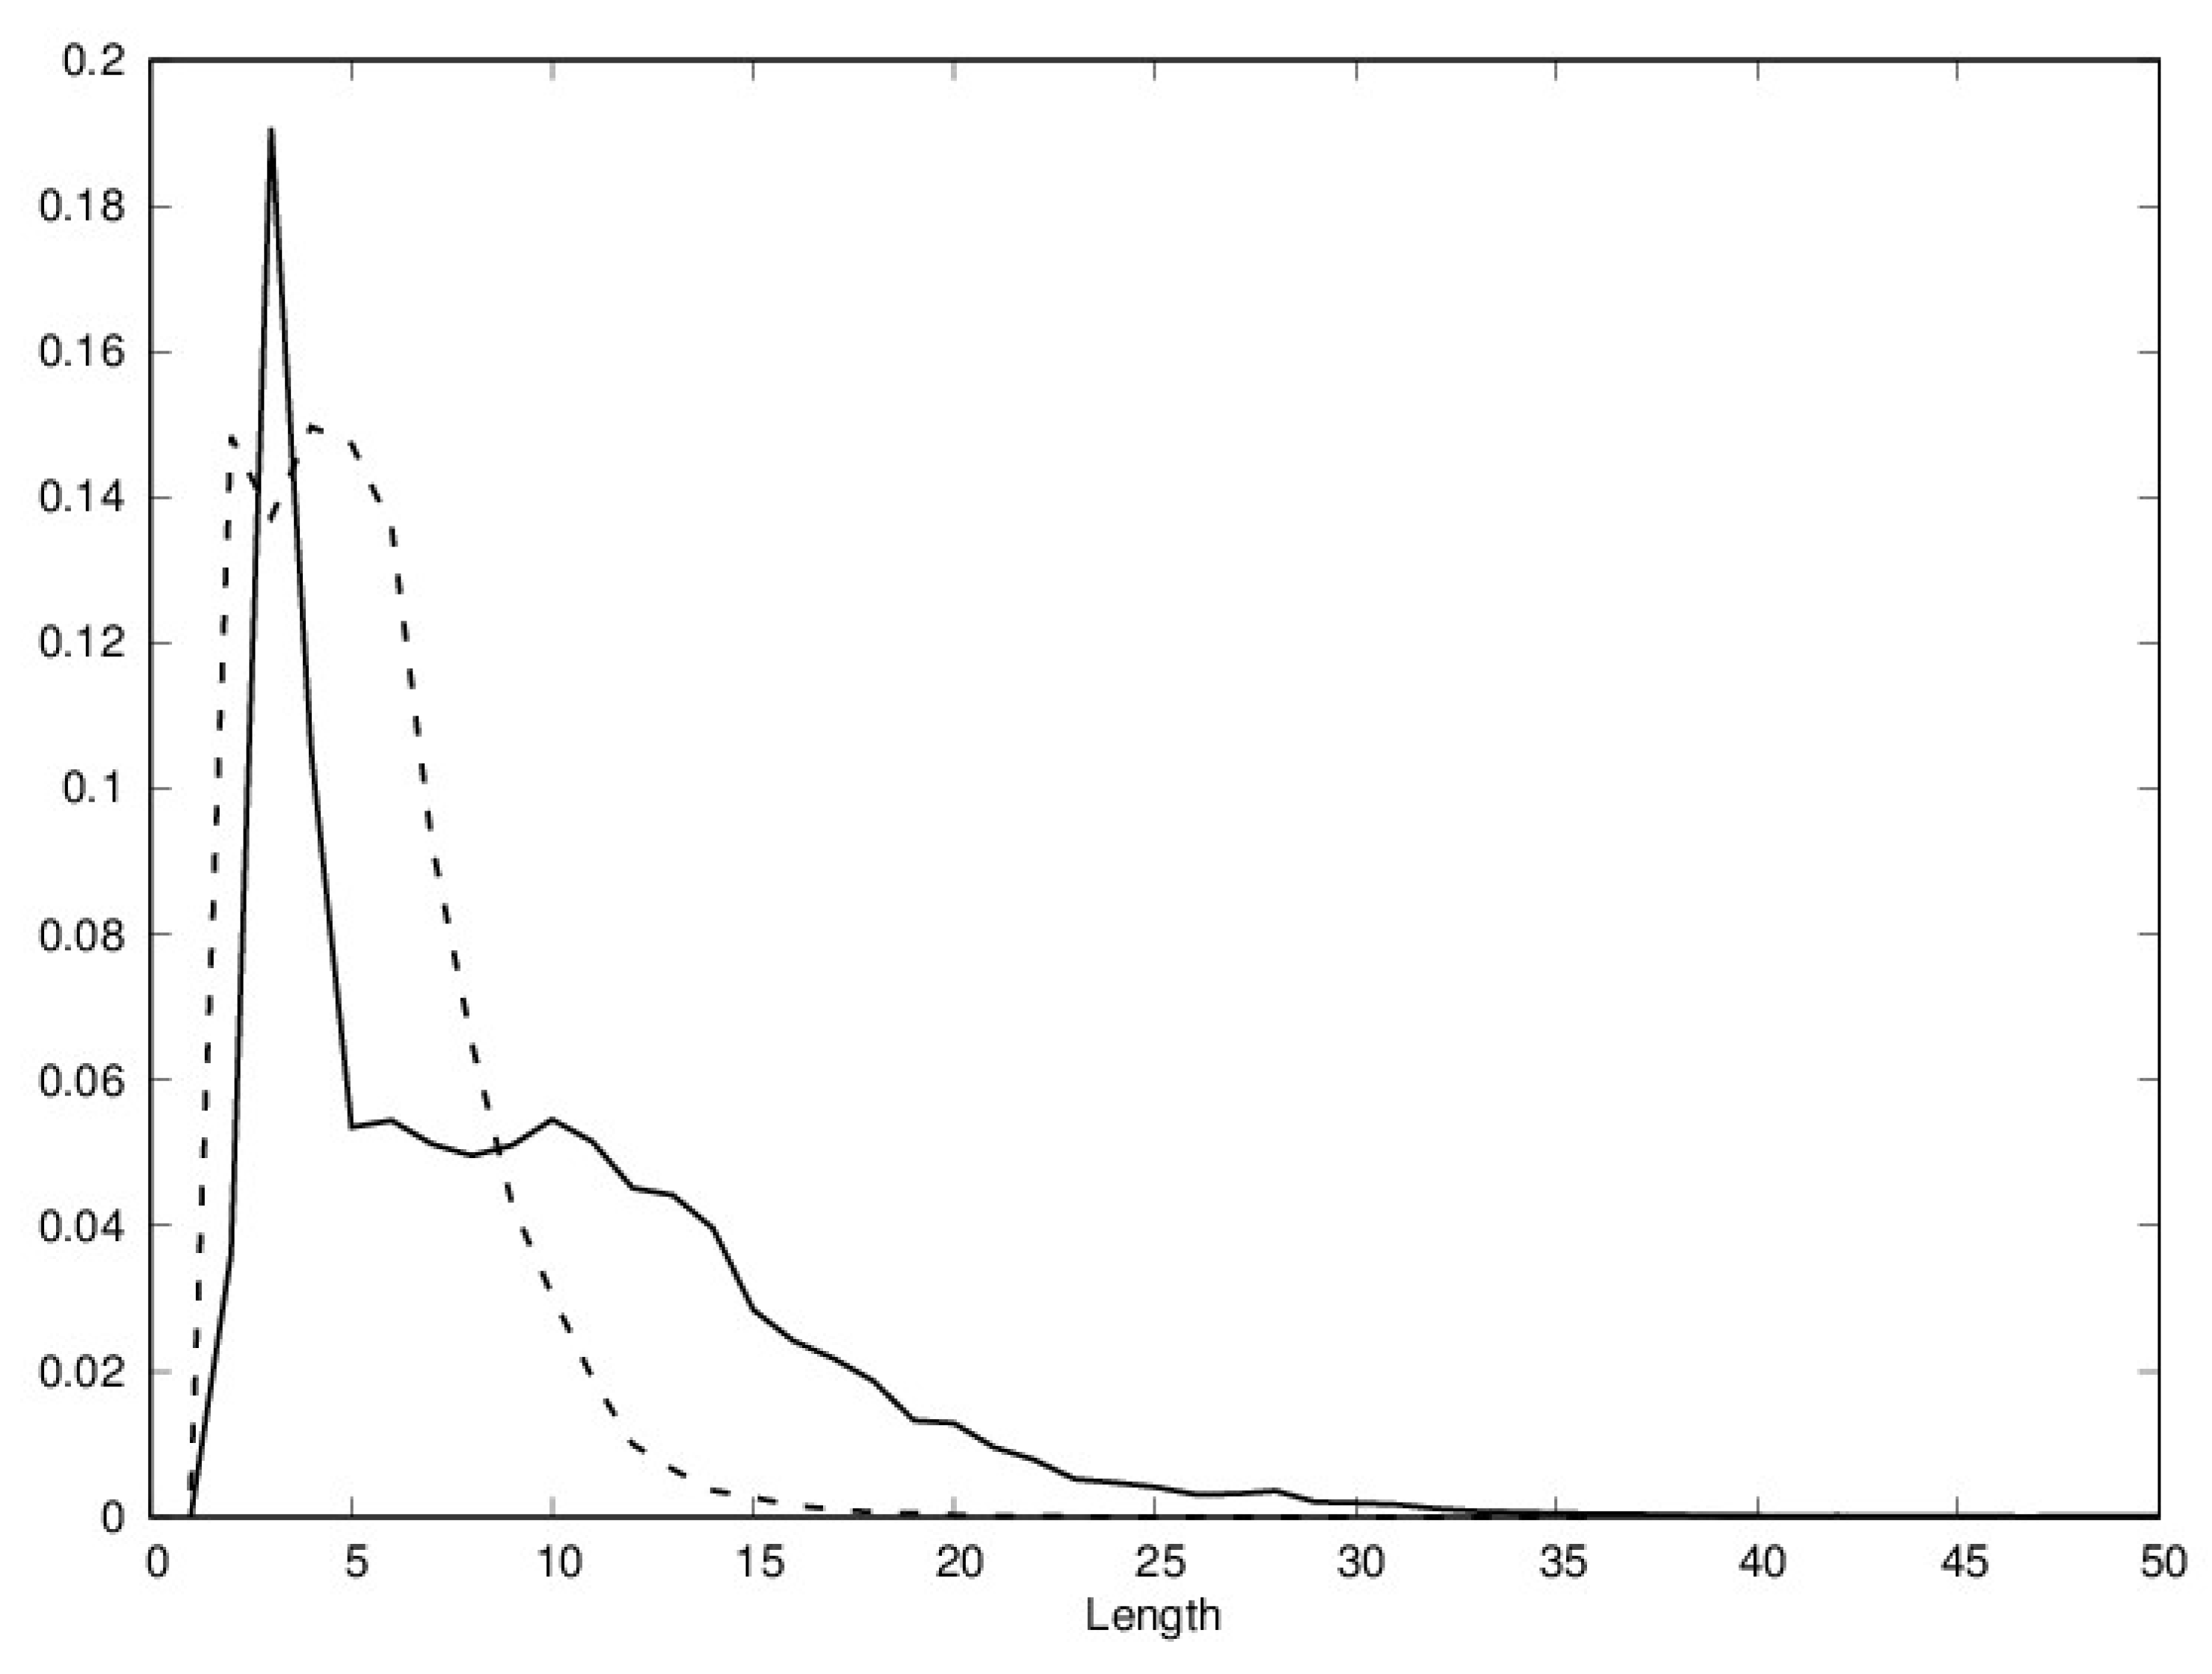
The distributions of helix and sheet lengths are shown in Figure 1. While the lengths of most helices and sheets fall in the [4,10] range, it is clear that longer secondary structure elements are more likely to be helices.
Table 3 presents various amino acid propensities in terms of percent occurrences. The overall percent of amino acids are given both based on the data set used in this study and on the amino acid composition in the UniProtKB/Swiss-Prot data bank [25], read from the Expasy server at the URL https://web.expasy.org/protscale/pscale/A.A.Swiss-Prot.html. Table 3 also shows the percent of each residue in helix and in sheet conformation, respectively, as well as the ratio of the helix and sheet percentages to their overall percentages, factoring out the effect of different overall propensities. Since it can be assumed that the distribution of amino acids is less biased both in the Expasy set and in the non-redundant sets, comparison of the overall percentages calculated on the full PDB and on the Expasy data set gives a measure of bias introduced by not using a non-redundant set. The differences are mostly small; the largest is for valine and leucine (0.85 and 0.64., respectively).
Table 4 presents data characterizing the chameleon propensities of each amino acid. In accordance with earlier work leucine, valine, and alanine were found to feature prominently in chameleons.
4. Discussion
The algorithm presented for the chameleon search is fast enough to be able to run easily on the full set of sequences in the PDB instead of just a representative, i.e., non-redundant set. This choice led to the discovery of chameleons significantly longer than those previously found. There is, however, one drawback to using the full set: since many proteins have several homologues and many protein structures have several (nearly) identical domains, the data obtained will have an unspecified bias in it. This bias will not affect the distribution of unique chameleons, but will affect the number of occurrences of both chameleons and the amino acid frequency statistics. However, the comparison of the amino acid percentages calculated on the PDB and on the Expasy set shows only small differences, thus the data set bias is small enough not to have a major effect on conclusions.
In any event, the reliability of the chameleon search hinges upon the reliability of the secondary structure annotation. Once a particular annotation is established the proposed algorithm is guaranteed to find all chameleons
The existence of such long chameleons also raises an intriguing problem. In [15] it was argued, assuming uniform distribution of amino acids, that chameleons with more than seven residues (the longest ones found in that work) are unlikely simply because the chance of longer sequences occurring more than once (never mind their conformation) is vanishingly small. The fact that, contrary to this suggestion, well over two hundred chameleons with more than seven residues were found since that time suggests that there may be hidden organizing principles at work selecting protein sequences that fold into well-defined conformations. This suggestion is supported by the fact that a protein with a randomly selected sequence is unlikely to fold [26].
Searching for residue patterns in chameleons is facilitated by the speed of the algorithm, since it makes it easy to perform the chameleon search with a variety of low-resolution residue definitions. It only takes the specification of the residue mapping and about 10 minutes on a laptop computer to generate the data.
The earlier observation, that alanine, leucine, and valine are frequently seen in chameleons, still holds in the current results. Interestingly, the effect diminishes as the propensities are normalized by overall amino acid propensities and further weakens if propensities to form secondary structure elements are used for normalization. This observation generalizes to the low-resolution chameleon propensities where the hydrophobic residues were found to be dominant. Not surprisingly, no significant difference was found between the positive and negative residues in this respect.
There is also a counterintuitive observation about the helix and sheet propensities of amino acids. One would expect that a tendency for chameleon forming implies roughly equal propensities for helix and sheet formation. However, the two large differences observed were for leucine and valine, two of the three prominent chameleon forming amino acids.
Supplementary Materials
The following are available online at https://www.mdpi.com/1999-4893/11/8/114/s1, Table S1: List of eight-residue chameleons found, Table S2: List of seven-residue chameleons found.
Funding
This research received no external funding.
Acknowledgments
This work was supported in part through the computational resources and staff expertise provided by Scientific Computing at the Icahn School of Medicine at Mount Sinai.
Conflicts of Interest
The author declares no conflict of interest.
References
- Ramachandran, G.N.; Ramakrishnan, C.; Sasisekharan, V. Stereochemistry of polypeptide chain configurations. J. Mol. Biol. 1963, 7, 95–99. [Google Scholar] [CrossRef]
- Gnanakaran, S.; Nymeyer, H.; Portman, J.; Sanbonmatsu, K.Y.; Garcıa, A.E.; Tovchigrechko, A. Peptide folding simulations. Curr. Opin. Struct. Biol. 2003, 13, 68–174. [Google Scholar] [CrossRef]
- Rose, G.D.; Creamer, T.O. Protein folding: Predicting predicting. Proteins. Struct. Funct. Genet. 1994, 19, 1–2. [Google Scholar] [CrossRef] [PubMed]
- Porter, L.L.; Loogera, L.L. Extant fold-switching proteins are widespread. Proc. Natl. Acad. Sci. USA 2018, 115, 5968–5973. [Google Scholar] [CrossRef] [PubMed]
- Cohen, F.E. Protein misfolding and prion diseases. J. Mol. Biol. 1999, 283, 313–320. [Google Scholar] [CrossRef] [PubMed]
- DeToma, A.S.; Salamekh, S.; Ramamoorthy, A.; Lim, M.H. Misfolded proteins in Alzheimer’s disease and type II diabetes. Chem. Soc. Rev. 2012, 41, 608–621. [Google Scholar] [CrossRef] [PubMed]
- Uversky, V.N.; Eliezer, D. Biophysics of Parkinson’s disease: Structure and aggregation of alpha-synuclein. Curr. Protein Pept. Sci. 2009, 10, 483–499. [Google Scholar] [CrossRef] [PubMed]
- Fraenkel, A.A. Complexity of protein folding. Bull. Math. Biol. 1993, 55, 1199–1210. [Google Scholar] [CrossRef] [PubMed]
- Chou, P.Y.; Fasman, G.D. Prediction of protein conformation. Biochemistry 1974, 13, 222–245. [Google Scholar] [CrossRef] [PubMed]
- Baldwinn, R.L.; Rose, G.D. Is protein folding hierarchic? II. Folding intermediates and transition states. Trends Biochem. Sci. 1999, 24, 185–191. [Google Scholar] [CrossRef]
- Sen, T.Z.; Cheng, H.; Kloczkowski, A.; Jernigan, R.L. A Consensus Data Mining secondary structure prediction by combining GOR V and Fragment Database Mining. Protein Sci. 2006, 15, 2499–2506. [Google Scholar] [CrossRef] [PubMed] [Green Version]
- Berman, H.M.; Westbrook, J.; Feng, Z.; Gilliland, G.; Bhat, T.N.; Weissig, H.; Shindyalov, I.N.; Bourne, P.E. The protein data bank. Nucleic Acids Res. 2000, 28, 235–242. [Google Scholar] [CrossRef] [PubMed]
- Kabsch, W.; Sander, C. On the use of sequence homologies to predict protein structure: Identical pentapeptides can have completely different conformations. Proc. Natl. Acad. Sci. USA 1984, 81, 1075–1078. [Google Scholar] [CrossRef] [PubMed]
- Minor, D.L.; Kim, P.S. Context-dependent secondary structure formation of a designed protein sequence. Nature 1996, 380, 730–734. [Google Scholar] [CrossRef] [PubMed] [Green Version]
- Mezei, M. Chameleon sequences in the PDB. Prot. Eng. 1998, 11, 411–414. [Google Scholar] [CrossRef] [Green Version]
- Sudarsanam, S. Structural diversity of sequentially identical subsequences of proteins: Identical octapeptides can have different conformations. Proteins Struct. Funct. Genet. 1998, 30, 228–231. [Google Scholar] [CrossRef]
- Gendoo, D.M.A.; Harrison, P.M. Discordant and chameleon sequences: Their distribution and implications for amyloidogenicity. Protein Sci. 2011, 20, 567–579. [Google Scholar] [CrossRef] [PubMed] [Green Version]
- Guo, J.; Jaromczyk, J.W.; Xu, Y. Analysis of chameleon sequences and their implications in biological processes. Proteins Struct. Funct. Genet. 2007, 67, 548–558. [Google Scholar] [CrossRef] [PubMed]
- Li, W.; Kinch, L.N.; Karplus, P.A.; Grishin, N.V. ChSeq: A database of chameleon sequences. Protein Sci. 2015, 24, 1075–1086. [Google Scholar] [CrossRef] [PubMed] [Green Version]
- Lo Conte, L.; Ailey, B.; Hubbard, T.J.; Brenner, S.E.; Murzin, A.G.; Chothia, C. SCOP: A structural classification of proteins database. Nucleic Acids Res. 2000, 28, 257–259. [Google Scholar] [CrossRef] [PubMed]
- Kabsch, W.; Sander, C. Dictionary of protein secondary structure: Pattern recognition of hydrogen-bonded and geometrical features. Biopolymers 1983, 22, 2577–2637. [Google Scholar] [CrossRef] [PubMed]
- Mezei, M. Simulaid: A simulation facilitator and analysis program. J. Comput. Chem. 2010, 31, 2658–2668. [Google Scholar] [CrossRef] [PubMed] [Green Version]
- Humphrey, W.; Dalke, A.; Schulten, K. VMD: Visual molecular dynamics. J. Mol. Gr. 1996, 14, 33–38. [Google Scholar] [CrossRef]
- Schrodinger, L. The PyMOL Molecular Graphics System, Version 1.8.6.2; Schrödinger, LLC: New York, NY, USA, 2010.
- The Uniprot Consortium Uniprot: The universal protein knowledgebase. Nucleic Acids Res. 2017, 45, D158–D169.
- De Lucrezia, D.; Slanzi, D.; Poli, I.; Polticelli, F.; Minervini, G. Do natural proteins differ from random sequences polypeptides? Natural vs. random proteins classification using an evolutionary neural network. PLoS ONE 2012, 7, e36634. [Google Scholar] [CrossRef] [PubMed] [Green Version]
Figure 1.
Distribution of helix length (full line) and sheet (broken line) length in the Protein Data Bank (PDB); length is the number of residues.
Figure 1.
Distribution of helix length (full line) and sheet (broken line) length in the Protein Data Bank (PDB); length is the number of residues.


Table 1.
Chameleon search statistics.
| 20 Residue Based | Low-Resolution (HP+−) | Low-Resolution (HPC) | |||||
|---|---|---|---|---|---|---|---|
| Length | Number of Sequences | NL(cham) | NL,X(cham) | NL(cham) | NL,X(cham) | NL(cham) | NL,X(cham) |
| 20 | 852,133 | 1 | 1 | 1 | 1 | 1 | 1 |
| 19 | 1,012,722 | 2 | 0 | 6 | 4 | 7 | 5 |
| 18 | 1,211,135 | 3 | 0 | 13 | 2 | 21 | 8 |
| 17 | 1,454,006 | 3 | 0 | 29 | 9 | 58 | 23 |
| 16 | 1,755,667 | 3 | 0 | 97 | 52 | 207 | 113 |
| 15 | 2,096,973 | 7 | 1 | 333 | 171 | 781 | 432 |
| 14 | 2,529,092 | 10 | 1 | 1245 | 693 | 3143 | 1824 |
| 13 | 3,055,102 | 14 | 1 | 440 | 2394 | 10,597 | 5506 |
| 12 | 3,685,170 | 18 | 0 | 13,359 | 6698 | 25,969 | 10,448 |
| 11 | 4,449,698 | 23 | 1 | 30,300 | 12,469 | 38,778 | 8658 |
| 10 | 5,380,037 | 32 | 4 | 45,328 | 13,386 | 32,363 | 2623 |
| 9 | 6,490,617 | 52 | 11 | 42,728 | 7408 | 16,527 | 265 |
| 8 | 7,827,484 | 149 | 79 | 26,482 | 2228 | 6390 | 18 |
| 7 | 9,444,433 | 2063 | 1822 | 11,499 | 314 | 2183 | 0 |
| 6 | 11,433,790 | 40,595 | 36,669 | 3769 | 14 | 729 | 0 |
| 5 | 13,801,708 | 249,407 | 187,803 | 1061 | 0 | 242 | 0 |
NL(cham) is the number of chameleons of length L and NL; X(cham) is the number of chameleons that are exactly of length L, i.e., are not part of a longer chameleon.
Table 2.
Chameleons longer than 8 residues.
| PDBid1 | Ch1 | Residue1 | PDBid2 | Ch2 | Residue1 | Sequence | Length | Number |
|---|---|---|---|---|---|---|---|---|
| 1AMB | A | 3 | 5OQV | F | 3 | EFRHDSGYEVHHQKLVFFAE | 20 | 2 |
| 1VCL | B | 343 | 3W9T | F | 343 | VKVTASLSKAWTNSQ | 15 | 2 |
| 2KKW | A | 42 | 2N0A | G | 42 | SKTKEGVVHGVATV | 14 | 2 |
| 1VCL | B | 320 | 3W9T | F | 320 | AGVAVEVSSTIEK | 13 | 4 |
| 2LLM | A | 19 | 2BEG | D | 31 | IIGLMVGGVVI | 11 | 4 |
| 2R1B | B | 145 | 3MW2 | B | 138 | LGRVVDEWLL | 10 | 2 |
| 2MDK | A | 115 | 3IKK | A | 118 | MDSKLRCVFE | 10 | 7 |
| 1BA4 | A | 24 | 2MXU | G | 24 | VGSNKGAIIG | 10 | 3 |
| 1G2C | C | 28 | 4JHW | F | 133 | VSVLTSKVLD | 10 | 8 |
| 2QZV | B | 340 | 2ZV5 | A | 328 | EQQGLLLKA | 9 | 4 |
| 1AMB | A | 16 | 2LMN | E | 16 | KLVFFAEDV | 9 | 9 |
| 2GEJ | A | 143 | 4NC9 | C | 127 | KSLTLSVFQ | 9 | 2 |
| 5N8Y | G | 86 | 4KSO | D | 86 | LIGLDLLYG | 9 | 2 |
| 1AMB | A | 17 | 2OTK | C | 17 | LVFFAEDVG | 9 | 2 |
| 2KB8 | A | 16 | 5KO0 | A | 2 | LVHSSNNFG | 9 | 3 |
| 5XLO | D | 74 | 6B44 | E | 76 | PNLQTVDVA | 9 | 3 |
| 5EY7 | A | 152 | 2OWY | B | 123 | RSSTFAAIA | 9 | 5 |
| 1AMB | A | 18 | 2BEG | D | 18 | VFFAEDVGS | 9 | 5 |
| 1XQ8 | A | 70 | 2N0A | G | 70 | VVTGVTAVA | 9 | 3 |
| 2N2C | D | 28 | 6CFH | B | 2 | WGMMGMLAS | 9 | 3 |
PDBid1 Ch1, Residue1 are the PDB id, chain id, and starting residue number of the protein where the sequence is in helix conformation, respectively; and PDBid2 Ch2, Residue2 are the corresponding quantities for the protein where the chameleon is in the sheet conformation. The last column (Number) gives the number of proteins in which this chameleon occurs.
Table 3.
Overall residue propensities.
| %(helix) | %(sheet) | %(helix)/%(aa) | %(sheet)/%(aa) | %(aa) | %(aa,Expasy) | |
|---|---|---|---|---|---|---|
| ALA | 11.10 | 6.25 | 1.386 | 0.780 | 8.01 | 8.25 |
| CYS | 1.16 | 1.95 | 0.855 | 1.442 | 1.35 | 1.37 |
| ASP | 4.97 | 3.07 | 0.882 | 0.545 | 5.64 | 5.45 |
| GLU | 8.87 | 4.51 | 1.342 | 0.682 | 6.61 | 6.75 |
| PHE | 4.05 | 5.58 | 1.036 | 1.427 | 3.91 | 3.86 |
| GLY | 3.59 | 4.94 | 0.484 | 0.665 | 7.42 | 7.07 |
| HIS | 2.15 | 2.26 | 0.798 | 0.842 | 2.69 | 2.27 |
| ILE | 6.10 | 9.62 | 1.087 | 1.715 | 5.61 | 5.96 |
| LYS | 6.50 | 4.74 | 1.100 | 0.802 | 5.91 | 5.84 |
| LEU | 11.89 | 10.23 | 1.319 | 1.135 | 9.02 | 9.66 |
| MET | 2.79 | 2.22 | 1.189 | 0.948 | 2.34 | 2.42 |
| ASN | 3.26 | 2.60 | 0.779 | 0.620 | 4.19 | 4.06 |
| PRO | 2.42 | 1.90 | 0.520 | 0.409 | 4.65 | 4.70 |
| GLN | 4.65 | 3.00 | 1.231 | 0.794 | 3.78 | 3.93 |
| ARG | 6.04 | 4.47 | 1.165 | 0.862 | 5.18 | 5.53 |
| SER | 4.88 | 5.40 | 0.773 | 0.856 | 6.31 | 6.56 |
| THR | 4.29 | 6.87 | 0.769 | 1.229 | 5.59 | 5.34 |
| VAL | 6.36 | 13.52 | 0.905 | 1.925 | 7.02 | 6.87 |
| TRP | 1.52 | 1.81 | 1.137 | 1.354 | 1.34 | 1.08 |
| TYR | 3.43 | 5.06 | 0.998 | 1.472 | 3.44 | 2.92 |
%(aa) and %(aa,Expasy) is the percent of the data set used in this study and in the Expasy data set, respectively, that is residue aa. %(helix) and %(sheet) are the percent of helix and sheet occurrences, respectively, of residue aa.
Table 4.
Chameleon residue propensities.
| res | N(cham) | %(cham) | %(HS) | %(cham)/%(HS) | %(cham)/%(aa) | %(cham)/5 |
|---|---|---|---|---|---|---|
| ALA | 102,472 | 8.74 | 9.32 | 0.94 | 1.09 | 1.75 |
| CYS | 12,346 | 1.05 | 1.45 | 0.73 | 0.78 | 0.21 |
| ASP | 37,854 | 3.23 | 4.27 | 0.76 | 0.57 | 0.65 |
| GLU | 68,719 | 5.86 | 7.27 | 0.81 | 0.89 | 1.17 |
| PHE | 62,609 | 5.34 | 4.61 | 1.16 | 1.37 | 1.07 |
| GLY | 54,815 | 4.67 | 4.09 | 1.14 | 0.63 | 0.93 |
| HIS | 20,950 | 1.79 | 2.19 | 0.82 | 0.66 | 0.36 |
| ILE | 108,171 | 9.22 | 7.39 | 1.25 | 1.64 | 1.84 |
| LYS | 60,089 | 5.12 | 5.85 | 0.88 | 0.87 | 1.02 |
| LEU | 143,655 | 12.25 | 11.28 | 1.09 | 1.36 | 2.45 |
| MET | 26,285 | 2.24 | 2.58 | 0.87 | 0.96 | 0.45 |
| ASN | 31,384 | 2.68 | 3.02 | 0.89 | 0.64 | 0.54 |
| PRO | 11,719 | 1.00 | 2.23 | 0.45 | 0.21 | 0.20 |
| GLN | 40,116 | 3.42 | 4.04 | 0.85 | 0.91 | 0.68 |
| ARG | 61,077 | 5.21 | 5.46 | 0.95 | 1.01 | 1.04 |
| SER | 63,667 | 5.43 | 5.07 | 1.07 | 0.86 | 1.09 |
| THR | 70,060 | 5.97 | 5.24 | 1.14 | 1.07 | 1.19 |
| VAL | 131,596 | 11.22 | 8.99 | 1.25 | 1.60 | 2.24 |
| TRP | 12,907 | 1.10 | 1.63 | 0.68 | 0.82 | 0.22 |
| TYR | 52,136 | 4.45 | 4.03 | 1.10 | 1.29 | 0.89 |
%(cham) is P1(L,i) averaged over L > 4; %(cham)/%(HS) is P4(L,i) averaged over L > 4; %(cham)/%(aa) is P3(L,i) averaged over L > 4; and %(cham)/5 is P2(L,i) averaged over L > 4. P1(L,i),…, P4(L,i) are defined in Section 2.
Table 5.
Chameleon propensities of hydrophobic (H), polar (P), and charged (C) residues.
| N(cham) | %(cham) | %(HS) | %(cham)/%(HS) | %(cham)/%(aa) | %(cham)/5 | |
|---|---|---|---|---|---|---|
| H | 150,809 | 42.43 | 45.67 | 0.93 | 1.04 | 1.27 |
| P | 124,200 | 34.94 | 31.48 | 1.11 | 0.98 | 1.05 |
| C | 80,416 | 22.63 | 22.85 | 0.99 | 0.97 | 0.68 |
%(cham) is P1(L,i) averaged over L > 4; %(cham)/%(HS) is P4(L,i) averaged over L > 4; %(cham)/%(aa) is P3(L,i) averaged over L > 4; and %(cham)/5 is P2(L,i) averaged over L > 4. P1(L,i),…, P4(L,i) are defined in Section 2.
Table 6.
Chameleon propensities of hydrophobic (H), polar (P), positive (+), and negative (-) residues.
Table 6.
Chameleon propensities of hydrophobic (H), polar (P), positive (+), and negative (-) residues.
| N(cham) | %(cham) | %(HS) | %(cham)/%(HS) | %(cham)/%(aa) | %(cham)/5 | |
|---|---|---|---|---|---|---|
| H | 205,518 | 42.58 | 45.67 | 0.93 | 1.04 | 1.7 |
| O | 160,794 | 33.31 | 31.48 | 1.06 | 0.93 | 1.33 |
| N | 55,382 | 11.47 | 11.54 | 0.99 | 0.94 | 0.46 |
| P | 60,985 | 12.63 | 11.31 | 1.12 | 1.14 | 0.51 |
%(cham) is P1(L,i) averaged over L > 4; %(cham)/%(HS) is P4(L,i) averaged over L > 4; %(cham)/%(aa) is P3(L,i) averaged over L > 4; and %(cham)/5 is P2(L,i) averaged over L > 4. P1(L,i),…, P4(L,i) are defined in Section 2.
© 2018 by the author. Licensee MDPI, Basel, Switzerland. This article is an open access article distributed under the terms and conditions of the Creative Commons Attribution (CC BY) license (http://creativecommons.org/licenses/by/4.0/).
Share and Cite
MDPI and ACS Style
Mezei, M. Revisiting Chameleon Sequences in the Protein Data Bank. Algorithms 2018, 11, 114. https://doi.org/10.3390/a11080114
AMA Style
Mezei M. Revisiting Chameleon Sequences in the Protein Data Bank. Algorithms. 2018; 11(8):114. https://doi.org/10.3390/a11080114
Chicago/Turabian StyleMezei, Mihaly. 2018. "Revisiting Chameleon Sequences in the Protein Data Bank" Algorithms 11, no. 8: 114. https://doi.org/10.3390/a11080114
Note that from the first issue of 2016, this journal uses article numbers instead of page numbers. See further details here.