Article

Structural Fingerprints of Transcription Factor Binding Site Regions

by
Eleanor J. J. Gardiner
1,2,*,
Christopher A. Hunter
1 and
Peter Willett
2
1
Department of Chemistry, University of Sheffield, Sheffield, S3 7HF, UK
2
Department of Information Studies, University of Sheffield, Sheffield, S1 4DP, UK
*
Author to whom correspondence should be addressed.
Algorithms 2009, 2(1), 448-469; https://doi.org/10.3390/a2010448
Submission received: 4 December 2008 / Revised: 2 February 2009 / Accepted: 5 March 2009 / Published: 10 March 2009
(This article belongs to the Special Issue Algorithms and Molecular Sciences)

Abstract

:
Fourier transforms are a powerful tool in the prediction of DNA sequence properties, such as the presence/absence of codons. We have previously compiled a database of the structural properties of all 32,896 unique DNA octamers. In this work we apply Fourier techniques to the analysis of the structural properties of human chromosomes 21 and 22 and also to three sets of transcription factor binding sites within these chromosomes. We find that, for a given structural property, the structural property power spectra of chromosomes 21 and 22 are strikingly similar. We find common peaks in their power spectra for both Sp1 and p53 transcription factor binding sites. We use the power spectra as a structural fingerprint and perform similarity searching in order to find transcription factor binding site regions. This approach provides a new strategy for searching the genome data for information. Although it is difficult to understand the relationship between specific functional properties and the set of structural parameters in our database, our structural fingerprints nevertheless provide a useful tool for searching for function information in sequence data. The power spectrum fingerprints provide a simple, fast method for comparing a set of functional sequences, in this case transcription factor binding site regions, with the sequences of whole chromosomes. On its own, the power spectrum fingerprint does not find all transcription factor binding sites in a chromosome, but the results presented here show that in combination with other approaches, this technique will improve the chances of identifying functional sequences hidden in genomic data.

1. Introduction

The recent complete sequencing of genomes [1,2,3] has led to an urgent need for new methods for genomic data analysis. At most 5% of the human genome codes for proteins: the function of most of the remaining ‘junk’ DNA is unknown [4]. Fourier transform methods have frequently been used in the analysis of DNA sequences, particularly in the identification of coding regions [5,6,7]. The degeneracy of the genetic code results in the likely repeat of T nucleotides in every third position: this gives a peak at 3 in the power spectrum of an exonic sequence. Several workers have used Fourier techniques to detect a sequence periodicity of between 10 and 11 bp [8,9] in genomic sequences, related to the DNA helical repeat. The results are sufficiently sensitive to distinguish between periodicities of 10 bp in archebacteria and 11 bp in eubacteria [8]. Widom has observed a periodicity of 10.2 bp in the occurrence of AA dinucleotides in eukaryotic but not prokaryotic genomes [10]. This is probably related to the related to the preferential positioning of nucleosomes in eukaryotes. Fourier techniques have also been used in the alignment of nucleosomal DNA sequences [11] and in the prediction of nucleosome array formation [12]. Very recently, Fourier methods have been used in two new contexts. D’Avenio et al have reported a Fourier transform method, SWIFT, for identifying protein sequences of a given class from the raw DNA sequence [13]. Sharma et al have developed the Spectral Repeat Finder to look for the location of both tandem and dispersed repeats [14]. Their method is somewhat similar to the method we propose for DNA structural properties. Spectral Repeat Finder uses the power spectrum of a DNA sequence to find the length of any repetitive element, followed by a windowing technique to locate the precise DNA repeat.
Recently we have applied Fourier transform techniques in an analysis of the structural properties of sets of Ultra Conserved Elements (UCEs) [15], and Conserved Non-Genic sequences (CNGs) [16,17]. Each of these sets contain sequences which are highly conserved between mouse and human over hundreds of bases. We showed that the power spectra of certain structural properties were able to distinguish coding from non-coding elements and also that a subset of the UCEs contained a repeating 6.2 bp 3-step roll motif [18]. In previous work we constructed the potential energy surfaces for all octamers in double helical DNA, as a function of the two principal degrees of freedom, slide and shift at the central step [19,20,21,22,23,24]. Analysis of these potential energy maps allowed us to compile a database of the structural properties of all 32, 896 unique DNA octamers, including information on stability, the minimum energy conformation and flexibility [25,26]. In a very recent analysis of methylated versus non-methylated CpG islands, certain of these structural properties, in particular high rise and low twist were found to be highly correlated with CpG island methylation and were used in the very successful prediction of further methylation patterns [27].
The structural properties considered here are summarised in Table 1. One concept may be unfamiliar. The ability of a DNA sequence to adopt a specific overall shape depends on the ability of dinucleotide steps to adapt their structure to fit the conformational preferences of their neighbours. Structural variation at the dinucleotide level may be compensated for by conformation changes in the neighbouring dinucleotides. This has the effect of smoothing variation along the sequence.
Table 1. Octamer Structural Properties.
PropertyDescription
twist3, roll3, slide3, shift3the values of the four 3-step parameters, 3-step twist, roll, slide, shift at the octamer central step
groovethe minor groove width, measured as the minimum phosphate-phosphate distance
RMSDRMSD from a notional straight path through the centres of the base-pair triads
Bistabilitypossessing 2 distinct energy minima
flexibility force constants, k-Roll, k +Roll, k -Twist, k +Twistfor twist, roll, the force constant required to move the parameter from its minimum energy value. Low values are flexible.
3-step flexibility force constants, 3k-Roll, 3k +Roll, 3k -Twist, 3k +Twistfor 3-step twist, 3-step roll, the force constant required to move the parameter from its minimum energy value. Low values are flexible.
flexibility partition coefficients, Q-Roll, Q+Roll, Q-Twist, Q+Twistflexibility force constants, converted to partition coefficients using Boltzmann’s equation.
Q = 0.5 e ( k / 2.5 ) x 2 d x .
Low values are inflexible.
3-step flexibility partition coefficients, 3Q-Roll, 3Q+Roll, 3Q-Twist, 3Q+Twistdecreasing 3-step force constants, converted to partition coefficients using Boltzmann’s equation. Low values are inflexible.
We therefore defined a new set of 3-step parameters that allow for the smoothing effect of two neighbouring steps on the properties of the central step. To obtain these parameters for an octamer, we consider the outer base pairs of the central three base steps (four base pairs) and calculate the overall values of roll, twist, slide and shift as if this was one giant base step [26]. The properties may be considered as belonging to one of two classes. The first class (the 3-step parameters, RMSD, minor groove width, bistablility) describes characteristics of the DNA double helix in its ground-state (usually B-DNA or A-DNA). The second class (the force constants and partition coefficients) describe the ability of the DNA sequence to change its conformation. For the two most important deformations, roll and twist, we also calculated decreasing and increasing 3-step-flexibility force constants and partition coefficients. We refer the reader to references [25,26] for detailed definitions and graphical illustrations of these properties. We now introduce an analysis of double-stranded DNA based upon the power spectrum of its structural properties.

2. Methods

The basis of this work is the observation that if a length of DNA contains a repetitive structural property motif this will be observed as a peak in the power spectrum obtained by taking the Fourier transform of that length of structural property values. The peaks correspond to the periodicity of the repeat. They give no information as to the location of the peak within the sequence. Our strategy when dealing with long sequences, such as an entire chromosomes, is therefore to consider the chromosome as a set of shorter sequence blocks and to obtain the power spectrum of each block separately. When dealing with sets of sequences, the power spectrum of a single sequence for a particular structural property can be regarded as a structural fingerprint which characterises the structural patterns observed within the sequence and can be used to search amongst a set of other fingerprints in order to retrieve similar structures.

2.1. Fourier Transform Methods

If a length of DNA contains a repetitive structural property motif this will be observed as a peak in the power spectrum obtained by taking the Fourier transform of that length of structural property values. The procedure we have followed is therefore:
1)
Take a long DNA sequence S, such as an entire chromosome, of length N bases and also a structural parameter, p, (for example roll 3).
2)
First pre-process the DNA sequence. For simplicity, any bases represented by N’s are deleted. (There are relatively very few of these with 140 N’s in the euchromatic portion of chromosome 21 and 333 in the euchromatic portion of chromosome 22. ) All lower case entries are replaced by their upper case equivalent.
3)
Consider S as a set of N-7 overlapping octamers. Divide the sequence of octamers into blocks of size M. (M is 1024 in all the work described here. N.B. 1024 octamer comprise 1031 nucleotides. In preliminary work values of M = 512 and M = 2048 gave very similar results.)
4)
For each block,
  • Replace the sequence of letters by a numeric vector, consisting of the value of p determined by the minimum energy structure of each octamer.
  • Take the M-step Fourier transform of the structural property vector.
  • Obtain the power spectrum. (NB Although the power spectra are of length 1024, they are symmetric about the centre and so only the first 512 elements need be considered).
5)
Sum the power spectra.
6)
Optionally, normalise by dividing each element of the total spectrum by the number of blocks, to obtain a mean structural power spectrum representing the entire DNA length.
When dealing with lengths of DNA comprising fewer than 1024 octamers, the process is similar, except that the structural parameter vector is padded with zeroes to give 1024 values, prior to taking its Fourier transform.
Since the persistence length (the distance over which the direction of a polymer segment persists, owing to limited flexibility of the polymer) of DNA is about 150 bp, the structural parameters within each block are independent of those in the remaining blocks. We therefore sum the power spectra (Step 5), which has the effect of amplifying peaks which are found in multiple blocks. Using this method it is possible to miss patterns which overlap two blocks. However, if such a pattern occurs only once or twice within a very long sequence it will certainly be lost amongst the noise since, for example, there are 33,369 such blocks in human chromosome 21, the smallest chromosome, whilst if it occurs multiple times, most occurrences will miss an overlap. We implemented an overlapping scheme (data not shown) and found no noticeable difference in the patterns of peaks obtained to those shown here. We thus proceeded without overlap since this method facilitates the matching of a peak to the subsequences which caused it.
It is common to estimate the noise in such spectra by randomising the DNA sequence and obtaining the power spectrum of the shuffled sequence [10]. We have followed this procedure, with an important modification. Rather than randomise a single sequence, we have preserved the proportion of nucleotides at a local level by randomising each block of M octamers separately. This ensures that local peaks are not solely due to the local base composition of the sequence, since such peaks will also be present in the spectrum of the randomised DNA. We then obtain a difference spectrum for the set of blocks by subtracting the summed shuffled spectra from the summed genomic spectra.
Bistable octamers have two low energy structures. Our previous studies have shown that bistability is an important structural feature. In order to calculate a power spectrum representing bistability we generate a numeric sequence by replacing each octamer by 1.0 if it is bistable and 0.0 otherwise in step 4a above.
In order to compare the structural parameter spectra with sequence we have followed the methods adopted by several previous workers [10,14,28] to obtain the power spectrum of a DNA sequence. In a long DNA sequence, each occurrence of a particular nucleotide is replaced by 1.0 and that of all other nucleotides by 0.0. We again treat a long sequence as a set of blocks of length M, obtain the power spectra for each block and sum over all blocks. This process is repeated for each of A,C,G,T, the resulting spectra are all summed and the result is normalised by dividing each element of the total spectrum by the number of blocks. To avoid confusion, we refer to this as an occurrence spectrum, since it reflects the periodic occurrence of nucleotide types. The occurrence spectra represent the single-base properties of the individual nucleotides whereas the structural property spectra take care of dinucleotide and longer-distance cooperativity. The Fourier transforms were performed using Matlab (www.mathworks.com).

2.2. Transcription Factor Binding Site Regions

Sets of Transcription Factor (TF) binding site containing regions for three transcription factors, Sp1, p53 and cMyc, have been reliably mapped in chromosomes 21 and 22 by Affymetrix [29,30,31] using high-density, tiled arrays in combination with chromatin immunoprecipitation (ChIP) technology. (NB we refer to the short transcription factor binding sire motif as a TFBS and the longer mapped region around the TFBS as the tfbs). We wish to investigate the power spectra of these sets of sequences, and in particular to see if any features are common to all sets, or more probably, if there is any similarity between the spectra of tfbs containing a particular type of TF.
Most of the tfbs were given as sequences of 1,001 bp. All the longer tfbs were longer than 1,031 bp and would therefore require a different Fourier transform length and/or consequent scaling of the peaks. Since this is an exploratory investigation, it was therefore decided to discard all tfbs longer than this 1,001 bp for the initial experiments. We also discarded overlapping tfbs, since any structural periodicity present in overlapping DNA would be represented twice although really only present once. This gave sets of 89 Sp1, 34 p53 and 221 cMyc tfbs in chromosome 21 and 209 Sp1, 63 p53 and 435 cMyc tfbs in chromosome 22.
We also shuffled the DNA sequences of each tfbs (as described previously) to obtain a set of sequences each of which contained the same proportion of A, C, G, T as one of the original tfbs sequences. This was done initially, and then whenever a randomised set of spectra was required, the appropriate set of randomized sequences was used to generate the spectra.

2.3. Tfbs Retrieval Experiments

In these experiments we regard the power spectra of the tfbs as fingerprints and the set of power spectra of an entire chromosome as a database of fingerprints to be searched. We have mapped the spectra of a set of tfbs to their position in the entire chromosome spectra in the following manner. The sequence of the entire chromosome, from BUILD 35 of the human genome [2] was obtained from UCSF [32]. The spectrum of each consecutive 1031-base pair block of the chromosome was obtained as described above, giving 33,369 power spectra for chromosome 21 and 33,949 spectra for chromosome 22.
The sequences of the transcription tfbs obtained from Affymetrix were actually from BUILD 32. This was a problem, since BUILD 32 is no longer available, and the addition of new sequence data in later builds means that a position in the chromosome from BUIILD 32 no longer corresponds to the tfbs in BUILD 35. The spectrum of a tfbs was therefore mapped to the equivalent chromosomal spectrum using a similarity search, where the similarity, d, between two spectra was measured using the complement of the cosine coefficient. Given two spectra (we used roll3 spectra), S=(s1, s2,.., sn), C=(c1, c2,.., cn), the cosine distance d between them is:
d = 1 i n s i c i i n s i 2 i n c i 2
We calculated the cosine distances between a tfbs power spectrum and each of the power spectra of the entire chromosome, sorted the distances, and in most cases the most similar spectrum by some distance was that of the ‘correct’ block of the chromosome. NB this is not always the case since a tfbs will almost certainly overlap two consecutive 1,031 bp chromosome sequences, and then, if whatever structural pattern it contains is similarly divided over two blocks, it may not be found by the similarity search. However this occurred in only 10% of cases. In these cases, BLAT [33] sequence searches were carried out to determine which block contained the larger portion of the tfbs sequence.
Given a set of transcription tfbs, S, and a particular structural property, p, the fingerprint for each member of S was used to search the entire set of fingerprints of its chromosome using a similarity search as described above, and the number of members of S in the top fraction was recorded. We used two different methods in order to get an estimate of the likelihood of the retrieval being achieved by chance. Firstly, we chose blocks at random from the chromosome and used these as fingerprints to search the chromosomal spectra. Secondly, the set of fingerprints, R, of the randomised versions of the sequences in S, was also used to search the chromosomal spectra and the count of members of S again recorded. Since a member of S has an advantage if it is allowed to find itself, this was disallowed. This actually gives members of S an inbuilt disadvantage, since their maximum possible retrieval is one less than for the randomised sequences.
Initial experiments used Sp1 tfbs in chromosome 21. Sp1 tfbs retrieval was measured at the 1% level. Thus if the search results were completely random, the expected value would be 0.88, since there are 89 Sp1 tfbs, but a tfbs is not allowed to recall itself. The significance of any difference in retrieval rates was measured by a one-sided Mann-Whitney test. A z-score of 1.96 is significant at the 95% level.
Data fusion is a technique used in searching databases of small molecules, with the aim of increasing the number of active molecules retrieved by a target molecule [34,35] and also in consensus scoring for protein-ligand docking [36]. Our aim, in using data fusion, is to increase the number of true positives in the top fraction of the database. Ginn et al found that a sum fusion method, based on the ranking produced by the similarity searches, was the most effective of those studied [34], and we have thus adopted this approach. Our method to fuse two similarity searches is to score each block by its rank in each of the two lists of similarities. We then add the scores to give a new ranksum score, re-rank by the ranksums and take the top fraction of this new list. For example, if we wish to fuse the results of searching for Sp1 tfbs using minor groove width and roll3, we take a target tfbs, rank the chromosome blocks in order of decreasing similarity to its minor groove width spectrum giving list 1 and in order of decreasing similarity to its roll3 spectrum giving list 2. Then a block which is ranked 20th in list 1 and 35th in list 2 has a ranksum similarity to the target tfbs of 55. Combining three or more searches is done similarly. We have previously successfully implemented this technique in a promoter finding experiment [25].

3. Results and Discussion

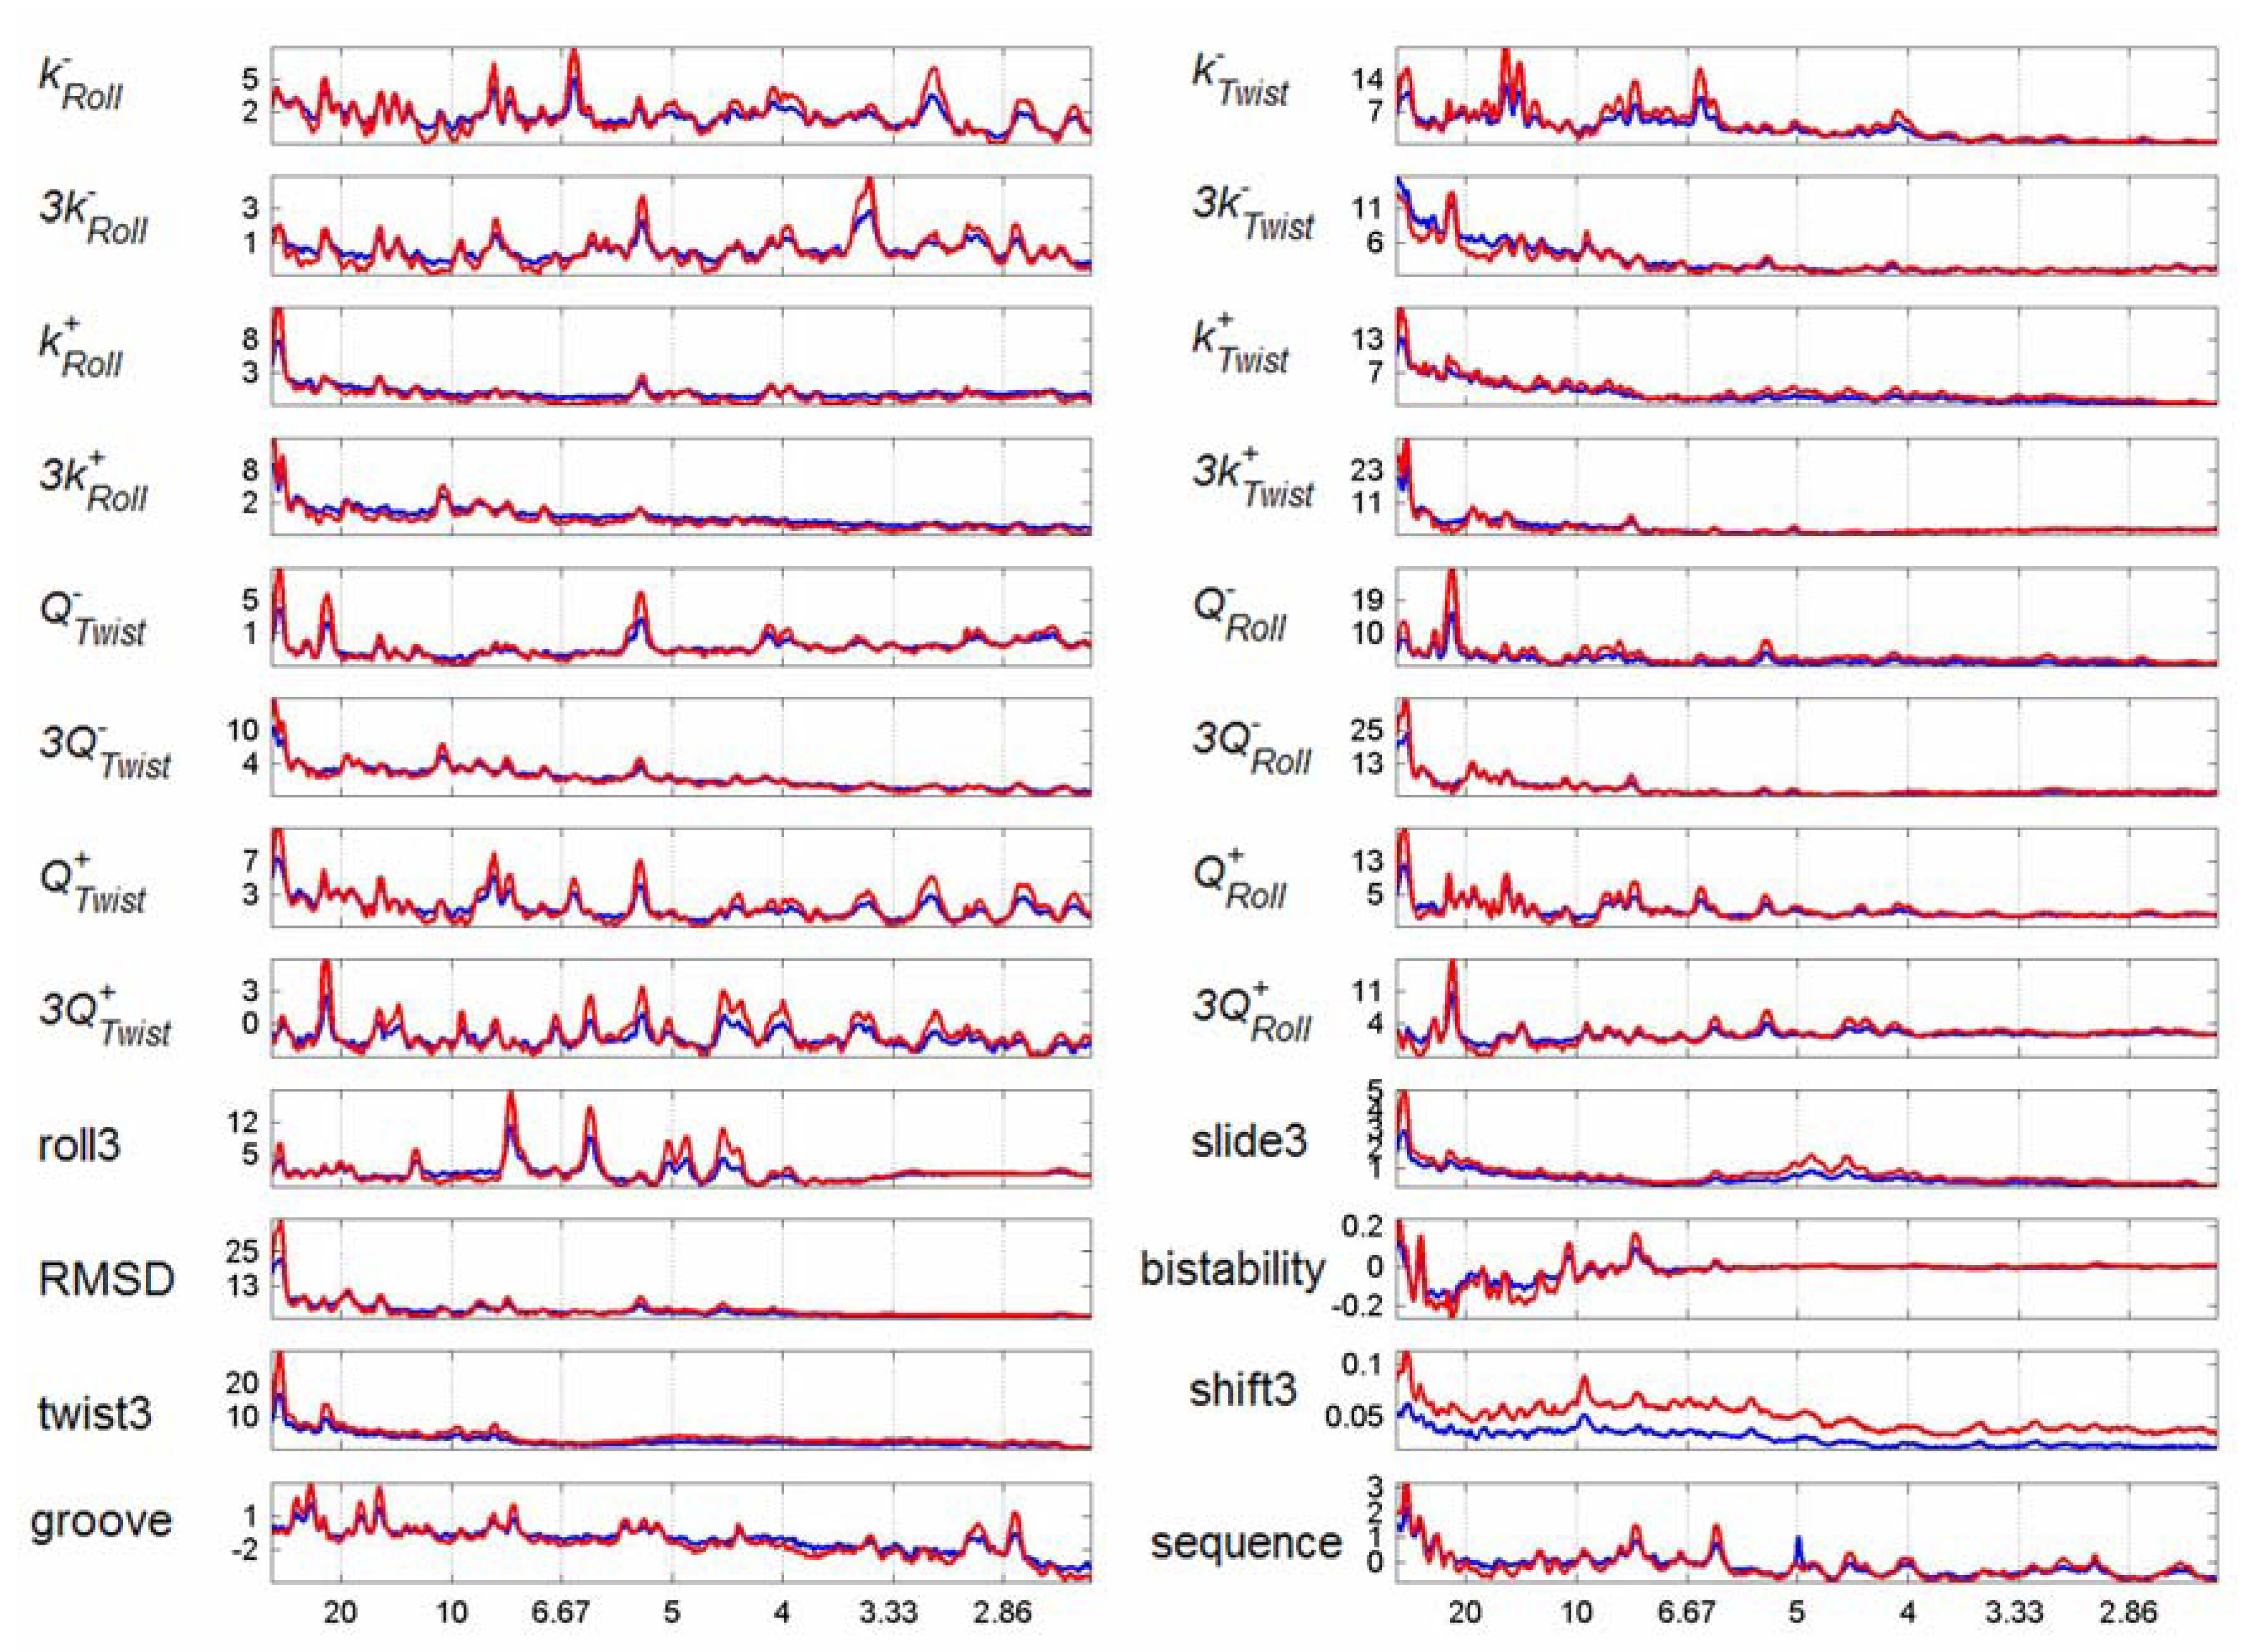
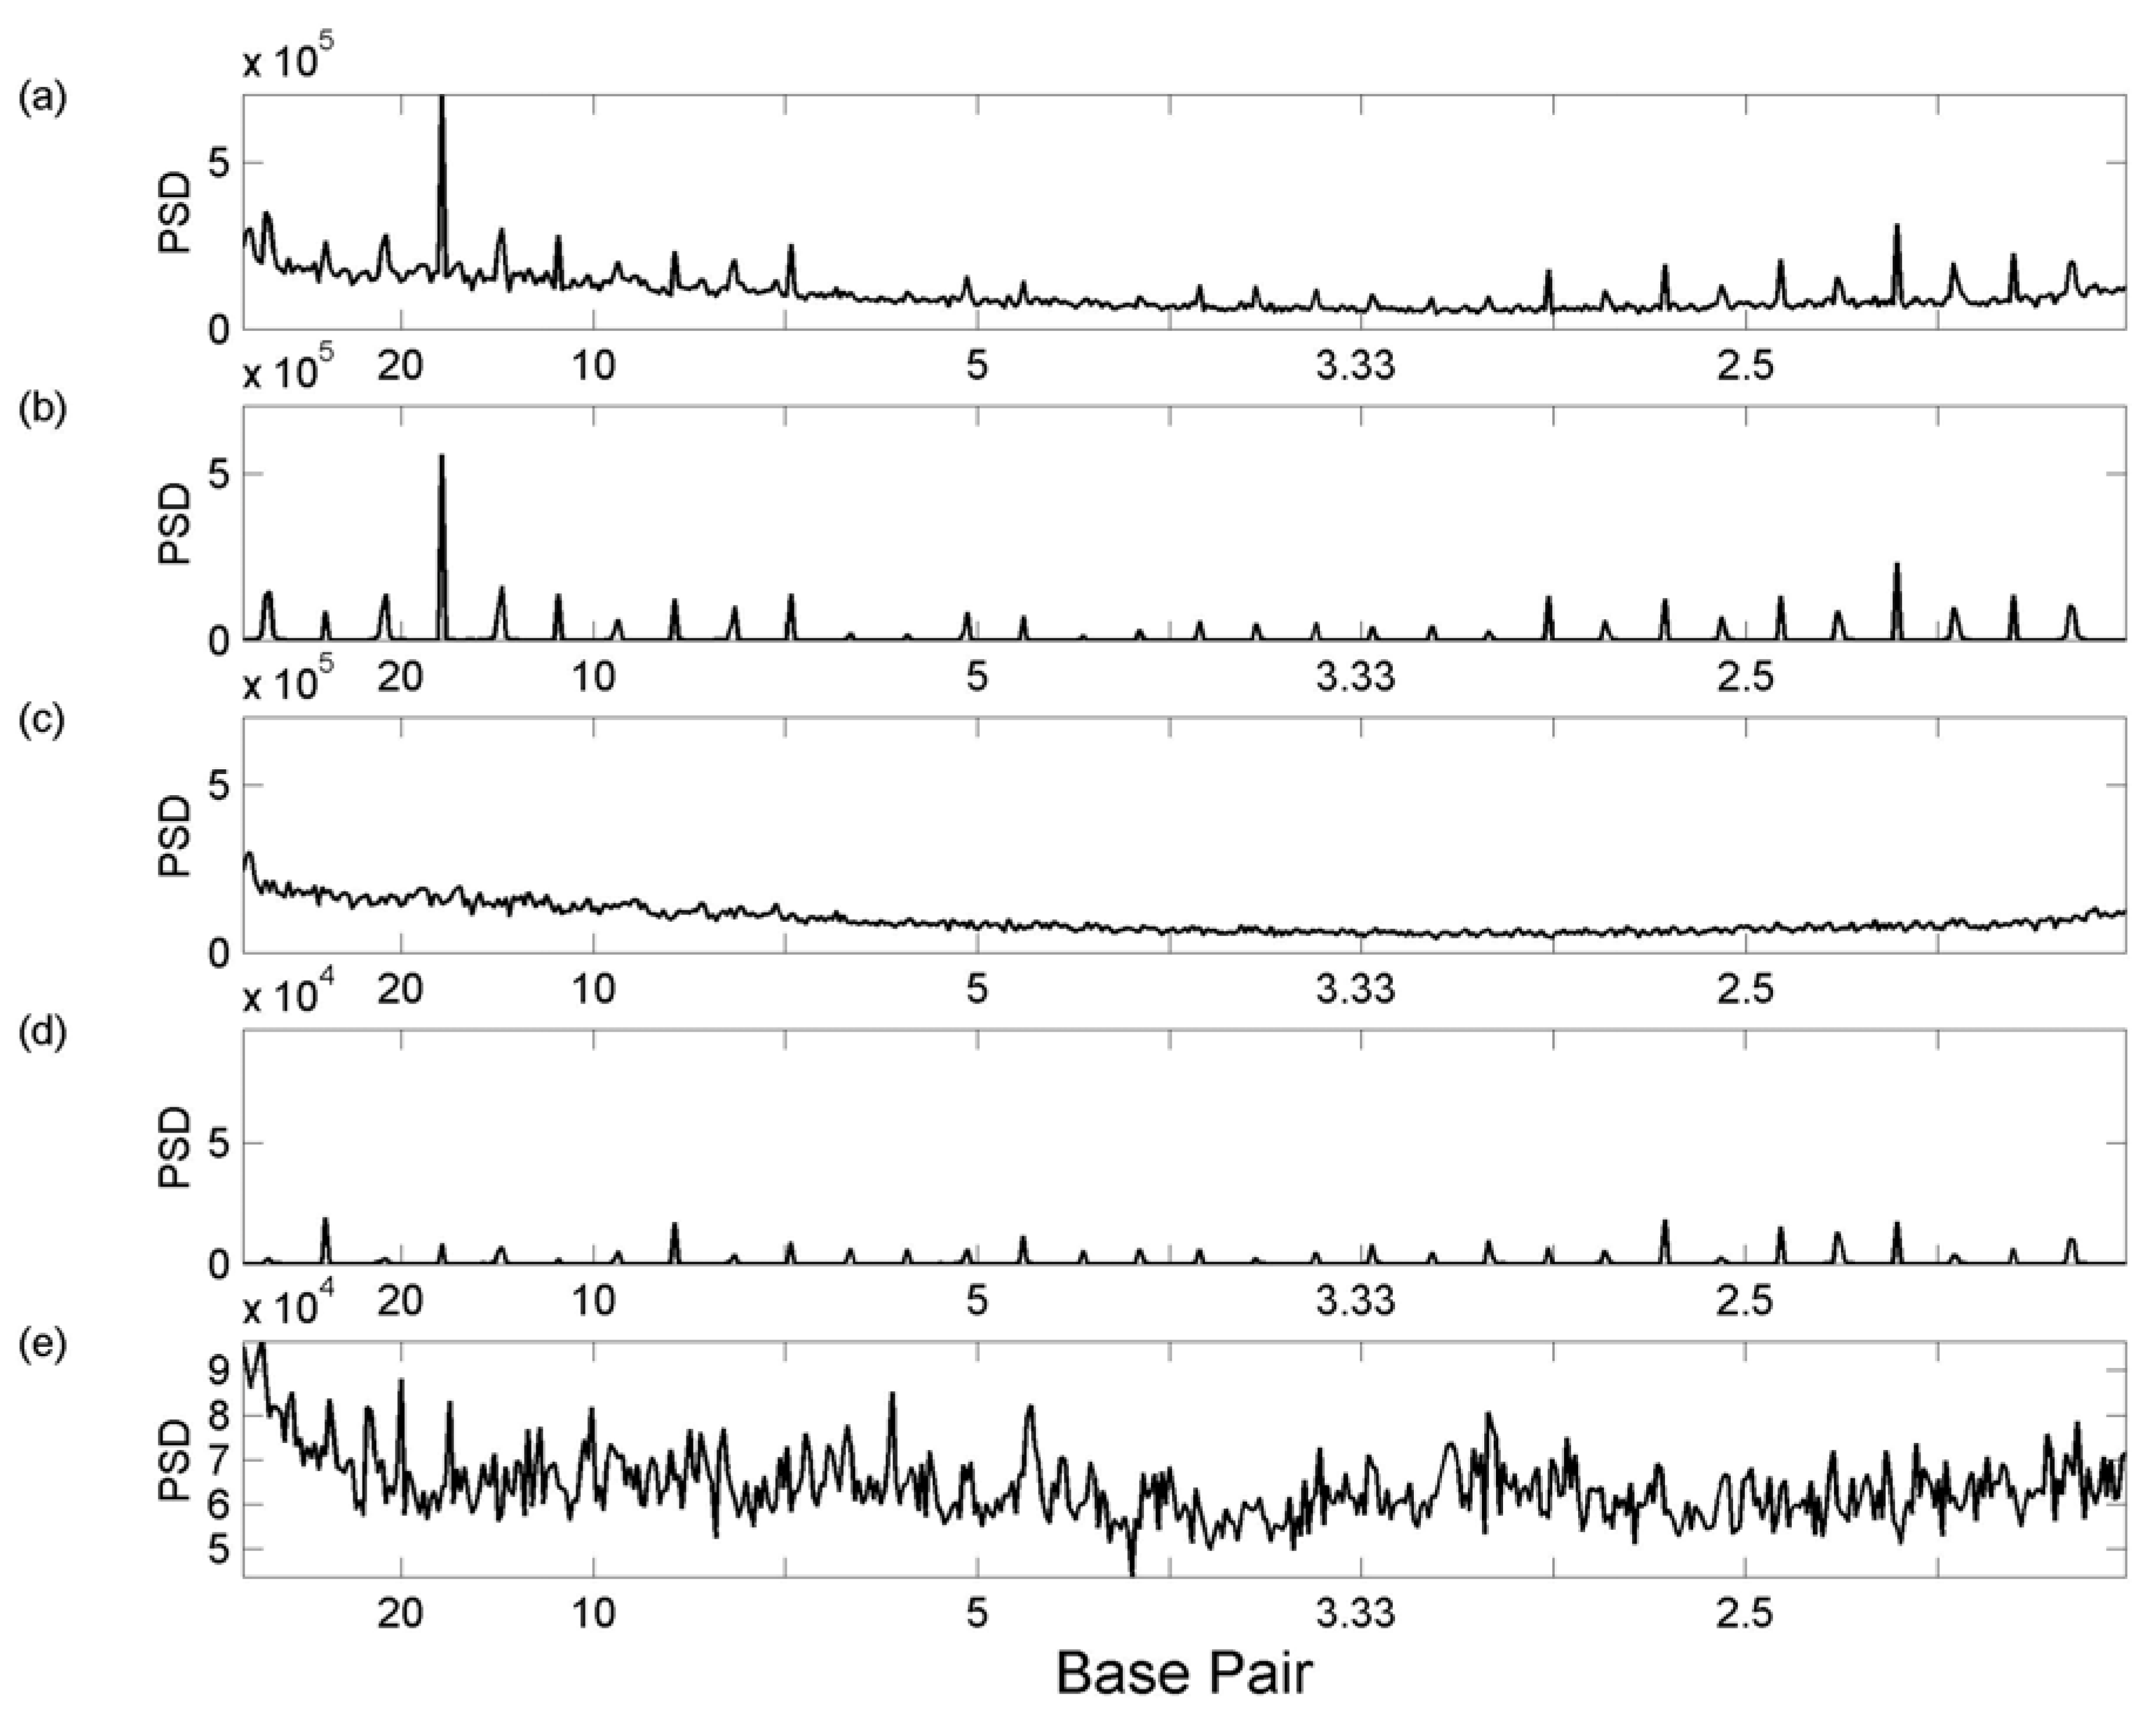
3.1 Whole Genome Transforms

Figure 1 illustrates the process of comparing difference spectra for chromosomes 21 and 22, for two properties, roll3 and sequence. Chromosomes 21 and 22 were each divided into 1031 bp blocks and their mean power spectra obtained (panels (c), (d), and (h), (i) respectively). Their shuffled power spectra (as described in the Approach section) were also obtained (panels (a), (b), and (f), (g)). Their difference spectra are shown in Figure 1(e) and (j). For example, panel(e) shows the difference spectra of chromosome 21 (obtained by subtracting panel (a) from panel (c)) in blue with that of chromosome 22 (obtained by subtracting panel (b) from panel (d)) in red.
Figure 1. Comparing Spectra. Left-hand panels are roll3, right-hand are sequence. (a) roll3 spectra of shuffled chromosome 21; (b) roll3 spectra of shuffled chromosome 22; (c) roll3 spectra of chromosome 21; (d) roll3 spectra of chromosome 22; (e) roll3 difference spectra of chromosome 21 (blue line) and chromosome 22 (red line). (f) sequence spectra of shuffled chromosome 21; (g) sequence spectra of shuffled chromosome 22; (h) sequence spectra of chromosome 21; (i) sequence spectra of chromosome 22; (j) sequence difference spectra of chromosome 21 (blue line) and chromosome 22 (red line). In each case the y-axis is the spectral value divided by 10,000. All figures were drawn in Matlab (www.mathworks.com).
Algorithms 02 00448 g001
Notice that the roll3 spectra of both the randomised and shuffled sequences have the same overall sine wave shape. This is due to the structure imposed on the spectra by considering the sequences as a series of overlapping octamers. Since an octamer differs in only one nucleotide from its neighbour octamer, this imposes a relationship on the neighbouring parameter values which are generally similar from octamer to octamer. Although the particular shape of the spectra is parameter-dependent, the same effect is seen in all structural parameter spectra plots. This is in sharp contrast to the sequence plot [Figures 1(f) – (i)], where, since there is no relationship between the neighbouring bases in the shuffled sequence, the shuffled plots are straight.
Although the shape of the shuffled and genomic roll3 plots are similar, the genomic plots have many sharp peaks, indicating the non-random organization of structural features, clearly absent from the shuffled sequences.
In Figure 2 we plot the difference spectra of human chromosomes 21 and 22 (in blue and red respectively), as per Figure 1(e), for each of the structural parameters of Table 1 and also for sequence. All the spectra increase in intensity as the periodicity decreases. This tends to obscure meaningful peaks – thus we have plotted only the region between 55 bp and 2.5 bp.
The spectra of chromosomes 21 and 22 are strikingly similar. The only differences are in the relative intensity of the peaks rather than in their positions. The sequence plot has many peaks, clearly present in both chromosomes, representing the non-random organization of genomic sequence. Both chromosomes show a clear peak at 3 bp which has previously been noted by many other workers [5,10,13] and is indicative of the presence of coding sequences. The peaks at 6.1 and 12 bp are overtones of this primary peak.
Some parameters are related - for example decreasing roll flexibility, decreasing roll3 flexibility, Q-Roll, and 3 Q-Roll all describe in some measure the ability of DNA to move to a lower value of roll. Such sets of parameters commonly exhibit at least some of the same peaks. Peaks are found at 6.4 bp for all decreasing roll flexibility parameters, and at 23 bp for all increasing roll flexibility parameters. Neither of these peaks are present in the sequence spectra.
Figure 2. Whole Chromosome Difference Spectra. Mean power spectra of chromosome 21 less mean power spectra of randomised chromosome 21 (blue line), Mean power spectra of chromosome 22 less mean power spectra of randomised chromosome 22 (red line), for selected structural properties. In each case the y-axis is the difference divided by 10000.
Algorithms 02 00448 g002
We note that some parameters, most evidently k+Roll, Q-Roll, Q-Twist, 3-step shift, show a peak every three base pairs, as does twist (not shown), corresponding to the presence of codons, which has previously been noted in the sequence plots. Coding DNA represents less than 2% of the content of the human genome and yet can be found as a peak in these structural DNA spectra. This is very pleasing, since it demonstrates that the structural power spectra are capable of finding known features, which gives a degree of confidence in the relevance of other findings.
Some parameters, such as roll3, closely mirror that of sequence, whilst others have clear peaks in common with sequence whilst also possessing distinct and interesting peaks. For example minor groove width has clear peaks at 6.1, 7.9 and 9.8 bp, as does sequence, but in addition has a major peak at 10.3 bp , very close to the double helical pitch, which is completely absent from the sequence plot. This is very close to the peak at 10.2 bp for AA dimers 10] which is thought to be important in the bending of nucleosome-wrapping sequences.
The peaks shown in Figure 2 clearly indicate the non-random organisation of structural features in the genome, which is different to the non-random organization of sequence, and which could have significant implication for understanding the role of non-coding DNA elements.

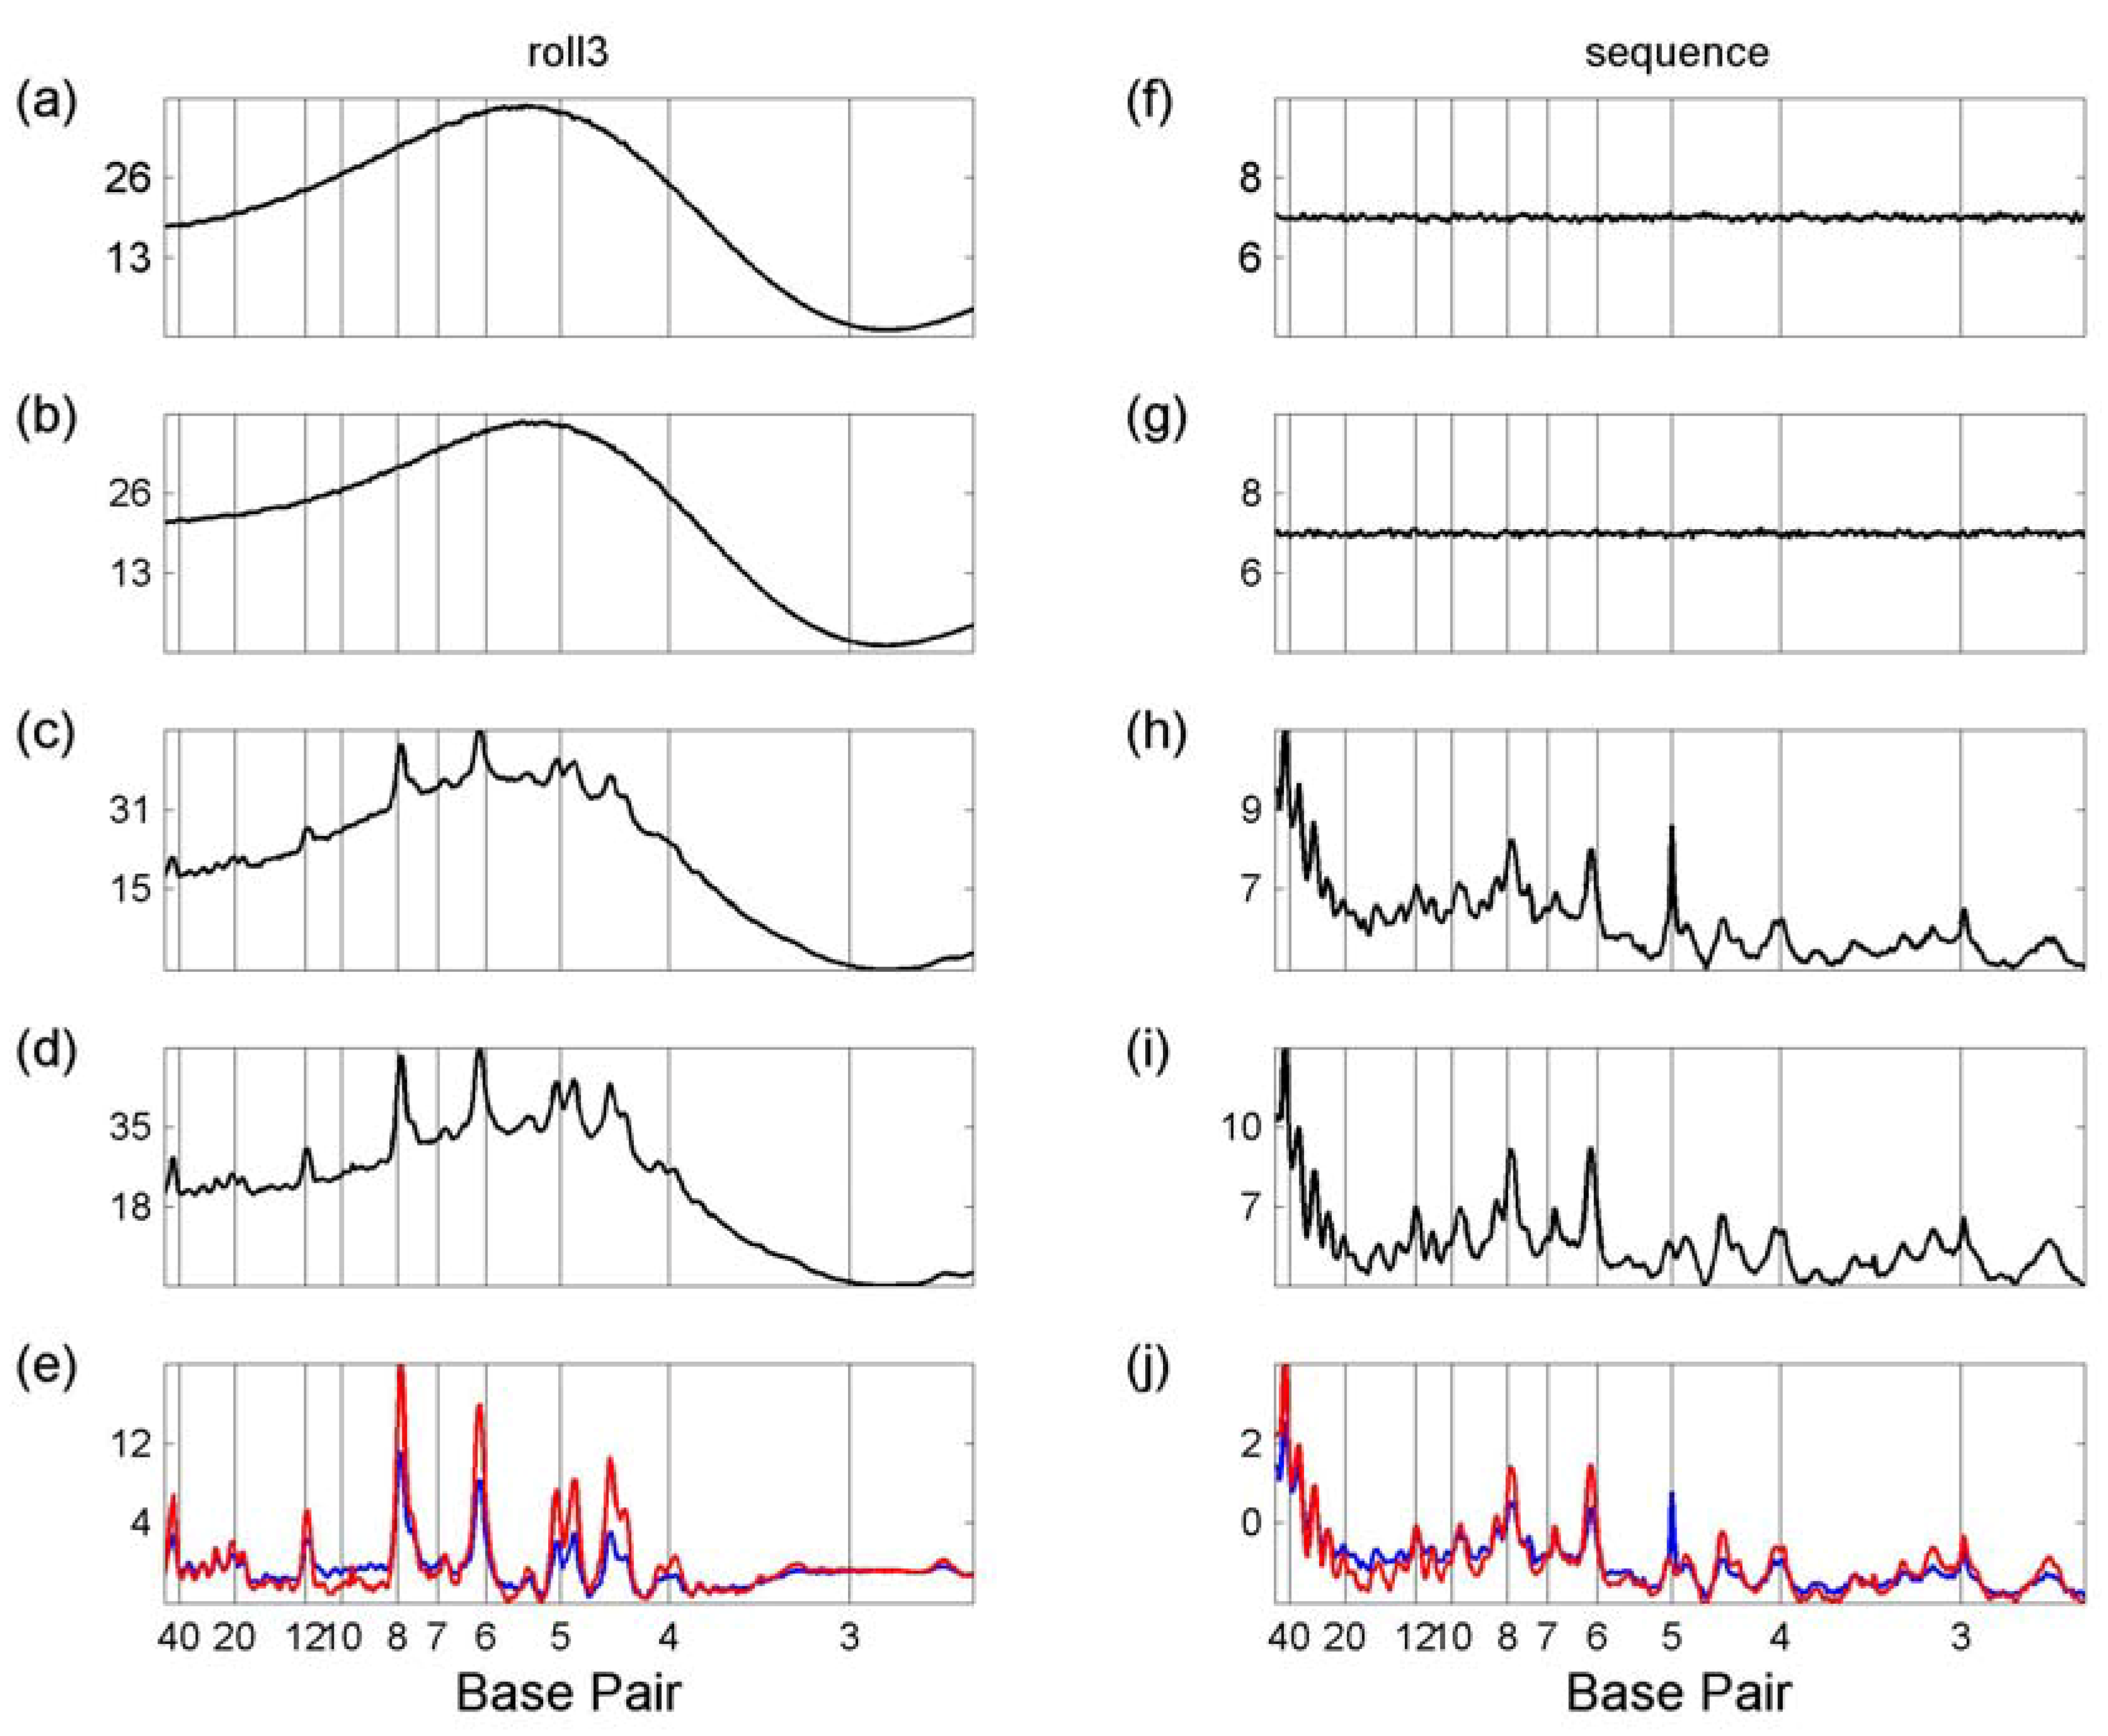
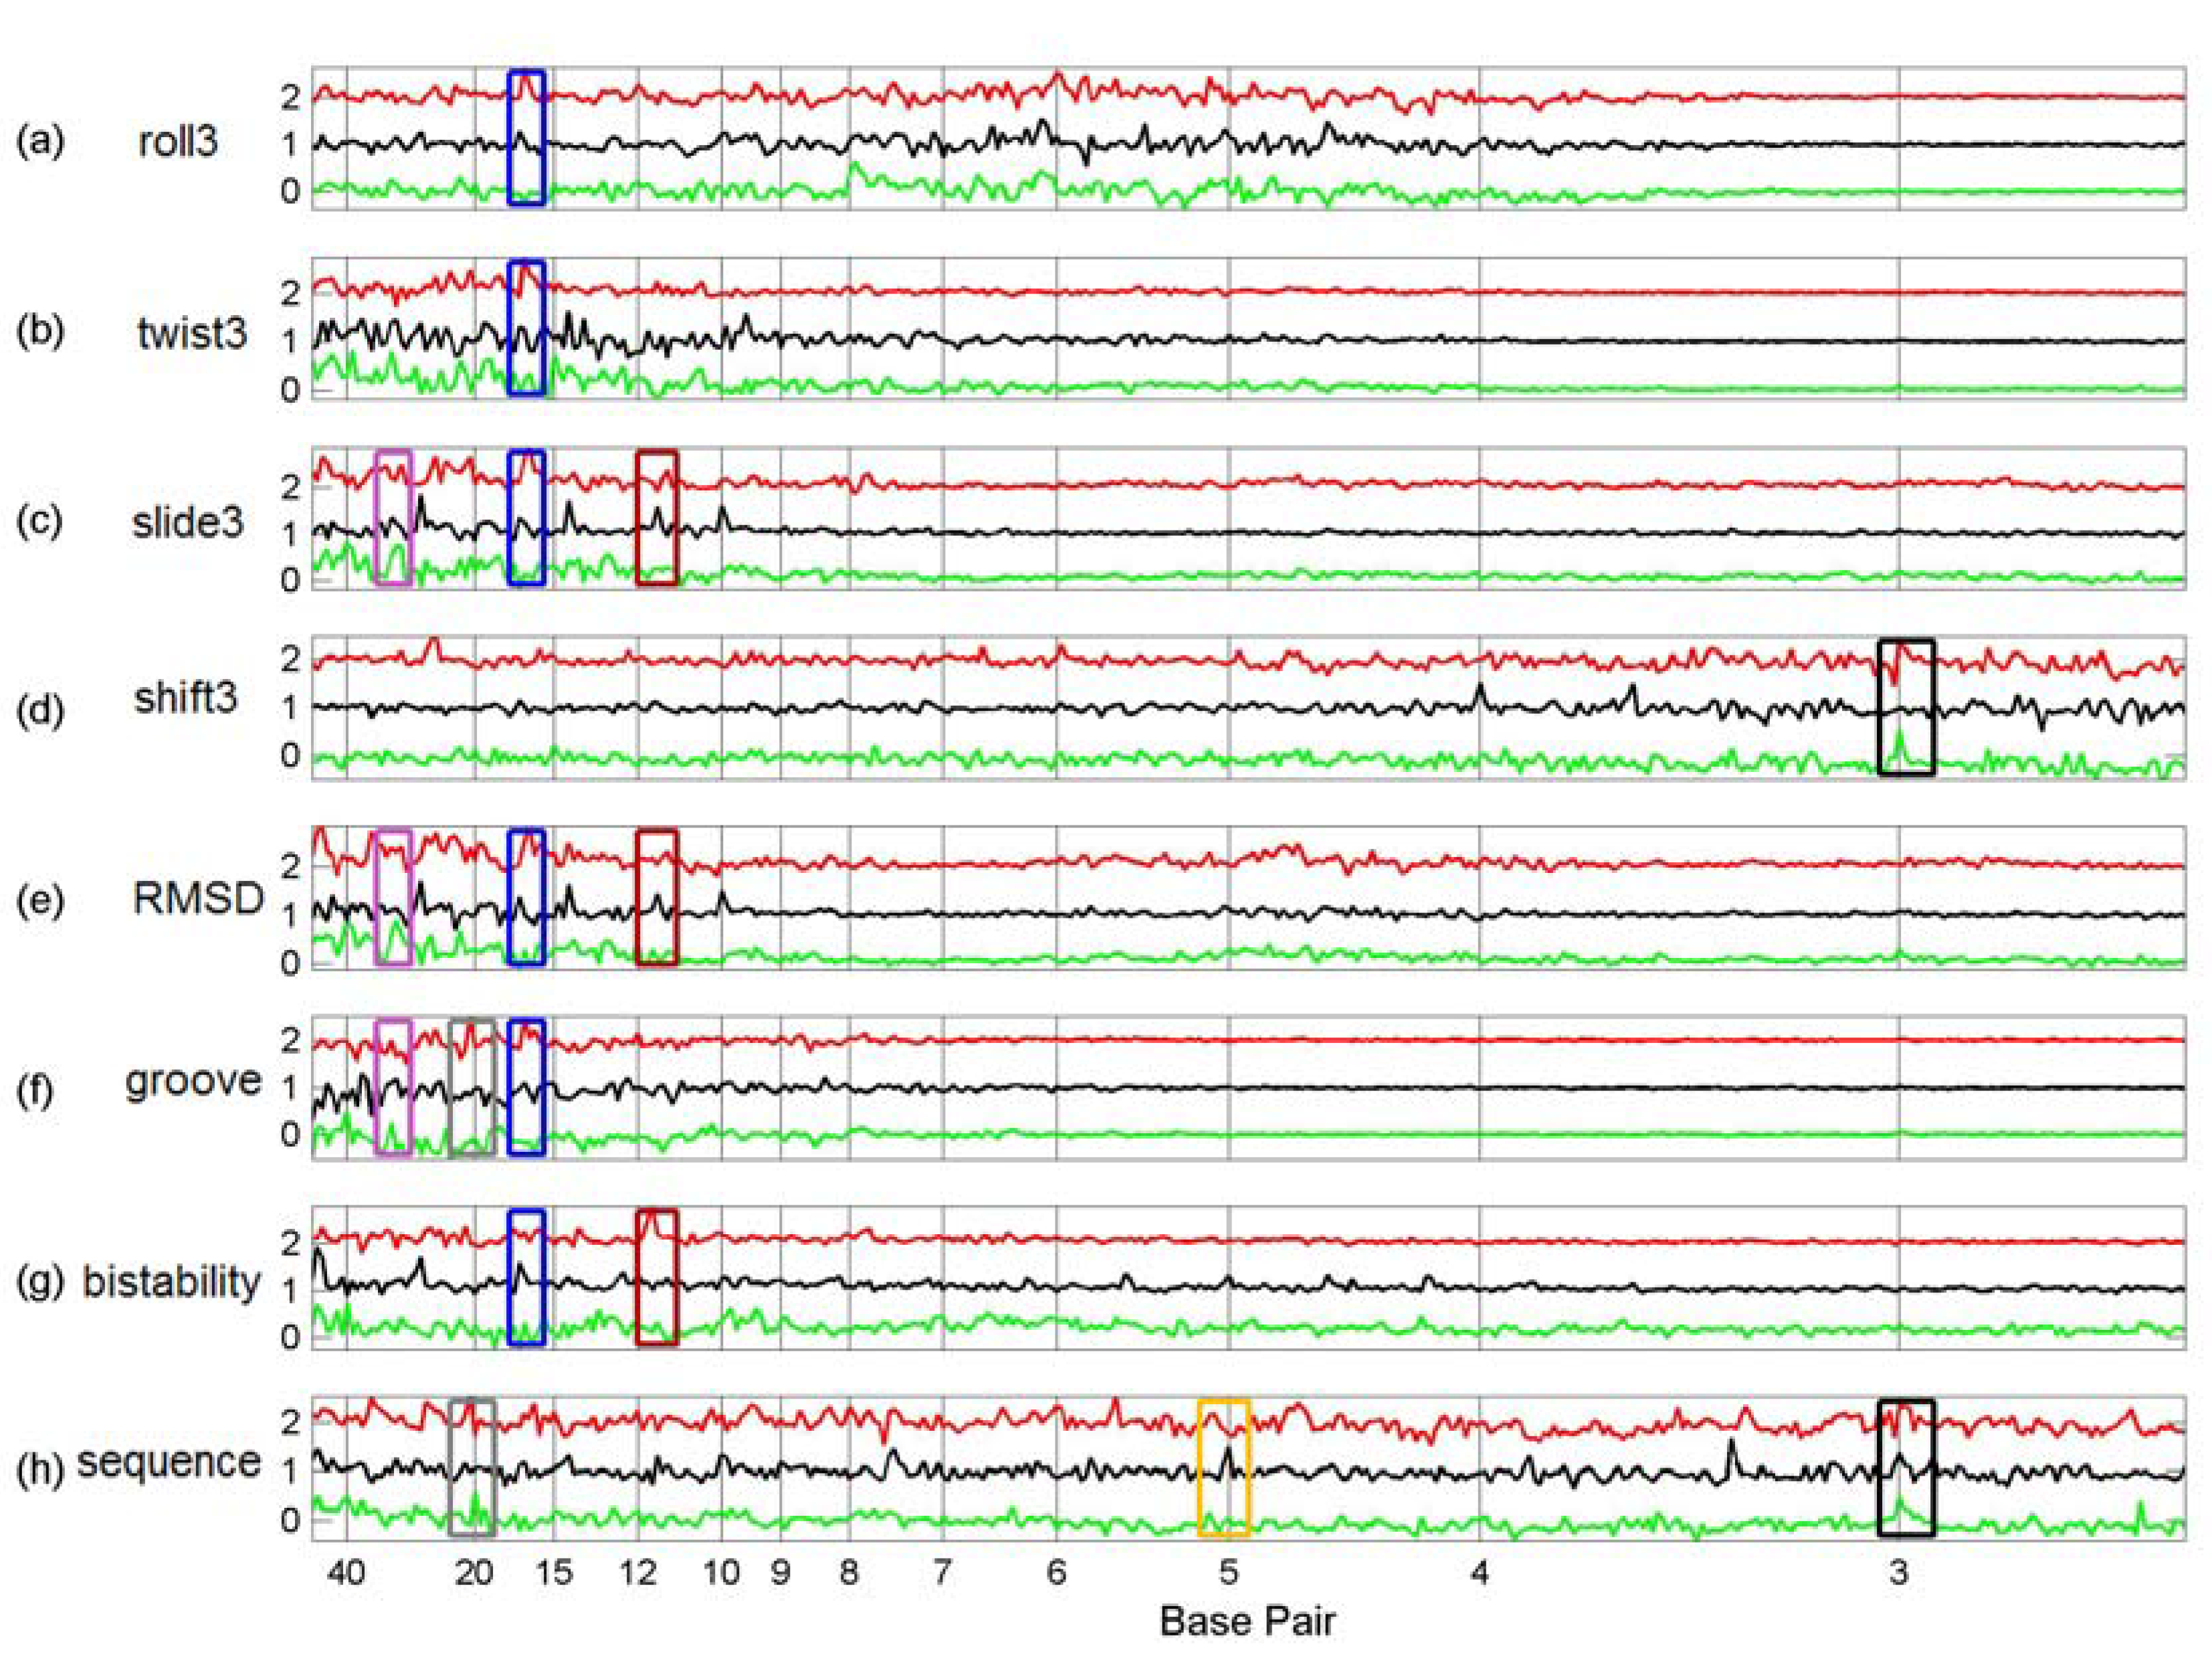
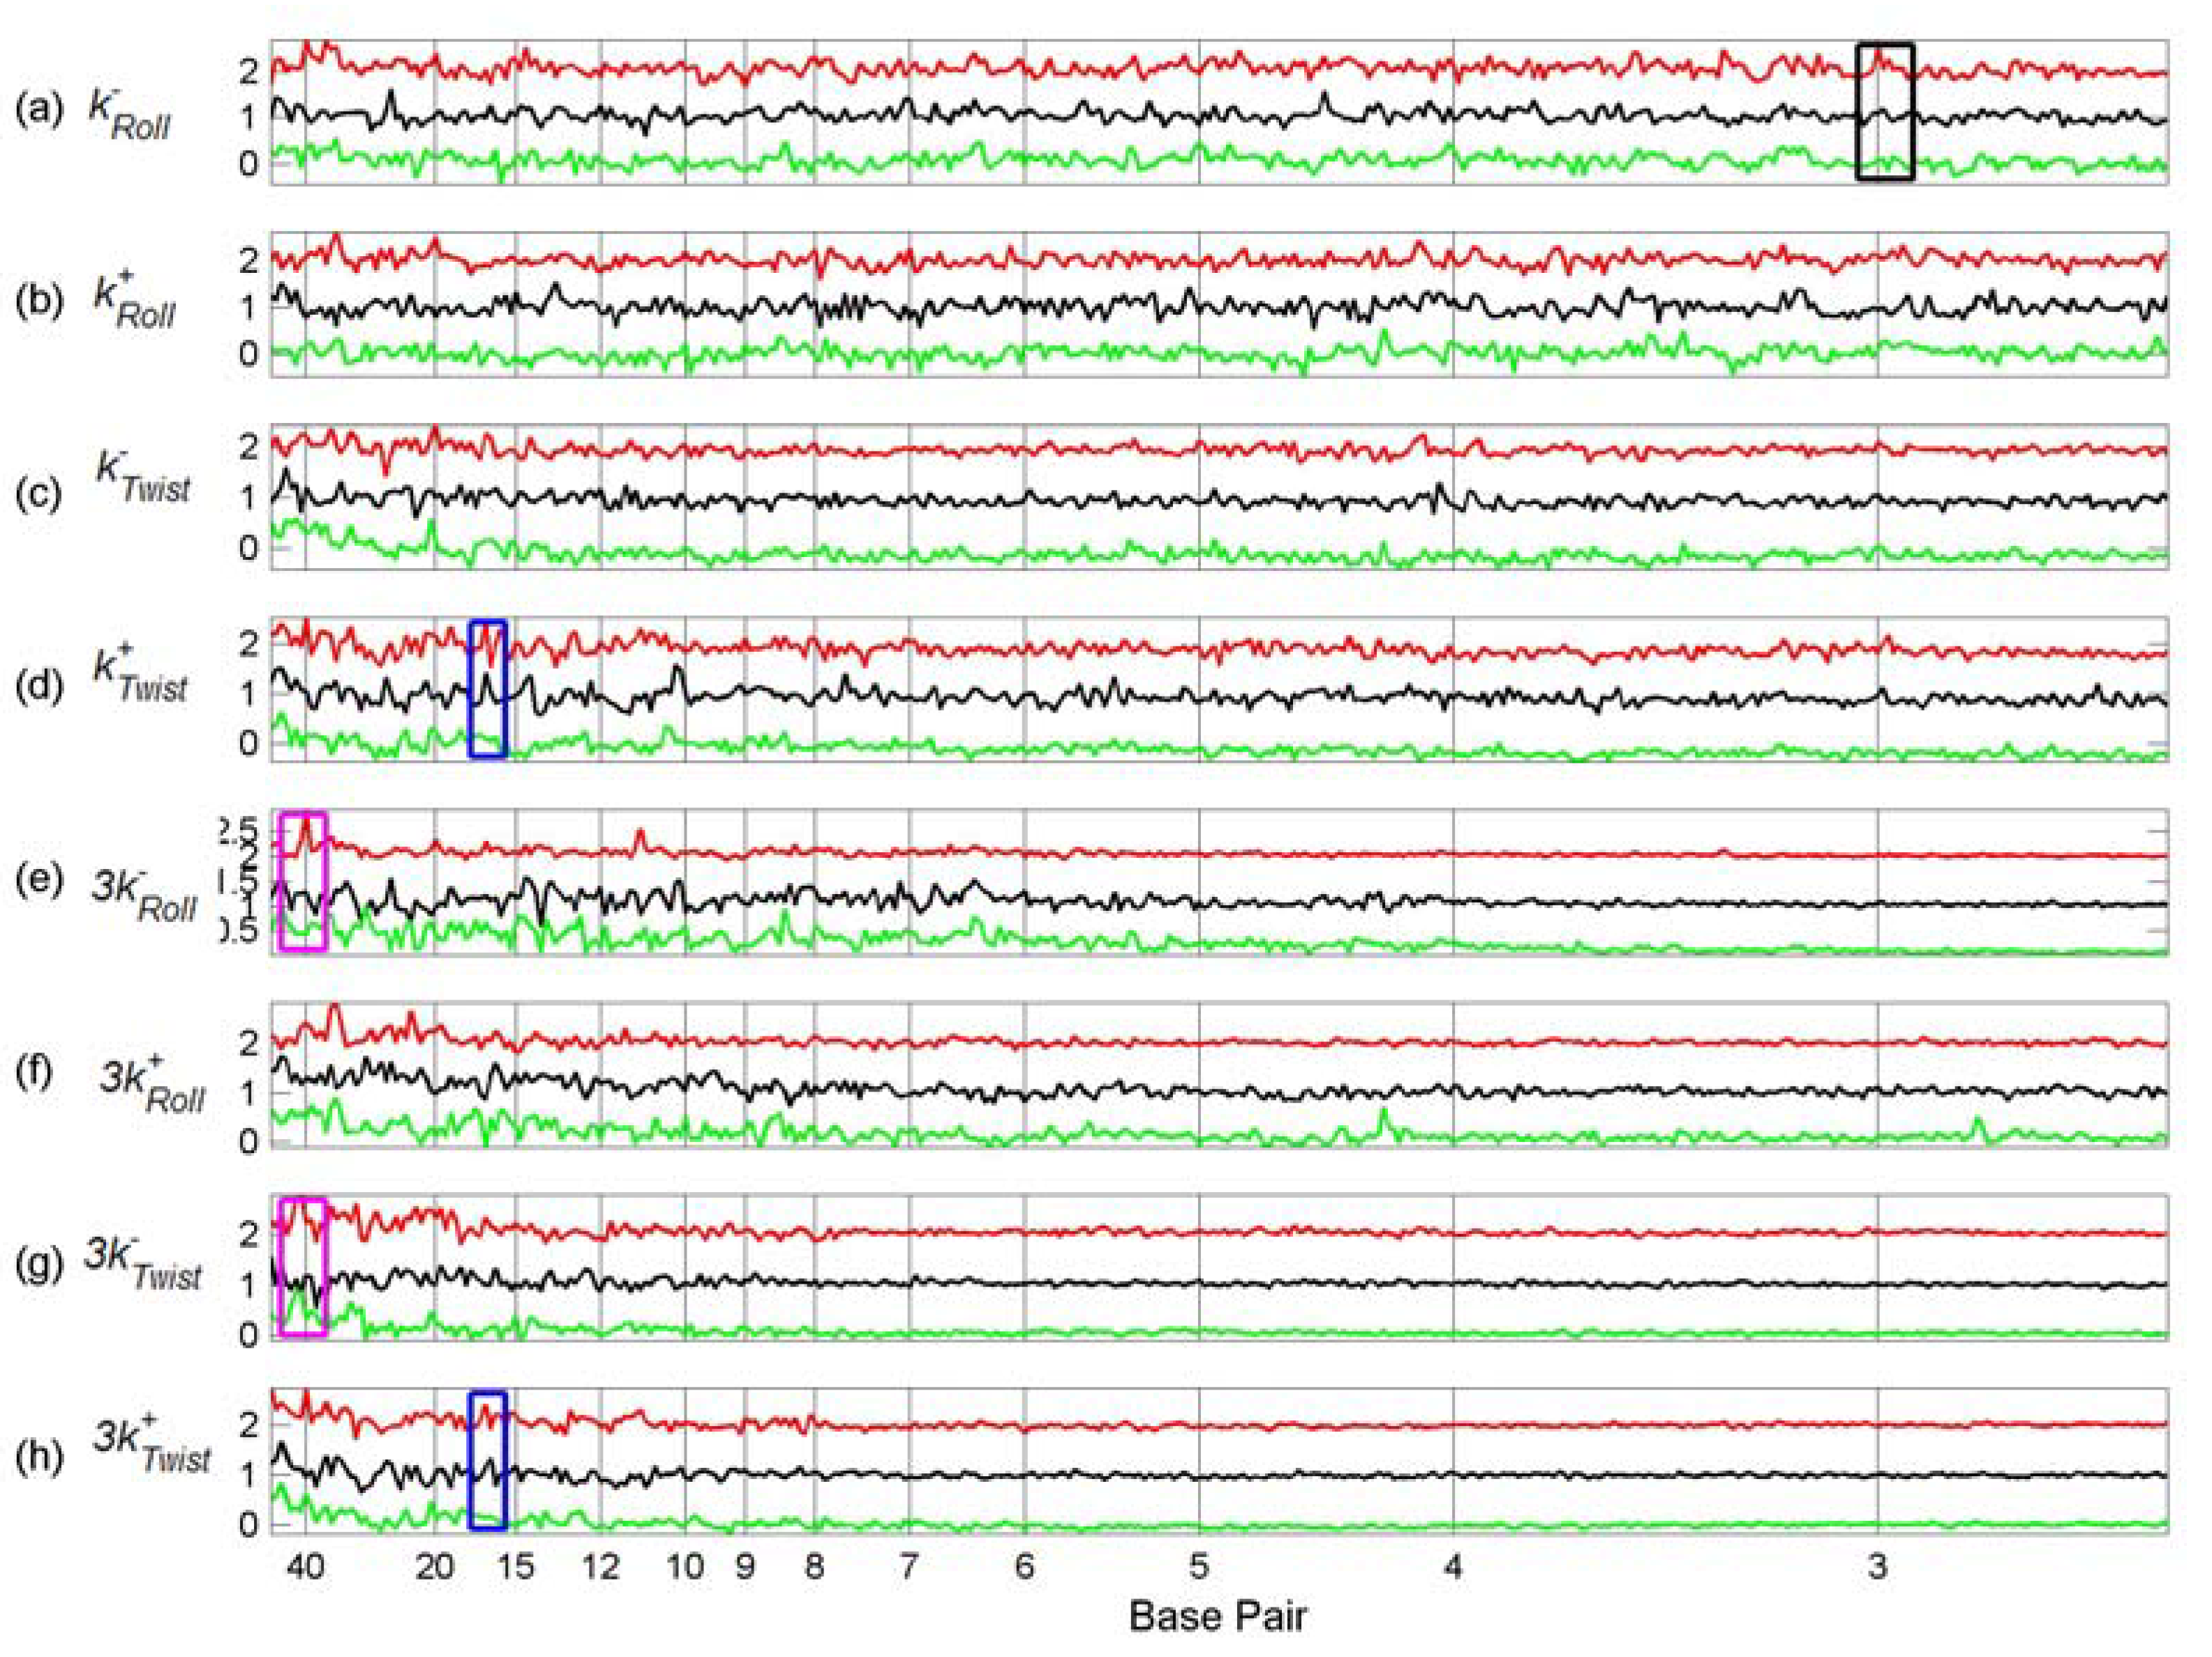
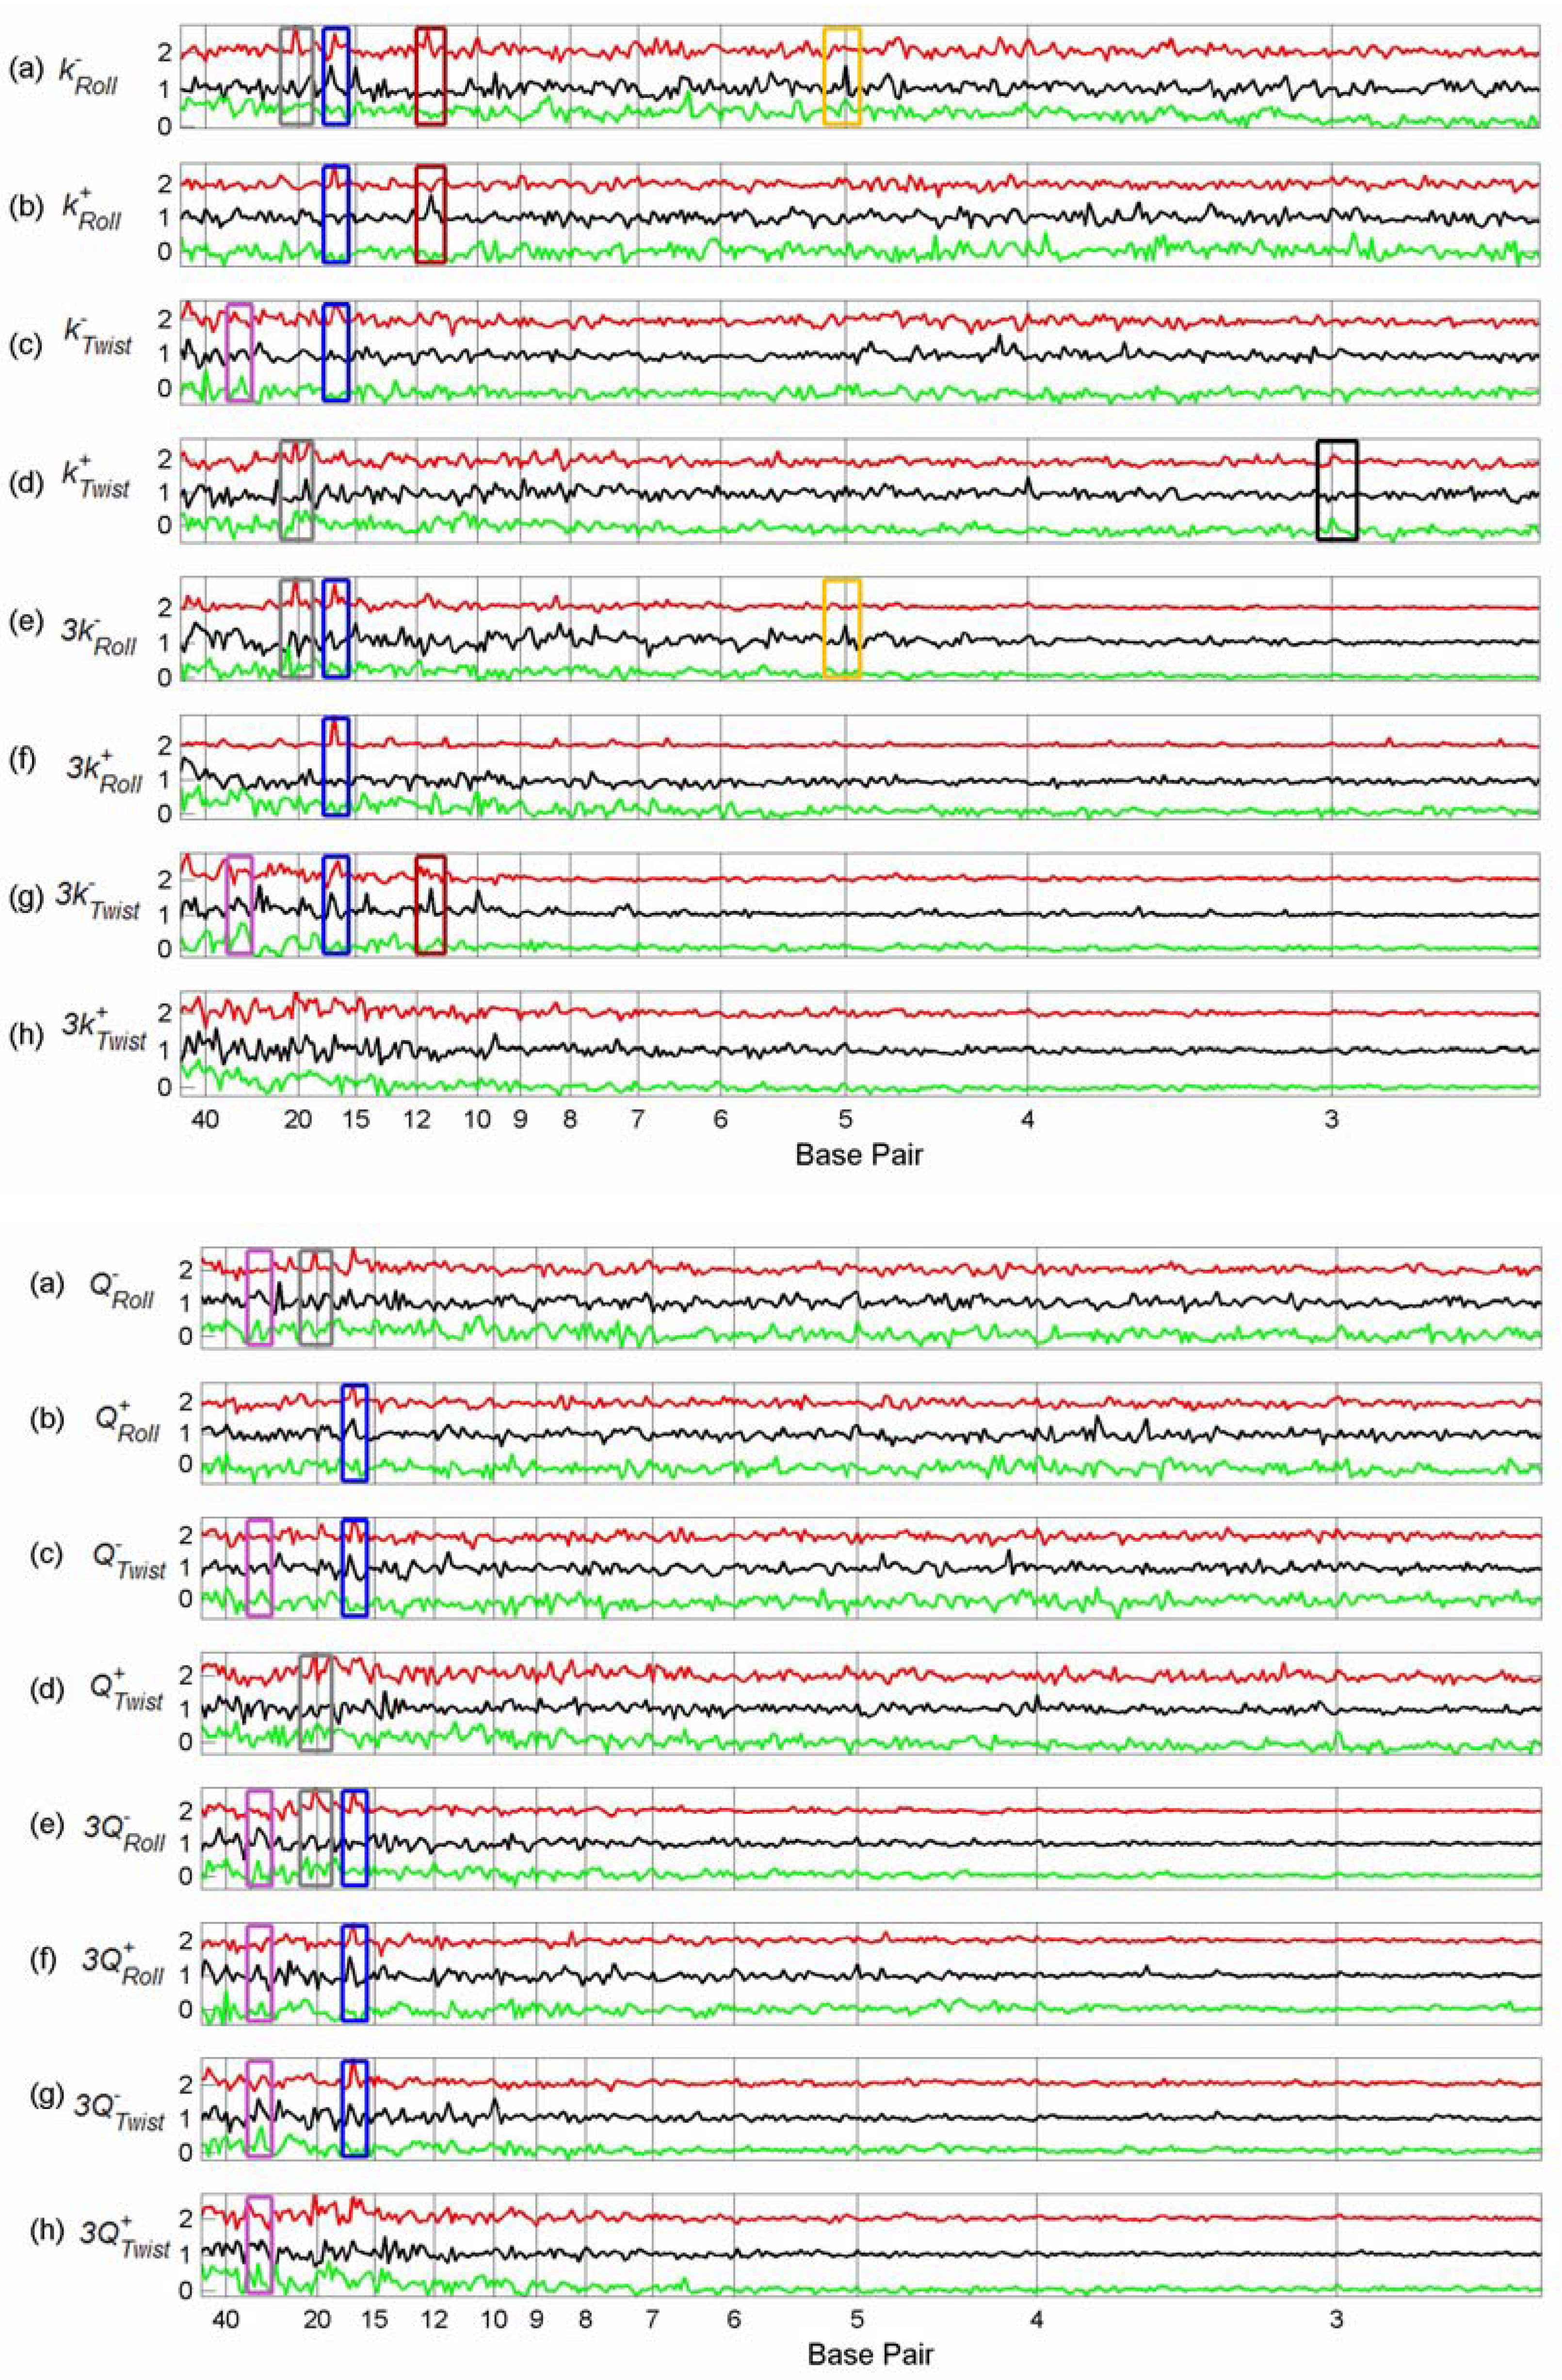
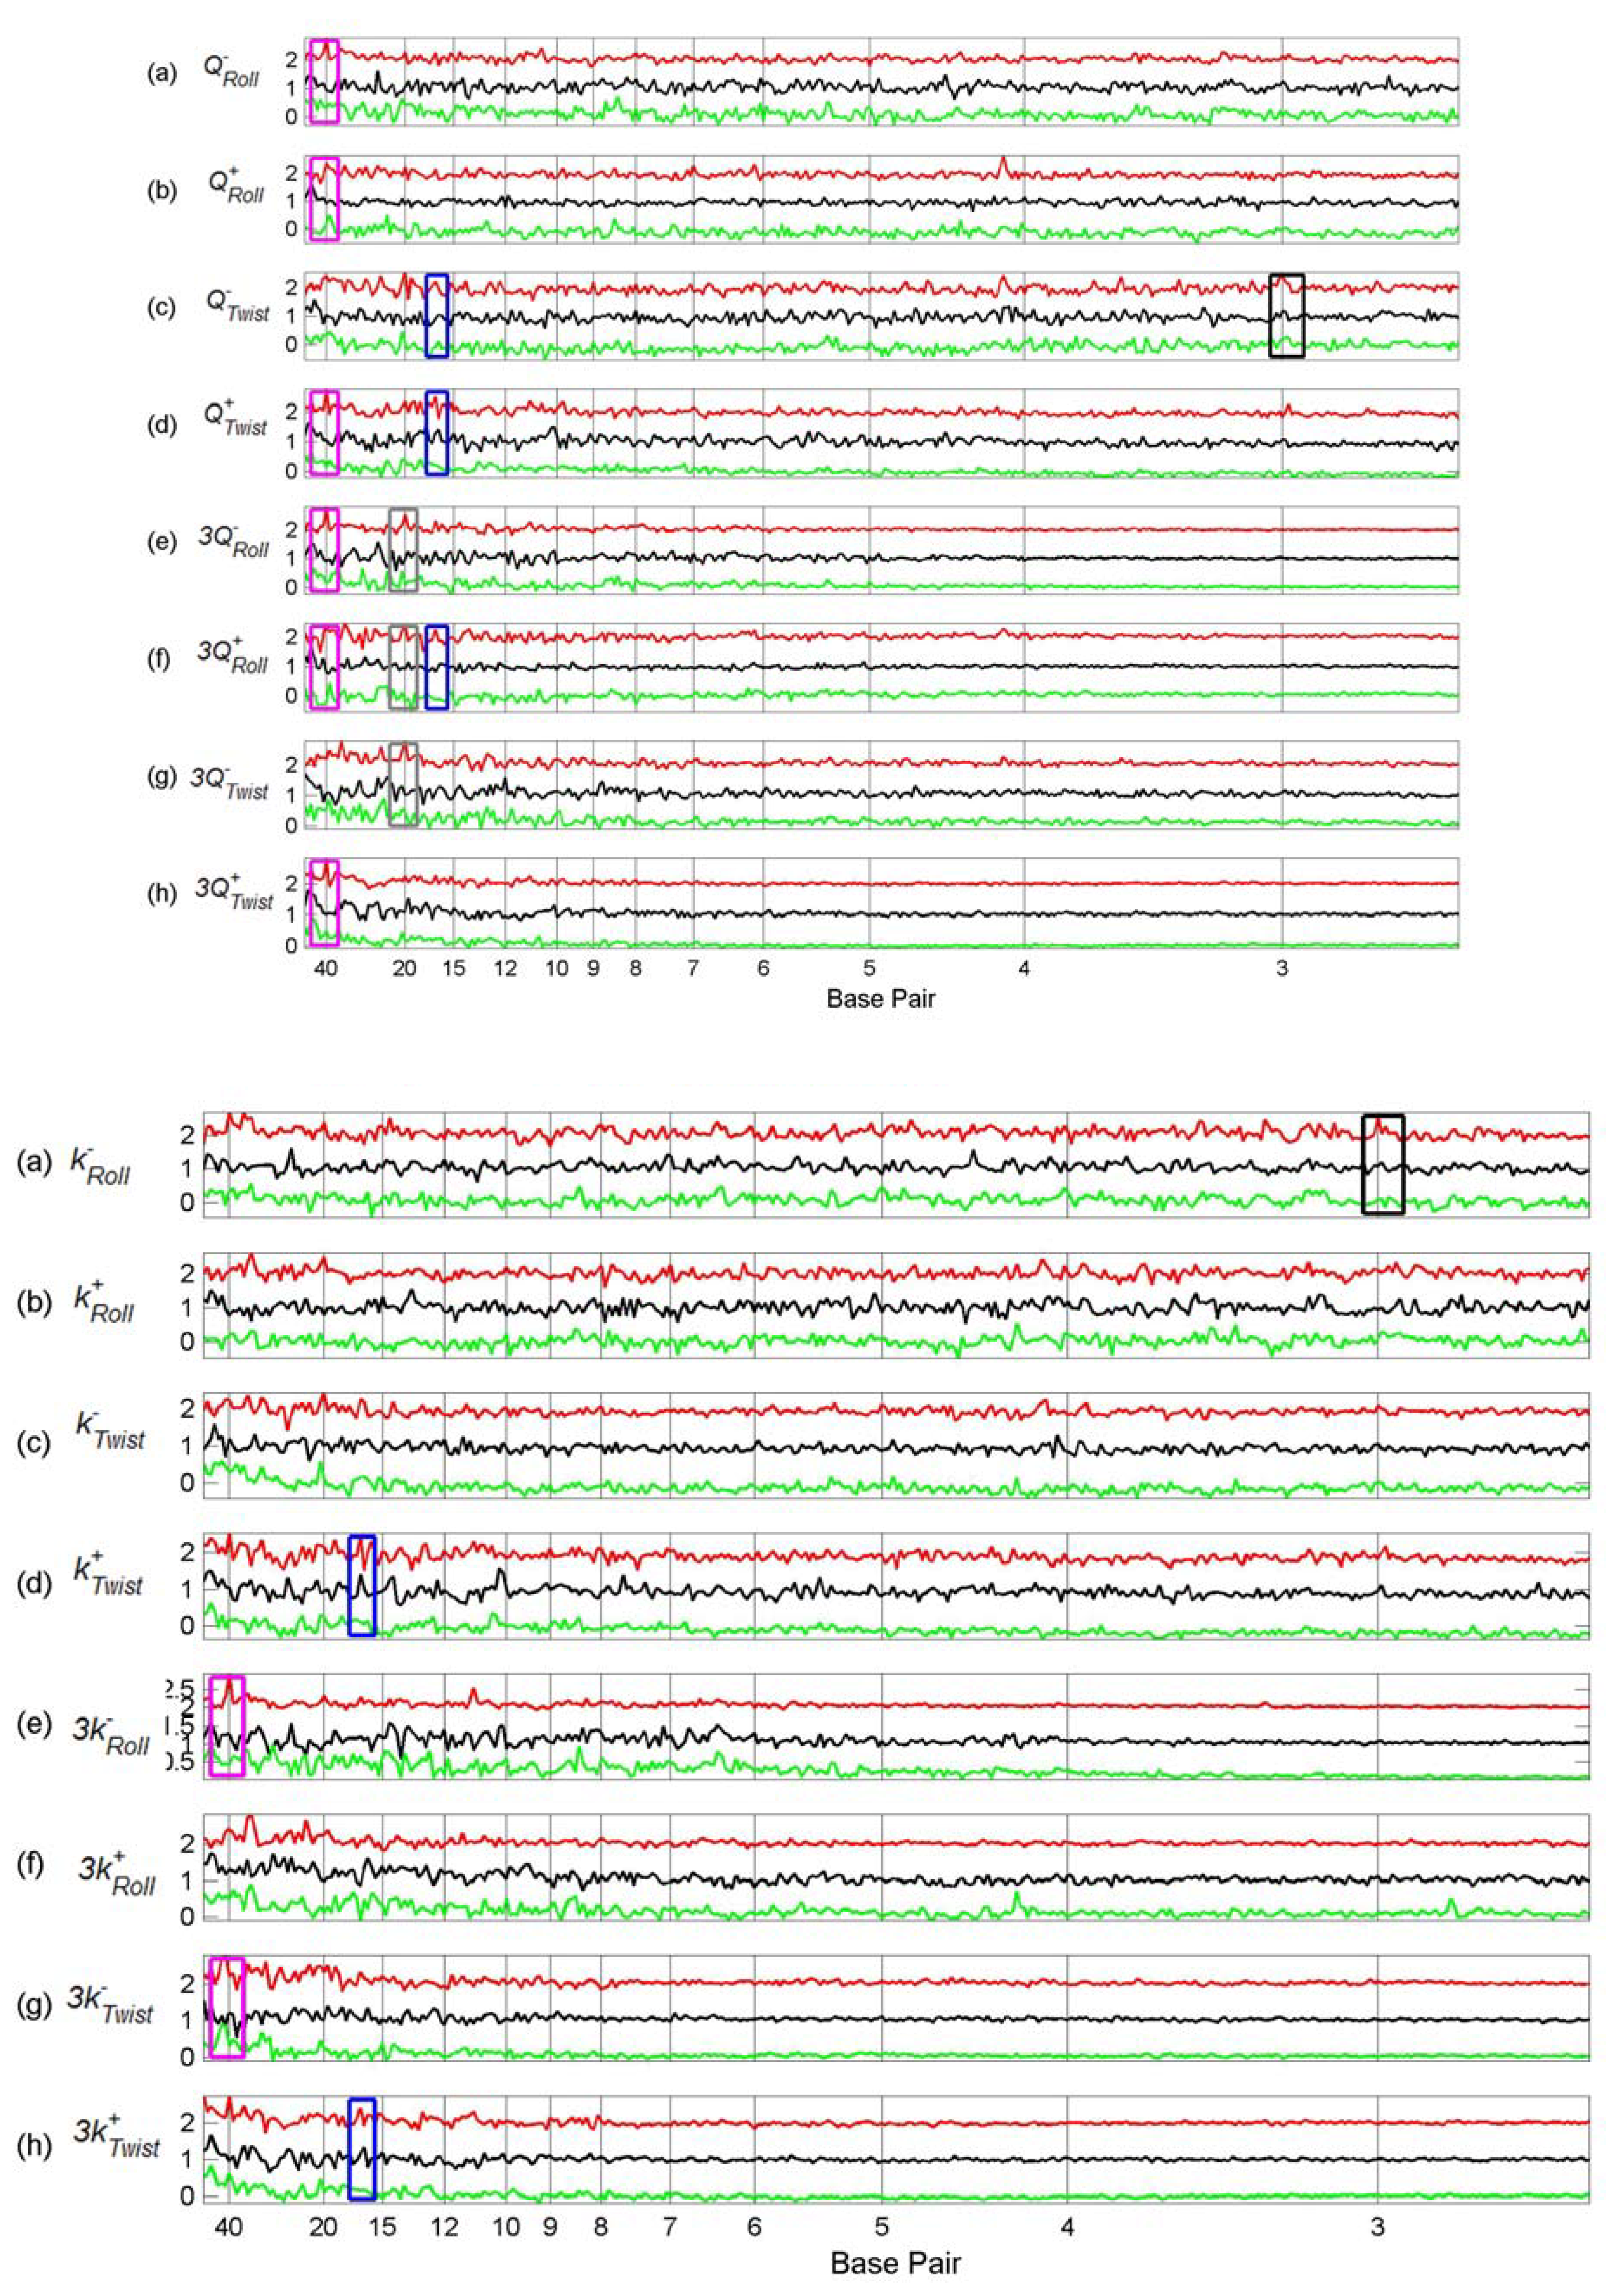
3.2. Transcription Factor Binding Site Transforms

We plotted the summed difference spectra of the Sp1, p53 and cMyc tfbs from chromosome 21 (Figures 3-5) and chromosome 22 (Figures 6-8) against the summed difference spectra of the randomised subsequences for each of the structural parameters of Table 1. Each summed difference spectrum is normalised by dividing by its range; the spectra are then offset. This means that the heights of the peaks are not directly comparable – the purpose of the plots is to see the relative positions of peaks for each transcription factor type. The plots are grouped as follows: flexibility force constants (Figure 3 and Figure 6), partition coefficients (Figure 4 and Figure 7) and the remaining non-flexibility properties (Figure 5 and Figure 8). The original Sp1 difference spectrum in chromosome 21 was dominated by the spectrum of a particular tfbs, number 76 (see the discussion below) and so, in the comparison plots of Figures 3-5 this tfbs is omitted from each of the Sp1 difference spectra. Similarly, the Sp1 spectrum in chromosome 22 was also dominated by a particular tfbs, number 209 (position 49476821 – 49477821), and the p53 spectrum in chromosome 22 was dominated by spectra 62 (position 49408559 - 49409559) and 63 (position 49410481 – 49411481) and so these tfbs were omitted from the Sp1 and p53 difference spectra respectively of chromosome 22 (Figures 6, 7, 8).
Figures 3-5. Comparison between Flexibility Force Constant Difference Spectra, Partition Coefficient Difference Spectra and Non-flexibility Property Difference Spectra of Tfbs in Chromosome 21.
Algorithms 02 00448 g003aAlgorithms 02 00448 g003b
Difference spectra of Sp1 tfbs (red line), p53 tfbs (black line), cMyc tfbs (green line). In each case the difference spectrum was calculated for all non-overlapping 1,024 bp subsequences, and the mean obtained. In each case the y-axis is the difference spectra normalised by its range; Sp1 tfbs offset by 2, p53 tfbs offset by 1.
Figure 6-8. Comparison between Flexibility Force Constant Difference Spectra, Partition Coefficient Difference Spectra and Non-flexibility Property Difference Spectra of Tfbs in Chromosome 22.
Algorithms 02 00448 g004aAlgorithms 02 00448 g004b
Difference spectra of Sp1 tfbs (red line), p53 tfbs (black line), cMyc tfbs (green line). In each case the difference spectrum was calculated for all non-overlapping 1024 bp subsequences, and the mean obtained. In each case the y-axis is the difference spectra normalised by its range; Sp1 tfbs offset by 2, p53 tfbs offset by 1.
These six figures provide an overview of the spectra of these set of tfbs. Peaks occur in several properties for the same set of tfbs, giving some confidence that they represent genuine features, rather than random fluctuations. In order to see common peaks more clearly we have added boxes coloured according to peak position for selected positions, as follows: – black – 3 bp; yellow – 5 bp; brown – 11.5 bp; blue – 16.5 bp; grey – 20 bp, purple – 30 bp and magenta – 40 bp. We notice that both chromosome 21 and 22 show peaks in the sequence spectra at 3bp (black boxes) for all three TFs, indicating the presence of codons in at least some of the sequences [Figure 5(h) and Figure 8(h)]. This is not surprising since the sequences are all 1001 bp, with the actual TFBS somewhere within the sequence– it is very likely that the coding sequence will overlap the 1001 bp for some of the tfbs. The coding peaks also show up in some of the structural properties, such as 3-step shift [Figure 5(d) and Figure 8(d)].
In chromosome 21, Sp1 spectra have peaks at 16.5 bp (blue boxes) for most structural properties, although not for sequence. The same peaks are present for p53 spectra in most cases, but are absent from the cMyc spectra. Sp1 and p53 tfbs show some of the same peaks in chromosome 22. Sp1 spectra in chromosome 21 also have peaks at 20 bp (grey boxes) which are not present in the p53 or cMyc spectra, but which do occur for Sp1 in chromosome 22 for some spectra (Figure 7, 8).
Several p53 spectra, including sequence and decreasing twist flexibility, have a particularly sharp peak at 5 bp (yellow boxes) which is not apparent in any of the other tfbs spectra in either chromosome. Interestingly, however, the whole chromosome 21 sequence spectra of Figure 2 has a similar very sharp peak. p53 spectra have several other clear common peaks—we have indicated those at 11.5 bp with a brown box. These 11.5 bp peaks often co-occur with other sharp peaks (not boxed), suggesting that they may be related [Figures 3(g) and 5(c), (e), (f)]. The cMyc spectra seem to have fewer common peaks. However, many properties have a peak at about 30 bp (purple box) which are shared with p53 properties, for example, most of the partition coefficients (Figure 4).
In chromosome 22, Sp1 spectra have a peak at 40 bp (magenta boxes). In a few cases this is shared by the cMyc spectra (Figures 6(g) and 7(b),(f)). However, in general, there are fewer common peaks amongst the spectra in chromosome 22, which makes the identification of peaks more difficult.
The fact that some peaks for a particular tfbs are different in the two chromosomes considered suggests that the structural periodicity represented by a peak may be due to an interaction between the structural requirements of the particular tfbs and also its chromosomal location. However, the same structural properties do seem to be important (as indicated by the number and relative intensity of their peaks), for Sp1 and p53 tfbs in both chromosomes 21 and 22.
In some cases the power spectra may be dominated by a particular tfbs. This is the case for the Sp1 3k +Roll spectra in chromosome 21. Figure 9 shows the summed 3k +Roll Sp1 spectra for chromosome 21, the single spectrum for Sp1 tfbs 76 (chromosome 21 position 43850478 – 43851470) and the summed Sp1 spectra omitting tfbs 76 (panels (a)-(c), respectively). Clearly most of the intensity of the total Sp1 spectra [Figure 9(a)] arises from the single spectrum of tfbs 76 [Figure 9(b)]. Without this spectrum, the summed spectrum [Figure 9(c)] is unremarkable. Investigation of this DNA sequence reveals that it is highly repetitive and that the downstream sequence is also repetitive. Thus in this case the periodicity detected is due to the sequence, rather than any particular structural feature. Figure 9(d) shows the occurrence spectrum of the Sp1 tfbs 76, which is strikingly similar to the 3k +Roll spectrum although its intensity relative to the occurrence spectra of the remaining tfbs is less. Thus the summed occurrence spectra, omitting tfbs 76, still retains noticeable peaks, for example the peak at 20 bp [Figure 9(e)].
Figure 9. Comparison of Sp1 tfbs 76 3k +Roll spectra with its occurrence spectra. PSD – power spectral density. (a) Summed 3k +Roll spectra for all Sp1 tfbs in chromosome 21; (b) Sp1 tfbs 76 3k +Roll spectrum alone; (c) summed Sp1 3k +Roll spectra omitting tfbs 76 (d) Sp1 tfbs 76 occurrence spectrum alone; (e) summed Sp1 occurrence spectra omitting tfbs 76.
Algorithms 02 00448 g005

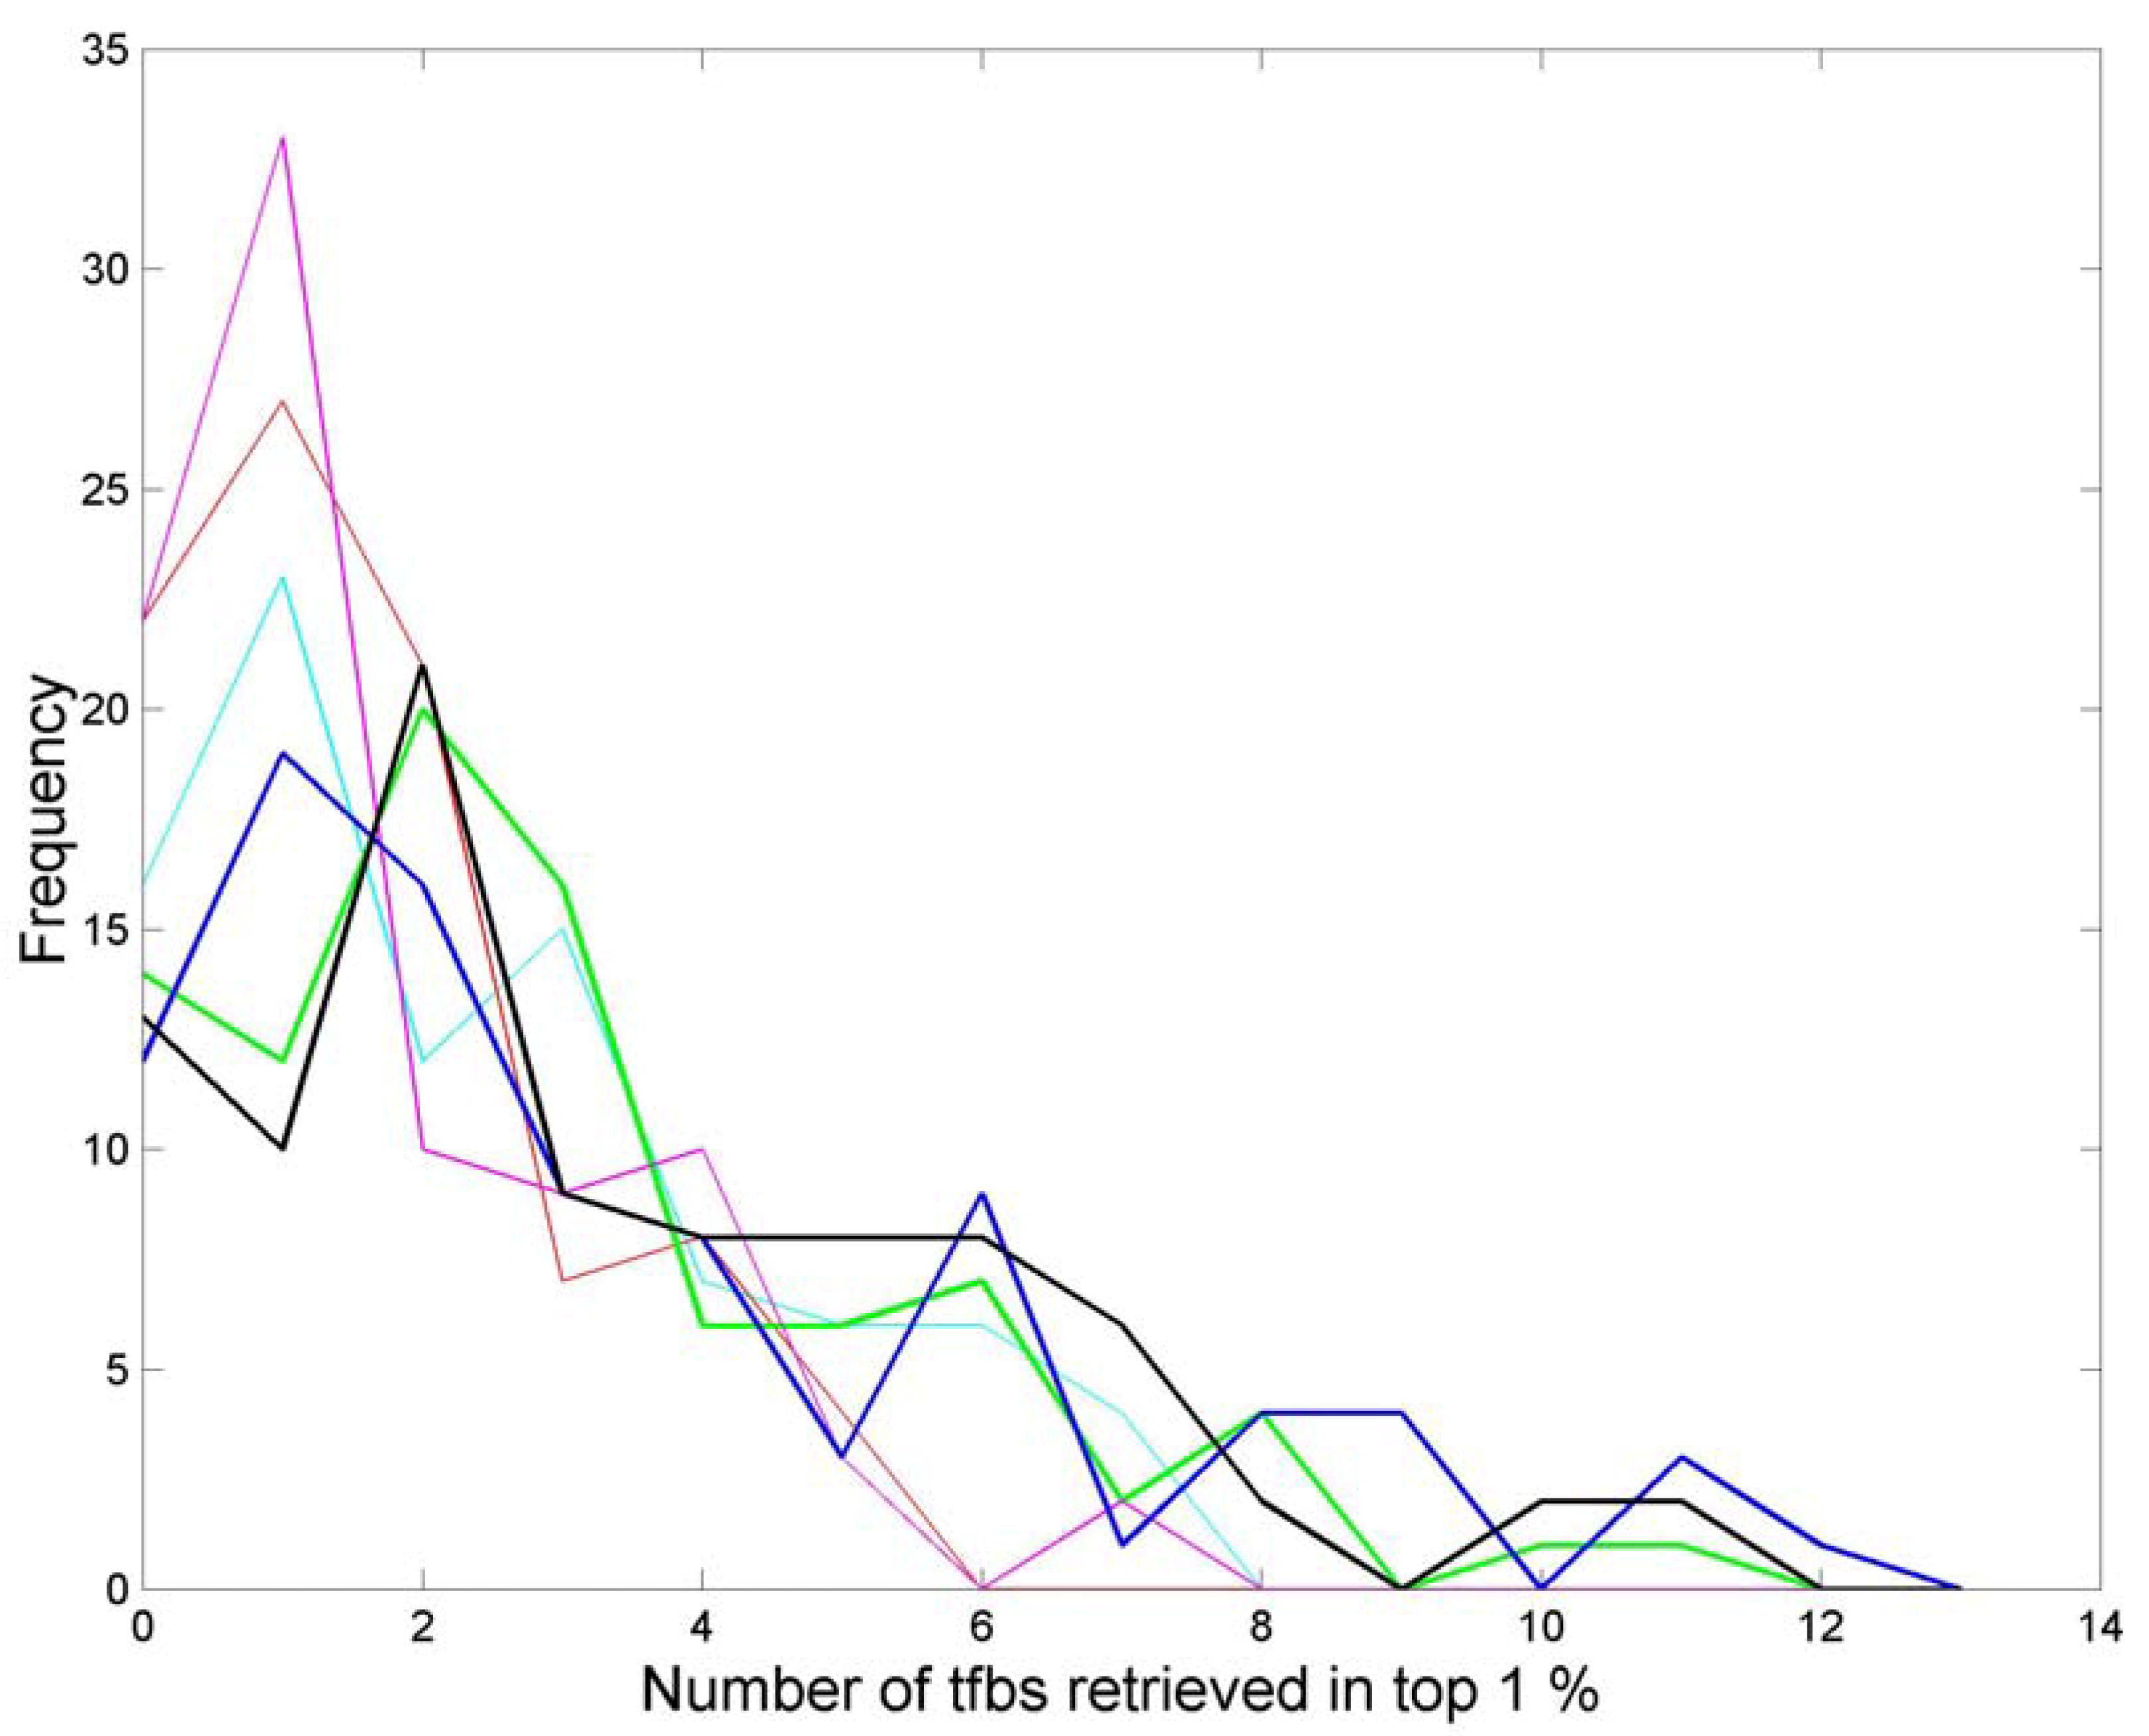
3.3. Finding tfbs Using Power Spectra as Fingerprints

The results of searching for Sp1 tfbs using Sp1 fingerprints in chromosome 21 are given in Table 2. The best performing structural parameter using the cosine distance is minor groove width which finds 2.4 Sp1 tfbs on average in the top 1% of the ranked list of spectra. Decreasing twist flexibility, k -Twist, is clearly next with 1.6, and then two partition coefficients and roll3 all retrieved approximately 1.4 tfbs. By chance we would expect a retrieval rate of 0.88 tfbs in 1% of the chromosomal blocks. Sequence performs well, retrieving 1.7 tfbs, but is clearly outperformed by minor groove width.
Table 2. Sp1 tfbs retrieval in chromosome 21.
parameterSp1RandomShuffledZscore
k -Twist1.601.161.012.8
k +Twist0.850.611.02-1.2
k-Roll0.900.710.780.64
k+Roll0.670.810.83-1.1
3k -Twist1.150.940.971.1
3k +Twist1.100.860.671.1
3k-Roll1.130.940.941.5
3k+Roll1.140.861.090.48
Q -Twist1.180.840.663.0
Q +Twist0.900.620.870.40
Q-Roll0.880.690.741.1
Q+Roll0.920.740.711.0
3Q -Twist0.920.780.99-0.85
3Q +Twist1.450.930.823.6
3Q-Roll1.410.950.654.8
3Q+Roll1.070.820.612.5
twist31.250.860.672.4
roll31.350.830.822.6
slide31.120.820.802.1
shift30.790.680.671.2
RMSD0.970.780.791.7
groove2.401.160.885.2
bistability0.380.110.002.1
Sequence1.671.050.674.4
All retrieval rates are the mean number of Sp1 tfbs found amongst the top 1% of the chromosome blocks. Sp1 is the retrieval rate obtained using the Sp1 tfbs spectra. Random is the mean 1% retrieval rate over 100 runs by 89 chromosome 21 blocks chosen at random. Shuffled is the retrieval rate obtained using the spectra of the shuffled sequences. Zscore is the results of a one-sided MannWhitney test comparing the Sp1 and Shuffled retrieval rates.
The next obvious step is to perform data fusion using some combination of parameters, the results being given in Table 3. As might be expected, fusing minor groove width and decreasing twist flexibility gives an improved retrieval rate, to 3 tfbs. In contrast, fusing minor groove with and sequence gives 2.5 tfbs, little improvement over groove width alone, suggesting that minor groove width is capturing most of the information provided by sequence.
Adding in more parameters gives more improvement, with the best performance being given by the fusion of groove, k Twist, roll3, sequence and 3Q +Twist. The performance tails off when further parameters are fused. Thus using all structural parameters with individual retrieval rates better than 0.88 gives a an overall retrieval rate of 1.3 Sp1 tfbs, which is an improvement upon some individual parameters, but clearly is not as good as the best single parameter. In Figure 10 we give the retrieval plots for minor groove width, decreasing twist flexibility and sequence, (cyan, red and magenta lines respectively), together with some of the fusion results (blue, black and green lines). It is clear that fusing parameters together both decreases the number of times that few tfbs are retrieved and increases the maximum number of tfbs retrieved (to 12 whereas the maximum retrieval for a single parameter is 7).
Table 3. Data fusion retrieval rate. 1% retrieval rate is the mean number of Sp1 tfbs found amongst the top 1% of the chromosome blocks.
Parameter combination1% retrieval rate
groove + k Twist3.0
groove + k Twist + roll33.2
groove + k Twist + roll3 + 3Q +Twist3.2
groove + k Twist + roll3 + 3Q +Twist +3Q-Roll2.9
groove + k Twist +3Q-Roll3.2
groove + sequence2.5
k Twist + sequence2.4
groove + k Twist + sequence3.3
groove + k Twist + roll3+sequence3.4
groove + k Twist + roll3+sequence + 3Q +Twist3.4
All parameters better then random1.3
Figure 10. Data fusion retrieval. Single parameters : groove (cyan); k Twist (red); sequence, (magenta). Fused parameters: groove + k Twist (green); groove + k Twist + roll3 (black); groove + k Twist + roll3 + 3Q+Twist + sequence (blue).
Algorithms 02 00448 g006

4. Conclusions

In this work we have applied Fourier analysis to the structural properties of human chromosomes 21 and 22. By considering a chromosome as a set of units, each 1031 bp (1024 octamers) long, and summing the power spectra obtained from each unit, we obtain an overview of the power spectrum of an entire chromosome. We showed that, for a given structural parameter, the structural property spectra of chromosomes 21 and 22 are strikingly similar (Figure 2). A comparison of structural spectra with the occurrence spectra (obtained from the sequence) revealed many common peaks, in particular that at 3 bp, indicative of the presence of codons. This peak was expected in the occurrence spectra, and it is pleasing that it is also present in many structural property spectra demonstrating that such spectra can reveal known DNA characteristics. Prominent peaks found at 10.3 bp in all increasing twist flexibility spectra and also in minor groove width may indicate nucleosome wrapping propensities. Other peaks at, for example those found at 6.4 bp in all decreasing roll flexibility spectra, need further investigation in order to elucidate potential function(s).
We have also examined the structural power spectra of three sets of transcription factor binding site regions in searches for common peaks, both for the same tfbs within different chromosomes and for different tfbs within the same chromosome (Figures 3–5 and Figures 6–8). We found peaks at 16.5 bp for Sp1 and p53 tfbs in both chromosomes 21 and 22 for several structural properties, and also some (although fewer) common peaks at 20 bp for the same tfbs. However there are also clear differences, both between transcription factors and between chromosomes. For example p53 tfbs have a very sharp peak at 5 bp in chromosome 21 spectra for properties related to the ability to decrease roll and also in the p53 occurrence spectrum. Although this peak is not present at all in the p53 spectra of chromosome 22, it is prominent in the entire chromosome 21 occurrence spectrum (Figure 2).
If tfbs have common peaks, which are not present in the majority of a chromosome, it should be possible to use them in a similarity search. We tested this premise using Sp1 tfbs spectra from chromosome 21. In a similarity search using the cosine distance, minor groove width retrieved on average three times as many tfbs as would be expected by chance. Fusing several properties, including minor groove width and occurrence, increased the retrieval rate to four times that of chance. Clearly this retrieval rate would not be acceptable as a means of finding tfbs. However there are already very many TFBS prediction methods, which have very high rates of false positive predictions. We anticipate that structural methods could be used as part of a consensus score, in an attempt to increase the hit rate for genuine TFBS.
This approach provides a new strategy for searching the genome data for information. There is clear experimental evidence that DNA structure plays an important role in determining functional properties such as protein binding and that DNA structure contains information that is different from DNA sequence. Although it is difficult to understand the relationship between specific functional properties and the set of structural parameters in our database, our structural fingerprints nevertheless provide a useful tool for searching for function information in sequence data. The Fourier power spectrum fingerprints provide a simple, fast method for comparing a set of functional sequences, in this case transcription factor binding site regions, with the sequences of whole chromosomes. On its own, the power spectrum fingerprint does not find all tfbs in a chromosome, but the results presented here show that in combination with other approaches, this technique will improve the chances of identifying functional sequences hidden in genomic data.

Acknowledgements

We thank the BBSRC (EJG) for funding.

References and Notes

  1. Lander, E.S.; Linton, L.M.; Birren, B.; Nusbaum, C.; Zody, M.C.; Baldwin, J.; Devon, K.; Dewar, K.; Doyle, M.; FitzHugh, W.; Funke, R.; Gage, D.; Harris, K.; Heaford, A.; Howland, J.; Kann, L.; Lehoczky, J.; LeVine, R.; McEwan, P.; McKernan, K.; Meldrim, J.; Mesirov, J.P.; Miranda, C.; Morris, W.; Naylor, J.; Raymond, C.; Rosetti, M.; Santos, R.; Sheridan, A.; Sougnez, C.; Stange-Thomann, N.; Stojanovic, N.; Subramanian, A.; Wyman, D.; Rogers, J.; Sulston, J.; Ainscough, R.; Beck, S.; Bentley, D.; Burton, J.; Clee, C.; Carter, N.; Coulson, A.; Deadman, R.; Deloukas, P.; Dunham, A.; Dunham, I.; Durbin, R.; French, L.; Grafham, D.; Gregory, S.; Hubbard, T.; Humphray, S.; Hunt, A.; Jones, M.; Lloyd, C.; McMurray, A.; Matthews, L.; Mercer, S.; Milne, S.; Mullikin, J.C.; Mungall, A.; Plumb, R.; Ross, M.; Shownkeen, R.; Sims, S.; Waterston, R.H.; Wilson, R.K.; Hillier, L.W.; McPherson, J.D.; Marra, M.A.; Mardis, E.R.; Fulton, L.A.; Chinwalla, A.T.; Pepin, K.H.; Gish, W.R.; Chissoe, S.L.; Wendl, M.C.; Delehaunty, K.D.; Miner, T.L.; Delehaunty, A.; Kramer, J.B.; Cook, L.L.; Fulton, R.S.; Johnson, D.L.; Minx, P.J.; Clifton, S.W.; Hawkins, T.; Branscomb, E.; Predki, P.; Richardson, P.; Wenning, S.; Slezak, T.; Doggett, N.; Cheng, J.F.; Olsen, A.; Lucas, S.; Elkin, C.; Uberbacher, E.; Frazier, M.; Gibbs, R.A.; Muzny, D.M.; Scherer, S.E.; Bouck, J.B.; Sodergren, E.J.; Worley, K.C.; Rives, C.M.; Gorrell, J.H.; Metzker, M.L.; Naylor, S.L.; Kucherlapati, R.S.; Nelson, D.L.; Weinstock, G.M.; Sakaki, Y.; Fujiyama, A.; Hattori, M.; Yada, T.; Toyoda, A.; Itoh, T.; Kawagoe, C.; Watanabe, H.; Totoki, Y.; Taylor, T.; Weissenbach, J.; Heilig, R.; Saurin, W.; Artiguenave, F.; Brottier, P.; Bruls, T.; Pelletier, E.; Robert, C.; Wincker, P.; Rosenthal, A.; Platzer, M.; Nyakatura, G.; Taudien, S.; Rump, A.; Yang, H.M.; Yu, J.; Wang, J.; Huang, G.Y.; Gu, J.; Hood, L.; Rowen, L.; Madan, A.; Qin, S.Z.; Davis, R.W.; Federspiel, N.A.; Abola, A.P.; Proctor, M.J.; Myers, R.M.; Schmutz, J.; Dickson, M.; Grimwood, J.; Cox, D.R.; Olson, M.V.; Kaul, R.; Shimizu, N.; Kawasaki, K.; Minoshima, S.; Evans, G.A.; Athanasiou, M.; Schultz, R.; Roe, B.A.; Chen, F.; Pan, H.Q.; Ramser, J.; Lehrach, H.; Reinhardt, R.; McCombie, W.R.; de la Bastide, M.; Dedhia, N.; Blocker, H.; Hornischer, K.; Nordsiek, G.; Agarwala, R.; Aravind, L.; Bailey, J.A.; Bateman, A.; Batzoglou, S.; Birney, E.; Bork, P.; Brown, D.G.; Burge, C.B.; Cerutti, L.; Chen, H.C.; Church, D.; Clamp, M.; Copley, R.R.; Doerks, T.; Eddy, S.R.; Eichler, E.E.; Furey, T.S.; Galagan, J.; Gilbert, J.G.R.; Harmon, C.; Hayashizaki, Y.; Haussler, D.; Hermjakob, H.; Hokamp, K.; Jang, W.H.; Johnson, L.S.; Jones, T.A.; Kasif, S.; Kaspryzk, A.; Kennedy, S.; Kent, W.J.; Kitts, P.; Koonin, E.V.; Korf, I.; Kulp, D.; Lancet, D.; Lowe, T.M.; McLysaght, A.; Mikkelsen, T.; Moran, J.V.; Mulder, N.; Pollara, V.J.; Ponting, C.P.; Schuler, G.; Schultz, J.R.; Slater, G.; Smit, A.F.A.; Stupka, E.; Szustakowki, J.; Thierry-Mieg, D.; Thierry-Mieg, J.; Wagner, L.; Wallis, J.; Wheeler, R.; Williams, A.; Wolf, Y.I.; Wolfe, K.H.; Yang, S.P.; Yeh, R.F.; Collins, F.; Guyer, M.S.; Peterson, J.; Felsenfeld, A.; Wetterstrand, K.A.; Patrinos, A.; Morgan, M.J. Initial sequencing and analysis of the human genome. Nature 2001, 409, 860–921. [Google Scholar] [CrossRef] [PubMed]
  2. Collins, F.S.; Lander, E.S.; Rogers, J.; Waterston, R.H. Finishing the euchromatic sequence of the human genome. Nature 2004, 431, 931–945. [Google Scholar]
  3. Waterston, R.H.; Lindblad-Toh, K.; Birney, E.; Rogers, J.; Abril, J.F.; Agarwal, P.; Agarwala, R.; Ainscough, R.; Alexandersson, M.; An, P.; Antonarakis, S.E.; Attwood, J.; Baertsch, R.; Bailey, J.; Barlow, K.; Beck, S.; Berry, E.; Birren, B.; Bloom, T.; Bork, P.; Botcherby, M.; Bray, N.; Brent, M.R.; Brown, D.G.; Brown, S.D.; Bult, C.; Burton, J.; Butler, J.; Campbell, R.D.; Carninci, P.; Cawley, S.; Chiaromonte, F.; Chinwalla, A.T.; Church, D.M.; Clamp, M.; Clee, C.; Collins, F.S.; Cook, L.L.; Copley, R.R.; Coulson, A.; Couronne, O.; Cuff, J.; Curwen, V.; Cutts, T.; Daly, M.; David, R.; Davies, J.; Delehaunty, K.D.; Deri, J.; Dermitzakis, E.T.; Dewey, C.; Dickens, N.J.; Diekhans, M.; Dodge, S.; Dubchak, I.; Dunn, D.M.; Eddy, S.R.; Elnitski, L.; Emes, R.D.; Eswara, P.; Eyras, E.; Felsenfeld, A.; Fewell, G.A.; Flicek, P.; Foley, K.; Frankel, W.N.; Fulton, L.A.; Fulton, R.S.; Furey, T.S.; Gage, D.; Gibbs, R.A.; Glusman, G.; Gnerre, S.; Goldman, N.; Goodstadt, L.; Grafham, D.; Graves, T.A.; Green, E.D.; Gregory, S.; Guigo, R.; Guyer, M.; Hardison, R.C.; Haussler, D.; Hayashizaki, Y.; Hillier, L.W.; Hinrichs, A.; Hlavina, W.; Holzer, T.; Hsu, F.; Hua, A.; Hubbard, T.; Hunt, A.; Jackson, I.; Jaffe, D.B.; Johnson, L.S.; Jones, M.; Jones, T.A.; Joy, A.; Kamal, M.; Karlsson, E.K.; Karolchik, D.; Kasprzyk, A.; Kawai, J.; Keibler, E.; Kells, C.; Kent, W.J.; Kirby, A.; Kolbe, D.L.; Korf, I.; Kucherlapati, R.S.; Kulbokas, E.J.; Kulp, D.; Landers, T.; Leger, J.P.; Leonard, S.; Letunic, I.; Levine, R.; Li, J.; Li, M.; Lloyd, C.; Lucas, S.; Ma, B.; Maglott, D.R.; Mardis, E.R.; Matthews, L.; Mauceli, E.; Mayer, J.H.; McCarthy, M.; McCombie, W.R.; McLaren, S.; McLay, K.; McPherson, J.D.; Meldrim, J.; Meredith, B.; Mesirov, J.P.; Miller, W.; Miner, T.L.; Mongin, E.; Montgomery, K.T.; Morgan, M.; Mott, R.; Mullikin, J.C.; Muzny, D.M.; Nash, W.E.; Nelson, J.O.; Nhan, M.N.; Nicol, R.; Ning, Z.; Nusbaum, C.; O'Connor, M.J.; Okazaki, Y.; Oliver, K.; Larty, E.O.; Pachter, L.; Parra, G.; Pepin, K.H.; Peterson, J.; Pevzner, P.; Plumb, R.; Pohl, C.S.; Poliakov, A.; Ponce, T.C.; Ponting, C.P.; Potter, S.; Quail, M.; Reymond, A.; Roe, B.A.; Roskin, K.M.; Rubin, E.M.; Rust, A.G.; Santos, R.; Sapojnikov, V.; Schultz, B.; Schultz, J.; Schwartz, M.S.; Schwartz, S.; Scott, C.; Seaman, S.; Searle, S.; Sharpe, T.; Sheridan, A.; Shownkeen, R.; Sims, S.; Singer, J.B.; Slater, G.; Smit, A.; Smith, D.R.; Spencer, B.; Stabenau, A.; Strange-Thomann, N.S.; Sugnet, C.; Suyama, M.; Tesler, G.; Thompson, J.; Torrents, D.; Trevaskis, E.; Tromp, J.; Ucla, C.; Vidal, A.U.; Vinson, J.P.; von Niederhausern, A.C.; Wade, C.M.; Wall, M.; Weber, R.J.; Weiss, R.B.; Wendl, M.C.; West, A.P.; Wetterstrand, K.; Wheeler, R.; Whelan, S.; Wierzbowski, J.; Willey, D.; Williams, S.; Wilson, R.K.; Winter, E.; Worley, K.C.; Wyman, D.; Yang, S.; Yang, S.P.; Zdobnov, E.M.; Zody, M.C.; Lander, E.S. Initial sequencing and comparative analysis of the mouse genome. Nature 2002, 420, 520–562. [Google Scholar] [PubMed]
  4. Johnston, M.; Stormo, G.D. Heirlooms in the attic. Science 2003, 302, 997–998. [Google Scholar] [CrossRef] [PubMed]
  5. Fickett, J.W.; Hatzigeorgiou, A.C. Eukaryotic promoter recognition. Genome Res. 1997, 7, 861–878. [Google Scholar] [PubMed]
  6. Silverman, B.D.; Linsker, R. A measure of DNA periodicity. J. Theor. Biol. 1986, 118, 295–300. [Google Scholar] [CrossRef]
  7. Tiwari, S.; Ramachandran, S.; Bhattacharya, A.; Bhattacharya, S.; Ramaswamy, R. Prediction of probable genes by Fourier analysis of genomic sequences. Comp. App. Biosci. 1997, 13, 263–270. [Google Scholar]
  8. Fukushima, A.; Ikemura, T.; Kinouchi, M.; Oshima, T.; Kudo, Y.; Mori, H.; Kanaya, S. Periodicity in prokaryotic and eukaryotic genomes identified by power spectrum analysis. Gene 2002, 300, 203–211. [Google Scholar] [CrossRef]
  9. Trifonov, E.N. 3-, 10.5-, 200- and 400-base periodicities in genome sequences. Physica a-Stat. Mech. App. 1998, 249, 511–516. [Google Scholar] [CrossRef]
  10. Widom, J. Short-range order in two eukaryotic genomes: Relation to chromosome structure. J. Mol. Biol. 1996, 259, 579–588. [Google Scholar] [CrossRef] [PubMed]
  11. Wang, J.P.Z.; Widom, J. Improved alignment of nucleosome DNA sequences using a mixture model. Nucleic Acids Res. 2005, 33, 6743–6755. [Google Scholar] [CrossRef] [PubMed]
  12. Dalal, Y.; Fleury, T.J.; Cioffi, A.; Stein, A. Long-range oscillation in a periodic DNA sequence motif may influence nucleosome array formation. Nucleic Acids Res. 2005, 33, 934–945. [Google Scholar] [CrossRef] [PubMed]
  13. D’Avenio, G.; Grigioni, M.; Orefici, G.; Creti, R. SWIFT (sequence-wide investigation with Fourier transform): a software tool for identifying proteins of a given class from the unannotated genome sequence. Bioinf. 2005, 21, 2943–2949. [Google Scholar] [CrossRef] [PubMed]
  14. Sharma, D.; Issac, B.; Raghava, G.P.S.; Ramaswamy, R. Spectral Repeat Finder (SRF): identification of repetitive sequences using Fourier transformation. Bioinf. 2004, 20, 1405–1412. [Google Scholar] [CrossRef] [PubMed]
  15. Bejerano, G.; Pheasant, M.; Makunin, I.; Stephen, S.; Kent, W.J.; Mattick, J.S.; Haussler, D. Ultraconserved elements in the human genome. Science 2004, 304, 1321–1325. [Google Scholar] [CrossRef] [PubMed]
  16. Dermitzakis, E.T.; Kirkness, E.; Schwarz, S.; Birney, E.; Reymond, A.; Antonarakis, S.E. Comparison of human chromosome 21 conserved nongenic sequences (CNGs) with the mouse and dog genomes shows that their selective constraint is independent of their genic environment. Genome Res. 2004, 14, 852–859. [Google Scholar] [CrossRef] [PubMed]
  17. Dermitzakis, E.T.; Reymond, A.; Lyle, R.; Scamuffa, N.; Ucla, C.; Deutsch, S.; Stevenson, B.J.; Flegel, V.; Bucher, P.; Jongeneel, C.V.; Antonarakis, S.E. Numerous potentially functional but non-genic conserved sequences on human chromosome 21. Nature 2002, 420, 578–582. [Google Scholar] [CrossRef] [PubMed]
  18. Gardiner, E.J.; Hirons, L.; Hunter, C.A.; Willett, P. Genomic data analysis using DNA structure: an analysis of Conserved Non-Genic sequences and Ultra-Conserved Elements. J. Chem. Inf. Model. 2006, 46, 753–761. [Google Scholar] [CrossRef] [PubMed]
  19. Hunter, C.A. Sequence-dependent DNA-structure - the role of base stacking interactions. J. Mol. Biol. 1993, 230, 1025–1054. [Google Scholar] [CrossRef] [PubMed]
  20. Hunter, C.A.; Lu, X.J. Construction of double-helical DNA structures based on dinucleotide building blocks. J. Biomol. Struct. Dyn. 1997, 14, 747–756. [Google Scholar] [CrossRef] [PubMed]
  21. Hunter, C.A.; Lu, X.J. DNA base-stacking interactions: A comparison of theoretical calculations with oligonucleotide X-ray crystal structures. J. Mol. Biol. 1997, 265, 603–619. [Google Scholar] [CrossRef] [PubMed]
  22. Packer, M.J.; Dauncey, M.P.; Hunter, C.A. Sequence-dependent DNA structure: Dinucleotide conformational maps. J. Mol. Biol. 2000, 295, 71–83. [Google Scholar] [CrossRef] [PubMed]
  23. Packer, M.J.; Dauncey, M.P.; Hunter, C.A. Sequence-dependent DNA structure: Tetranucleotide conformational maps. J. Mol. Biol. 2000, 295, 85–103. [Google Scholar] [CrossRef] [PubMed]
  24. Packer, M.J.; Hunter, C.A. Sequence-structure relationships in DNA oligomers: A computational approach. J. Am. Chem. Soc. 2001, 123, 7399–7406. [Google Scholar]
  25. Gardiner, E.J.; Hunter, C.A.; Lu, X.J.; Willett, P. A structural similarity analysis of double-helical DNA. J. Mol. Biol. 2004, 343, 879–889. [Google Scholar] [CrossRef] [PubMed]
  26. Gardiner, E.J.; Hunter, C.A.; Packer, M.J.; Palmer, D.S.; Willett, P. Sequence-dependent DNA structure: A database of octamer structural parameters. J. Mol. Biol. 2003, 332, 1025–1035. [Google Scholar] [CrossRef] [PubMed]
  27. Bock, C.; Paulsen, M.; Tierling, S.; Mikesa, T.; Lengauer, T.; Walter, J. CpG island methylation in human lymphocytes is highly correlated with DNA sequence patters, repeat frequencies and predicted DNA structure. PLoS Genetics 2006, 2, 243–252. [Google Scholar] [CrossRef] [PubMed]
  28. Fickett, J.W.; Tung, C.S. Assessment of protein coding measures. Nucleic Acids Res. 1992, 20, 6441–6450. [Google Scholar] [CrossRef] [PubMed]
  29. Cawley, S.; Bekiranov, S.; Ng, H.H.; Kapranov, P.; Sekinger, E.A.; Kampa, D.; Piccolboni, A.; Sementchenko, V.; Cheng, J.; Williams, A.J.; Wheeler, R.; Wong, B.; Drenkow, J.; Yamanaka, M.; Patel, S.; Brubaker, S.; Tammana, H.; Helt, G.; Struhl, K.; Gingeras, T.R. Unbiased mapping of transcription factor binding sites along human chromosomes 21 and 22 points to widespread regulation of noncoding RNAs. Cell 2004, 116, 499–509. [Google Scholar] [CrossRef]
  30. Kampa, D.; Cheng, J.; Kapranov, P.; Yamanaka, M.; Brubaker, S.; Cawley, S.; Drenkow, J.; Piccolboni, A.; Bekiranov, S.; Helt, G.; Tammana, H.; Gingeras, T.R. Novel RNAs identified from an in-depth analysis of the transcriptome of human chromosomes 21 and 22. Genome Res. 2004, 14, 331–342. [Google Scholar] [CrossRef] [PubMed]
  31. Kampa, D.; Kapranov, P.; Cawley, S.; Bekiranov, S.; Ng, H.H.; Sekinger, E.A.; Piccolboni, A.; Sementchenko, V.; Cheng, J.; Drenkow, J.; Yamanaka, M.; Patel, S.; Brubaker, S.; Tammana, H.; Narayanan, B.; Helt, G.; Struhl, K.; Gingeras, T.R. Global mapping of functionally-important and regulatory regions on human chromosomes 21 and 22 reveal novel regulatory networks in the human genome. Am. J. Hum. Genet. 2003, 73, 118. [Google Scholar]
  32. Karolchik, D.; Baertsch, R.; Diekhans, M.; Furey, T.S.; Hinrichs, A.; Lu, Y.T.; Roskin, K.M.; Schwartz, M.; Sugnet, C.W.; Thomas, D.J.; Weber, R.J.; Haussler, D.; Kent, W.J. The UCSC Genome Browser Database. Nucleic Acids Res. 2003, 31, 51–54. [Google Scholar] [CrossRef] [PubMed]
  33. Kent, W.J. BLAT - The BLAST-like alignment tool. Genome Res. 2002, 12, 656–664. [Google Scholar] [CrossRef] [PubMed]
  34. Ginn, C.M.R.; Willett, P.; Bradshaw, J. Combination of molecular similarity measures using data fusion. Perspect. Drug Discov. Des. 2000, 20, 1–16. [Google Scholar] [CrossRef]
  35. Salim, N.; Holliday, J.; Willett, P. Combination of fingerprint-based similarity coefficients using data fusion. J. Chem. Inf. Comput. Sci. 2003, 43, 435–442. [Google Scholar] [CrossRef] [PubMed]
  36. Charifson, P.S.; Corkery, J.J.; Murcko, M.A.; Walters, W.P. Consensus scoring: A method for obtaining improved hit rates from docking databases of three-dimensional structures into proteins. J. Med. Chem. 1999, 42, 5100–5109. [Google Scholar] [CrossRef] [PubMed]

