Review

Algorithm for the Analysis of Tryptophan Fluorescence Spectra and Their Correlation with Protein Structural Parameters

Physics Department, University of Rhode Island, 2 Lippitt Rd, Kingston, RI 02881, USA
*
Author to whom correspondence should be addressed.
Algorithms 2009, 2(3), 1155-1176; https://doi.org/10.3390/a2031155
Submission received: 15 July 2009 / Revised: 20 August 2009 / Accepted: 10 September 2009 / Published: 16 September 2009
(This article belongs to the Special Issue Algorithms and Molecular Sciences)

Abstract

:
The fluorescence properties of tryptophan residues are sensitive to the microenvironment of fluorophores in proteins. Therefore, fluorescence characteristics are widely used to study structural transitions in proteins. However, the decoding of the structural information from spectroscopic data is challenging. Here we present a review of approaches developed for the decomposition of multi-component protein tryptophan fluorescence spectra and correlation of these spectral parameters with protein structural properties.

Fluorescence spectroscopy is a powerful tool for the investigation of protein structure, conformations and dynamics, since fluorescence properties of tryptophan residues vary widely depending on the tryptophan environment in a given protein (Figure 1). The major goal in the application of tryptophan fluorescence spectroscopy is to interpret fluorescence properties in terms of structural parameters and to predict structural changes in a protein.
Figure 1. Examples of protein fluorescence spectra of tryptophan residues located in different environments of protein molecule. The position of maximum of fluorescence spectra can vary in range of 305 to 355 nm.
Algorithms 02 01155 g001

1. Methods for the Analysis of Protein Fluorescence Spectra

1.1. Protein fluorescence

Proteins are the most extensively studied naturally fluorescent molecules. There are three emitting residues in proteins: tryptophan (Trp), tyrosine (Tyr) and phenylalanine (Phe). The illumination of proteins at wavelengths 295–305 nm allows for the selective excitation of mostly Trp residues. The fluorescence parameters of tryptophan residues, in contrast to tyrosine and phenylalanine residues, are sensitive to the environment. The main reason for this is the large redistribution of electron density in the asymmetric indole ring of the Trp residue (Figure 2) after the excitation of photons, while practically no redistribution occurs in Tyr and Phe symmetric rings [1,2,3,4,5,6,7,8,9,10]. Quantum-mechanical studies showed that much electron density is lost from the Nε1 and Cγ atoms and is deposited at the Cε3, Cζ2, and Cδ2 atoms of the indole ring during excitation (10-15 sec) in the main fluorescent state 1La [11,12]. This leads to a large increase in the indole dipole moment in the excited 1La state compared with the ground state (by up to >10 D in water) and creates a local non-equilibrium in the surrounding Trp environment [3,5,11,13,14,15]. Depending on the structural properties of the environment of tryptophan residues in proteins, various interactions between atoms of the indole ring and protein atoms, and/or water molecules, could occur during the lifetime of the excited state (pico- and nano-seconds). These interactions affect the fluorescence properties, including the position of maximum of the fluorescence spectrum, which we will discuss here.
Figure 2. Indole ring of the tryptophan residue.
Algorithms 02 01155 g002

1.2. Complex nature of protein fluorescence spectra

One of the major obstacles in the analysis of fluorescence data lies in the complex nature of protein fluorescence. The overwhelming majority of proteins contain more than one fluorophore and therefore exhibit smooth spectra that contain more than one component. The multicomponent nature of protein spectra makes their unequivocal interpretation difficult. Mathematically, the problem of decomposition of fluorescence spectrum into elementary components is an inverse ill-posed problem - problems of this class are common in spectral and image analysis [16,17,18,19,20]. It is necessary to determine the parameters of the spectral components from the overall experimental spectrum, where the components are indirectly manifested. In general, the solution of problems of this class is unstable against slight variations in the input data (noise). Since the real input data are only known approximately (i.e., with some experimental error), this instability results in an inevitable ambiguity of the solutions. However, a stable solution can often be found by integrating additional information (constraints) that effectively reduces the complexity of the problem [16,21,22].

1.3. Decomposition algorithms

In this section we will briefly mention two methods for the decomposition of steady-state fluorescence spectra. The first approach implements the time-domain [23,24,25] or frequency-domain methods [26,27,28] for the resolution of fluorescence spectra. The methods are based on the fluorescence lifetime measurements, which are in general more complicated than steady-state experiments.
The second approach implements an iterative non-linear-squares analysis of Stern-Volmer quenching plots [20,29,30,31,32]. The method is based on the fact that the fluorescence of tryptophan residues can be quenched by external quencher molecules, such as acrylamide, iodide and cesium ions [33,34,35,36,37]. The probability of fluorescence quenching depends on the rate of collision of the quencher and fluorophores (dynamic quenching). Thus, the emission of tryptophan fluorophores located on the surface of the protein is expected to be quenched more effectively than the fluorescence of the Trp residues buried in the protein matrix, where the quencher has limited access. The dependence of the emission intensity on the quencher concentration [c] is given by the well-known Stern-Volmer equation:
F 0 F = τ 0 τ = 1 + K s v c
where F0, F is the fluorescence intensity and τ0, τ is the lifetime in the absence and presence of the quencher, respectively; and Ksv is the Stern-Volmer constant. The significant limitation of this method lies in the fact that it can only resolve a spectrum into two components, corresponding to two classes of tryptophan residues (exposed and buried), while reality might be much more complicated.

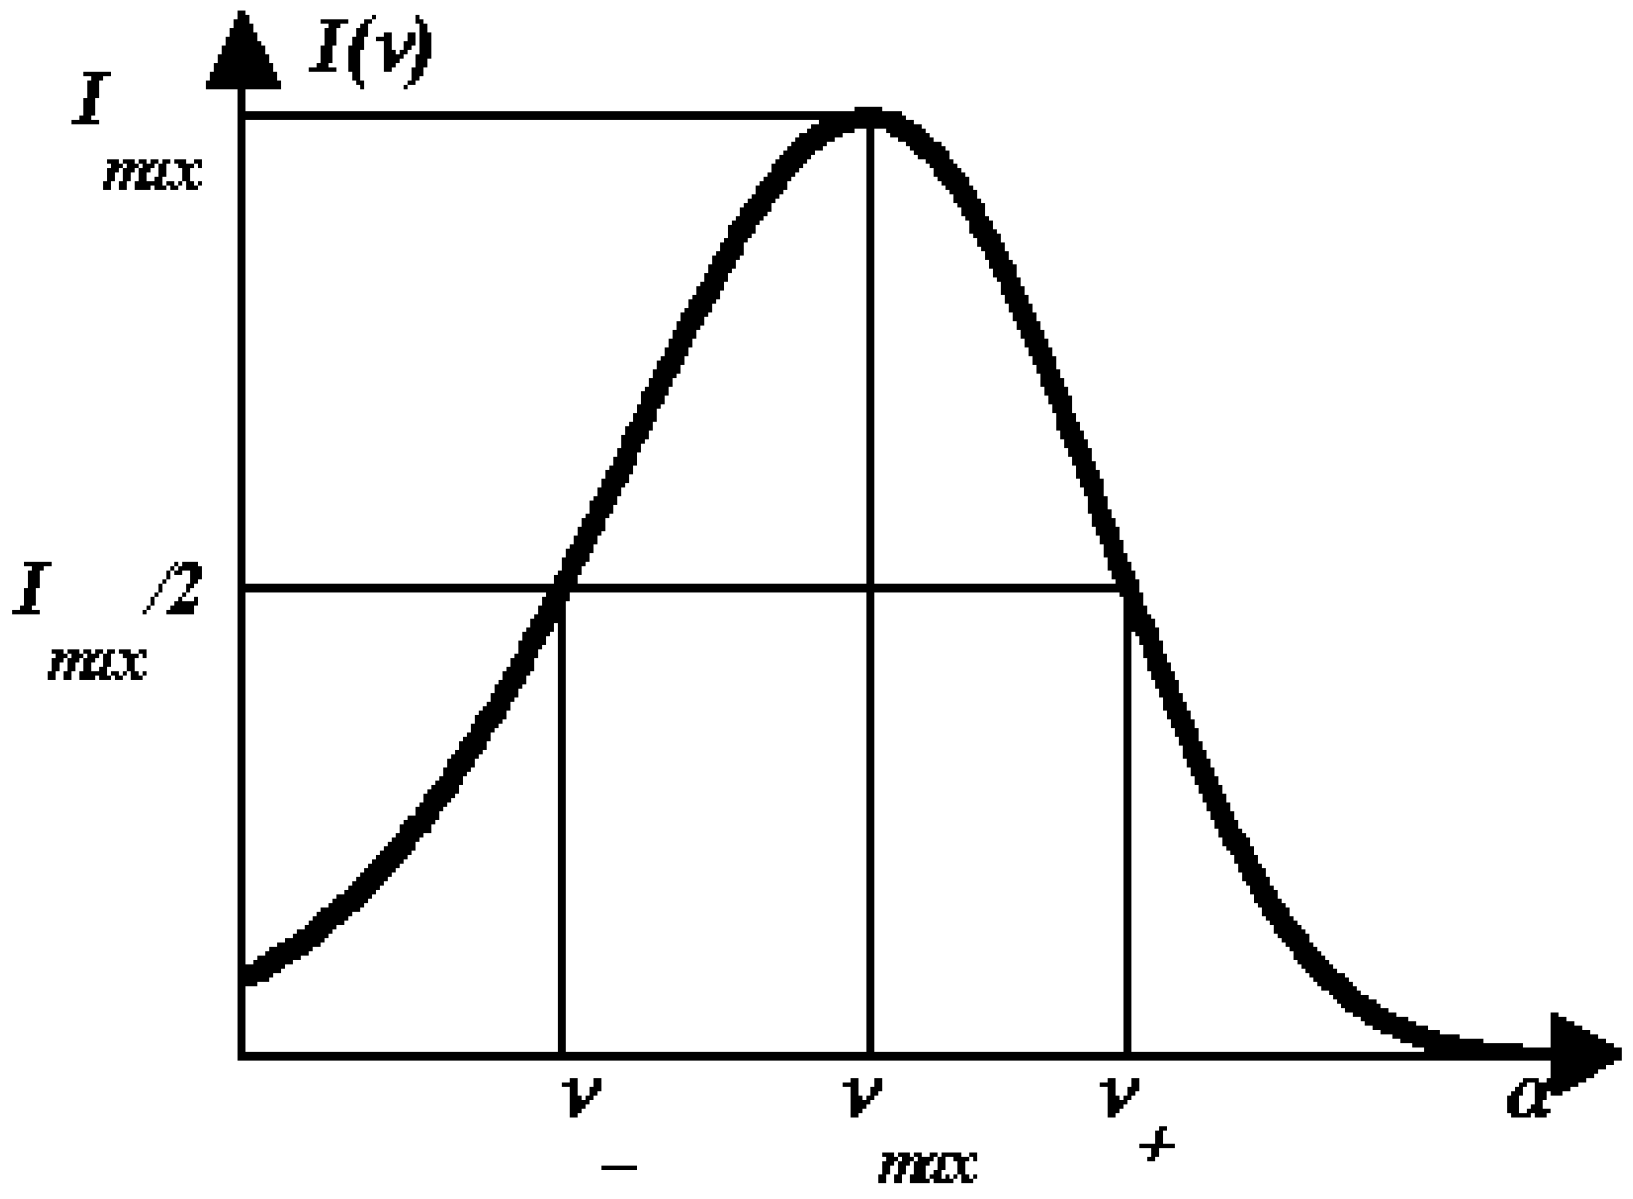
1.4. Log-normal function for describing spectral curves

The decomposition methods described above do not employ any analytical descriptions of the spectral curves. There were many attempts to describe spectral components by using various mathematical functions [38,39,40,41]. The quadric-parametric (maximal amplitude, Im, position of the maximum, νm, and positions of half-maximal amplitudes, ν and ν+; Figure 3) log-normal function originally proposed by Siano and Metzler [38], was found to be one of the best functions for describing absorption spectra of complex molecules with a minimal number of variable parameters [39,40,41,42,43]. The log-normal function used in its mirror-symmetric form has been shown to accurately describe fluorescence spectra as well [44,45,46,47] and can be written as:
{ I ( ν ) = I m exp { ln 2 ln 2 ρ ln 2 ( a ν a ν m ) } ( at   ν   < a ) I ( ν ) = 0 ( at   ν   a )
where Im is the maximal intensity; ν is the current wavenumber; ρ is the band asymmetry parameter and a is the function limiting point position (Figure 3):
ρ = ν m ν ν + ν m a = ν m + ρ ( ν + ν ) ρ 2 1
Figure 3. The log-normal function.
Algorithms 02 01155 g003
Despite the fact that the log-normal function describes the shape of fluorescence spectra very well, it is not of any practical use in decomposition algorithms, since it has too many variable parameters (seven or eleven unknown parameters for two- or three- component solutions, respectively). Estimating so many parameters would lead to unstable solutions. Thus, an extremely important result was obtained by Burstein and Emelyanenko [44], who experimentally established the existence of linear relationships between the positions of maximal (νm) and two half-maximal amplitudes (ν and ν+) for a large series of monocomponent spectra of small tryptophan derivatives in various solvents:
ν + = 0.831 ν m + 7070 ν = 1.177 ν m 7780
These relations allow a reduction in the number of unknown parameters for individual spectral component from four (Im, νm, ν , ν+) to two (Im, νm) (three or five unknown parameters for two- or three- component solutions, respectively). Such a significant reduction in the number of parameters makes decomposition analysis much less ambiguous [48]. By implementing this additional information (constraints) and using the log-normal function to describe the spectral components, two mathematically different algorithms for the decomposition of fluorescence spectra were developed: SIMS - simple fitting procedure using the root-mean-square criterion, which is based on the minimal least-square approach, and PHREQ - PHase-plot-based REsolution using Quenchers that uses an analytical pseudo-graphic solving technique [45]. Later, the linear relations between the position of maximum and the width of spectra were established for environment sensitive fluorophores Prodan and Acrylodan [47].

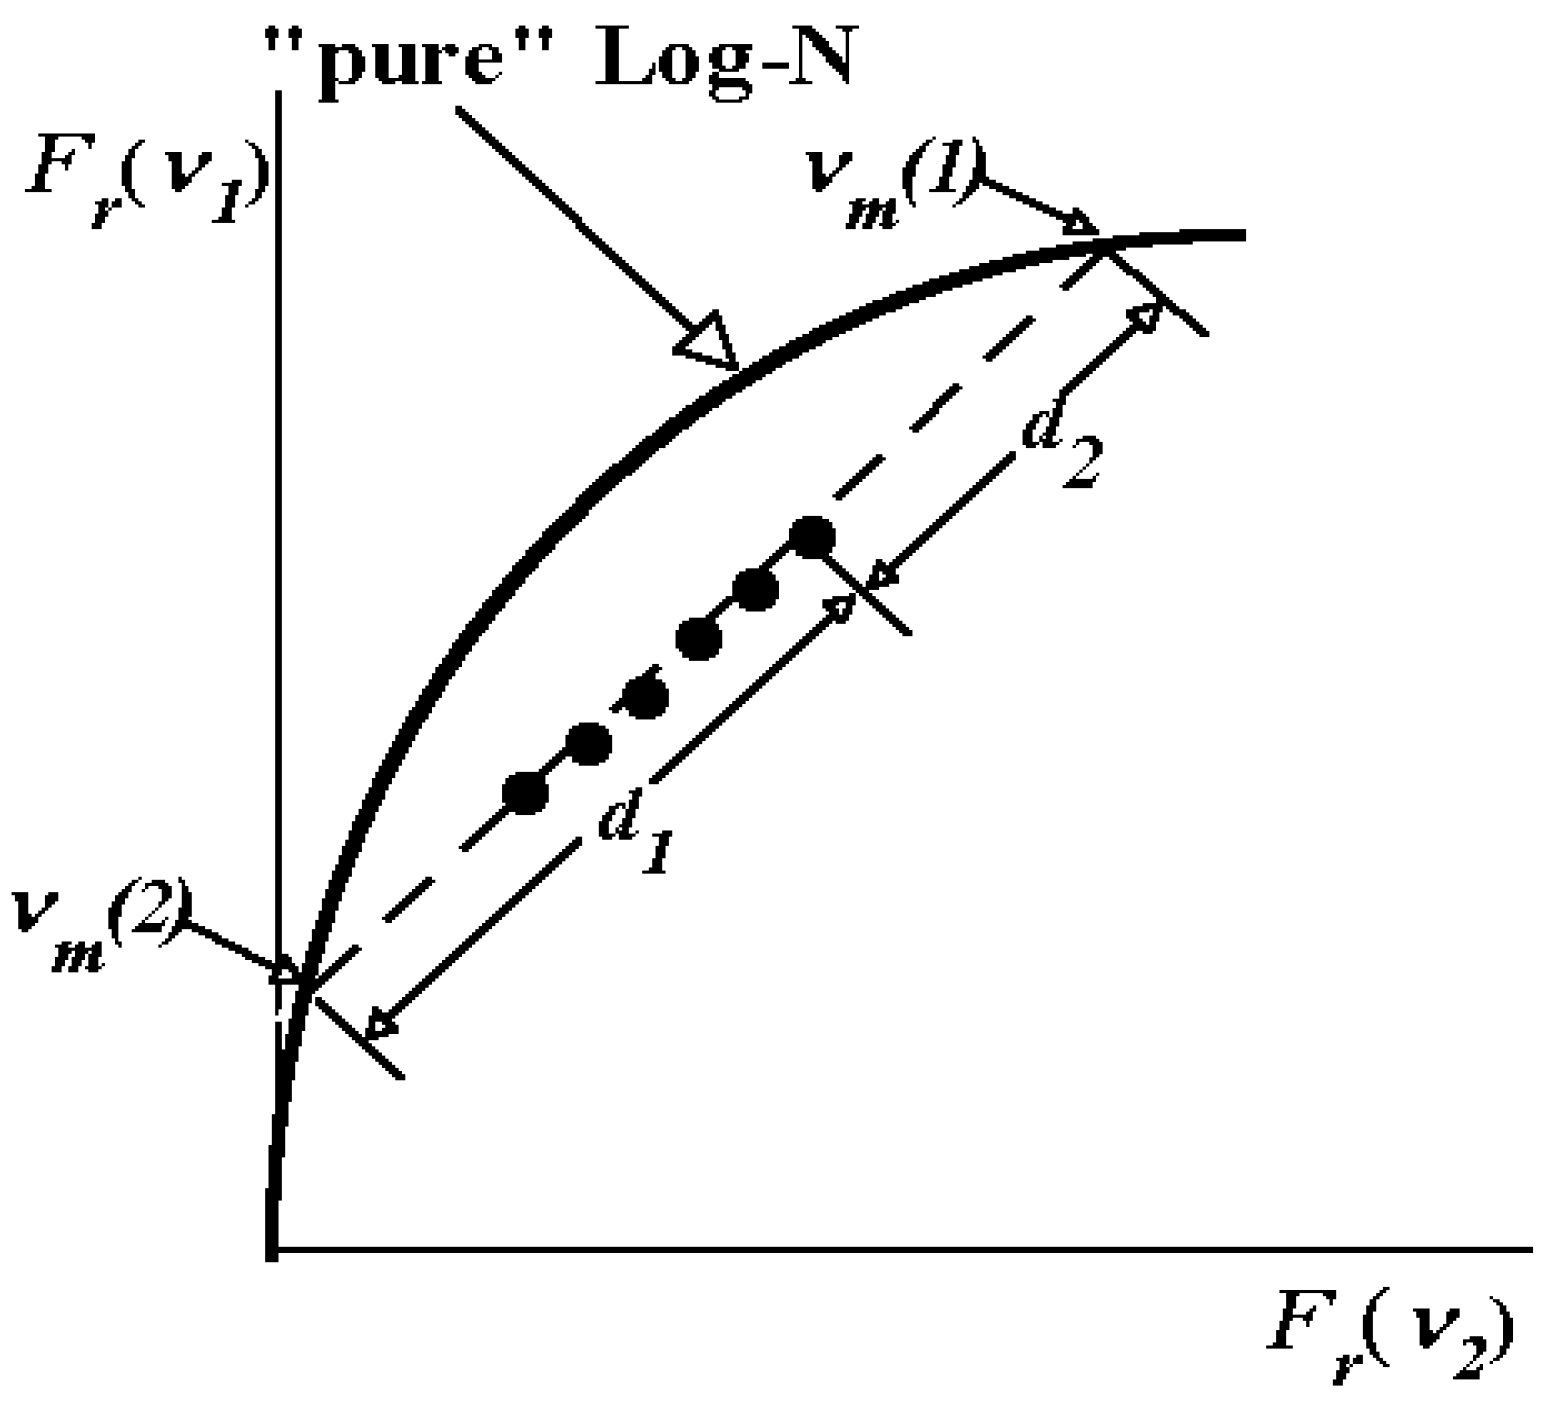
1.5. SIMS and PHREQ decomposition algorithms

Several constraints were implemented into the SIMS and PHEQ decomposition algorithms, which reduced the complexity of the problem. Thus, stable solutions could be derived with an error not exceeding the experimental one [45]. The implemented constraints are:
1)
The spectrum of an elementary component on the frequency (wave number) scale is described by a bi-parametric (maximal amplitude and position of the maximum) log-normal function (Equation 2 and 3).
2)
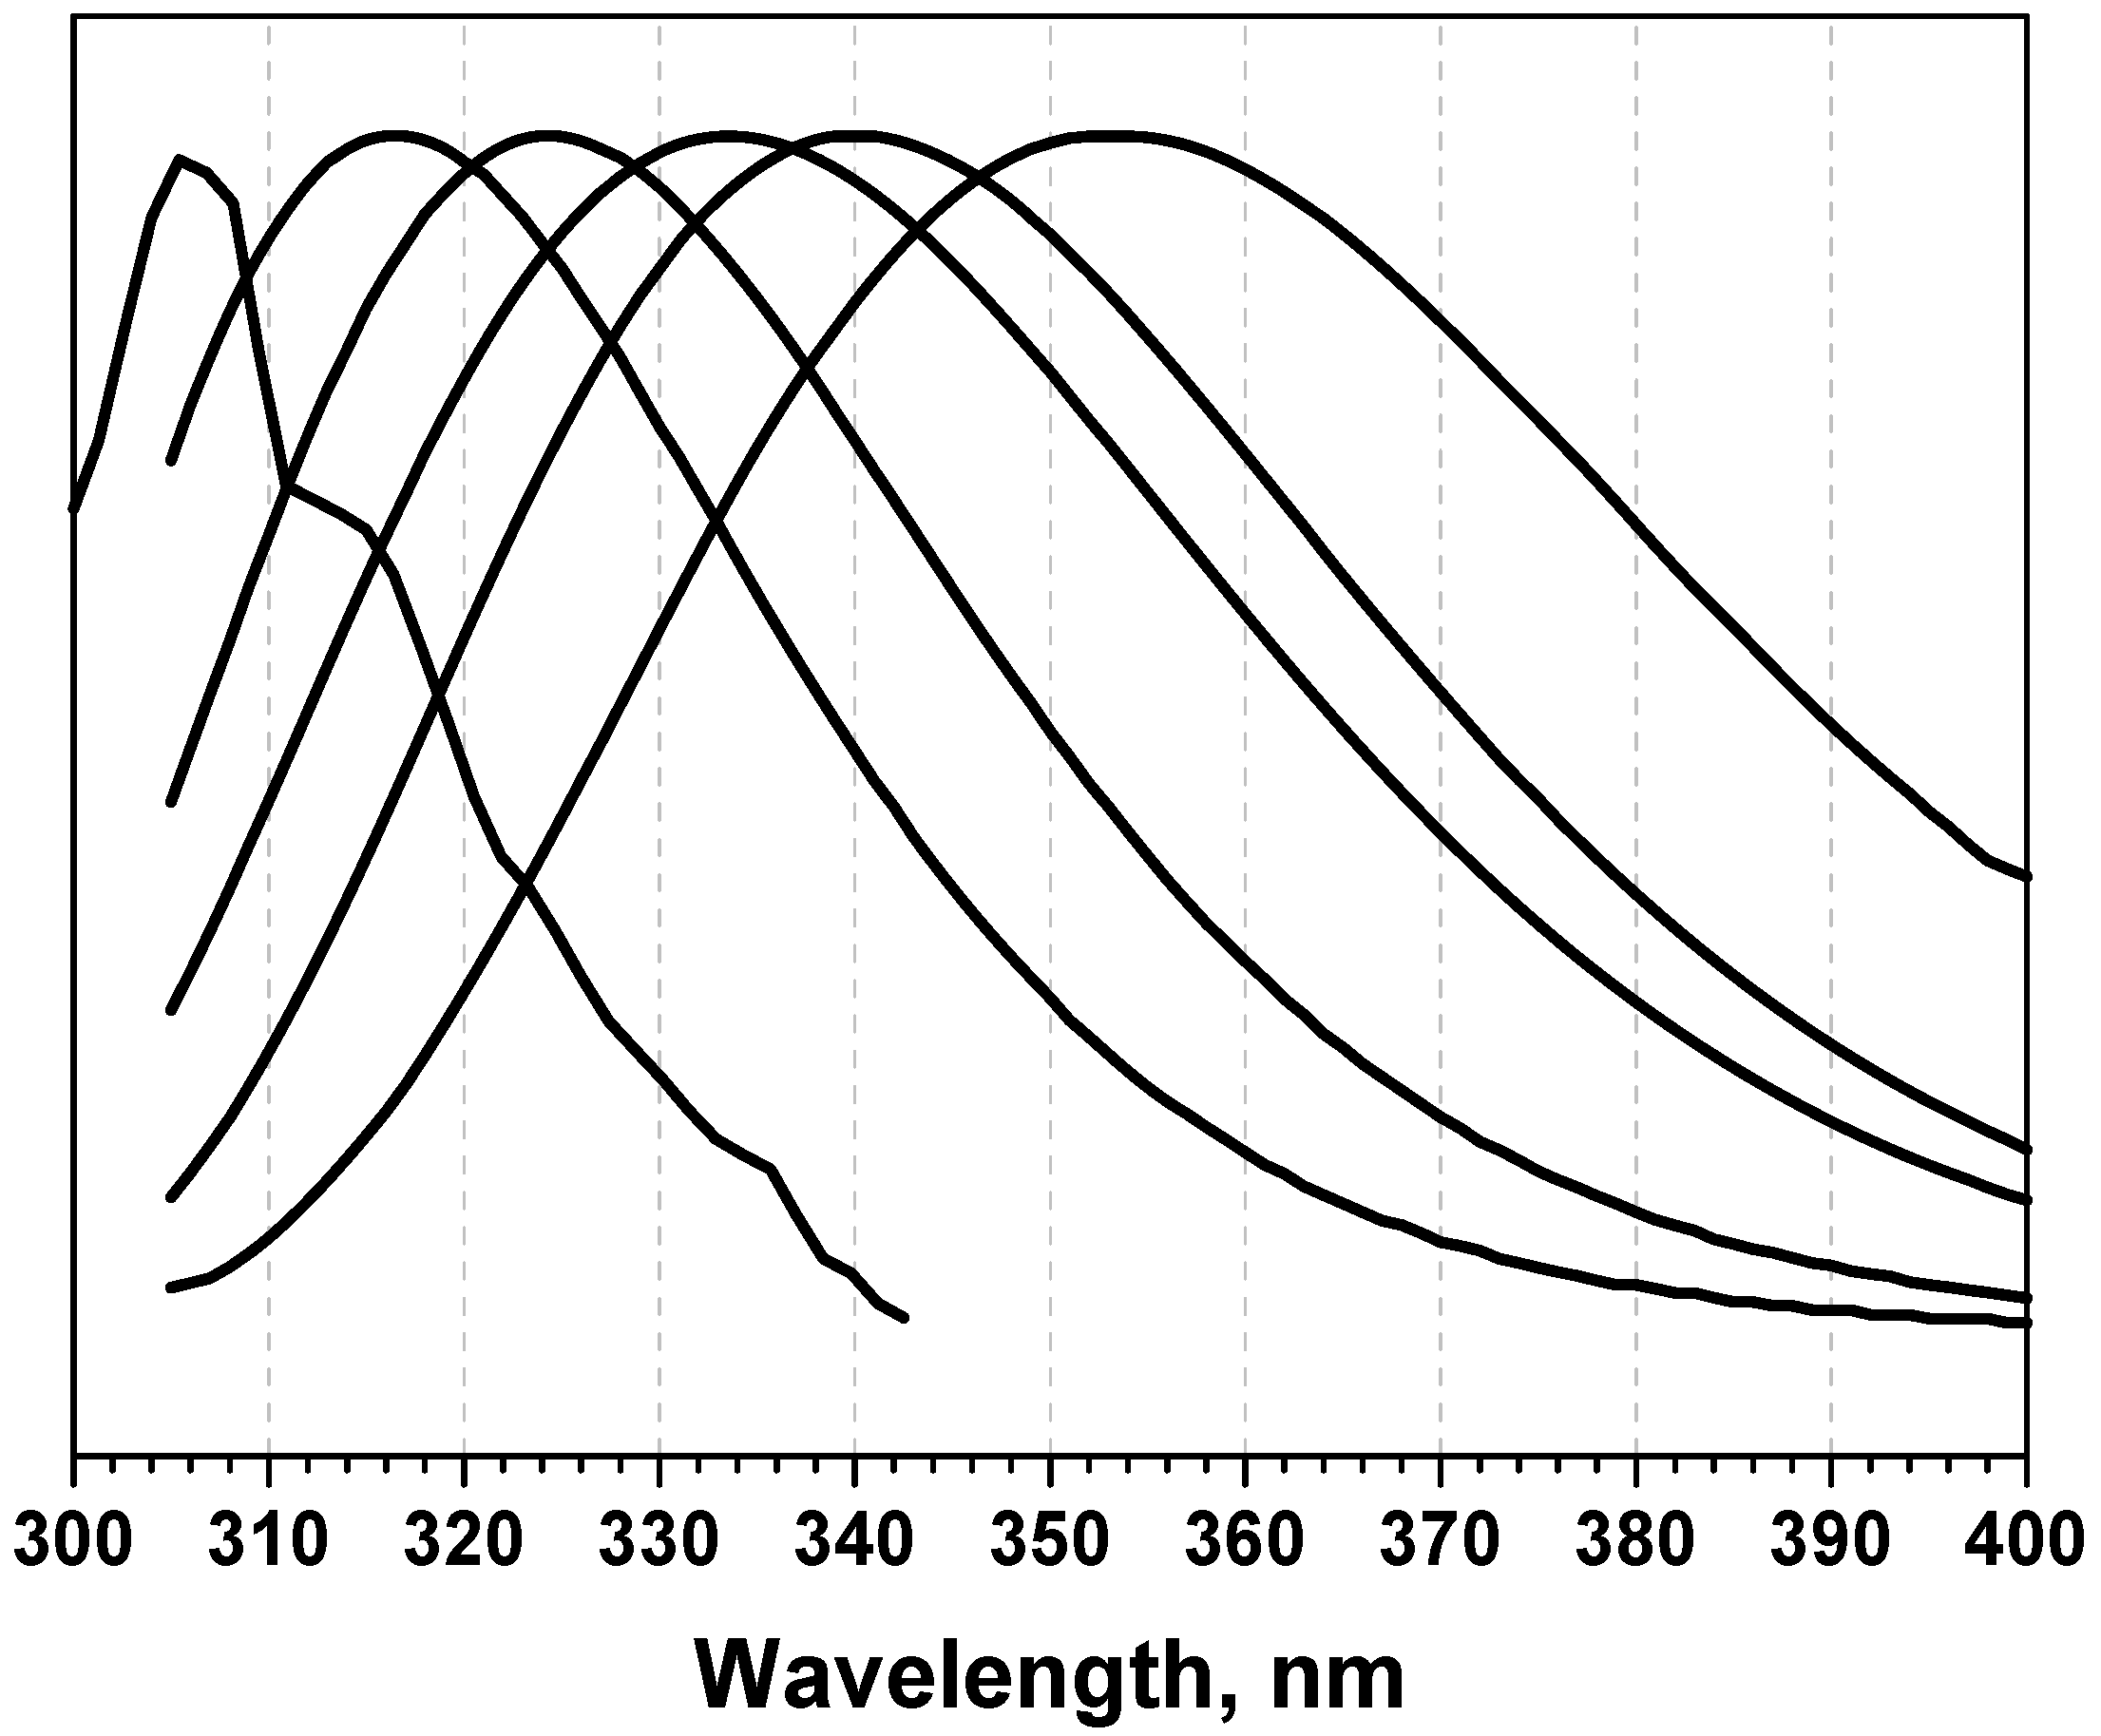
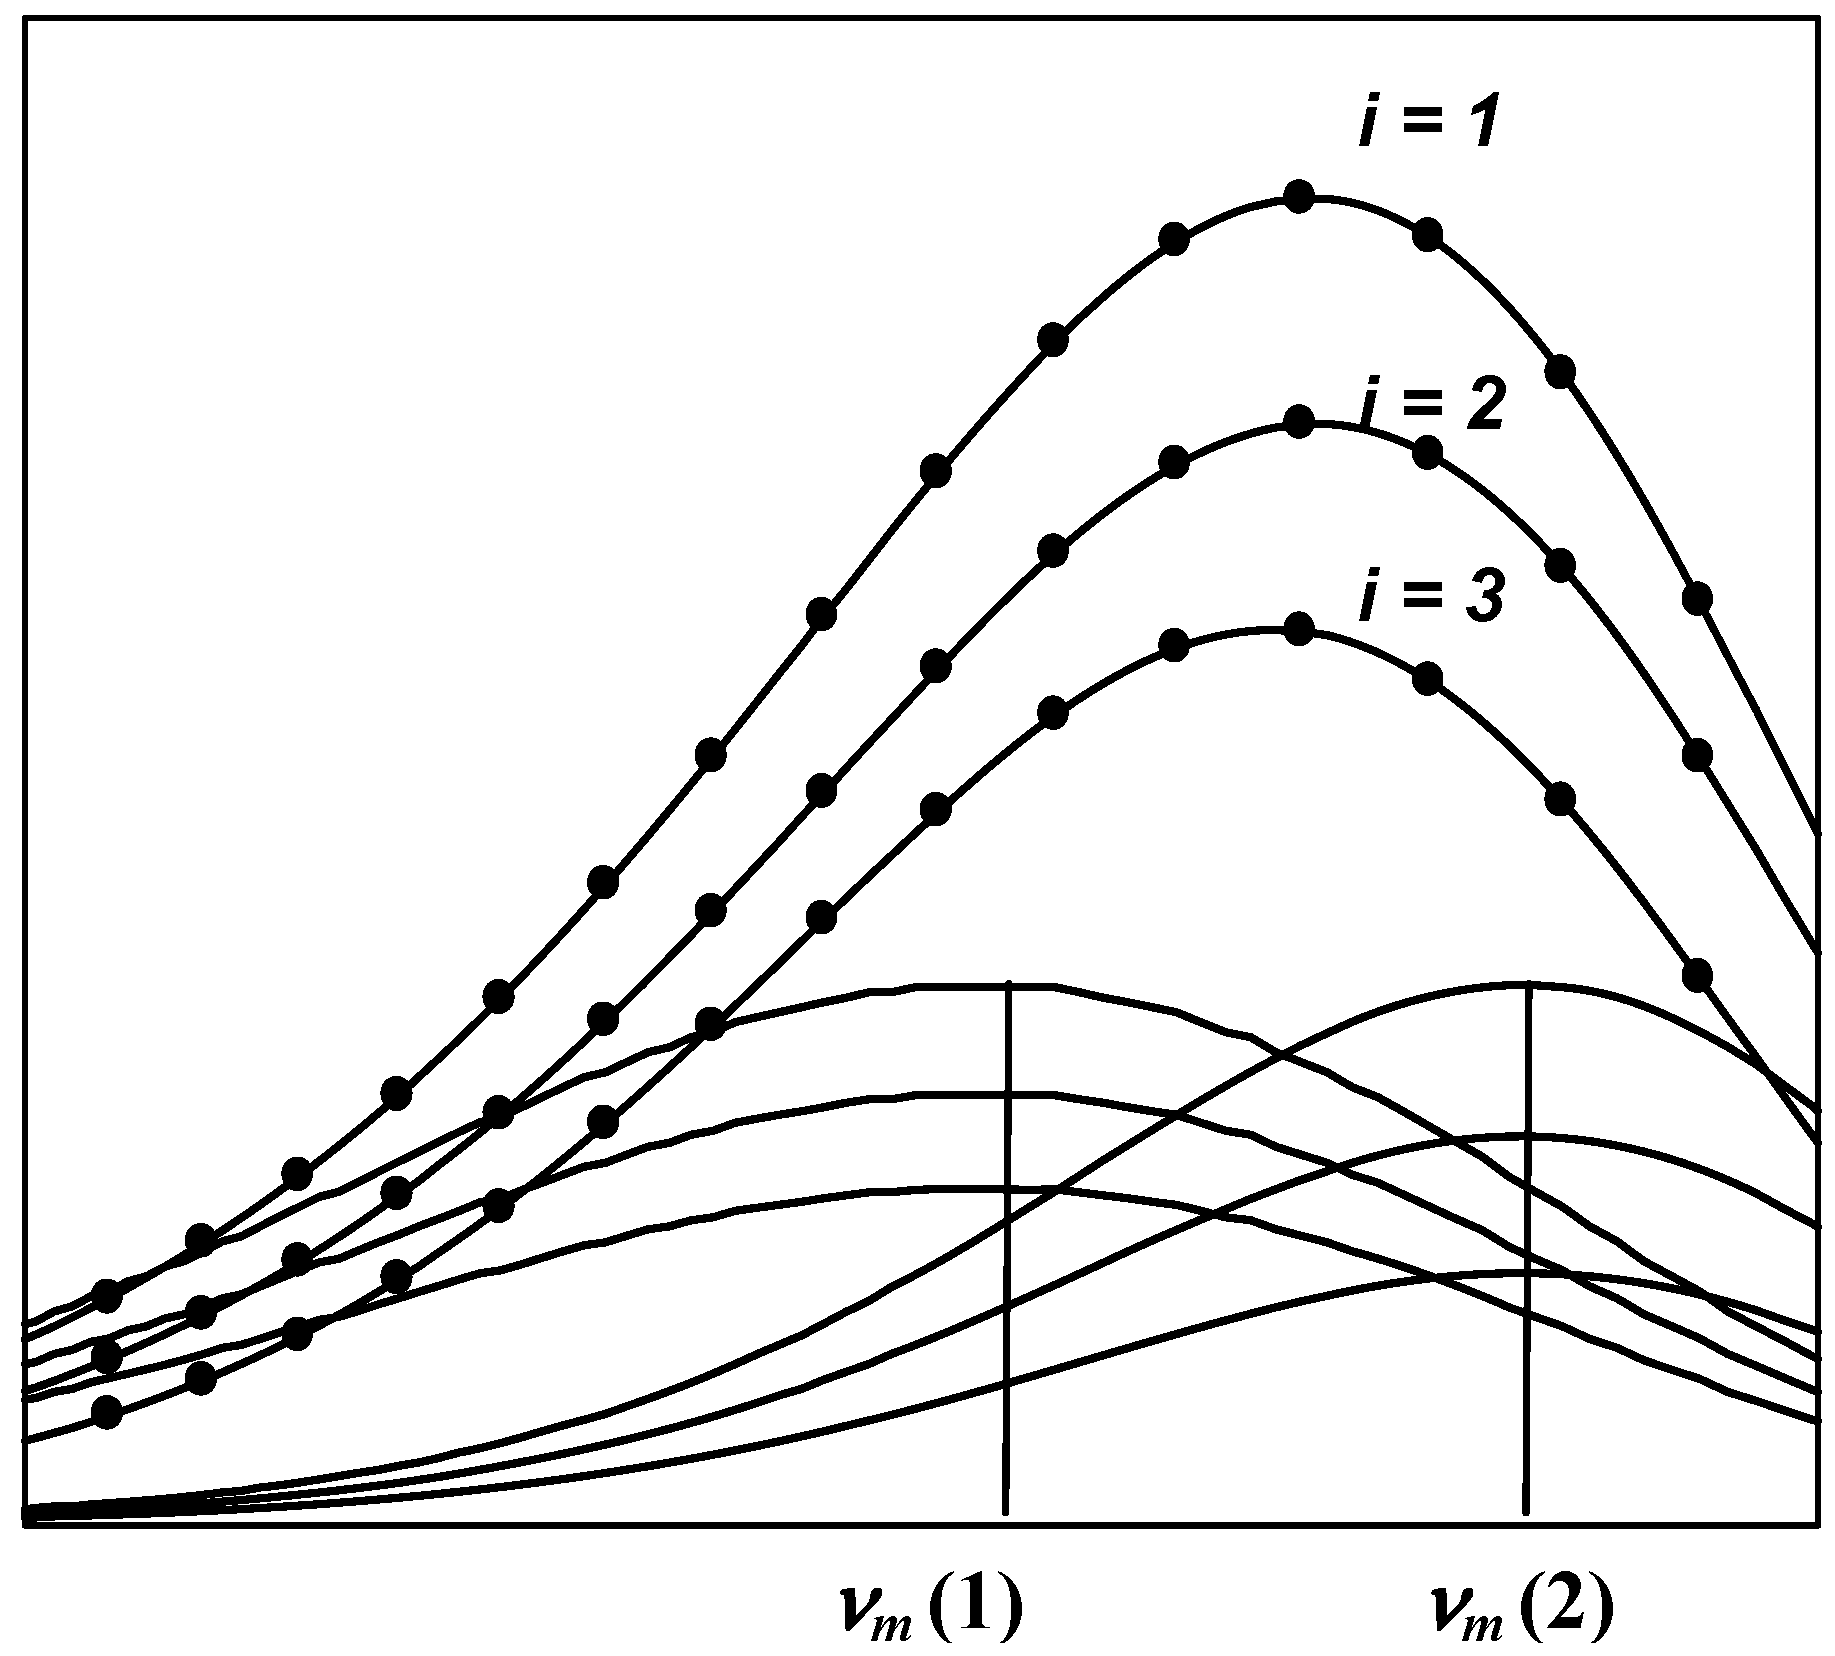
The shape and position of the tryptophan emission spectra remain unchanged by quenching of the fluorescence by small water-soluble quenchers [34,35]. Thus, a series of spectra measured at various quencher concentrations represents a sum of spectral components whose position and shape are constant at all quencher concentrations, while the relative spectral contributions (intensities) are changed. This allows the analysis of all spectra measured at different concentrations of quencher in a global mode.
3)
The change in amplitudes of the individual components induced by quenching obeys the Stern-Volmer law (Equation 1).
4)
The number of experimental points under analysis greatly exceeds the number of parameters sought. This approach attenuates the effect of occasional noise [49].
The input to the algorithms are the tryptophan fluorescence spectra measured at different concentrations c(i) of the external fluorescence quenchers (acrylamide or I-, or Cs+, or NO3-). Since under different concentrations of the quenchers, the position and shape of the spectral components remain unchanged, while the relative contributions of the components change, the experimental spectra can be written as:
F ( i , j ) = k = 1 L I ( k , i ) φ ( k , j )
where i = 1, ..., N is the number of spectra corresponding to the i-th quencher concentration, c(i); j = 1, ..., M is the number of current frequency (wavenumber), ν(j); k = 1, ..., L is the number of component determined by the position of its spectral maximum, νm(k); F(i, j) is the experimental intensity of fluorescence on the wavenumber scale in the i-th spectrum at the j-th frequency ν(j); φ(k, j) is the value of the log-normal function (Equations 2 and 3) with a position of the maximum at νm (k) at current frequency ν(j) with unit maximal amplitude (at given k and j, this value is the same for any of the N spectra); I(k, i) is the maximal amplitude of the k-th component in the i-th spectrum (Figure 4).
Figure 4. Plot of three fluorescence spectra measured at three different concentration of quencher (i = 1, 2 and 3) (black points). Each spectrum was decomposed into two components with position of maximum of spectral components at νm(1) and νm(2). The shape of the first and second spectral components is described by normalized log-normal functions φ(1, j) and φ(2, j), with intensities I(1, i) and I(2, i), respectively.
Algorithms 02 01155 g004
In order to decompose the spectra into components, it is necessary to find the positions of maximum νm(k) and the maximal intensities I(k, i) of the log-normal spectral components from the set of experimental spectra F(i,j). However, Equation 4 cannot be solved analytically because the log-normal function φ(k, j) is transcendental with respect to the unknown νm(k) (see Equation 2). The position of maximum of spectral components can be found by fitting the νm(k) values. The SIMS method employs the minimal least-square approach, according to which the canonical sets of linear equations are solved to find I(k, i). Thus, the variable parameters, νm(k), are found by fitting, while I(k, i) values are calculated.
The PHREQ method is based on the fact that any physical parameter could be used to characterize the transition from one physical state (A) to another (B). To estimate the contribution of the components in the mixture of A and B, the physical parameters should be linearly related to the extent of transition completing:
α = B A + B
For the decomposition of fluorescence spectra, the “physical” state is constituted by the position and shape of the spectral components, which remain unchanged under the different concentrations of fluorescence quenchers. The total spectrum could be considered as a sum of two spectral components and values of the intensities of spectral components F(i,j) measured at different wavenumbers will represent physical parameters. Added quenchers perturb the “spectral” state, i.e. change the ratios of component contributions. The spectra measured at various quencher concentrations are represented by points on the linear track on a quasi phase-plane (Figure 5). Thus, the phase-plot can be used for estimating the main parameters of the two-component spectrum, i.e. the positions of the maximum of the spectral components and their relative contributions f and (1 − f).
f = d 2 d 1 + d 2
Figure 5. Representation of the fluorescence spectra measured at different concentration of quenchers as points on the quasi-phase plane. The curve “pure” Log-N corresponds to all possible elementary log-normal functions.
Algorithms 02 01155 g005
The main limitation of the PHREQ algorithm is that it can only decompose a spectrum into two components. If the correct solution has indeed two-components, the results of the PHREQ analysis correlate with high accuracy to the results obtained by the SIMS algorithm.
The fact that individual components in the protein fluorescence spectra are very broad and mutually overlapped, poses severe limitations on the procedures that can be used for searching for a functional minimum. Attempts to use fast fitting methods revealed a strong dependence of the solutions on the initial conditions. Therefore, the νm values are exhaustively enumerated (with successively diminishing steps from ca. 8 nm down to 0.1 nm) to find the global minimum in SIMS and PHREQ methods. This procedure does not significantly increase computational time since the space of searched parameters is limited (because the possible position of the maximum of the tryptophan fluorescence spectrum can only lie between 305 to 355 nm, and it is difficult to perform spectral measurements with precision higher than 0.1–0.2 nm). Moreover, exhaustive search obviates the need to set any arbitrary initial conditions, which often leads to an erroneous result when solving the ill-posed problem [50]. It is also important to note that since the width of the spectral component is predetermined by the position of its maximum (Equation 3), the goodness-of-fit is reduced significantly when unnecessary components are included in the model.

1.6. Accuracy of decomposition algorithms

In order to test how various factors might affect the accuracy of the solution, a series of decompositions were carried out for simulated spectra [45]. Among varied factors were: number of spectra (N) with various “quencher concentrations”; number of points in each spectrum (M); randomly introduced noise, (S, %); distance between positions of maximum of spectral components (Δλmax, nm); ratio of Stern-Volmer constants, and contribution of a component in the total spectrum. The quality of the solution was evaluated by the deviation of initial positions of component maxima from those obtained as a result of spectra decomposition (Δλ, nm). It was found that the decomposition methods provide an acceptable level of accuracy (Δλ < 1 nm and < 1.5 nm for the two-component and three-component solutions, respectively) in case of S = 0.5 – 1.5%; N = 3 – 10; M = 10 – 20; Δλmax > 7 nm; and contribution of an individual component in a range of 10 – 90% - conditions of a typical experimental set up.
In addition to validation of the decomposition algorithms, it is extremely important to know that the spectral components indeed correspond to the fluorescence of individual fluorophores. As already mentioned, the problem of data deconvolution is very typical in biophysical sciences. However, in the majority of cases it is not clear whether the obtained components have any physical meaning. Therefore, very important studies were carried with two proteins i) outer envelope protein 16, OEP16 and ii) Eosinophil Cationic Protein, ECP. Both proteins contain two tryptophan residues located in different parts of the protein molecules. Two single-tryptophan mutants were generated for each protein. Steady-state fluorescence spectra of wild-type and single-tryptophan mutants were recorded and decomposition analysis was applied [51,52]. The spectral components revealed by the decomposition of the fluorescence spectra of the wild-type proteins were strongly correlated with the position of the maximum of the single-tryptophan-containing mutants.
The decomposition methods were tested on model compounds and single-tryptophan containing proteins and applied for the deconvolution of the fluorescence spectra of more than 150 proteins [46,53]. The application of the decomposition algorithms was successfully extended for the analysis of fluorescence spectra of Acrylodan and Prodan [47].

2. Algorithm for the Analysis of Structural Properties of Environment of Tryptophan Residues from Atomic Structures of Proteins

The methods of spectral analysis allow extraction of the fluorescence properties of individual tryptophan residues, thus creating an opportunity to investigate the spectral-structural relationship. More than 35 years ago the first attempts were made to reveal a correlation between fluorescence parameters and structural characteristics of the tryptophan fluorophore’s environment based on the atomic structures of several proteins [54,55,56]. Since then rapid progress in X-ray crystallography and NMR spectroscopy methods have led to an increase in the number of works where the measured fluorescence properties of individual proteins were analyzed in relation to structural features [57,58,59,60,61,62,63,64,65,66]. A number of databases and algorithms were proposed for calculating different structural and physical characteristics of individual residues in proteins [67,68,69,70,71,72,73].
Here we present the major aspects of an algorithm for the calculation of structural properties of the environment of tryptophan residues derived from the atomic structures data contained in the Protein Data Bank (PDB) [46,53]. The specially created program identifies and characterizes the environment of tryptophan residues in proteins. All protein atoms and water molecules located at distance of ≤7.5 Å from the indole atoms are considered as belonging to the tryptophan fluorophore environment. To analyze the location and orientation of the neighbor protein, or structure-defined solvent groups, a spherical system of coordinates is centered in turn on each of nine atoms of the indole ring of the Trp residue. Potential hydrogen bond donors and acceptors are revealed from the neighboring polar groups around the indole atoms according to the geometric criteria of hydrogen bonds [74]. The program calculates a number of structural parameters such as the accessibility of each atom of the indole ring, and the whole tryptophan residue to the solvent; the packing density and polarity around the tryptophan; the relative flexibility of the environment (based on the information of crystallographic B-factor); the “dynamic accessibility”, which takes into account both flexibility of water molecules and orientation of charged residues near the Trp; and probability of the excitation energy homo-transfer using the Förster equation (for more details see [53]).

3. Correlation between Spectral and Structural Properties of Tryptophan Residues

Decomposition algorithms can be applied to reveal spectral properties of individual tryptophan fluorophores. Structural parameters of an individual tryptophan’s environment can be calculated from the atomic structures of proteins. The final task is to assign spectral components to individual tryptophan residues or clusters of tryptophans located close to each other. This is a problem of classification in multi-dimensional space of different kind of parameters. To address this question, the statistical methods of multivariate analysis are applied.

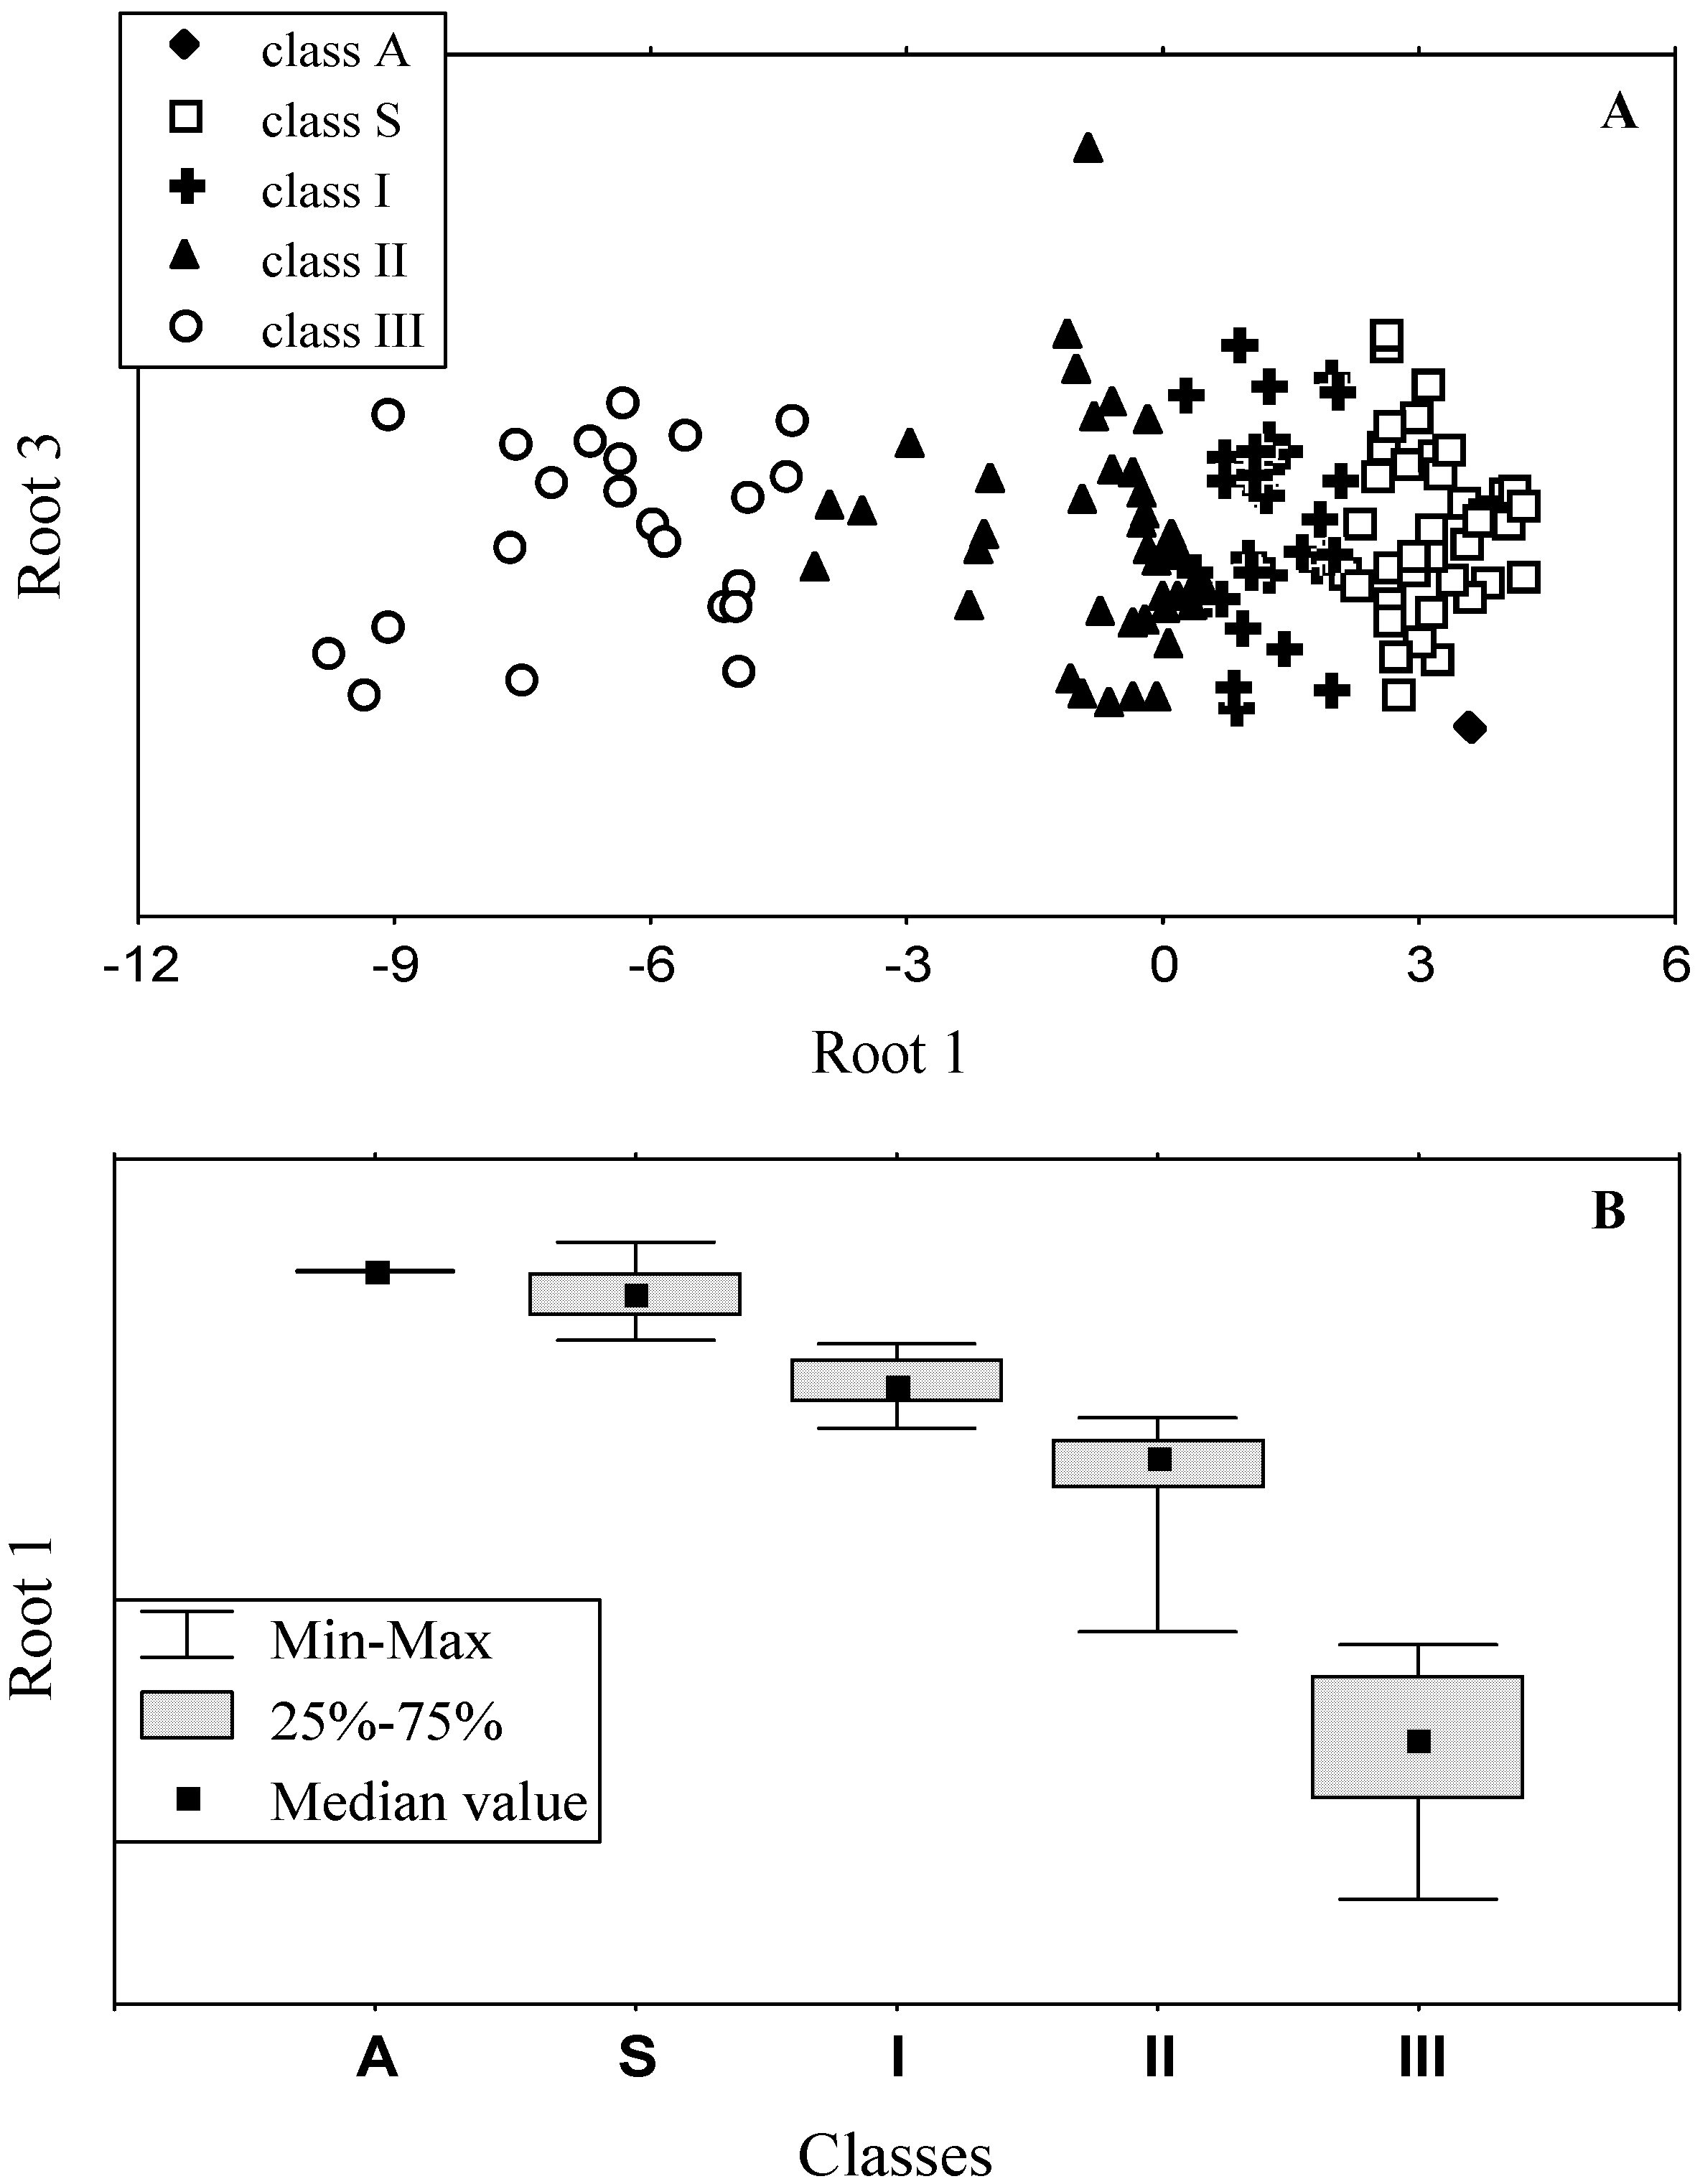
3.1. Statistical classification approaches

There are two main approaches for multivariate data analysis: unsupervised and supervised learning algorithms. For unsupervised learning no prior knowledge about the mathematical structure of the data is assumed. Instead of a-priori assumptions, analytical approaches are used that develop understanding of the underlying structure present in the data (such as the number of clusters, distinct classes, or independent latent vectors). In the case of supervised learning, prior knowledge is used that assigns each sample to a known class or value. The known classes or values are then used to train models and perform prediction.
For high dimensional data, where the number of variables often exceeds the number of observations, both unsupervised and supervised learning are typically performed after reducing the dimension. The amount of dimension reduction possible without significantly reducing the information content is directly related to the amount of structure in the data. If the raw data contain many redundant or highly correlated variables, significant dimension reduction can occur with virtually no loss of information. Contrariwise, if the predictor variables are nearly orthogonal, no dimension reduction is possible at all. Classical methods of dimension reduction include principal components analysis, linear discriminant analysis and multidimensional scaling. Recently developed nonlinear dimension reduction methods such as spectral clustering, isometric mapping , locally linear embedding and others usually outperform the classical methods for dimension reduction, since they are no longer based solely on linear combinations of the variables, and allow for dissimilarities in clusters based on other than simple Euclidean metrics. For example, in the study by Lee et al. [75] the discriminatory power of two supervised classifiers (support vector machines and C4.5 decision trees) was assessed after applying both linear and nonlinear dimension reduction techniques. The results demonstrated that the nonlinear dimension reduction techniques significantly improved both classification accuracy and cluster metrics of the analyzed data.

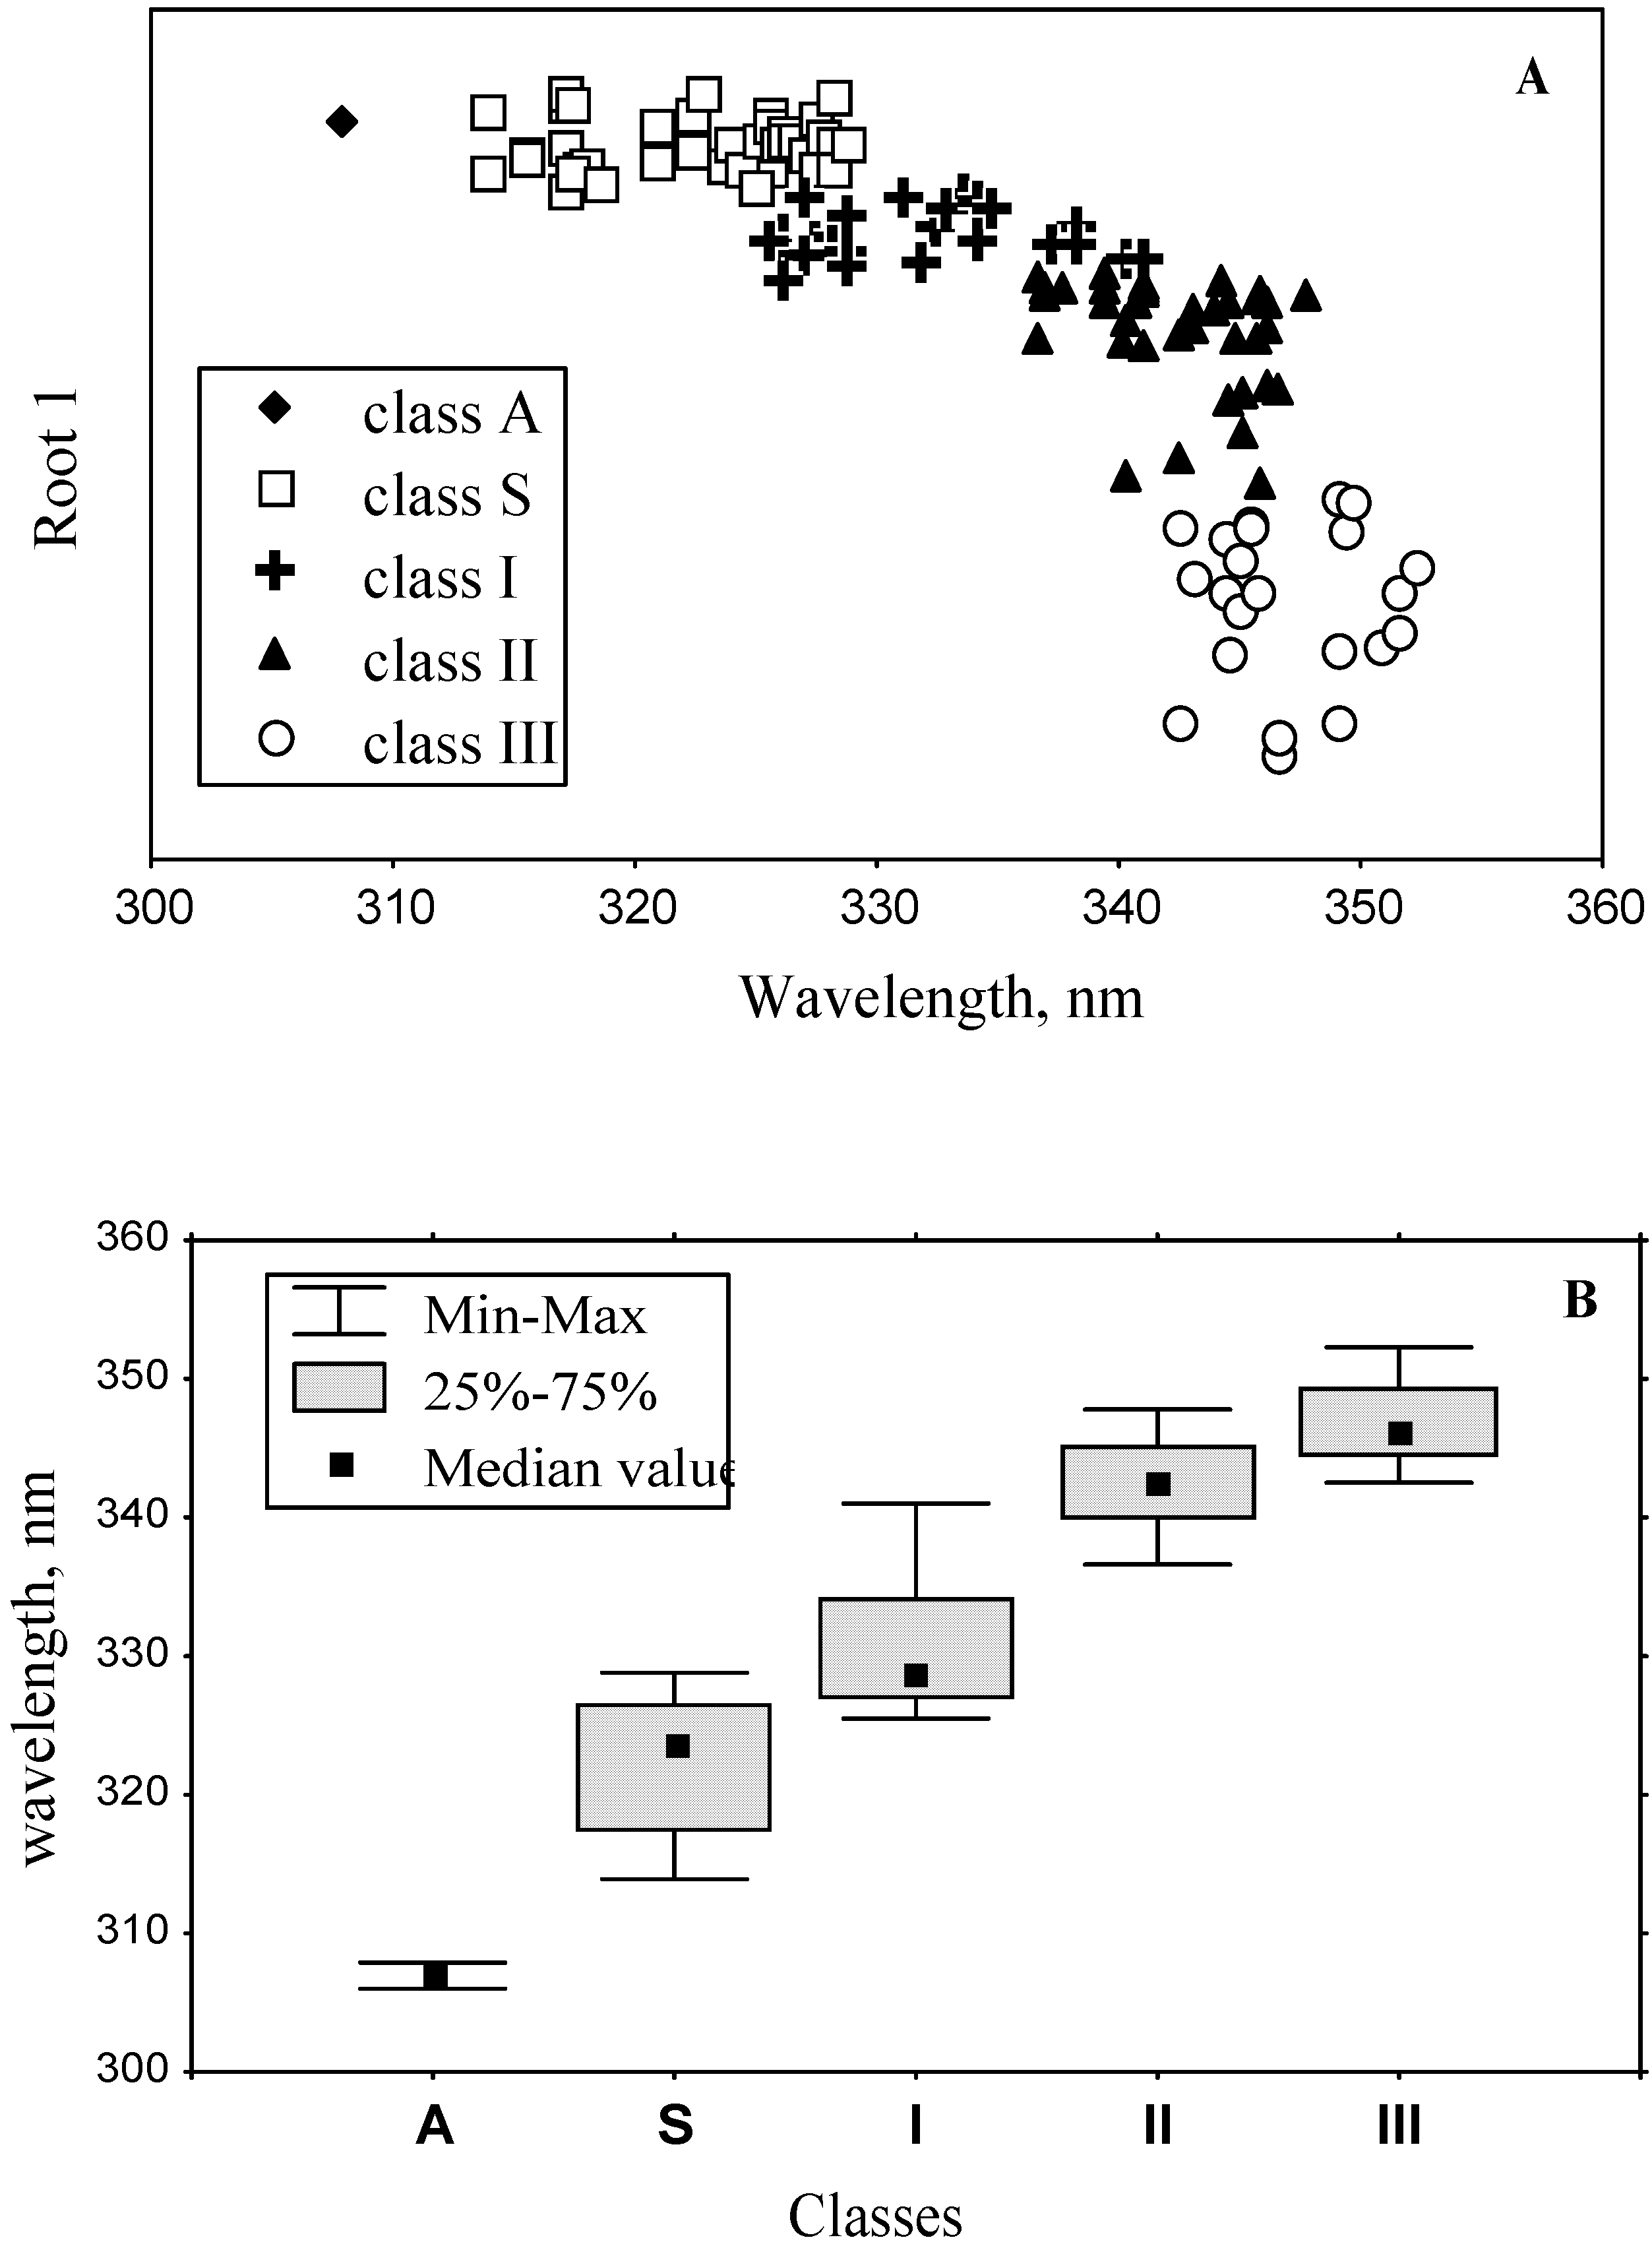
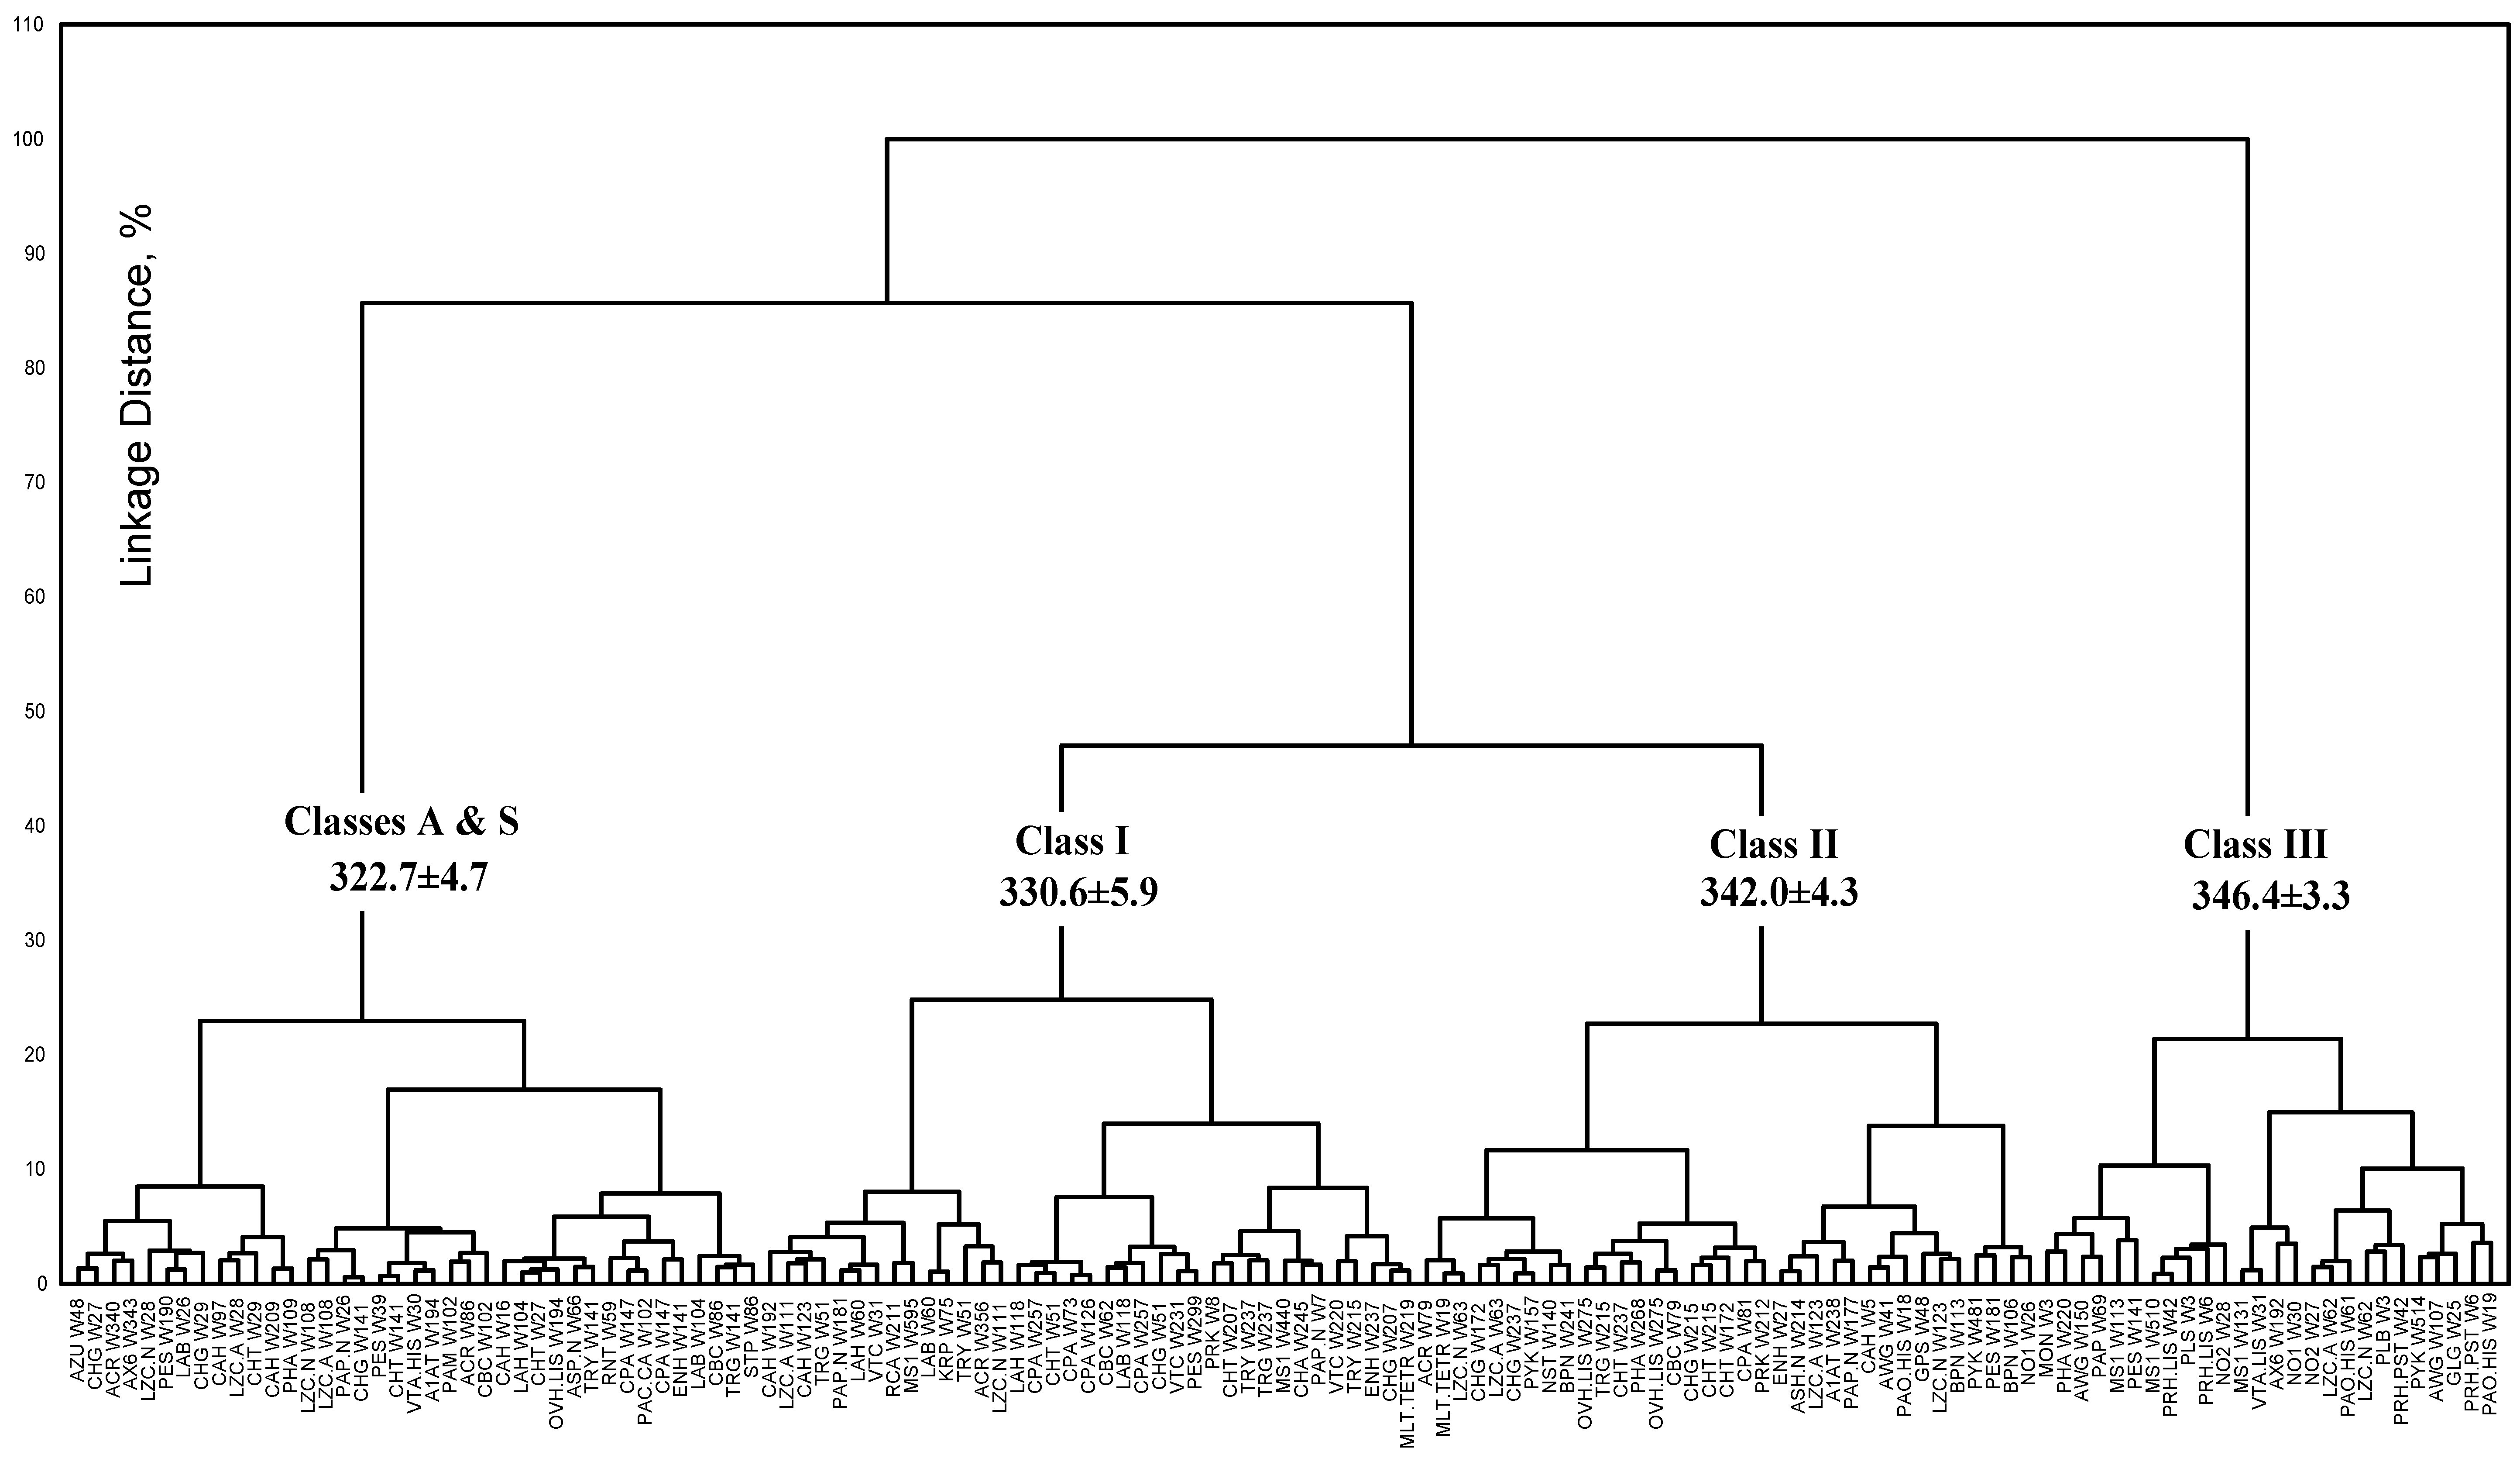
3.2. Classification of tryptophan residues

Both unsupervised and supervised classification methods were implemented for the analysis of the set of structural parameters of the microenvironment of tryptophan residues in proteins [53]. The analysis of the frequency of occurrence of maximum positions of spectral components obtained by the decomposition of tryptophan fluorescence spectra of more than 160 proteins revealed the existence of five discrete spectral classes of emitting tryptophan residues (Table 1, first row) [46]. The spectral classes represent the most probable positions of emission of tryptophan fluorophores in proteins. An unsupervised approach of hierarchical clustering was applied to the set of structural parameters. The clusters derived from the classification of tryptophan residues in general correlate well with the spectral classes. However, the model was based on the equal contributions (equal weights) of all structural parameters. To reveal the unique role (weight) of each structural parameter in the discrimination of tryptophan residues among classes, and to develop a model for assigning new tryptophan residues to spectral-structural classes based on the set of structural parameters, stepwise canonical discriminant analysis, a supervised learning algorithm, was applied. It tests the differences between the means of classes (in other words discriminates objects among classes) and evaluates all variables (structural parameters) to find those that significantly contribute to the discrimination. A total variance-covariance matrix as well as a pooled-within-group variance-covariance matrix were computed for the investigated structural parameters and compared via multivariate F tests. As a result, a reduced set of six parameters (see Table 1) were revealed to be statistically significant and correlative to the spectral classes.
For the assignment of tryptophan residues to spectral components two canonical variables (canonical coordinates or in other words, discriminant functions, or Roots) were revealed, which provide the best discrimination between classes. These canonical coordinates are linear combinations of six structural parameters with different weights. The assignment of tryptophan residue to classes was performed in phase-space of canonical coordinates by using the Mahalanobis distance metric. The output of the discriminant analysis includes calculation of i) classification scores and ii) probabilities of class assignment for each tryptophan residue [53,76]. Figure 6 is an illustration of the discrimination of 137 tryptophan residues from 48 proteins into five classes, projected onto two canonical coordinates (Root 3 vs. Root 1) (figure is taken from [53]).
Table 1. The five spectral and structural classes.
Spectral and structural parameters *Class AClass SClass IClass IIClass III
The wavelengths of the most probable spectral positions (nm) revealed from an analysis of the fluorescence spectra of 160 proteins308321–325330–333341–344346–350
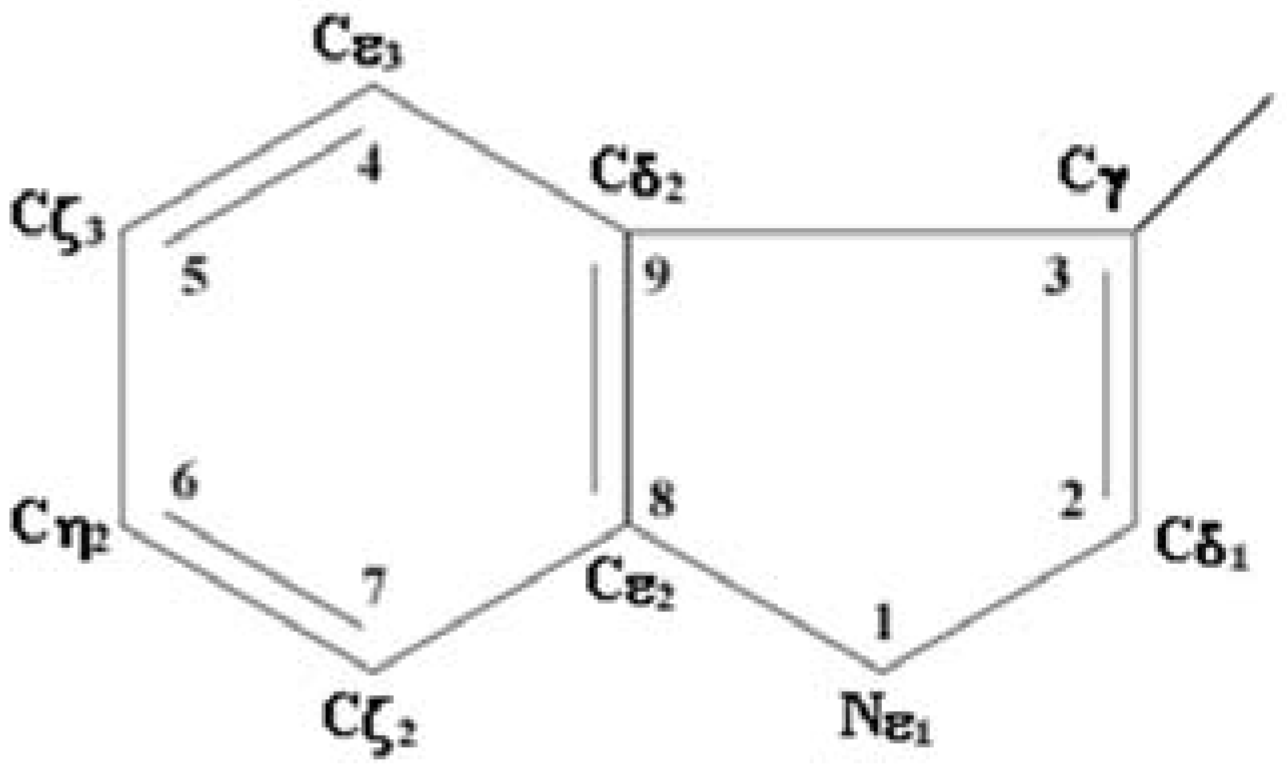
Acc (averaged value of the relative solvent accessibility of the nine atoms of indole ring of the tryptophan fluorophore.)1.90.8 ± 1.46.0 ± 3.614.8 ± 7.555.3 ± 15.9
Acc1-7 (averaged value of the relative solvent accessibility of 1 and 7 atoms of the tryptophan fluorophore)0.01.0 ± 2.211.2 ± 8.526.7 ± 19.171.1 ± 19.5
Den (packing density: the number of neighbor atoms at a distance < 7.5 Å from the indole ring)138.3148.3 ± 8.5129.3 ± 9.1109.3 ± 12.662.7 ± 18.8
A (relative polarity of environment: portion of the atoms of the polar groups amongst all the atoms around the tryptophan residue at a distance <7.5 Å)23.534.5 ± 5.839.3 ± 5.545.1 ± 7.465.5 ± 13.9
B (B-factor: crystallographic B-factors of the atoms of the polar groups normalized to the mean B-factor value of all the Cα atoms in the crystal structure)0.610.89 ± 0.171.11 ± 0.201.23 ± 0.321.54 ± 0.55
R (“Dynamic accessibility” [R = Acc.B], a dynamic characteristic of the tryptophan microenvironment)0.90.7 ± 1.26.7 ± 4.018.2 ± 10.385.2 ± 30.9
* The detailed description of structural parameters calculations could be found in [46].
The training data set is a key element for successful classification and discrimination. The ability of discriminant functions to successfully classify future samples is very dependent on the use of an adequate training set. If future samples arrive that lie outside of the canonical space spanned by the training set, very poor classification may result, since such samples contain structural parameter data unlike any seen when the discriminant function was derived. In many cases, it is very difficult or even impossible to construct a training set a priori, which is a significant limitation in the discriminant analysis method. The training dataset that was used for this work consisted of the structural parameters of tryptophan residues of proteins containing no more than four Trps, for which the assignment of tryptophan residues to spectral components was obvious and straightforward [53,76].
Figure 6. A) The discrimination of 137 tryptophan residues of 48 proteins presented in canonical coordinates (Root 3 vs. Root 1). B) The box plot style picture of the central tendency (median) and range (quartiles) of Root 1 in five classes. Figure is taken from the reference [53].
Algorithms 02 01155 g006

3.3. Accuracy of statistical analysis

The major goal of statistical approaches is to establish correlation between spectroscopic and structural parameters. Figure 7 [53] illustrates the correlation between values of Root 1, which is a combination of six microenvironment parameters, and maximum positions of spectral components. The plot shows that fluorophores belonging to various structural classes revealed by statistical methods, have different values of spectral properties. Figure 8 [53] is another representation of the correlative nature of spectral and structural parameters). Cluster analysis applied to the calculated canonical variates shows discrimination of tryptophan residues between four distinct classes (Class A consists of one object, and therefore could not be identified as an individual class by cluster analysis approach). Tryptophan residues belonging to the same class have similar spectral properties (the mean values of the position of maximum of tryptophan residues for each class are presented in the figure). To test the classification results obtained using the full set of fluorophores, discriminant analysis was applied to the tryptophan residues belonging to pairs of neighboring classes in turn. The obtained results confirmed the classifications obtained using the full set of tryptophan residues [53].
Figure 7. A) The dependence of canonical variate (Root 1), which was calculated based on the structural parameters of microenvironment of tryptophan residues, vs. spectral maximum positions of log-normal components assigned to individual protein fluorophores. B) The box plot style picture of the central tendency (median) and range (quartiles) of spectral maximum positions in five structure-based classes. Figure is taken from reference [53].
Algorithms 02 01155 g007
Figure 8. The hierarchical tree (dendrogram) constructed based on the canonical variate (Root 1). Figure is taken from the reference [53].
Algorithms 02 01155 g008

3.4. Model of discrete classes of tryptophan residues in proteins

Canonical discriminant analysis was applied to establish correlation between spectral and structural classes of tryptophan residues. The resulting model suggests the existence of discrete spectral-structural classes of emitting tryptophan fluorophores in proteins, which assumes that various processes might occur in the excited state of the tryptophan fluorophores belonging to five different classes, and as a result different spectral responses can be observed [53,76]:
Class A (λm = 308 nm, structured spectra) - these fluorophores do not form hydrogen-bound complexes in the excited state (no exciplexes) with the solvent or neighboring protein groups; they are deeply buried into the protein matrix and are located in non-polar (mainly carbon atoms), non-flexible protein environments. The tryptophan residues of class A are separated from other classes mainly by parameters polarity and flexibility of microenvironment.
Class S (λm = 316 nm, structured spectra) includes buried tryptophan residues that can form the exciplexes with 1:1 stoichiometry. The major difference between fluorophores of classes A and S is that the latter one has higher relative polarity and flexibility of the microenvironment.
Class I (λm = 330 – 332 nm, Δλ = 48 – 50 nm) represents the buried fluorophores that can form the exciplexes with 2:1 stoichiometry. The fluorophores of this class have much lower packing density, which could lead to a greater mobility of the environment in contrast to Trps of class S.
Class II (λm = 340 – 342 nm, Δλ = 53 – 55 nm) the main feature of the fluorophores of this class is their contact with the structured water molecules. The discrimination between classes I and II are mostly defined by the parameters of packing density, total solvent accessibility, and “dynamic accessibility”.
Class III (λm = 350 – 353 nm, Δλ = 59 – 61 nm) contains fully exposed fluorophores surrounded by the highly mobile free water molecules, the time of dipole relaxation is in the femto-, pico- second range. This makes their spectra almost coinciding with those of free tryptophan residues in water.

4. Examples of Application of Spectral and Structural Algorithms for the Study of Protein Structure, Conformation and Dynamics

Classification of spectral and structural parameters of tryptophan residues in proteins within five discrete classes (presented above) are already accepted and widely used [78,79,80,81,82,83,84,85,86]. Here we would like to provide several examples of the application of our algorithms in the study of protein structure and dynamics.
Spectral and structural analysis was applied to investigate conformational changes of 20S proteasome of rat natural killer cells induced by mono and divalent cations [87]. It was found that the emission of Trp13 (one of 19 tryptophan residues in protein) from α6 subunit located near the cluster of highly conserved proteasome residues is mostly sensitive to the activation of the enzyme. It was concluded that the expression of maximal chymotrypsin-like activity of 20S proteasome is associated with the conformational changes that occur in this cluster, and that leads to the proteasome open conformation, allowing substrate access into the proteolytic chamber.
Analysis of fluorescence spectra of isoforms of recombinant rat nucleoside diphosphate kinase (NDPK), which catalyze the transfer of γ-phosphate from nucleoside triphosphates to nucleoside diphosphates, revealed an unusual fluorescence (extremely high quantum yield) in NDPK alpha. This fluorescence was associated with tyrosinate formation in the active center of the alpha enzyme crucial for the activity of the protein [88]. Spectral and structural analysis were used to probe interactions of peptides and proteins with the lipid bilayer of membrane [51,52,89,90,52,89].

5. Web-based tool PFAST: Protein Fluorescence And Structural Toolkit

The SIMS and PHREQ spectral decomposition methods, and algorithms for calculating structural parameters of the local tryptophan environment in proteins, which are then used for Trp classification; have been integrated into a web-based toolkit PFAST: Protein Fluorescence and Structural Toolkit (http://pfast.phys.uri.edu/) [76]. PFAST contains three modules: 1) FCAT is a fluorescence-correlation analysis tool, which decomposes protein fluorescence spectra to reveal the spectral components of individual tryptophan residues or groups of tryptophan residues located close to each other, and assigns spectral components to one of five spectral-structural classes. 2) SCAT is a structural-correlation analysis tool for the calculation of the structural parameters of the environment of tryptophan residues from the atomic structures of the proteins from the PDB, and for the assignment of tryptophan residues to one of five spectral-structural classes. 3) The last module is a PFAST database that contains protein fluorescence and structural data obtained from results of the FCAT and SCAT analyses.

6. Future Direction

The successful application of tryptophan fluorescence spectroscopy in studies of protein structure depends on our ability to extract as much structural information as possible from the spectral data. Therefore, it is important to explore and expand the list of structural parameters which might correlate with various spectral properties, including lifetime of fluorescence and anisotropy. The other significant improvement in correlation of the spectral properties with the structural parameters might come as a result of implementation of modern machine learning approaches, which are well suited for systems with high levels of noise.

References

  1. Teale, F.W. The ultraviolet fluorescence of proteins in neutral solution. Biochem. J. 1960, 76, 381–388. [Google Scholar] [PubMed]
  2. Weber, G. Fluorescence-polarization spectrum and electronic-energy transfer in tyrosine, tryptophan and related compounds. Biochem. J. 1960, 75, 335–345. [Google Scholar] [PubMed]
  3. Konev, S.V. Fluorescence and Phosphorescence of Proteins and Nucleic Acids; Plenum Press: New York, NY, USA, 1967. [Google Scholar]
  4. Longworth, J.W. Excited States of Proteins and Nucleic Acids; Pergamon Press: New York, NY, USA, 1971. [Google Scholar]
  5. Burstein, E.A. Luminescence of protein chromophores (model studies). In Advances in Science and Technology, Ser. Biophysics; VINITI: Moscow, Russia, 1976; Vol. 6. (in Russian) [Google Scholar]
  6. Burstein, E.A. Intrinsic protein luminescence. the nature and application. In Advances in Science and Technology, Ser. Biophysics; VINITI: Moscow, Russia, 1977; Vol. 7. (in Russian) [Google Scholar]
  7. Lakowicz, J.R. Principles of Fluorescence Spectroscopy; Plenum Press: New York, NY, USA, 1983. [Google Scholar]
  8. Lakowicz, J.R. Principles of Fluorescence Spectroscopy, 2nd Ed. ed; Kluwer Academic/Plenum: New York, NY, USA, 1999. [Google Scholar]
  9. Lakowicz, J.R. Principles of Fluorescence Spectroscopy, 3rd Ed. ed; Springer: New York, NY, USA, 2006. [Google Scholar]
  10. Demchenko, A.P. Ultraviolet Spectroscopy of Proteins.; Springer: Berlin, Germany, 1986. [Google Scholar]
  11. Callis, P.R. 1La and 1Lb transitions of tryptophan: applications of theory and experimental observations to fluorescence of proteins. Methods Enzymol. 1997, 278, 113–150. [Google Scholar] [PubMed]
  12. Vivian, J.T.; Callis, P.R. Mechanisms of tryptophan fluorescence shifts in proteins. Biophys. J. 2001, 80, 2093–2109. [Google Scholar] [CrossRef]
  13. Muiño, P.L.; Callis, P.R. Hybrid simulations of solvation effects on electronic spectra: indoles in water. J. Chem. Phys. 1994, 100, 4093–4109. [Google Scholar] [CrossRef]
  14. Pierce, D.W.; Boxer, S.G. Stark effect spectroscopy of tryptophan. Biophys. J. 1995, 68, 1583–1591. [Google Scholar] [CrossRef]
  15. Toptygin, D. Effects of the solvent refractive index and its dispersion on the radiative decay rate and extinction coefficient of a fluorescent solute. J. Fluoresc. 2003, 13, 201–219. [Google Scholar] [CrossRef]
  16. Tikhonov, A. On the solution of ill-posed problems and the method of regularization. Dokl. Akad. Nauk SSSR (in Russian) 1963, 151, 501–504. [Google Scholar]
  17. Tikhonov, A. Ill-Posed Problems in the Natural Sciences; GBV: Moscow, Russia, 1987; Vol. 344. [Google Scholar]
  18. Craig, I.; Brown, J. Inverse Problems in Astronomy; Adam Hilger Ltd.: Bristol, UK, 1986. [Google Scholar]
  19. Henn, S.; Witsch, K. A multigrid approach for minimizing a nonlinear functional for digital image matching. Computing 2000, 64, 339–348. [Google Scholar] [CrossRef]
  20. Wentzell, P.D.; Nair, S.S.; Guy, R.D. Three-way analysis of fluorescence spectra of polycyclic aromatic hydrocarbons with quenching by nitromethane. Anal. Chem. 2001, 73, 1408–1415. [Google Scholar] [CrossRef] [PubMed]
  21. Hansen, P. Regularization, GSVD and truncated GSVD. BIT 1989, 29, 491–504. [Google Scholar] [CrossRef]
  22. Hansen, P. Truncated singular value decomposition solutions to discrete ill-posed problems with ill-determined numerical rank. SIAM J. Sci. Stat. Comput. 1990, 11, 503–518. [Google Scholar] [CrossRef]
  23. Wahl, P.; Auchet, J.C. Resolutions of fluorescence spectra using the decay measurements. application to the study of human serum albumin. Biochim. Biophys. Acta 1972, 285, 99–117. [Google Scholar] [CrossRef]
  24. Brochon, J.C.; Wahl, P.; Charlier, M.; Maurizot, J.C.; Helene, C. Time resolved spectroscopy of the tryptophyl fluorescence of the E.coli LAC repressor. Biochem. Biophys. Res. Commun. 1977, 79, 1261–1271. [Google Scholar] [CrossRef]
  25. Knutson, J.R.; Walbridge, D.G.; Brand, L. Decay-associated fluorescence spectra and the heterogeneous emission of alcohol dehydrogenase. Biochemistry 1982, 21, 4671–4679. [Google Scholar] [CrossRef] [PubMed]
  26. Lakowicz, J.R.; Cherek, H. Phase-sensitive fluorescence spectroscopy: a new method to resolve fluorescence lifetimes or emission spectra of components in a mixture of fluorophores. J. Biochem. Biophys. Methods 1981, 5, 19–35. [Google Scholar] [CrossRef]
  27. Lakowicz, J.R.; Cherek, H. Resolution of heterogeneous fluorescence from proteins and aromatic amino acids by phase-sensitive detection of fluorescence. J. Biol. Chem. 1981, 256, 6348–6353. [Google Scholar] [PubMed]
  28. Wasylewski, Z.; Eftink, M.R. Frequency-domain fluorescence studies of an extracellular metalloproteinase of staphylococcus aureus. Biochim. Biophys. Acta 1987, 915, 331–341. [Google Scholar] [CrossRef]
  29. Stryjewski, W.; Wasylewski, Z. The resolution of heterogeneous fluorescence of multitryptophan-containing proteins studied by a fluorescence-quenching method. Eur. J. Biochem. 1986, 158, 547–553. [Google Scholar] [CrossRef] [PubMed]
  30. Wasylewski, Z.; Kaszycki, P.; Guz, A.; Stryjewski, W. Fluorescence-quenching-resolved spectra of fluorophores in mixtures and micellar solutions. Eur. J. Biochem. 1988, 178, 471–476. [Google Scholar] [CrossRef] [PubMed]
  31. Koloczek, H.; Wasniowska, A.; Potempa, J.; Wasylewski, Z. The fluorescence quenching resolved spectra and red-edge excitation fluorescence measurements of human alpha1-proteinase inhibitor. Biochim. Biophys. Acta 1991, 1973, 619–625. [Google Scholar] [CrossRef]
  32. Burstein, E.A. An improved algorithm of resolution of fluorescence spectra into quencher accessibility-associated components. Photochem. Photobiol. 1996, 63, 278–280. [Google Scholar] [CrossRef]
  33. Lehrer, S.S. The selective quenching of tryptophan fluorescence in proteins by iodide ion: lysozyme in the presence and absence of substrate. Biochem. Biophys. Res. Commun. 1967, 29, 767–772. [Google Scholar] [CrossRef]
  34. Lehrer, S.S. Solute perturbation of protein fluorescence. the quenching of the tryptophyl fluorescence of model compounds and of lysozyme by iodide ion. Biochemistry 1971, 10, 3254–3263. [Google Scholar] [CrossRef] [PubMed]
  35. Lehrer, S.S.; Leavis, P.C. Solute quenching of protein fluorescence. Methods Enzymol. 1978, 49, 222–236. [Google Scholar] [PubMed]
  36. Eftink, M.R.; Ghiron, C.A. Exposure of tryptophanyl residues and protein dynamics. Biochemistry 1977, 16, 5546–5551. [Google Scholar] [CrossRef] [PubMed]
  37. Eftink, M.R. Fluorescence techniques for studying protein structure. Methods Biochem. Anal. 1991, 35, 127–205. [Google Scholar] [PubMed]
  38. Siano, D.B.; Metzler, D.E. Band shapes of the electronic spectra of complex molecules. J. Chem. Phys. 1969, 51, 1856–1961. [Google Scholar] [CrossRef]
  39. Metzler, C.M.; Viswanath, R.; Metzler, D.E. Equilibria and absorption spectra of tryptophanase. J. Biol. Chem. 1991, 266, 9374–9381. [Google Scholar] [PubMed]
  40. Djikanovic, D.; Kalauzi, A.; Jeremic, M.; Micic, M.; Radotic, K. Deconvolution of fluorescence spectra: contribution to the structural analysis of complex molecules. Colloids Surf. B Biointerfaces 2007, 54, 188–192. [Google Scholar] [CrossRef] [PubMed]
  41. Kalauzi, A.; Mutavdzic, D.; Djikanovic, D.; Radotic, K.; Jeremic, M. Application of asymmetric model in analysis of fluorescence spectra of biologically important molecules. J. Fluoresc. 2007, 17, 319–329. [Google Scholar] [CrossRef] [PubMed]
  42. Metzler, D.E.; Harris, C.; Yang, I.Y.; Siano, D.; Thomson, J.A. Band-shape analysis and display of fine structure in protein spectra: a new approach to perturbation spectroscopy. Biochem. Biophys. Res. Commun. 1972, 46, 1588–1597. [Google Scholar] [CrossRef]
  43. Metzler, C.M.; Cahill, A.E.; Petty, S.; Metzler, D.E.; Lang, L. The widespread applicability of log-normal curves for the description of absorption spectra. Appl. Spectrosc. 1985, 39, 333–339. [Google Scholar] [CrossRef]
  44. Burstein, E.A.; Emelyanenko, V.I. Log-normal description of fluorescence spectra of organic fluorophores. Photochem. Photobiol. 1996, 64, 316–320. [Google Scholar] [CrossRef]
  45. Burstein, E.A.; Abornev, S.M.; Reshetnyak, Y.K. Decomposition of protein tryptophan fluorescence spectra into log-normal components. I. Decomposition algorithms. Biophys. J. 2001, 81, 1699–1709. [Google Scholar] [CrossRef]
  46. Reshetnyak, Y.K.; Burstein, E.A. Decomposition of protein tryptophan fluorescence spectra into log-normal components. II. The statistical proof of discreteness of tryptophan classes in proteins. Biophys. J. 2001, 81, 1710–1734. [Google Scholar] [CrossRef]
  47. Emelyanenko, V.I.; Reshetnyak, Y.K.; Andreev, O.A.; Burstein, E.A. Log-normal component analysis of fluorescence spectra of prodan and acrylodan bound to proteins. Biophysics 2000, 45, 207–219. [Google Scholar]
  48. Antipova-Korotaeva, I.I.; Kazanova, N.N. Mathematical decomposition of composite spectral contours into components with partially known parameters. J. Appl. Spectrosc. 1971, 14, 1093–1096. [Google Scholar]
  49. Aksenenko, V.M.; Shumskaya, T.N.; Slapochnikova, V.A.; Shein, N.V. Quantitative analysis of multicomponent systems based on the mathematical treatment of vibrational spectra. J. Appl. Spectrosc. 1989, 51, 306–311. [Google Scholar] [CrossRef]
  50. Tikhonov, A.N.; Arsenin, V.Y. Solution of Ill-posed Problems; Winston: New York, NY, USA, 1977. [Google Scholar]
  51. Linke, D.; Frank, J.; Pope, M.S.; Soll, J.; Ilkavets, I.; Fromme, P.; Burstein, E.A.; Reshetnyak, Y.K.; Emelyanenko, V.I. Folding kinetics and structure of OEP16. Biophys. J. 2004, 86, 1479–1487. [Google Scholar] [CrossRef]
  52. Torrent, M.; Cuyás, E.; Carreras, E.; Navarro, S.; López, O.; de la Maza, A.; Nogués, M.V.; Reshetnyak, Y.K.; Boix, E. Topology studies on the membrane interaction mechanism of the eosinopjil cationic protein. Biochemistry 2007, 46, 720–733. [Google Scholar] [CrossRef] [PubMed]
  53. Reshetnyak, Y.K.; Koshevnik, Y.; Burstein, E.A. Decomposition of protein tryptophan fluorescence spectra into log-normal components. III. Correlation between fluorescence and microenvironment parameters of individual tryptophan residues. Biophys. J. 2001, 81, 1735–1758. [Google Scholar] [CrossRef]
  54. Pelley, R.; Horowitz, P. Fluorimetric studies of tryptophyl exposure in Concanavalin A. Biochim. Biophys. Acta 1976, 427, 359–363. [Google Scholar] [CrossRef]
  55. Brown, M.F.; Omar, S.; Raubach, R.A.; Schleich, T. Quenching of the tyrosyl and tryptophyl fluorescence of subtilisins carlsberg and novo by iodide. Biochemistry 1977, 16, 987–992. [Google Scholar] [CrossRef] [PubMed]
  56. Rousslang, K.W.; Thomasson, J.M.; Rose, J.B.; Kwiram, A.L. Triplet state of tryptophan in proteins. 2. Differentiation between tryptophan residues 62 and 108 in lysozyme. Biochemistry 1979, 18, 2296–2300. [Google Scholar] [CrossRef] [PubMed]
  57. Turoverov, K.K.; Kuznetsova, I.M. Polarization of intrinsic fluorescence of proteins. iv. changes in the degree of polarization from the emission spectra. Mol. Biol. (Moscow) 1985, 19, 1321–1331. [Google Scholar]
  58. Turoverov, K.K.; Kuznetsova, I.M.; Zaitsev, V.N. The environment of the tryptophan residue in pseudomonas aeruginosa azurin and its fluorescence properties. Biophys. Chem. 1985, 23, 79–89. [Google Scholar] [CrossRef]
  59. Dolashka, P.; Dimov, I.; Genov, N.; Svendsen, I.; Wilson, K.S.; Betzel, C. Fluorescence properties of native and photooxidised proteinase k: the x-ray model in the region of the two tryptophans. Biochim. Biophys. Acta 1992, 1118, 303–312. [Google Scholar] [CrossRef]
  60. Dolashka, P.; Filippi, B.; Wilson, K.S.; Betzel, C.; Genov, N. Spectroscopic studies on proteinase K and subtilisin DY. relation to X-ray models. Int. J. Pept. Protein Res. 1992, 40, 465–471. [Google Scholar] [CrossRef] [PubMed]
  61. Kuznetsova, I.M.; Yakusheva, T.A.; Turoverov, K.K. Contribution of separate tryptophan residues to intrinsic fluorescence of actin. analysis of 3D structure. FEBS Lett. 1999, 452, 205–210. [Google Scholar] [CrossRef]
  62. Alston, R.W.; Urbanikova, L.; Sevcik, J.; Lasagna, M.; Reinhart, G.D.; Scholtz, J.M.; Pace, C.N. Contribution of single tryptophan residues to the fluorescence and stability of Ribonuclease A. Biophys. J. 2004, 87, 4036–4047. [Google Scholar] [CrossRef] [PubMed]
  63. Kosinski-Collins, M.S.; Flaugh, S.L.; King, J. Probing folding and fluorescence quenching in human gamma D crystallin greek key domains using triple tryptophan mutant proteins. Protein Sci. 2004, 13, 2223–2235. [Google Scholar] [CrossRef] [PubMed]
  64. Bedell, J.L.; Edmondson, S.P.; Shriver, J.W. Role of a surface tryptophan in defining the structure, stability, and DNA binding of the hyperthermophile protein sac7d. Biochemistry 2005, 44, 915–925. [Google Scholar] [CrossRef] [PubMed]
  65. Duy, C.; Fitter, J. How aggregation and conformational scrambling of unfolded states govern fluorescence emission spectra. Biophys. J. 2006, 90, 3704–3711. [Google Scholar] [CrossRef] [PubMed]
  66. Legardinier, S.; Raguénès-Nicol, C.; Tascon, C.; Rocher, C.; Hardy, S.; Hubert, J.F.; Le Rumeur, E. Mapping of the lipid-binding and stability properties of the central rod domain of human dystrophin. J. Mol. Biol. 2009, 389, 546–558. [Google Scholar] [CrossRef] [PubMed] [Green Version]
  67. Gray, P.M.; Kemp, G.J.; Rawlings, C.J.; Brown, N.P.; Sander, C.; Thornton, J.M.; Orengo, C.M.; Wodak, S.J.; Richelle, J. Macromolecular structure information and databases. The EU BRIDGE database project consortium. Trends Biochem. Sci. 1996, 21, 251–256. [Google Scholar] [PubMed]
  68. Hogue, C.W.; Ohkawa, H.; Bryant, S.H. A dynamic look at structures: www-entrez and the molecular modeling database. Trends Biochem. Sci. 1996, 21, 226–229. [Google Scholar] [CrossRef]
  69. Islamov, A.S.; Rumjantsev, A.B.; Skvortsov, V.S.; Archakov, A.I. ONIX: an interactive PC program for the examination of protein 3D structures from PDB. Comput. Appl. Biosci. 1997, 13, 111–113. [Google Scholar]
  70. Laskowski, R.A.; Hutchinson, E.G.; Michie, A.D.; Wallace, A.C.; Jones, M.L.; Thornton, J.M. PDBsum: a web-based database of summaries and analyses of all PDB structures. Trends Biochem. Sci. 1997, 22, 488–490. [Google Scholar] [CrossRef]
  71. Michalickova, K.; Bader, G.D.; Dumontier, M.; Lieu, H.; Betel, D.; Isserlin, R.; Hogue, C.W. SeqHound: biological sequence and structure database as a platform for bioinformatics research. BMC Bioinformatics 2002, 3, 32. [Google Scholar] [CrossRef] [PubMed]
  72. Hollup, S.M.; Salensminde, G.; Reuter, N. WEBnm@: a wweb application for normal mode analyses of proteins. BMC Bioinformatics 2005, 6, 52. [Google Scholar] [CrossRef] [PubMed]
  73. Faraggi, E.; Xue, B.; Zhou, Y. Improving the prediction accuracy of residue solvent accessibility and real-value backbone torsion angles of proteins by guided-learning through a two-layer neural network. Proteins 2009, 74, 847–856. [Google Scholar] [CrossRef] [PubMed]
  74. McDonald, I.K.; Thornton, J.M. Satisfying hydrogen bonding potential in proteins. J. Mol. Biol. 1994, 238, 777–793. [Google Scholar] [CrossRef] [PubMed]
  75. Lee, G.; Rodriguez, C.; Madabhushni, A. Investigating the efficacy of nonlinear dimensionality reduction schemes in classifying gene and protein expression studies. IEEE/ACM Trans. Comput. Biol. Bioinformatics 2008, 5, 368–384. [Google Scholar] [CrossRef] [PubMed]
  76. Shen, C.; Menon, R.; Das, D.; Bansal, N.; Nahar, N.; Guduru, N.; Jaegle, S.; Peckham, J.; Reshetnyak, Y.K. The protein fluorescence and structural toolkit (PFAST): database and programs for the analysis of protein fluorescence and structural data. Protein: Struct. Funct. Bioinformatics 2008, 71, 1744–1754. [Google Scholar] [CrossRef] [PubMed]
  77. Orlov, N.Y.; Orlova, T.G.; Reshetnyak, Y.K.; Burstein, E.A.; Kimura, N. Comparative study of recombinant rat nucleoside diphosphate kinases alpha and beta by intrinsic protein fluorescence. J. Biomol. Struct. Dyn. 1999, 16, 955–968. [Google Scholar] [CrossRef] [PubMed]
  78. Gensch, T.; Hendriks, J.; Hellingwerf, K.J. Tryptophan fluorescence monitors structural changes accompanying signalling state formation in the photocycle of photoactive yellow protein. Photochem. Photobiol. Sci. 2004, 6, 531–536. [Google Scholar] [CrossRef] [PubMed]
  79. Churbanova, I.Y.; Tronin, A.; Strzalka, J.; Gog, T.; Kuzmenko, I.; Johansson, J.S.; Blasie, J.K. Monolayers of a model anesthetic-binding membrane protein: formation, characterization, and halothane-binding affinity. Biophys. J. 2006, 90, 3255–3266. [Google Scholar] [CrossRef] [PubMed]
  80. Toh, K.C.; van Stokkum, I.H.; Hendriks, J.; Alexandre, M.T.; Arents, J.C.; Perez, M.A.; van Grondelle, R.; Hellingwerf, K.J.; Kennis, J.T. On the signaling mechanism and the absence of photoreversibility in the AppA BLUF domain. Biophys. J. 2008, 95, 312–321. [Google Scholar] [CrossRef] [PubMed]
  81. Zhang, A.; Liu, W.F.; Yan, Y.B. Role of the RRM domain in the activity, structure and stability of poly(A)-specific ribonuclease. Arch Biochem. Biophys. 2007, 461, 255–262. [Google Scholar] [CrossRef] [PubMed]
  82. Su, J.T.; Kim, S.H.; Yan, Y.B. Dissecting the pretransitional conformational changes in aminoacylase I thermal denaturation. Biophys. J. 2007, 92, 578–587. [Google Scholar] [CrossRef] [PubMed]
  83. Galka, J.J.; Baturin, S.J.; Manley, D.M.; Kehler, A.J.; O'Neil, J.D. Stability of the glycerol facilitator in detergent solutions. Biochemistry 2008, 47, 3513–3524. [Google Scholar] [CrossRef] [PubMed]
  84. Verheyden, S.; Sillen, A.; Gils, A.; Declerck, P.J.; Engelborghs, Y. Tryptophan properties in fluorescence and functional stability of plasminogen activator inhibitor 1. Biophys. J. 2003, 85, 501–510. [Google Scholar] [CrossRef]
  85. Runke, G.; Maier, E.; Summers, W.A.; Bay, D.C.; Benz, R.; Court, D.A. Deletion variants of Neurospora mitochondrial porin: electrophysiological and spectroscopic analysis. Biophys. J. 2006, 90, 3155–3164. [Google Scholar] [CrossRef] [PubMed]
  86. Maglia, G.; Jonckheer, A.; De Maeyer, M.; Frère, J.M.; Engelborghs, Y. An unusual red-edge excitation and time-dependent Stokes shift in the single tryptophan mutant protein DD-carboxypeptidase from Streptomyces: the role of dynamics and tryptophan rotamers. Protein Sci. 2008, 17, 352–361. [Google Scholar] [CrossRef] [PubMed]
  87. Reshetnyak, Y.K.; Kitson, R.P.; Lu, M.; Goldfarb, R.H. Conformational and enzymatic changes of 20S proteasome of rat natural killer cells induced by mono and divalent cations. J. Struct. Biol. 2004, 145, 263–271. [Google Scholar] [CrossRef] [PubMed]
  88. Orlov, N.Y.; Orlova, T.G.; Reshetnyak, Y.K.; Burstein, E.A.; Kimura, N. Comparative study of recombinant rat nucleoside diphosphate kinases alpha and beta by intrinsic protein fluorescence. J. Biomol. Struct. Dyn. 1999, 16, 955–968. [Google Scholar] [CrossRef] [PubMed]
  89. Reshetnyak, Y.K.; Tchedre, K.T.; Nair, M.P.; Pritchard, P.H.; Lacko, A.G. Structural differences between wild-type and fish eye disease mutant of lecithin:cholesterol acyltransferase. J. Biomol. Struct. Dyn. 2006, 24, 75–82. [Google Scholar] [CrossRef] [PubMed]
  90. Reshetnyak, Y.K.; Segala, M.; Andreev, O.A.; Engelman, D.M. A monomeric membrane peptide that lives in Three Worlds: in solution, attached to and inserted across lipid bilayers. Biophys. J. 2007, 93, 2363–2672. [Google Scholar] [CrossRef] [PubMed]

