InfoVis Interaction Techniques in Animation of Recursive Programs

Abstract
:
1. Introduction
2. Visualization of Recursion
2.1. Visualizations of Recursion
2.2. Visualizations of Recursion in SRec
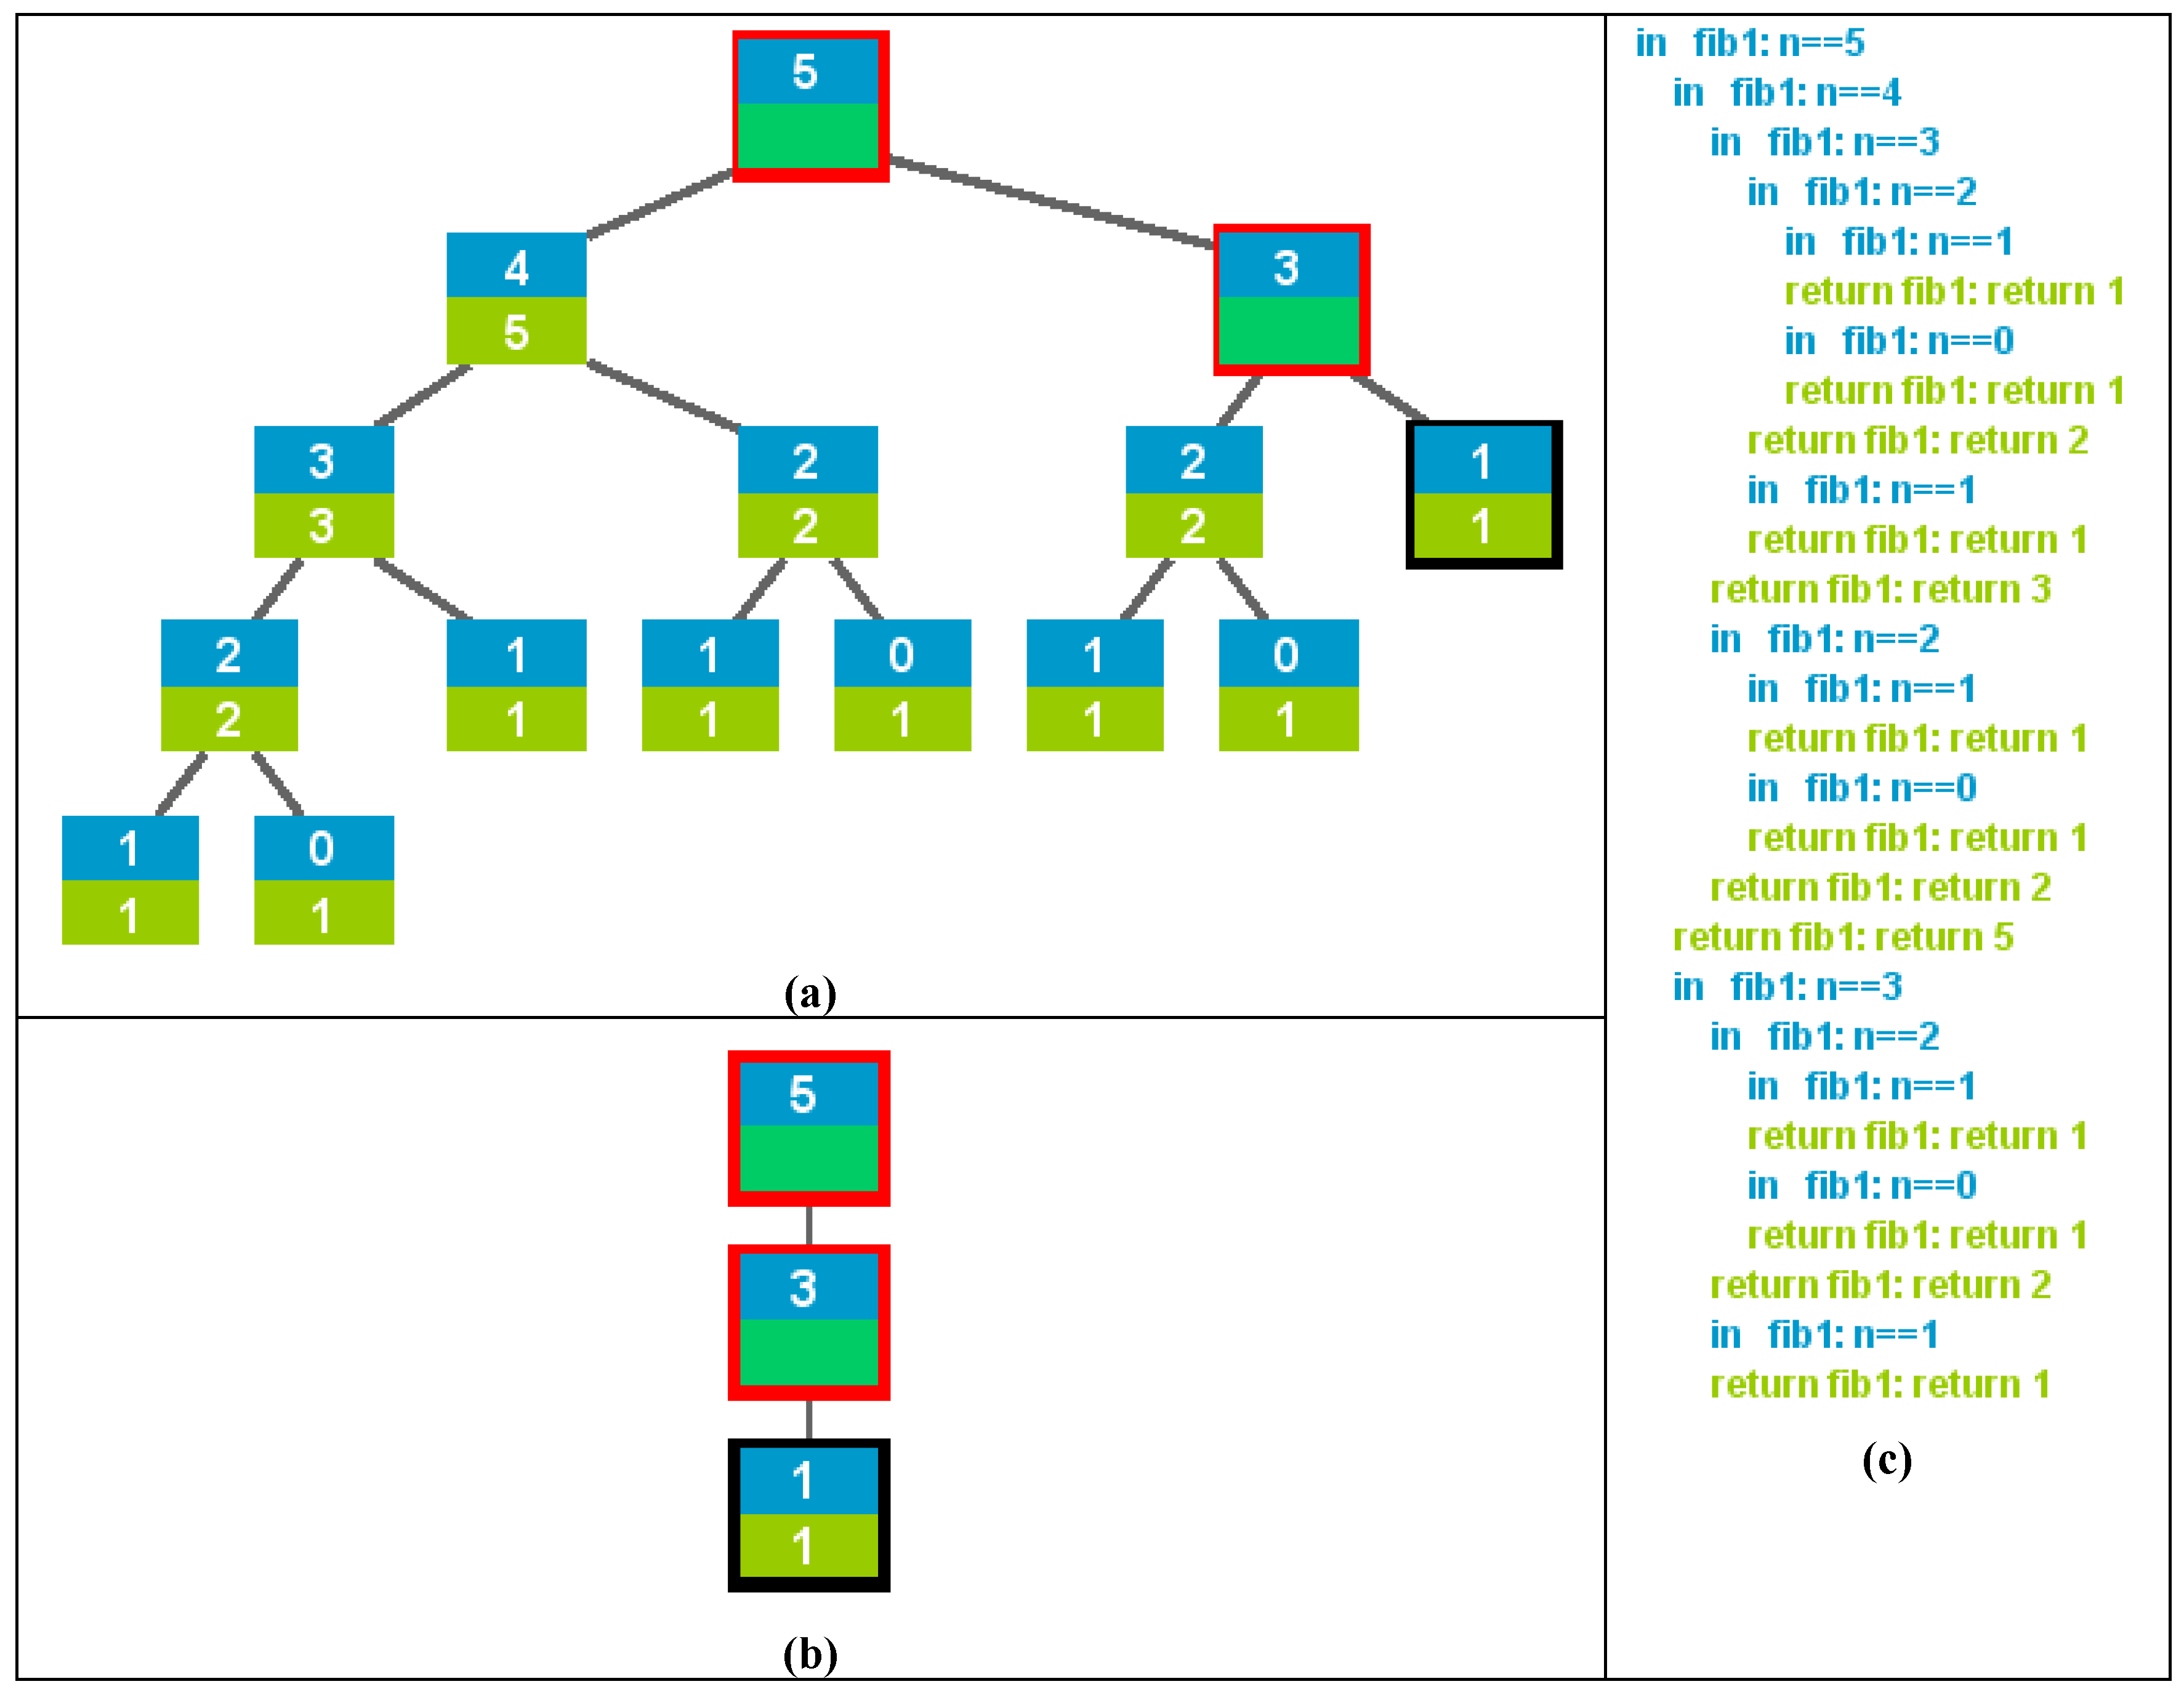
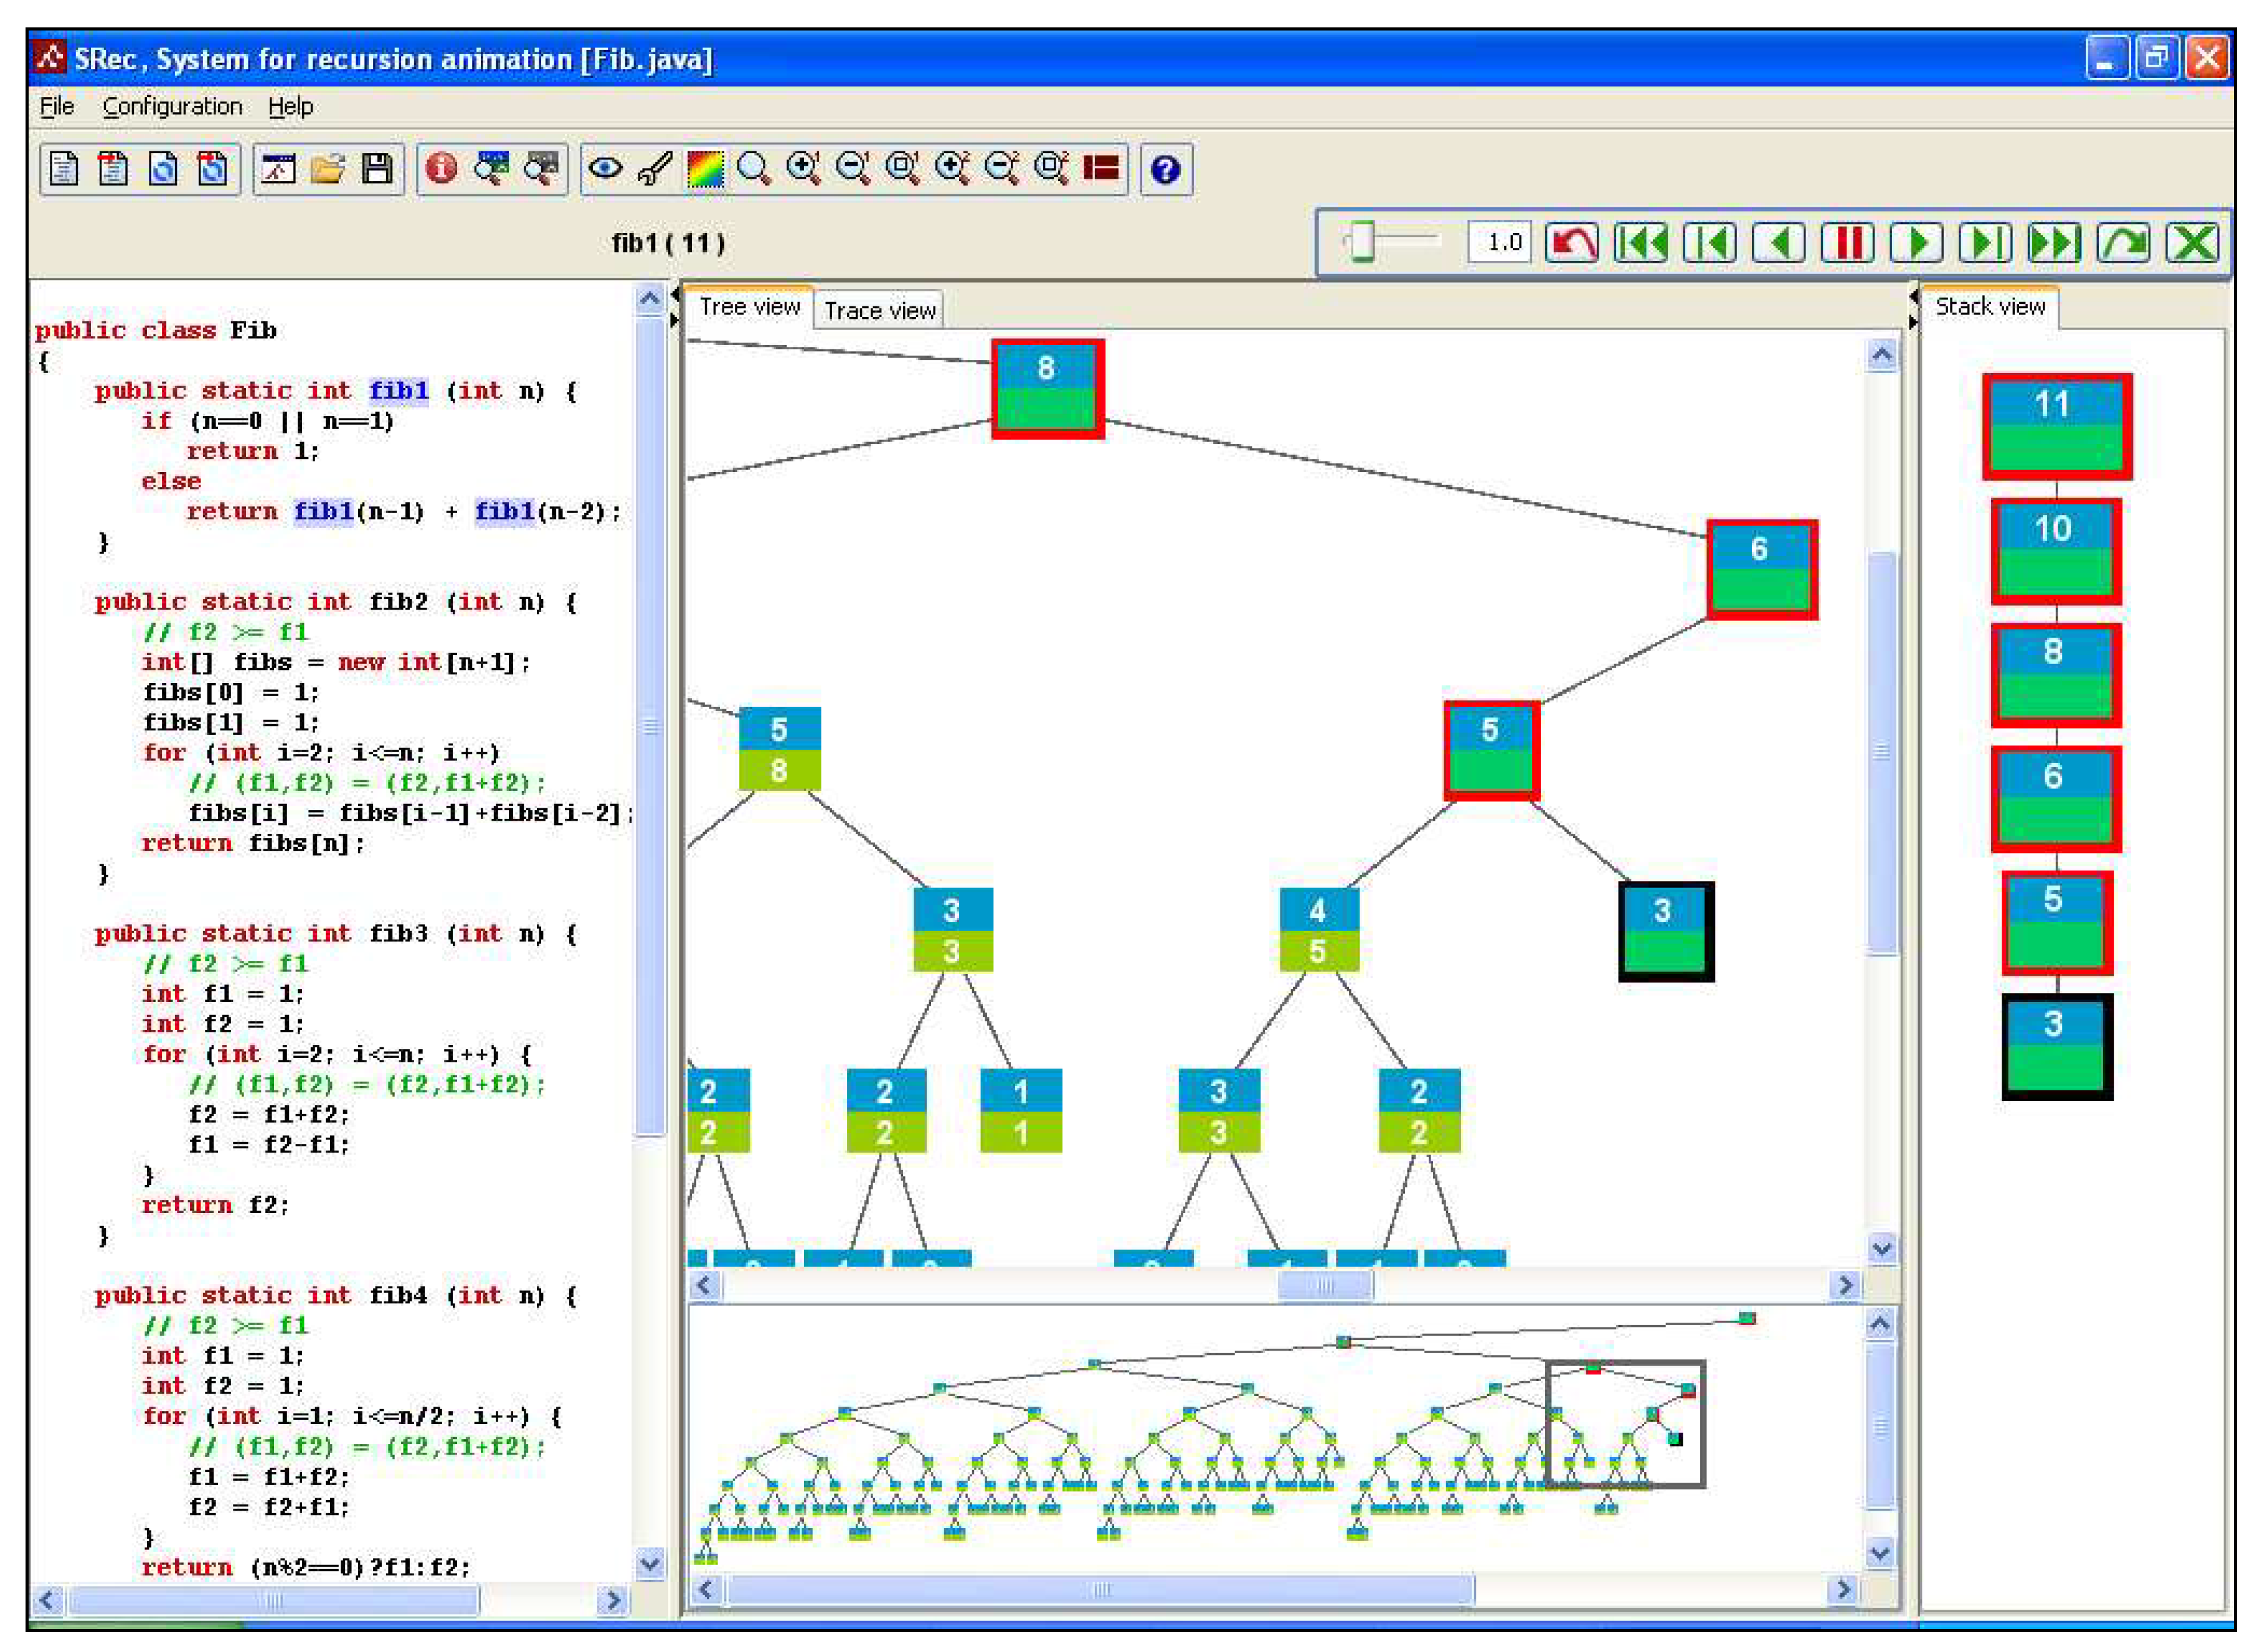
- Recursion tree. This visualization allows display of the complete history of a recursive process as a tree. The root corresponds to the initial invocation. The children of a node are the recursive calls that it has invoked, from left to right in chronological order. Leaves represent calls corresponding to base cases. Every node is displayed with two areas, where the top area contains input values of parameters and the bottom one the result of the invocation (if the method does not return any value, the output state of parameters can be displayed). For example, Figure 1(a) displays the computation state for fib (5) where most recursive calls finished their execution, but the active call fib (1) and pending calls fib (3) and fib (5). In SRec, two states are displayed for every invocation: immediately after the invocation entry, and immediately before the invocation exit. The node framed in black in Figure 1(a) is the active node, so its computation is close to exit. Nodes framed in red correspond to pending invocations. In the figure, input values have a blue background and output values have a green background.
- The control stack. The control stack is an internal data structure of the virtual machine that makes possible the execution of programs with subroutines. In SRec, records of the control stack only contain input and output values, so they have the same structure as the nodes of recursion trees. The control stack initially contains the first invocation. On entry of a method invocation, a new record is pushed at the top of the stack, becoming the active record. This new record contains input values, but the output area is empty. On exit of a method invocation, the output area of the record at the top is filled with the call results and it is later popped. Figure 1(b) displays the control stack at the same instant as Figure 1(a). Visualizations of the control stack can be quite complex [10]. Notice however that the control stack, as displayed by SRec, is isomorphic to the rightmost branch of its associated recursion tree.
- Trace. A trace is a textual description of the sequence of events that take place during the execution of an algorithm, here entry or exit of every method invocation. Each entry (or exit) is represented as a text line that contains an indication that it is an entry (or exit), the method name and its actual parameters (or results). Using a color convention allows differentiating entry and exit invocations. In addition, indentation is commonly used to represent the level of nesting of invocations. Figure 1(c) contains a trace of the same computation of fib (5). Notice that the trace is isomorphic to a traversal of the recursion tree, where input values are printed inorder and ouput values are printed postorder.

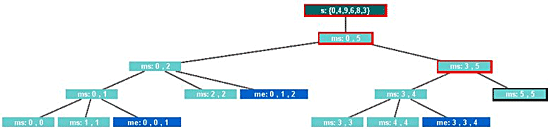
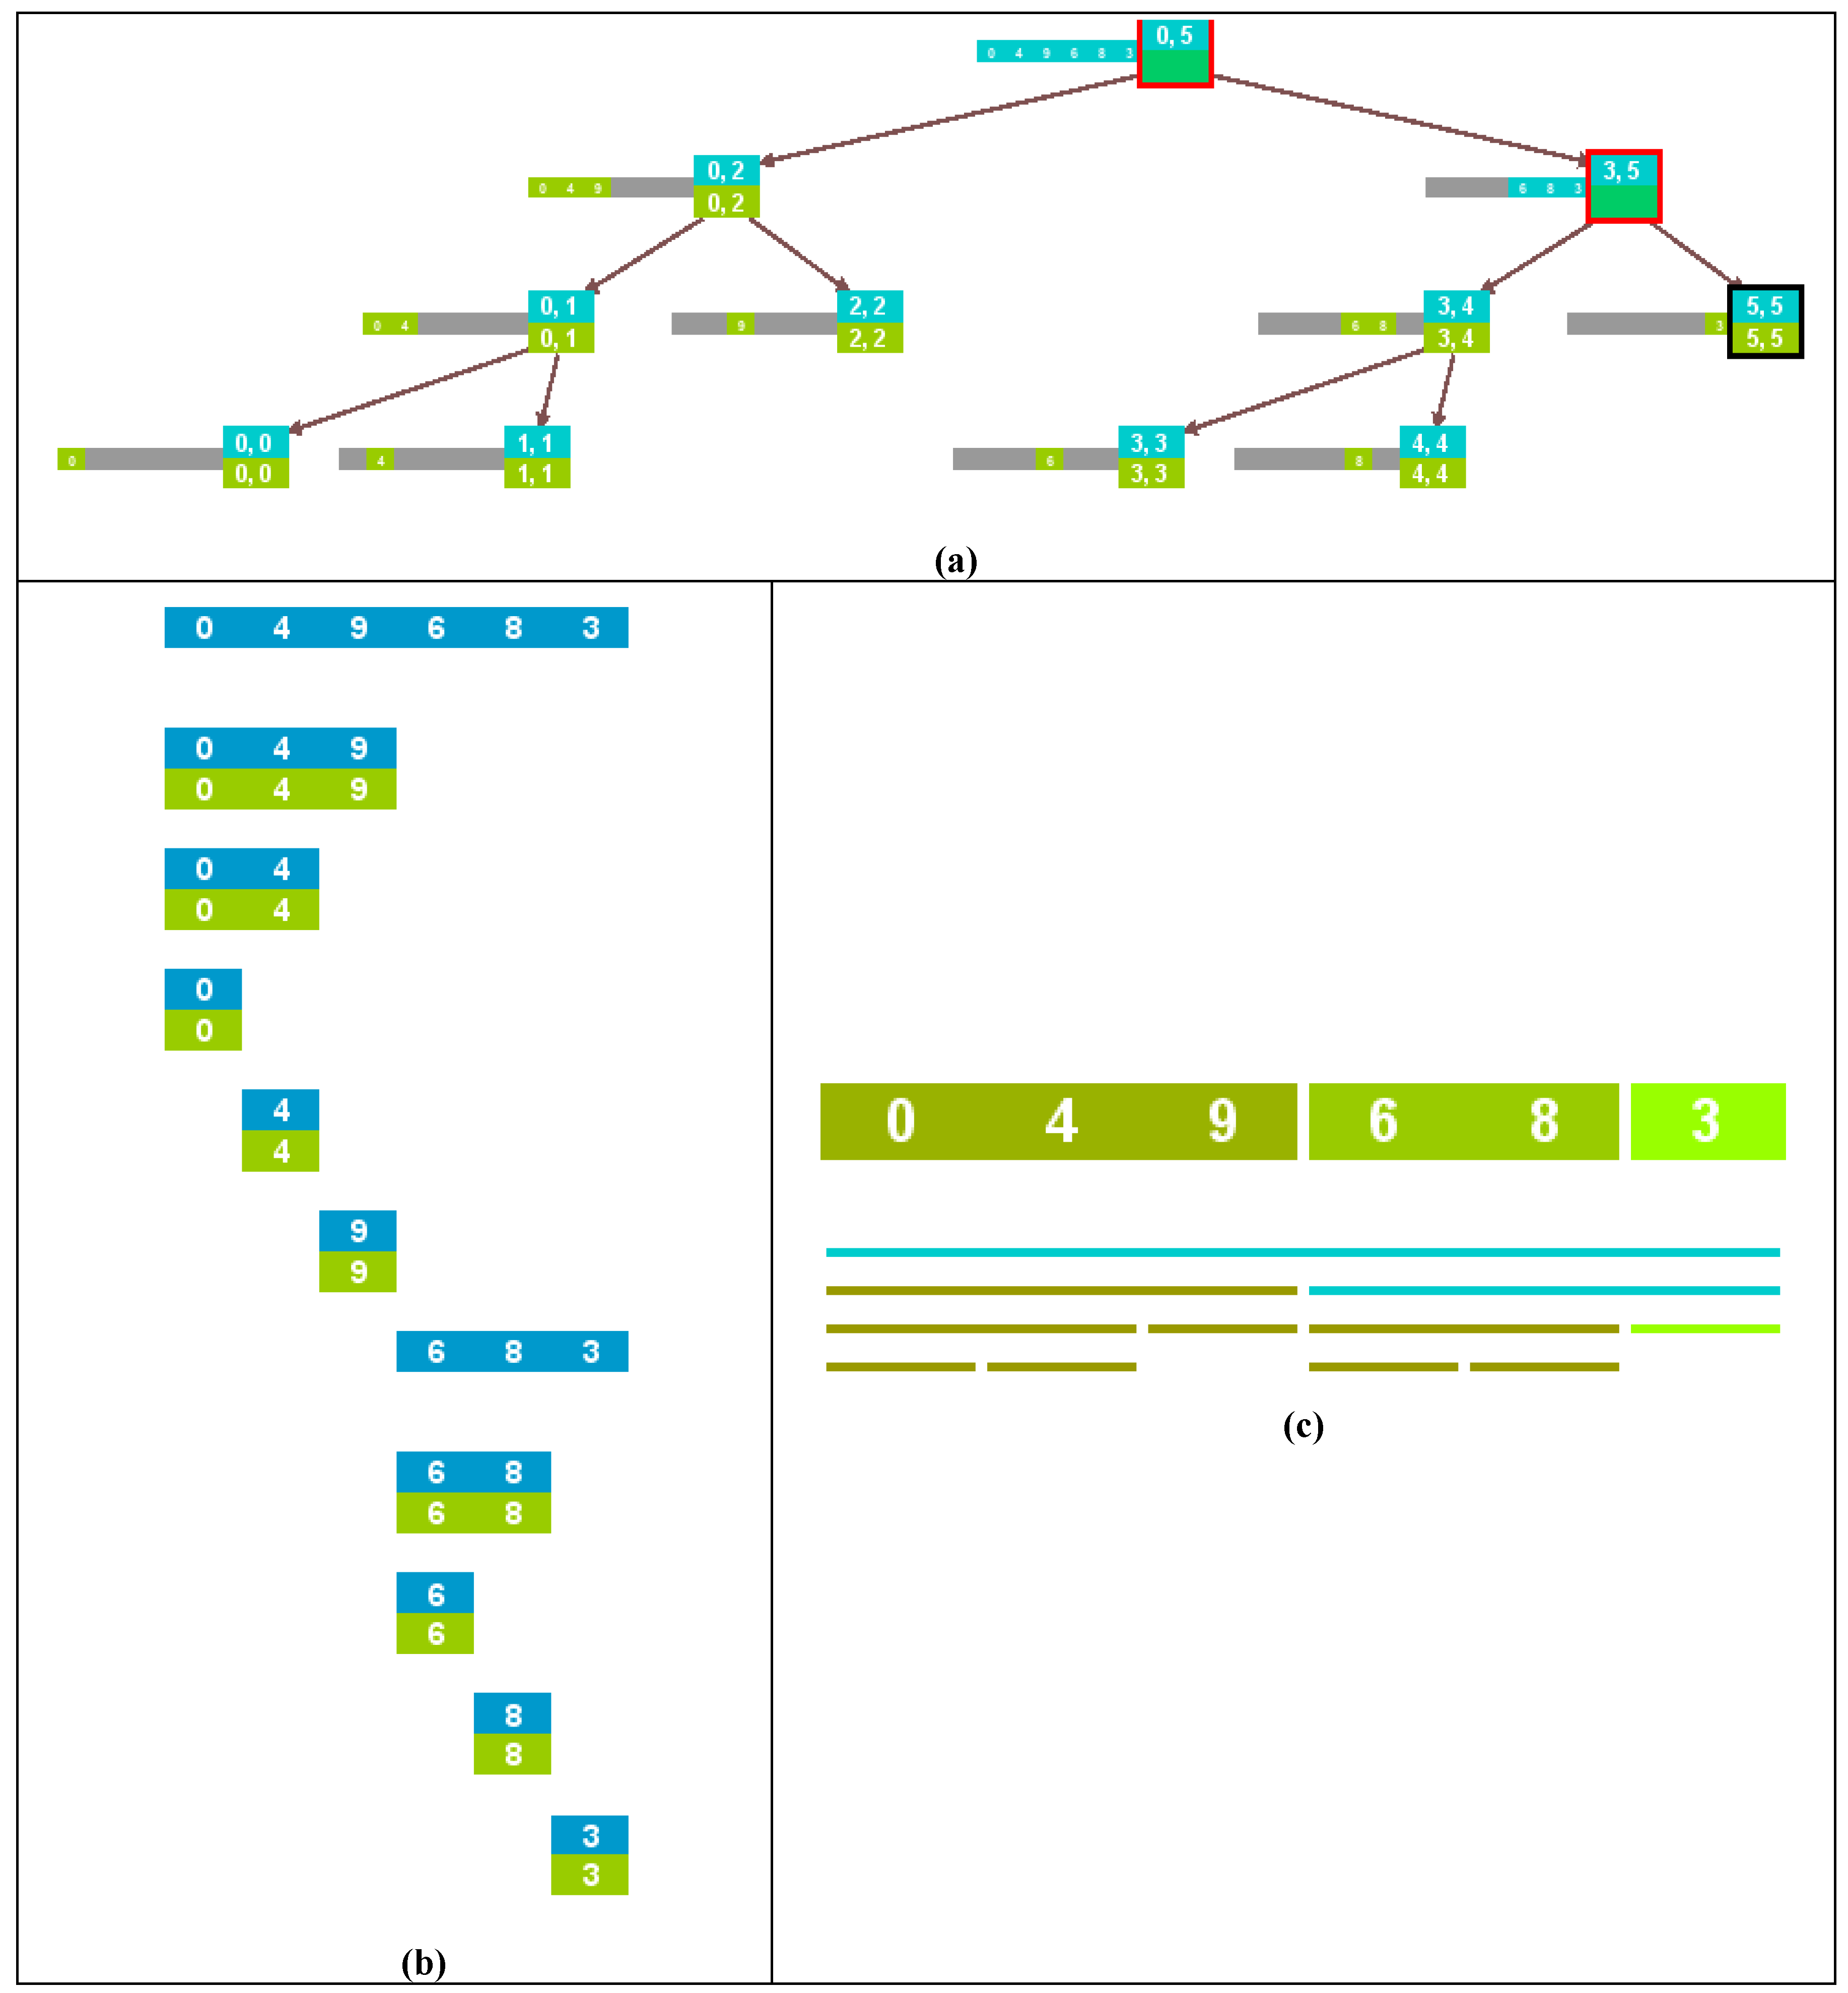
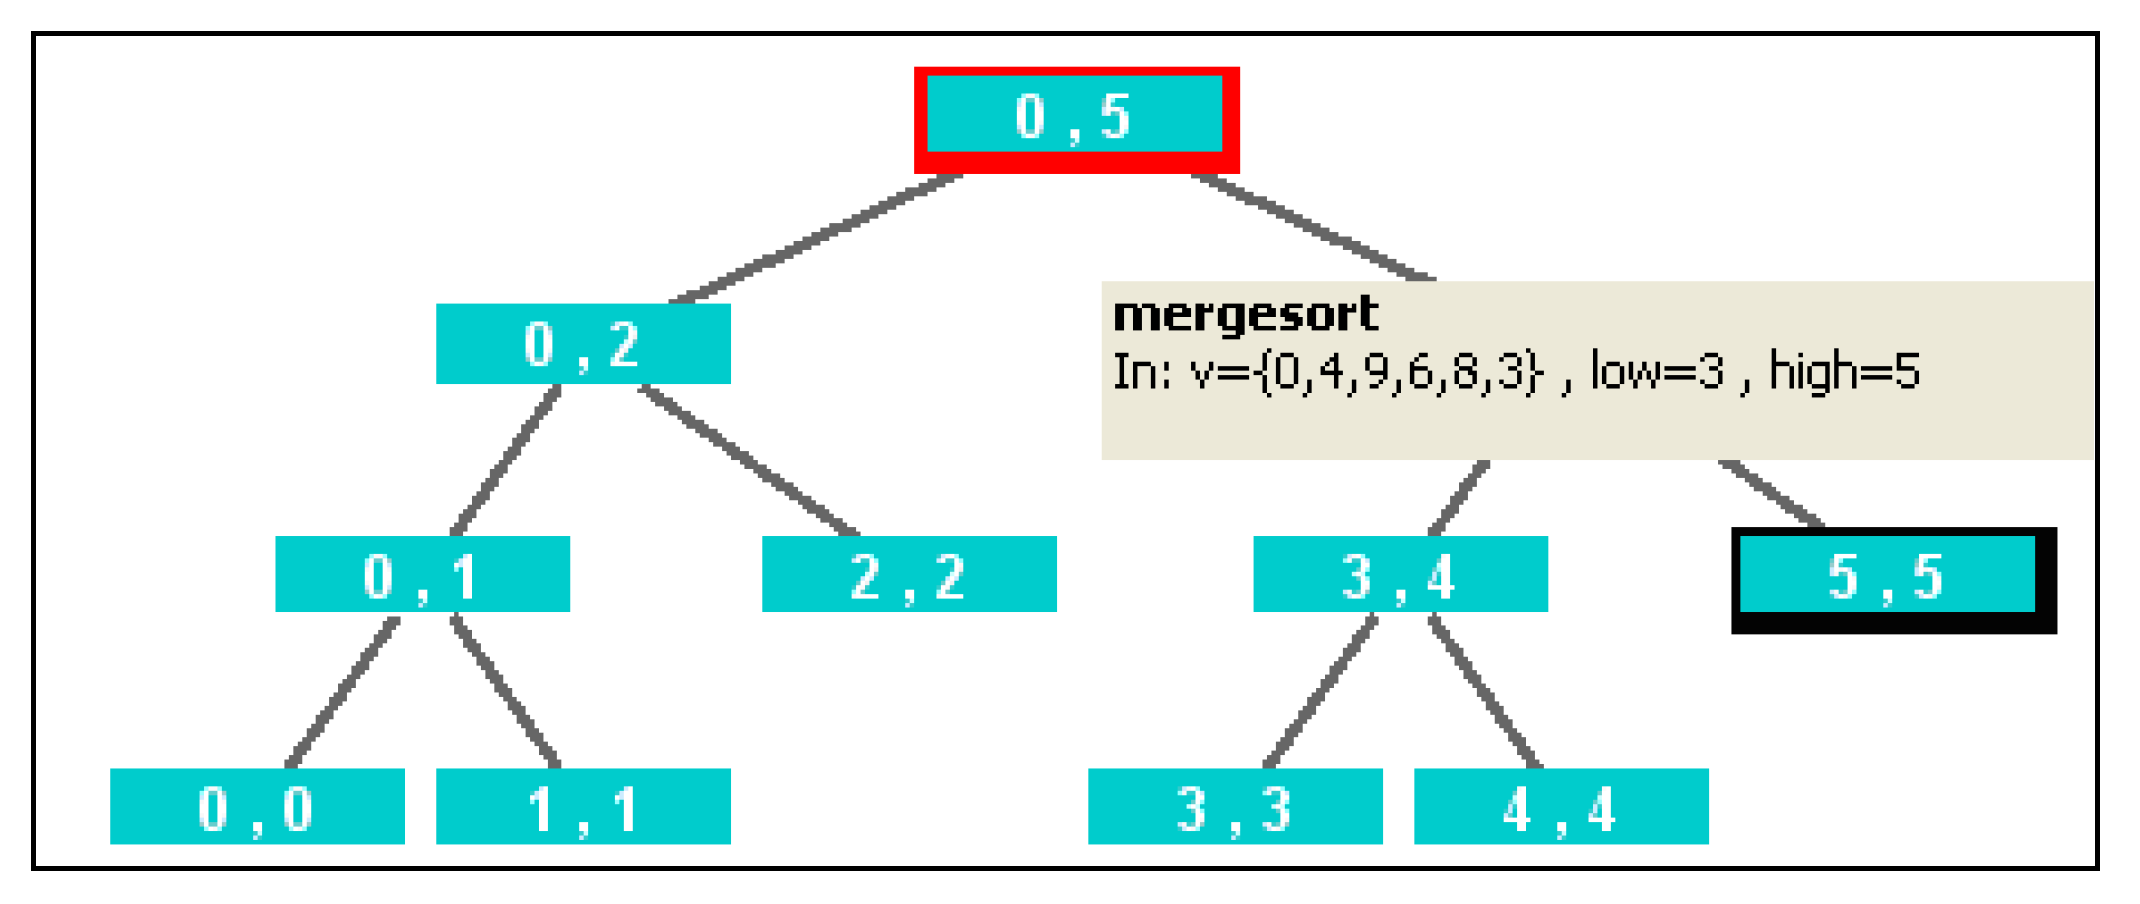
- Divide-and-conquer recursion tree. Divide-and-conquer algorithms typically manipulate a large data structure, but in most recursive calls, the focus of interest is limited to a part of it (i.e. a substructure). An effective variant of recursion trees for divide-and-conquer algorithms consists of displaying the whole structure with the relevant substructure highlighted. SRec supports this additional display for vectors and matrices. Figure 2(a) shows this representation when mergesorting the array {0,4,9,6,8,3}.
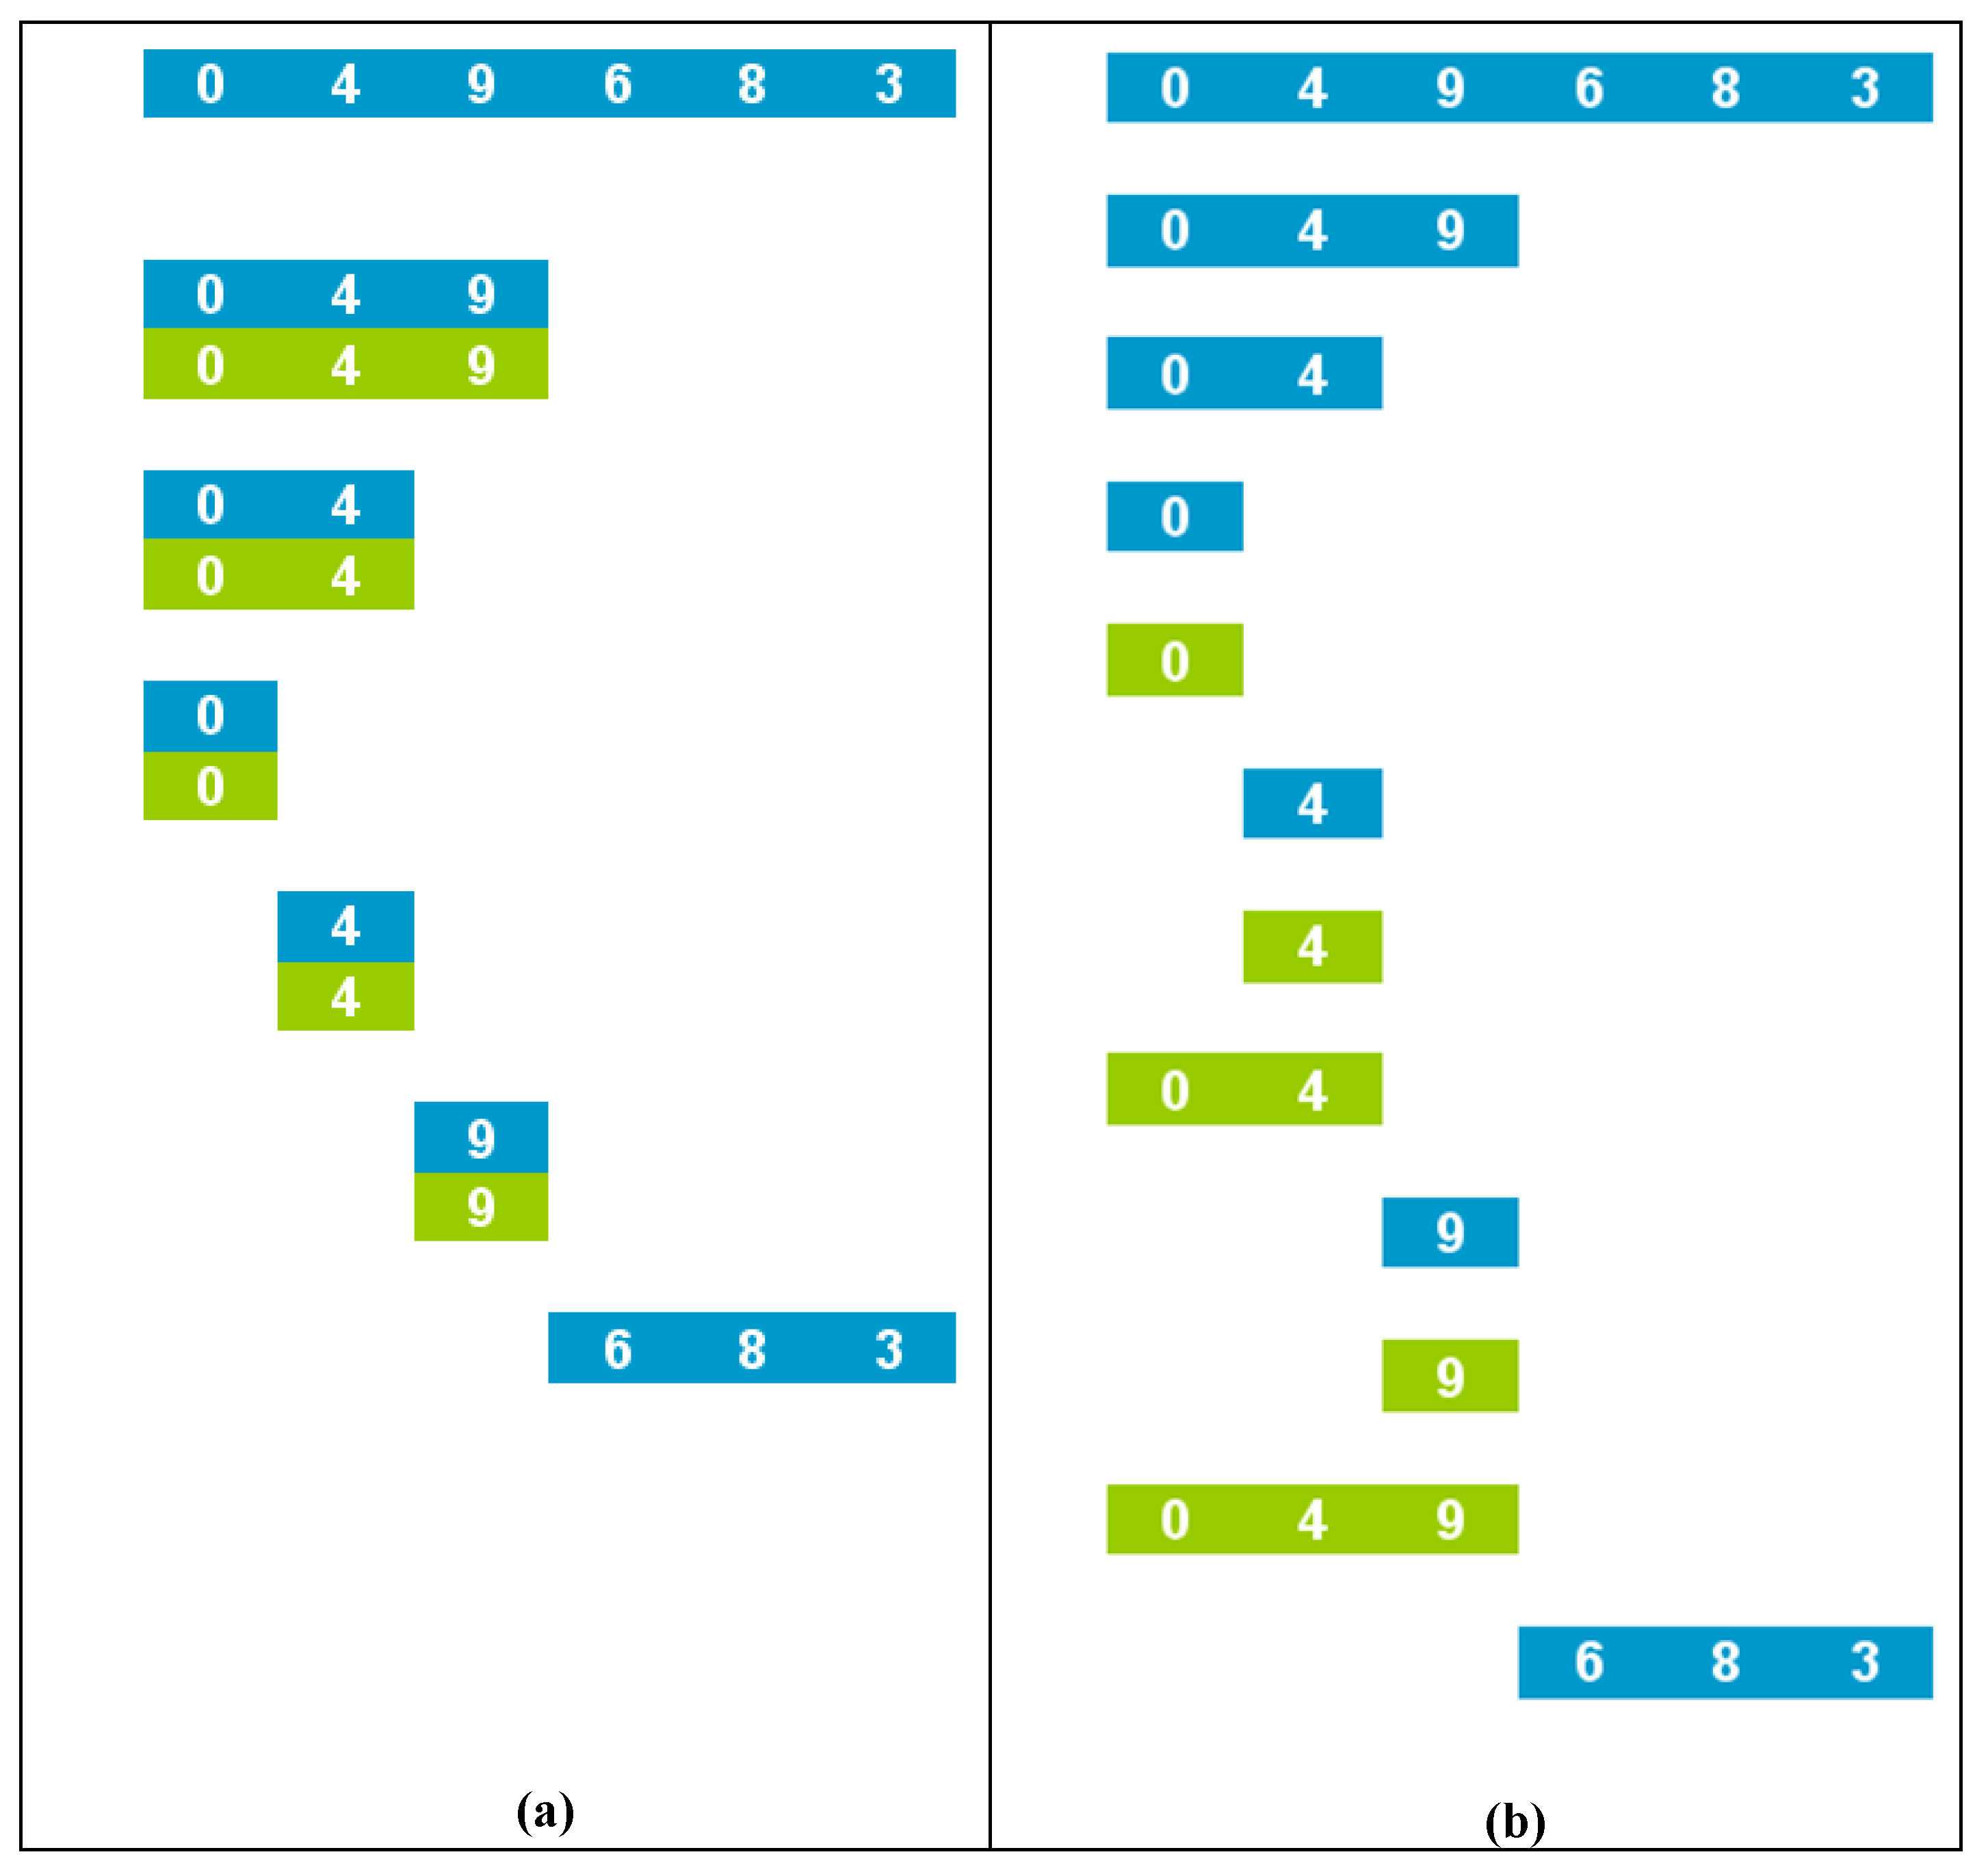
- Sequence of visualizations of the data structure. This representation consists of a sequence of visualizations of the state of the data structure, displayed top-down. It can be considered a variant of the trace visualization, which differs in the layout and in the amount of information displayed. Every time a recursive call is invoked, the array state is displayed. In order to better illustrate the algorithm behavior, each line only shows the subarray delimited in the recursive call. Every time a recursive call exits, the output state of its associated subarray is displayed adjacent to its input state. Again, the relative placement and the use of colors allow differentiating input and output states of subarrays. Figure 2(b) shows this view at the same state as Figure 2(a).
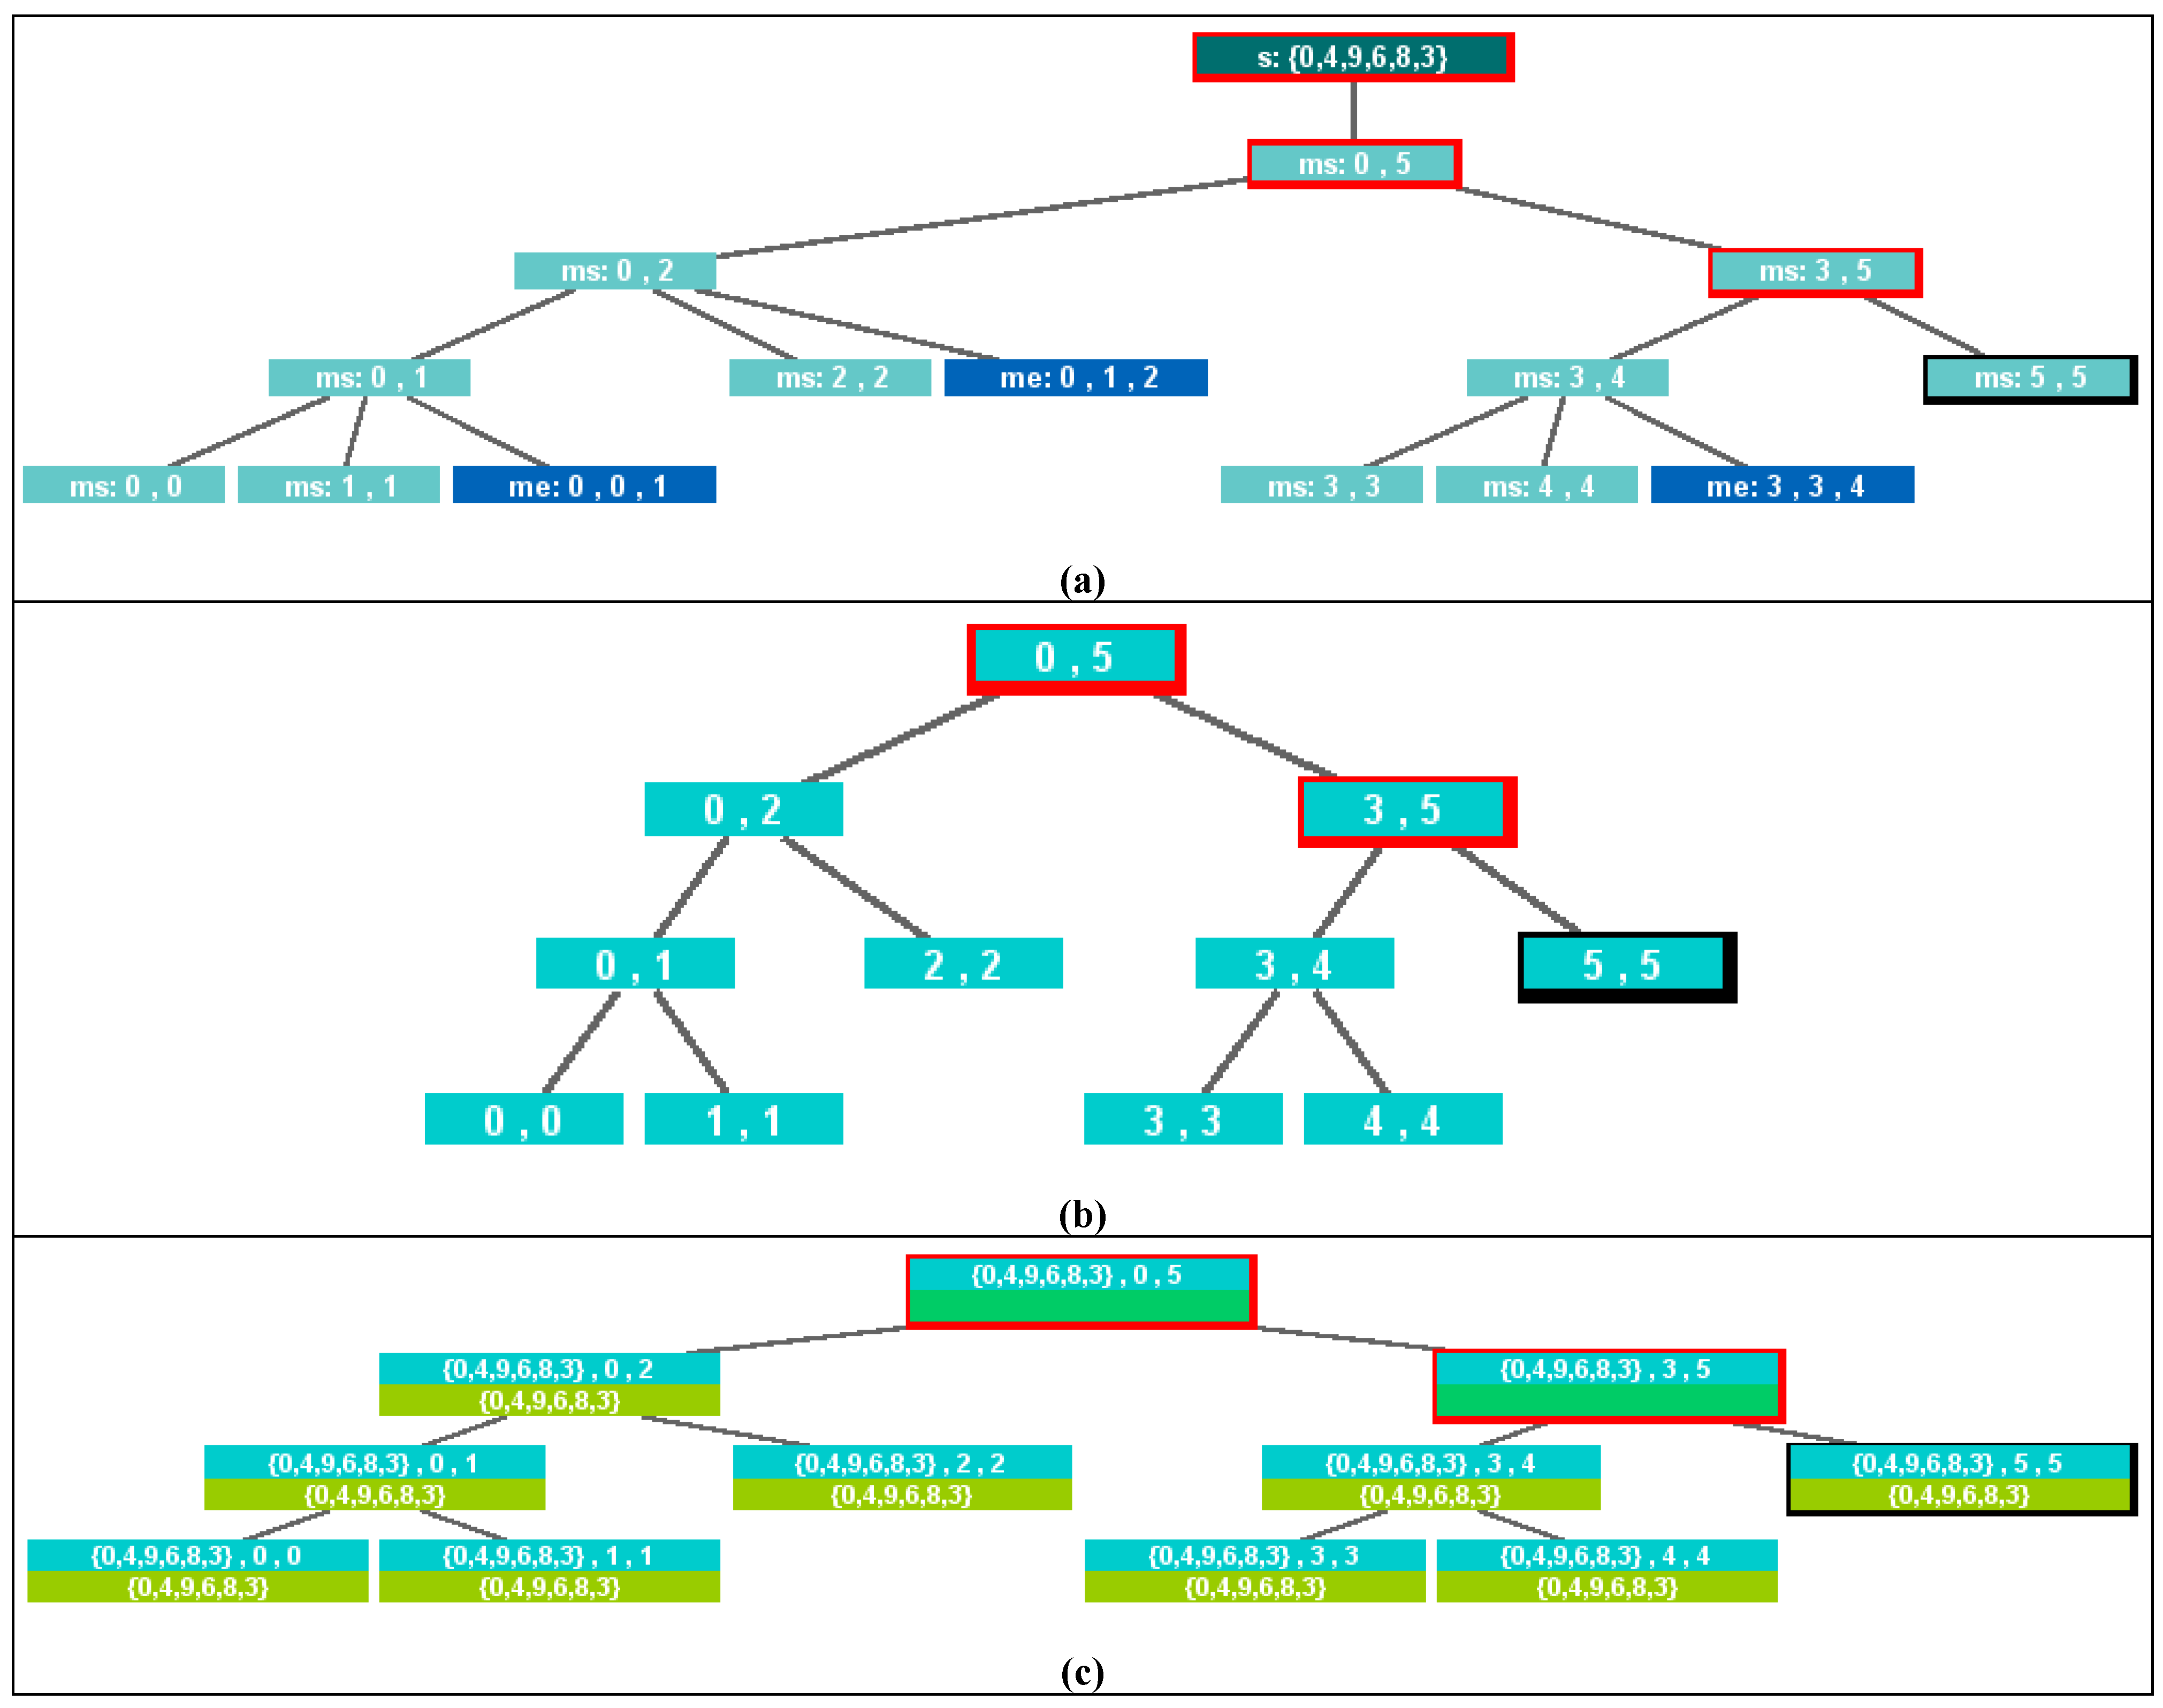
- Colored data structure. This is a mixed view that displays both the state of the data structure to manipulate and hints about the recursive process. In particular, if the data structure is a vector, a set of bars is displayed below the vector. The bars mirror the recursive process by underlining the subarray delimited in each recursive call. A coloring scheme that distinguishes input and output is also applied here. For each underlying bar, the coloring scheme indicates whether the corresponding recursive call is pending or finished. For each subarray, the scheme indicates whether the last update of its state by a recursive invocation was made with input or output values. Tones are also used to represent the distance in the activation tree to the active call. Figure 2(c) shows this representation at the same instant as Figure 2(a).
2.3. Systems for Recursion Animation


| System | Visualizations | Animation controls |
|---|---|---|
| EROSI | Copies model (variables) | Step forwards Automatic play Exit |
| ETV | Copies model (code) Traces Recursion tree | Step/complete Forwards/backwards Manual Restart/finish Exit |
| Flopex 2 | Control stack Recursion tree | Step forwards Automatic play Restart |
| Function Visualizer | Copies model (code and variables) | Step forwards Automatic play Exit |
| Recursion Animator | Copies model (variables) | Step by step Forwards/backwards Manual/automatic Exit |
| SimRECUR | Copies model (code) Control stack Recursion tree | Step forwards Manual/automatic Exit |
| SRec | Traces Control stack Recursion tree (general and divide-and-conquer) Colored data structure Sequence of visualizations of the data structure | Step/step over/complete Forwards/backwards Manual/automatic Restart/finish Exit |
3. Interacting with Visualizations and Animations of Recursion
3.1. Encode
3.2. Connect


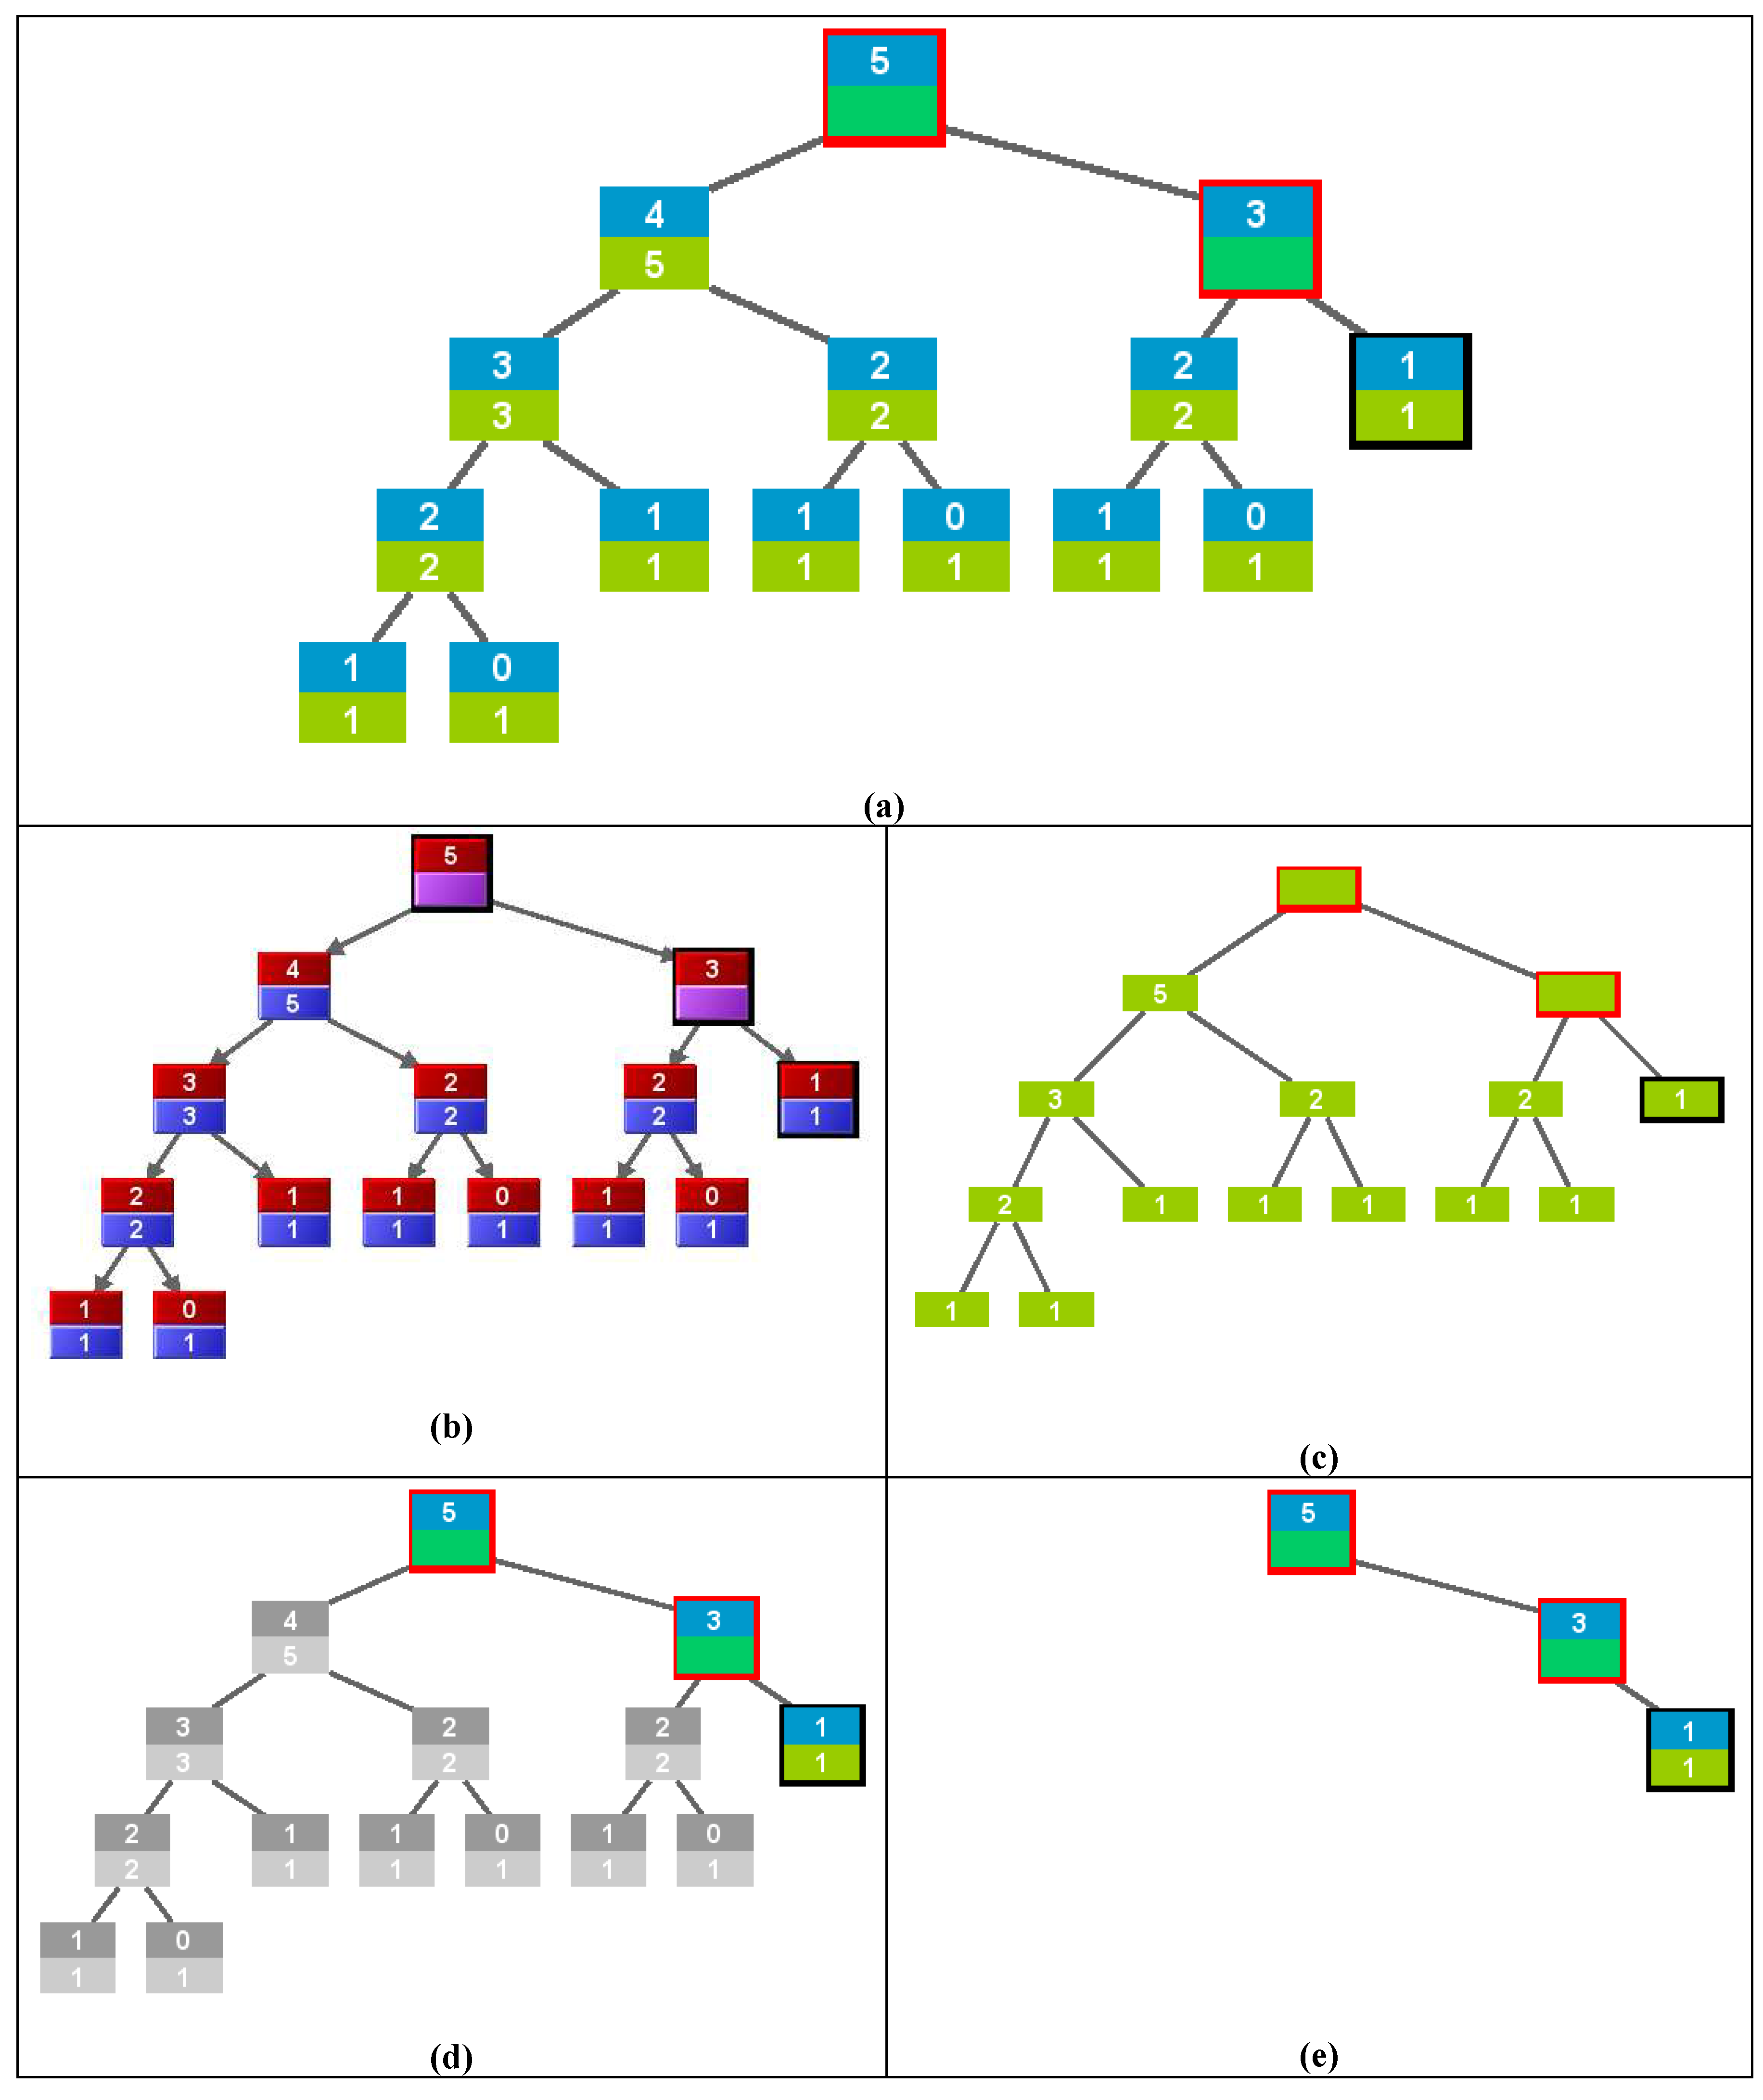
3.3. Filter

3.4. Abstract/Elaborate
3.5. Explore
- Panning+scrolling. Panning is another name for geometric zooming, which allows changing the scale of the visualization and therefore the amount of information that fits the screen. When a visualization does not fit its enclosing panel, a scroll bar may be provided to allow the user to select the part that she wishes to focus on.
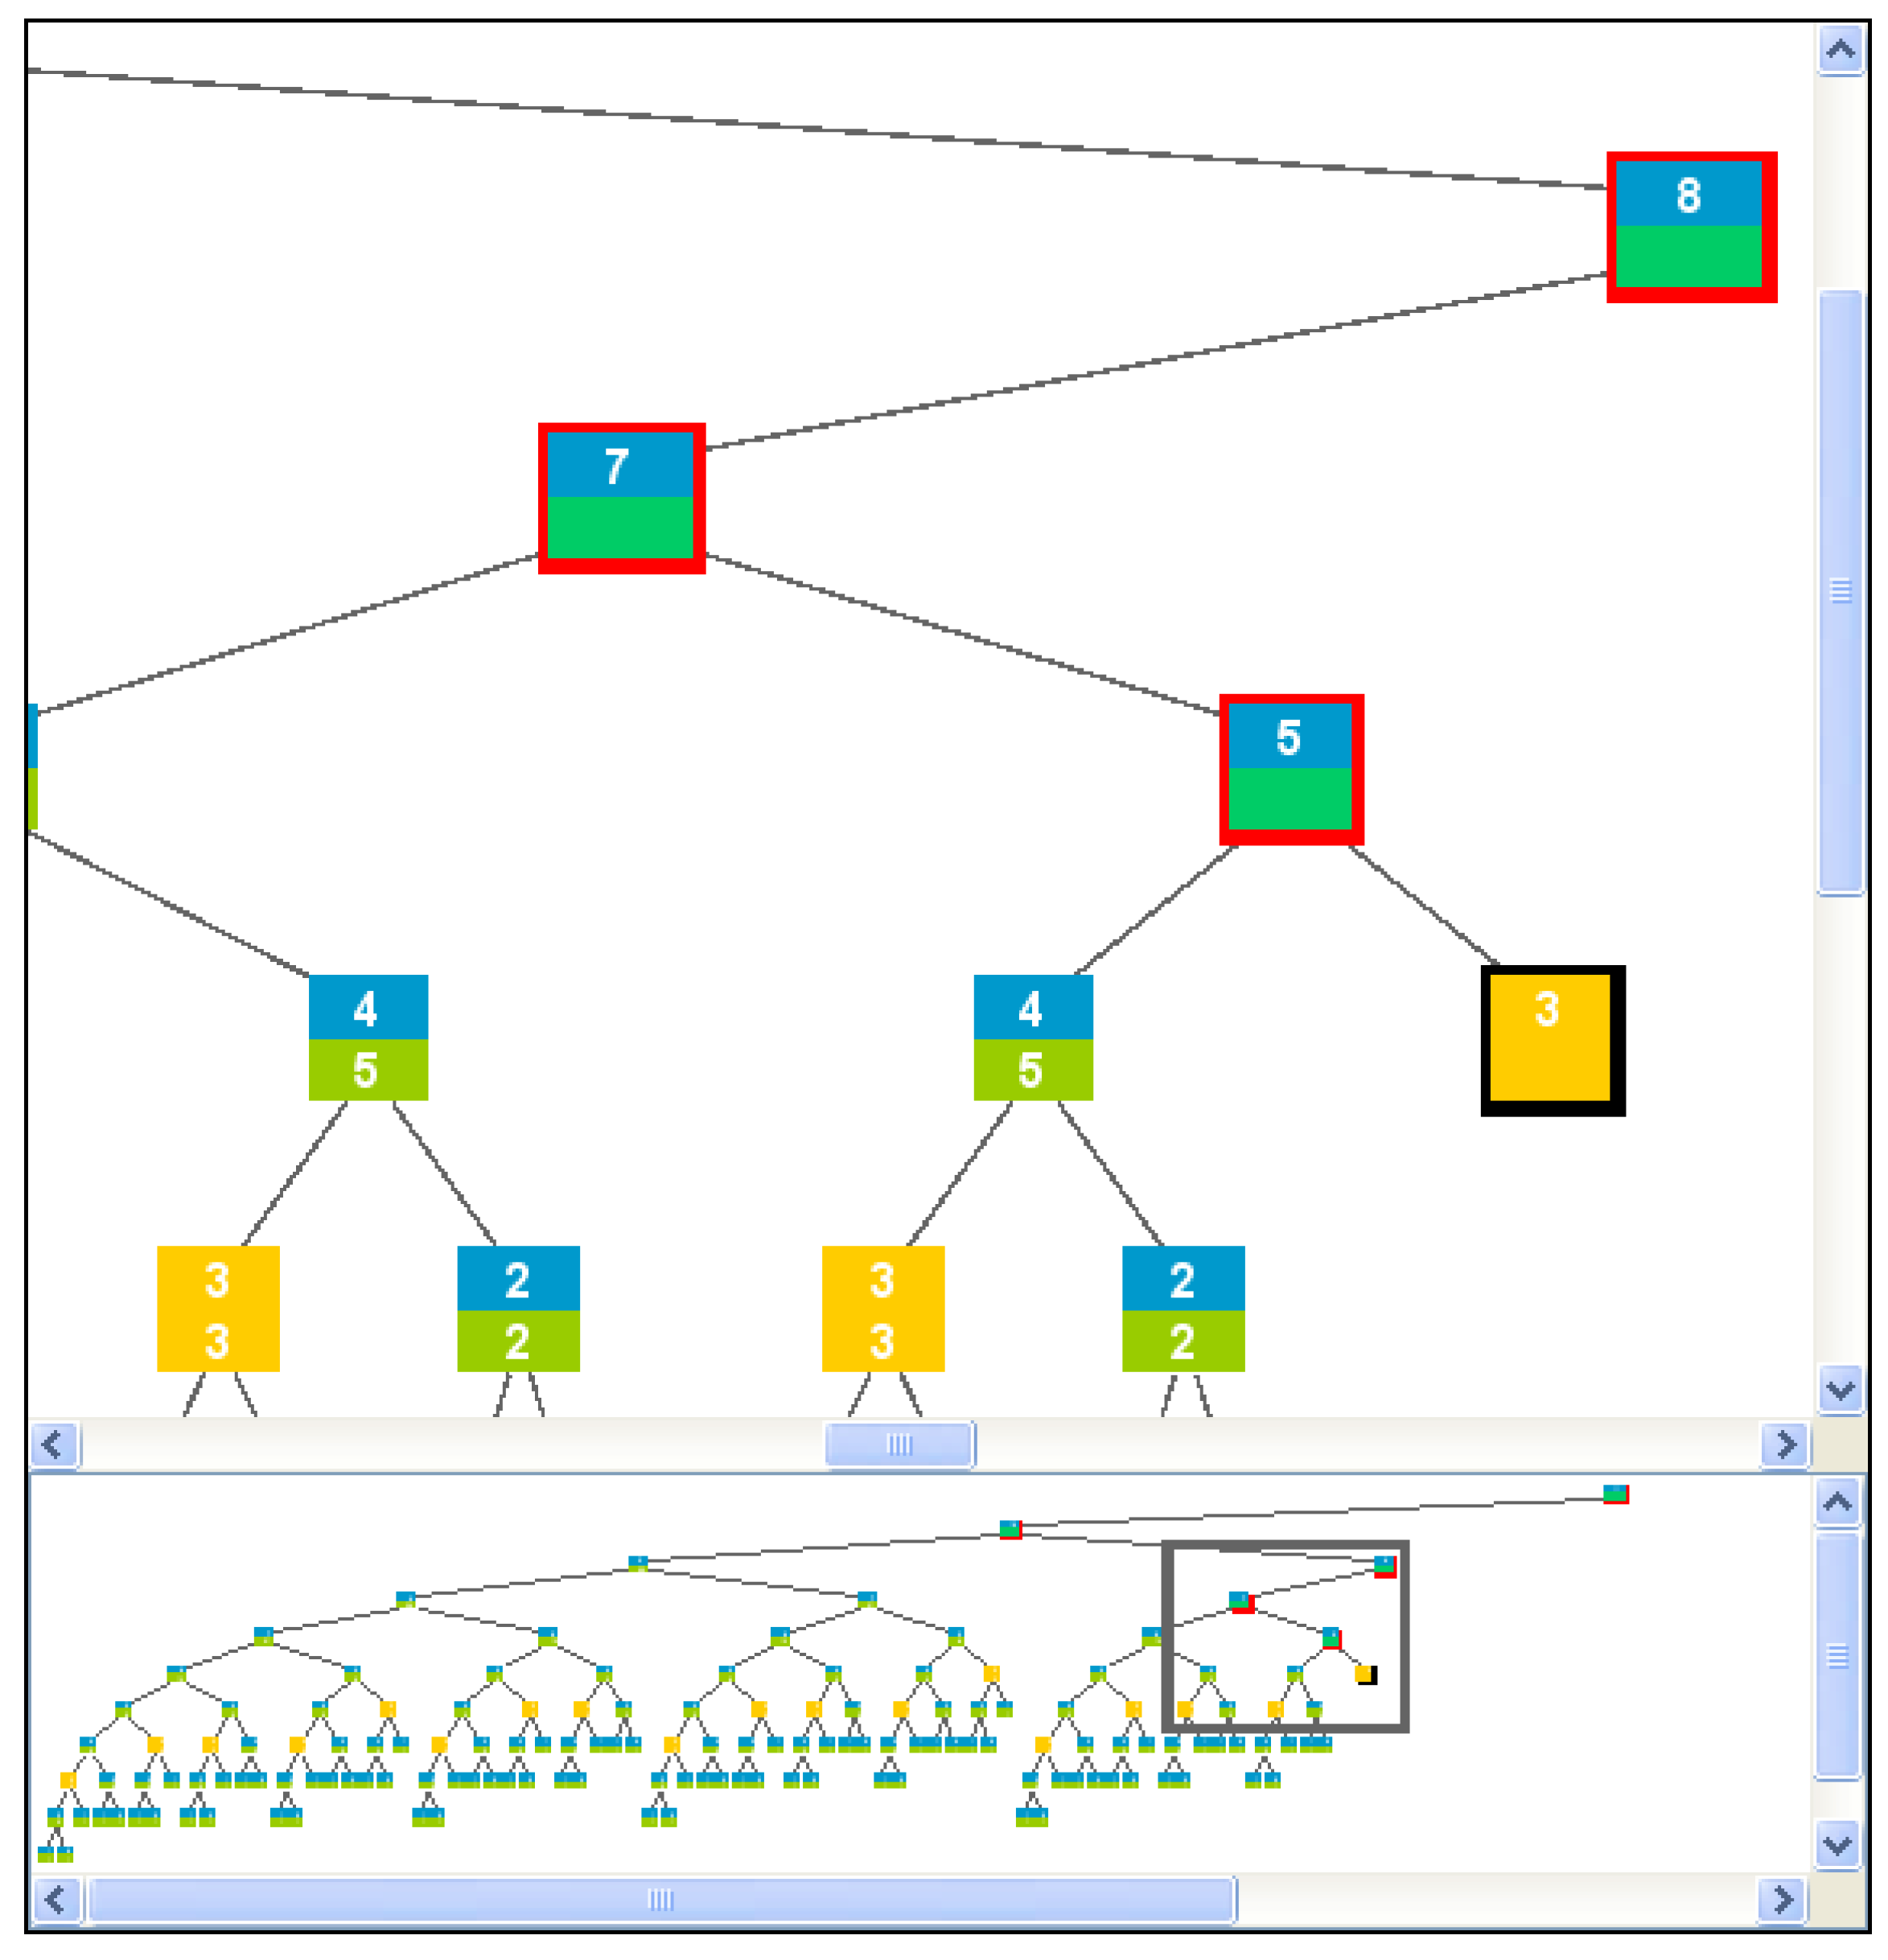
- Overview+detail. Panning+scrolling allows navigating, but if the visualization is much larger than the part visible in a panel, the user may get lost. An overview+detail interface provides two complementary views: the “detail” view makes readable a part of the visualization and the “overview” gives a sketch of the global view of the visualization, identifying the position of the “detail” view.
3.6. Reconfigure

3.7. Select
4. Conclusions
- Lack of evidence of their educational efficiency.
- Heavy workload posed on animation constructors (typically, the instructors).
Acknowledgments
References
- Bloom, B.; Furst, E.; Hill, W.; Krathwohl, D.R. Taxonomy of Educational Objectives: Handbook I, The Cognitive Domain; Longmans: New York, NY, USA, 1959. [Google Scholar]
- Böcker, H.D.; Fisher, G.; Nieper, H. The enhancement of understanding through visual representations. In Proceedings of the ACM SIGCHI Conference on Human Factors in Computing, Boston, MA, USA, April 1986; pp. 44–50.
- Velázquez-Iturbide, J.Á.; Pérez-Carrasco, A.; Urquiza-Fuentes, J. SRec: An animation system of recursion for algorithm courses. In Proceedings of the 13th Annual Conference Innovation and Technology in Computer Science Education, Madrid, Spain, June 2008; pp. 225–229.
- Haynes, S.M. Explaining recursion to the unsophisticated. ACM SIGCSE Bulletin 1995, 27, 3–6 and 14. [Google Scholar]
- Wilcocks, D.; Sanders, I. Animating recursion as an aid to instruction. Comput. Educ. 1994, 23, 221–226. [Google Scholar]
- Stern, L.; Naish, L. Visual representations for recursive algorithms. In Proceedings of the 33rd SIGCSE technical symposium on Computer science education, Cincinnati, KY, USA, February 2002; pp. 196–200.
- Software Visualization, Stasko, J.T.; Domingue, J.; Brown, M.H.; Price, B.A. (Eds.) MIT Press: Cambridge, MA, USA, 1997.
- Velázquez-Iturbide, J.Á.; Pérez-Carrasco, A.; Urquiza-Fuentes, J. A design of automatic visualizations for divide-and-conquer algorithms. Electr. N. Theor. Comput. Sci. 2009, 224, 113–120. [Google Scholar]
- Fernández-Muñoz, L.; Pérez-Carrasco, A.; Velázquez-Iturbide, J.Á.; Urquiza-Fuentes, J. A framework for the automatic generation of algorithm animations based on design techniques. In Proceedings of the Second European Conference on Technology Enhanced Learning, Crete, Greece, September 2007; pp. 475–480.
- Velázquez-Iturbide, J.Á. Formalization of the control stack. ACM SIGPLAN Notices 1989, 24, 46–54. [Google Scholar]
- Terada, M. ETV: A program trace player for students. In Proceedings of the 10th Annual Conference Innovation and Technology in Computer Science Education, Monte da Caparica, Portugal, June 2005; pp. 118–122.
- Wu, C.C.; Lin, J.M.C.; Hsu, I.Y.W. Closed laboratories using SimLIST and SimRECUR. Comput. Educat. 1997, 28, 55–64. [Google Scholar] [CrossRef]
- Dershem, H.L.; Parker, D.E.; Weinhold, R. A Java function visualizer. J. Comput. Small Coll. 1999, 15, 220–230. [Google Scholar]
- George, C.E. EROSIIVisualizing recursion and discovering new errors. In Proceedings of the SIGCSE’00, Austin, TX, USA, March 2000; pp. 305–309.
- Eskola, J.; Tarhio, J. On visualization of recursion with Excel. In Proceedings of the Second Program Visualization Workshop, HornstrupCentret, Denmark, June 2002; pp. 45–51.
- Yi, J.S.; Kang, Y.; Stasko, J.; Jacko, J.A. Toward a deeper understanding of the role of interaction in information visualization. IEEE Trans. Visualiz. Comput. Graph. 2007, 13, 1224–1231. [Google Scholar]
- Naps, T.; Roessling, G.; Almstrum, V.; Dann, W.; Fleischer, R.; Hundhausen, C.; Korhonen, A.; Malmi, L.; McNally, M.; Rodger, S.; Velázquez-Iturbide, J.Á. Exploring the role of visualization and engagement in computer science education. ACM SIGCSE Bulletin 2003, 35, 131–152. [Google Scholar] [CrossRef]
- Hundhausen, C.; Douglas, S.; Stasko, J. A meta-study of algorithm visualization effectiveness. J. Vis. Lang. Comput. 2002, 13, 259–290. [Google Scholar] [CrossRef]
- Ihantola, P.; Karavirta, V.; Korhonen, A.; Nikander, J. Taxonomy of effortless creation of algorithm visualization. In Proceedings of the International Workshop on Computing Education Research, Seattle, WA, USA, October 2005; pp. 123–133.
© 2010 by the authors. Licensee MDPI, Basel, Switzerland. This article is an open access article distributed under the terms and conditions of the Creative Commons Attribution license ( http://creativecommons.org/licenses/by/3.0/).
Share and Cite
Velázquez-Iturbide, J.Á.; Pérez-Carrasco, A. InfoVis Interaction Techniques in Animation of Recursive Programs. Algorithms 2010, 3, 76-91. https://doi.org/10.3390/a3010076
Velázquez-Iturbide JÁ, Pérez-Carrasco A. InfoVis Interaction Techniques in Animation of Recursive Programs. Algorithms. 2010; 3(1):76-91. https://doi.org/10.3390/a3010076
Chicago/Turabian StyleVelázquez-Iturbide, J. Ángel, and Antonio Pérez-Carrasco. 2010. "InfoVis Interaction Techniques in Animation of Recursive Programs" Algorithms 3, no. 1: 76-91. https://doi.org/10.3390/a3010076