An Efficient Algorithm for Automatic Peak Detection in Noisy Periodic and Quasi-Periodic Signals


Abstract
:1. Introduction
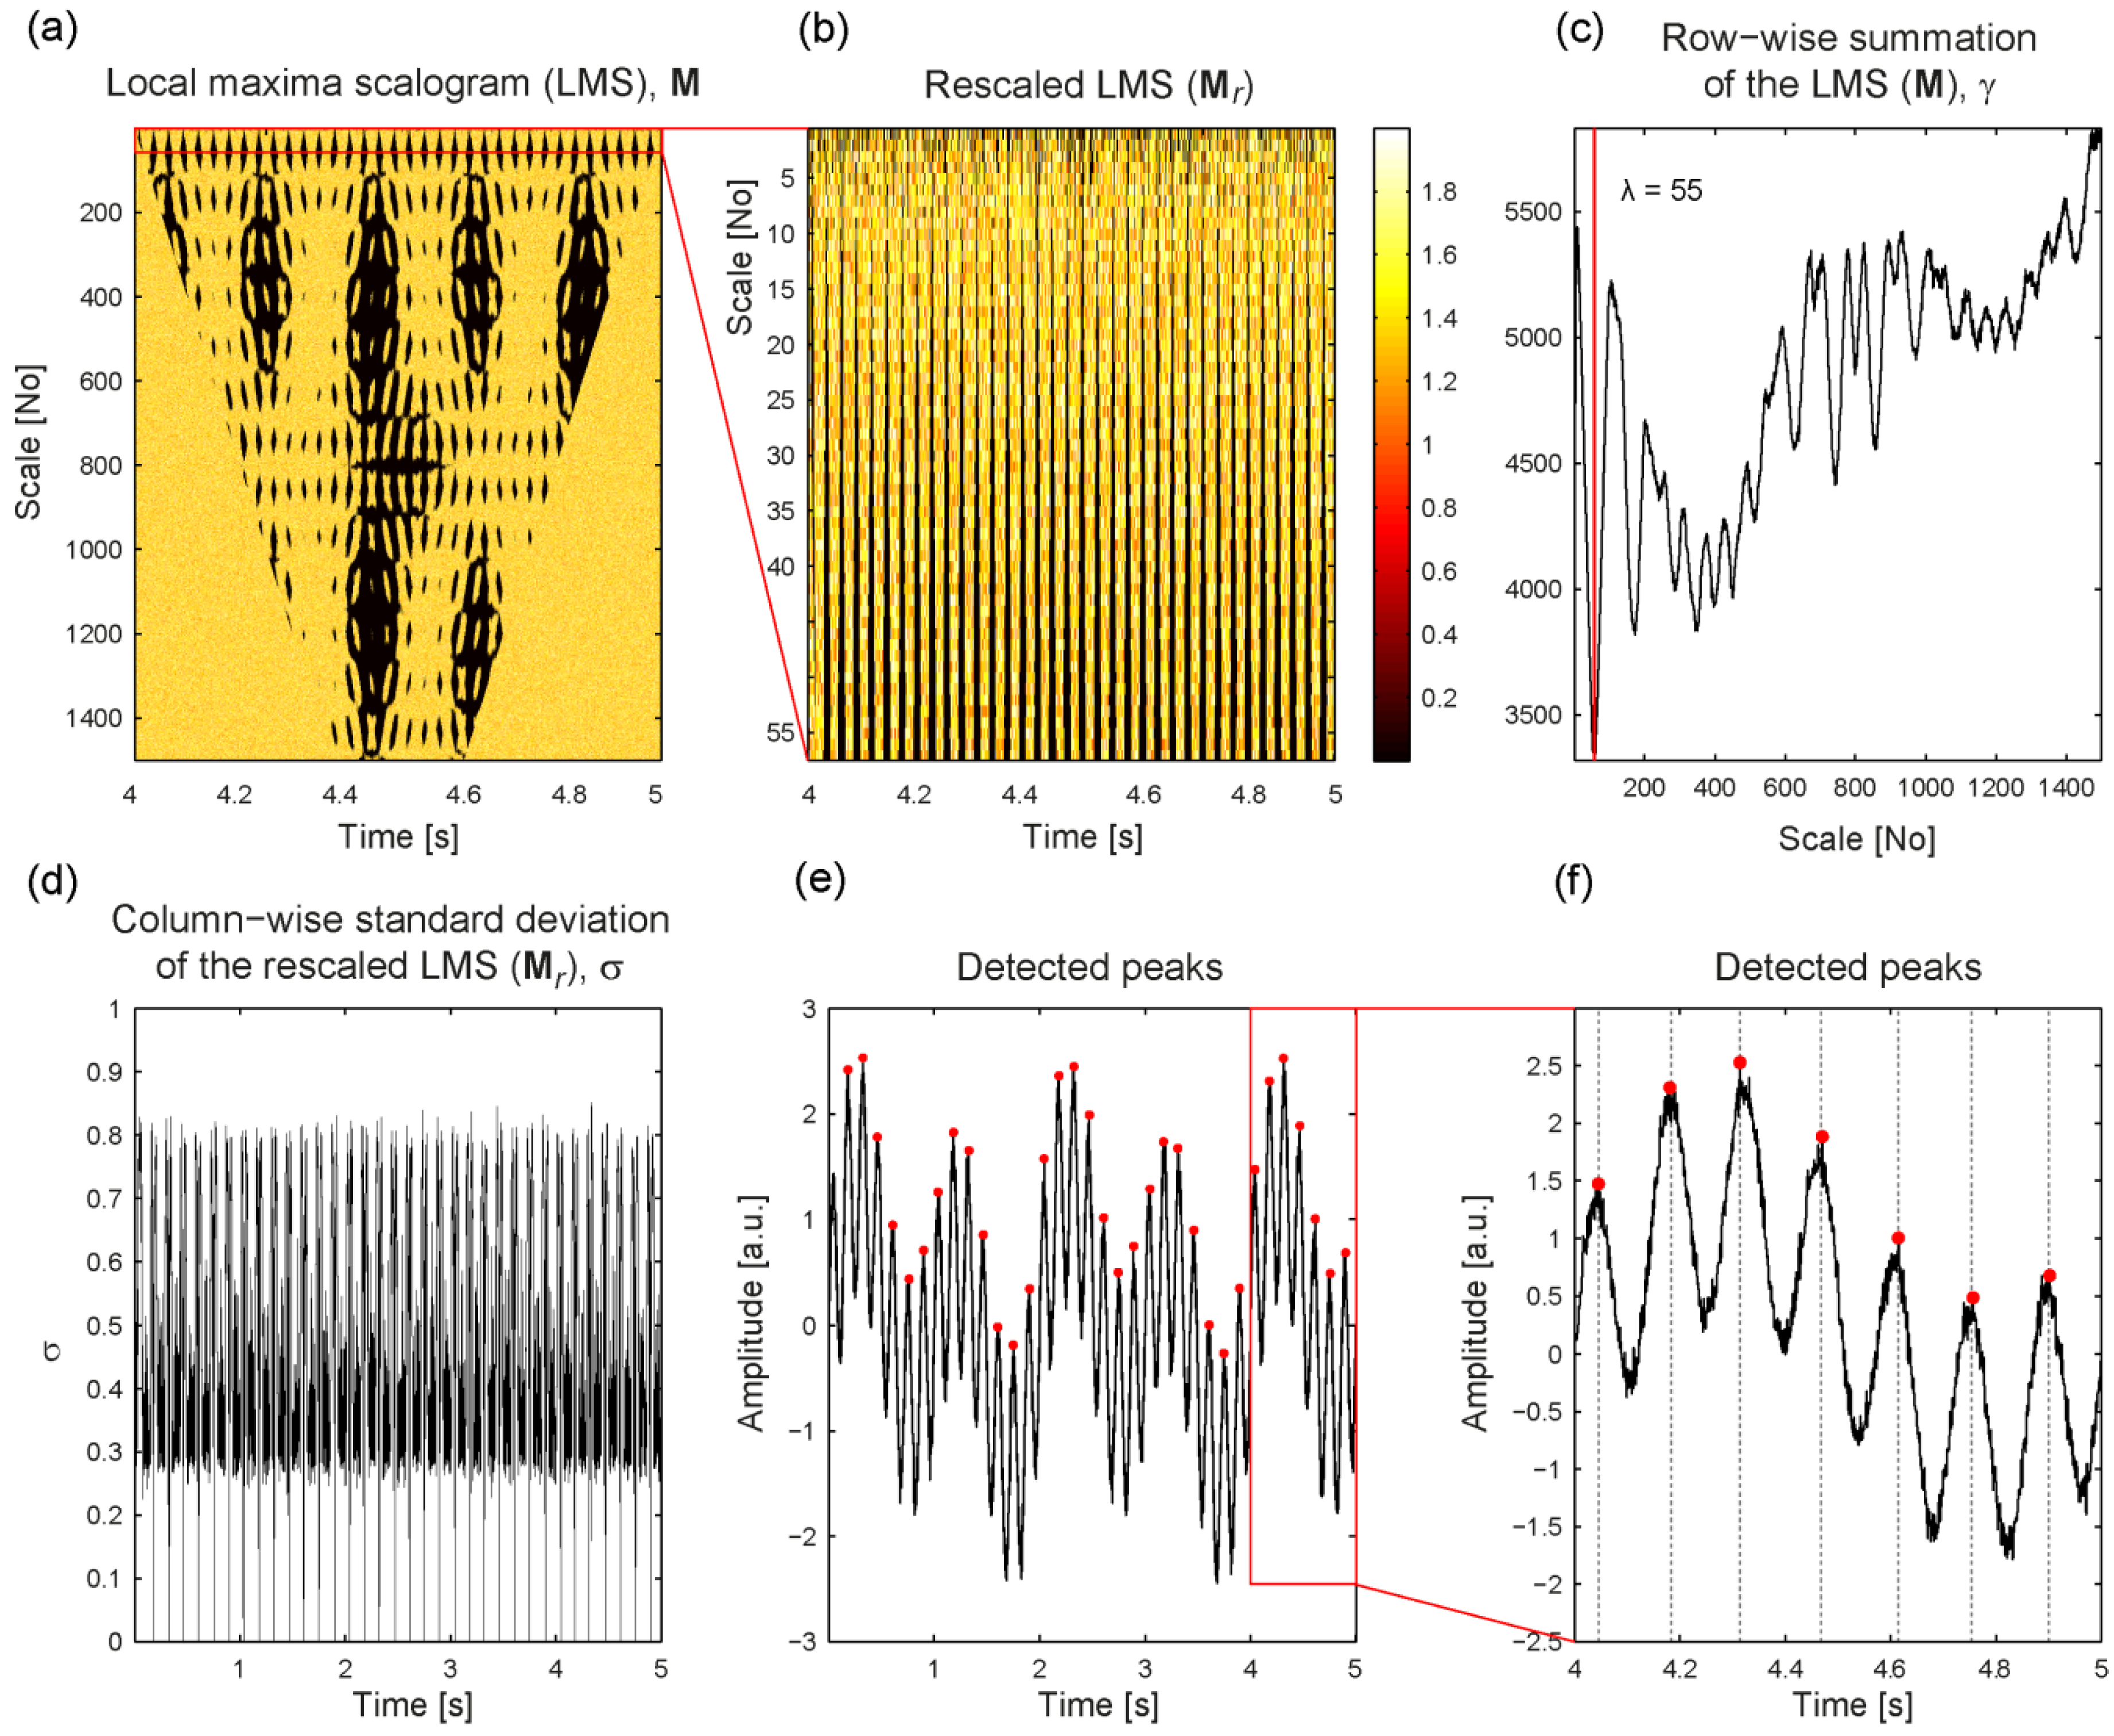
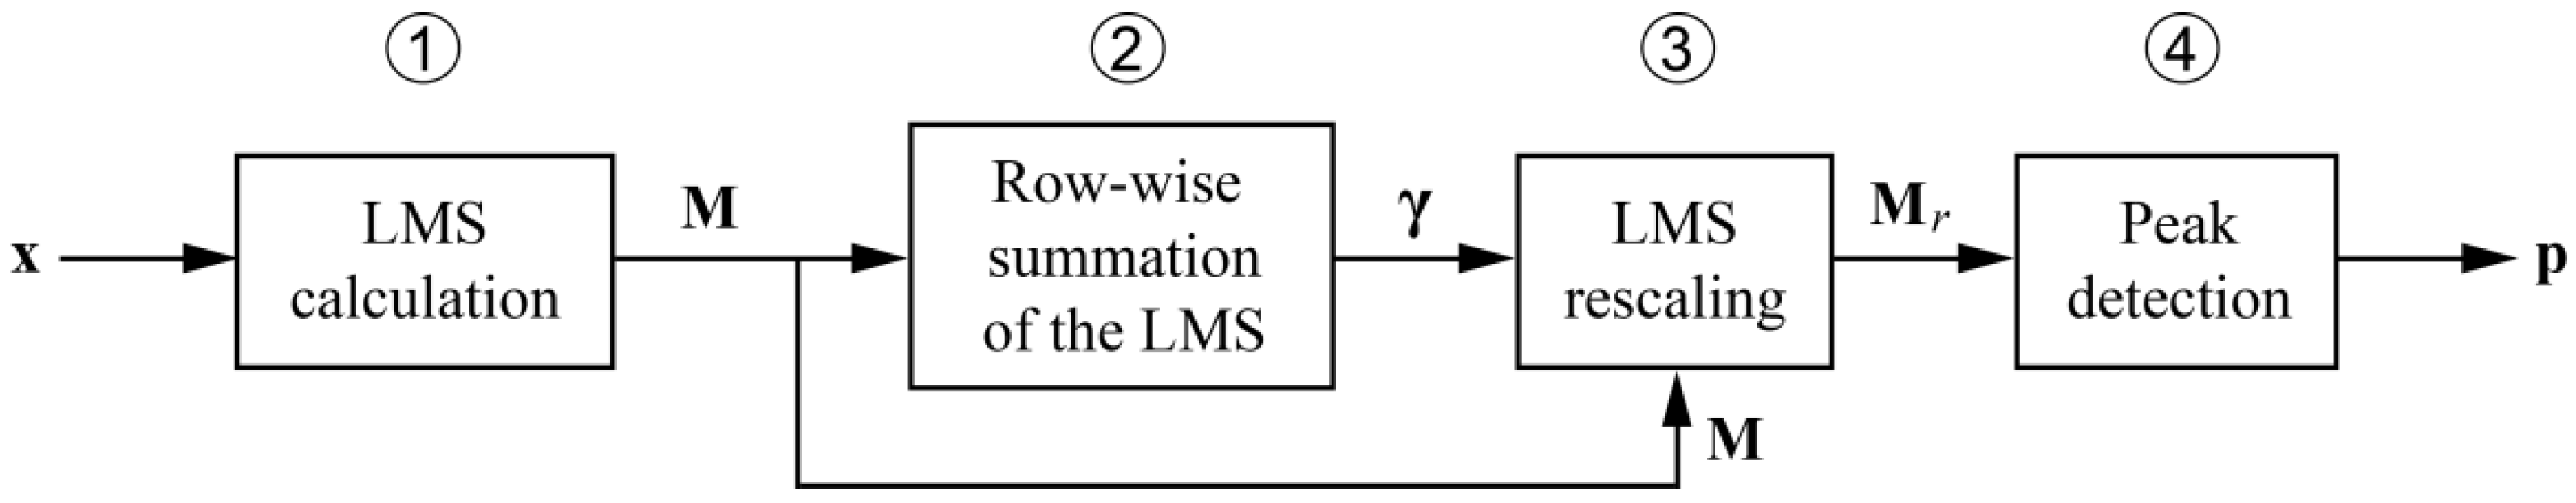
2. Algorithm

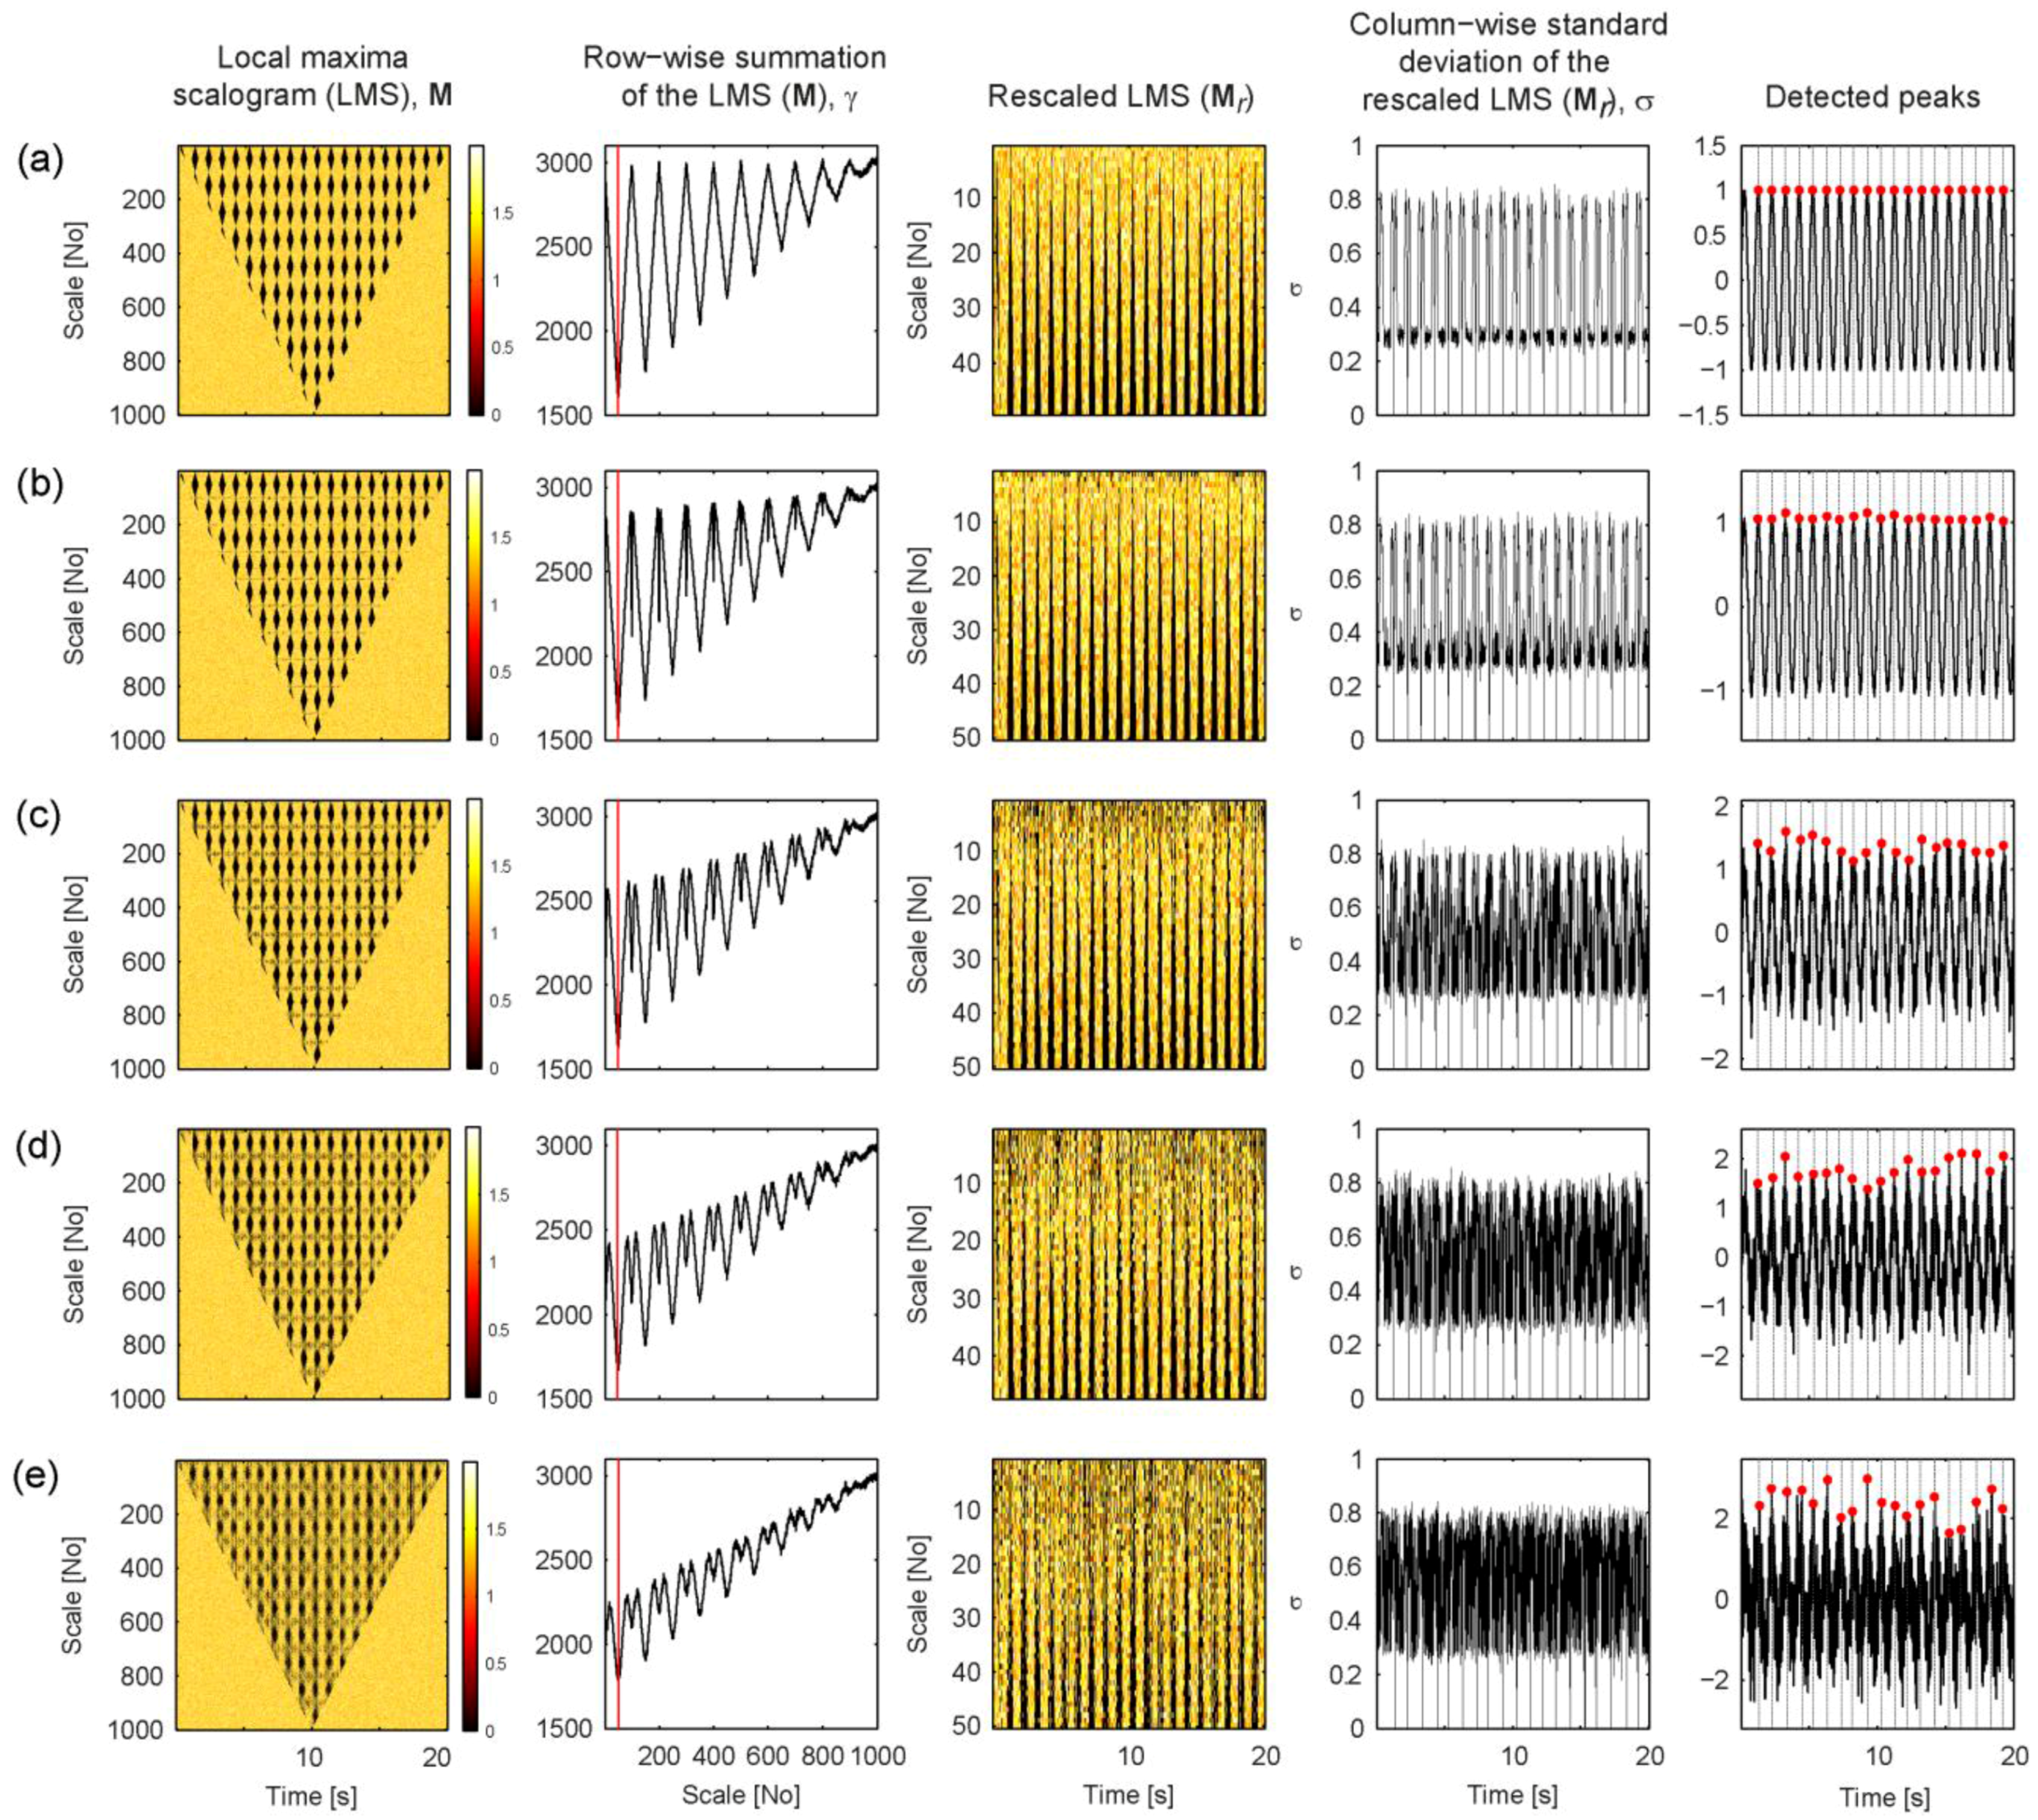
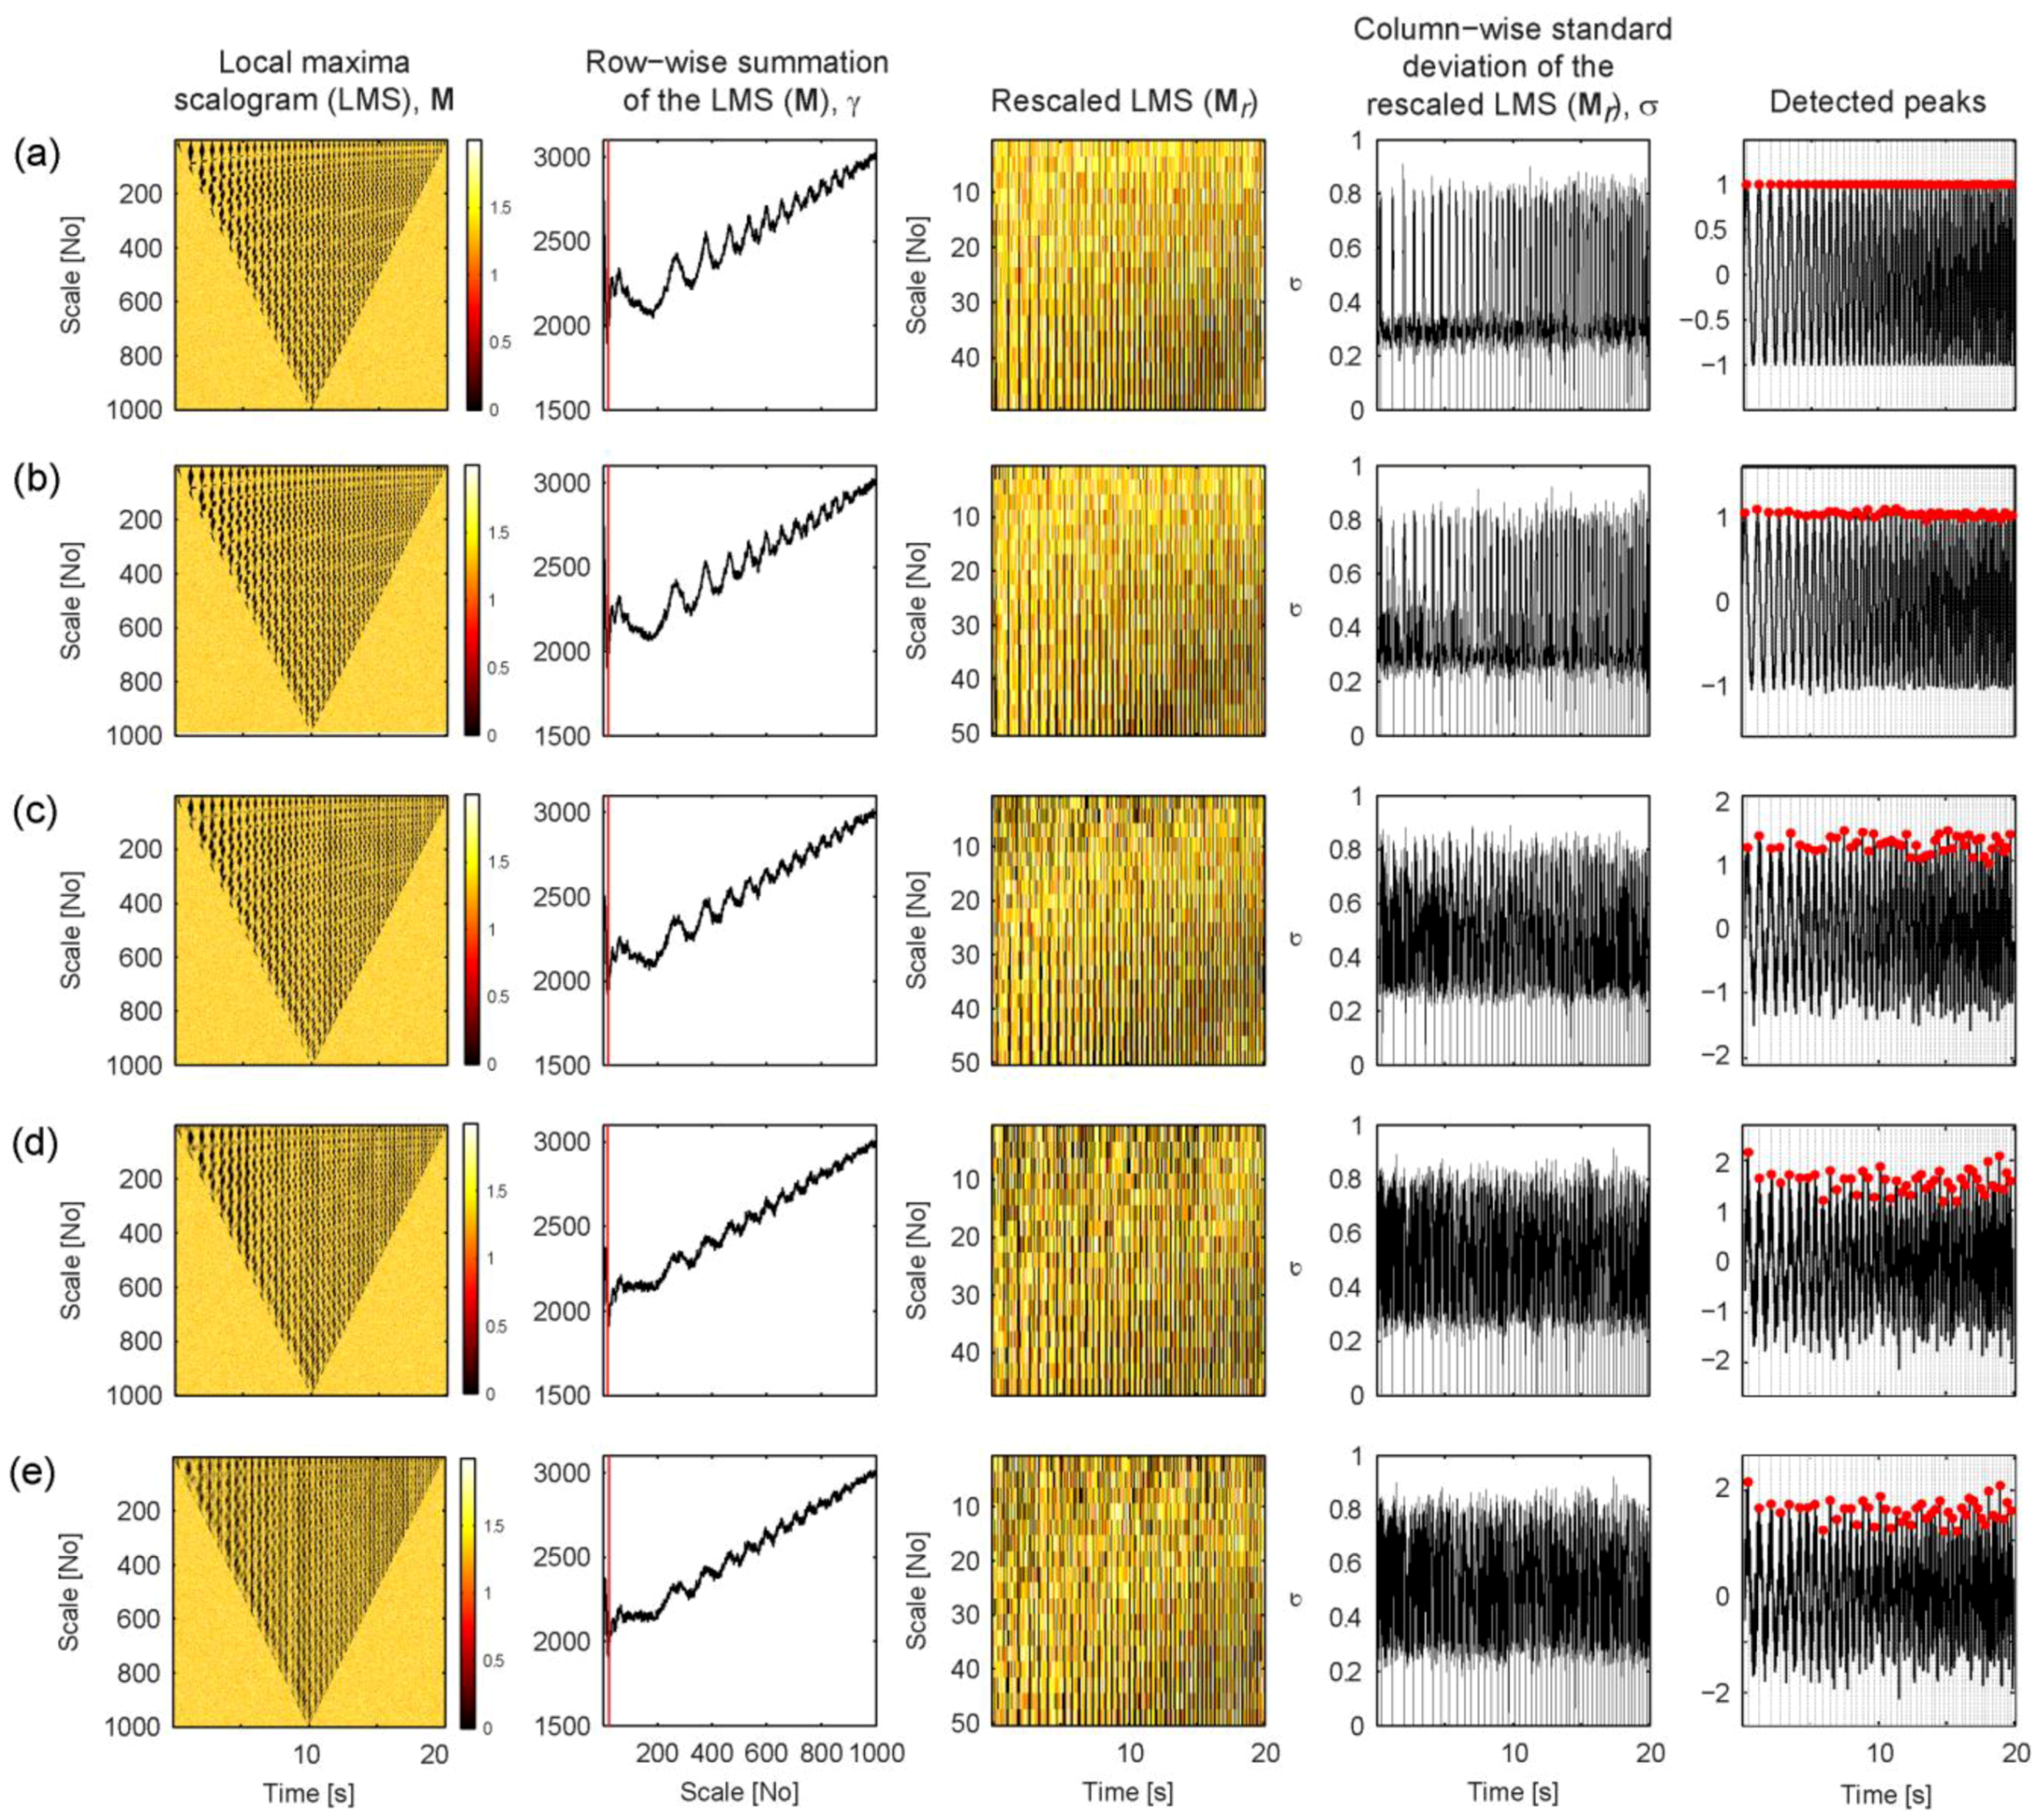
3. Validation


4. Application Examples
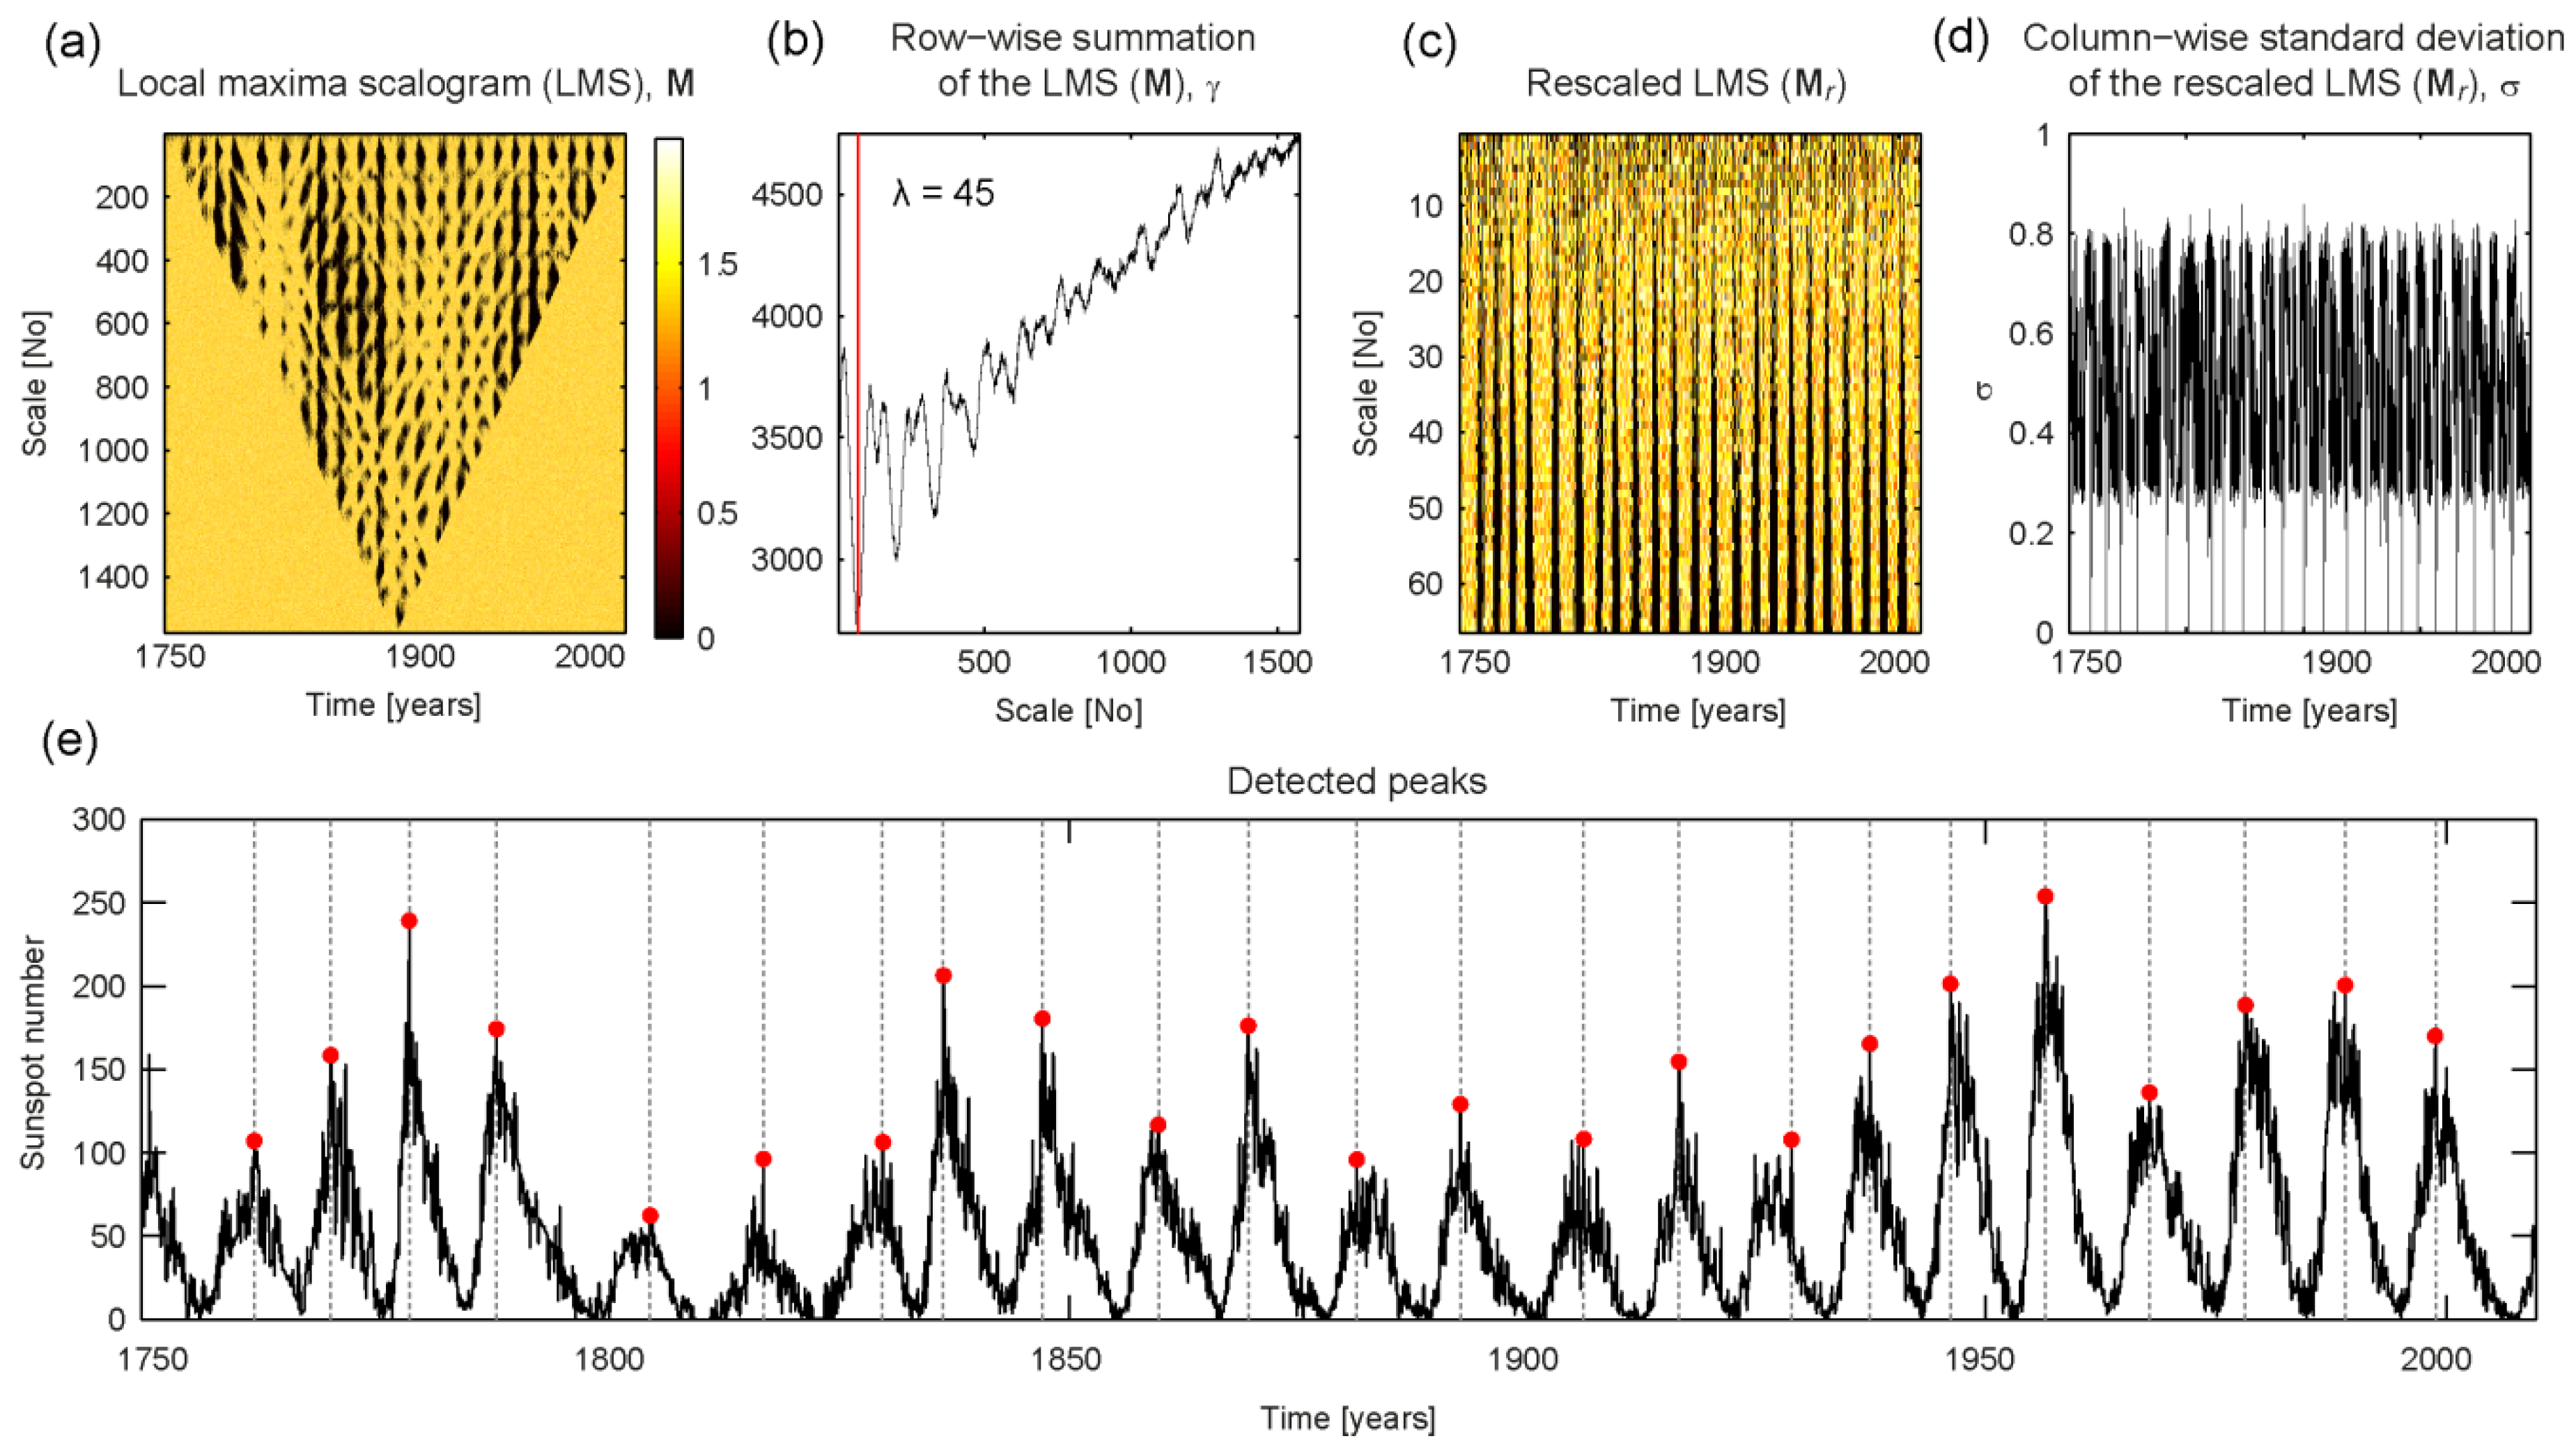
4.1. Sunspot Numbers
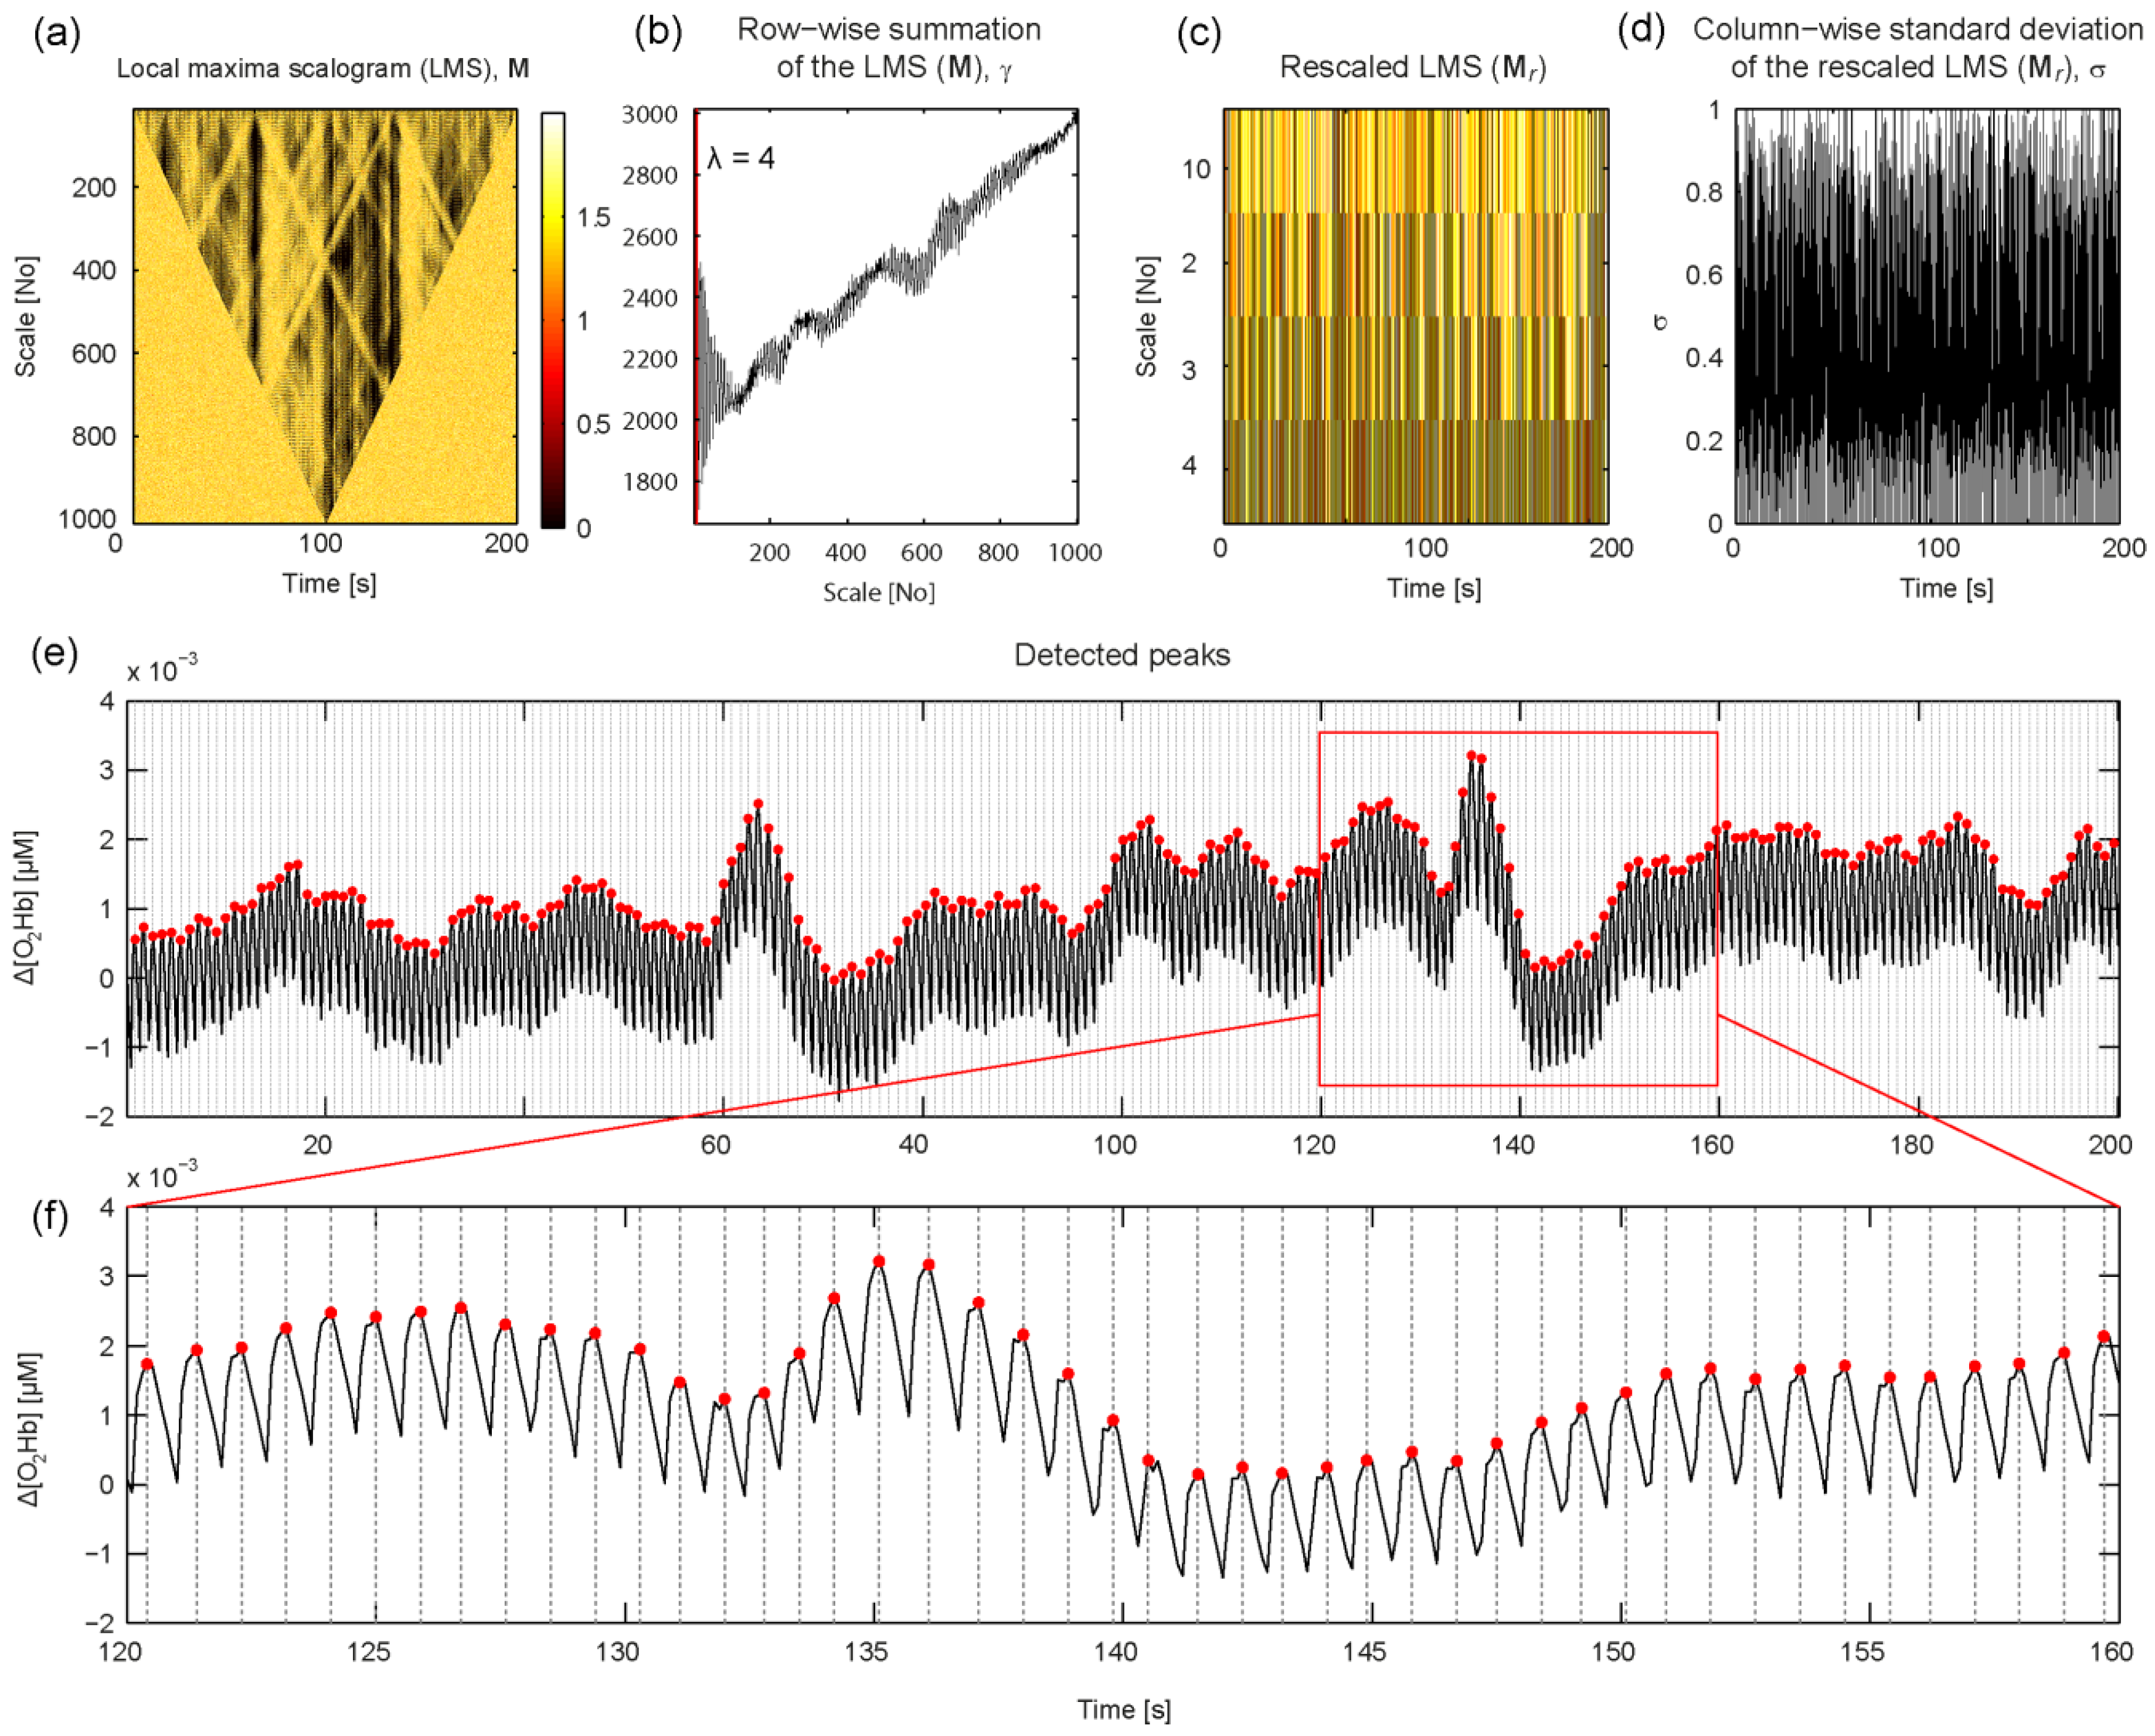
4.2. Blood Volume Pulse in fNIRS Signals

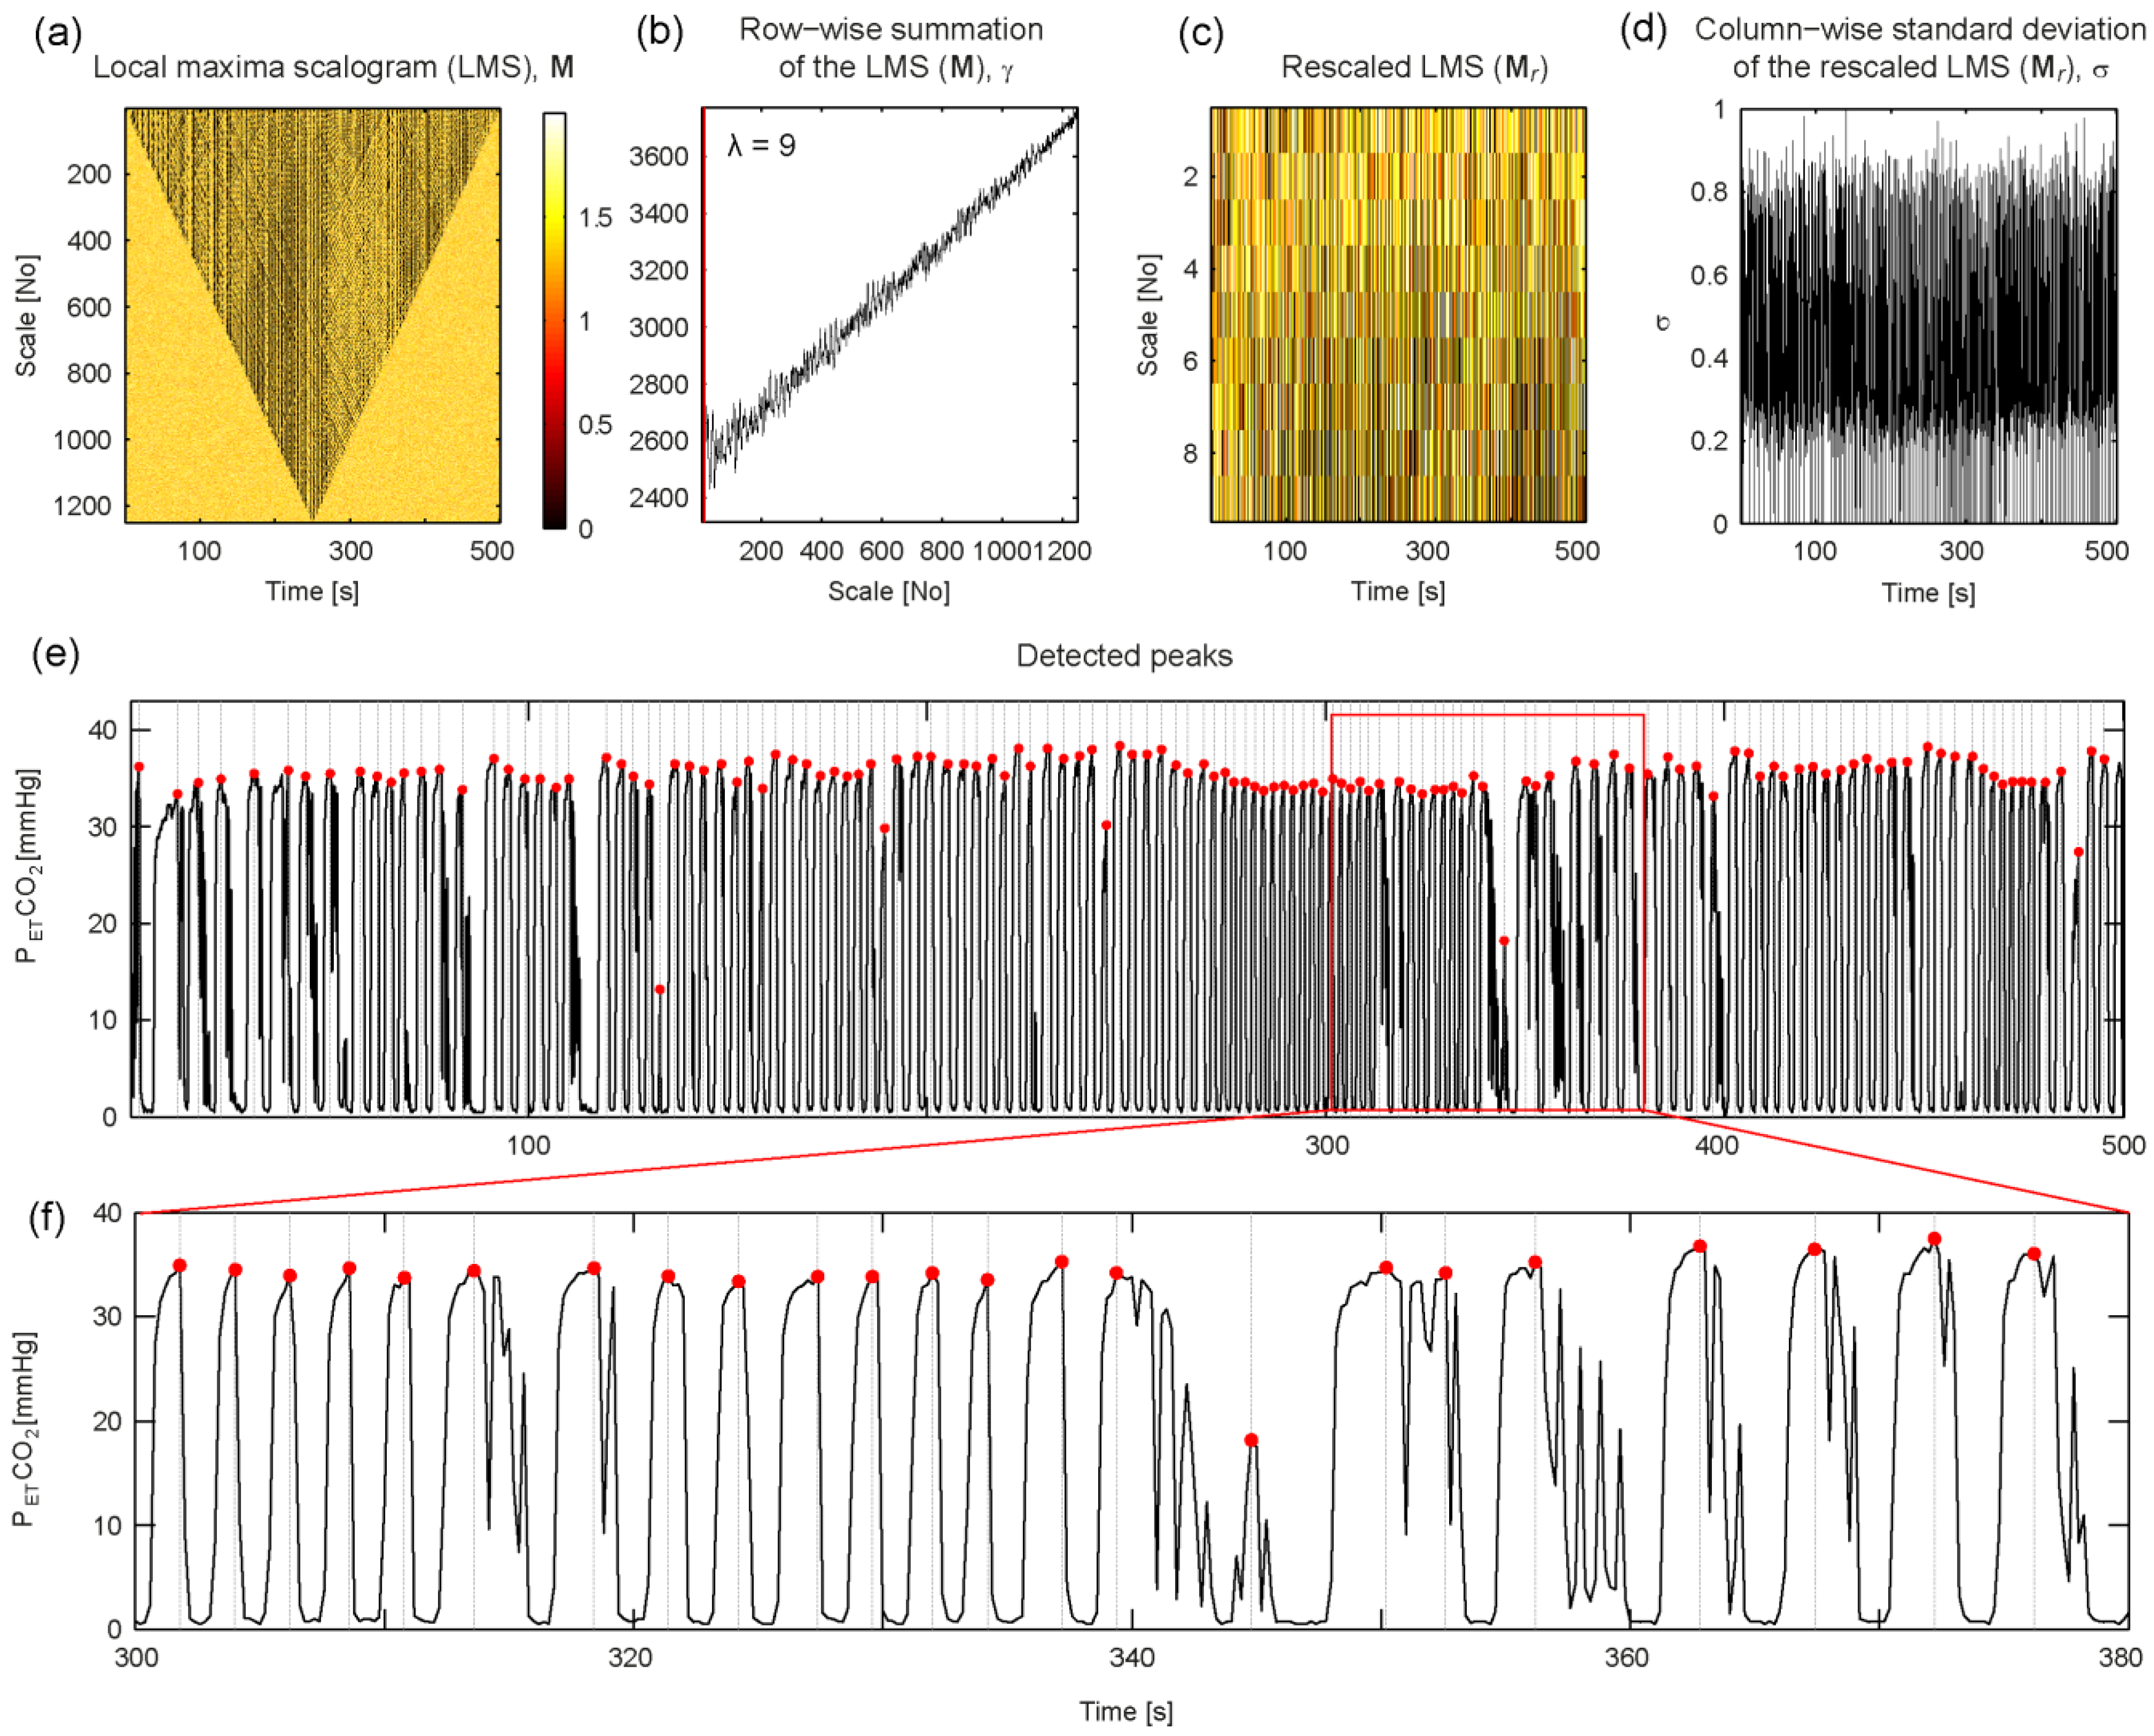
4.3. Maximum Concentration of Expired CO2

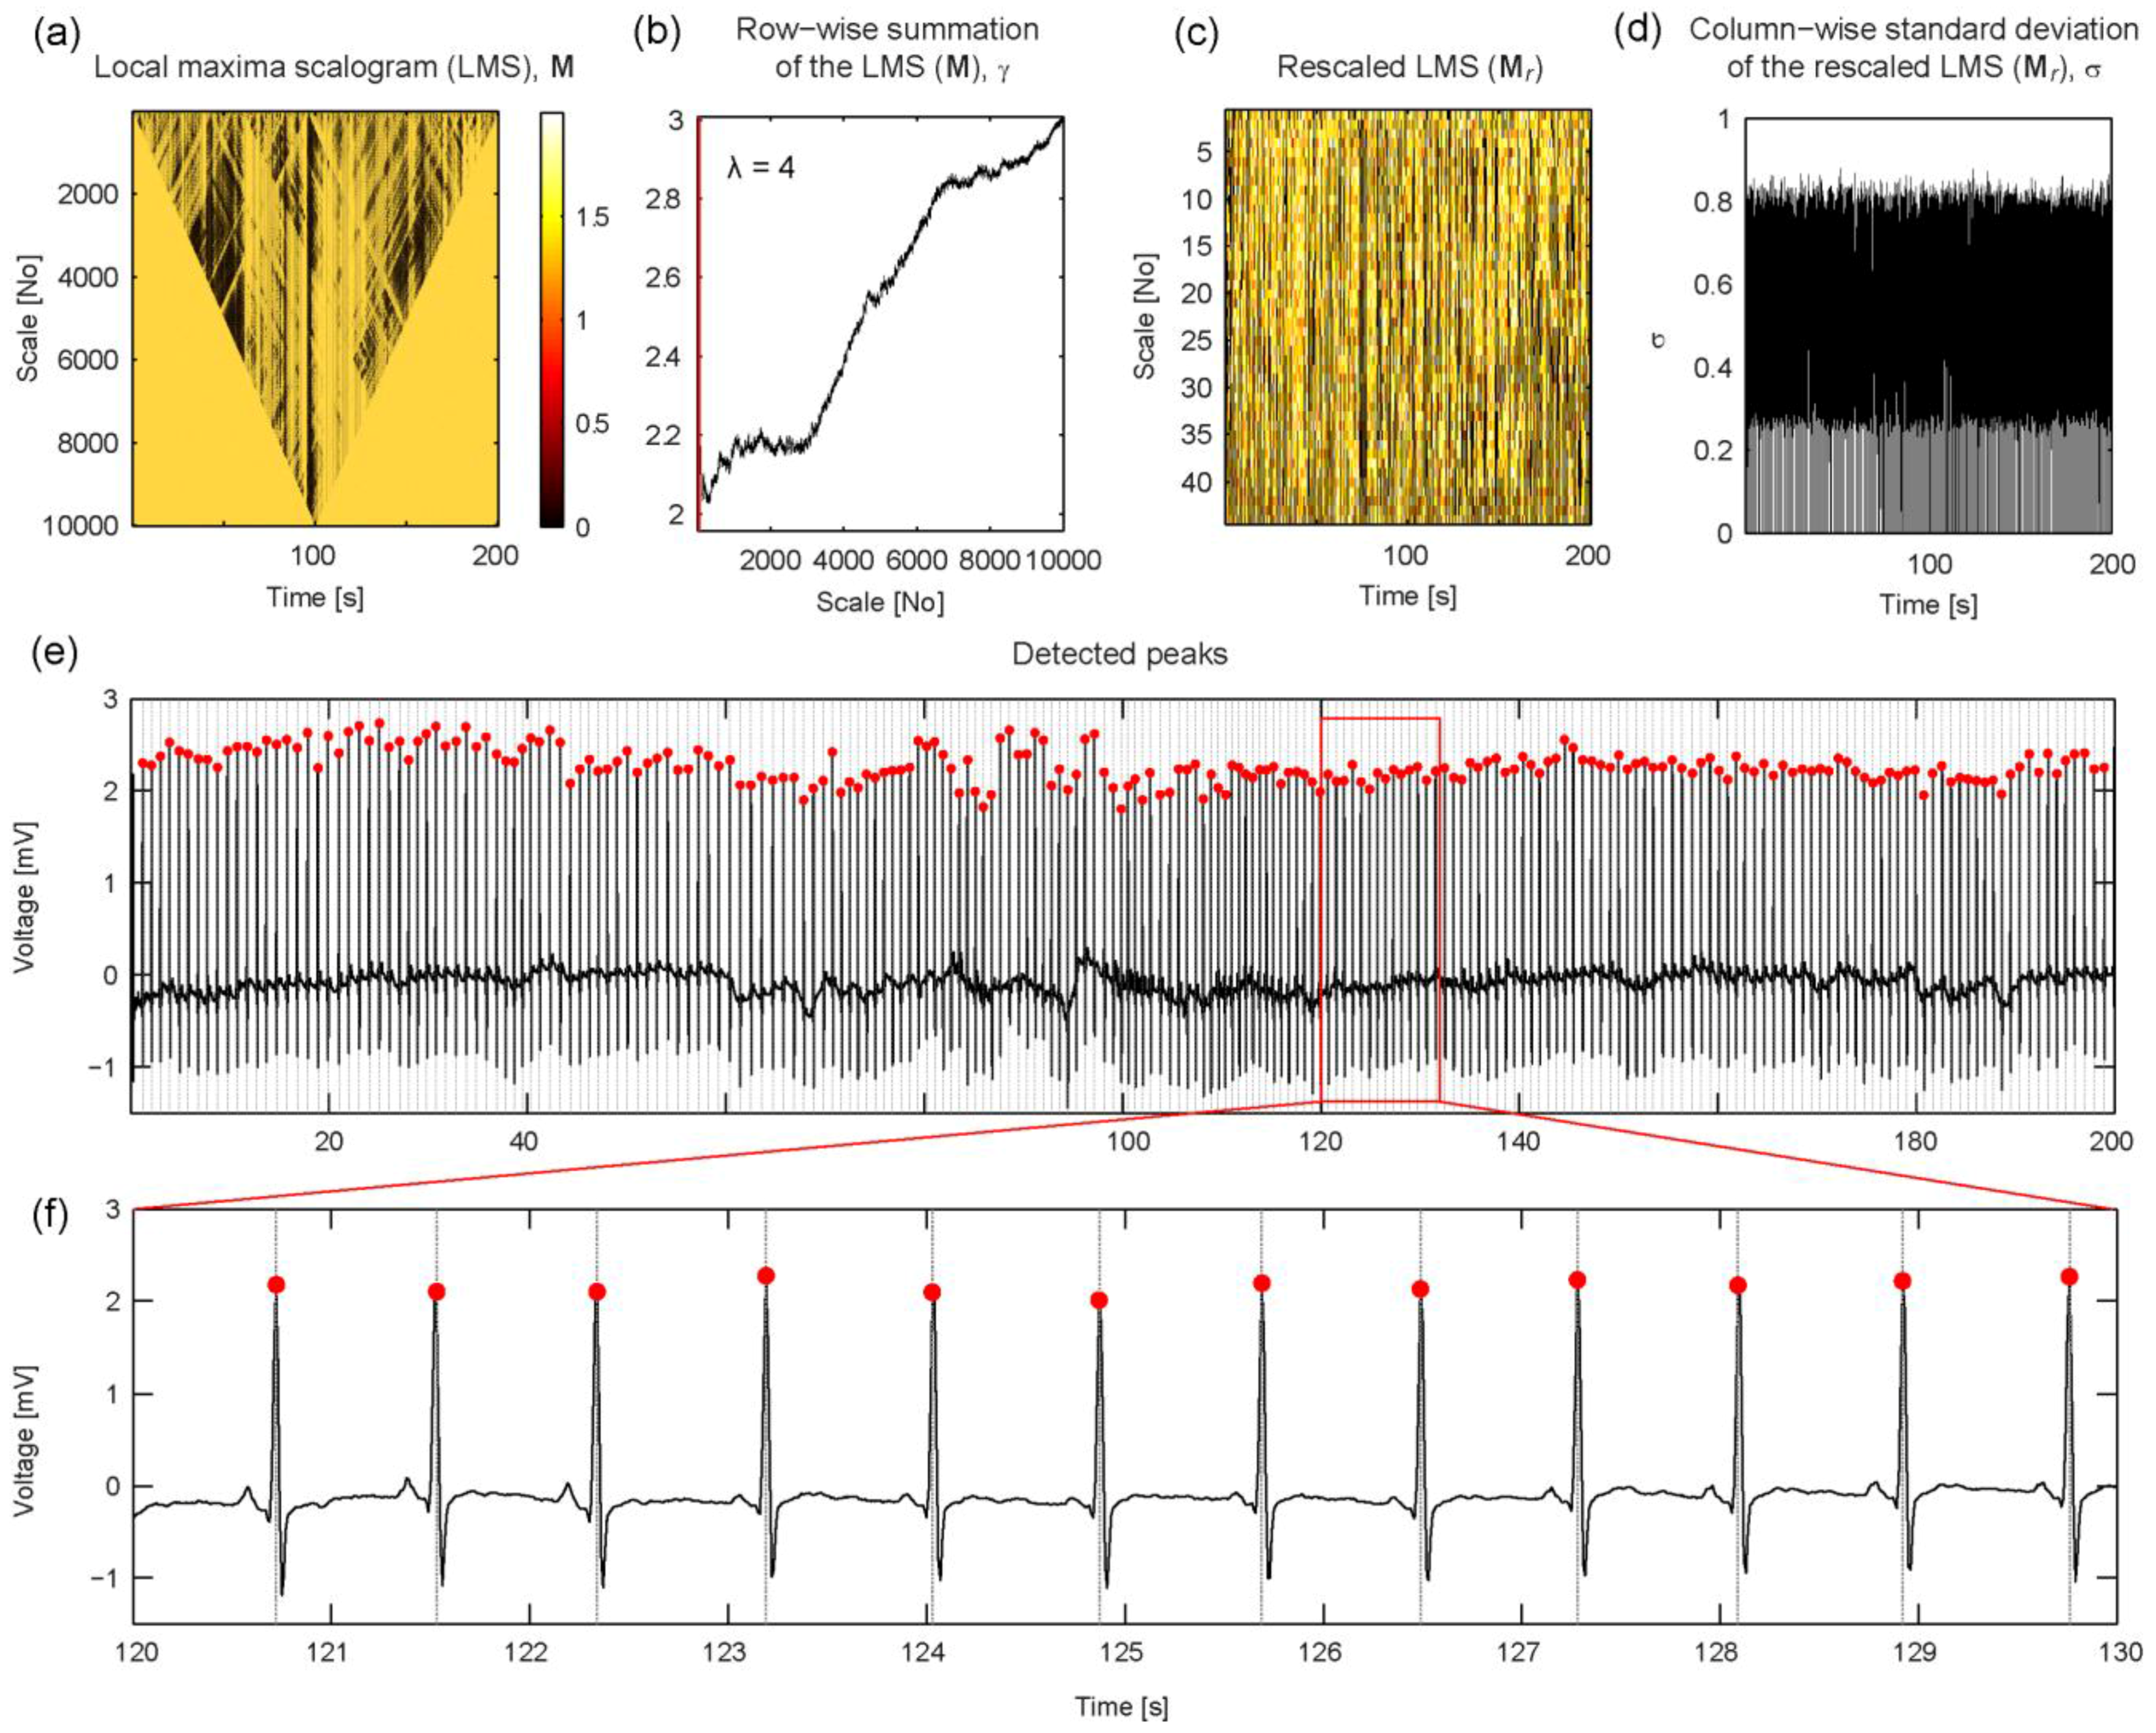
4.4. QRS Peaks in ECG Signals

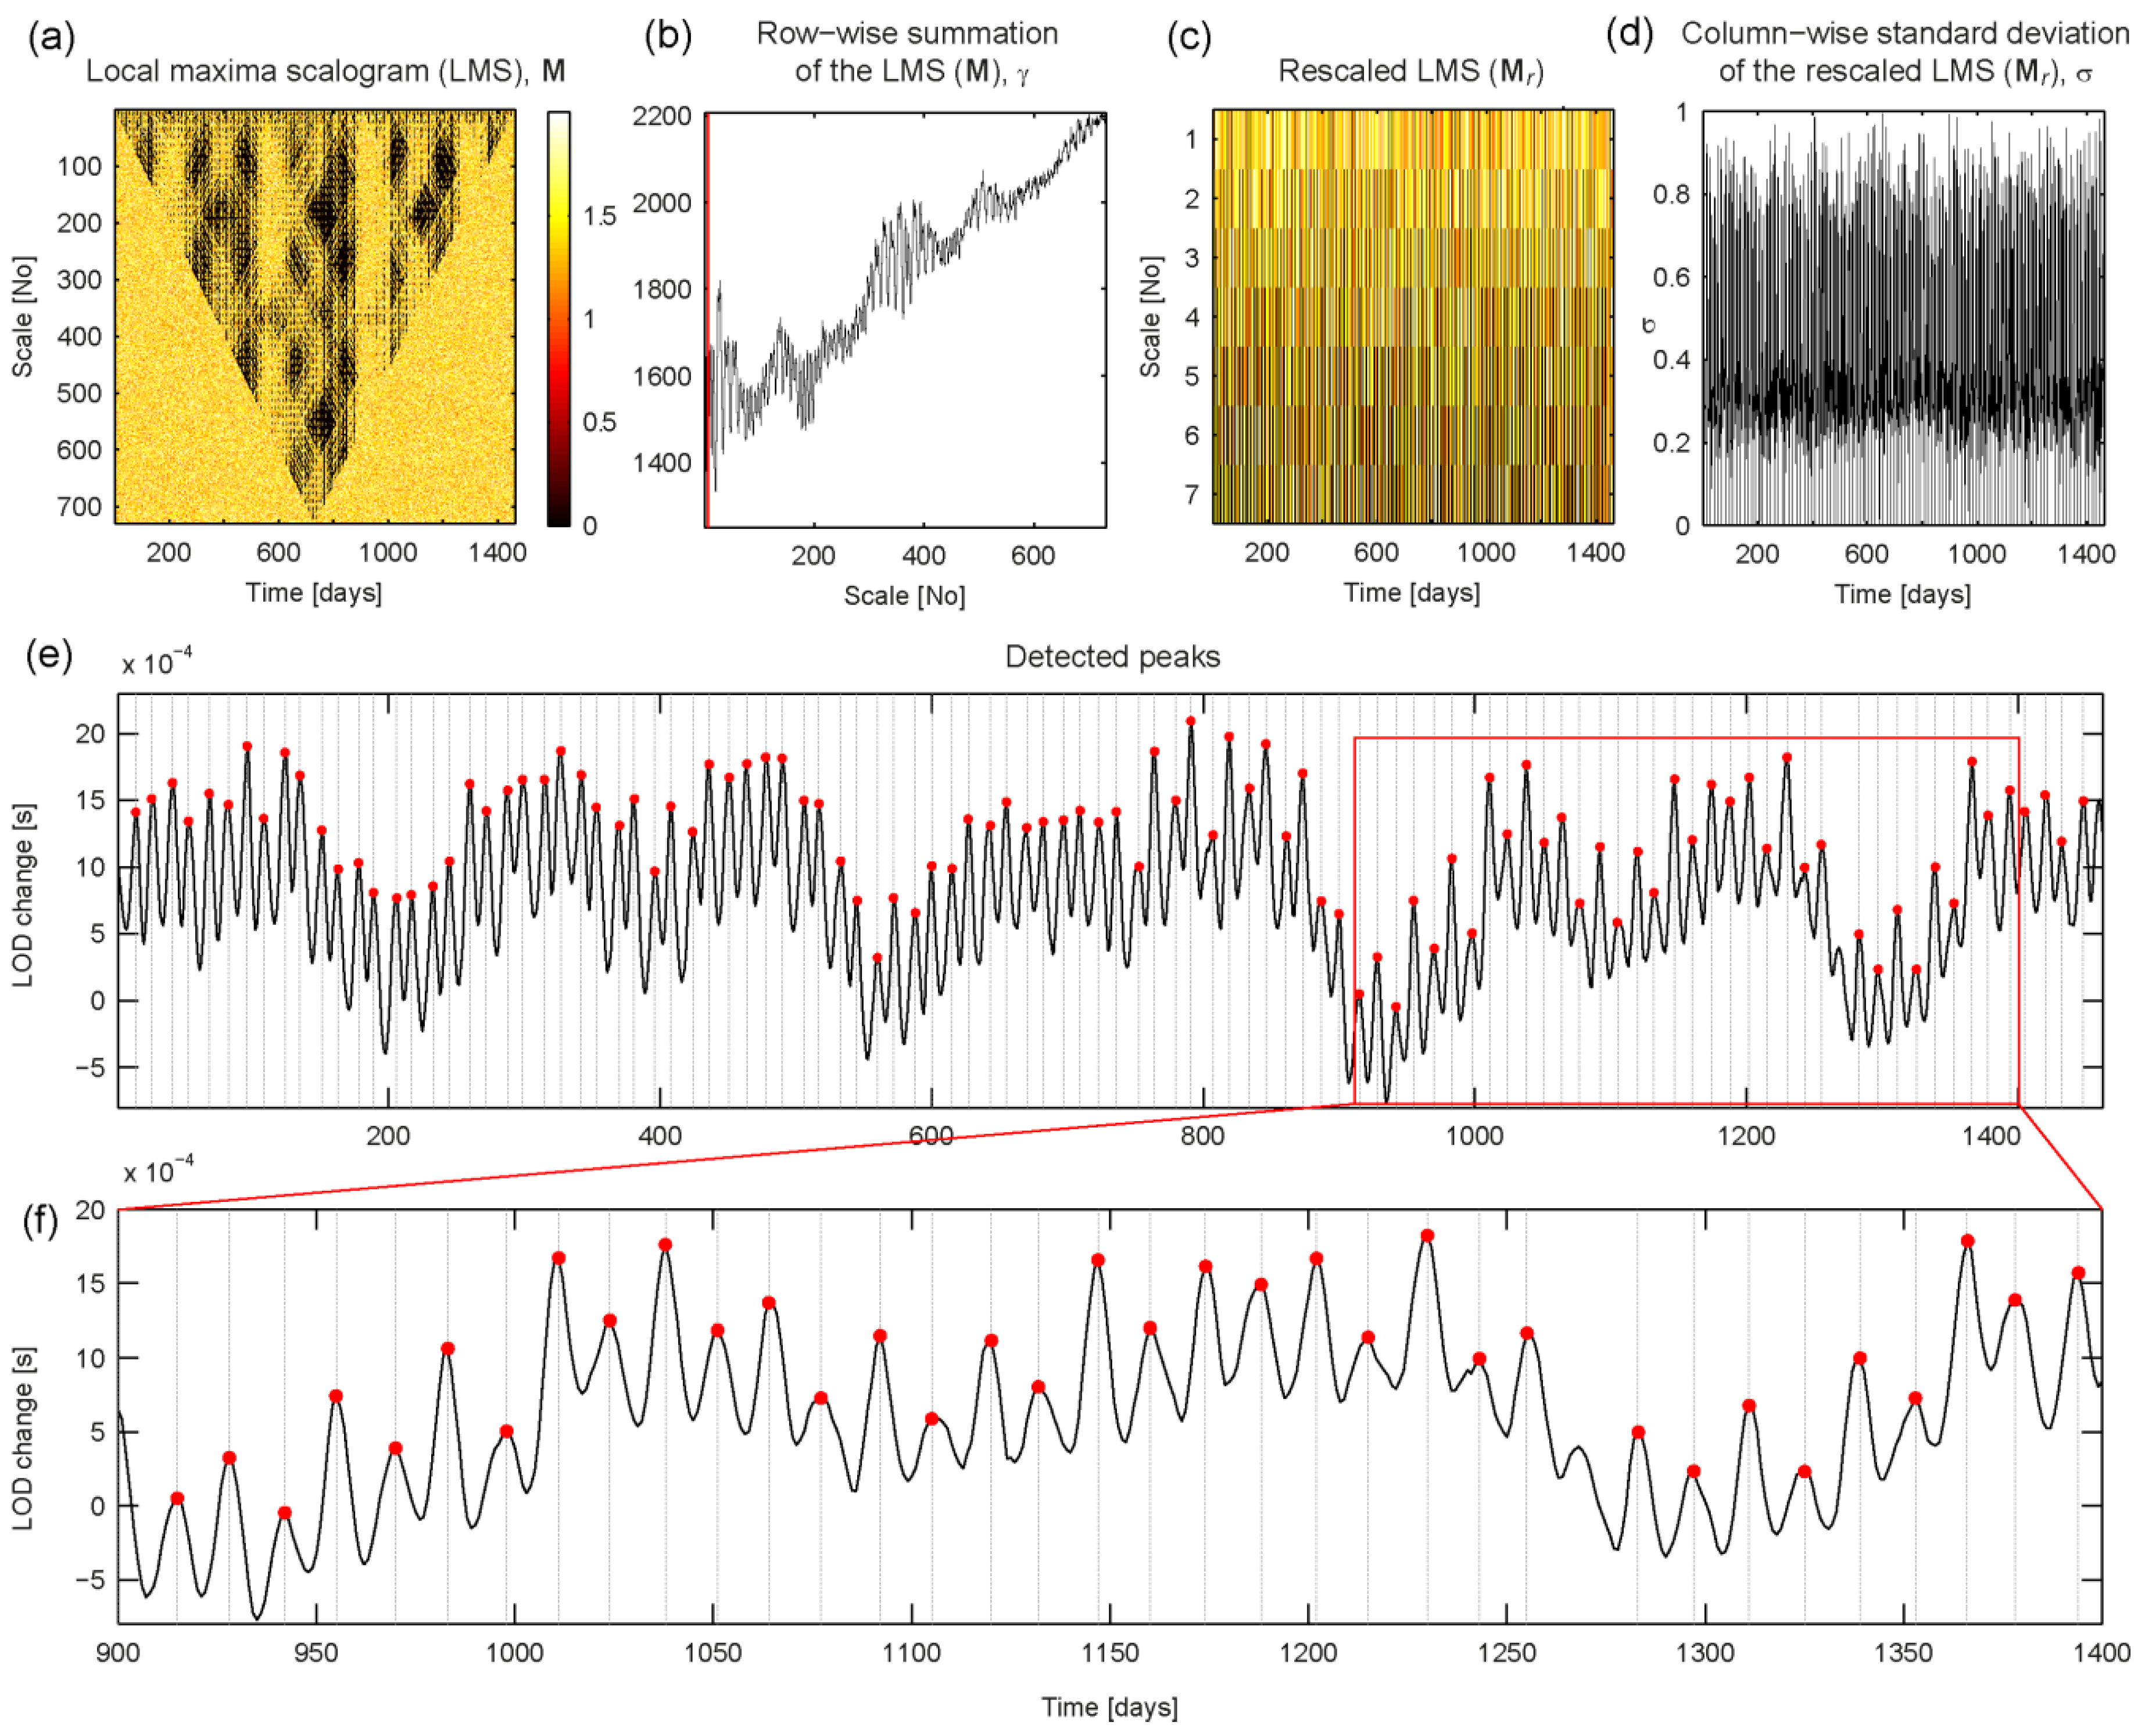
4.5. Peaks in the Variation of the Earth’s Length of Day due to Lunar Tidal Forcing

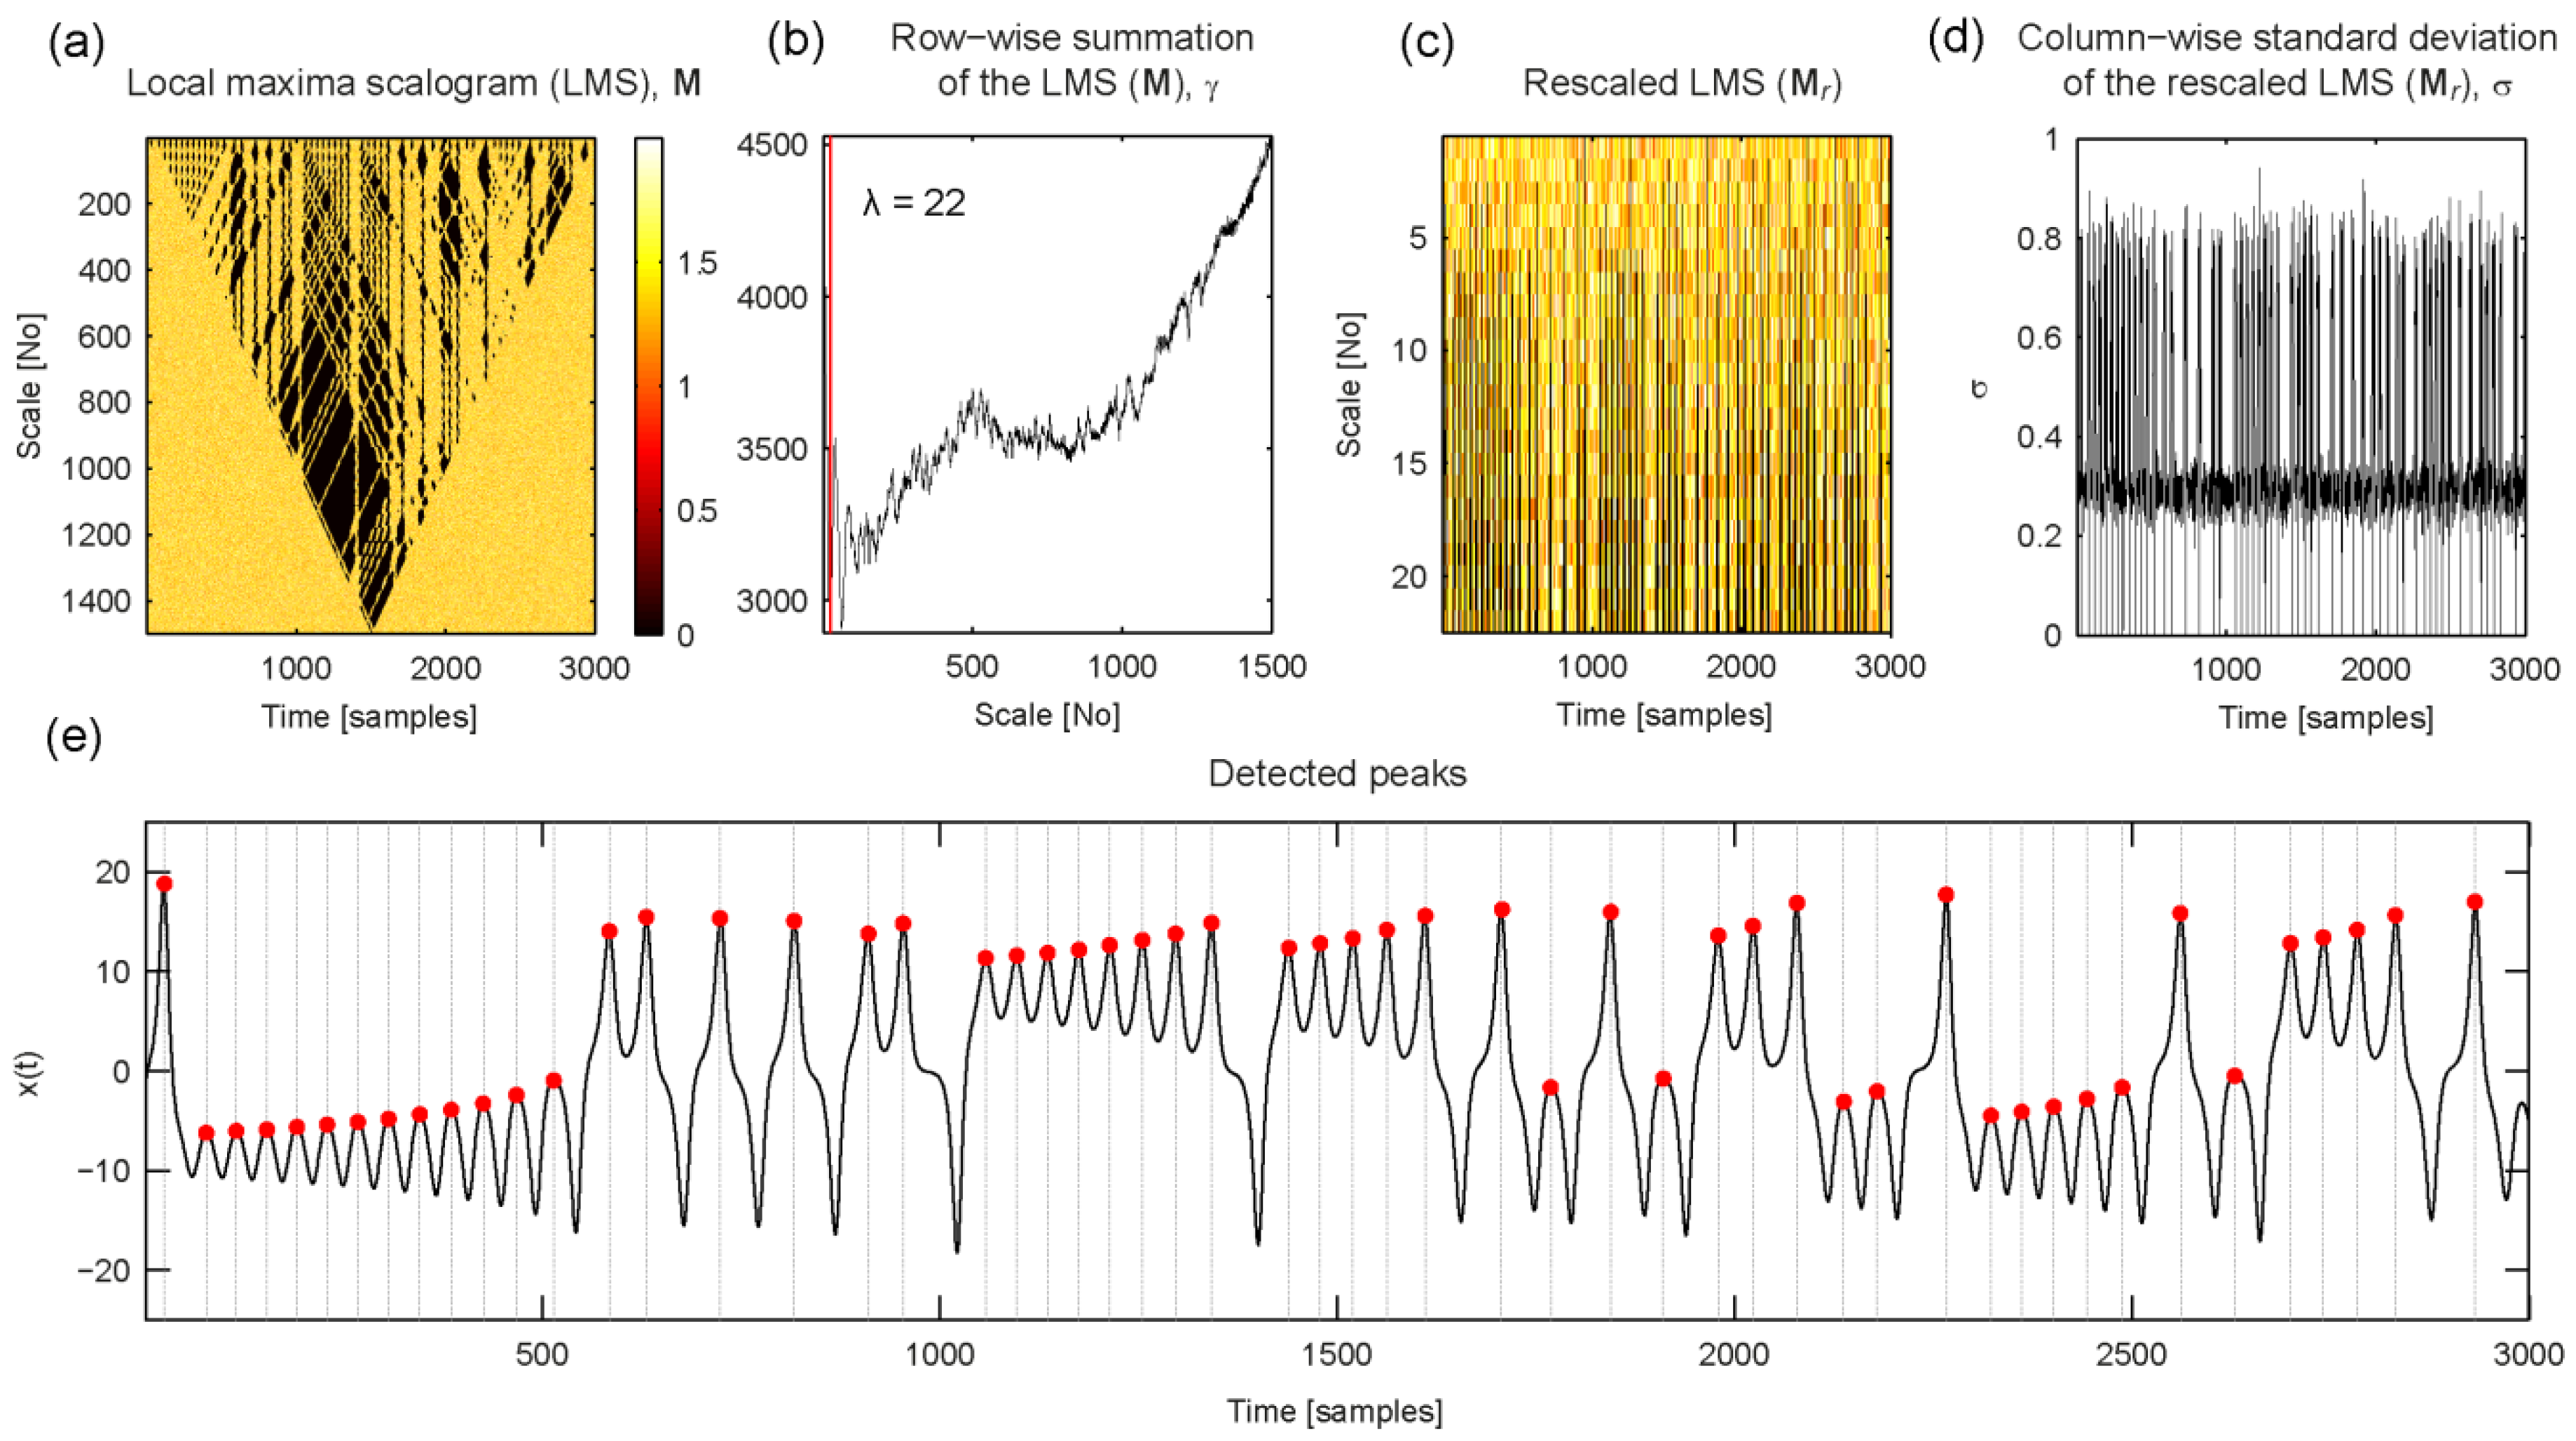
4.6. Chaos Theory: Lorenz System
5. Discussion and Conclusions
Acknowledgments
References
- Pan, J.; Tompkins, W.J. A real-time QRS detection algorithm. IEEE Trans. Biomed. Eng. 1985, 32, 230–236. [Google Scholar] [CrossRef] [PubMed]
- Jacobsen, A.L. Auto-Threshold peak detection in physiological signals. In Proceedings of the 23rd Annual International Conference of the IEEE, Al-Ain, United Arab Emirates; 2001; Volume 3, pp. 2194–2195. [Google Scholar]
- Vivó-Truyols, G.; Torres-Lapasió, J.R.; Van Nederkassel, A.M.; Vander Heyden, Y.; Massart, D.L. Automatic program for peak detection and deconvolution of multi-overlapped chromatographic signals part I: Peak detection. J. Chromatogr. A 2005, 1096, 133–145. [Google Scholar] [CrossRef] [PubMed]
- Excoffier, J.L.; Guichon, G. Automatic peak detection in chromatography. Chromatographia 1982, 15, 543–545. [Google Scholar] [CrossRef]
- Du, P.; Kibbe, W.A.; Lin, S.M. Improved peak detection in mass spectrum by incorporating continuous wavelet transform-based pattern matching. Bioinformatics 2006, 22, 2059–2065. [Google Scholar] [CrossRef] [PubMed]
- Coombes, K.R.; Tsavachidis, S.; Morris, J.S.; Baggerly, K.A.; Hung, M.C.; Kuerer, H.M. Improved peak detection and quantification of mass spectrometry data acquired from surface-enhanced laser desorption and ionization by denoising spectra with the undecimated discrete wavelet transform. Proteomics 2005, 5, 4107–4117. [Google Scholar] [CrossRef] [PubMed]
- Singh, O.; Sunkaria, R.K. A robust R-peak detection algorithm using wavelet packets. Int. J. Comput. Appl. 2011, 36, 37–43. [Google Scholar]
- Kadambe, S.; Murray, R.; Boudreaux-Bartels, G.F. Wavelet transform-based QRS complex detector. IEEE Trans. Biomed. Eng. 1999, 46, 838–848. [Google Scholar] [CrossRef] [PubMed]
- Nenadic, Z.; Burdick, J.W. Spike detection using the continuous wavelet transform. IEEE Trans. Biomed. Eng. 2005, 52, 74–87. [Google Scholar] [CrossRef] [PubMed]
- Li, C.; Zheng, C.; Tai, C. Detection of ECG characteristic points using wavelet transforms. IEEE Trans. Biomed. Eng. 1995, 42, 21–28. [Google Scholar] [PubMed]
- Gregoire, J.M.; Dale, D.; Van Dover, R.B. A wavelet transform algorithm for peak detection and application to powder X-ray diffraction data. Rev. Sci. Instrum. 2011, 82, 1–8. [Google Scholar] [CrossRef] [PubMed]
- Fard, P.J.; Moradi, M.H.; Tajvidi, M.R. A novel approach in R peak detection using Hybrid Complex Wavelet (HCW). Int. J. Cardiol. 2008, 124, 250–253. [Google Scholar] [CrossRef] [PubMed]
- Wee, A.; Grayden, D.B.; Zhu, Y.; Petrkovic-Duran, K.; Smith, D. A continuous wavelet transform algorithm for peak detection. Electrophoresis 2008, 29, 4215–4225. [Google Scholar] [CrossRef] [PubMed]
- Benitez, D.; Gaydecki, P.A.; Zaidi, A.; Fitzpatrick, A.P. The use of the Hilbert transform in ECG signal analysis. Comput. Biol. Med. 2001, 31, 399–406. [Google Scholar] [CrossRef]
- Rabbani, H.; Mahjoob, M.P.; Farahabadi, E.; Farahabadi, A. R peak detection in electrocardiogram signal based on an optimal combination of wavelet transform, Hilbert transform, and adaptive thresholding. J. Med. Signals Sens. 2011, 1, 91–98. [Google Scholar] [PubMed]
- Xue, Q.; Hu, Y.H.; Tompkins, W.J. Neural-Network-Based adaptive matched filtering for QRS detection. IEEE Trans. Biomed. Eng. 1992, 39, 317–329. [Google Scholar] [CrossRef] [PubMed]
- Vijaya, G.; Kumar, V.; Verma, H.K. ANN-Based QRS-complex analysis of ECG. J. Med. Eng. & Technol. 1998, 22, 160–167. [Google Scholar]
- Mtetwa, N.; Smith, L.S. Smoothing and thresholding in neuronal spike detection. Neurocomputing 2006, 69, 1366–1370. [Google Scholar] [CrossRef]
- Andreev, V.P.; Rejtar, T.; Chen, H.S.; Moskovets, E.V.; Ivanov, A.R.; Karger, B.L. A universal denoising and peak picking algorithm for LC-MS based on matched filtration in the chromatographic time domain. Anal. Chem. 2003, 75, 6314–6326. [Google Scholar] [CrossRef] [PubMed]
- Chen, Y.; Duan, H. A QRS complex detection algorithm based on mathematical morphology and envelope. In Proceedings of 27th Annual International Conference of the Engineering in Medicine and Biology Society, Shanghai, China, 2006; pp. 4654–4657.
- Zhang, F.; Lian, Y. QRS detection based on multiscale mathematical morphology for wearable ECG devices in body area networks. IEEE Trans. Biomed. Circuits Syst. 2009, 3, 220–228. [Google Scholar] [CrossRef] [PubMed]
- Zhang, F.; Lian, Y. QRS detection based on morphological filter and energy envelope for applications in body sensor networks. J. Signal Proc. Syst. 2011, 64, 187–194. [Google Scholar] [CrossRef]
- Sun, Y.; Suppappola, S.; Wrublewski, T.A. Microcontroller-Based real-time QRS detection. Biomed. Instrum. & Technol. 1992, 26, 477–484. [Google Scholar]
- Ferdi, Y.; Herbeuval, J.P.; Charaf, A.; Boucheham, B. R wave detection using fractional digital differentiation. ITBM-RBM 2003, 24, 273–280. [Google Scholar] [CrossRef]
- Aboy, M.; McNames, J.; Thong, T.; Tsunami, D.; Ellenby, M.S.; Goldstein, B. An automatic beat detection algorithm for pressure signals. IEEE Trans. Biomed. Eng. 2005, 52, 1662–1670. [Google Scholar] [CrossRef] [PubMed]
- Shim, B.; Min, H.; Yoon, S. Nonlinear preprocessing method for detecting peaks from gas chromatograms. BMC Bioinf. 2009. [Google Scholar] [CrossRef] [PubMed]
- Tzallas, A.T.; Oikonomou, V.P.; Fotiadis, D.I. Epileptic spike detection using a Kalman filter based approach. In Proceedings of the 28th IEEE EMBS Annual International Conference, New York, NY, USA, 2006; pp. 501–504.
- Nguyen, N.; Huang, H.; Oraintara, S.; Vo, A. Peak detection in mass spectrometry by Gabor filters and envelope analysis. J. Bioinf. Comput. Biol. 2009, 7, 547–569. [Google Scholar] [CrossRef]
- Fredriksson, M.J.; Petersson, P.; Axelsson, B.O.; Bylund, D. An automatic peak finding method for LC-MS data using Gaussian second derivative filtering. J. Seperation Sci. 2009, 32, 3906–3918. [Google Scholar] [CrossRef] [PubMed]
- Lin, K.-P. QRS feature extraction using linear prediction. IEEE Trans. Biomed. Eng. 1989, 36, 1050–1055. [Google Scholar] [PubMed]
- Panoulas, K.I.; Hadjileontiadis, L.J.; Pasa, S.M. Enhancement of R-wave detection in ECG data analysis using higher-order statistics. In Proceedings of the 23rd Annual International Conference of the IEEE, Thessaloniki, Greece, 2001; Volume 1, pp. 344–347.
- Mehta, S.S.; Sheta, D.A.; Lingayat, N.S.; Chouhan, V.S. K-Means algorithm for the detection and delineation of QRS-complexes in electrocardiogram. IRBM 2010, 31, 48–54. [Google Scholar] [CrossRef]
- Sharma, S.; Mehta, S.S.; Mehta, H. Development of derivative based algorithm for the detection of QRS-complexes in single lead electrocardiogram using FCM. IJCA 2011, 4, 19–23. [Google Scholar]
- Slimane, Z.-E.H.; Nait-Ali, A. QRS complex detection using Empirical Mode Decomposition. Digit. Signal Proc. 2010, 20, 1221–1228. [Google Scholar] [CrossRef]
- Coast, D.A.; Stern, R.M.; Cano, G.G.; Briller, S.A. An approach to cardiac arrhythmia analysis using hidden Markov models. IEEE Trans. Biomed. Eng. 1990, 37, 826–836. [Google Scholar] [CrossRef] [PubMed]
- Palshikar, G. Simple algorithms for peak detection in time-series. In Proceedings of 1st IIMA International Conference on Advanced Data Analysis, Business Analytics and Intelligence, Ahmedabad, India, 2009.
- Harmer, K.; Howells, G.; Sheng, W.; Fairhurst, M.; Deravi, F. A peak-trough detection algorithm based on momentum. In Proceedings of the International Congress on Image and Signal Processing CISP ’08, Sanya, Hainan, China, 2008; Volume 4, pp. 454–458.
- Sezan, M.I. A peak detection algorithm and its application to histogram-based image data reduction. Comput Vis. Graph. Image Proc. 1990, 49, 36–51. [Google Scholar] [CrossRef]
- Jarman, K.H.; Daly, D.S.; Anderson, K.K.; Wahl, K.L. A new approach to automated peak detection. Chemom. Intell. Lab. Syst. 2003, 69, 61–76. [Google Scholar] [CrossRef]
- Deng, H.; Xiang, B.; Liao, X.; Xie, S. A linear modulation-based stochastic resonance algorithm applied to the detection of weak chromatographic peaks. Anal. Bioanal. Chem. 2006, 386, 2199–2205. [Google Scholar] [CrossRef] [PubMed]
- Mukhopadhyay, S.; Ray, G.C. A new interpretation of nonlinear energy operator and its efficacy in spike detection. IEEE Trans. Biomed. Eng. 1998, 45, 180–187. [Google Scholar] [CrossRef] [PubMed]
- Solanki, S.K. Sunspots: An overview. Astron. Astrophys. Rev. 2003, 11, 153–286. [Google Scholar] [CrossRef]
- Solar Influences Data Analysis Center (SIDC) of the Royal Observatory of Belgium. Available online: http://sidc.oma.be/DATA/monthssn.dat (accessed on 22 May 2012).
- Mansouri, C.; Kashou, N.H. New window on optical brain imaging; medical development, simulations and applications. In Selected Topics on Optical Fiber Technology; Yasin, M., Harun, S.W., Arof, H., Eds.; InTech: Rijeka, Croatia, 2012; pp. 271–288. [Google Scholar]
- Wolf, M.; Ferrari, M.; Quaresima, V. Progress of near-infrared spectroscopy and topography for brain and muscle clinical applications. J. Biomed. Opt. 2007. [Google Scholar] [CrossRef]
- Ferrari, M.; Quaresima, V. A brief review on the history of human functional near-infrared spectroscopy (fNIRS) development and fields of application. Neuroimage 2012, 63, 921–935. [Google Scholar] [CrossRef] [PubMed]
- Morren, G.; Wolf, M.; Lemmerling, P.; Wolf, U.; Choi, J.H.; Gratton, E.; De Lathauwer, L.; Van Huffel, S. Detection of fast neuronal signals in the motor cortex from functional near infrared spectroscopy measurements using independent component analysis. Med. Biol. Eng. Comput. 2004, 42, 92–99. [Google Scholar] [CrossRef] [PubMed]
- Steinbrink, J.; Kempf, F.C.D.; Villringer, A.; Obrig, H. The fast optical signal—robust or elusive when non-invasively measured in the human adult? Neuroimage 2005, 26, 996–1008. [Google Scholar] [CrossRef] [PubMed]
- Trajkovic, I.; Scholkmann, F.; Wolf, M. Estimating and validating the interbeat intervals of the heart using near-infrared spectroscopy on the human forehead. J. Biomed. Opt. 2011. [Google Scholar] [CrossRef] [PubMed] [Green Version]
- Haensse, D.; Szabo, P.; Brown, D.; Fauchere, J.C.; Niederer, P.; Bucher, H.U.; Wolf, M. A new multichannel near-infrared spectro-photometry system for functional studies of the brain of adults and neonates. Opt. Express 2005, 13, 4525–4538. [Google Scholar] [CrossRef] [PubMed]
- Bhavani-Shankar, K.; Moseley, H.; Kumar, A.Y.; Delph, Y. Capnometry and anaesthesia. Can. J. Anesth. 1992, 39, 617–632. [Google Scholar] [CrossRef] [PubMed]
- Rajendra Acharya, U.; Paul Joseph, K.; Kannathal, N.; Lim, C.M.; Suri, J.S. Heart rate variability: A review. Med. Biol. Eng. Comput. 2004, 44, 1031–1051. [Google Scholar] [CrossRef] [PubMed]
- Wahr, J.M. The earth’s rotation. Ann. Rev. Earth Planet. Sci. 1988, 16, 231–249. [Google Scholar] [CrossRef]
- Li, G. 27.3-day and 13.6-day atmospheric tide and lunar forcing on atmospheric circulation. Adv. Atmos. Sci. 2005, 22, 359–374. [Google Scholar]
- International Earth Rotation and Reference Service (IERS). Available online: http://www.iers.org, used data file: EOP 08 C04 series for 1862-2012 (IAU2000) (accessed on 29 May 2012).
- Bellanger, E.; Blanter, E.M.; Le Mouël, J.-L.; Shnirman, M.G. Estimation of the 13.63-day lunar tide effect on length of day. J. Geophys. Res. 2002, 107, 2102. [Google Scholar] [CrossRef]
- Lorenz, E.N. Deterministic nonperiodic flow. J. Atmos. Sci. 1963, 20, 130–148. [Google Scholar] [CrossRef]
- Saltzman, B. Finite amplitude free convection as an initial value problem—1. J. Atmos. Sci. 1962, 19, 329–341. [Google Scholar] [CrossRef]
© 2012 by the authors; licensee MDPI, Basel, Switzerland. This article is an open access article distributed under the terms and conditions of the Creative Commons Attribution license (http://creativecommons.org/licenses/by/3.0/).
Share and Cite
Scholkmann, F.; Boss, J.; Wolf, M. An Efficient Algorithm for Automatic Peak Detection in Noisy Periodic and Quasi-Periodic Signals. Algorithms 2012, 5, 588-603. https://doi.org/10.3390/a5040588
Scholkmann F, Boss J, Wolf M. An Efficient Algorithm for Automatic Peak Detection in Noisy Periodic and Quasi-Periodic Signals. Algorithms. 2012; 5(4):588-603. https://doi.org/10.3390/a5040588
Chicago/Turabian StyleScholkmann, Felix, Jens Boss, and Martin Wolf. 2012. "An Efficient Algorithm for Automatic Peak Detection in Noisy Periodic and Quasi-Periodic Signals" Algorithms 5, no. 4: 588-603. https://doi.org/10.3390/a5040588