Mathematical Description of the Fuzzy Harmony Search (FHS) Algorithm
The mathematical description for FHS is defined as follows: Equation (1) shows the fundamental part of the traditional HS algorithm; where the harmony memory accepting (HMR) is represented by a constant value. Equation (2) shows the fundamental part of the traditional HS algorithm, where the pitch adjusting (PArate) is represented by a constant value. Equations (1) and (2) describe the different ways the basic equations of HS are modified for achieving the goal, and then, convert part of it into fuzzy parameters. The differences between both equations are that HMR in Equation (1) and PArate in Equation (2) are those that change, because an essential part of the proposed method lies in these two parameters. Traditionally, these two parameters are constant; in this case, due to the importance of these two parameters, they are converted into fuzzy parameters. Therefore, for designing the fuzzy systems, which dynamically adjust the HMR and PArate parameters, the measure of percentage of iterations is considered as the input. All the fuzzy systems are of Mamdani type because it is more common to use them in this type of fuzzy control and the defuzzification method is the centroid. In this case, this type of defuzzification was used because other researchers have achieved good results with this method.
In this case, these values are considered fuzzy because they are changing dynamically when the FHS is running, and are defined by Equations (4) and (5), where
HMR and
PArate are changing values in the range [0,1].
where
HMR is the harmony memory accepting rate;
is the number of rules of the fuzzy system corresponding to
hmr;
is the output result for rule
i corresponding to
hmr;
is the membership function of rule
i corresponding to
hmr.
where
PArate is the pitch adjusting;
is the number of rules of the fuzzy system corresponding to
PArate;
is the output result for rule
i corresponding to
PArate;
is the membership function of rule
i corresponding to
PArate.
Fuzzy logic is based on fuzzy set theory proposed by Zadeh in 1965, which helps us in modeling knowledge, through the use of if-then fuzzy rules. The fuzzy set theory provides a systematic calculus to deal with linguistic information, and that improves the numerical computation by using linguistic labels stipulated by membership functions [
19,
20].
The parameters of HMR and PArate are selected to be modified using fuzzy logic, since these parameters account for controlling the exploitation and exploration of the search domain. The HMR and PArate parameters in the HS algorithm are very important to fine-tuning the optimized solution vectors, and can be potentially useful in adjusting the convergence rate of the algorithm to find the optimal solution Therefore, the adjustment of these parameters is of great interest.
There are three variants of the algorithm that have been applied to achieve better results and they are briefly explained in the following: The improved harmony search algorithm (IHS) [
13] is a novel method for generating new solution vectors that enhance accuracy and convergence rate of harmony search (HS) algorithm; the global best harmony search (GHS) [
24] is proposed in this paper where concepts from swarm intelligence are borrowed to enhance the performance of HS; and the new global harmony search (NGHS) [
25] is a proposed new algorithm that includes two important operations—position updating and genetic mutation with a small probability. The former enables the worst harmony of the harmony memory to move to the global best harmony rapidly in each iteration, and the latter can effectively prevent the NGHS from trapping into the local optimum. It should be noted that none of these methods use fuzzy logic techniques to achieve their goals.
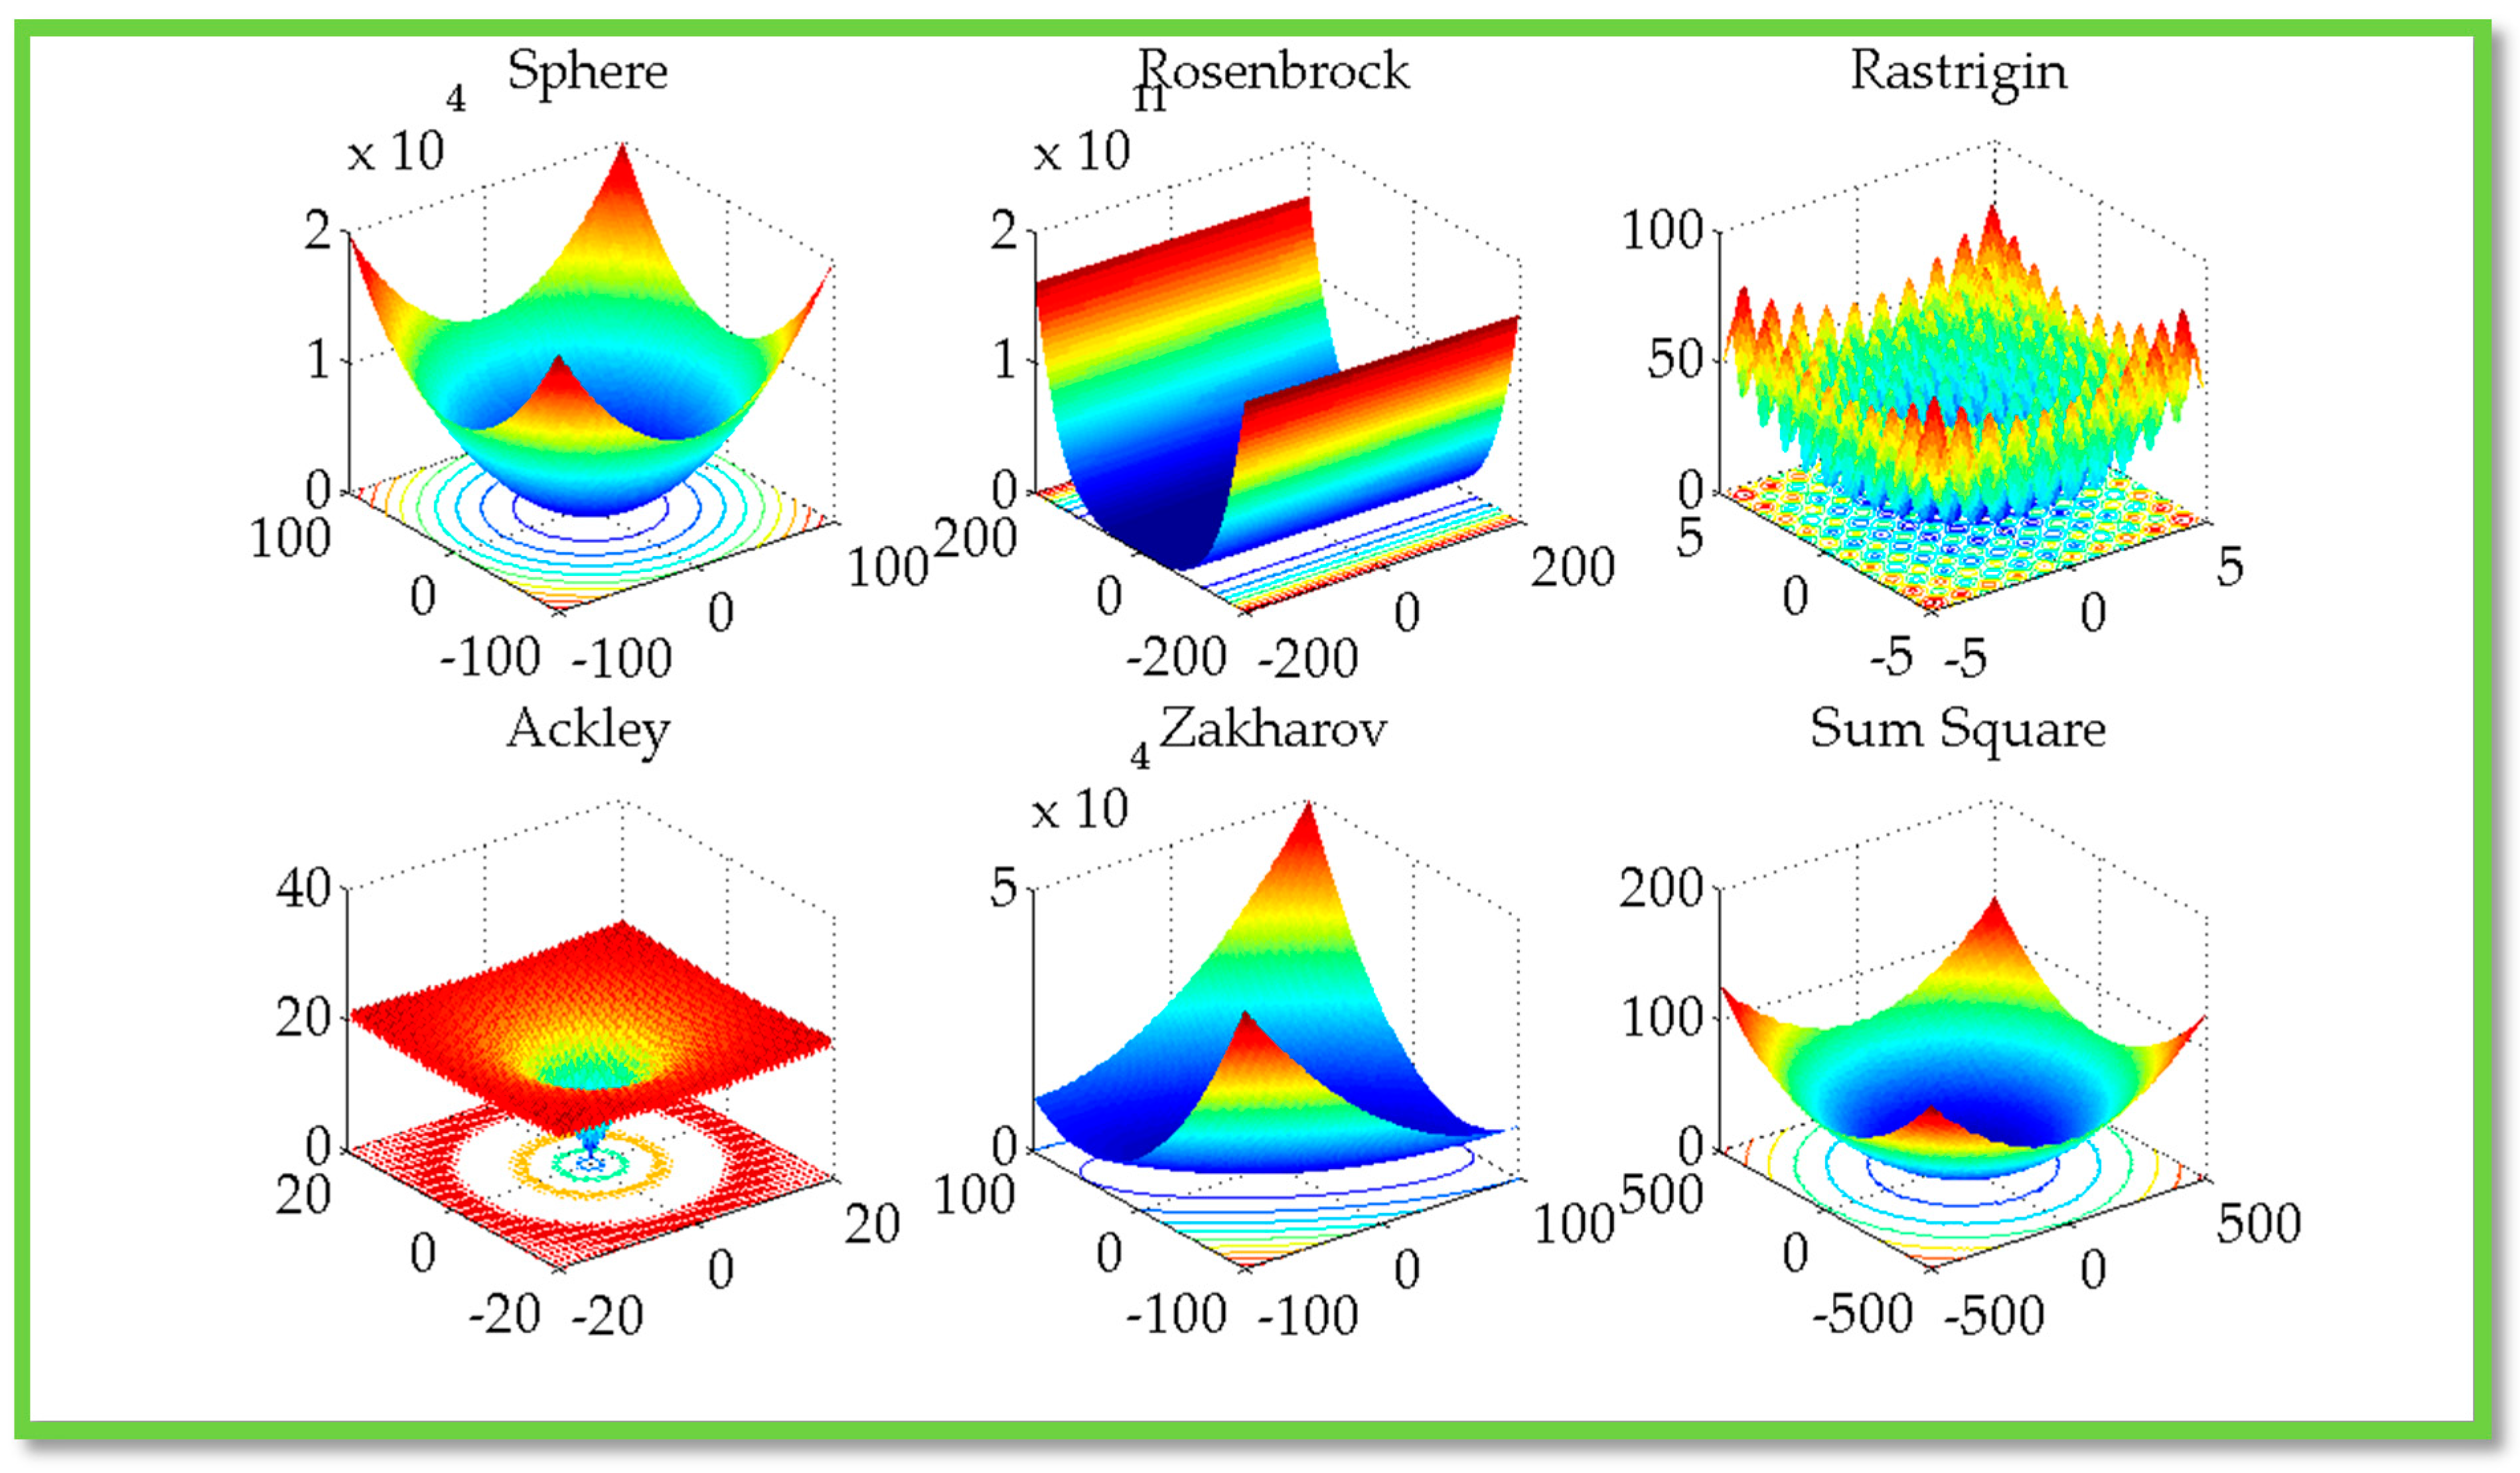
The harmony search algorithm has been applied so far to various optimization problems: optimization of functions [
9,
14], the distribution of water, groundwater modeling, energy-saving clearance, structural design [
26], vehicle routing, and others. The possibility of combining harmony search with other algorithms, such as particle swarm optimization and genetic algorithms has also been investigated.
The parameter harmony memory accepting (HMR) represents the exploitation, and this will ensure that the best harmonies will be transferred to the new harmony memory.
The parameter pitch adjustment (PArate) represents the exploration of this algorithm, and is similar to the mutation operator in genetic algorithms. A pitch adjustment rate (PArate) was used to control the degree of adjustment. The literature suggests the range of pitch adjustment to be between 0 and 1; this parameter in the original algorithm does not change during the iterations and some authors use this parameter in a range between 0.1 and 0.7. In the proposed model, the parameters change during iterations in the range 0.7 to 1 through the use of a fuzzy system to give diversity algorithm and finding the global optimum.
Parameter randomization is used to increase the diversity of the solutions, and the use of randomization can further push the system to explore various regions with high diversity solutions in order to find the global optimum.
The main difference between FHS and the traditional HS method is in the way they perform the adjusting of the
HMR and
PArate parameters. To improve the performance of the HS algorithm, the FHS algorithm considers the
HMR and
PArate as dynamic parameters in the improvisation step. FHS uses a fuzzy system to be responsible for dynamically changing the
HMR and
PArate parameters in the range from 0 to 1 and 0.7 to 1; this range is based on a detailed study of the behavior of the algorithm parameters after performing a series of experiments applied to optimization problems, since some items used different ranges in the original method [
22] in each iteration number. In this case, the rules are used in increasing and decreasing form as shown in
Figure 1.
This method includes the input iterations of the algorithm, because other studies have found it favorable to consider this measure that can control the execution of the algorithm.
In addition, it is also found that an algorithm performance measure, such as the iterations, needs to be considered in the parameter adaptation. In this work, all the above are taken into consideration for the fuzzy systems to modify the HMR and PArate parameters by dynamically changing these parameters in each iteration of the algorithm.
In this phase, the percentage of elapsed iterations is considered to determine the values of
HMR and
PArate. If a low percentage of iterations elapses, the
HMR and
PArate parameters would take a low value in the range in order to enable a wide search in the search space, as a kind of exploration. On the contrary, if a high percentage of iterations have occurred, it would give the
HMR and
PArate parameters a high value in the indicated range in order to draw a more intense exploitation within the search space in advanced iterations. Subsequently, if the percentage of elapsed iterations is medium, then a medium value for
HMR and
PArate would occur, with the aim of expanding the above criteria. The following equation represents this idea [
27]:
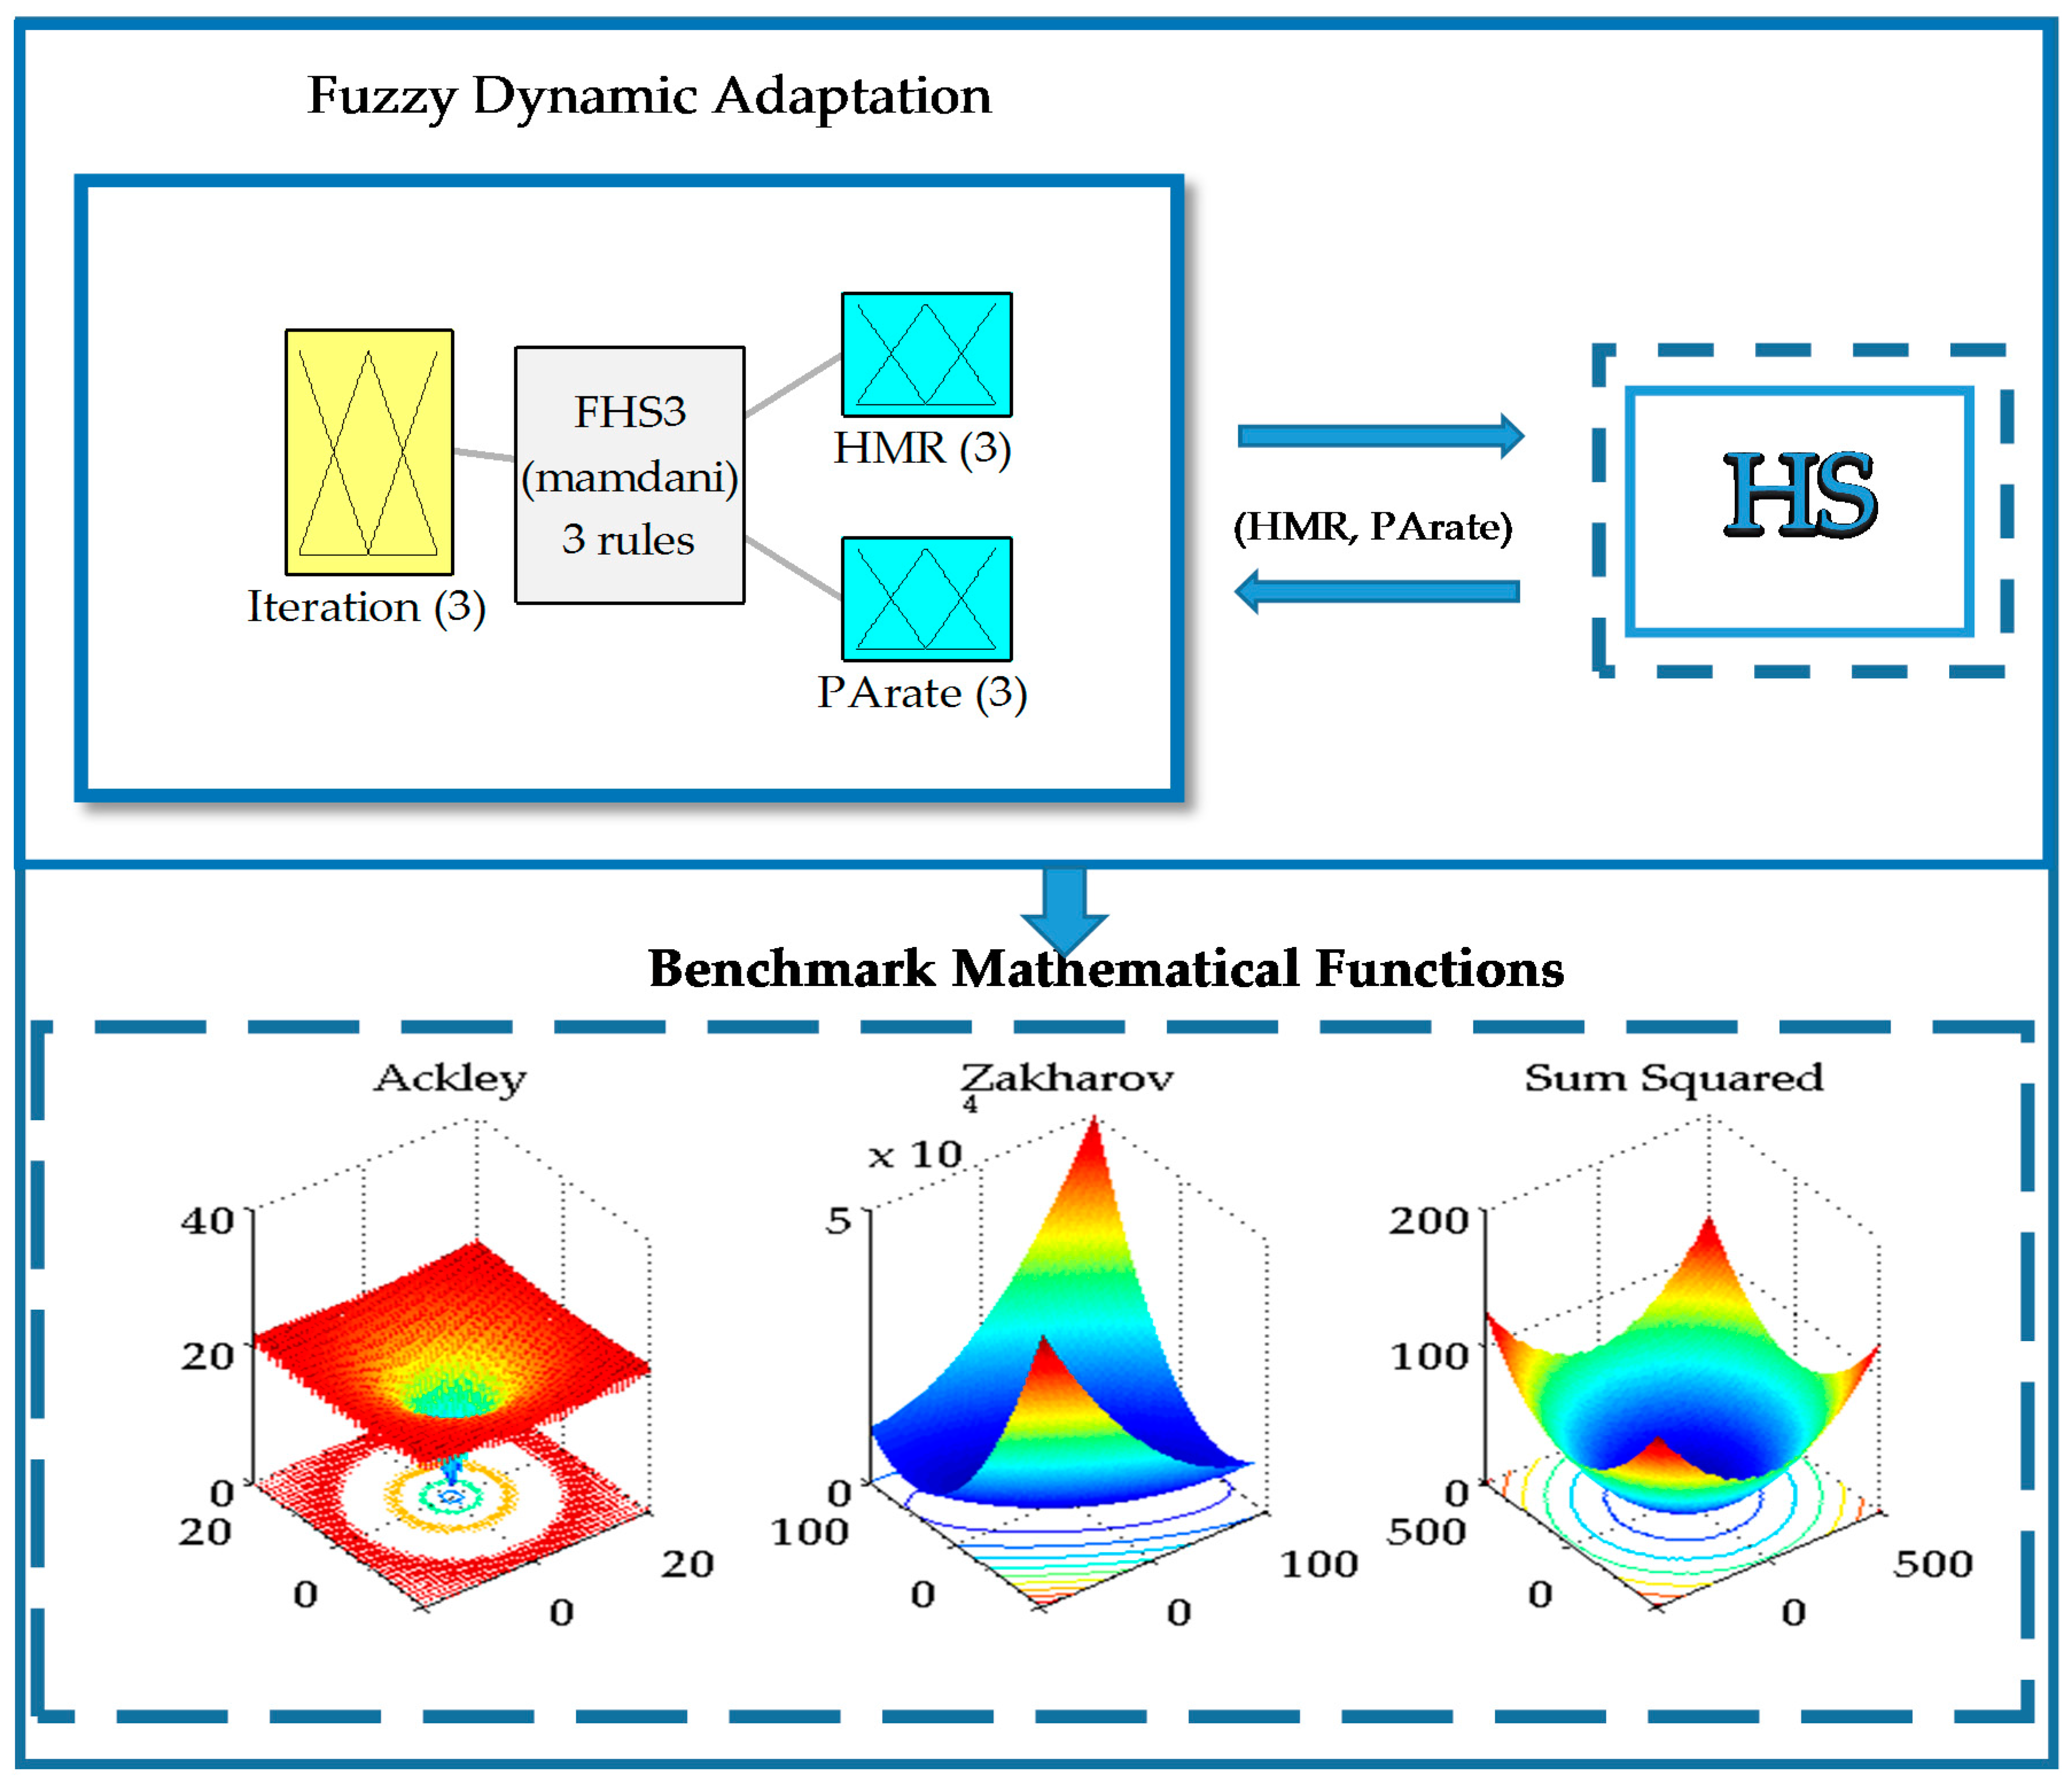
Therefore, for designing the fuzzy systems, which dynamically adjust the HMR and PArate parameters, the measure described above was considered as the input. Experiments were performed to test each parameter separately in order to check their behavior when applied to optimization problems with different fuzzy rules to increase or decrease, and eventually the two parameters in the output were put together to test the effectiveness of the method. The first proposed output of the fuzzy system is the HMR parameter, the second proposed output of the fuzzy system is the PArate parameter and for the third proposed fuzzy system, the outputs are both HMR and PArate parameters. The fuzzy systems use rules with increment and decrement and with ranges from 0 to 1 and from 0.7 to 1, respectively, for the experiments.
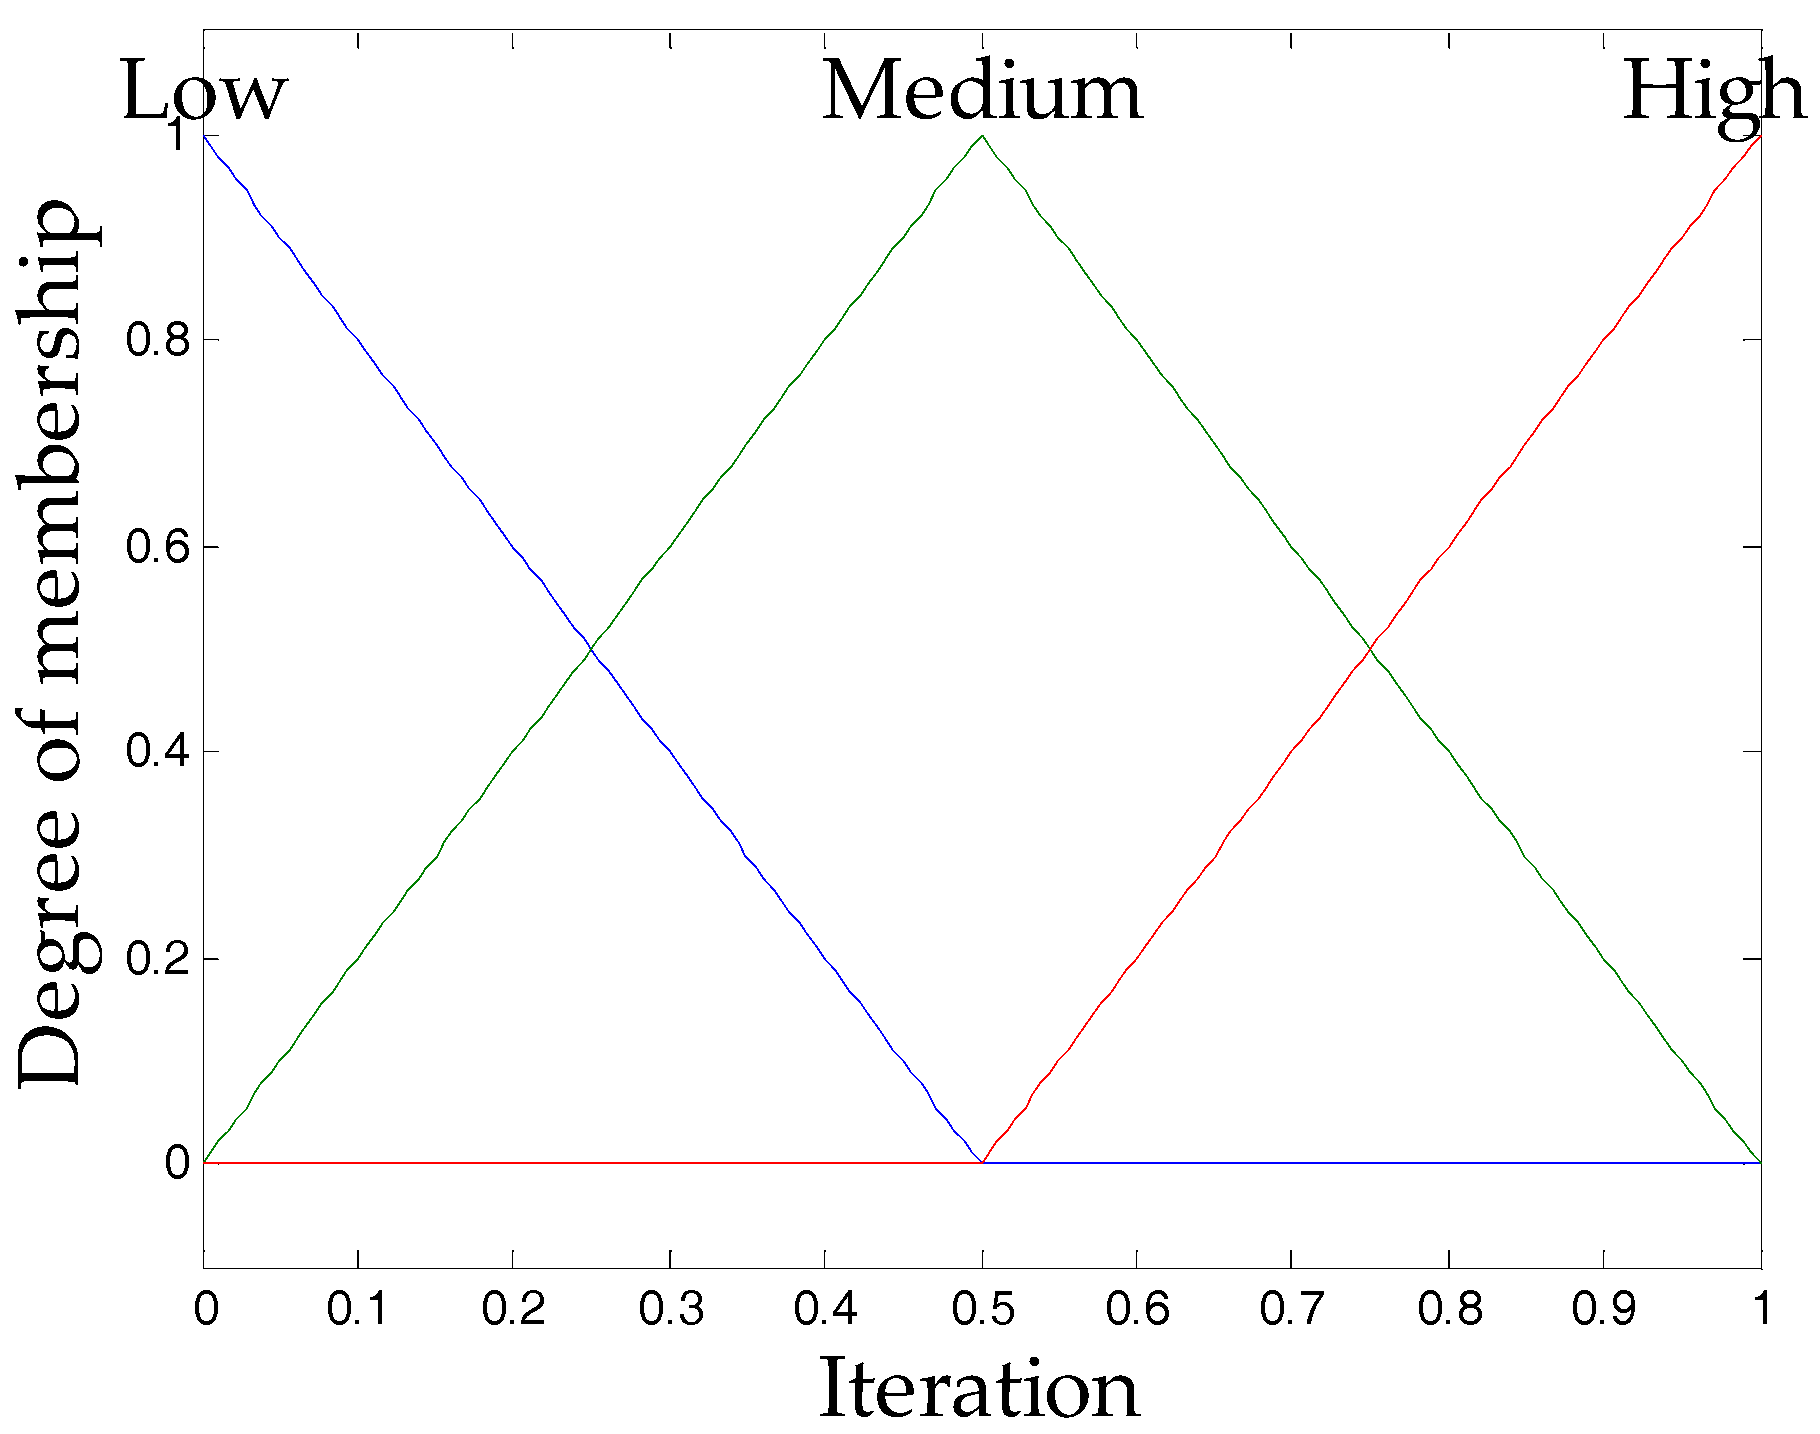
The design of the input variable in all fuzzy systems can be found in
Figure 2, which shows the input called “iteration”, and this input is granulated into three triangular membership functions.
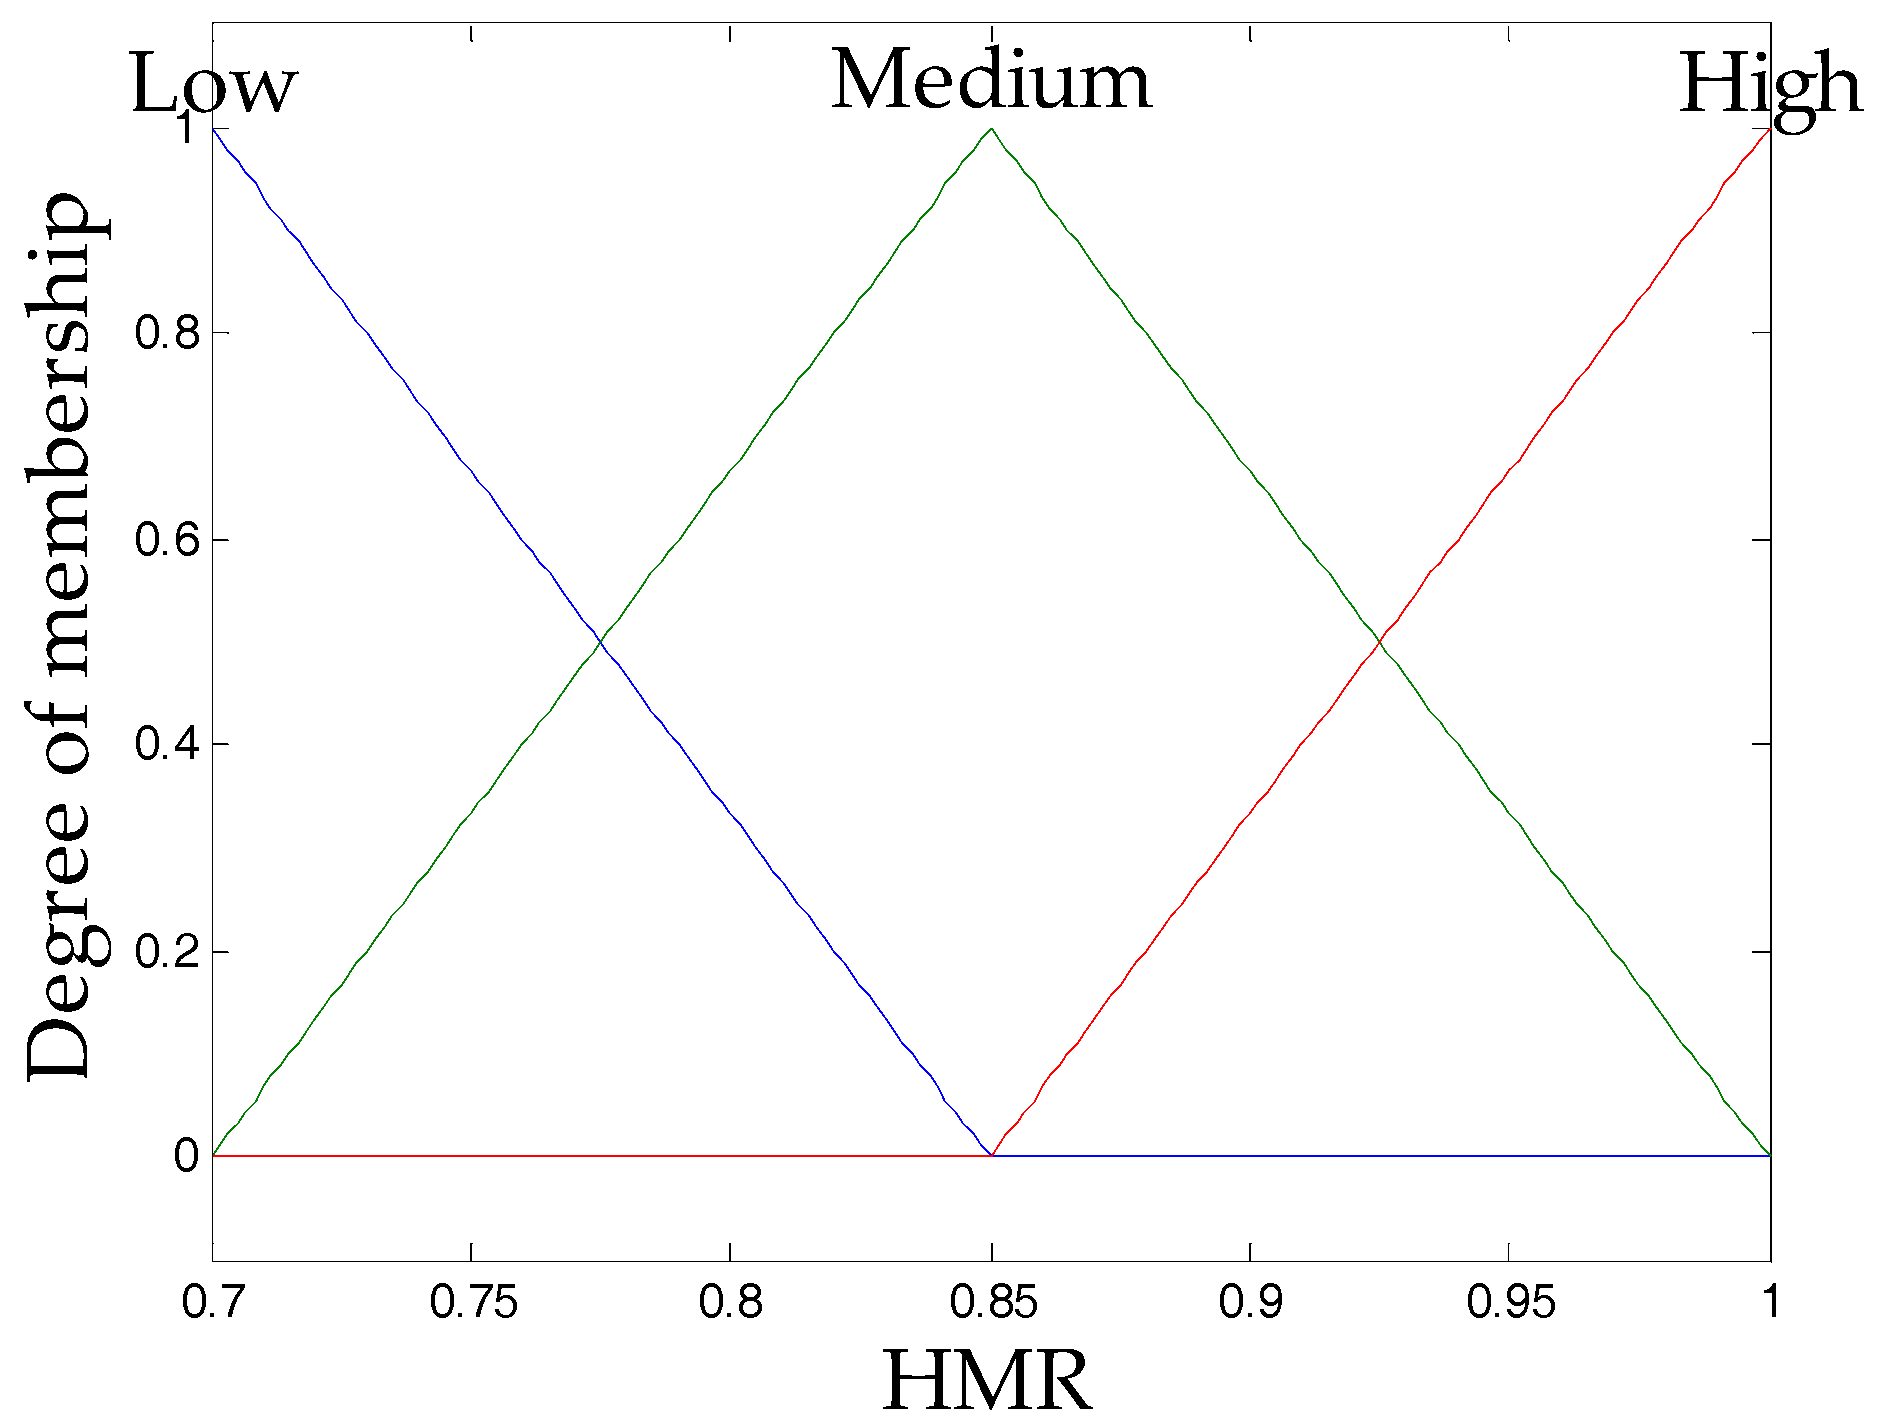
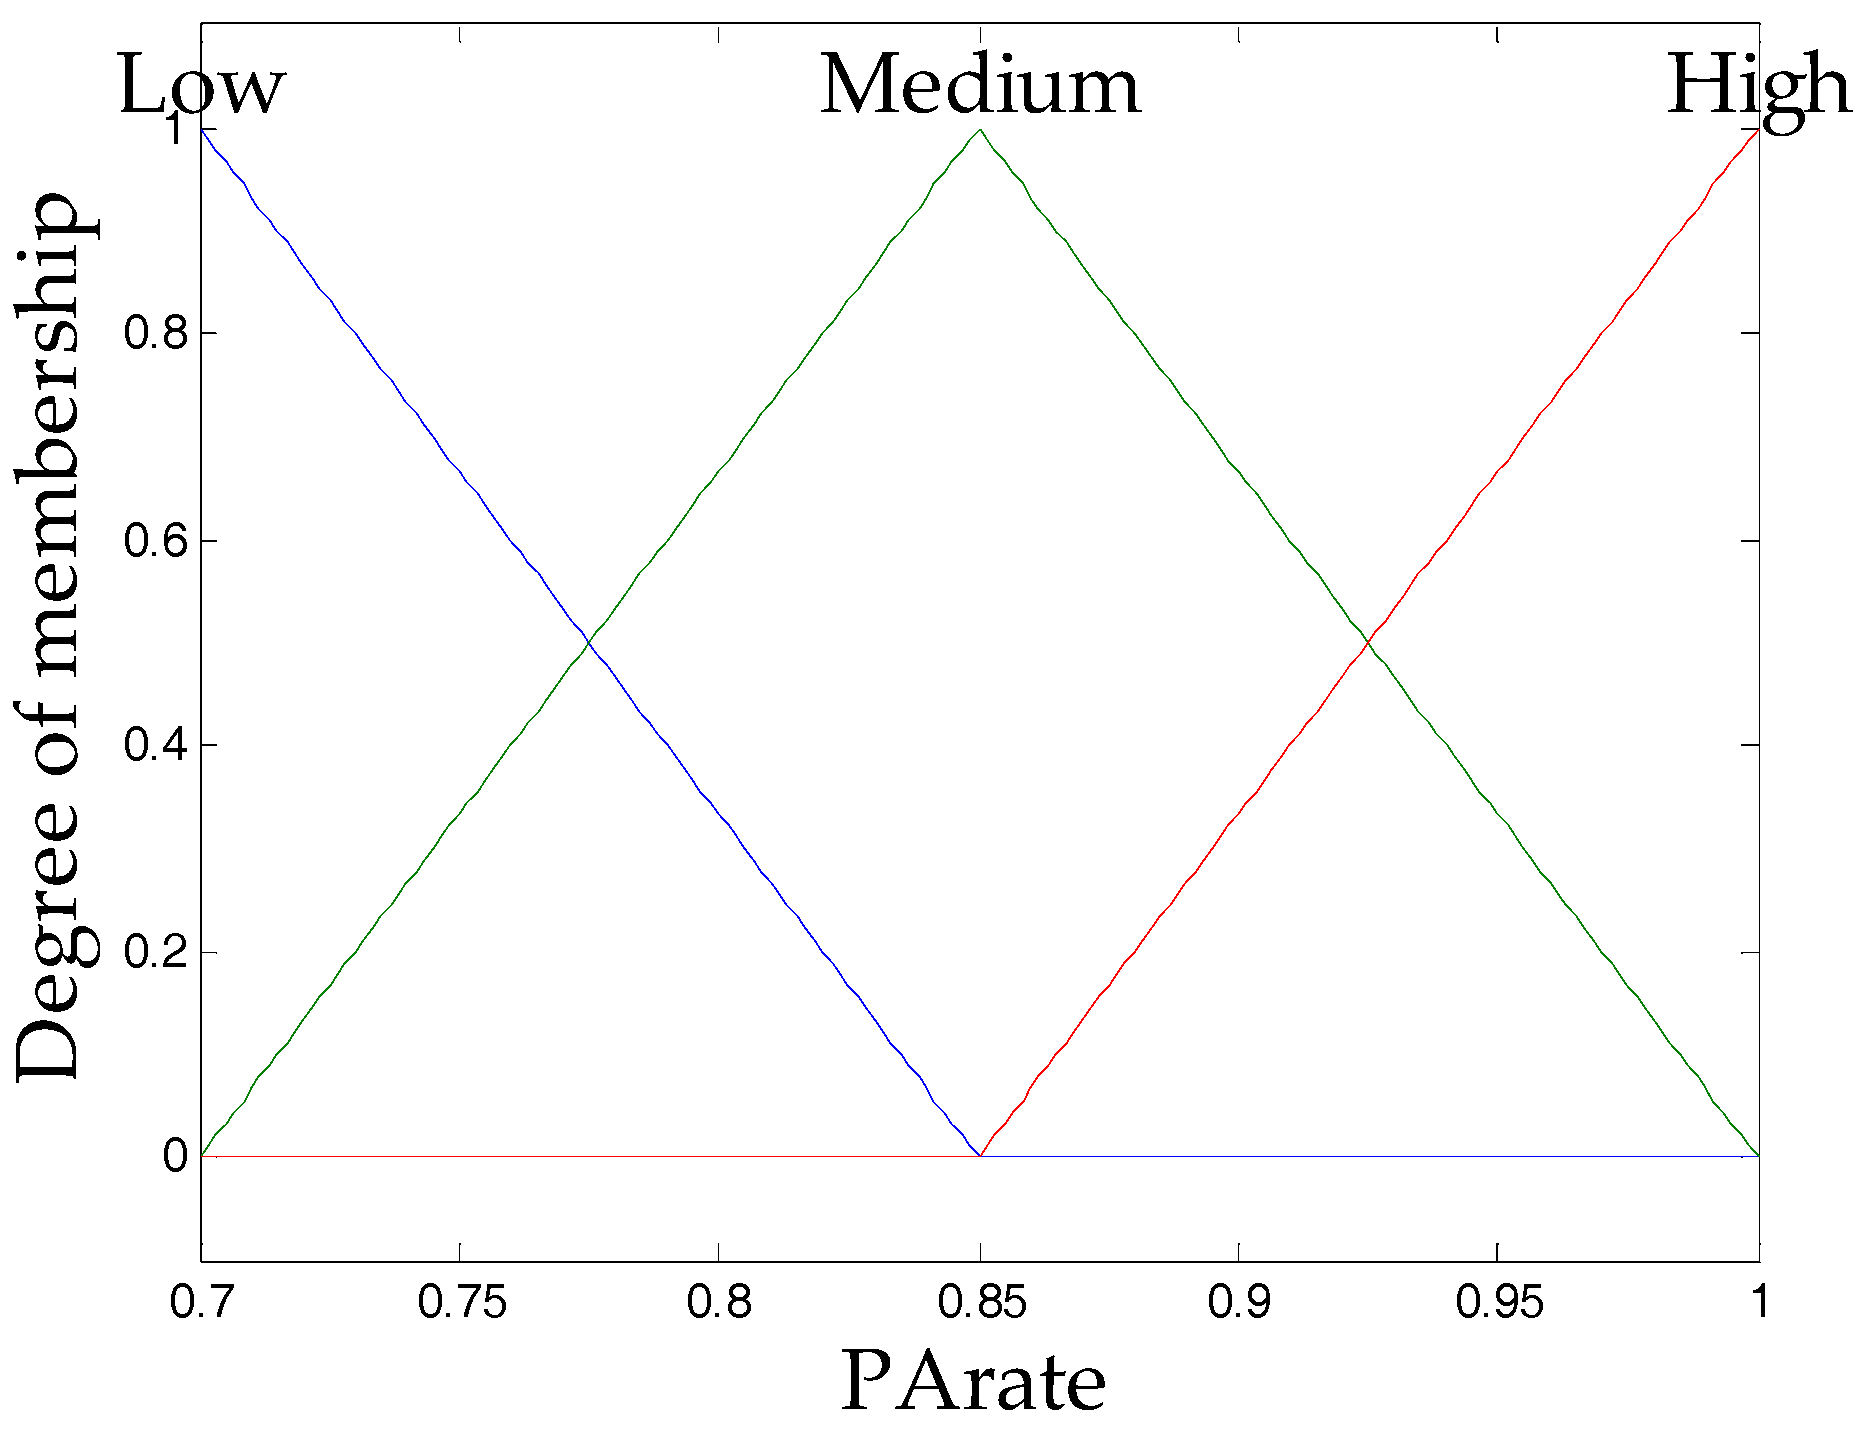
For the output variables, as mentioned above, the recommended values for
HMR and
PArate are from 0 to 1 and 0.7 to 1, so the output variables are designed using these ranges of values. Each output is granulated into three triangular membership functions which are low, medium and high, and the design of the
HMR and
PArate output variables can be found in
Figure 3 and
Figure 4.
Having defined the possible output variables, it was decided to combine them to generate different fuzzy systems for the dynamic adjustment of HMR and PArate. Based on the literature the recommended values for the parameters are from 0 to 1, so in this case the range 0 to 1 and 0.7 to 1 were used for the outputs in the fuzzy system. There are 12 possible fuzzy systems, in this case only the three fuzzy systems using a range 0.7 to 1 are presented, using rules to increase because these algorithms achieve better results, which are defined below.
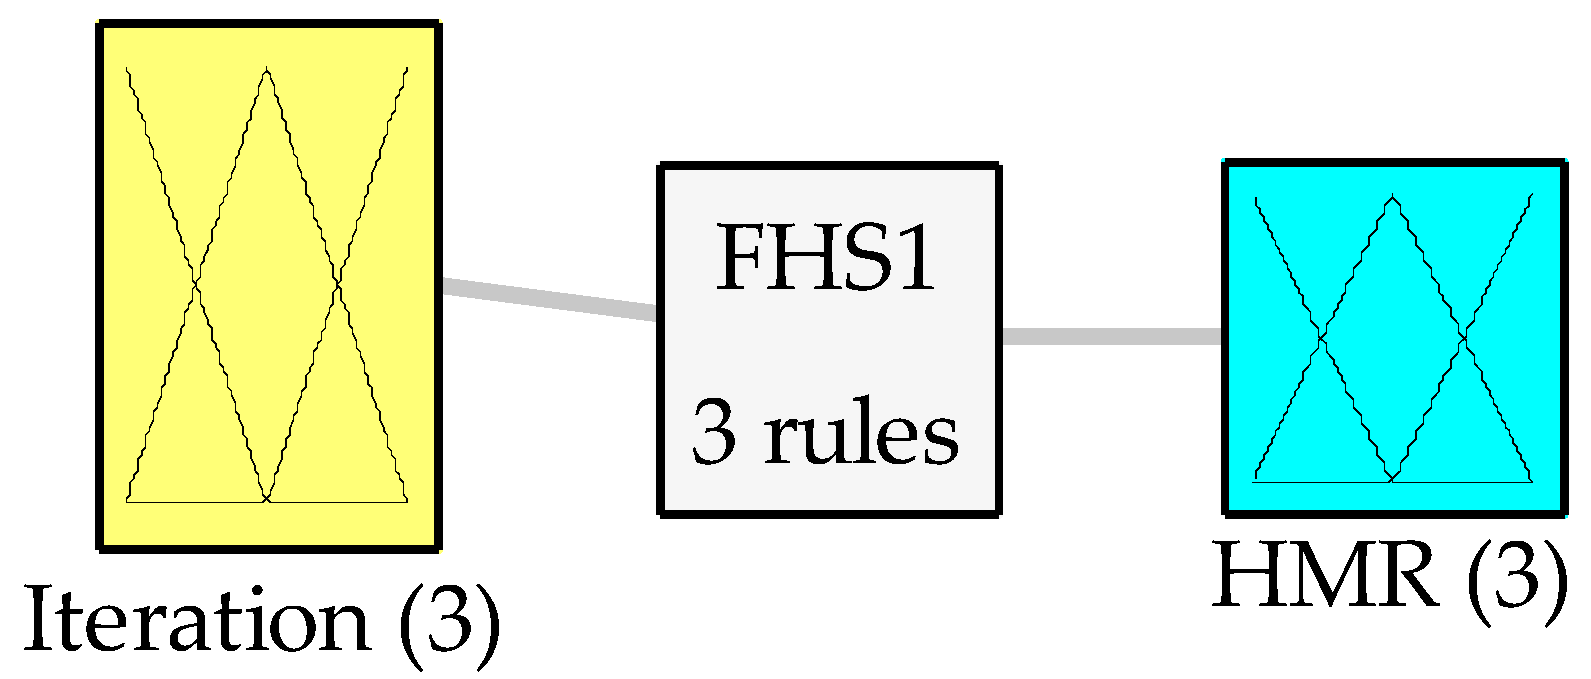
The first fuzzy system has iteration as input and
HMR as output, which is shown in
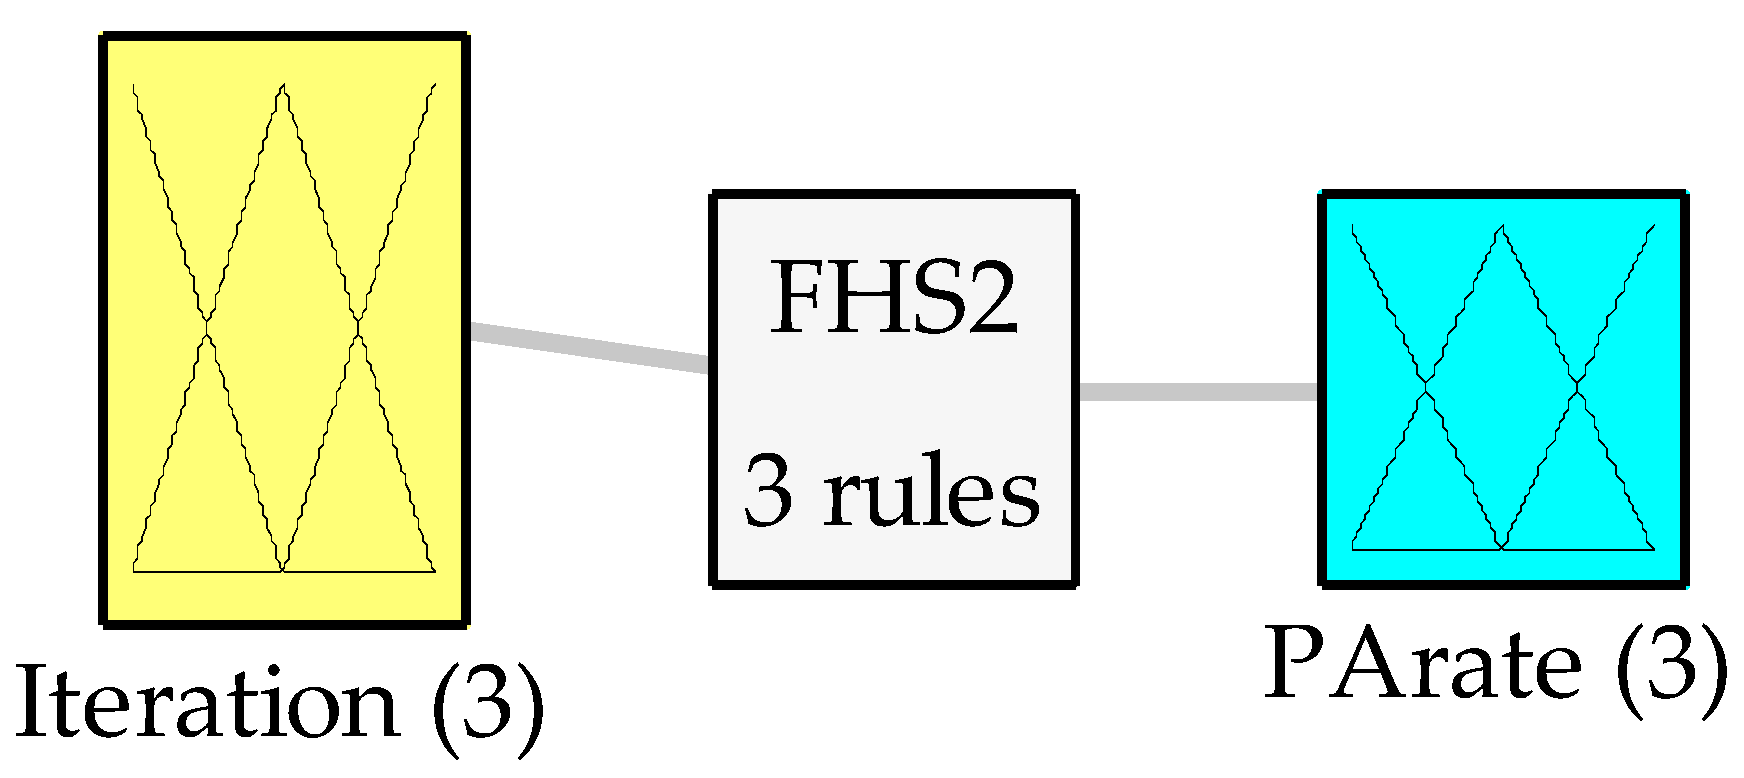
Figure 5. The second fuzzy system has iteration as input and
PArate as output and is shown in
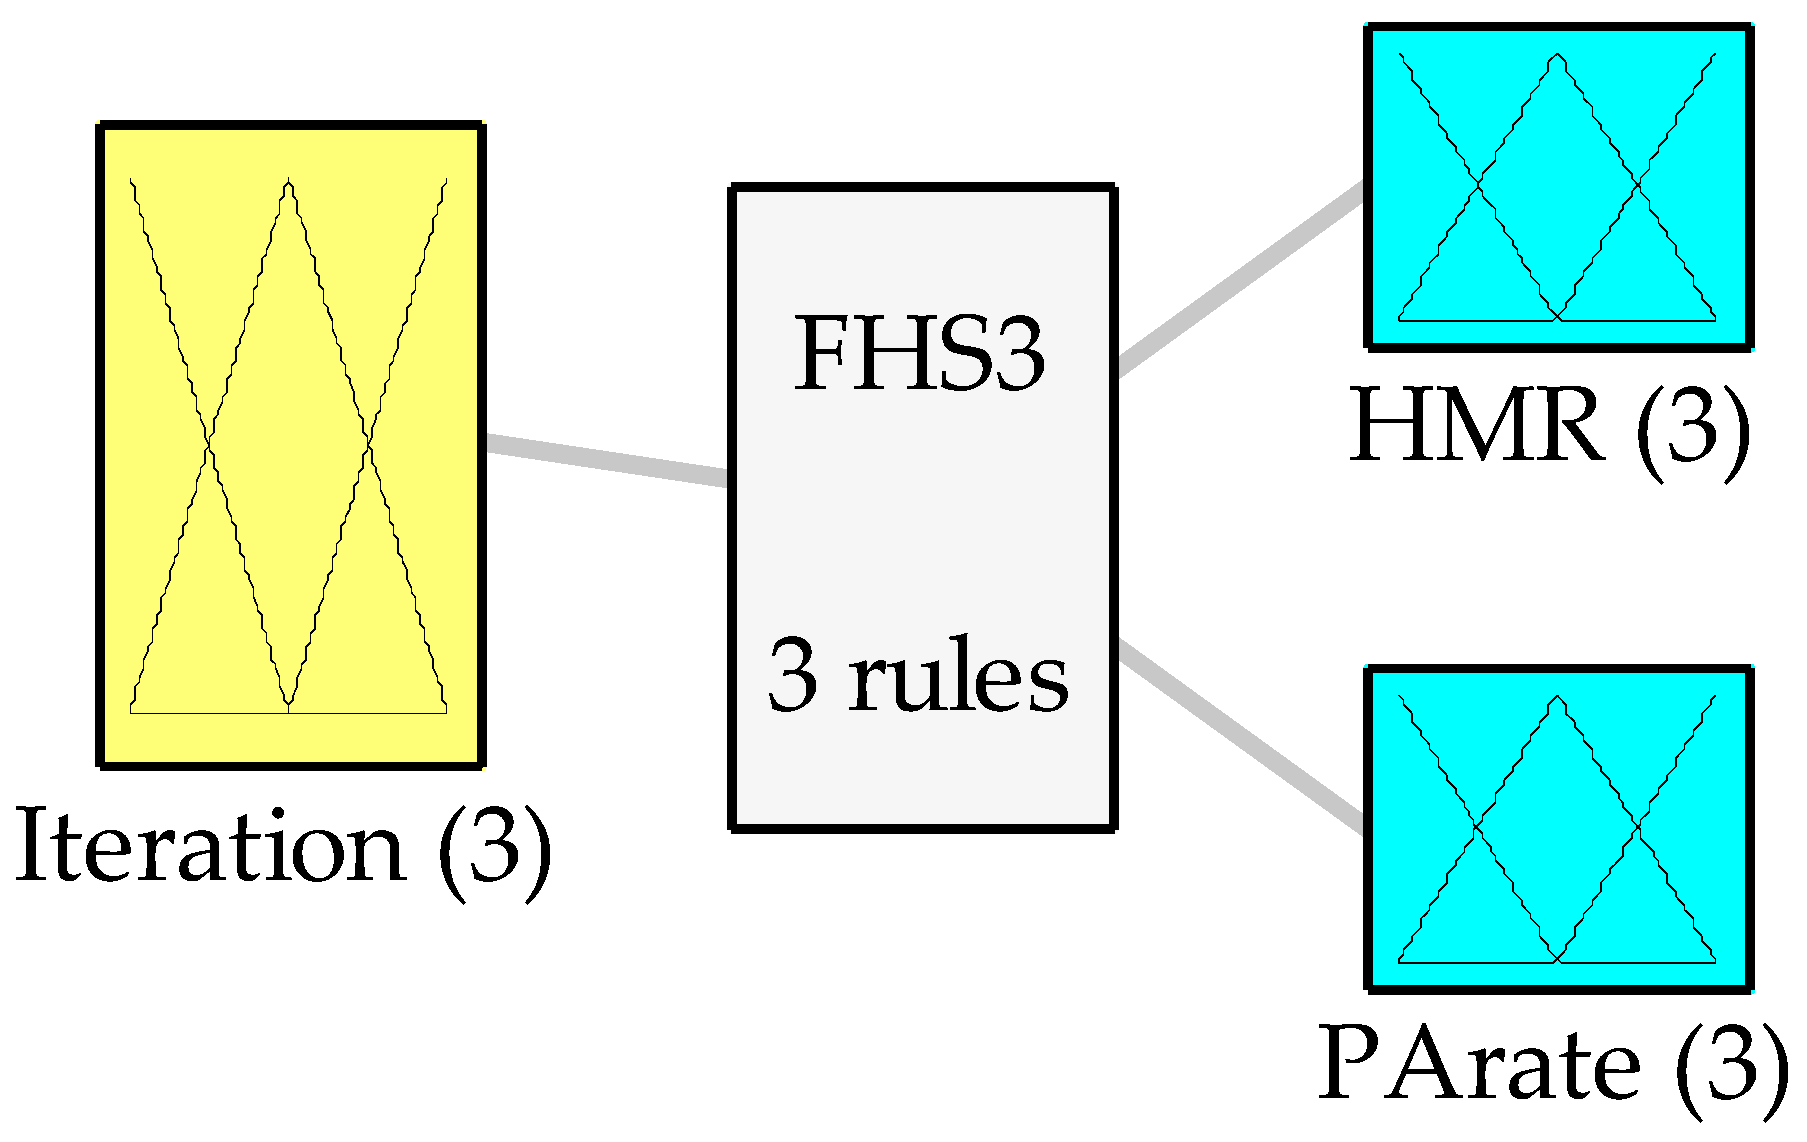
Figure 6. The third fuzzy system has iteration as input and the outputs are
HMR and
PArate, as shown in
Figure 7.
The first fuzzy system is defined by the following design, using as input the iterations and as output in this case the harmony memory accepting (
HMR) to dynamically vary the first parameter that within the algorithm represents the exploitation, which is the number of solutions that will be considered for the subsequent iteration, as shown in
Figure 5.
The second fuzzy system is defined by the following design, using as input the iterations and as output the pitch adjusting (
PArate) to dynamically vary the second parameter that represents the exploration in the algorithm, which can be viewed as a refinement of local solutions, as shown in
Figure 6.
The third fuzzy system, which is composed of the following design, uses as input the iterations and as outputs the
HMR and
PArate parameters to move both parameters dynamically. For this case, a combination of rules based on the results of the two previous fuzzy systems is made, as illustrated in
Figure 7.
To design the rules of each fuzzy system, it was decided that in early iterations the HS algorithm must explore and eventually exploit.
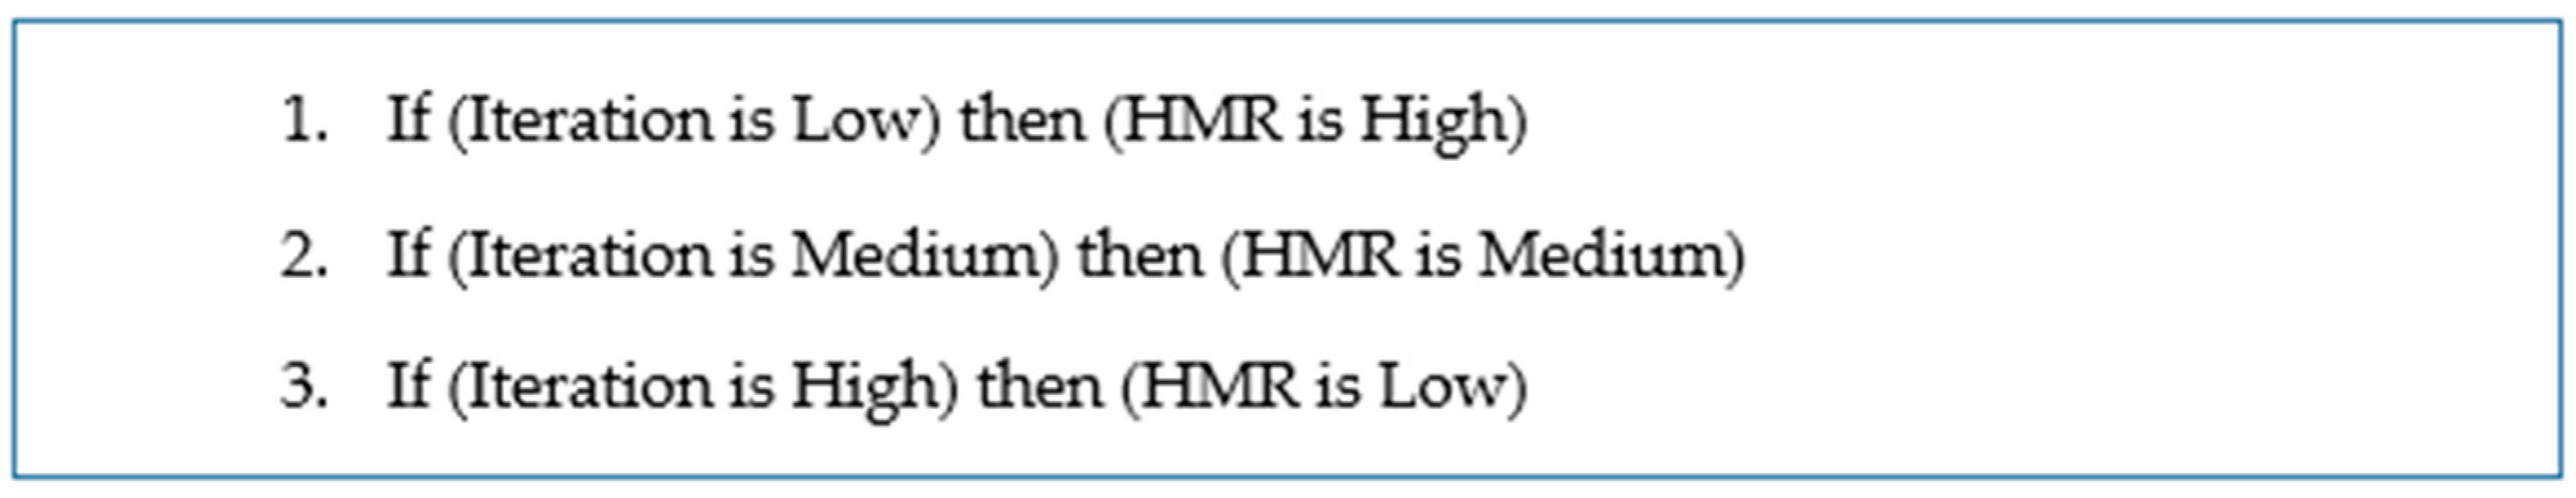
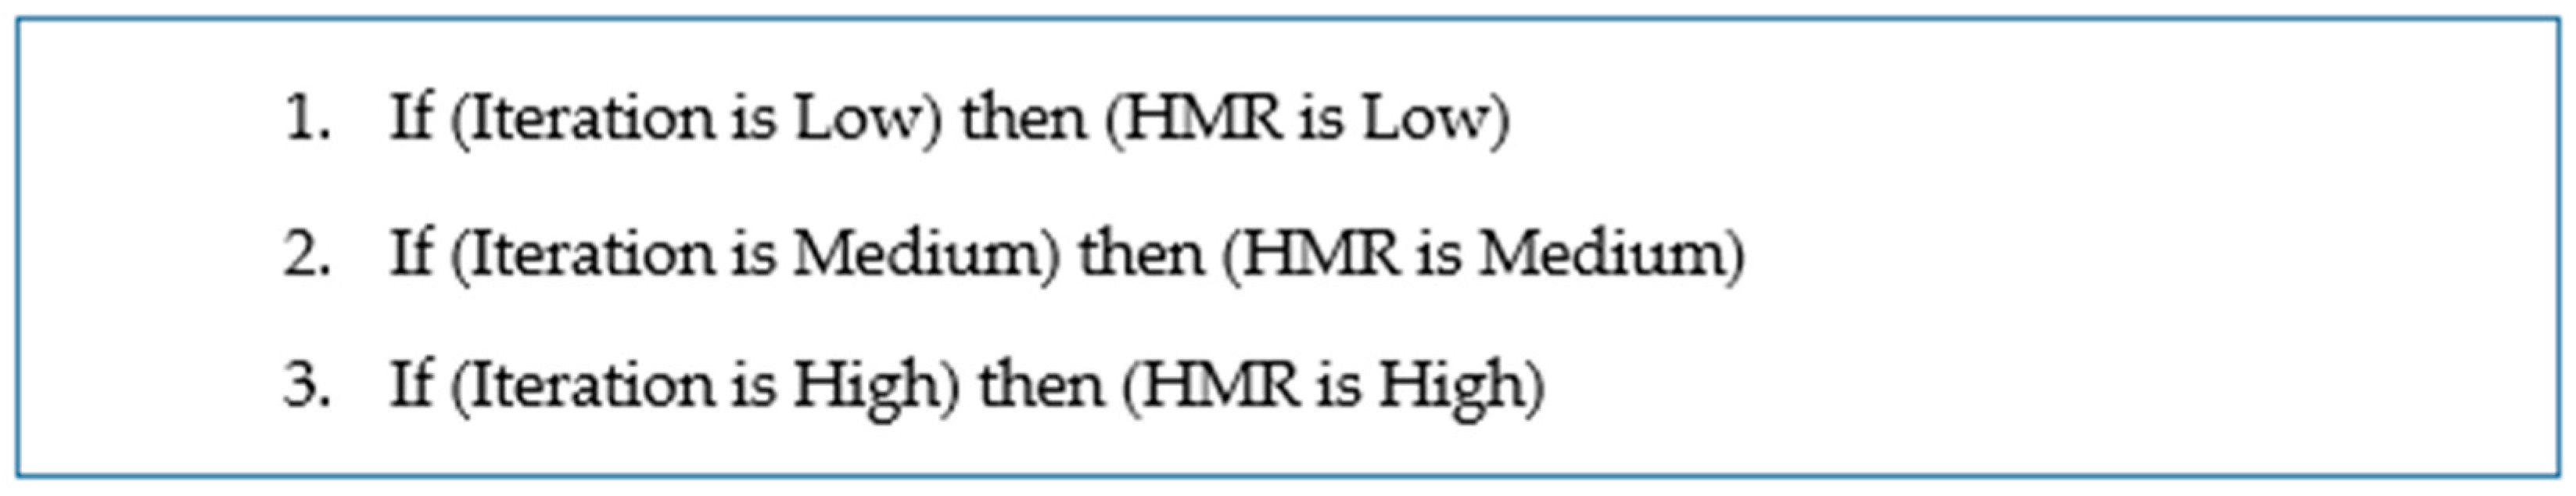
The rules given in
Figure 8 are those used in the fuzzy system 1, and are defined to increase the
HMR parameter according to the iterations to achieve better exploration and exploitation of the search space.
The rules given in
Figure 9 are those used also for the fuzzy system 1, which are defined for decreasing the
HMR parameter to achieve exploitation and exploration of the search space.
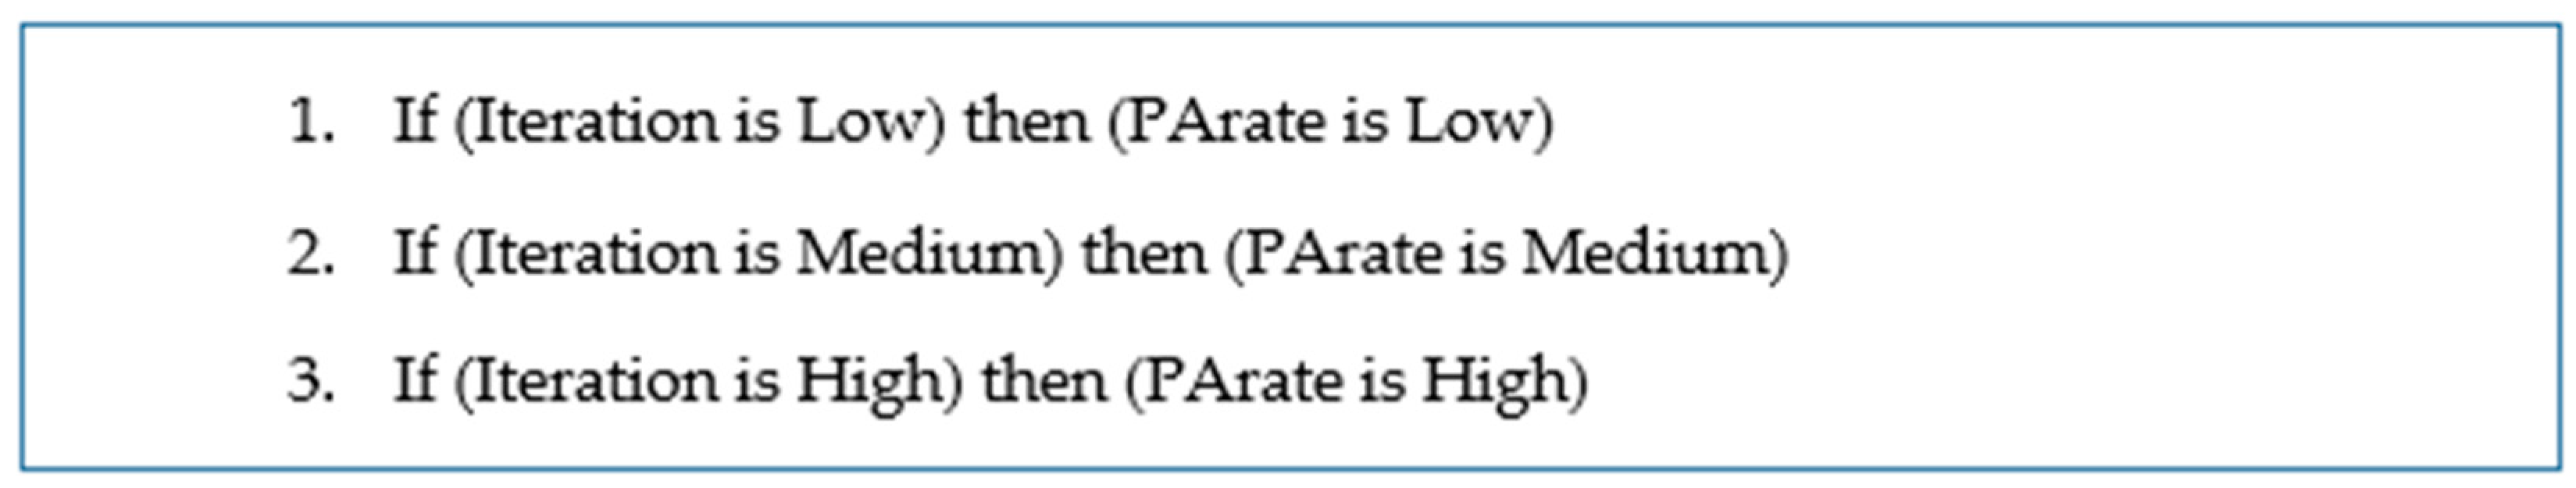
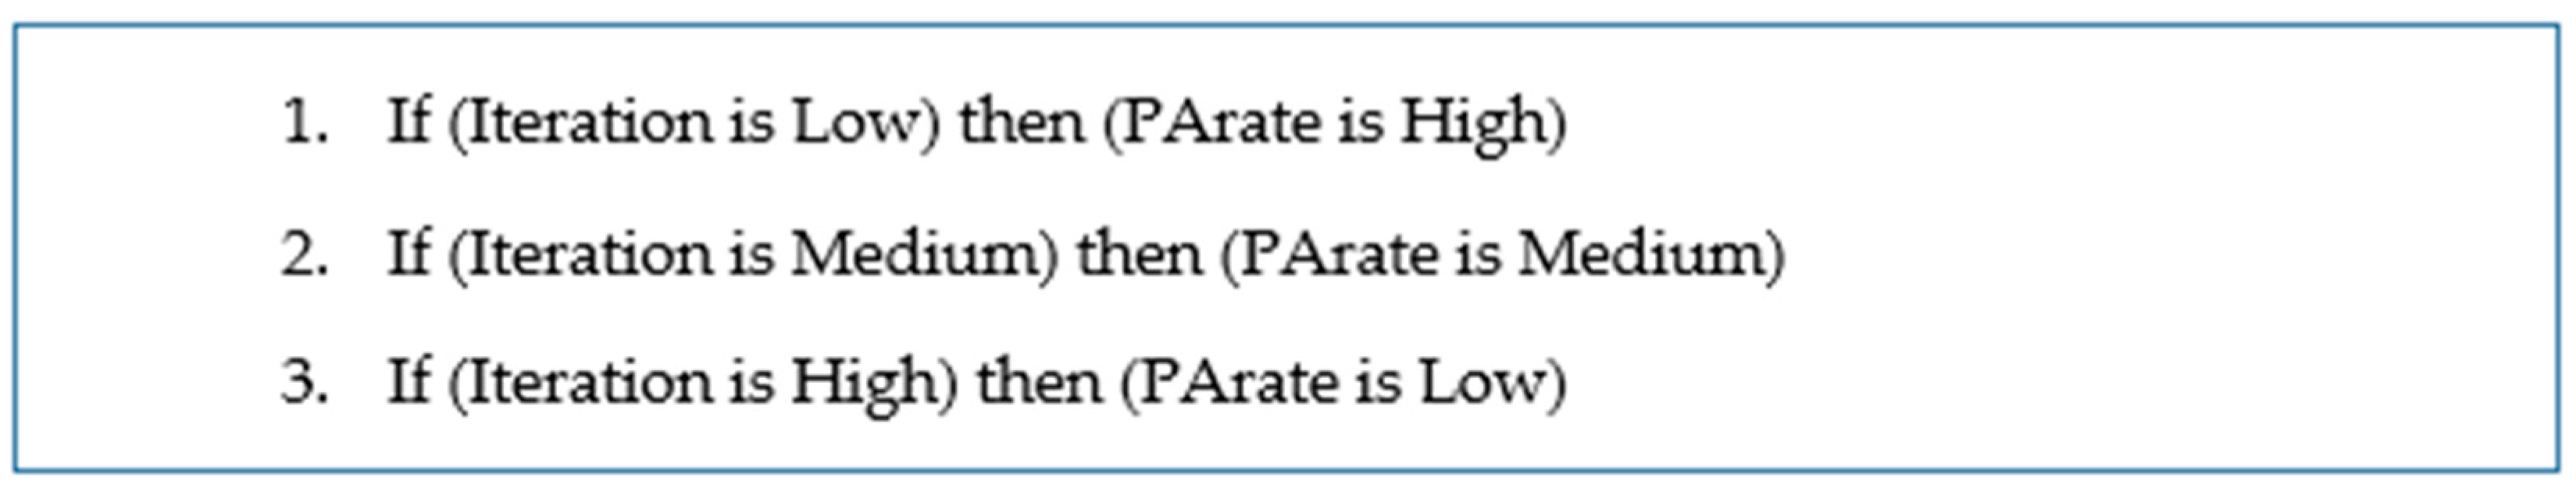
The rules given in
Figure 10 are those used in the fuzzy system 2, in this case for increasing the
PArate parameter to achieve exploration and exploitation of the search space.
The rules given in
Figure 11 are those used in the fuzzy system 2, but now for decreasing the
PArate parameter to achieve exploitation and exploration of the search space.
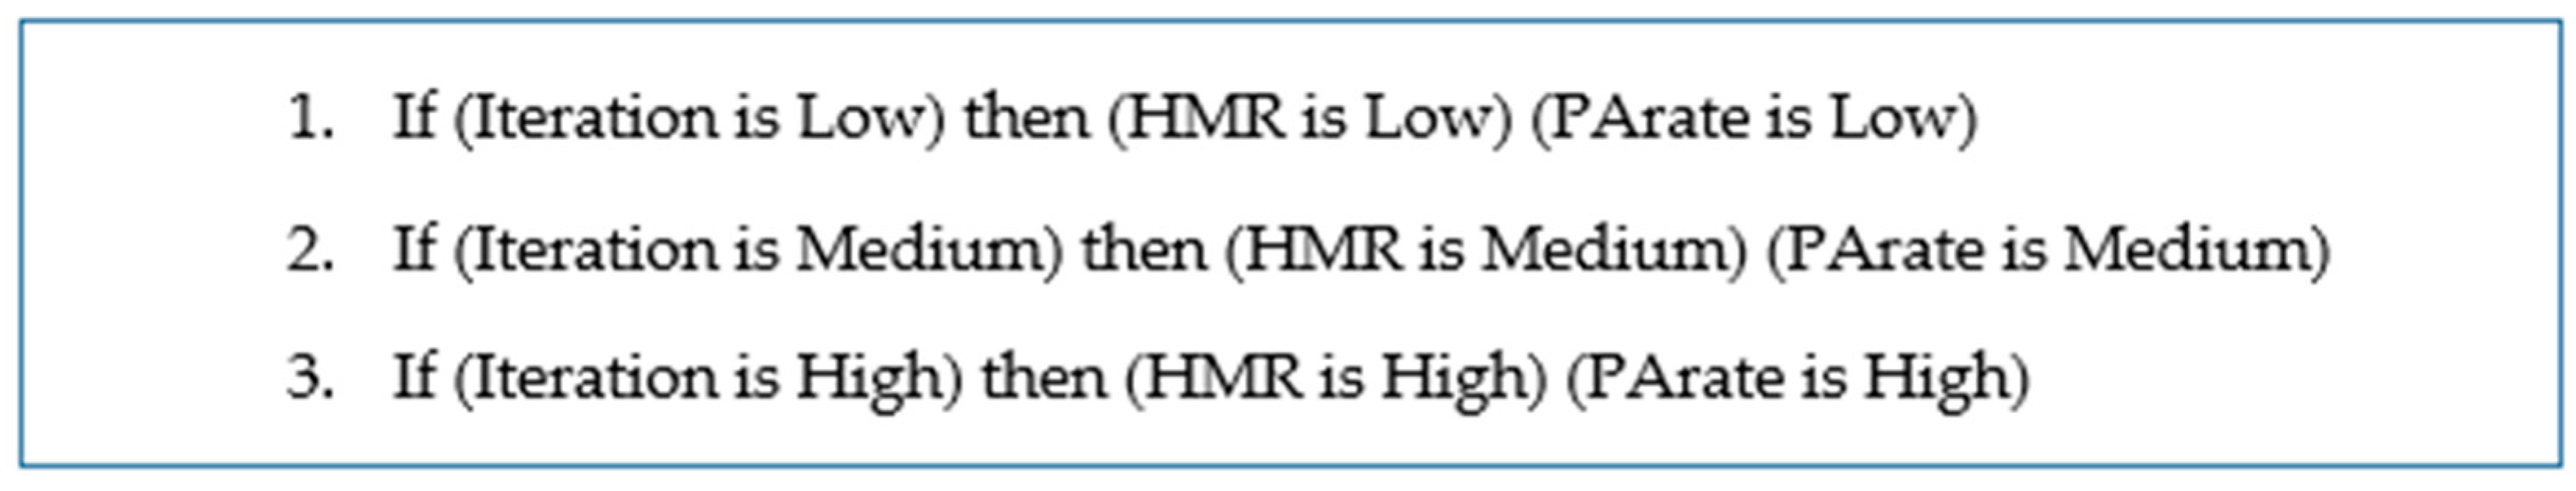
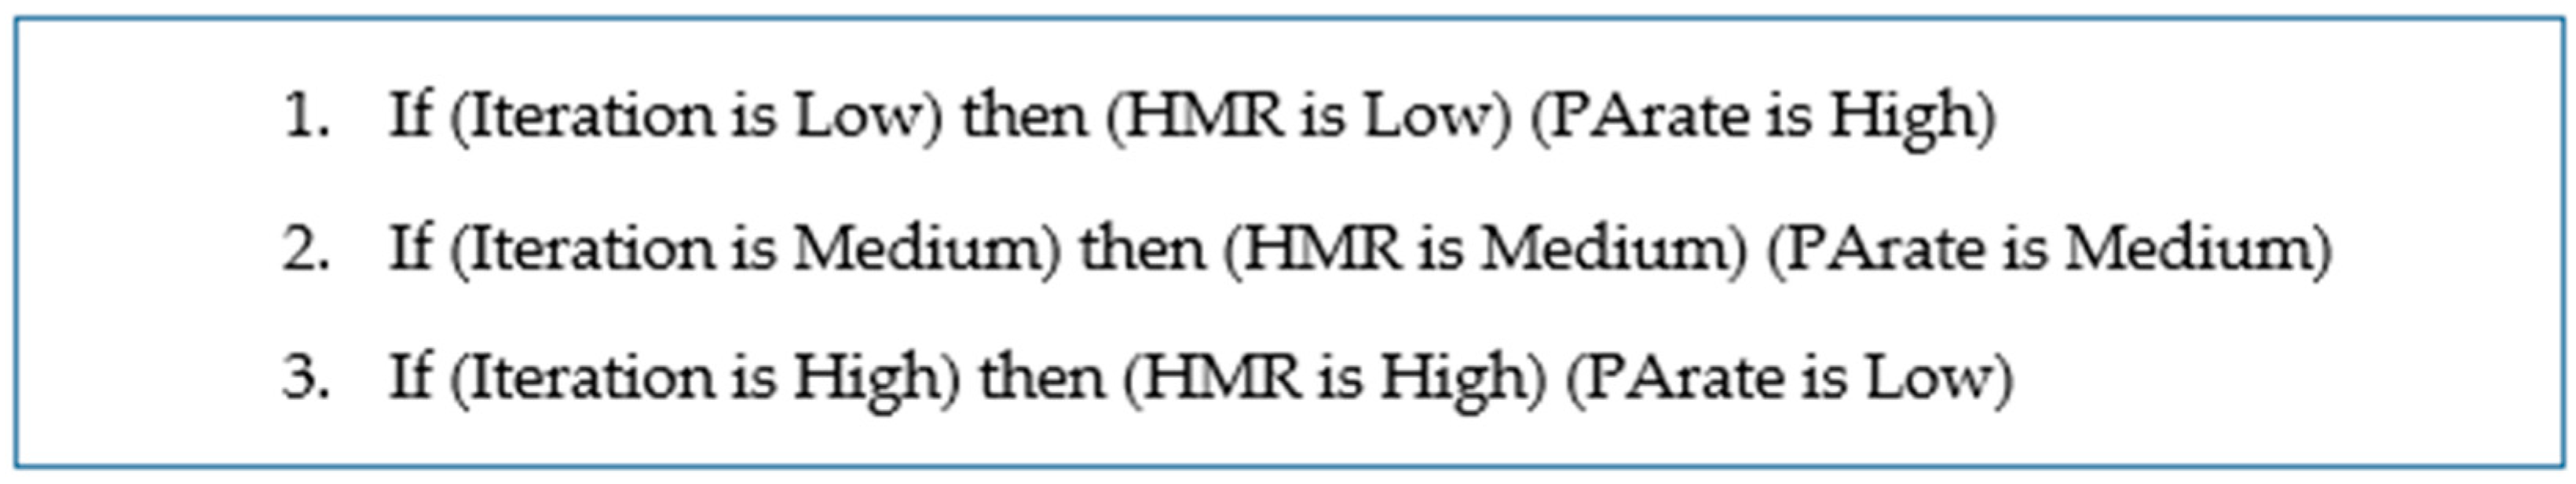
The rules given in
Figure 12 are used in the fuzzy system 3, which are a combination of the two parameters in increase to first explore and then exploit the search space.
The rules given in
Figure 13 are used in the third fuzzy system, which are another combination of the two parameters in decrease to first exploit and then explore the search space.


