Influence of Climate on the Growth of Hybrid Poplar in Michigan


Department of Forestry, Michigan State University, 126 Natural Resources Building, East Lansing, MI 48824, USA
Forests 2010, 1(4), 209-229; https://doi.org/10.3390/f1040209
Submission received: 30 September 2010
/
Revised: 22 October 2010
/
Accepted: 9 November 2010
/
Published: 15 November 2010
Abstract
:This study examined the influence of climate on cumulative and interannual growth patterns of 18 full-sib families of hybrid poplars (Populus × smithii Boivin) derived from different geographical locations (state counties) of natural stands of aspen parents (trembling aspen (Populus tremuloides Michx.) and bigtooth aspen (Populus grandidentata Michx.)). The hybrids were subsequently planted in 1982 in southern mid-Michigan at Michigan State University (MSU) Sandhill Research Area. Cumulative measures of hybrid poplar productivity (diameter, height, basal area, and stem volume) in 2009 (28 years since plantation establishment) were related via correlation analysis to geographical distances and climatic variables (temperature and precipitation) between parental county locations and between parental locations and the plantation site. Tree-ring analysis methods (dendrochronology) were also used to quantify the influence of climate (i.e., mean temperature and total precipitation at monthly and 3-month seasonal scales) on interannual basal area growth rates of hybrid poplars. Analyses of cumulative measures of growth indicated a maternal effect: full-sib families had higher productivity if they had a maternal parent originating from a state county that was close to or had higher temperature (annual and summer) and summer precipitation than corresponding parameters of the planting site. Principal component analysis indicated that 17 of the 18 full-sib families shared a large amount of common growth variation. Dendrochronological analyses of interannual growth-climate relationships indicated that growth was mainly affected by the degree of late summer to fall moisture stress in both the current and previous growth season, and the degree of winter harshness.

1. Introduction
Rising energy costs and the non-renewable nature of petroleum based energy sources have created the impetus to develop renewable energy sources [1,2]. Woody biomass is a renewable resource that can serve as a feedstock to produce electricity and heat (bioenergy), as well as liquid fuels such as ethanol (biofuels) which in turn helps displace fossil fuel use. If properly managed, woody biomass feedstocks for bioenergy and biofuels production have the potential to be carbon neutral.
Sustainable woody biofeedstock production systems require a reliable supply of woody biomass. Hybrid poplars have been tapped as an important biofeedstock resource in which productivity gains can be realized over very short rotations [3]. Hybrid poplars are derived from both natural and anthropogenic crosses among poplar species [4]. In the north-central United States, the potential yield of hybrid poplar plantations can reach 27–45 m3 ha−1 year−1 [5]. However, there is limited understanding of the climatic sensitivity (e.g., degree of drought tolerance) of hybrid poplars. Most genetic tree-improvement programs are geared towards improving growth traits (e.g., height, diameter, volume) [6,7] without consideration of the climatic effects on such growth traits. Effects of climatic factors have been examined for hybrid poplars [8,9] but have focused on the effects of climate on roots [10] and generally consist of short term (<5 years) ecophysiological studies [11,12,13].
The annual growth cycle of temperate and boreal tree species in North America alternates between phases of summer growth and winter dormancy in response to seasonal changes in climatic drivers of tree growth phenology [14]. The seasonal periodicity of climatic effects on stem growth processes results in the formation of annual rings. Tree-ring analysis (dendrochronology) provides insight into the seasonal timing of growth-climate relationships [14,15]. Nonetheless, there is limited species-specific understanding of the climatic drivers of growth phenology for a number of tree species [16]. Dendrochronology studies therefore can assist with the parameterization of climatically-sensitive forest growth models [17]. Tree-ring analyses represents an alternative and insightful approach to reveal past climatic drivers of tree growth at longer term time scales [15,18,19], and has been an underutilized tool to assess climatic sensitivity of hybrid poplars although it has been applied to poplar species, in particular trembling aspen (Populus tremuloides Michx.) [20,21,22].
There is a growing need for identifying key climatic and ecophysiogical mechanisms that influence growth and productivity of hybrid poplars to ensure sustainable management of hybrid poplar production systems [23] particularly in terms of adapting to future climatic change. The objective of this study is to elucidate the impact of climatic factors (i.e., temperature and precipitation) on cumulative and interannual growth rates of fast growing hybrid poplar previously planted in a Michigan State University (MSU) research property in the Lower Peninsula of Michigan.
2. Experimental Methods
2.1. Study Area and Field Sampling
This study was conducted in the Michigan State University (MSU) Sandhill Research Area (SRA: 42.7°N latitude; 84.5°W longitude) located in East Lansing in Ingham County, Michigan (Figure 1; Table 1). Pollen and branches with female catkins from natural stands of aspen parents (i.e., trembling aspen (Populus tremuloides Michx.) [24] and bigtooth aspen (Populus grandidentata Michx.) [25]) derived from different geographical localities were genetically crossed (P. grandidentata × P. tremuloides) and a full-sib progeny test plantation of hybrid poplar (P. × smithii Boivin) [4] was established at the field experiment location in April of 1982 [26,27]. Full-sib progeny testing involves a controlled pollination in which both the maternal and paternal parents are known [7]. Family members from each full-sub maternal and paternal genetic cross have 50% of their genes in common.
Figure 1.
Map of Michigan state counties. Pollen and branches with female catkins were obtained from aspen parents (Populus tremuloides Michx. and Populus grandidentata Michx.) from different counties (indicated by black filled triangles) and a full-sib progeny test plantation of hybrid poplar (Populus × smithii Boivin) was established in the Michigan State University Sandhill Research Area in Ingham county in 1982.


Table 1.
Geographical coordinates and climatic conditions for Michigan state county origins (listed in alphabetical order) of aspen parents of hybrid poplar (Populus × smithii Boivin) for the reference period of 1971–2000 obtained from the National Climatic Data Center [28]. Table abbreviations noted at end of table.
| County | County Abb. | Lat. (°N) | Long. (°W) | Climate Station Name | Station No. | TAVG (ºC) | PPT (mm) |
|---|---|---|---|---|---|---|---|
| Benzie | BEN | 44.63 | 86.25 | FRANKFORT 2 NE | MI2984 | 7.5 | 892 |
| Branch | BRA | 41.92 | 85.05 | COLDWATER STATE SCHOOL | MI1675 | 8.8 | 912 |
| Calhoun | CAL | 42.25 | 85.00 | BATTLE CREEK 5 NW | MI0552 | 9.1 | 899 |
| Chippewa | CHI | 46.32 | 84.52 | DE TOUR VILLAGE | MI2094 | 5.6 | 749 |
| Clare | CLA | 43.99 | 84.84 | GLADWIN | MI3170 | 7.4 | 807 |
| Gladwin | GLA | 43.99 | 84.39 | GLADWIN | MI3170 | 7.4 | 807 |
| Ingham | ING | 42.60 | 84.37 | EAST LANSING 4 S | MI2395 | 8.3 | 785 |
| Iosco | IOS | 44.28 | 83.34 | EAST TAWAS | MI2423 | 7.1 | 789 |
| Iron | IRO | 46.21 | 88.51 | STAMBAUGH 2 SSE | MI7812 | 3.8 | 775 |
| Kalkaska | KAL | 44.69 | 85.08 | TRAVERSE CITY FAA AP | MI8251 | 7.3 | 858 |
| Lake | LAK | 43.99 | 85.81 | BALDWIN | MI0446 | 7.0 | 869 |
| Marquette | MAR | 46.66 | 87.60 | MARQUETTE | MI5178 | 6.0 | 763 |
| Montcalm | MON | 43.31 | 85.15 | GREENVILLE 2 NNE | MI3429 | 8.3 | 882 |
| Oakland | OAK | 42.66 | 83.38 | PONTIAC STATE HOSPITAL | MI6658 | 9.2 | 772 |
| Ogemaw | OGE | 44.33 | 84.13 | LUPTON 1 S | MI4967 | 5.9 | 1,351 |
| Roscommon | ROS | 44.33 | 84.61 | HOUGHTON LAKE WSO AP | MI3936 | 6.4 | 726 |
| Saginaw | SAG | 43.33 | 84.05 | SAGINAW FAA AP | MI7227 | 8.3 | 804 |
| Van Buren | VAN | 42.27 | 86.31 | BLOOMINGDALE | MI0864 | 8.5 | 1,009 |
| Wexford | WEX | 44.34 | 85.58 | CADILLAC | MI1176 | 5.9 | 833 |
Note: County Abb. = first three letter abbreviation of county; Lat. = latitude and Long. = longitude of county. Climate variable abbreviations: TAVG = mean annual temperature; and PPT = total annual precipitation.
Each hybrid poplar was planted in a randomized complete block design with 6 replications [26,27]. Nursery stock (1-0) was initially grown in greenhouses and then machine planted with a revised cultiplanter in April 1982 at a spacing of 2.44 m between row and 1.83 m between trees in the same row. In the year prior to planting, site preparation consisted of mowing vegetation with a rotatory mower in August 1981 combined with spraying with glyphosate herbicide (application rate of 7 L/ha) in 1 m wide strips three to four weeks later. After spring planting, seedlings were spot-sprayed with glyphosate herbicide in July 1982 to control invading grasses.
According to the nearest meteorological station (East Lansing 4S, MI2395) and for the reference period of 1971–2000, mean annual temperature is 8.3 ºC with warmest mean monthly temperatures in July (21.4 ºC) and coldest mean monthly temperatures occurring in January (−5.8 ºC) [28]. Total annual precipitation is 782 mm with most precipitation occurring in August (85.9 mm). Soil conditions at SRA are a fine sandy loam [26,27]. Grasses and perennial weeds constitute the dominant understory vegetation at this site.
Full-sib families of hybrid poplar still represented by at least two surviving members (i.e., at least two out of the 6 replicates) by the end of the 2009 growing season were selected for additional sampling in spring of 2010. Consequently, a total of 18 full-sib families of hybrid poplar were sampled of which P. grandidentata was the maternal component of 7 of the full-sib families and P. tremuloides was the maternal component of 11 of the full-sib families (Table 2). The number of dead individuals of each family is equal to 6 (number of replications) subtract the number of surviving members listed in Table 2. The hybrid poplar trees in each of these full-sib families were sampled with an increment borer from the stem region at breast height (1.3 m) and two increment cores were obtained from opposite sides of each tree (180º apart). Diameter at breast height (DBH) was measured with diameter tape and height of each tree was determined with a laser hypsometer.
Table 2.
Characteristics of full-sib families of hybrid poplar (P. × smithii) including county locations and species of maternal and paternal parents. Growth characteristics are cumulative values after 2009 growing season and are also averaged for families where maternal parent is P. grandidentata or P. tremuloides and the average for all families combined. Full-sib families are listed according to ranking (largest to smallest) of basal area values. The starting year of the annual tree-ring chronologies is also listed. Full-sib families, parental species, and growth variable abbreviations noted at end of table.
| Full-Sib Family | Mat. Species | Pat. Species | Genetic Acc. No. | No. Trees (No. Radii) | DBH (cm) | HT (m) | BA (m2) | VOL (m3) | SC | Chronology Start Year |
|---|---|---|---|---|---|---|---|---|---|---|
| CAL_WEX | P.GRA | P.TRE | 56-6-77 | 2 (4) | 35.2 | 22.6 | 0.0983 | 0.893 | 62.2 | 1987 |
| LAK_MAR | P.TRE | P.GRA | 27-38-27 | 2 (4) | 31.1 | 24.6 | 0.0772 | 0.812 | 79.6 | 1983 |
| BRA_CLA | P.TRE | P.GRA | 4-9-10 | 2 (4) | 30.0 | 23.4 | 0.0729 | 0.704 | 81.6 | 1983 |
| GLA_GLA | P.TRE | P.GRA | 14-21-13 | 2 (4) | 29.6 | 22.2 | 0.0689 | 0.642 | 75.0 | 1987 |
| IOS_GLA | P.TRE | P.GRA | 24-33-13 | 4 (8) | 28.5 | 21.2 | 0.0671 | 0.596 | 78.2 | 1984 |
| VAN_IRO | P.GRA | P.TRE | 78-44-34 | 6 (12) | 28.1 | 18.5 | 0.0651 | 0.514 | 68.6 | 1982 |
| SAG_CHI | P.GRA | P.TRE | 76-40-15 | 2 (4) | 28.4 | 21.2 | 0.0631 | 0.558 | 75.0 | 1987 |
| MAR_CLA1 | P.TRE | P.GRA | 32-45-10 | 2 (4) | 27.5 | 19.7 | 0.0591 | 0.488 | 71.8 | 1984 |
| CAL_IRO | P.GRA | P.TRE | 57-6-34 | 4 (8) | 27.1 | 21.0 | 0.0585 | 0.523 | 78.0 | 1984 |
| WEX_BEN | P.GRA | P.TRE | 81-46-8 | 5 (10) | 27.2 | 20.7 | 0.0585 | 0.505 | 76.6 | 1983 |
| MAR_OAK | P.TRE | P.GRA | 33-45-32 | 4 (8) | 26.4 | 17.1 | 0.0567 | 0.434 | 64.6 | 1986 |
| CHI_KAL | P.TRE | P.GRA | 8-14-21 | 2 (4) | 25.8 | 20.0 | 0.0533 | 0.432 | 80.3 | 1986 |
| ROS_OAK | P.TRE | P.GRA | 44-71-32 | 2 (4) | 25.4 | 17.8 | 0.0517 | 0.368 | 72.8 | 1984 |
| MON_VAN | P.GRA | P.TRE | 70-31-73 | 3 (6) | 22.4 | 16.8 | 0.0401 | 0.294 | 74.2 | 1987 |
| GLA_CHI | P.TRE | P.GRA | 12-21-8 | 3 (6) | 22.4 | 19.9 | 0.0393 | 0.328 | 89.1 | 1985 |
| OGE_GLA | P.GRA | P.TRE | 73-33-22 | 2 (4) | 20.8 | 15.5 | 0.0375 | 0.273 | 76.9 | 1984 |
| MAR_ING | P.TRE | P.GRA | 28-43-16 | 3 (6) | 19.3 | 16.7 | 0.0299 | 0.218 | 86.6 | 1983 |
| MAR_CLA2 | P.TRE | P.GRA | 29-43-10 | 2 (4) | 19.3 | 17.6 | 0.0294 | 0.217 | 91.5 | 1985 |
| Mean | P.TRE | P.GRA | - | 2.5 (5.1) | 25.9 | 20.0 | 0.0550 | 0.476 | 79.2 | 1985(1987)* |
| Mean | P.GRA | P.TRE | - | 3.4 (6.9) | 27.0 | 19.5 | 0.0602 | 0.508 | 73.1 | 1985(1987)* |
| Mean | All Combined | - | 2.9 (5.8) | 26.3 | 19.8 | 0.0570 | 0.489 | 76.8 | 1985(1987)* | |
Note: First three letters of full-sib family abbreviation refer to location of maternal county, and last three letters refer to paternal county; c.f. Table 1 for full county names. Maternal (Mat.) and paternal (Pat.) species abbreviations: P.TRE = Populus tremuloides and P.GRA = Populus grandidentata. Genetic Acc. No. = Accession number of full-sib family followed by accessions numbers of maternal and paternal parents. Cumulative growth variable abbreviations: DBH = diameter at breast height (1.3 m); HT = total tree height (m); BA = stem basal area at DBH; VOL = total stem volume; and SC = slenderness coefficient which is the ratio of height to diameter in same units (m). * In parentheses is the maximum start year that all full-sib families had a overlapping tree-ring chronology time period.
2.2. Sample Processing and Dendrochronological Measurements
All wood increment cores were processed according to standard dendrochronological techniques and sanded with progressively finer grades of sandpaper to highlight annual rings [29]. All samples within each full-sib family were visually crossdated under a binocular microscope to identify any missing and/or false double rings [30]. All samples were digitally scanned at an optical resolution of 1,200 dpi. Annual ring width was measured using an image analysis software-based system (CooRecorder and DendroScan: Cybis Elektronik and Data AB, Sweden). Difficult sections of some increment cores containing extremely narrow rings were measured with a stage micrometer coupled with a stereo microscope to an accuracy of 0.001 mm (Velmex: Bloomfield, New York).
Annual ring measurements were converted to annual basal area increment values (cm2 year−1). At the end of each growth year, annual ring width measurements from each increment core of each tree was converted to cumulative measures of diameter inside bark (DIB). If coring missed the pith, the missing radius was estimated from the difference of half of the diameter outside bark (DOB) taken in the field and total cumulative radial measurements plus bark retained in each core [31]. Cumulative basal area values were derived from cumulative DIB values and the formula for the area of a circle. Annual basal area increment values (cm2 year−1) were obtained by subtracting cumulative basal area in the previous year (t−1) from the current year (t).
Volume of each tree at the time of sampling at the end of the 2009 growing season was determined for each tree using the following equation developed by Gevorkiantz and Olsen [32]:
where V = the peeled volume of an individual stem; F = the cylinder form factor and for trees >9.14 m, F = 0.42; B = basal area (m2) determined from DOB; and H = tree height (m). A slenderness coefficient describing tree form was also calculated for each tree by dividing height (m) by DBH (expressed in m) resulting in a dimensionless parameter [33]. Trees experiencing high competition generally show increased values of the slenderness coefficient.
V = FBH
A two-sample t-test with separate variance (SYSTAT version 10.2, procedure TTEST) was used to compare growth variables (DBH, height, basal area, volume, and slenderness coefficient) between whether full-sib families had either P. grandidentata or P. tremuloides as the maternal parent.
2.3. Analyses of Full-Sib Families
Using Pearson correlation analyses, averaged growth performance of each full-sib family was compared to geographical and climatic characteristics of parental county origin. Growth performance variables for each full-sib family included cumulative DBH, height, volume, and basal area after the end of the 2009 growing season. Geographical variables included the straight line distance (km) and latitudinal distance (km) between maternal county location and paternal county location; distances between maternal county location and Ingham county (site location of hybrid poplar plantation); and distances between paternal county location and Ingham county. Climatic normal variables included mean temperature and total precipitation for the annual period of January to December and for the growing season period of June to October. Specifically, cumulative growth performance of each full-sib family was compared to differences in these climatic variables between maternal county location and paternal county location; differences in these climatic variables between maternal county location and Ingham county (site location of hybrid poplar plantation); and differences in these climatic variables between paternal county location and Ingham county.
2.4. Growth-Climate Analyses: Interannual Scale
Monthly climate data was obtained from the meteorological station (East Lansing 4S, MI2395) nearest to the MSU Sandhill Research Area over the record period of 1953–2009 [28]. However, climate records were interrupted in 2009 leading to many missing values. Consequently, subsequent growth-climate analyses did not include the year 2009. The primary climate variables provided included mean monthly temperature and total monthly precipitation. These primary variables were used as the basis to produce a synthetic monthly climatic moisture index (CMI) variable calculated as precipitation subtract potential evapotranspiration (PET) [34]. Monthly values of PET are primarily a function of mean vapor pressure deficit which in turn is estimated from monthly temperature. Consequently, CMI combines the effects of both precipitation and temperature on soil moisture regimes. Since tree growth may respond more strongly with climatic variables at the seasonal scale, monthly climatic variables were converted to seasonal 3-month periods (temperature variables averaged during 3-month periods, and precipitation and moisture index variables were summed during 3-month periods).
Interannual basal area increment time series for each increment core were standardized to remove age-related trends [19]. Standardization was based on applying a linear, locally weighted regression (Loess) with a neighborhood span equivalent to 10 years using the function ‘loess’ (package STATS) in the program R [35]. The 10-year neighborhood window for determining the LOESS regression estimate for growth of a certain year is the growth in the 10 nearest years. Growth in the years closer to the year of estimate are weighted much heavier than years farther away using a tricubic weighting formula (Venables and Ripley 2002). Each year Basal area index (BAI) was calculated as the ratio of their observed versus predicted values from the Loess model. BAI values derived from the two increment cores of each tree were averaged together then summarized further by determining averages for each full-sib family of P. × smithii. BAI was also averaged for the 7 full-sib families of which P. grandidentata was the maternal component, and similarly, BAI was averaged for the 11 full-sib families for which P. tremuloides was the maternal component. Principal component analysis (PCA) was conducted on a covariance matrix (SYSTAT version 10.2, procedure FACTOR) of the BAI growth chronologies of the 18 full-sib families over the common period shared by all chronologies (1987–2008) [36,37].
The standardized BAI were related to monthly and seasonal climate variables using Pearson correlation analyses. This analysis was conducted over the common 22-year growth period (1987–2008) of all 18 full-sib families of hybrid poplar and included climate variables spanning over two growing seasons to examine the lagged effect of climatic factors (April of the prior year (t−1) to October of the current year (t) of diameter growth). At the 3-month seasonal scale, there is a total of 17 seasonal variables: i.e., April (t−1) to June (t−1), May (t−1) to July (t−1), June (t−1) to August (t−1), and so on, such that the remaining 14 variables are derived by shifting the start and end months of the preceding 3-month variable forward by 1 month.
3. Results
3.1. Full-Sib Family Characteristics
The top three full-sib families of P. × smithii that had the highest DBH, height, basal area and volume were CAL_WEX, LAK_MAR, and BRA_CLA (Table 2). In particular, CAL_WEX had a average per tree DBH of 35.2 cm, basal area of 0.0983 m2, and volume of 0.893 m3. The bottom three full-sib families that had the lowest DBH, basal area, and stem volume were OGE_GLA, MAR_ING, and MAR_CLA2. Furthermore, CAL_WEX had the lowest slenderness coefficient (62.2) while MAR_CLA2 had the highest slenderness coefficient (91.5). There were no significant differences in the growth variables (DBH, height, basal area, volume) between the two groupings based on whether the maternal species was either P. grandidentata or P. tremuloides (all P ≥ 0.05).
3.2. Relationships between growth and geographical variables and climatic normals
Average per tree DBH (r = −0.471), basal area (r = −0.473), and volume (r = −0.487) of full-sib families were significantly negatively correlated with the straight line distance between maternal county and Ingham county (all P < 0.05) (Table 3). In other words, full-sib families with a maternal parent originating from a county close to the site of the study plantation in Ingham county tended to have higher DBH, basal area, and volume. There were no statistically significant relationships between growth variables of full-sib families and the latitudinal distances between maternal and paternal counties, and between maternal and Ingham and paternal and Ingham county locations (all P > 0.05).
Table 3.
Pearson correlation coefficients between growth characteristics of 18 full-sib families of hybrid poplar (P. × smithii) and geographical variables.
| Geographical Variables | DBH (cm) | Height (m) | Basal Area (m2) | Volume (m3) |
|---|---|---|---|---|
| a) Straight line distance (km) between counties: | ||||
| Maternal and paternal | −0.110 | −0.166 | −0.112 | −0.128 |
| Maternal and Ingham | −0.471* | −0.454 | −0.473* | −0.487* |
| Paternal and Ingham | 0.330 | 0.452 | 0.301 | 0.357 |
| b) Latitudinal distance (km) between counties: | ||||
| Maternal and paternal | 0.155 | 0.049 | 0.136 | 0.105 |
| Maternal and Ingham | −0.202 | −0.074 | −0.226 | −0.218 |
| Paternal and Ingham | 0.199 | 0.313 | 0.169 | 0.179 |
* denotes significant correlation coefficients (P < 0.05).
Cumulative height growth (r = 0.478, P < 0.05) of full-sib families of P. × smithii at the time of plantation sampling was positively correlated with annual mean temperature difference between maternal and paternal county locations (Table 4). DBH (r = 0.518), basal area (r = 0.528), and volume (r = 0.528) of full-sib families were positively correlated to the annual mean temperature difference between maternal and Ingham county locations (all P < 0.05). In contrast, there were no significant relationships between growth of full-sib families and total annual precipitation differences between county locations.
DBH, height, basal area, and volume growth variables of full-sib families were significantly positively correlated with the summer mean temperature difference between maternal and paternal county locations (all P < 0.05) (Table 4). Similarly, DBH, basal area, and volume of full-sib families were positively correlated with the summer mean temperature difference between maternal county location and Ingham county (all P < 0.05). Height growth of full-sib families were positively correlated with the summer total precipitation difference between maternal and paternal county locations. Furthermore, volume growth of full-sib families was directly associated with the summer total precipitation difference between both maternal and paternal county locations as well as maternal and Ingham county locations.
Table 4.
Pearson correlation coefficients between growth characteristics of 18 full-sib families of hybrid poplar (P. × smithii) and climatic normal variables (reference period of 1971–2000). Climate variable abbreviations noted at end of table.
| Climate Normal Variables | DBH (cm) | Height (m) | Basal Area (m2) | Volume (m3) |
|---|---|---|---|---|
| a) Annual TAVG difference between counties: | ||||
| Maternal and paternal | 0.463 | 0.478* | 0.467 | 0.485* |
| Maternal and Ingham | 0.518* | 0.459 | 0.528* | 0.528* |
| Paternal and Ingham | −0.337 | −0.408 | −0.335 | −0.365 |
| b) Annual PPT difference between counties: | ||||
| Maternal and paternal | −0.021 | −0.116 | 0.034 | 0.046 |
| Maternal and Ingham | −0.074 | −0.206 | −0.014 | −0.013 |
| Paternal and Ingham | −0.118 | −0.191 | −0.117 | −0.145 |
| c) Growing season TAVG difference between counties: | ||||
| Maternal and paternal | 0.472* | 0.501* | 0.476* | 0.501* |
| Maternal and Ingham | 0.500* | 0.453 | 0.506* | 0.506* |
| Paternal and Ingham | −0.359 | −0.444 | −0.361 | −0.400 |
| d) Growing season PPT difference between counties: | ||||
| Maternal and paternal | 0.404 | 0.487* | 0.422 | 0.500* |
| Maternal and Ingham | 0.431 | 0.364 | 0.455 | 0.470* |
| Paternal and Ingham | 0.092 | −0.044 | 0.102 | 0.051 |
Note: * denotes significant correlation coefficients (P < 0.05). Climate variable abbreviations: TAVG = mean temperature; and PPT = total precipitation. Annual climate variables for period of January-December and summer climate variables refer to period of June-October.
3.3. Interannual Growth Chronology Characteristics
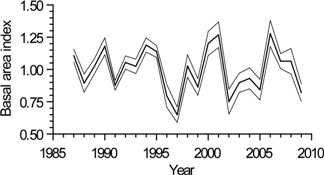
The temporal patterns of the basal area index (BAI) growth chronology of all 18 full-sib families of P. × smithii combined indicated that the three lowest years of below-average growth (BAI values < 1) occurred in 1997, 2002, and 2009 (Figure 2). The three highest years of above-average growth (BAI values > 1) occurred in 1994, 2001, and 2006.
Figure 2.
Basal area index (BAI) growth chronology of all 18 full-sib families of hybrid poplar (P. × smithii) combined (bold line) and the lower and upper limits of a 95% confidence interval of the mean (thin lines).
Figure 2.
Basal area index (BAI) growth chronology of all 18 full-sib families of hybrid poplar (P. × smithii) combined (bold line) and the lower and upper limits of a 95% confidence interval of the mean (thin lines).

Figure 3.
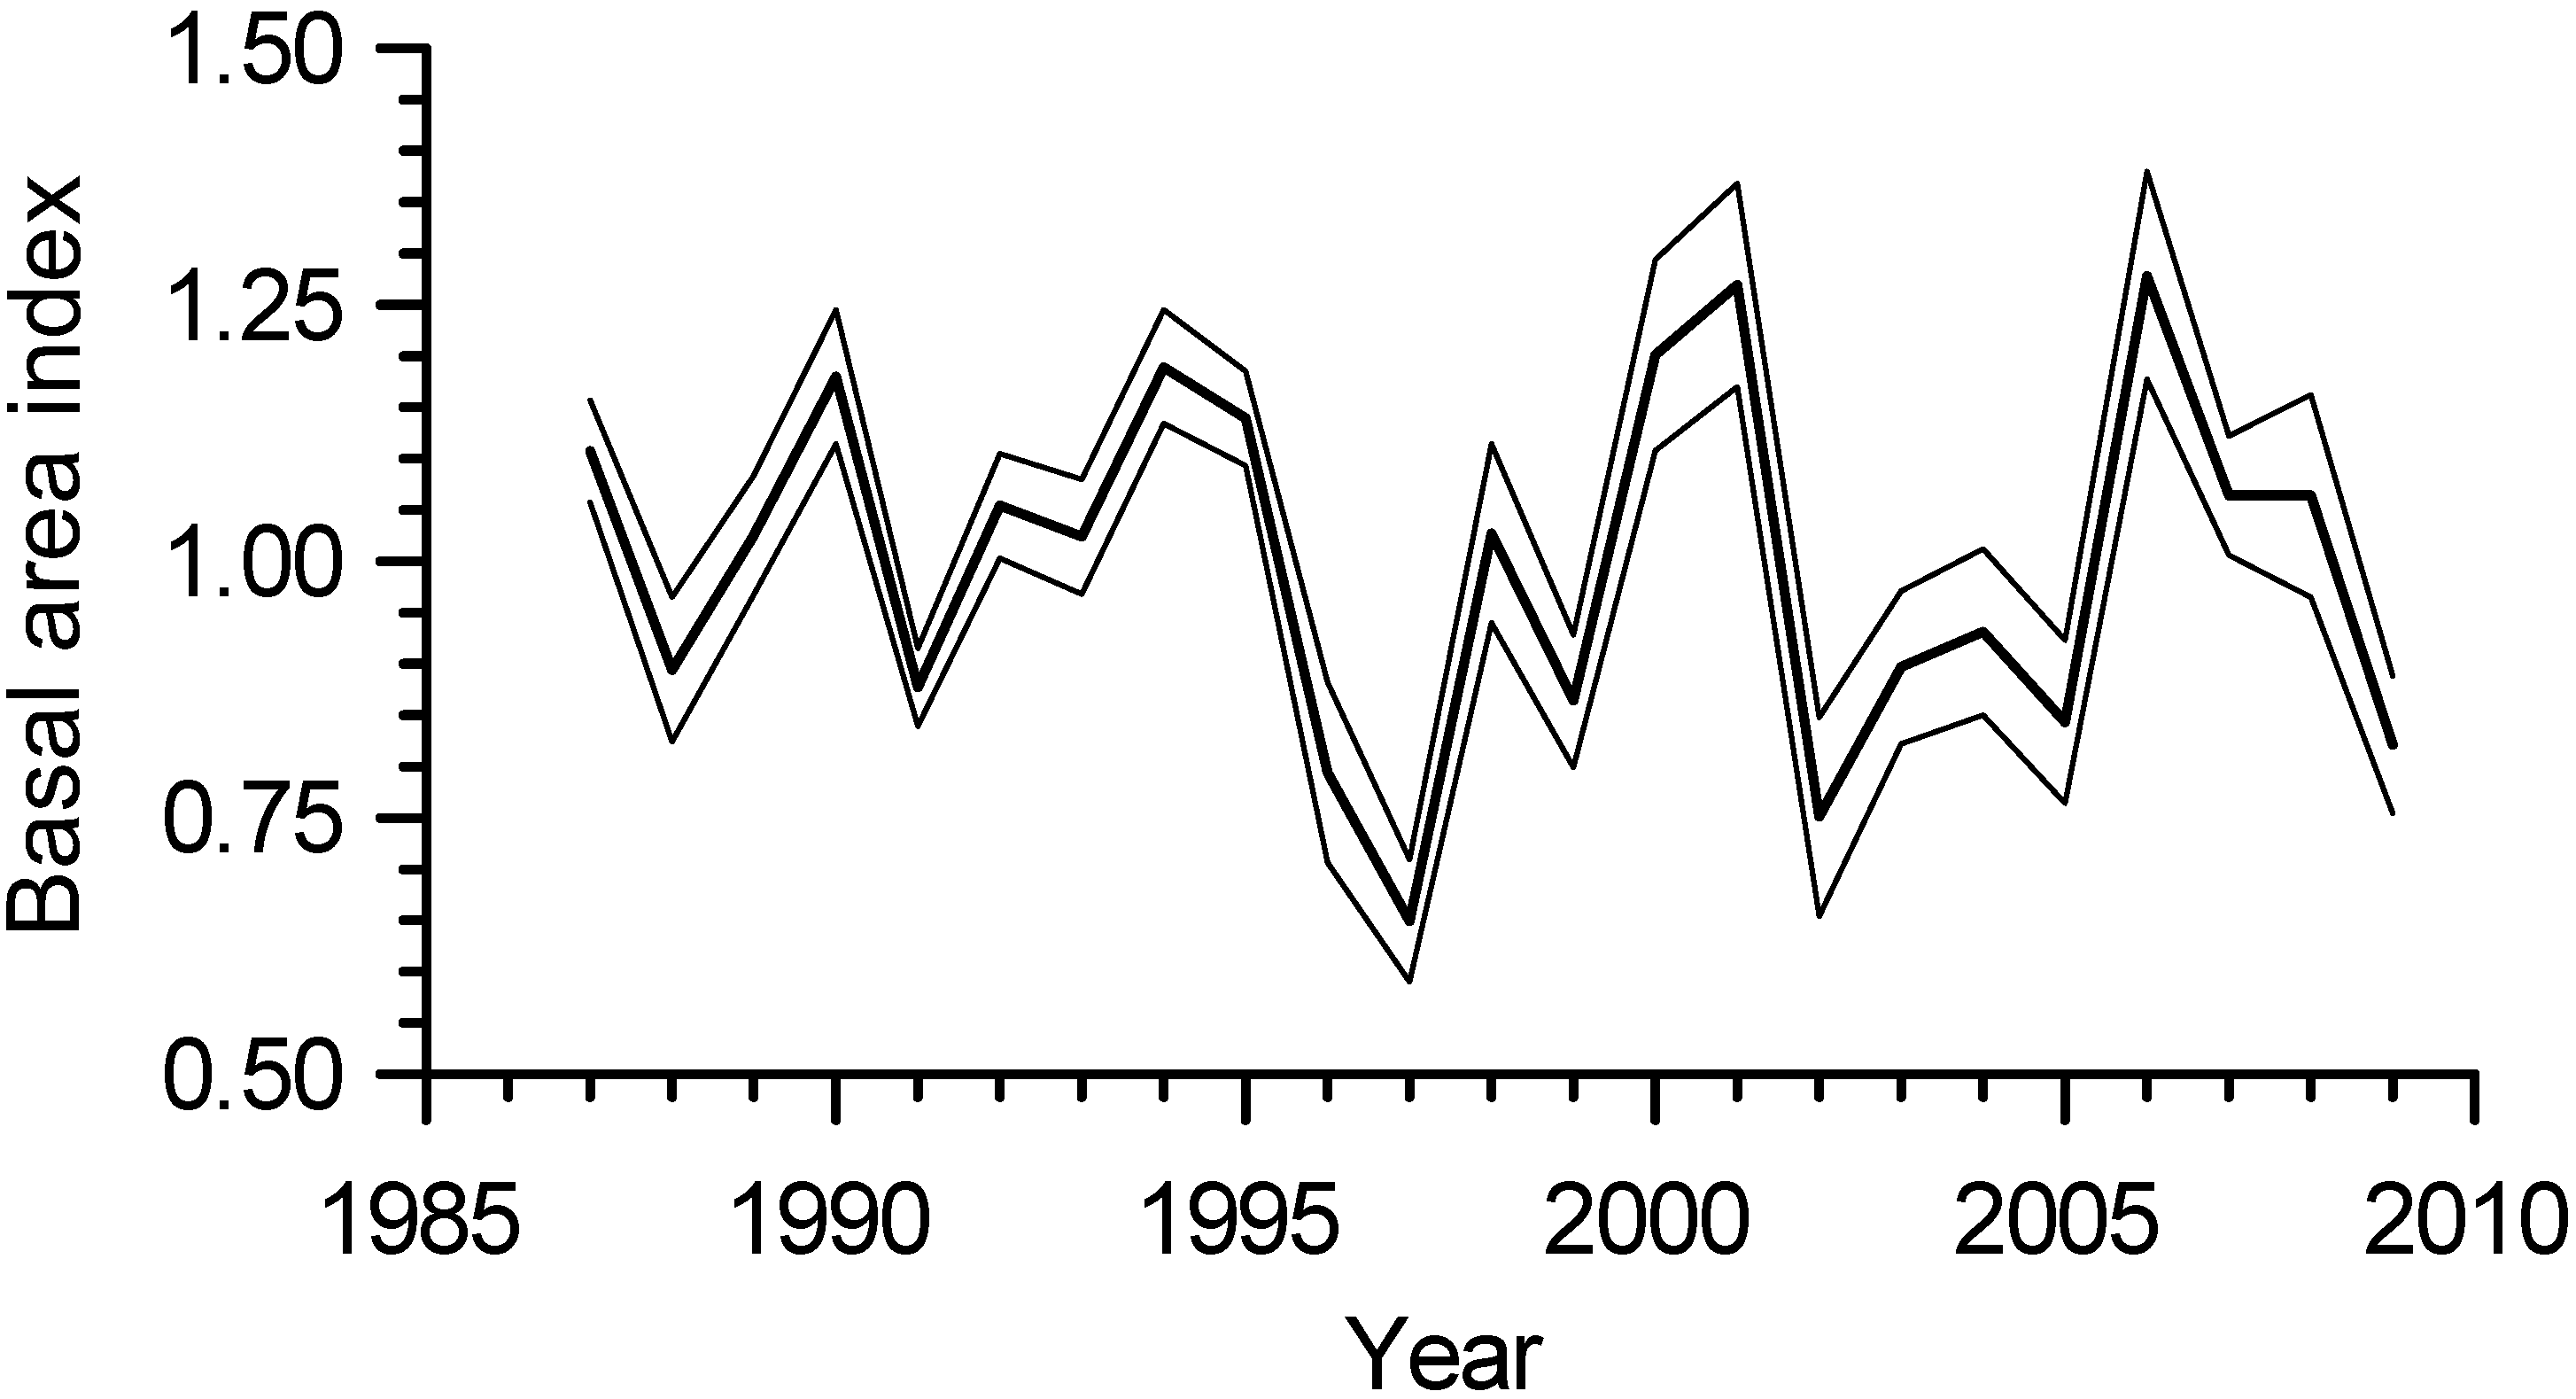
Principal component analysis of the basal area index (BAI) growth chronologies of all 18 full-sib families of hybrid poplar (P. × smithii): (a) percentage of the observed total variance explained by each of the first four principal components (PC1-PC4) compared with the expected values from the broken stick null model [36,37]; and (b) loadings of each of the BAI chronologies of the 18 full-sib families onto PC1.
Figure 3.
Principal component analysis of the basal area index (BAI) growth chronologies of all 18 full-sib families of hybrid poplar (P. × smithii): (a) percentage of the observed total variance explained by each of the first four principal components (PC1-PC4) compared with the expected values from the broken stick null model [36,37]; and (b) loadings of each of the BAI chronologies of the 18 full-sib families onto PC1.

Principal component analysis (PCA) of the 18 full-sib families of P. × smithii indicated that only the percentage of the total variance explained by the first principal component (PC1) (63.5%) was greater than that expected under the broken stick null model (19.4%); consequently, this indicates that PC1 is the only meaningful principal component to interpret [36,37] (Figure 3a). In the broken stick null model, the variance shared among all of the possible principal component axes is represented by a stick of unit length. This unit stick is broken at random into a number of pieces equivalent to the number of principal component axes and this is done a large number of times. The expected value of explained variance for each axis under this null model is equivalent to the relative mean length of the first longest pieces, the second longest pieces, and so on. The BAI growth chronologies of 17 of the 18 full-sib families generally had the same sign and similar magnitude of the their loadings on the PC1 (Figure 3b). The MAR_CLA2 full sib family differed greatly from the other full sib-families by having a slightly negative (−0.001) loading value onto PC1.
3.4. Interannual Growth-Climate Relationships
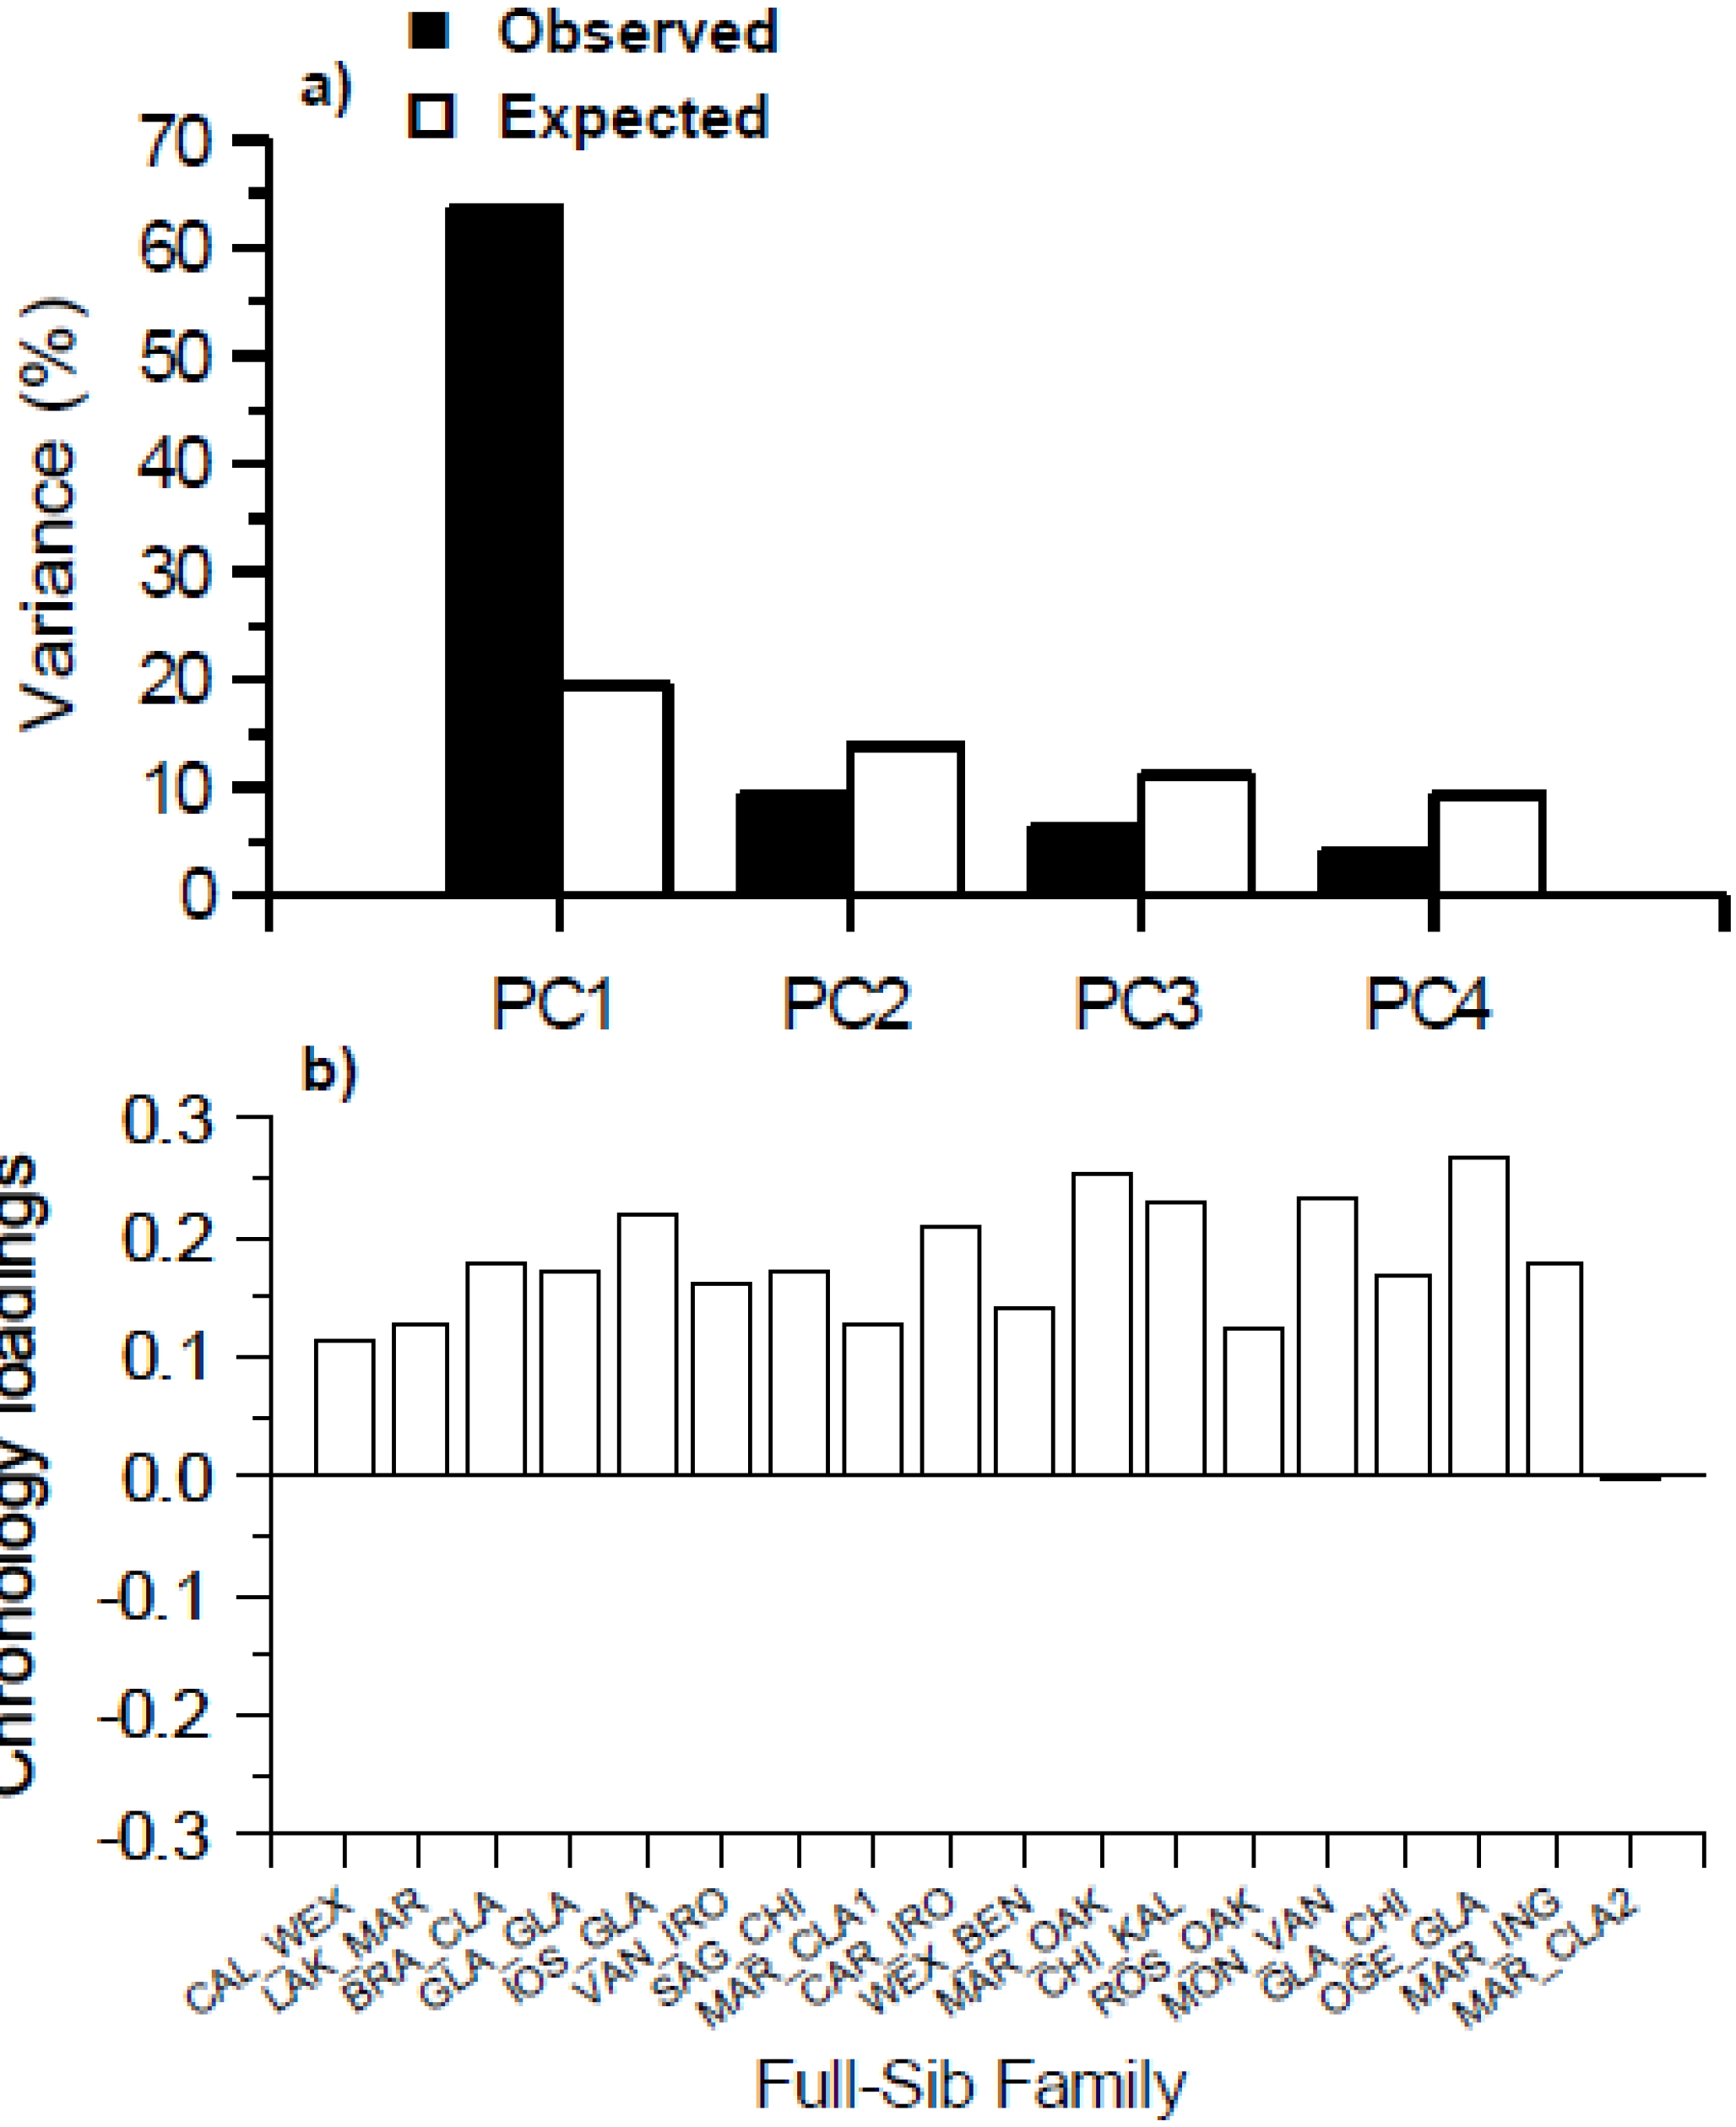
The temporal patterns of the BAI growth chronologies of each 18 full-sib family of P. × smithii generally showed a weak positive relationship to mean monthly temperature (Figure 4a). BAI growth of the full-sib families was most frequently positively associated (4 full-sib families: CAL_WEX, BRA, CLA, MAR_CLA1, and MAR_OAK) with March temperature of the current year (t) with a mean correlation coefficient of (mean r) 0.26. Three full-sib families also responded positively to January temperature (mean r = 0.25). Compared to mean temperature, BAI of the full-sib families generally responded more strongly to precipitation (Figure 4b). Specifically, BAI of 11 full-sib families showed a positive response to October (t) precipitation (mean r = 0.44). The next strongest relationship was a negative association between BAI and December precipitation of the previous year (t−1) for 7 full-sib families (mean r = −0.36).
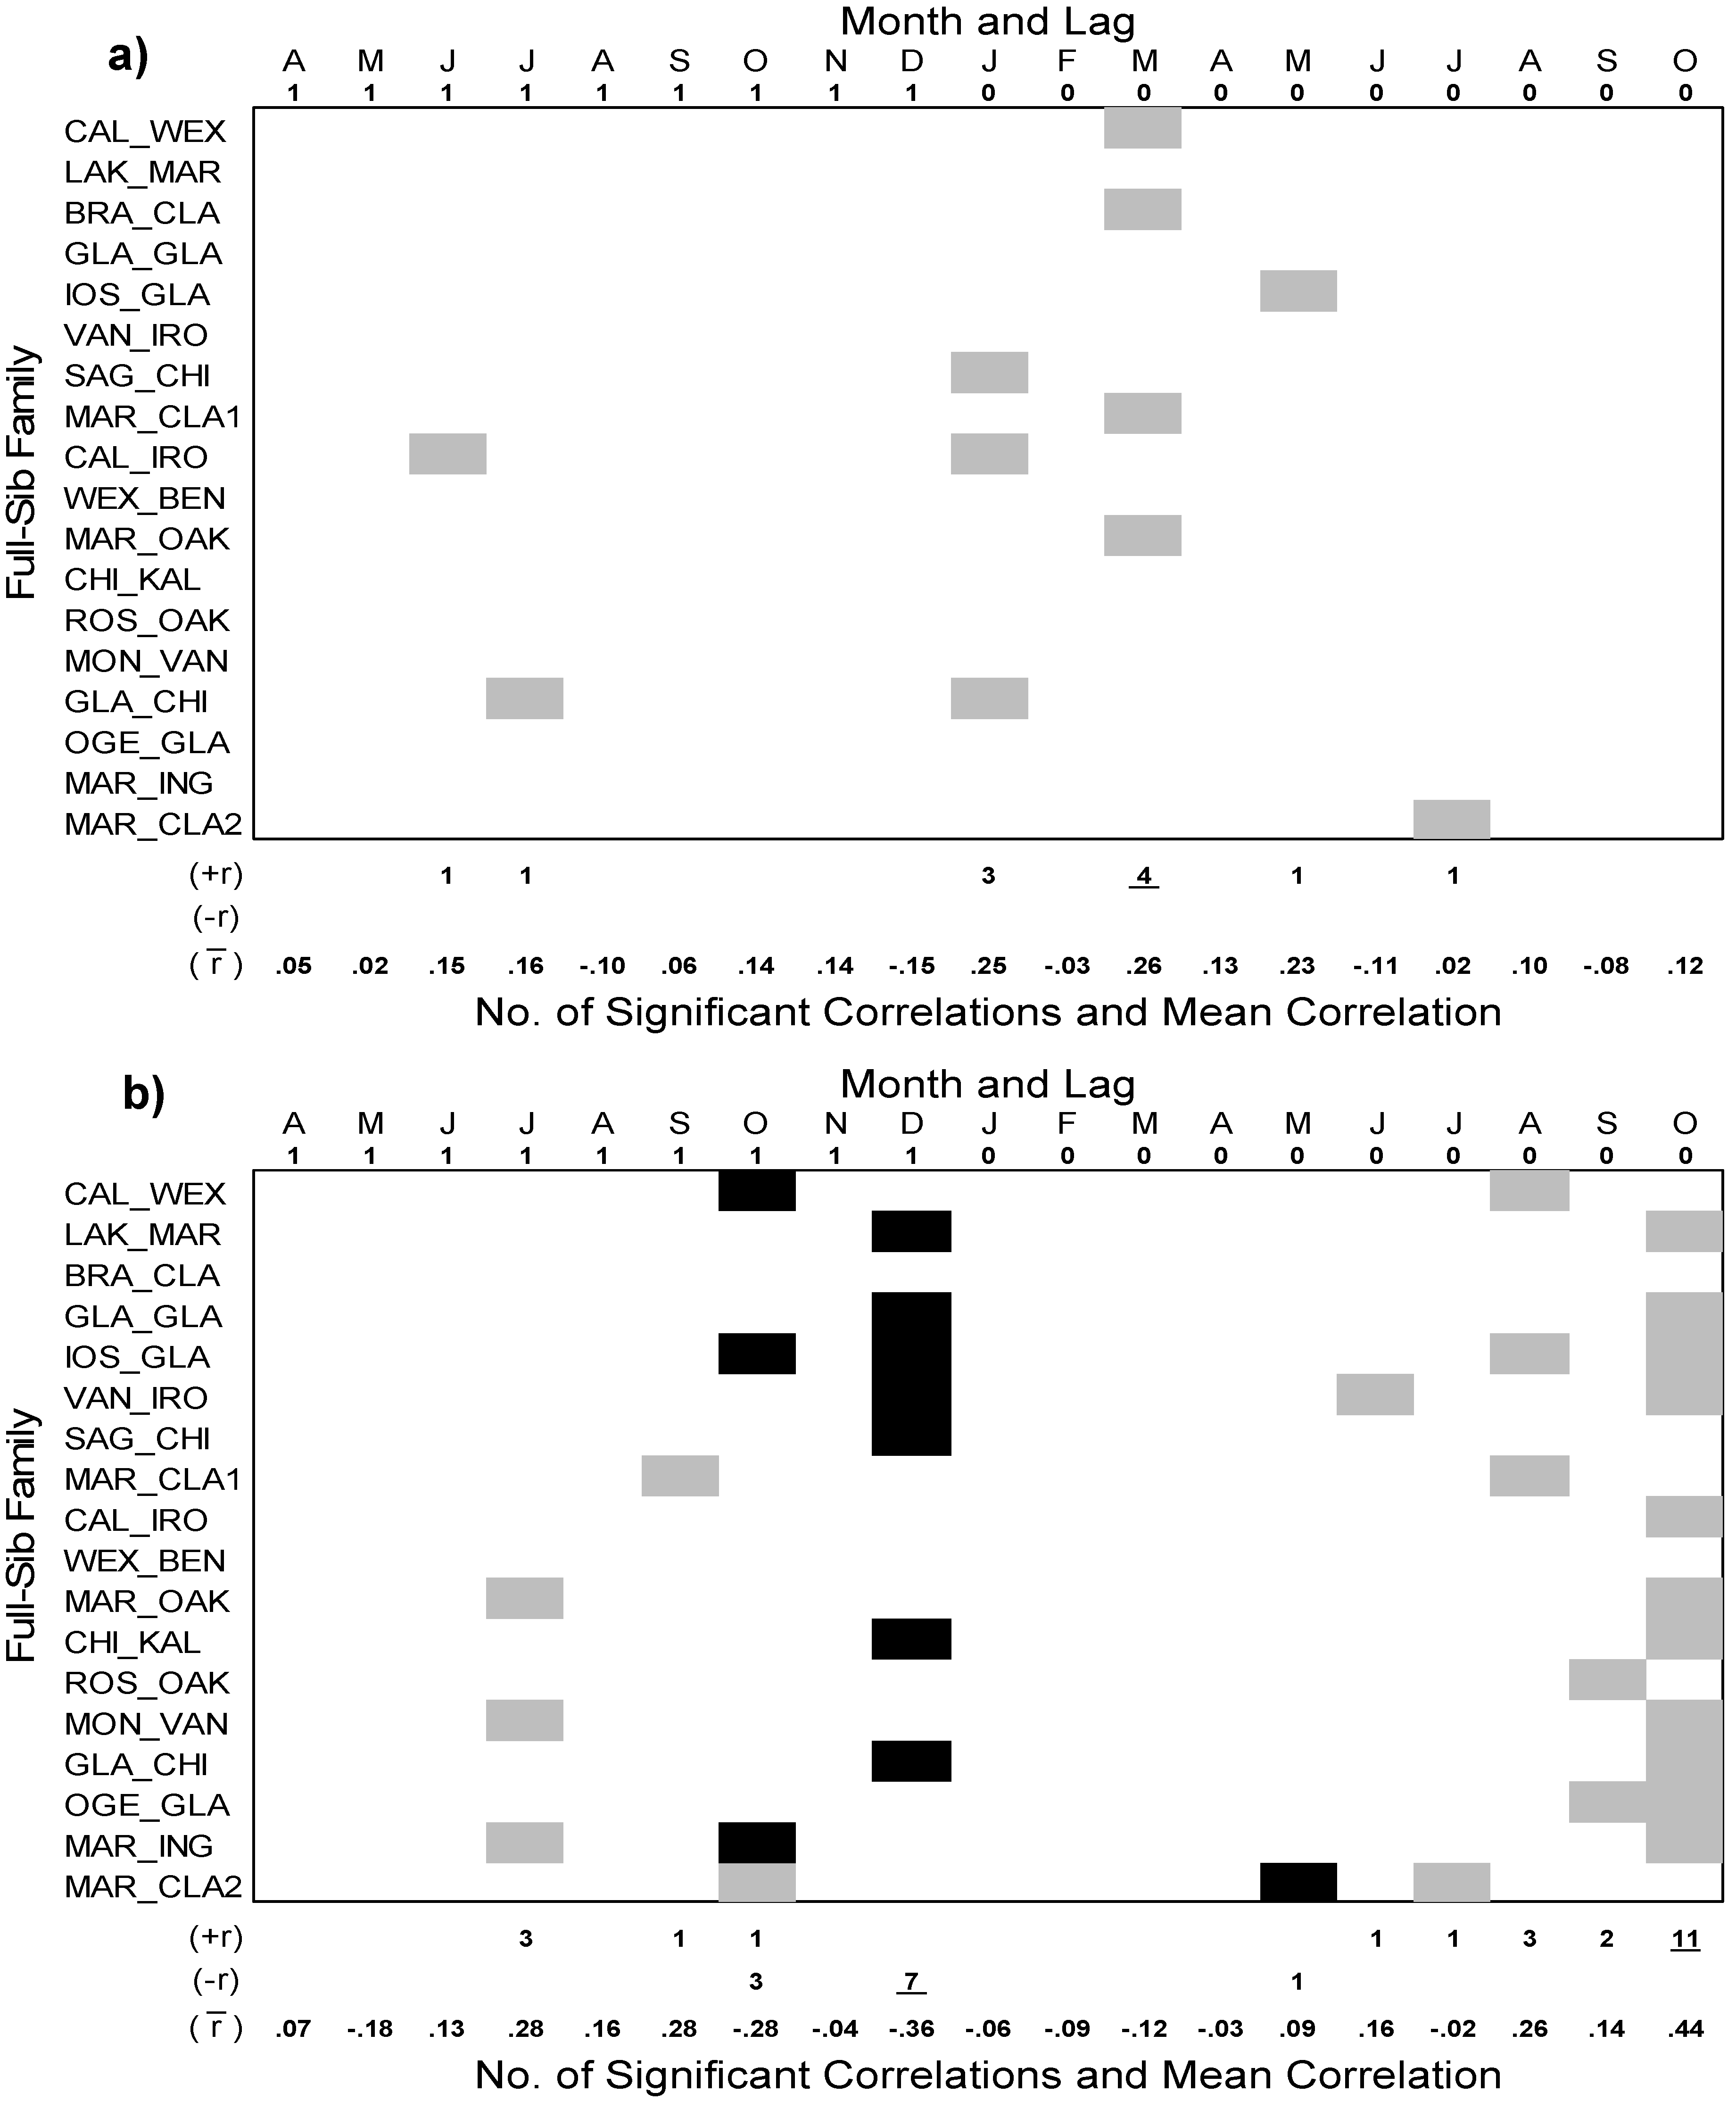
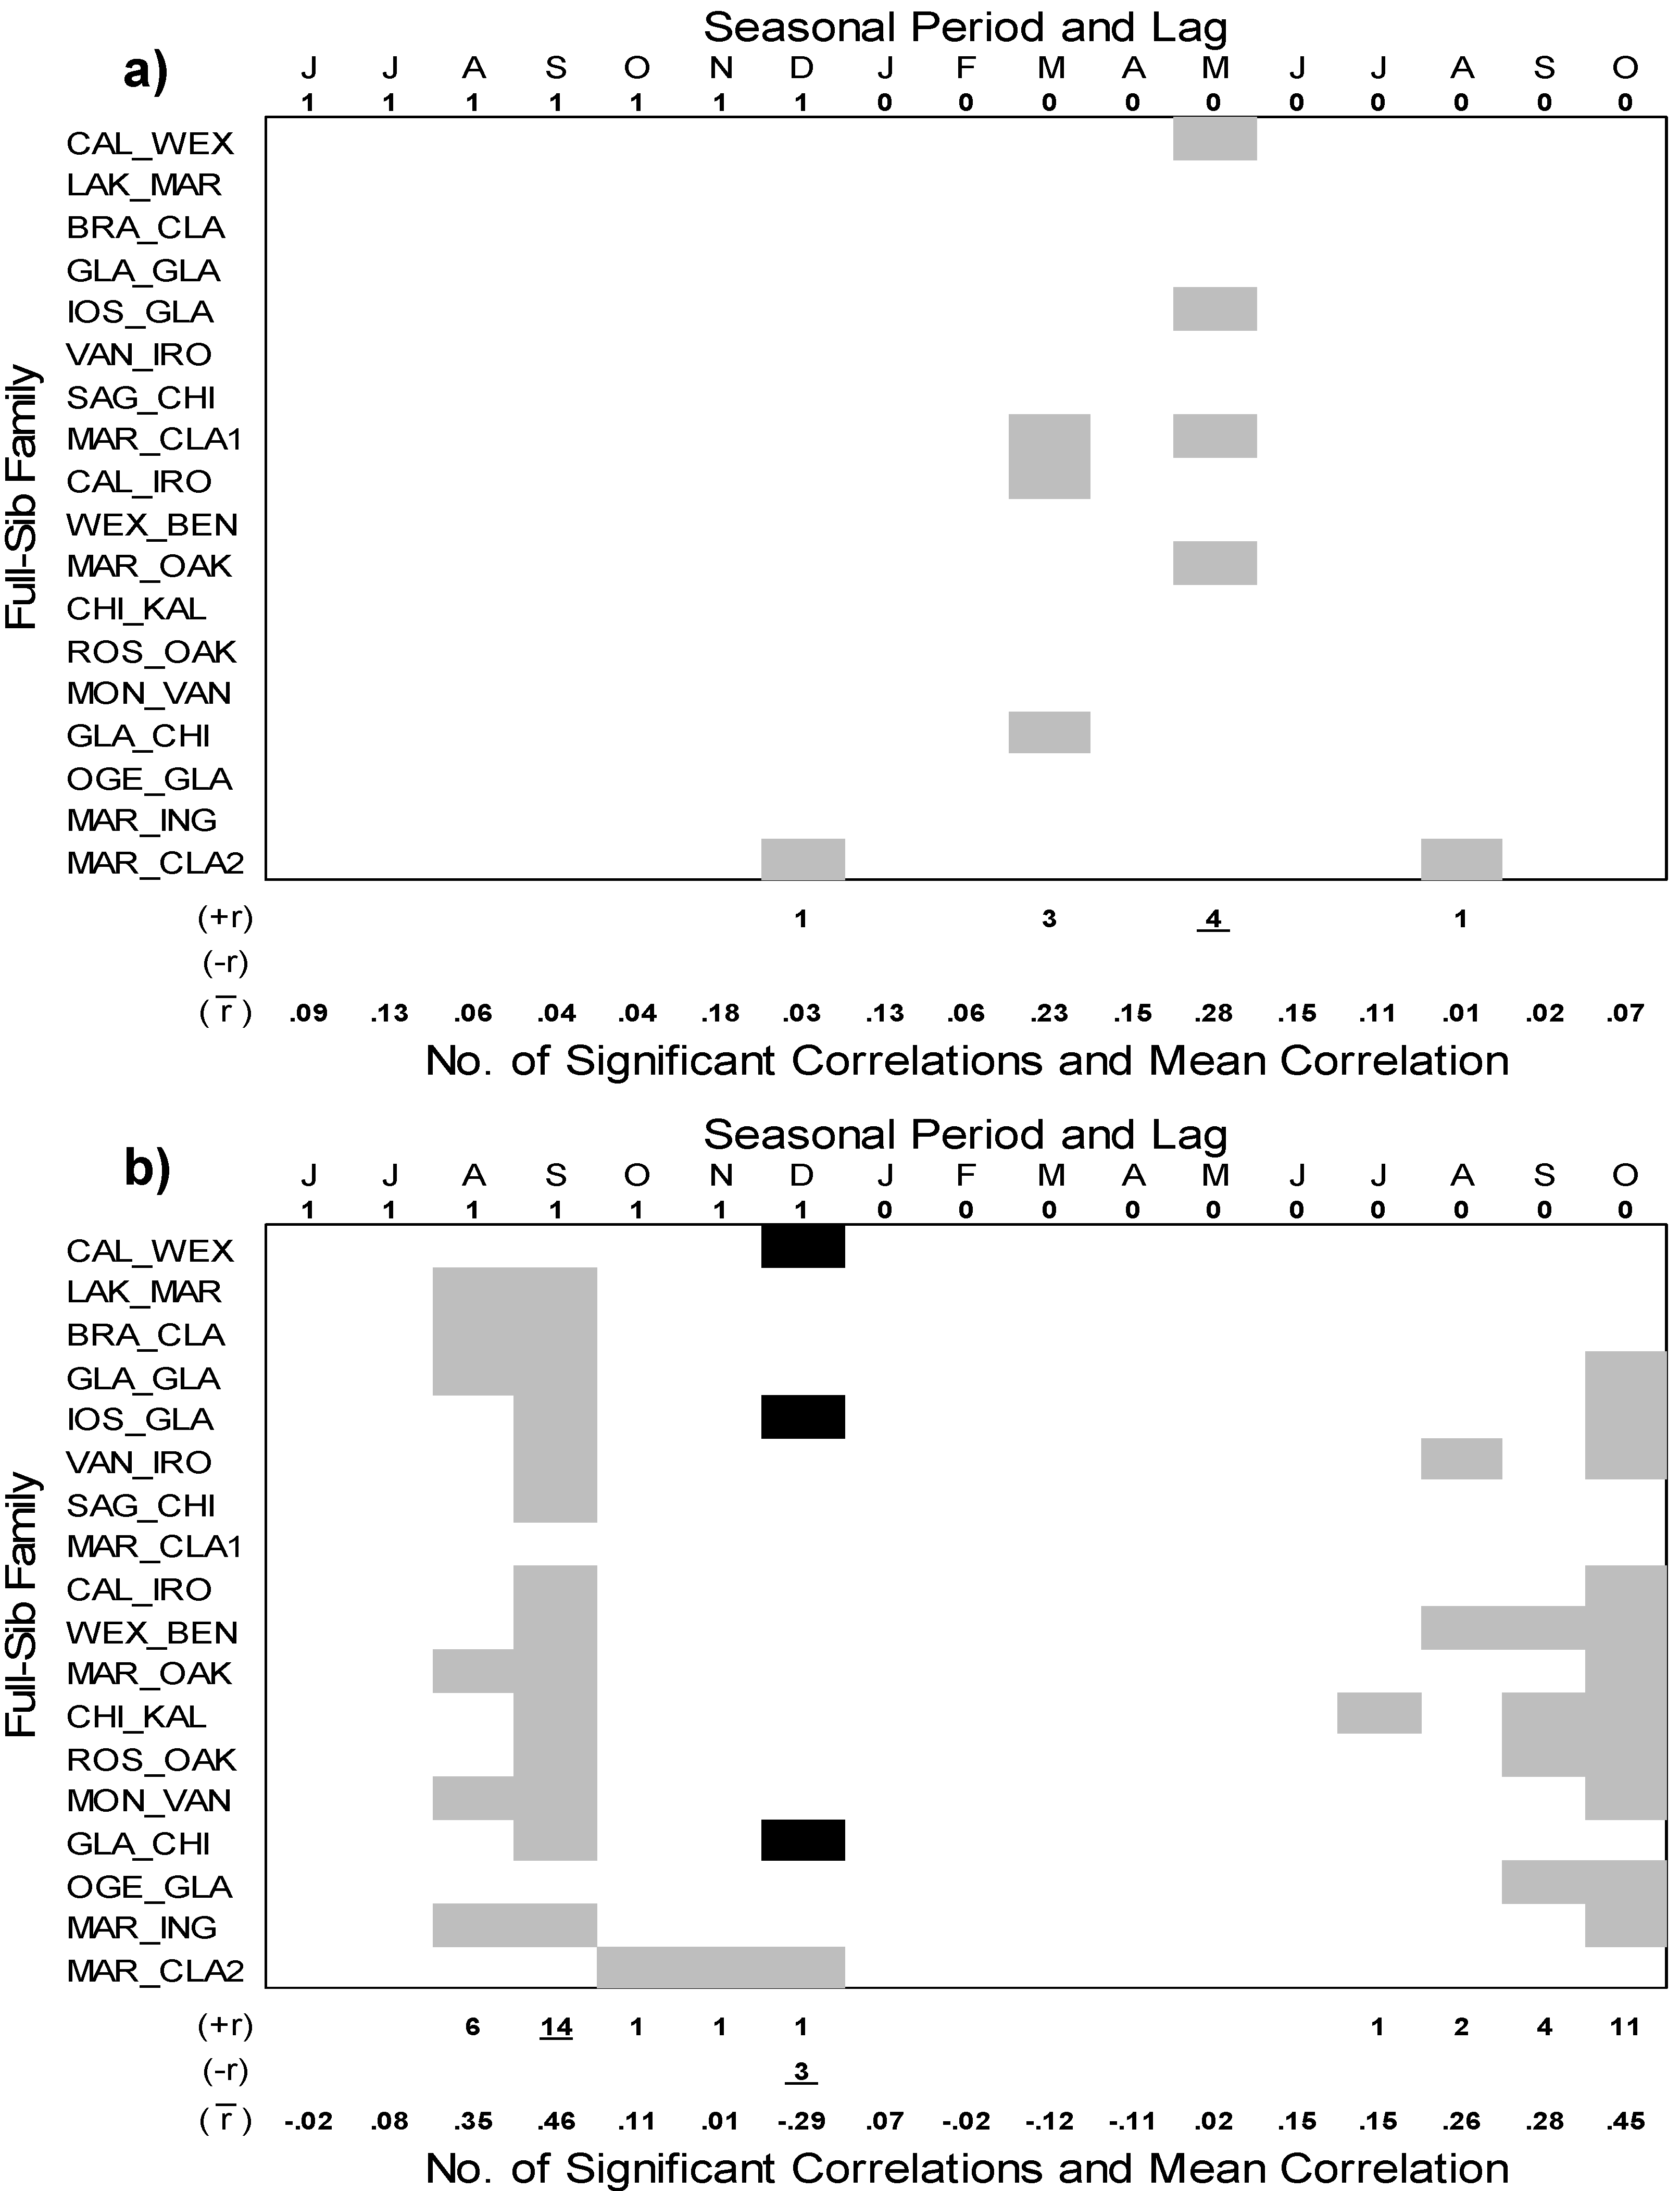
At the seasonal scale, BAI of the full-sib families responded mainly to the 3 month temperature period ending in May (t−1), but the number of full-sib families responding to this climatic factor did not change (4 families) and the strength of this relationship only slightly increased (mean r = 0.28) (Figure 5a) compared with monthly March (t) temperature (Figure 4a). In contrast to mean temperature, seasonalizing the precipitation variables greatly increased the number of full-sib families (14) that responded to 3 month precipitation amounts ending in September of the previous year (t−1) (Figure 5b). While the number of full-sib families (11) and strength of the positive relationship (mean r = 0.45) to 3 month precipitation amounts ending in October (t) did no change, two families (WEX_BEN and ROS_OAK) went from no response to monthly October (t) precipitation to significant responses to this seasonal precipitation period. The frequency (4 families) and strength of the relationship (mean r = −0.29), however, weakened for responses to 3 month precipitation amounts ending in December (t−1). The full-sib family with the lowest amount of growth (MAR_CLA2) was positively related to 3 month precipitation ending in December (t−1) which is in contrast to the negative relationship to this precipitation period shown in other families (CAL_WEX and IOS_GLA). Responses of BAI of the full-sib families to the Climate Moisture Index (CMI) generally mirrored the responses to precipitation at either the monthly or seasonal scale and are therefore not presented.
Figure 4.
Pearson’s correlation coefficients between the standardized basal area index (BAI) growth chronologies of 18 full-sib families of hybrid poplar (P. × smithii) with monthly climate variables: (a) mean temperature; and (b) total precipitation. The analysis was conducted from 1987–2008 and spanning two growing seasons from April of the prior year (lag 1 = t−1) to October of the current year (lag 0 = t). Significant (P < 0.05) positive relationships denoted by gray boxes, and significant (P < 0.05) negative relationships indicated by black boxes. The number of significant positive and negative correlation coefficients are shown below each figure with the highest number for each underlined. The mean correlation coefficient for each month is also indicated.

Figure 5.
Pearson’s correlation coefficients between the standardized basal area index (BAI) growth chronologies of all 18 full-sib families of hybrid poplar (P. × smithii) with seasonal (3 month periods) climate variables: (a) mean temperature; and (b) total precipitation. The analysis was conducted from 1987-2008 and all possible 3 month periods were considered that spanned two growing seasons from April of the prior year (lag 1 = t−1) to October of the current year (lag 0 = t). The monthly abbreviations indicate the month at which a 3 month period ends. Significant (P < 0.05) positive relationships denoted by gray boxes, and significant (P < 0.05) negative relationships indicated by black boxes. The number of significant positive and negative correlation coefficients are shown below each figure with the highest number for each underlined. The mean correlation coefficient for each month is also indicated.

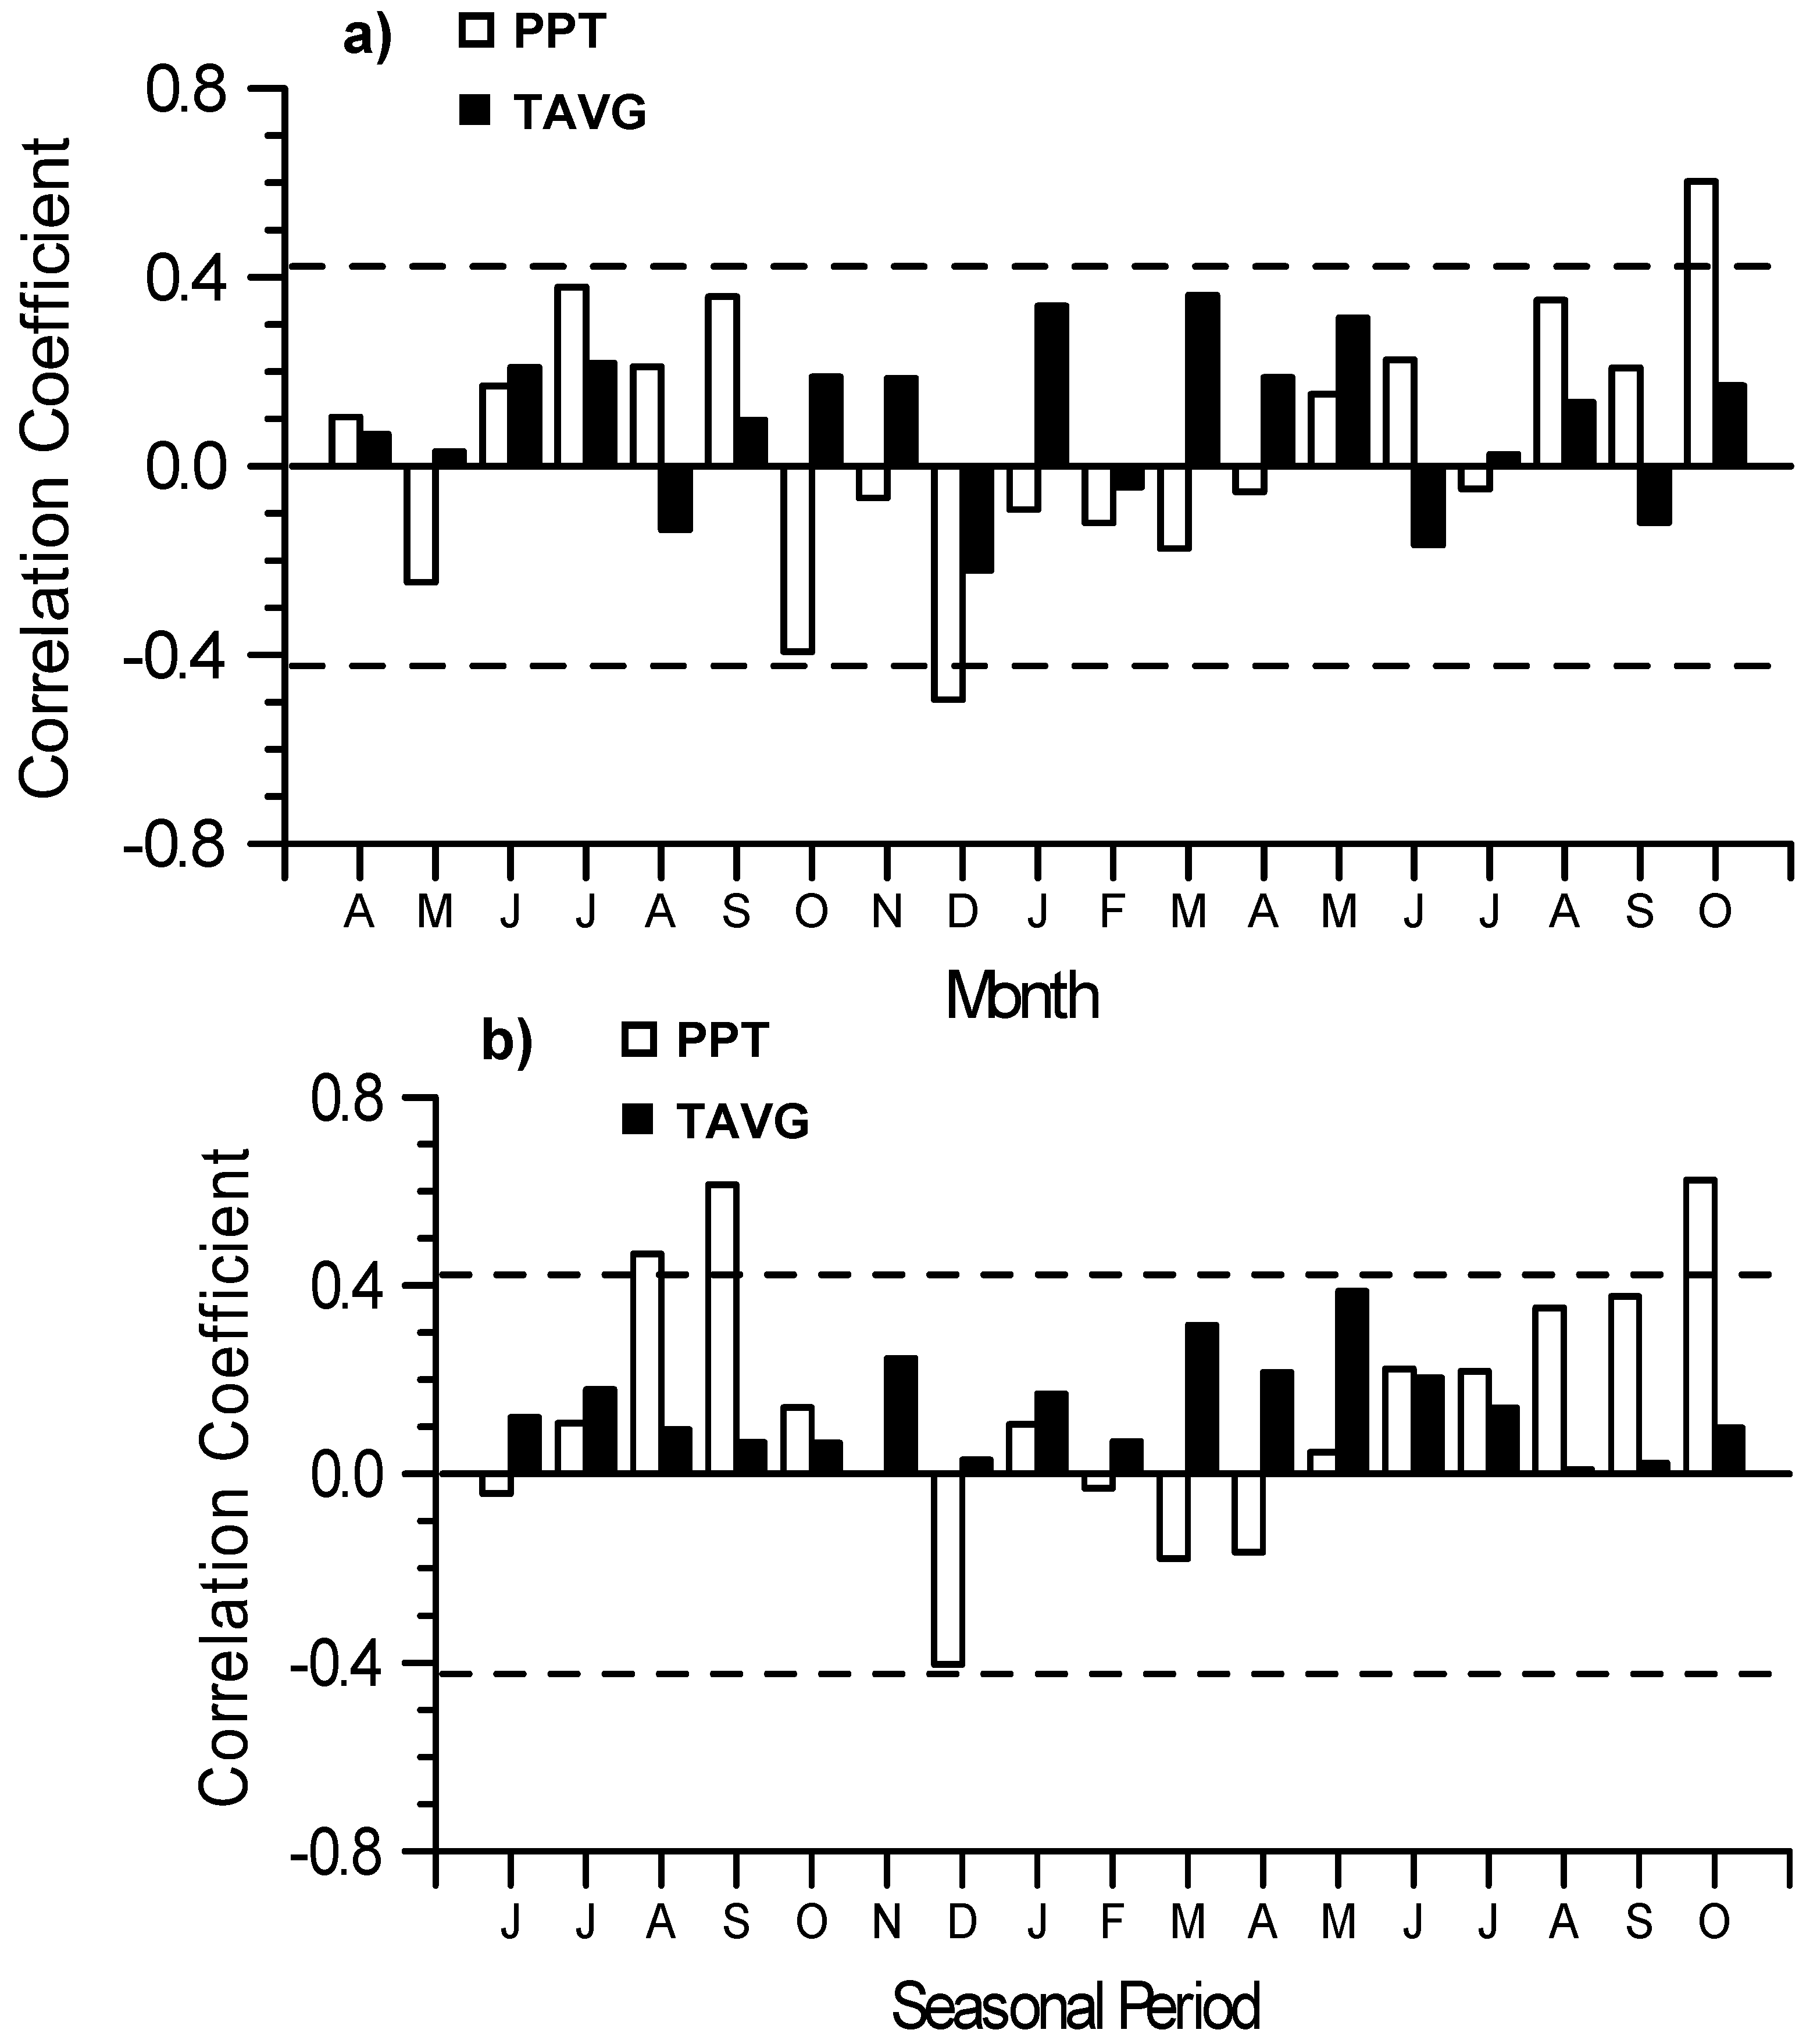
Responses of the BAI growth chronology of all 18 full-sib families combined indicated a significant positive association with October (t) precipitation; a negative relationship with December (t−1) precipitation; and no significant correlations with any of the monthly temperature variables (Figure 6a) which was revealed in the previous growth-climate analyses (cf. Figure 4). BAI of all 18 full-sib families combined showed significant positive relationships with 3-month precipitation amounts ending in August (t−1), September (t−1), and October (t) (Figure 6b) which was revealed in previous growth-climate analyses (cf. Figure 5). Responses of the BAI growth chronology of full-sib families with either P. grandidentata and P. tremuloides as the maternal parent showed similar relationships to the climatic variables (results not presented) as seen for BAI of all full-sib families combined.
Figure 6.
Pearson’s correlation coefficients between the basal area index (BAI) growth chronologies of all 18 full-sib families of hybrid poplar (P. × smithii) combined with (a) monthly and (b) seasonal (3 month periods) climate variables: mean temperature (TAVG) and total precipitation (PPT). Broken lines indicate the threshold for significant correlations at P < 0.05.

4. Discussion
4.1. Geographical and Environmental Significance of Parental Origin
The results indicated that the full-sib families that had higher levels of productivity (diameter, basal area, and volume) after 28 years of growth since initial plantation establishment in 1982 owed much of their high growth potential to having a maternal parent originating from a county close to the county of plantation establishment of the full-sib family (i.e., Ingham county). In this study, a strong maternal environmental effect was also observed in terms of the effect of environmental conditions (annual and summer temperature and summer precipitation) of maternal county origin (relative to the plantation site) on family productivity. Maternal environmental effects have been reported for plants in general [38,39,40] and trees in particular [41,42,43]. In a greenhouse study, Reighard and Hanover [44] reported a maternal effect on stem to root ratios of P. × smithii. It has been hypothesized that the maternal effect acts partially through conferring on progeny the same phenological growth pattern as the mother [41,43]. Under this hypothesis, full-sib families with a mother originating far away from the planting site location would be expected to be phenologically mismatched for growth at that planting site. Namely, in the present study, it is speculated that full-sib families with a mother originating farther north from the planting site location are displaying earlier growth termination than their full-sib family counterparts with mothers originating closer to the plantation site location.
Geographic distance between counties of parents had no significant effect on measures of productivity (diameter, height, basal area, and volume) which was also confirmed by the study of Reighard and Hanover [27] on biomass patterns of different full-sib families of P. × smithii. Full-sib families did however show higher productivity, and thus suggesting better adaptation, to the plantation site when the maternal parent originated from a county that was warmer (annual and summer) or had higher summer moisture than environmental conditions of paternal county location.
Identity of the maternal parent (P. tremuloides versus P. grandidentata) did not affect overall cumulative growth in any of the growth parameters. Furthermore, identity of the maternal parent did not effect responses of interannual basal area growth patterns to climatic factors. In contrast, a prior greenhouse study indicated that interspecific hybrids in which the maternal parent was P. tremuloides generally grew taller than hybrids in which P. grandidentata was the maternal parent [44].
4.2. Interannual Growth-Climate Relationships
Principal component analysis (PCA) indicated that there was strong common variance (63.5% growth variance captured by the first principal component) shared by the interannual patterns of basal area growth of 17 of the 18 full-sib families. However, the slowest growing full-sib family (MAR_CLA2) differed from the other families likely because of strong within stand competition related effects (suggested by the high slenderness coefficient) that affected interannual variations in basal area growth. Nonetheless, the high proportion of variance explained by the first principal component indicates that growth for most of the full-sib families is being affected by a common external environmental factor (i.e., climate).
Dendrochronological analyses of growth-climate relationships indicated that precipitation had a greater impact on interannual growth patterns of full-sib families of P. × smithii than did temperature variables. In particular, the direct association of basal area growth of 14 out of 18 full-sib families to 3 month precipitation amounts ending in September of year prior to (t−1) ring formation indicated that growth was affected by moisture stress in this seasonal window (Figure 5b). The lagged effect of late summer precipitation in the year prior to growth has also been noted in P. tremuloides in northeastern British Columbia, Canada [21] and in the eastern Canadian boreal forest in the provinces of Ontario and Quebec [22]. This strong lagged effect of past precipitation amounts on diameter growth in the following growing season is likely due to a number of possible ecophysiological mechanisms. First, it is generally understood that favorable climatic conditions in late summer and early fall promote excess carbon production which is allocated to the accumulation of carbohydrate storage reserves in poplars in storage tissues such as roots, stems, and branches [45,46,47,48]. Carbohydrate reserves generally build up in late summer and reach their highest levels in the fall and are then depleted in the spring of the following growing season as these reserves are used to drive initial tree growth [47,49]. Consequently, low precipitation in late summer and early fall can thus limit the degree of carbohydrate reserve accumulation which in turn would limit the amount of reserves to drive diameter growth in the following growing season.
Some foliage of hybrid poplars arises from a determinate growth pattern particularly in short shoots commonly located near the tree crown base [47,50]. Therefore, a second possible ecophysiologically based explanation for the lagged effect of precipitation is that leaf primordia are generally formed in tree buds in the year prior to ring formation. Low precipitation levels would likely limit the number of leaf primordia produced and thereby curtail the amount of leaf area produced in the following growing season in the year of bud expansion.
The effect of moisture on interannual basal area growth was also present in the year of ring formation (t). Basal area growth was directly associated with monthly precipitation in October (t) (Figure 4b) and in 3 month precipitation amounts ending in October (t) (Figure 5b) in 11 out of 18 full-sib families of P. × smitthii. These results suggest that basal area growth is strongly affected by the length of the growing season since greater precipitation in late summer and early fall was associated with greater growth. Precipitation amounts in the current year can effect the degree of leaf expansion of leaf primordia produced during bud set at the end of the prior growing season (determinate foliage development). Furthermore, hybrid poplars are generally known for producing more indeterminate foliage from long shoot regions of the upper crown [47]. Water stress during the current year can limit the amount of leaf area development of indeterminate foliage development. Furthermore, the effect of drought stress in either the prior year or current year of ring formation can negatively impact growth by increasing the likelihood of xylem cavitation which is the blockage of these water conducting tissues with air thus forming embolisms [47,51].
Although diameter growth is most active in the summer (June and July), diameter growth of poplar and hybrid poplar clones in Washington state continued into October [52] and November [53]. Furthermore, growth of hybrid poplar (P. tremula × P. tremuloides) in Finland continued into early and mid October [54] and into November for P. × canadensis Moench in Italy [55]. The results in the current study thus indirectly suggest that the phenology of many of the full-sib families in southern Michigan continue diameter growth into the fall (i.e., October) but further studies are required to confirm the phenology of diameter growth in these full-sib families of P. × smithii.
The impact of moisture stress was also underscored by the fact that the lowest decrease in growth was observed in 1997 in the BAI growth chronology for all full-sib families combined and this year corresponded with the 1997 to 1998 El-Niño event [56]. El-Niño events are generally associated with summer drought stress conditions in North America [57].
The next climatic factor that impacted growth was the negative influence of winter precipitation (monthly December precipitation) in 7 out of the 18 full-sib families of P. × smithii. The effect of winter precipitation appeared to affect the full-sib families with generally larger cumulative sizes. It is postulated that there is a tradeoff between large tree size and increased likelihood of crown breakage from high mechanical loads resulting from high winter precipitation levels [58]. Damaged crowns would likely receive higher priority for carbohydrate allocation in the subsequent growing season which in turn would limit the amount of food resources for diameter growth which generally receives lower priority for carbohydrate allocation [46]. By damaging tree crowns, high winter precipitation levels may also increase the risk of winter desiccation injury [46,59]. It is interesting that the slowest growing full-sib family with parents originating from Marquette and Clare (MAR_CLA2) showed a positive relation to 3 month precipitation amounts ending in December (Figure 5b). It is speculated that this result suggests that the most competitively impacted full-sib family likely benefits from crown breakup of more dominant trees in the plantation stand.
While interannual basal area growth of full-sib families generally showed a very weak response to temperature variables, the most notable response was a positive response in 4 out of 18 families to March mean monthly temperature (Figure 4a) or 3 month mean temperature ending in May (t) (Figure 5a). These results suggested that growth in these full-sib families was generally controlled by the timing of the start of the growing season. Bud break and cambial reactivation in tree species is generally controlled by accumulated heat sums in the spring [60]. Zalesny et al. [10] determined that belowground temperature heat sums was an influential factor controlling rooting of hybrid poplar clones in early spring in the Midwestern United States.
5. Conclusions
This study indicated that maternal environmental effects plays a key role on subsequent productivity and adaptation of hybrid poplar progeny at the plantation site. Full-sib families had higher productivity if they had a maternal parent originating from a county that was close to or had higher temperature (annual and summer) and summer precipitation than corresponding parameters of the planting site. Most of the full-sib families (17 out of 18) shared a large degree of common interannual growth variation indicated by principal components analysis which suggested a strong external environmental forcing. Dendrochronological analyses of growth-climate relationships confirmed that the hybrid poplars are drought sensitive during late summer and fall of both the current or previous growing season.
Acknowledgements
The author is thankful for the initial planning and establishment of the hybrid poplar stand by G.L. Reighard, J.W. Hanover and D.I. Dickmann. Thanks also go to J.L. Willis, E.T. David, P. Bloese, and R. Klevickas for their assistance in the field and laboratory data collection. This study was funded by the Michigan Agricultural Experiment Station (Project # MICL06002).
References
- Eriksson, H.M.; Hall, J.P.; Helynen, S. Rationale for forest energy production. In Bioenergy from Sustainable Forestry; Richardson, J., Bjorheden, R., Hakkila, P., Lowe, A.T., Smith, C.T., Eds.; Kluwer Academic Publishers: Dordrecht, The Netherlands, 2002; pp. 1–17. [Google Scholar]
- Ohlrogge, J.; Allen, D.; Berguson, B.; DellaPenna, D.; Shachar-Hill, Y.; Stymne, S. Driving on biomass. Science 2009, 324, 1019–1020. [Google Scholar] [CrossRef]
- Dickmann, D.I. Silviculture and biology of short-rotation woody crops in temperature regions: then and now. Biomass Bioenergy 2006, 30, 696–705. [Google Scholar] [CrossRef]
- Demeritt, M.E. Poplar hybrids (Populus L.). Silvics of North America; Burns, R.M., Honkala, B.H., Eds.; USDA Forest Service: Washington, DC, USA, 1990; Volume 2. Available online: http://www.na.fs.fed.us/spfo/pubs/silvics_manual/volume_2/populus/populus.htm (accessed on 1 August 2010).
- Riemenschneider, D.E.; Berguson, W.E.; Dickmann, D.I.; Hall, R.B.; Isebrands, J.G.; Mohn, C.A.; Stanosz, G.C.; Tuskan, G.A. Poplar breeding and testing strategies in the north-central U.S.: Demonstration of potential yield and consideration of future research needs. For. Chron. 2001, 77, 245–253. [Google Scholar] [CrossRef]
- Pliura, A.; Zhang, S.Y.; MacKay, J.; Bousquet, J. Genotypic variation in wood density and growth traits of poplar hybrids at four clonal trials. For. Ecol. Manage. 2007, 238, 92–106. [Google Scholar] [CrossRef]
- White, T.L.; Addams, W.T.; Neale, D.B. Forest Genetics; CABI Publishing, CAB International: Oxfordshire, UK, 2007. [Google Scholar]
- Robison, D.; Raffa, K.F. Productivity, drought tolerance and pest status of hybrid Populus: tree improvement and silvicultural implications. Biomass Bioenergy 1998, 14, 1–20. [Google Scholar] [CrossRef]
- Zalesny, R.S., Jr.; Hall, R.B.; Zalesny, J.A.; McMahon, B.G.; Berguson, W.E.; Stonosz, G.R. Biomass and genotype × environment interactions of Poplulus energy crops in the midwestern United States. Bioenergy Res. 2009, 2, 106–1222. [Google Scholar] [CrossRef]
- Zalesny, R.S., Jr.; Hall, R.B.; Bauer, E.O.; Riemenschneider, D.E. Soil temperature and precipitation affect the rooting ability of dormant hardwood cuttings of Populus. Silvae Genet. 2005, 54, 47–58. [Google Scholar]
- Monclus, R.; Dreyer, E.; Villar, M.; Delmotte, F.M.; Delay, D.; Petit, J.-M.; Barbaroux, C.; Le Thiec, D.; Brechet, C.; Brignolas, F. Impact of drought on productivity and water use efficiency in 29 genotypes of Populus deltoides × Populus nigra. New Phytol. 2006, 169, 765–777. [Google Scholar] [CrossRef]
- Giovannelli, A.; Deslauriers, A.; Fragnelli, G.; Scaletti, L.; Castro, G.; Rossi, S.; Crivellaro, A. Evaluation of drought response of two poplar clones through high resolution analysis of stem growth. J. Exp. Bot. 2007, 58, 2673–2683. [Google Scholar] [CrossRef]
- Monclus, R.; Villar, M.; Barbaroux, C.; Bastien, C.; Fichot, R.; Delmotte, F.M.; Delay, D.; Petit, J.-M.; Brechet, C.; Dreyer, E. Productivity, water-use efficiency and tolerance to moderate water deficit correlate in 33 poplar genotypes from a Populus deltoides × Populus trichocarpa F1 progeny. Tree Physiol. 2009, 29, 1329–1339. [Google Scholar] [CrossRef]
- Vaganov, E.A.; Hughes, M.K.; Shashkin, A.V. Growth Dynamics of Conifer Tree Rings: Images of Past and Future Environments; Ecological Studies 183; Springer-Verlag: Berlin, Germany, 2006. [Google Scholar]
- Fritts, H.C. Tree Rings and Climate; Academic Press: London, UK, 1976. [Google Scholar]
- Burton, P.J.; Cumming, S.G. Potential effects of climatic change on some western Canadian forests, based on phenological enhancements to a patch model of forest succession. Water Air Soil Pollut. 1995, 82, 401–414. [Google Scholar] [CrossRef]
- Loehle, C.; LeBlanc, D. Model-based assessments of climate change effects on forests: a critical review. Ecol. Modell. 1996, 90, 1–31. [Google Scholar] [CrossRef]
- Chhin, S.; Hogg, E.H.; Lieffers, V.J.; Huang, S. Potential effects of climate change on the growth of lodgepole pine across diameter size classes and ecological regions. For. Ecol. Manage. 2008, 256, 1692–1703. [Google Scholar] [CrossRef]
- Chhin, S.; Hogg, E.H.; Lieffers, V.J.; Huang, S. 2010. Growth-climate relationships vary with height along the stem in lodgepole pine. Tree Physiol. 2010, 30, 335–345. [Google Scholar] [CrossRef]
- Hogg, E.H.; Brandt, J.P.; Michaelian, M. Impacts of a regional drought on the productivity, dieback, and biomass of western Canadian aspen forests. Can. J. For. Res. 2008, 38, 1373–1384. [Google Scholar] [CrossRef]
- Leonelli, G.; Denneler, B.; Bergeron, Y. Climate sensitivity of trembling aspen radial growth along a productivity gradient in northeastern British Columbia, Canada. Can. J. For. Res. 2008, 38, 1211–1222. [Google Scholar] [CrossRef]
- Huang, J.; Tardif, J.C.; Bergeron, Y.; Denneler, B.; Berninger, F.; Girardin, M.P. Radial growth response of four dominant boreal tree species to climate along a latitudinal gradient in the eastern Canadian boreal forest. Glob. Change Biol. 2009, 16, 711–731. [Google Scholar] [CrossRef]
- Vance, E.D.; Maguire, D.A.; Zalesny, R.S., Jr. Research strategies for increasing productivity of intensively managed forest plantations. J. For. 2010, 4, 183–192. [Google Scholar]
- Laidly, P.R. Bigtooth aspen (Populus grandidentata Michx.). Silvics of North America; Burns, R.M., Honkala, B.H., Eds.; USDA Forest Service: Washington, DC, USA, 1990; Volume 2. Available online: http://www.na.fs.fed.us/spfo/pubs/silvics_manual/volume_2/populus/grandidentata.htm (accessed on 1 August 2010).
- Perala, D.A. Quaking aspen (Populus tremuloides Michx.). Silvics of North America; Burns, R.M., Honkala, B.H., Eds.; USDA Forest Service: Washington, DC, USA, 1990; Volume 2. Available online: http://www.na.fs.fed.us/spfo/pubs/silvics_manual/volume_2/populus/tremuloides.htm (accessed on 1 August 2010).
- Reighard, G.L. Physiological Genetics Studies of Populus grandidentata, Populus tremuloides, and their hybrid, Populus × smithii. Ph.D. Dissertation, Michigan State University, East Lansing, MI, USA, 1984. [Google Scholar]
- Reighard, G.L.; Hanover, J.W. Progeny testing of native aspens and their hybrids for biomass production in Michigan. In Proceedings of the 29th Northeastern Forest Tree Improvement Conference, Morgantown, WV, 1985; Demeritt, M.D., Jr., Ed.; West Virginia University: Morgantown, WV, 1985; pp. 5–22. [Google Scholar]
- Monthly Surface Data; National Climatic Data Center: Asheville, NC, USA, 2010. Available online: http://cdo.ncdc.noaa.gov/pls/plclimprod/somdmain.somdwrapper?datasetabbv=DS3220&countryabbv=&georegionabbv=&forceoutside=.
- Stokes, M.A.; Smiley, T.L. An Introduction to Tree-Ring Dating; The University of Arizona Press: Tuscon, AZ, USA, 1996. [Google Scholar]
- Yamaguchi, D.K. A simple method for cross-dating increment cores from living trees. Can. J. For. Res. 1991, 21, 414–416. [Google Scholar] [CrossRef]
- Metsaranta, J.M.; Lieffers, V.J. Using dendrochronology to obtain annual data for modelling stand development: a supplement to permanent sample plots. Forestry 2009, 82, 163–173. [Google Scholar] [CrossRef]
- Gevorkiantz, S.R.; Olsen, L.P. Composite Volume Tables for Timber and Their Application in the Lake States; USDA For. Serv. Tech. Bull. 1104; USDA Forest Service: Washington, DC, USA, 1955. [Google Scholar]
- Wang, Y.; Titus, S.J.; LeMay, V.M. Relationships between tree slenderness coefficients and tree or stand characteristics for major species in boreal mixedwood forests. Can. J. For. Res. 1998, 28, 1171–1183. [Google Scholar] [CrossRef]
- Hogg, E.H. Temporal scaling of moisture and the forest-grassland boundary in western Canada. Agr. Forest Meteorol. 1997, 84, 115–122. [Google Scholar]
- Venables, W.N.; Ripley, B.D. Modern Applied Statistics with S, 4th ed.; Springer: New York, NY, USA, 2002. [Google Scholar]
- Frontier, S. Étude de la décroissance des valeurs propres dans une analyse en composantes principales: comparaison avec le modèle du baton brisé. J. Exp. Mar. Biol. Ecol. 1976, 25, 67–75. [Google Scholar] [CrossRef]
- Legendre, P.; Legendre, L. Numerical Ecology, 2nd ed.; Developments in Environmental Modeling 20; Elsevier Science B.V.: Amsterdam, The Netherlands, 1998. [Google Scholar]
- Roach, D.A.; Wulff, R.D. Maternal effects in plants. Annu. Rev. Ecol. Syst. 1987, 18, 209–235. [Google Scholar] [CrossRef]
- Rossiter, M.C. Incidence and consequences of inherited environmental effects. Annu. Rev. Ecol. Syst. 1996, 27, 451–476. [Google Scholar] [CrossRef]
- Mousseau, T.A.; Fox, C.W. The adaptive significance of maternal effects. Trends Ecol. Evol. 1998, 13, 403–407. [Google Scholar] [CrossRef]
- Andersson, B. Aftereffects of maternal environment on autumn frost hardiness in Pinus sylvestris seedlings in relation to cultivation techniques. Tree Physiol. 1994, 14, 313–322. [Google Scholar] [CrossRef]
- Wei, R.-P.; Lindgren, K.; Lindgren, D. Parental environmental effects on cold acclimation and height growth in lodgepole pine seedlings. Silvae Genet. 2001, 50, 252–257. [Google Scholar]
- Chmura, D.J. Phenology differs among Norway spruce populations in relation to local variation in altitude of maternal stands in the Beskidy Mountains. New For. 2006, 32, 21–31. [Google Scholar] [CrossRef]
- Reighard, G.L.; Hanover, J.W. Shoot and root development and dry matter partitioning in Populus grandidentata, Populus tremuloides, and P. × smithii. Can. J. For. Res. 1990, 20, 849–852. [Google Scholar] [CrossRef]
- Nguyen, P.U.; Dickmann, D.I.; Pregitzer, K.S.; Hendrick, R. Late-season changes in allocation of starch and sugar to shoots, coarse roots, and fine roots in two hybrid poplar clones. Tree Physiol. 1990, 7, 95–105. [Google Scholar] [CrossRef]
- Kozlowski, T.T.; Kramer, P.J.; Pallardy, S.G. The Physiological Ecology of Woody Plants; Academic Press: San Diego, CA, USA, 1991. [Google Scholar]
- Dickmann, D.I.; Isebrands, J.G.; Blake, T.J.; Kosola, K.; Kort, J. Physiological ecology of poplars. In Poplar Culture in North America; Dickmann, D.I., Isebrands, J.G., Eckenwalder, J.E., Richardson, J., Eds.; NRC Research Press: Ottawa, Canada, 2001; Part A, Chapter 3; pp. 77–118. [Google Scholar]
- Landhausser, S.M.; Lieffers, V.J. Seasonal changes in carbohydrate reserves in mature northern Populus tremuloides clones. Trees 2003, 17, 471–476. [Google Scholar] [CrossRef]
- Telewski, F.W.; Aloni, R.; Sauter, J.J. Physiology of secondary tissues of Populus. In Biology of Populus and Its Implications for Management and Conservation; Stettler, R.F., Bradshaw, H.D., Jr., Heilman, P.E., Hinckley, T.M., Eds.; NRC Research Press, National Research Council of Canada: Ottawa, Canada, 1996; Part II, Chapter 13; pp. 459–489. [Google Scholar]
- Van Vokenburgh, E.; Taylor, G. 1996. Leaf growth physiology. In Biology of Populus and Its Implications for Management and Conservation; Stettler, R.F., Bradshaw, H.D., Jr., Heilman, P.E., Hinckley, T.M., Eds.; NRC Research Press, National Research Council of Canada: Ottawa, Canada, 1996; Part II, Chapter 18; pp. 459–489. [Google Scholar]
- Blake, T.J.; Sperry, J.; Tschaplinski, T.J.; Wang, S.S. Water relations. In Biology of Populus and Its Implications for Management and Conservation; Stettler, R.F., Bradshaw, H.D., Jr., Heilman, P.E., Hinckley, T.M., Eds.; NRC Research Press, National Research Council of Canada: Ottawa, Canada, 1996; Part II, Chapter 16; pp. 401–422. [Google Scholar]
- DeBell, D.S.; Harrington, C.A.; Clendenen, G.W.; Zasada, J.C. Tree growth and stand development of four Populus clones in large monoclonal plots. New For. 1997, 14, 1–18. [Google Scholar] [CrossRef]
- Devine, W.D.; Harrington, C.A.; DeBell, D.S. Intra-annual growth and mortality of four Populus clones in pure and mixed plantings. New For. 2010, 39, 287–299. [Google Scholar] [CrossRef]
- Yu, Q.; Tigerstedt, P.M.A.; Haapanen, M. Growth and phenology of hybrid aspen clones (Populus tremula L. × Populus tremuloides Michx.). Silva Fenn. 2001, 35, 15–25. [Google Scholar]
- Deslauriers, A.; Giovannelli, A.; Rossi, S.; Castro, G.; Fragnelli, G.; Traversi, L. Intra-annual cambial activity and carbon availability in stem of poplar. Tree Physiol. 2009, 29, 1223–1235. [Google Scholar] [CrossRef]
- IPCC. Climate Change 2007: the Physical Science Basis; Contribution of Working Group I to the Fourth Assessment Report of the Intergovernmental Panel on Climate Change; Solomon, S., Qin, D., Manning, M., Chen, Z., Marquis, M., Averyt, K.B., Tignor, M., Miller, H.L., Eds.; Cambridge University Press: Cambridge, UK, 2007. [Google Scholar]
- McCabe, G.J.; Betancourt, J.L.; Gray, S.T.; Palecki, M.A.; Hidalgo, H.G. Associations of multi-decadal sea-surface temperature variability with US drought. Quat. Int. 2008, 188, 31–40. [Google Scholar] [CrossRef]
- Grier, C.C. Foliage loss due to snow, wind, and winter drying damage; its effects on leaf biomass of some western conifer forests. Can. J. For. Res. 1988, 18, 1097–1102. [Google Scholar] [CrossRef]
- Havranek, W.M.; Tranquillini, W. Physiological processes during winter dormancy and their ecological significance. In Ecophysiology of Coniferous Forests; Smith, W.K., Hinckley, T.M., Eds.; Academic Press: San Diego, CA, USA, 1995; pp. 95–124. [Google Scholar]
- Begum, S.; Nakaba, S.; Bayramzadeh, V.; Oribe, Y.; Kubo, T.; Funada, R. Temperature responses of cambial reactivation and xylem differentiation in hybrid poplar (Populus sieboldii × P. grandidentata) under natural conditions. Tree Physiol. 2008, 28, 1813–1819. [Google Scholar] [CrossRef]
© 2010 by the authors; licensee MDPI, Basel, Switzerland. This article is an open access article distributed under the terms and conditions of the Creative Commons Attribution license (http://creativecommons.org/licenses/by/3.0/).
Share and Cite
MDPI and ACS Style
Chhin, S. Influence of Climate on the Growth of Hybrid Poplar in Michigan. Forests 2010, 1, 209-229. https://doi.org/10.3390/f1040209
AMA Style
Chhin S. Influence of Climate on the Growth of Hybrid Poplar in Michigan. Forests. 2010; 1(4):209-229. https://doi.org/10.3390/f1040209
Chicago/Turabian StyleChhin, Sophan. 2010. "Influence of Climate on the Growth of Hybrid Poplar in Michigan" Forests 1, no. 4: 209-229. https://doi.org/10.3390/f1040209