UAV-Based High-Throughput Approach for Fast Growing Cunninghamia lanceolata (Lamb.) Cultivar Screening by Machine Learning


1
College of Forestry, Fujian Agriculture and Forestry University, Fuzhou 350002, China
2
Basic Forestry and Proteomics Research Center, College of Forestry, Fujian Provincial Key Laboratory of Haixia Applied Plant Systems Biology, Fujian Agriculture and Forestry University, Fuzhou 350002, China
3
Department of Molecular, Cell & Developmental Biology, University of California, Los Angeles, CA 90095, USA
4
Fujian Academy of Forestry, the Key Laboratory of Timber Forest Breeding and Cultivation for Mountainous Areas in Southern China, State Forestry Administration Engineering Research Center of Chinese Fir, the Key Laboratory of Forest Culture and Forest Product Processing Utilization of Fujian Province, Fuzhou 350012, China
*
Authors to whom correspondence should be addressed.
Forests 2019, 10(9), 815; https://doi.org/10.3390/f10090815
Submission received: 14 July 2019
/
Revised: 10 September 2019
/
Accepted: 17 September 2019
/
Published: 19 September 2019
(This article belongs to the Section Forest Inventory, Modeling and Remote Sensing)
Abstract
:Obtaining accurate measurements of tree height and diameter at breast height (DBH) in forests to evaluate the growth rate of cultivars is still a significant challenge, even when using light detection and ranging (LiDAR) and three-dimensional (3-D) modeling. As an alternative, we provide a novel high-throughput strategy for predicting the biomass of forests in the field by vegetation indices. This study proposes an integrated pipeline methodology to measure the biomass of different tree cultivars in plantation forests with high crown density, which combines unmanned aerial vehicles (UAVs), hyperspectral image sensors, and data processing algorithms using machine learning. Using a planation of Cunninghamia lanceolate, which is commonly known as Chinese fir, in Fujian, China, images were collected while using a hyperspectral camera. Vegetation indices and modeling were processed in Python using decision trees, random forests, support vector machine, and eXtreme Gradient Boosting (XGBoost) third-party libraries. The tree height and DBH of 2880 samples were manually measured and clustered into three groups—“Fast”, “median”, and “normal” growth groups—and 19 vegetation indices from 12,000 pixels were abstracted as the input of features for the modeling. After modeling and cross-validation, the classifier that was generated by random forests had the best prediction accuracy when compared to other algorithms (75%). This framework can be applied to other tree species to make management and business decisions.
1. Introduction
Cunninghamia lanceolata (Lamb.) Hook, also known commonly as Chinese fir, is a primary species used for lumber production in southern China, especially between latitudes 20 and 34° N [1]. The species is highly popular due to its high timber quality, rapid growth rate, and straight and uniform stems [2,3,4]. Following the implementation of the Belt and Road Initiative (“B&R”) strategy by the Chinese government, the demand for high quality Chinese fir seedlings has rapidly expanded, especially in southeast Asia. This booming industry is believed to offer new opportunities for those living in poverty [4,5,6].
As with all trees, tree height and tree diameter at breast height (DBH) are two critical measurements for evaluating the quality of Chinese fir and planning forest management. However, these variables may change with plantation conditions [5,6]. Several models have been established by ecologists to make these predictions, but these models were generated from limited data (e.g., only 35 tresses were measured in Mei’s work) and in specific conditions (e.g., locations). Hence, more accurate and general approaches are needed [6,7].
High-throughput phenotyping that uses satellites and aircraft tends to have a low image resolution [8], according to LAND INFO Worldwide Mapping LLC (Littleton, USA), high resolution multispectral or hyperspectral satellite imagery is associated with high costs and non-real-time (must be order than 90 days in archive). However, field-based phenotyping of forests has become possible with recent improvements in unmanned aerial vehicle (UAV) technology. This real-time approach is also precise and it can be conducted at a competitive cost. The UAV approach includes remote sensors, which can adapt to the objectives and more accurately collect measurements [9]. The RGB camera, multispectral sensors, and hyperspectral sensors are frequently used to determine the image traits of trees from the canopy. At the same time, UAV based light detection and ranging (UAV-LiDAR) technology is applied to measure the tree height and DBH [10]. However, LiDAR is extremely hard to conduct comparable measurements in small areas that have a high crown density, or to use in hard-to-reach field areas [9]. Furthermore, the procedure for computing the three-dimensional (3-D) geometric features of individual trees and tree-rows by using multispectral imagery data has been developed for high-throughput phenotyping, it is still difficult to conduct 3-D modeling without the support of accurate mapping level data [11,12]. Unfortunately, a high crown density and a lack of mapping level data support happen in most forestry field trials. Some tasks have been made to provide clues for the solution of the above problems. It has been well documented for several crops that hyperspectral traits of canopies are closely related to biomass (e.g., plant height and diameters), as well as some vegetation indices in the field [9]. Therefore, it is still possible to evaluate the tree height and DBH of the forest with the hyperspectral canopy images. However, to the best of the authors’ knowledge, no similar method has been previously used in the forestry industry for this purpose.
The current models for predicting the biomass of Chinese fir are quite simple due to inadequate volumes of data [6,7]. By taking advantage of unmanned aerial vehicles (UAVs) and remote sensors, it will be much easier to develop better quality and larger datasets from forests [11,12]. These datasets can provide a better way to develop more complex models with advanced algorithms [13]. Machine learning allows for the classification and prediction of high volumes of data and it has gained popularity in recent years. Scikit-learn, a free machine learning library for the Python programming language, has been used in the forestry field to deploy some conventional machine-learning algorithms for monitoring vegetation levels (e.g., direct reflectance measurements) [13]. Additionally, for early detection and quantification of verticillium wilt with support vector machines (SVMs), obtaining mixed accuracy results among the evaluated classes of infection severity (59%–75%) [14,15]. Furthermore, deep-learning models were used for object detection, e.g., k-nearest neighbor (k-NN) classifiers was applicated on assess pest damage in the canopy (e.g., mapping bark beetle damage), the prediction accuracy of this model has been as high as 90% [16,17,18]. However, similar research focused on deep-learning models has been limited, mostly because it was designed for processing images more than numerical data. Recently, the eXtreme Gradient Boosting (XGBoost) algorithm has been developed to deal with massive data and was proved to have high prediction ability in multiple types of data than other algorithms [12], e.g., it has been used in models related to pathogen damage and it has had a predicting accuracy of >95% [19]. This combination of UAVs, remote sensing imagery, and artificial intelligence still needs to be trained on relevant features to specific datasets, data correlations, and validation processes [20,21].
Overall, we aim to develop a novel pipeline for the high-throughput biomass measurement of Chinese fir in the field, by evaluating the tree height and DBH of the forest with the hyperspectral images of canopy. In this study, we selected a typical Chinese fir plantation that was measured to have a high crown density, which is impossible to apply accurate LiDAR measurement, also insufficient mapping level data to support 3-D modeling. We sought to determine better connections between image traits and the biomass of each cultivar. To do this, we described a pipeline that includes UAV-based hyperspectral data collection, image processing, data combination, preprocessing and splitting, and classifier development and evaluation while using multiple machine learning algorithms. The entire pipeline was tested using a case study that compared the growth rate (whole tree height and DBH) of eight commercial Chinese fir cultivars, for which there are already manually collected data measurements for three years. We considered four machine learning algorithms to develop the learning (growth rate prediction) model: decision trees (DT), Random forests (RF), SVMs, and XGBoost. We repeatedly composed a learning model using training datasets and evaluated it with a validation dataset. The model that showed the best validation accuracy was chosen as the best learning model. All of the image processing and the data manipulation were conducted while using open source software or Python, with the goal of building a user-friendly system for people without a technology background.
2. Material and Methods
2.1. Study Area and Experimental Design
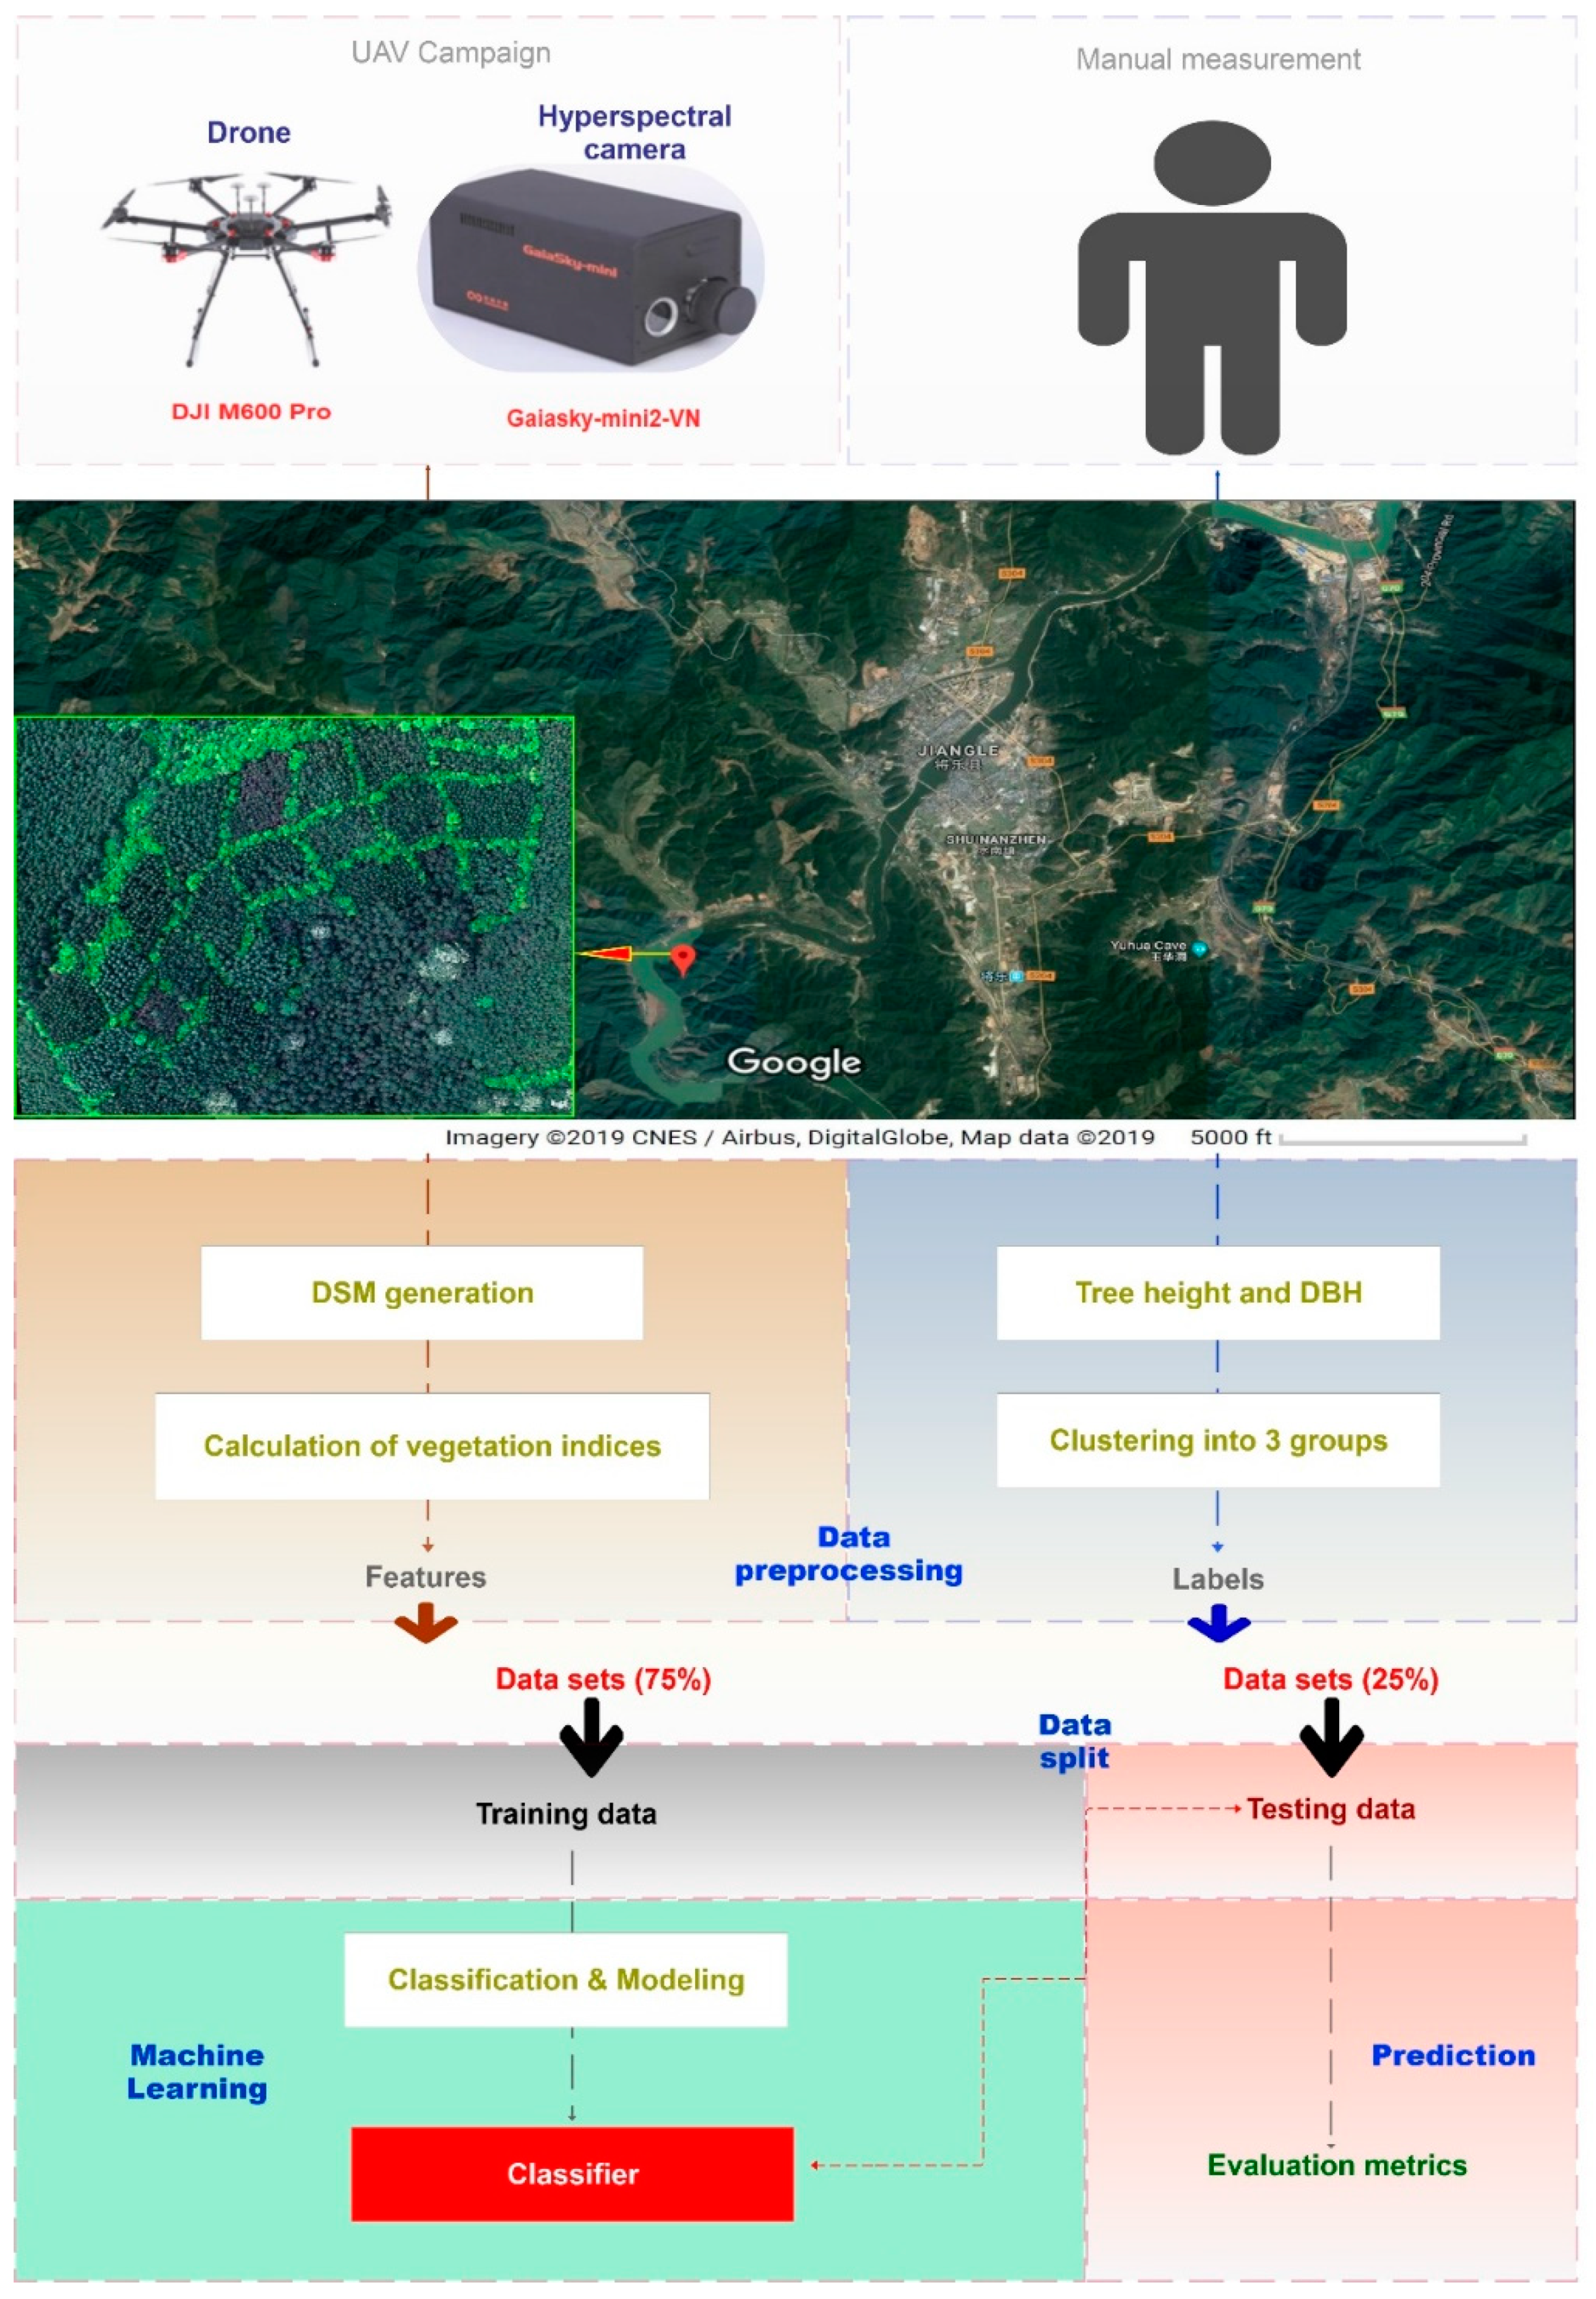
A 10.52 ha field was selected in Jiangle, Fujian province, in southeast China (26.6952° N, 117.4344° E). Plants had been generated in tissue culture to maintain the traits of the original variety (i.e., growth rate) (Figure 1). In 2007, the field site was divided into three rows: Row1 (up-row), Row2 (middle-row), and Row2 (bottom-row), with eight sub-plots for each one. A total of eight Chinese fir cultivars were planted in each row. Each row contained a single replicate of each cultivar. In Row 1, the cultivars were in the order of: C1, C2, C3, C4, C5, C6, C7, and C8. In Row 2, cultivars were in the order of C2, C5, C8, C7, C3, C6, C4, and C1. In Row 3, the cultivars were in the order of C6, C4, C3, C2, C8, C1, C5, and C7. To minimize the experimental deviation, all of the trees received the same management measures (fertilizers, farming, and spraying). Randomly, 120 individuals were selected in each sub-plot, and their whole tree height and diameter at breast height (DBH) over 1.3 m were manually measured each year from 2016 to 2018.
2.2. UAV-Based Hyperspectral Image Data Collection
In this study, a DJI M600 Pro was used as a flight platform and equipped with a 176-band hyperspectral camera (Gaiasky-mini2-VN, Zuolihanguang, Beijing, China) with a wavelength range of 400 to 1000 nm. The resolution for this hyperspectral camera was 960 × 1057 pixels and it yielded a 4.5 cm spatial resolution at a flight altitude of 90 m.
Prior to measurement, the exposure time was calibrated in direct sunlight by placing a standard whiteboard with a reflectivity of 100% perpendicular to the lens. Two dark background images and one white frame image were then used for lens calibration and reflectance calibration. The dark background images were collected by attaching the lens cap, and one dark background image was obtained by increasing the exposure time by 0.1 s. Cloths of 20%, 40%, and 60% reflectivity were placed in the field and their gray values in the images were later utilized for atmospheric correction.
Hyperspectral data were collected on 18 April 2019, and they were repeated three times from 9:00 to 10:00 a.m., 1:00 to 2:00 p.m., and 4:00 to 5:00 p.m., respectively, which corresponded to different light conditions.
2.3. Image Processing
2.3.1. Digital Surface Models (DSM) Generation and Region of Interests (ROI) Selection
The entire data correction process included lens correction, reflectance correction, and atmospheric correction (Suppl. file1). For background removal and noise reduction in the corrected hyperspectral images, ROIs only containing Chinese fir and no soil, as well as ROIs without Chinese fir and with soil, were selected. A reference spectral library was generated from the average spectra of these ROIs. With these reference spectra, the original spectra were classified while using the spectral angle classification method to remove the background and eliminate soil noise.
2.3.2. Parcel Detection, Random Sampling, and Dimensionality Reduction
After removing the background, the planting area for each cultivar was marked. Areas along edges where adjacent cultivars touched were removed during labeling. In the selected ROIs, 300 points were randomly selected without repetition. Pixels that were identified as background and noise were removed during the preprocessing steps and points with a value of zero were excluded from the sampling process. The hyperspectral data contained information from 176 bands, which had a higher sensitivity than the analysis requirements. Therefore, we reduced the dimensionality to 22 spectra by averaging every eight adjacent bands.
2.3.3. Calculation of Vegetation Indices
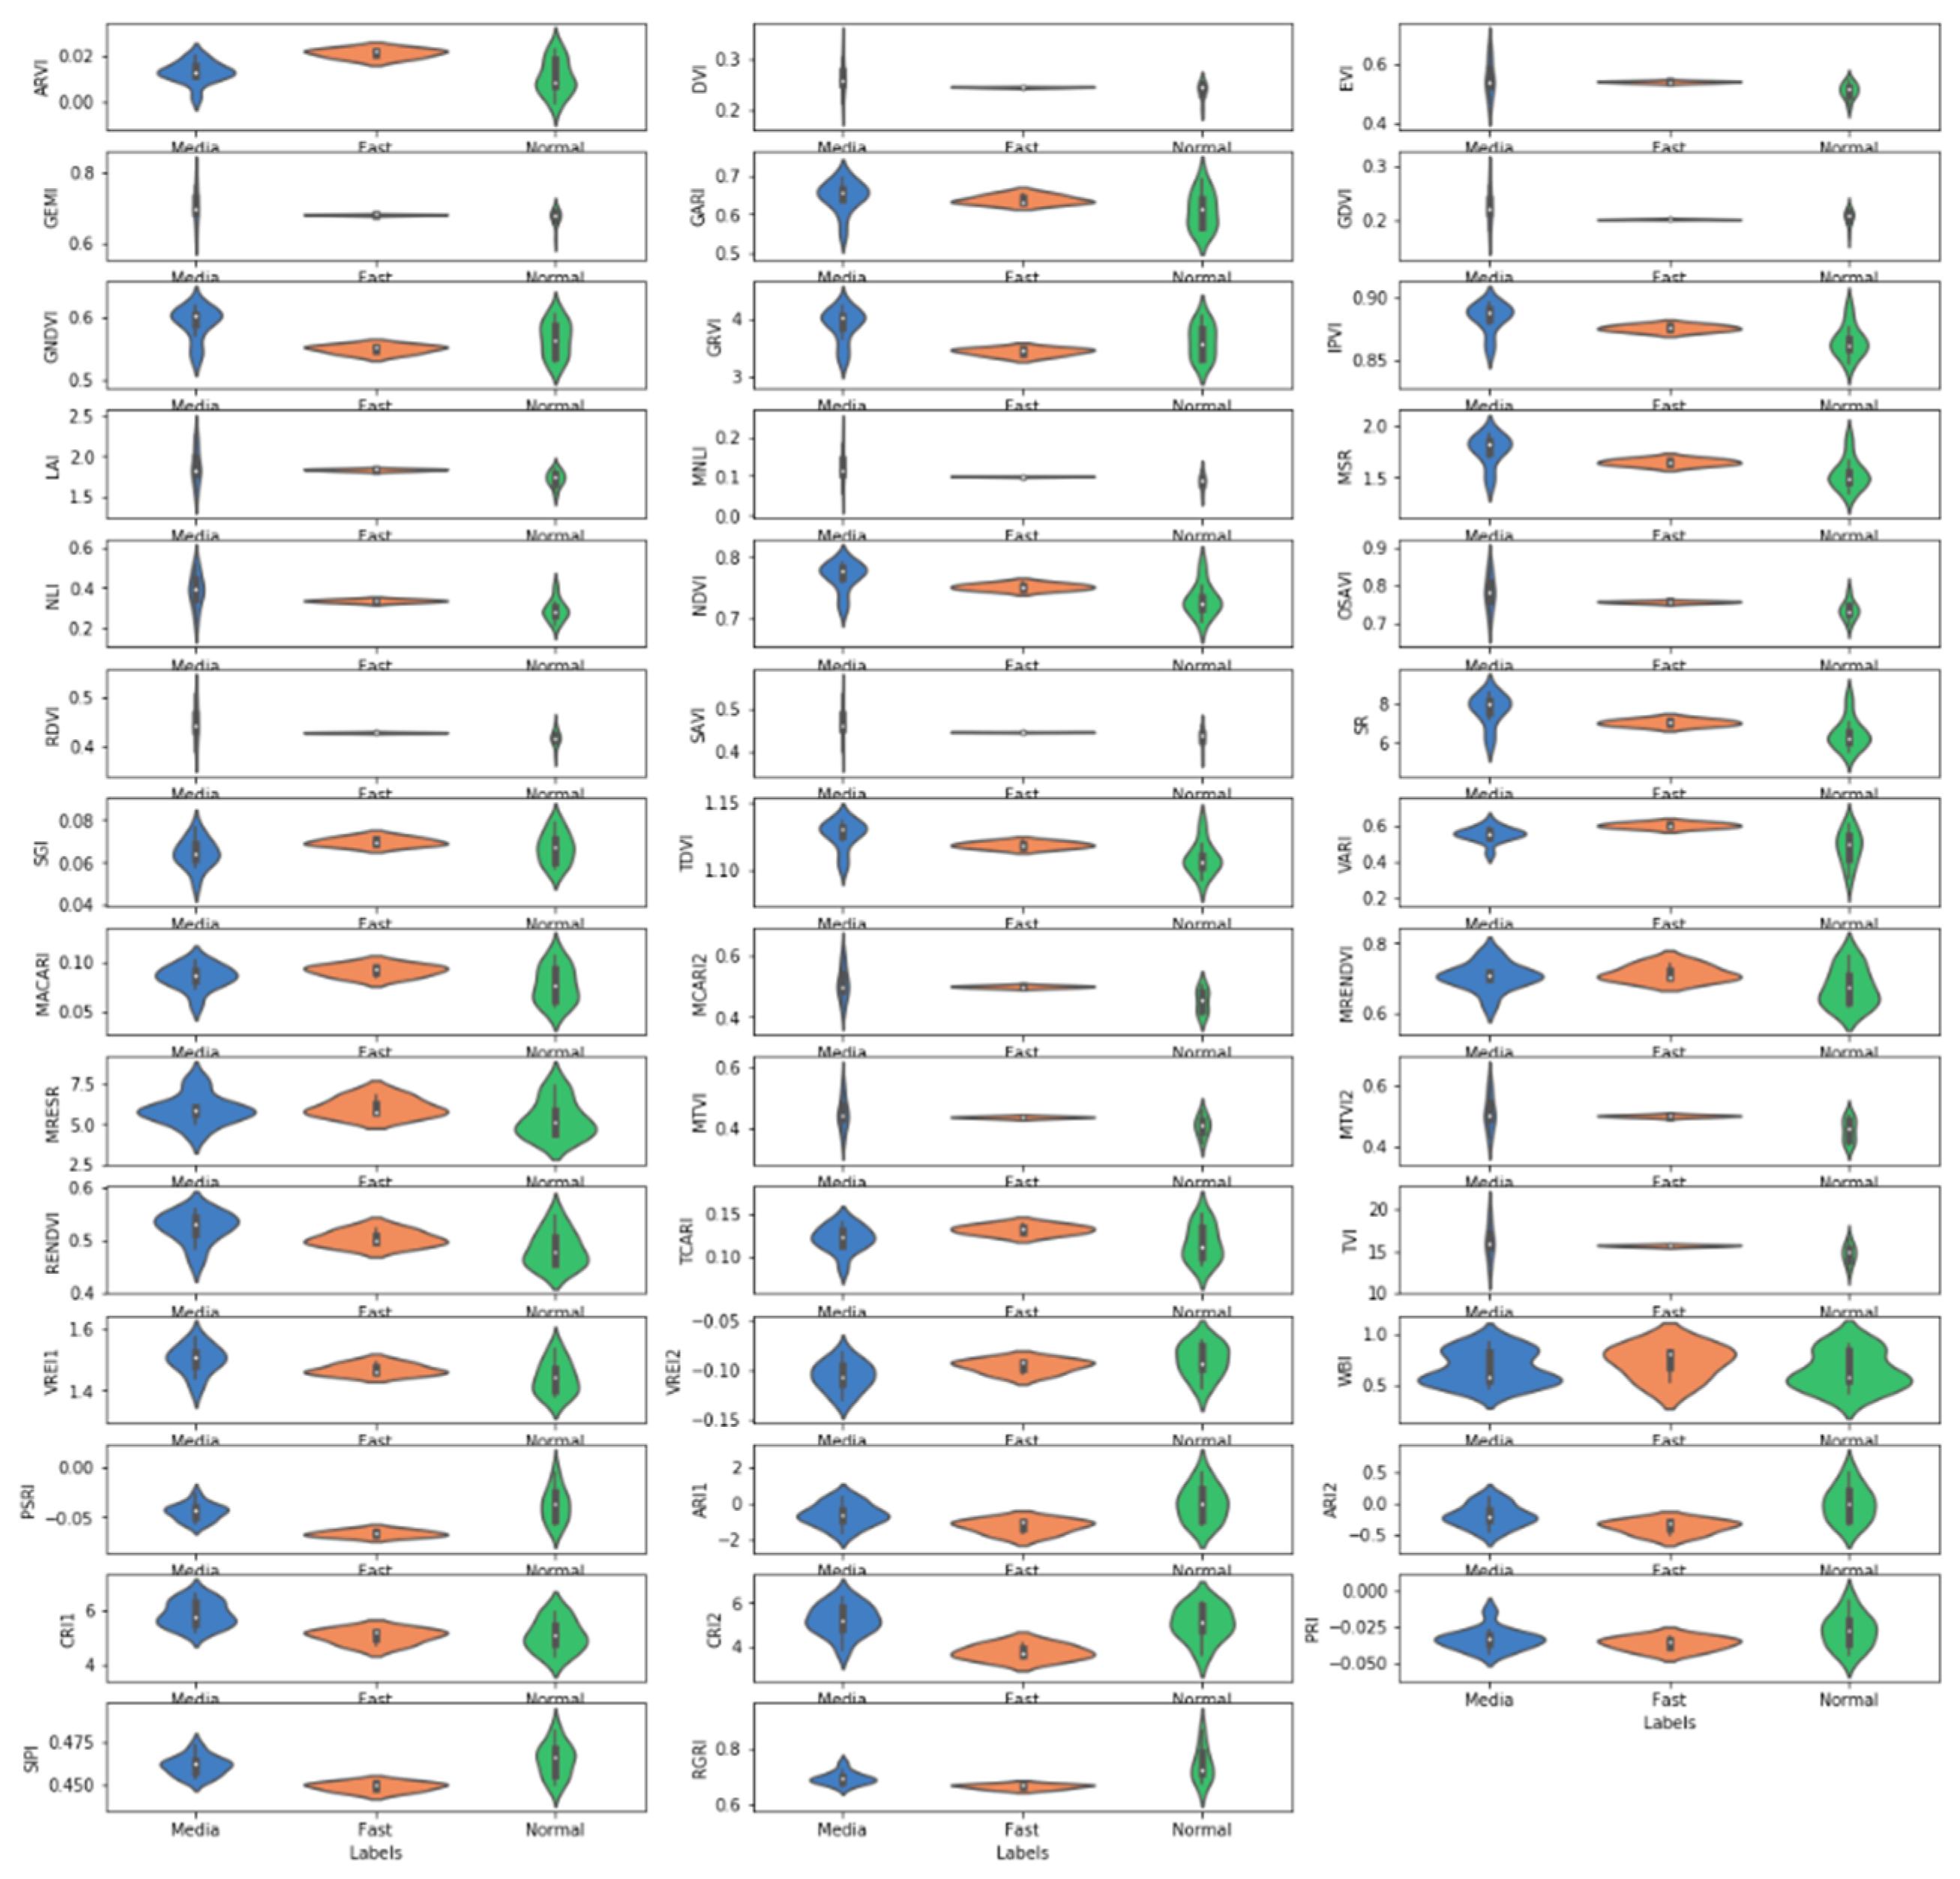
The wavelengths of visible and near-infrared radiation have been widely used to measure vegetation cover, growth vigor, or biomass [16], and they have been used to generate qualitative and quantitative vegetation indices. We calculated 41 different vegetation indices (Figure 2) that were described by ENVI software (Version 5.5.2, 2019 Harris Geospatial Solutions, Inc., US) based on our dataset that was collected with the Gaiasky-mini2-VN hyperspectral camera (Suppl. file2 and Suppl. file3).
2.4. Data Processing and Modeling
2.4.1. Manual Measurement Data Processing
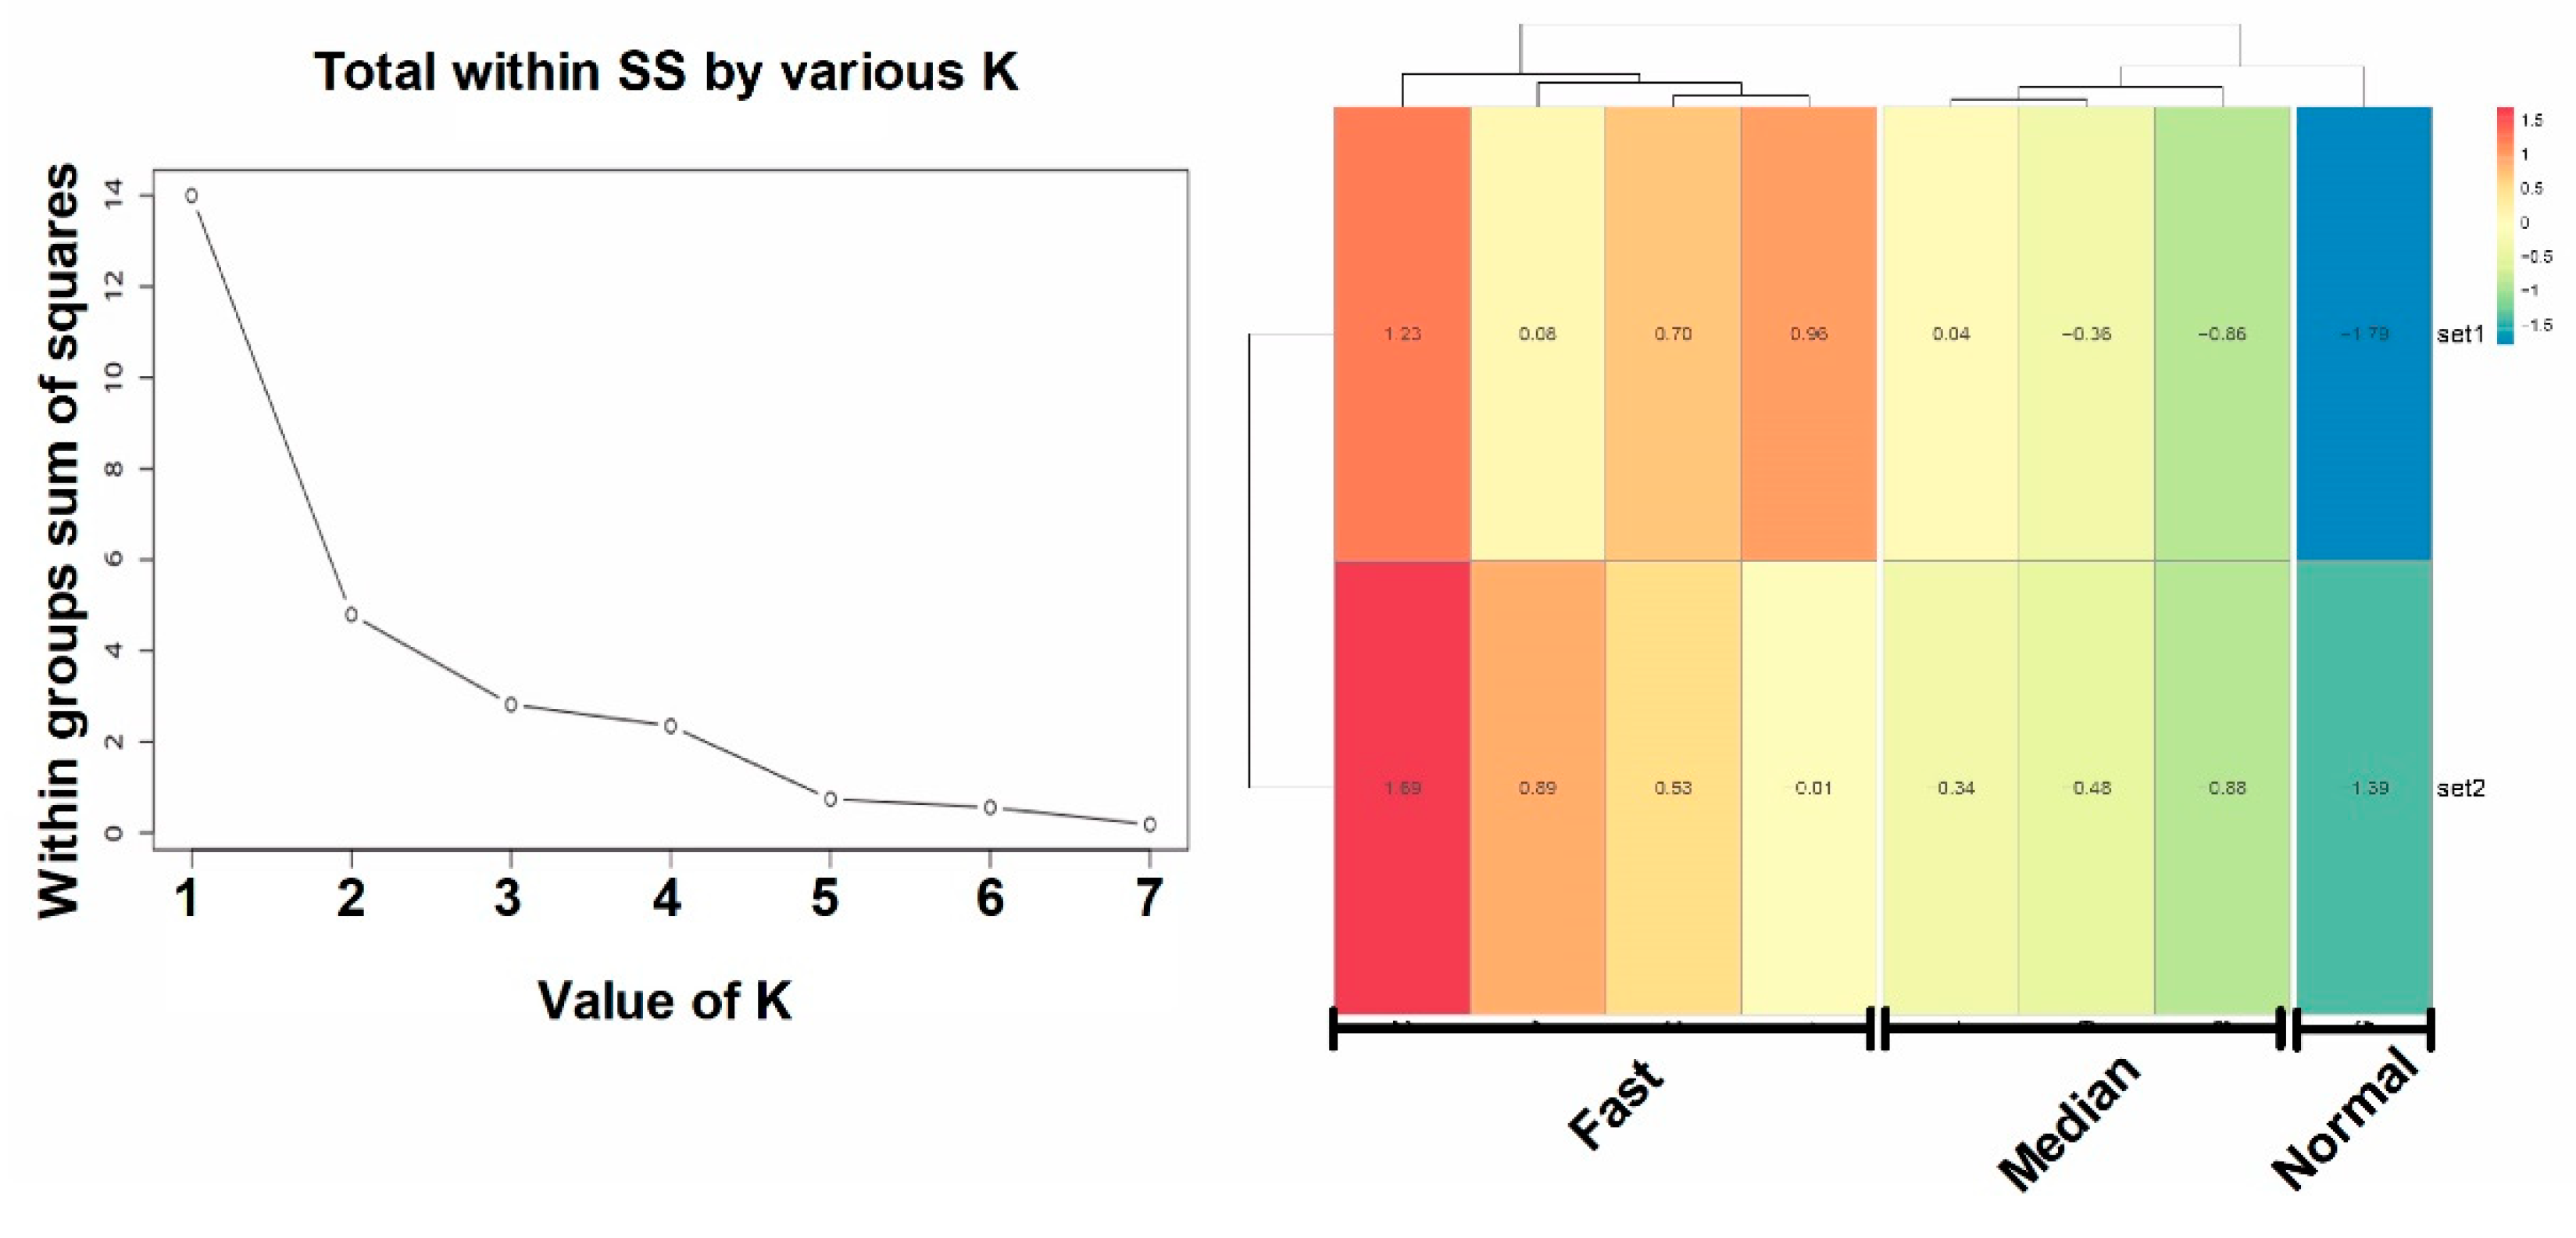
K-mean clustering was conducted to classify the manually collected data from 2016–2018 by using the height and DBH of the eight cultivars (Figure 3, left). Three clusters were enough for this classification, because the within group sum of squares do not dramatically decrease for K values greater than 3 (Figure 3).
2.4.2. Trimming the Vegetation Indices Data
For machine learning, the quality of the training data is crucial for the accuracy of the training and prediction. In our case, first we plotted mean values of all 41 vegetation indices against the three clusters to understand the data distribution (Figure 2). This showed that most of the vegetation index values of the Fast group were centralized around the means, but that the data distribution of the Median and Normal groups was more normal. When considering the growth rate of these three groups of cultivars, we only kept 19 of all 41 vegetation indices (absolute value of Pearson product-moment correlation coefficient between vegetation indices and growth rate are greater than 0.4), which were: ARVI, EVI, GARI, OSAVI, VARI, MACARI, MCARI2, MRENDVI, MRESR, MTVI, MTVI2, TCARI, TVI, PSRI, ARI1, ARI2, CRI2, SIPI, and RGRI (described in Suppl. file2).
2.5. Modeling by Machine Learning
Classification algorithms and evaluation metrics
First, each grid was divided into several smaller cells, and then a sample of 500 pixels was randomly selected from cells of each grid, evenly. All of the vegetation indices for each grid were used as the features, and the three classes (Fast, Median, and Normal) were set as labels. The dataset was divided into two sections: 75% for training and 25% to test the set while using the train_test_split library from sklearn in Anaconda-Jupyter (Austin, TX, USA). Four supervised machine learning algorithms were applied to our dataset: decision tree (DT), random forest (RF), support vector machine (SVM), and XGBoost. All four models were utilized by applying the corresponding libraries in Anaconda-Jupyter (Austin, TX, USA).
We conducted predictions on random selected test samples 1000 times and plotted the accuracy (Number of correct predictions)/(Total number of predictions made) for each time to evaluate the accuracy of our classifiers. The cross-validation score (CVS) was calculated utilizing the classifiers that were generated by the decision tree, random forest, SVM, and XGBoost. For XGBoost, Logarithmic Loss (Log Loss) was calculated, which works by penalizing false classifications to evaluate the prediction accuracy. After calibrating the models by using cross-validation or Log Loss, another sample of 500 pixels was randomly selected from cells of each grid for the validation of the new models.
3. Results
We compared the height and DBH of eight Chinese Fir cultivars (C1–C8) beginning in 2007. A total of 120 out of 650 individuals from each repeat of every cultivar were randomly marked for future measurement. From 2007 to 2016, we focused on the establishment of trees and monitored the survival rate (not shown). Beginning in 2016, tree height and DBH were manually measured until 2018. No changes were detected in height and DBH over the course of these three years. Thus, we averaged plant height and DBH for each plant for the three years. According to the classification (Figure 3), we assigned cultivar C5 to the Normal group, cultivars C6, C7, and C8 to the Median group, and cultivars C1, C2, C3, and C4 to the Fast group.
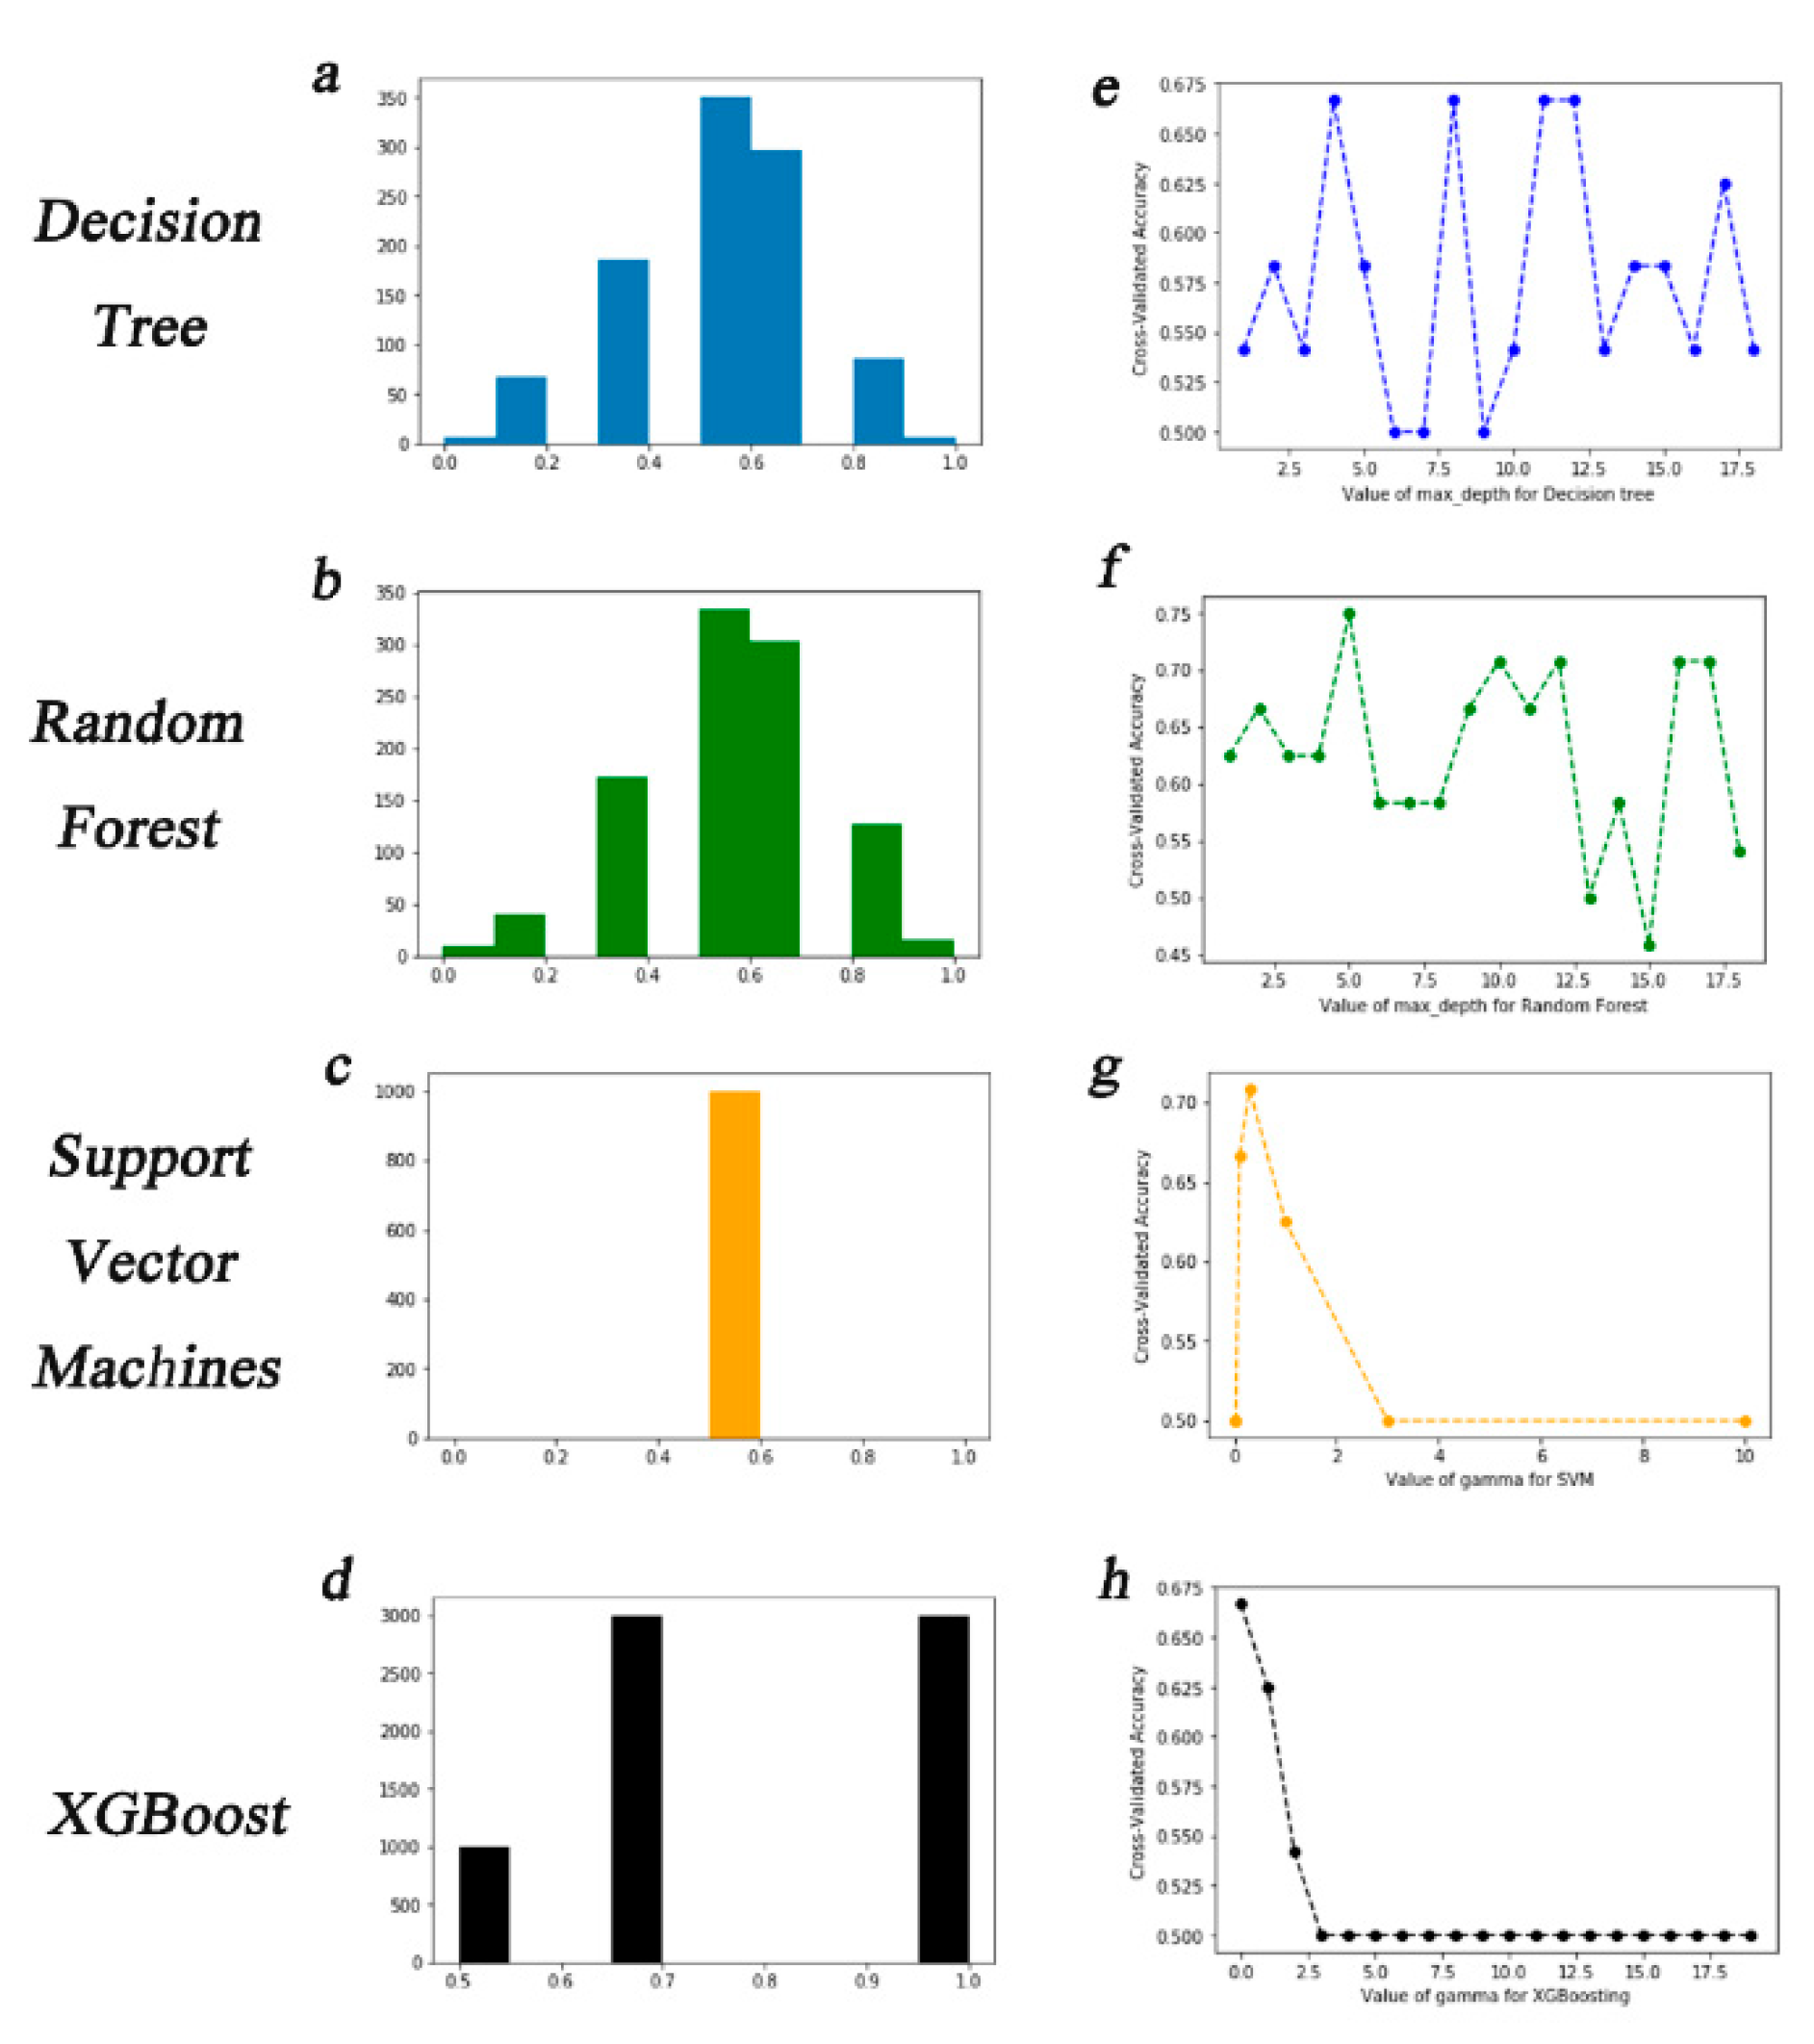
A total of 19 features from 12,000 pixels were abstracted as the input of this workflow. After repeating 1000 times with default parameters for the prediction with test data sets, the decision tree or random forest classifier had a 32% chance of making an accuracy score of 0.6, 30% chance of 0.7, 17% chance of 0.4, and a 14% chance of 0.9. DT and RF both had an average accuracy of 0.5 (Figure 4a,b). With the optimal gamma (0.03) for the support vector machine classification, the prediction accuracy was always 0.5 (Figure 4c). XGBoost was set to a max depth value of 5 and the “objective” parameters were set to “binary: logistic” to generate the classifier. The new classifier had a degressive log loss value from 0.5 to 0.001 after 30 rounds (Figure S1), and a detection accuracy of 0.5, 0.65, and 0.95 for all three groups, fast, median, and normal, respectively, with an average accuracy of 0.5 (Figure 4d).
The cross validation of each classifier was evaluated to further improve the model. A maximum depth was set for 1–19 and cross validation accuracy (CVA) was expected to be 0.67 for the decision tree classification (Figure 4e) and 0.75 for the random forest (Figure 4f). We plotted the CVA at different gamma values for SVMs due to the importance of the gamma value (Figure 4g). This showed a cross validation accuracy of 0.71 when the gamma value was 0.03. For boosting, the XGBoost prediction accuracy improved to 0.67 with a gamma of 0 (Figure 4h). The model developed by DT, RF, SVMs, and XGBoost was improved by cross validation, and the model that was generated by the RF algorithm was modified to have the best average prediction accuracy of 0.75 (Table 1), while DT, SVMs, and XGBoost was 0.67, 0.71, and 0.67, respectively.
4. Discussion
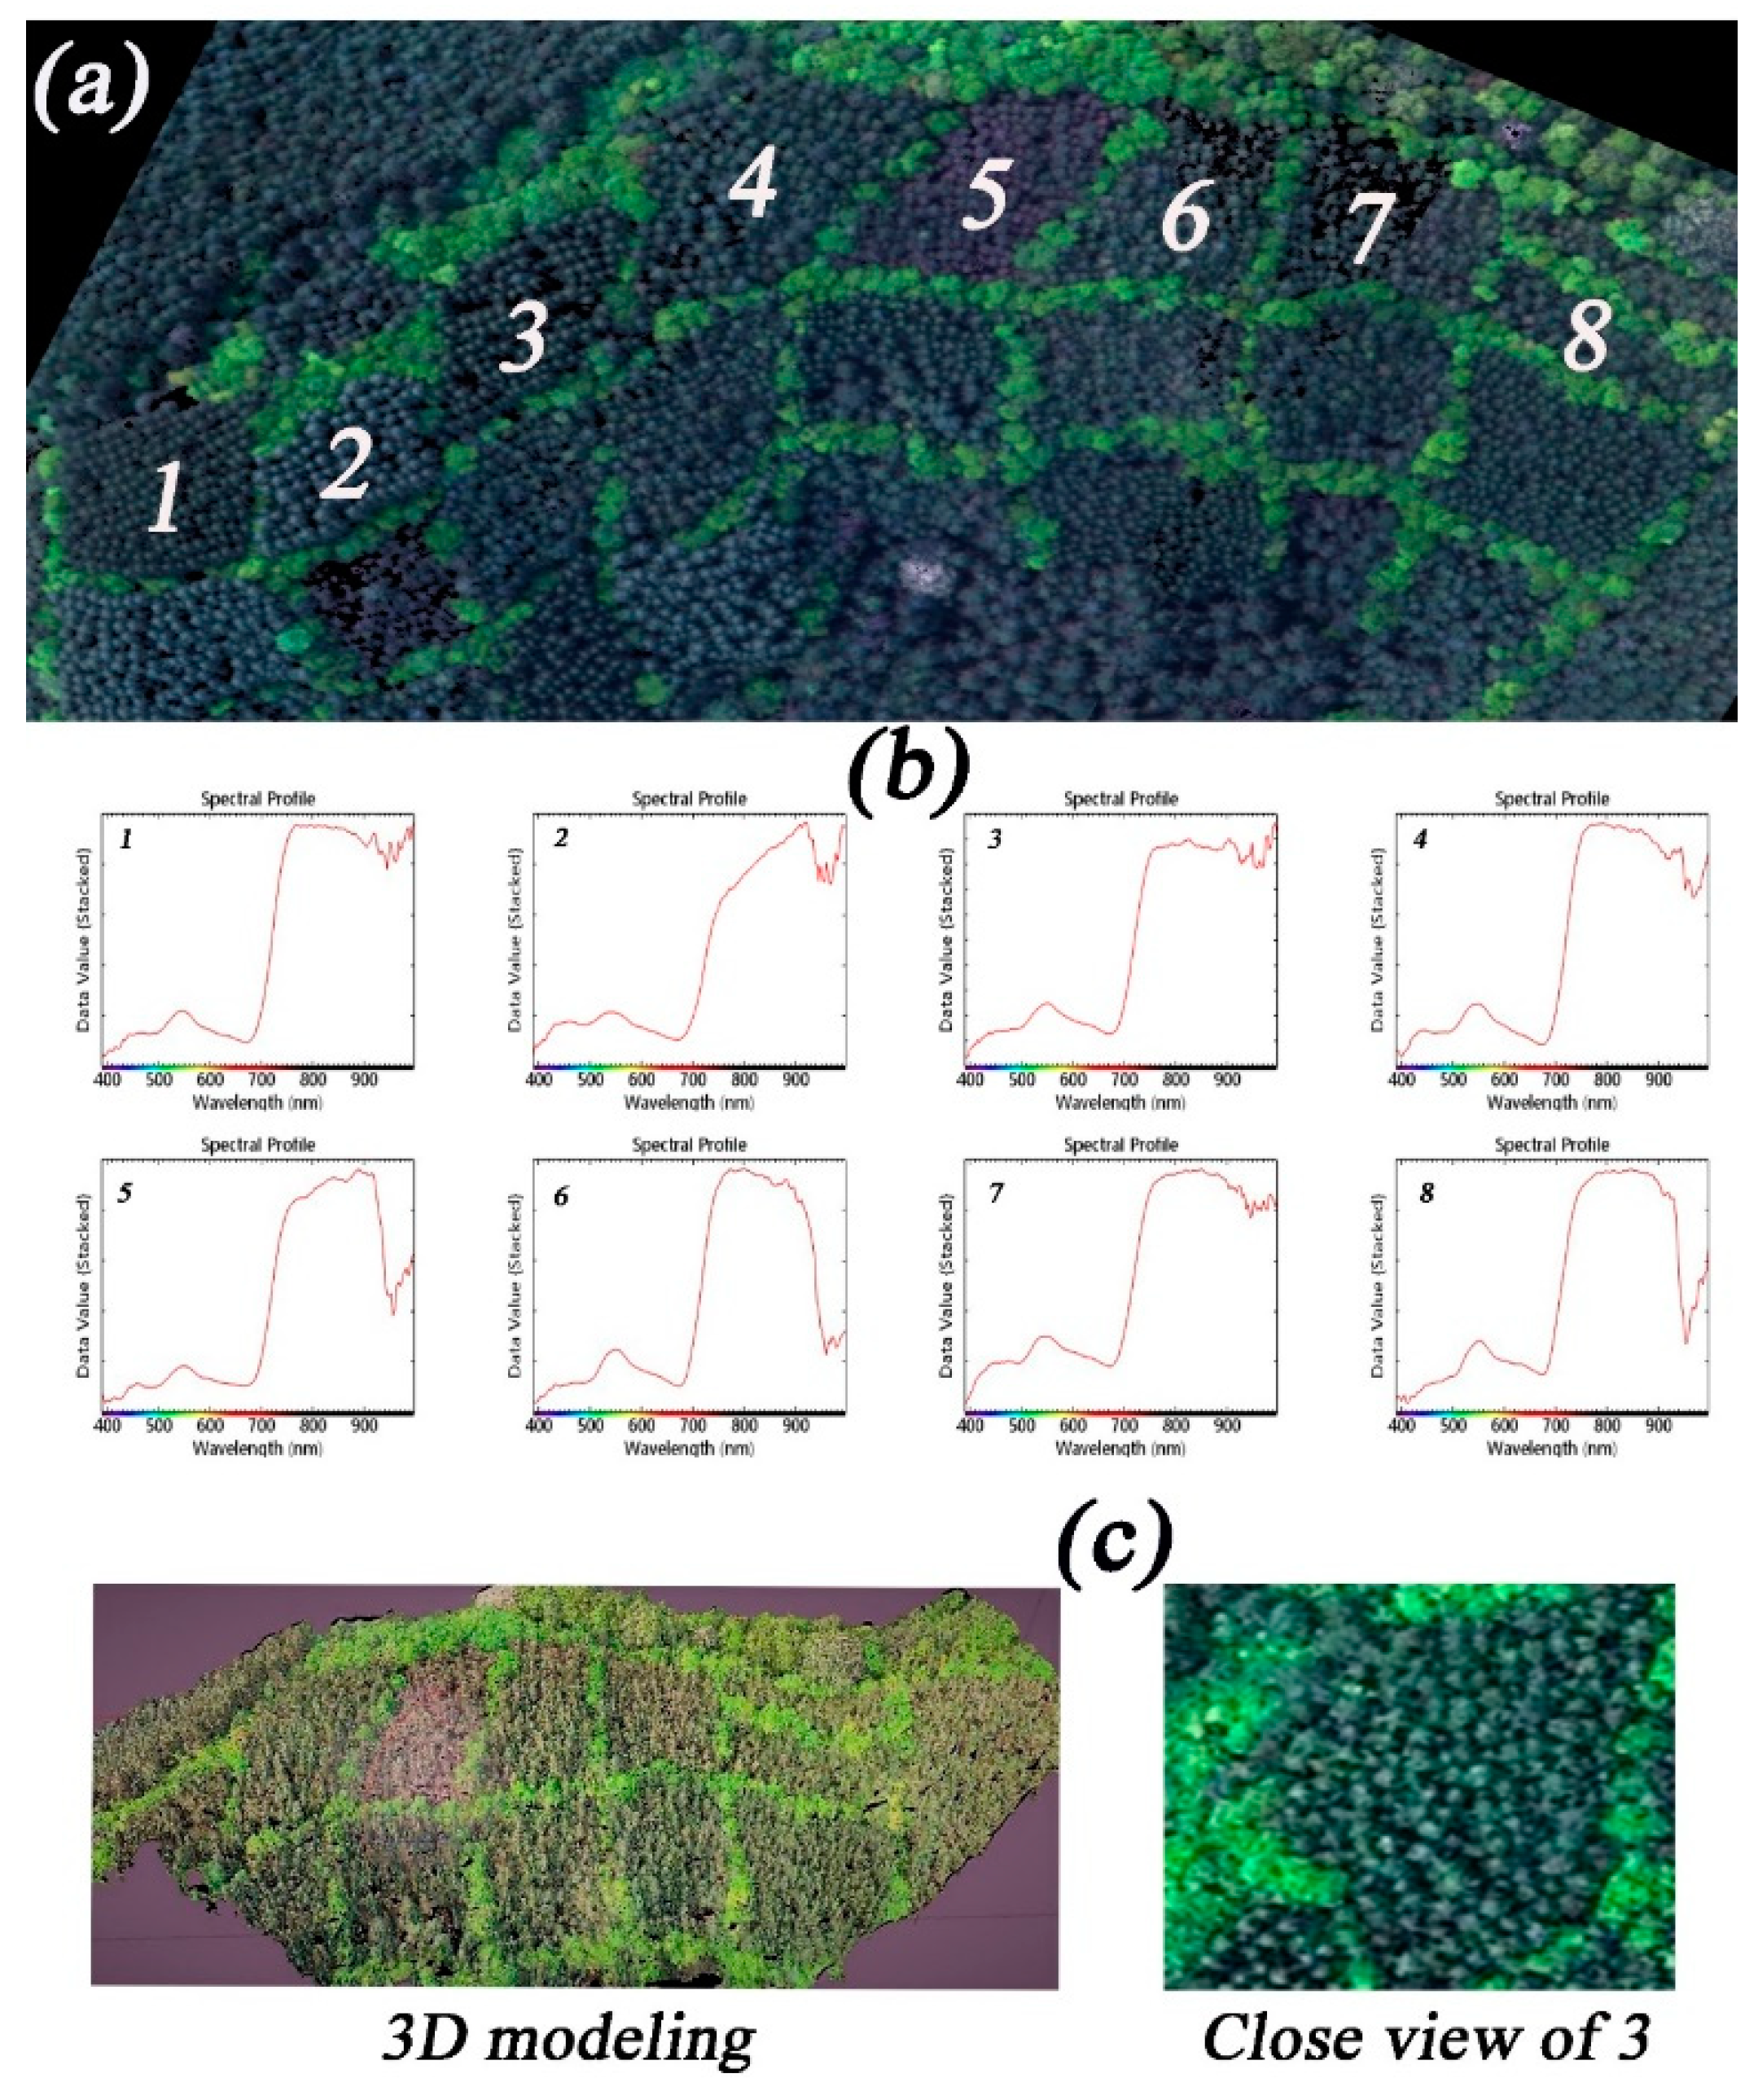
In the pre-experiments, we selected several sampling fields and tried to measure the tree height and DBH while using LiDAR and 3-D modeling by high resolution RGB imagery, as previously described [10,11]. After conducting 3-D modeling, an inaccurate measurement was made for subplot 3 (shown as a blank) due to high crown density and insufficient geographical information (Figure 5c). Although our manually collected measurements found difference in these variables between cultivars, this was not detected from the data that were measured by LiDAR and 3-D modeling. This was problematic for the screening process, mainly because the spectral difference between cultivars ranges from 900 to 1000 nm, which is beyond the RGB detection range (Figure 5a,b), also differs from frequently used spectral vegetation indices that use wavebands of the red and near-infrared (NIR) spectrum to predict key traits, such as biomass [22,23]. This suggests that sensors used in further similar study should capable of collecting spectral information by using wavebands of near infrared to shortwave infrared.
It has been well documented that the spectral traits of canopies are closely related to biomass, as well as some vegetation indices [22,23]. Therefore, it is still possible to evaluate the biomass of the forest with the canopy images. One of the most popular and widespread vegetation indices is the normalized difference vegetation index (NDVI), which is used for measuring the general health status of crops and predict the plant biomass, as well as the red edge NDVI [24]. However, NDVI and red edge NDVI did not show high correlation with the growth ratio of Chinese fir in this study (Figure 2). From raw hyperspectral data collected by UAVs, we found the same pattern between the biomass and 19 vegetation indices of different cultivars. This enhanced the possibility of developing a highly accurate classifier. Furthermore, we evaluated the importance of these 19 vegetation indices during development of the model by RF, and found that nine (EVI, RGRI, MTVI, CRI2, PSR1, ARVI, OSAVI, TCARI, and MCARI2) had a larger F-score (> 20) than the other 10 vegetation indices (Figure S2). This suggests that these nine vegetation indices are enough for the prediction of the growth rate of Chinese fir. Most of these nine vegetation indices require NIR reflectance spectroscopy for the calculation, which is different from other tree species (e.g., pea and apple) [23,25]. Interestingly, NIR reflectance spectroscopy has proved to be very effective for the analysis of grassland biophysical parameters (e.g., above-ground biomass) [26]. This may hint that, in low background noise areas (plant covers most part of the images), NIR reflectance spectroscopy is more suitable for the biomass prediction than red and red edge.
Building simple models for the prediction of DBH and Height is inappropriate due to the weak direct correlations between VIs and DBH or Height (the absolute values of Pearson product-moment correlation coefficient are between 0.4–0.6) in this study [6,7]. Hence, we take advantage of machine learning algorithms and developed more complex models for the predictions. The RF algorithm was developed to fix the overfitting problem of DT, and it shows better predict accuracy in crop disease classification and some characteristics of plant leaves [24,27,28], which is consistent with our results that the RF model has better accuracy than DT. We show that SVM model has a lower prediction accuracy than RF, which differs from the case of early disease detection, where the imagery features were used for modeling instated of spectral features [23,29]. XGBoost was an advanced RF algorithm [19,20] and was proven to be a better choice than RF for modeling in multiple cases [12,23]. Surprisingly, our work shows that RF has better prediction ability on DBH and Height of Chinese fir than XGBoost, this may come from our data generating strategy (pixel not objective base) and low features of our dataset [19,20].
Reliable and timely information of forest areas is crucial for governments, the commercial sector, and scientists, in order to make decisions on policies, investments, and research. Although tremendous efforts have been made to access that information, it is still difficult to gather customized information for specific cases, which has contributed to a slow-growing forestry industry [30,31]. In this study, we collaborated with the government and private industry to collect information regarding forest land. During our investigation, we were amazed by the popularity of UAVs in the forest area with a coverage of the village level. Thus, we identified a strategy that was based on “Internet of Things”, which connects all UAVs via the Internet, named “Internet of UAVs (IoU)”, to share all useful information (e.g., growth conditions of different forests, real time weather information, and nutrient condition of ROI) with a wide range of users. Our largest concern for IoU is that most investigators using UAVs are not well-trained to quantify or conduct quality control on massive datasets and images. Thus, we aimed to develop a user-friendly software to serve those investigators with a single click.
5. Conclusions
LiDAR and 3-D modeling both have limits on measuring tree height and tree diameter at breast height (DBH) in the field. 19 vegetation indices were calculated by randomly selecting 500 pixels from every ROI and assigned to three categories according to the manually measured data to understand the connection between canopy spectral features collected by UAVs and the growth rate of Chinese fir. By comparing the prediction accuracy of the machine learning prediction models that were generated by decision tree (DT), random forest (RF), support vector machine (SVM), and XGBoost algorithms, we found that the model that was generated by the random forest had the highest prediction accuracy (0.75). This provides a novel approach for evaluating the growth rate of Chinese fir in high canopy density area.
This study demonstrates an effective approach that allows for rapid and high-throughput indicators, and for alterations of LiDAR and 3-D modeling. However, understanding the connections between canopy spectral features and the biomass is still required for the effective use of these technologies. Future research should discuss the effects of environmental factor, soil conditions, and other biophysical information offered by site-based methods on the model, and how data will contribute to improving management strategies of forestry industry.
Supplementary Materials
The following are available online at https://www.mdpi.com/1999-4907/10/9/815/s1. Suppl. file1: Digital Surface Models (DSM) of sample filed. Suppl. file2: Values of 41 different vegetation indices (VI) and calculation of VIs in this research. Suppl. file3: Calculation scripts of vegetation indices (VI). Figure S1: Logarithmic Loss (Log Loss) evaluation results for XGBoost. Figure S2: Feature importance of 19 vegetation indices in this study, evaluated by F score.
Author Contributions
Investigation, X.Z., A.L., and B.W.; software, B.W.; writing, original draft, J.S.; review and editing: R.Z. and J.L.; project administration: R.Z. and J.L.; funding acquisition: J.S., R.Z. and J.L.
Acknowledgments
This work was supported by the National Natural Science Foundation of China (31700582) and was sponsored by the People’s Republic of China Scholarship Council.
Conflicts of Interest
The authors declare no conflict of interest.
References
- Shi, J.; Zhen, Y.; Zheng, R. Proteome profiling of early seed development in Cunninghamia lanceolata (Lamb.) Hook. J. Exp. Bot. 2010, 61, 2367–2381. [Google Scholar] [CrossRef] [PubMed]
- Zheng, W.; Chen, J.; Hao, Z.; Shi, J. Comparative analysis of the chloroplast genomic information of Cunninghamia lanceolata (Lamb.) Hook with sibling species from the Genera Cryptomeria, D. Don, Taiwania Hayata, and Calocedrus Kurz. Int. J. Mol. Sci. 2016, 17, 1084. [Google Scholar] [CrossRef] [PubMed]
- Guan, F.Y.; Tang, X.L.; Fan, S.H.; Zhao, J.C.; Peng, C. Changes in soil carbon and nitrogen stocks followed the conversion from secondary forest to Chinese fir and Moso bamboo plantations. Catena 2015, 133, 455–460. [Google Scholar] [CrossRef]
- Zhao, M.F.; Xiang, W.H.; Peng, C.H.; Tian, D.L. Simulating age-related changes in carbon storage and allocation in a Chinese Fir plantation growing in southern China using the 3-PG model. For. Ecol. Manag. 2009, 257, 1520–1531. [Google Scholar] [CrossRef]
- Ablo, P.I.H.; Mathieu, J.; Claude, N.; Laurent, S.-A.; Quentin, P. Improving the robustness of biomass functions: From empirical to functional approaches. Ann. For. Sci. 2015, 72, 795–810. [Google Scholar]
- Guangyi, M.; Yujun, S.; Saeed, S. Models for Predicting the Biomass of Cunninghamia lanceolata Trees and Stands in Southeastern China. PLoS ONE 2017, 12, e0169747. [Google Scholar] [CrossRef] [PubMed]
- Hao, X.; Yujun, S.; Xinjie, W.; Jin, W.; Yao, F. Linear mixed-effects models to describe individual tree crown width for China-Fir in Fujian Province, Southeast China. PLoS ONE 2015, 10, e0122257. [Google Scholar] [CrossRef]
- White, J.W.; Andrade-Sanchez, P.; Gore, M.A.; Bronson, K.F.; Coffelt, T.A.; Conley, M.M.; Jenks, M.A.; Feldmann, K.A.; French, A.N.; Heun, J.T.; et al. Field-based phenomics for plant genetics research. Field Crop Res. 2012, 133, 101–112. [Google Scholar] [CrossRef]
- Yang, G.; Liu, J.; Zhao, C.; Li, Z.; Huang, Y.; Yu, H.; Xu, B.; Yang, X.; Zhu, D.; Zhang, X.; et al. Unmanned aerial vehicle remote sensing for field-based crop phenotyping: Current status and perspectives. Front. Plant Sci. 2017, 8, 1111. [Google Scholar] [CrossRef]
- Brede, B.; Lau, A.; Bartholomeus, H.; Kooistra, L. Comparing RIEGL RiCOPTER UAV LiDAR derived canopy height and DBH with terrestrial LiDAR. Sensors 2017, 17, 2371. [Google Scholar] [CrossRef]
- Torres-Sánchez, J.; López-Granados, F.; Serrano, N.; Arquero, O.; Peña, J.M. High Throughput 3-D Monitoring of Agricultural-Tree Plantations with Unmanned Aerial Vehicle (UAV) Technology. PLoS ONE 2015, 10, e0130479. [Google Scholar] [CrossRef] [PubMed]
- Sandino, J.; Pegg, G.; Gonzalez, F.; Smith, G. Aerial mapping of forests affected by pathogens using UAVs, hyperspectral sensors, and artificial intelligence. Sensors 2018, 18, 944. [Google Scholar] [CrossRef] [PubMed]
- Aasen, H.; Burkart, A.; Bolten, A.; Bareth, G. Generating 3D hyperspectral information with lightweight UAV snapshot cameras for vegetation monitoring: From camera calibration to quality assurance. ISPRS J. Photogramm. Remote Sens. 2015, 108, 245–259. [Google Scholar] [CrossRef]
- Calderon, R.; Navas-Cortes, J.; Lucena, C.; Zarco-Tejada, P. High-resolution airborne hyperspectral and thermal imagery for early detection of Verticillium wilt of olive using fluorescence, temperature and narrow-band spectral indices. Remote Sens. Environ. 2013, 139, 231–245. [Google Scholar] [CrossRef]
- Bilwaj, G.; Davatzikos, C. Analytic estimation of statistical significance maps for support vector machine based multi-variate image analysis and classification. Neuroimage 2013, 78, 270–283. [Google Scholar] [Green Version]
- Nasi, R.; Honkavaara, E.; Lyytikainen-Saarenmaa, P.; Blomqvist, M.; Litkey, P.; Hakala, T.; Viljanen, N.; Kantola, T.; Tanhuanpaa, T.; Holopainen, M. Using UAV-Based photogrammetry and hyperspectral imaging for mapping bark beetle damage at tree-level. Remote Sens. 2015, 7, 15467–15493. [Google Scholar] [CrossRef]
- Ren, S.; He, K.; Girshick, R.; Sun, J. Faster r-cnn: Towards real-time object detection with region proposalnetworks. In Advances in Neural Information Processing Systems; The MIT Press: London, UK, 2015; pp. 91–99. [Google Scholar]
- Girshick, R.; Donahue, J.; Darrell, T.; Malik, J. Rich feature hierarchies for accurate object detection andsemantic segmentation. In Proceedings of the IEEE Conference on Computer Vision and Pattern Recognition, Columbus, OH, USA, 24–27 June 2014; pp. 580–587. [Google Scholar]
- Chen, T.; Guestrin, C. XGBoost: A scalable tree boosting system. In Proceedings of the 22nd ACM Sigkdd International Conference on Knowledge Discovery and Data Mining, San Francisco, CA, USA, 13–17 August 2016; ACM: New York, NY, USA; pp. 785–794. [Google Scholar]
- Pause, M.; Schweitzer, C.; Rosenthal, M.; Keuck, V.; Bumberger, J.; Dietrich, P.; Heurich, M.; Jung, A.; Lausch, A. In situ/remote sensing integration to assess forest health–A review. Remote Sens. 2016, 8, 471. [Google Scholar] [CrossRef]
- Sambo, P.; Nicoletto, C.; Giro, A.; Pii, Y.; Valentinuzzi, F.; Mimmo, T.; Terzano, R.; Lugli, P.; Orzes, G.; Mazzetto, F.; et al. Hydroponic solutions for soilless production systems: Issues and opportunities in a smart agriculture perspective. Front. Plant Sci. 2019, 10, 923. [Google Scholar] [CrossRef] [PubMed]
- Tilly, N.; Aasen, H.; Bareth, G. Fusion of plant height and vegetation indices for the estimation of barley biomass. Remote Sens. 2015, 7, 11449–11480. [Google Scholar] [CrossRef]
- Quirós Vargas, J.J.; Zhang, C.; Smitchger, J.A.; McGee, R.J.; Sankaran, S. Phenotyping of Plant Biomass and Performance Traits Using Remote Sensing Techniques in Pea (Pisum sativum, L.). Sensors 2019, 19, 2031. [Google Scholar] [CrossRef] [PubMed]
- Lowe, A.; Harrison, N.; French, A.P. Hyperspectral image analysis techniques for the detection and classification of the early onset of plant disease and stress. Plant Methods. 2017, 13, 80. [Google Scholar] [CrossRef] [PubMed]
- Jarolmasjed, S.; Kostick, S.; Si, Y.; Quiros, J.; Marzougui, A.; Evans, K.; Sankaran, S. High-Throughput Phenotyping of Fire Blight Disease Symptoms Using Sensing Techniques in Apple. Front. Plant Sci. 2019, 10, 576. [Google Scholar] [CrossRef] [PubMed]
- Vescovo, L.; Wohlfahrt, G.; Balzarolo, M.; Pilloni, S.; Sottocornola, M.; Rodeghiero, M.; Gianelle, D. New spectral vegetation indices based on the near-infrared shoulder wavelengths for remote detection of grassland phytomass. Int. J. Remote Sens. 2012, 33. [Google Scholar] [CrossRef] [PubMed]
- Maes, W.H.; Steppe, K. Perspectives for remote sensing with unmanned aerial vehicles in precision agriculture. Trends Plant Sci. 2019, 24, 152–164. [Google Scholar] [CrossRef] [PubMed]
- Fan, L.; Zhao, J.; Xu, X.; Liang, D.; Yang, G.; Feng, H.; Wei, P.; Yang, H.; Wang, Y.; Chen, G. Hyperspectral-Based Estimation of Leaf Nitrogen Content in Corn Using Optimal Selection of Multiple Spectral Variables. Sensors 2019, 19, 2898. [Google Scholar] [CrossRef] [PubMed]
- Rumpf, T.; Mahlein, A.; Steiner, U.; Oerke, E.; Dehne, H.; Plümer, L. Early detection and classification of plant diseases with support vector machines based on hyperspectral reflectance. Comput. Electron. Agric. 2010, 74, 91–99. [Google Scholar] [CrossRef]
- MacDicken, K.G. Global forest resources assessment 2015: What, why and how? For. Ecol. Manag. 2015, 352, 3–8. [Google Scholar] [CrossRef]
- Rodney, J.K.; Gregory, A.R.; Frédéric, A.; Joberto, V.D.F.; Alan, G.; Erik, L. Dynamics of global forest area: Results from the FAO global forest resources assessment 2015. For. Ecol. Manag. 2015, 352, 9–20. [Google Scholar]
Figure 1.
Pipeline process for screening fast growing Chinese fir.

Figure 2.
Data distribution of 41 vegetation indices of three clusters. Each column represents the data distribution of the represented group, the mean was represented by the white spot inside the column.
Figure 2.
Data distribution of 41 vegetation indices of three clusters. Each column represents the data distribution of the represented group, the mean was represented by the white spot inside the column.

Figure 3.
Clustering results of manually collected data on tree height and diameter at breast height (DBH) of Chinese fir in Jiangle, China. (Left) represents K-mean clustering results plotted by the number of clusters and the validity; (Right) shows the heatmap plot against first 2 principal components (set1 & set2 represent tree height and DBH, respectively) of each cluster (Fast, Median, and Normal).

Figure 4.
Evaluation results of different algorithms. Prediction accuracy of randomly selected test samples (1000 replicates) was calculated for decision tree (a), random forest (b), support vector machines (c), and XGBoost (d). The cross-validated accuracy was calculated with the values of max_depth from 1 to 18 for decision tree (e) and random forest (f), for gamma values from 1 to 10 for the support vector machines (g), and gamma values from 1 to 18 for XGBoost (h).

Figure 5.
Limitations on measuring the real tree height and DBH of Chinese fir directly by RGB camera. Pre-experiment results of different locations (a); the variation of spectral profiles for eight Chinese fir cultivars (b) range from 900–1000 nm; and, (c) three-dimensional (3-D) modeling results of eight Chinese fir cultivars (left) and a real color close view of subplot 3 (right).


Table 1.
Validation of the calibrated models.
| Algorithm | Average Precisions (%) |
|---|---|
| decision tree | 66.67 |
| random forest | 75.00 |
| support vector machines | 71.34 |
| XGBoost | 67.47 |
© 2019 by the authors. Licensee MDPI, Basel, Switzerland. This article is an open access article distributed under the terms and conditions of the Creative Commons Attribution (CC BY) license (http://creativecommons.org/licenses/by/4.0/).
Share and Cite
MDPI and ACS Style
Zou, X.; Liang, A.; Wu, B.; Su, J.; Zheng, R.; Li, J. UAV-Based High-Throughput Approach for Fast Growing Cunninghamia lanceolata (Lamb.) Cultivar Screening by Machine Learning. Forests 2019, 10, 815. https://doi.org/10.3390/f10090815
AMA Style
Zou X, Liang A, Wu B, Su J, Zheng R, Li J. UAV-Based High-Throughput Approach for Fast Growing Cunninghamia lanceolata (Lamb.) Cultivar Screening by Machine Learning. Forests. 2019; 10(9):815. https://doi.org/10.3390/f10090815
Chicago/Turabian StyleZou, Xiaodan, Anjie Liang, Bizhi Wu, Jun Su, Renhua Zheng, and Jian Li. 2019. "UAV-Based High-Throughput Approach for Fast Growing Cunninghamia lanceolata (Lamb.) Cultivar Screening by Machine Learning" Forests 10, no. 9: 815. https://doi.org/10.3390/f10090815
Note that from the first issue of 2016, this journal uses article numbers instead of page numbers. See further details here.