Article

Changes in Soil C, N, and P Concentrations and Stoichiometry in Karst Trough Valley Area under Ecological Restoration: The Role of Slope Aspect, Land Use, and Soil Depth

College of Resources and Environment, Southwest University, Chongqing 400715, China
*
Author to whom correspondence should be addressed.
Forests 2021, 12(2), 144; https://doi.org/10.3390/f12020144
Submission received: 29 December 2020 / Revised: 15 January 2021 / Accepted: 25 January 2021 / Published: 26 January 2021
(This article belongs to the Section Forest Ecology and Management)

Abstract

:
This study aims to investigate the roles of slope aspect, land use and soil depth in altering the soil organic carbon (C), total nitrogen (N), and total phosphorus (P) traits in the karst trough valley area experiencing extensive ecological restoration. A total of 54 soil samples were collected at 0–10, 10–20, and 20–30 cm soil depths from secondary forest, plantation forest, and grassland on the relatively more shaded east-facing slope and the contrasting west-facing slope, respectively. The independent and interactive effects of slope aspect, land use, and soil depth on soil C, N, and P concentrations and stoichiometry were determined. The results show that soil C and N concentrations were markedly higher on the east-facing slope than on the west-facing slope, and soil P concentrations showed an opposite trend, leading to significant differences in soil C:P and N:P but not in C:N ratios between the two aspects. Soil C and N concentrations were not affected by land use, and soil P concentration was significantly higher in plantation forest than in secondary forest and grassland. Soil C and N concentrations significantly decreased with increasing soil depth, but soil P concentration presented no significant changes with soil depth. Both the land use and soil depth did not differ in terms of their elemental stoichiometry. There were no significant interactive effects of slope aspect, land use and soil depth on soil C, N, and P traits. Our results indicate that soil C, N, and P changes are more sensitive to slope aspect rather than land use and soil depth in the karst trough valley area under ecological restoration.

1. Introduction

The biogeochemical cycles of carbon (C), nitrogen (N), and phosphorus (P) are usually interconnected through their coupled responses to primary production, respiration, and decomposition [1,2]. The C:N:P stoichiometric ratio is the significant indicator for characterizing the nutrient cycling, and its shifts affect the capacity to regenerate the natural vegetation after the anthropogenic abandonment [3,4,5]. Recently, it has been suggested that C, N, and P cycles vary greatly in soils because of the effects by various factors such as topography, vegetation types, and human activities [6,7]. Due to the effects of those influencing factors, soil C, N, and P concentrations are markedly changed, and thus their coupled stoichiometric ratios are probably disrupted, indicating the potential differences occurring in the ecological interactions and processes in different soil ecosystems [8,9,10].
Slope aspect is widely regarded as the crucial topography factor altering soil C, N, and P concentrations and stoichiometry [11,12,13] as a result of the distinct microclimates in different aspects [14]. Nevertheless, the effects of slope aspect on C, N, and P traits are still unclear. For example, Sidari et al. [15] found lower soil C and N contents on the south-facing slope rather than the relatively more shaded northern aspect, and the C:N ratio declined dramatically along the soil profile on the north-facing aspect, but did not significantly differ on the south-facing slope in a Pinus laricio forest ecosystem of Aspromonte in Southern Italy. By contrast, Chu et al. [16] reported nonsignificant differences in C and N concentrations, but higher C:N ratio on the north-facing slope than on the south-facing slope in a boreal forest of China. Thus, more data are required to disclose the slope aspect effects on variations in soil C and nutrients to deepen the understanding of their biogeochemical cycles.
Land use change, mainly driven by human activities, also plays a pivotal role in enhancing the variability of soil C, N, and P elements. Cleveland and Liptzin [8] reported a well-constrained C:N:P stoichiometric ratio (186:13:1) at the soil depth of 0–10 cm, though these elemental concentrations varied by orders of magnitude between forests and grasslands at the global scale. However, Xu et al. [17] suggested that soil C, N, and P concentrations and stoichiometric ratios averaged for the 0–30 cm soil depth varied widely among various land uses at the global scale. This clearly demonstrates a distinct shift in trends in C, N, and P concentrations and stoichiometry in response to different land uses. At the regional scale, the differences in C, N, and P traits appear to be magnified through the influences of different land uses [5,18]. Although great efforts have been made to evaluate the differences in C and nutrient traits under different land uses [10,19,20], the understanding of stoichiometrically coupled variations in C, N, and P elements impacted by land use changes are still unavailable.
Generally, soil depth is another important factor differing the distribution patterns of soil C, N, and P concentrations and stoichiometry [21,22]. Based on a synthesis of observational data at the national scale, Tian et al. [23] found that soil C, N, and P concentrations and their stoichiometric ratios significantly decreased as soil depth increased in the 0–100 cm soil profile. However, other studies found that soil C and N concentrations were relatively higher in the top layer than those in the lower layer, while soil P concentration varied only slightly across study soil profiles, resulting in marginal shifts in their stoichiometric ratios [5,24]. This suggests that more studies on soil depth effects on changes in C and nutrients are undoubtedly needed.
Karst trough valley is one of the typical landscapes in the karst region, Southwest China, an area with the largest continuous karsts in the world. This region is subjected to considerable degradation in ecological environment, such as vegetation cover loss, soil erosion, and biodiversity loss, largely due to human activities [25]. In recent years, ecological restoration following agricultural abandonment through either natural regeneration or afforestation has been increasingly launched in the most degraded karst lands, which have suffered from substantial destruction of native vegetation and arable cultivation over the past decades [26]. However, the effects of land use changes relating to different ecological restoration measures implemented in the contrasting slope aspects on soil C, N, and P traits in such areas, to our knowledge, have been rarely investigated. Addressing these effects will help to understand the biogeochemical cycles of C, N, and P, and optimize the measures of ecological restoration considering the benefits of soil quality improvement. Additionally, soil C, N, and P concentrations and stoichiometric ratios are usually linked to other soil physicochemical properties [18,27], which have not been well examined in this area [26,28].
In the current study, the changes in soil C, N, and P concentrations and stoichiometry were determined in different soil depths from secondary forest, plantation forest, and grassland on the relatively more shaded east-facing slope and the contrasting west-facing slope, respectively, in the representative karst trough valley hillslope. The specific objectives of this study are to (1) determine the variations in soil C, N, and P concentrations, their stoichiometric ratios and selected physicochemical properties affected independently and interactively by slope aspect, land use and soil depth; (2) explore the potential changes in interrelationships between these soil variables.

2. Materials and Methods
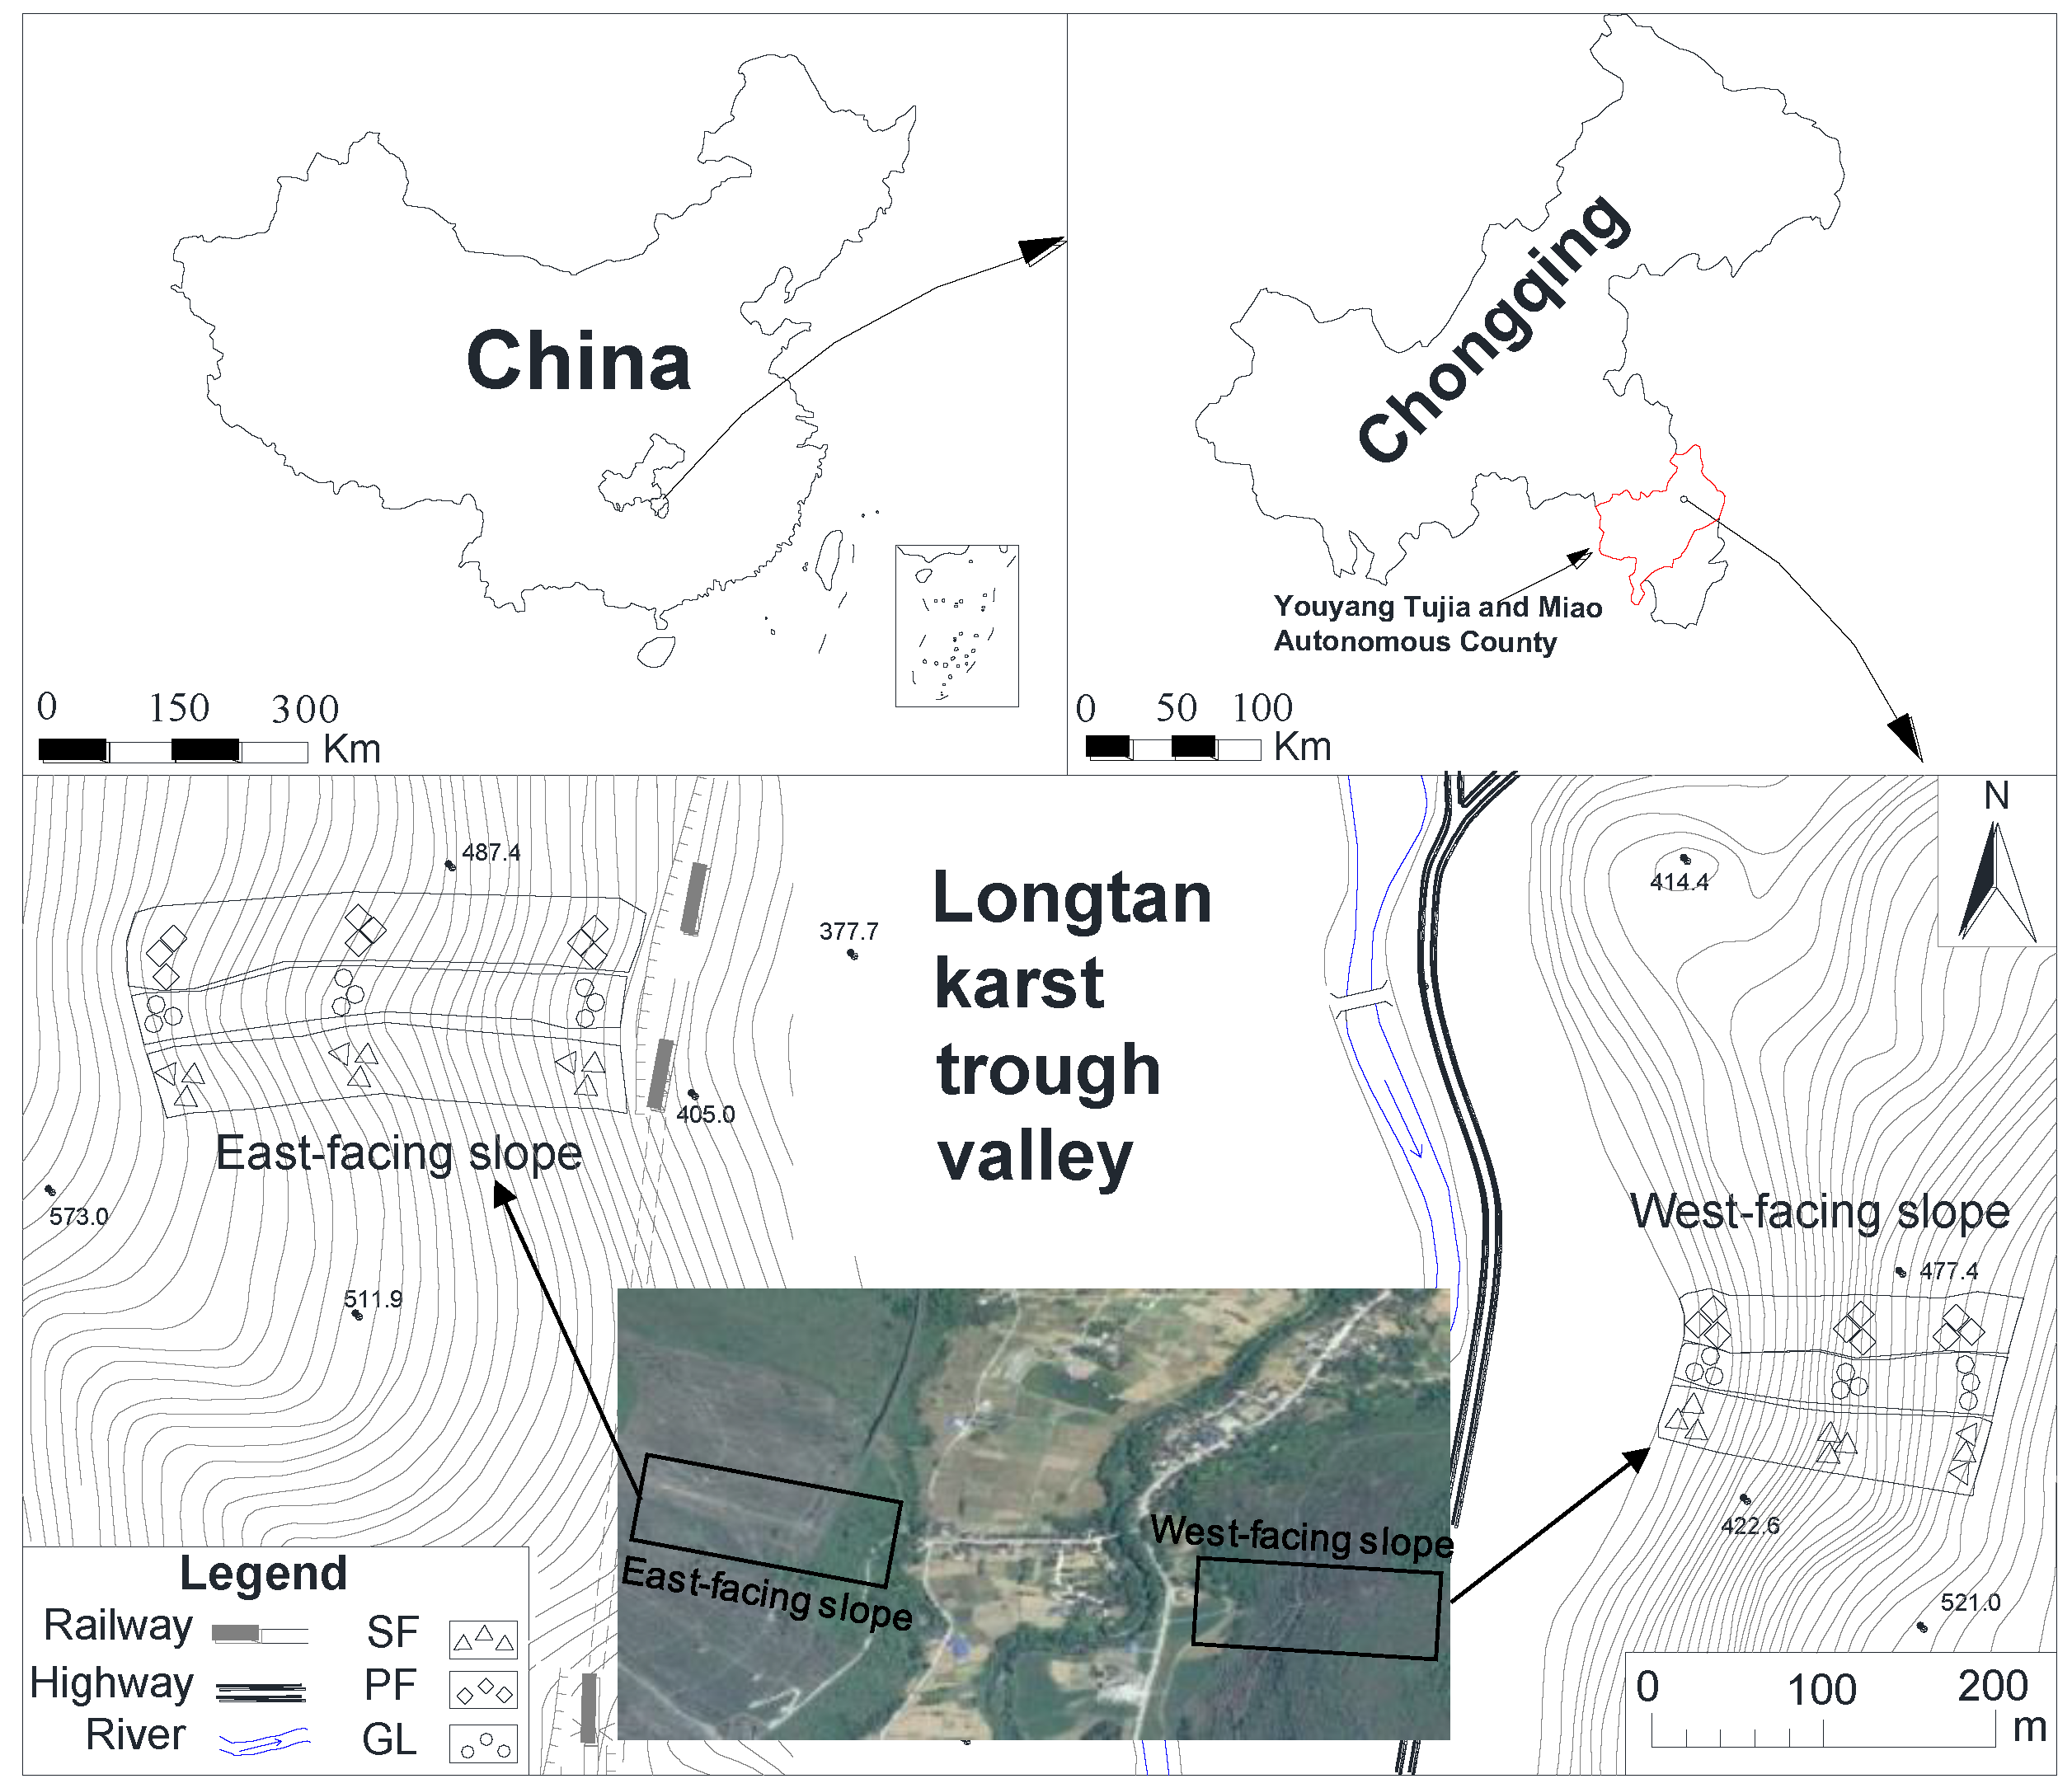
2.1. Study Area

The study area is situated in the Longtan Trough Valley (LTV) (108.96° E, 29.01° E), Youyang Tujia, and Miao Autonomous County, Chongqing Municipality, Southwest China (Figure 1). The regional climate is characterized by a subtropical monsoon humid climate with a mean annual air temperature of 14.6 °C. The average annual precipitation is 1200 mm, with over 80% occurring in the wet season from April to October [29].
LTV is located on the southeast wing of the Tongmaling anticline, where its axial area is dominated by Cambrian dolomite and Ordovician limestone, and the areas in the two wings of the anticline are Silurian sand shale and Permian and Triassic limestone, respectively [30]. LTV runs from northeast to southwest, with a total length of approximately 35 km and an area of 1677 km2, which is dominated by karst landform accounting for 76% of the total area [30]. The bottom area of LTV has a width ranging from 1 to 4 km with an elevation of 300–500 m above sea level, and the elevation of east to west wings of LTV varies from 900 to 1100 m above sea level with the slope gradient of 15–30° [30]. The bedrock stratum tendency on either side of the LTV is the same, while the slope aspect is the opposite. The relatively more shaded east-facing slope of LTV has the same dip direction with the bedrock stratum tendency, while the west-facing slope of LTV has inverse dip direction with the bedrock stratum tendency [31]. Since the severe water and soil losses usually occur on the slope presenting the same dip direction with bedrock stratum tendency [31], the east-facing slope has a higher rock bareness rate than that in the west-facing slope, which together results in severe rocky desertification accounting for 11% of the total area.
The overlying soils in the study area are mainly classified as yellow calcareous soil corresponding to mollic Inceptisols according to the United States Department of Agriculture (USDA) Taxonomy [32]. Soils in both east-facing and west-facing hillslopes are discontinuously distributed within the cavities and grooves between outcrop rocks, and the thickness of soil layers is heterogeneous and not in excess of 60 cm [30]. Although the study area is attributed to subtropical evergreen broadleaf forest zone, most native plants on both east-facing and west-facing hillslopes were removed by deforestation to develop the local economy over the past decades. Recently, in response to the local policy of ecological restoration, the arable lands have been converted to the plantation forest (PF) and grassland (GL) through revegetation since 2014. The PF is dominated by Zanthoxylum bungeanum Maxim. with a stand density of about 1100 tree ha−1, and the GL is dominated by herbs such as Oxalis corniculata (L.) and Eleusine indica (L.) Gaertn. Additionally, the secondary forest (SF) has also been found on the hillslopes since 1990s and is dominated by macrophanerophytes, such as Pinus massoniana (L.), Cunninghamia Lanceolata (L.) Hook (Table 1). Approximately, 500–1650 kg ha−1 water-soluble compound fertilizers with high potassium sulfate concentration are applied to the PF in February and July in each year, but human management activities are rarely conducted in SF and GL, according to the local farmers.

2.2. Soil Sampling and Measurements

The soil sampling was conducted in the middle of June 2018, at a time in which there was no rain for a week before the sampling days. In situ, three land uses including SF, PF, and GL were all identified on the east-facing and west-facing slopes, where the slope gradients varied between 23–28 degrees, respectively (Figure 1). For each land use, three sampling sites (10 m × 10 m for each site) in the top, middle and foot slopes were randomly chosen, respectively. Five soil sampling points in each site were assigned by drawing an ‘S’ shape and soil cores were collected from 0–10, 10–20, and 20–30 cm soil depths, respectively, using a 5 cm diameter soil auger in each point. These soil cores sampled from the five sampling points in each soil depth of each site corresponded to each land use, and were first mixed thoroughly and then subsampled for a composite sample weighing approximately 1 kg. In total, 54 soil samples (2 slope aspects × 3 land uses × 3 sampling sites × 3 soil depths) were thus collected. These soil samples were air-dried and passed through a 2 mm sieve to remove the roots, rocks and other debris. Additionally, undisturbed soil cores corresponding to a 0–20 cm soil depth were collected to determine soil bulk density (BD) and porosity.
Soil organic C concentration was determined by the Walkley–Black dichromate oxidation method [33]. Soil N concentration was measured by the Kjeldahl digestion procedure. Soil P concentration was determined using sodium hydroxide fusion combined with molybdenum antimony colorimetry. Soil pH (1:5 soil/water ratio) was measured with a pH meter. Fraction size distributions of soil micro-aggregates and mass percentages of soil sand, silt, and clay were analyzed using the pipette method. Soil BD was determined using the weighing method. Soil porosity was determined after complete saturation by capillarity. The measurements of the above variables (i.e., soil N, P, pH, micro-aggregates, sand, silt, clay, BD, and porosity) followed the standard Chinese protocols [34]. Moreover, the elevation gradient usually plays an important role in altering soil C, N, and P concentrations and stoichiometry as well as other soil physicochemical properties [35]. Nevertheless, in this study, the elevation gradients for sampling sites were the same between land uses for each slope aspect, and were not in excess of 60 m between slope aspects for each land use; the elevation effects on analyzed soil properties are negligible.

2.3. Statistical Analysis

A Kolmogorov–Smirnov (K–S) test was conducted to examine the normality of variables and the log-transformation (base 10) was performed when the data were not normally distributed. A one-way analysis of variance (ANOVA) with least significant difference (LSD) test was used to determine the differences in C, N, and P concentrations and stoichiometry, and selected soil physicochemical variables among land uses and soil depths, respectively. The Independent Samples T test was performed to examine those differences between slope aspects. Multiple-way ANOVA was adopted to examine the effects of slope aspect, land use, soil depth and their possible interactions on soil variables. The mean values calculated from measured data (27 samples for each slope aspect, 18 samples both for each land use and soil depth) for the study soil variables were displayed visually. Pearson correlation analysis was employed to disclose the correlations between study soil variables. Simple regression analysis was applied to determine the relationships among C, N, and P concentrations and their stoichiometric ratios, and the mean values calculated from three soil depths of each land use were presented in terms of different slope aspects. A significance level of p < 0.05 was specified in this study. All statistical analyses abovementioned were implemented using SPSS 22.0 (IBM, Armonk, New York, NY, USA).

3. Results

3.1. Soil C, N, and P Concentrations

Soil C, N, and P concentrations were all significantly affected by slope aspect (Figure 2a,d,g). Specifically, soil C and N concentrations were 57.6% and 61.3% higher on the east-facing slope than those on the west-facing slope, while soil P concentration was 40.7% lower on the east-facing slope relative to the west-facing slope.
Soil C and N concentrations were not significantly affected with land use (Figure 2b,e). However, soil P concentration was significantly higher in PF than in SF and GL (Figure 2h).
Soil C and N concentrations varied among soil depths, and generally decreased with increasing soil depths (Figure 2c,f). Soil P concentrations did not vary significantly with soil depth (Figure 2i). There were no significant interactive effects of slope aspect, land use, and soil depth on C, N, and P concentrations (Supplementary Materials Table S1).

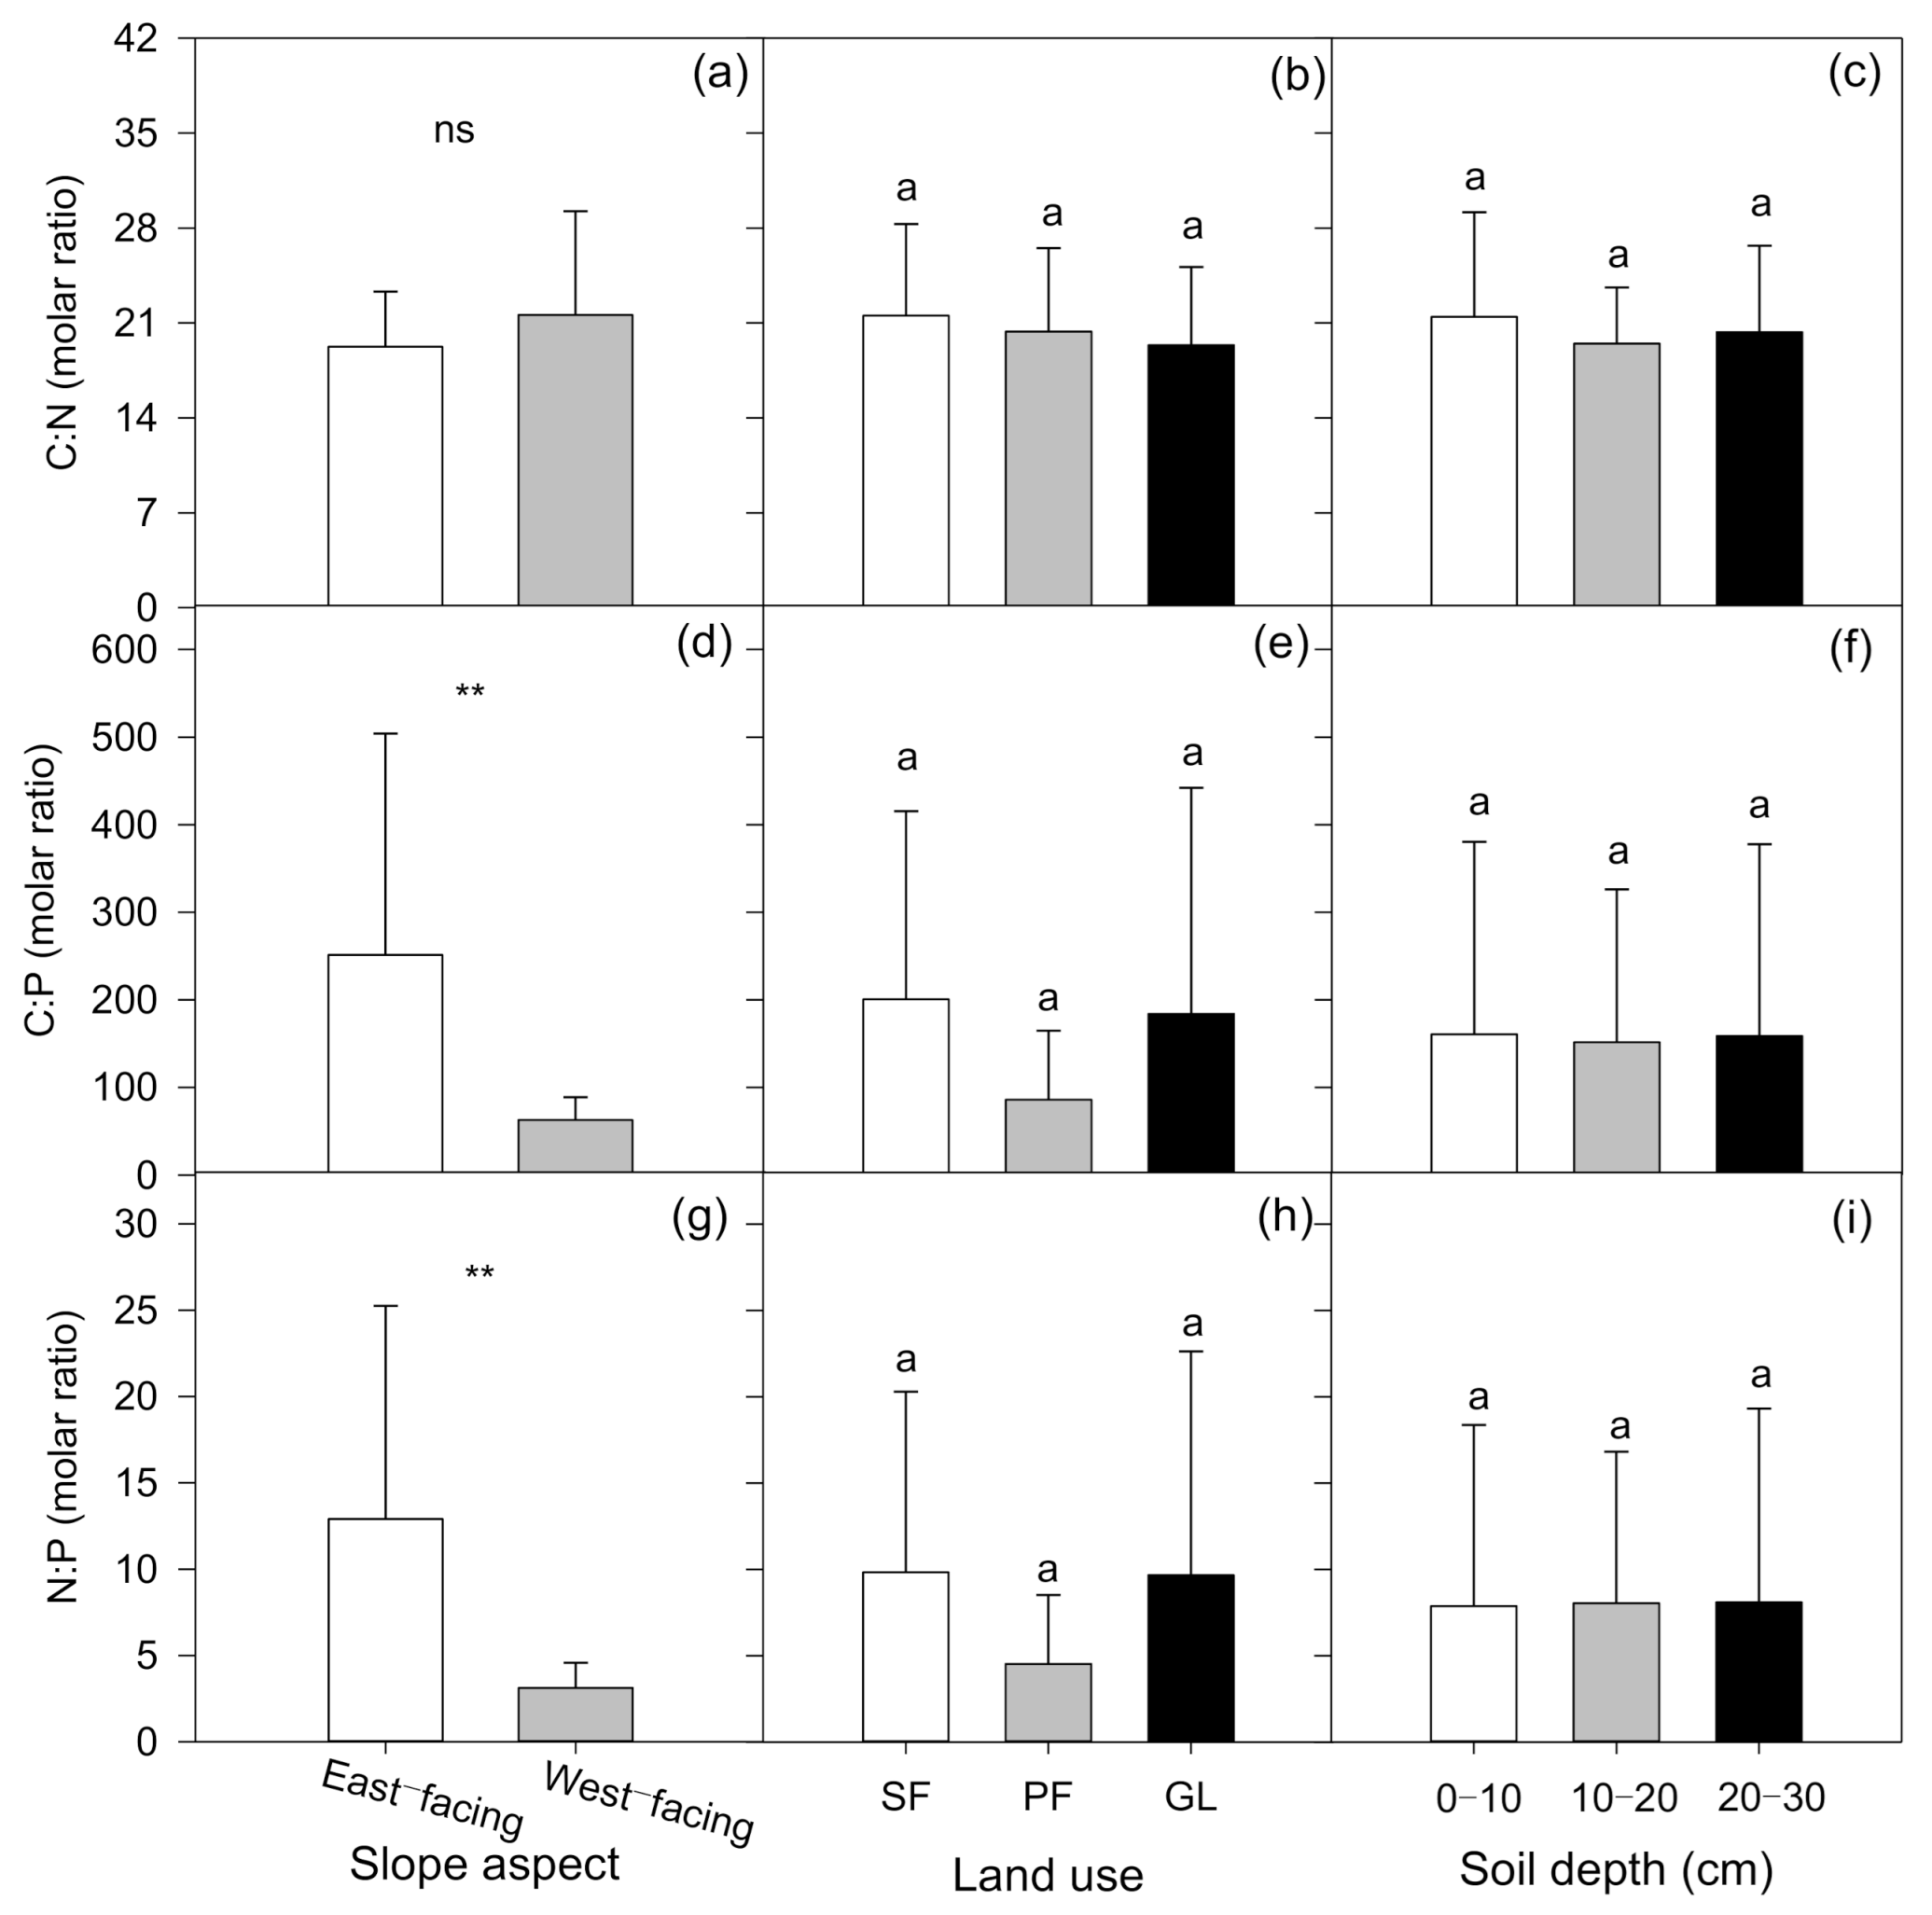
3.2. Soil C, N, and P Stoichiometry

Soil C:N ratio was not significantly affected by slope aspect, while soil C:P and N:P ratios were both 4-fold greater on the east-facing slope than those on the west-facing slope (Figure 3a,d,g). Soil C:N, C:P, and N:P ratios were not affected by land use nor by soil depth (Figure 3b,c,e,f,h,i). There were no significant interactive effects of slope aspect, land use, and soil depth on C:N, C:P, and N:P ratios (Supplementary Materials Table S1).

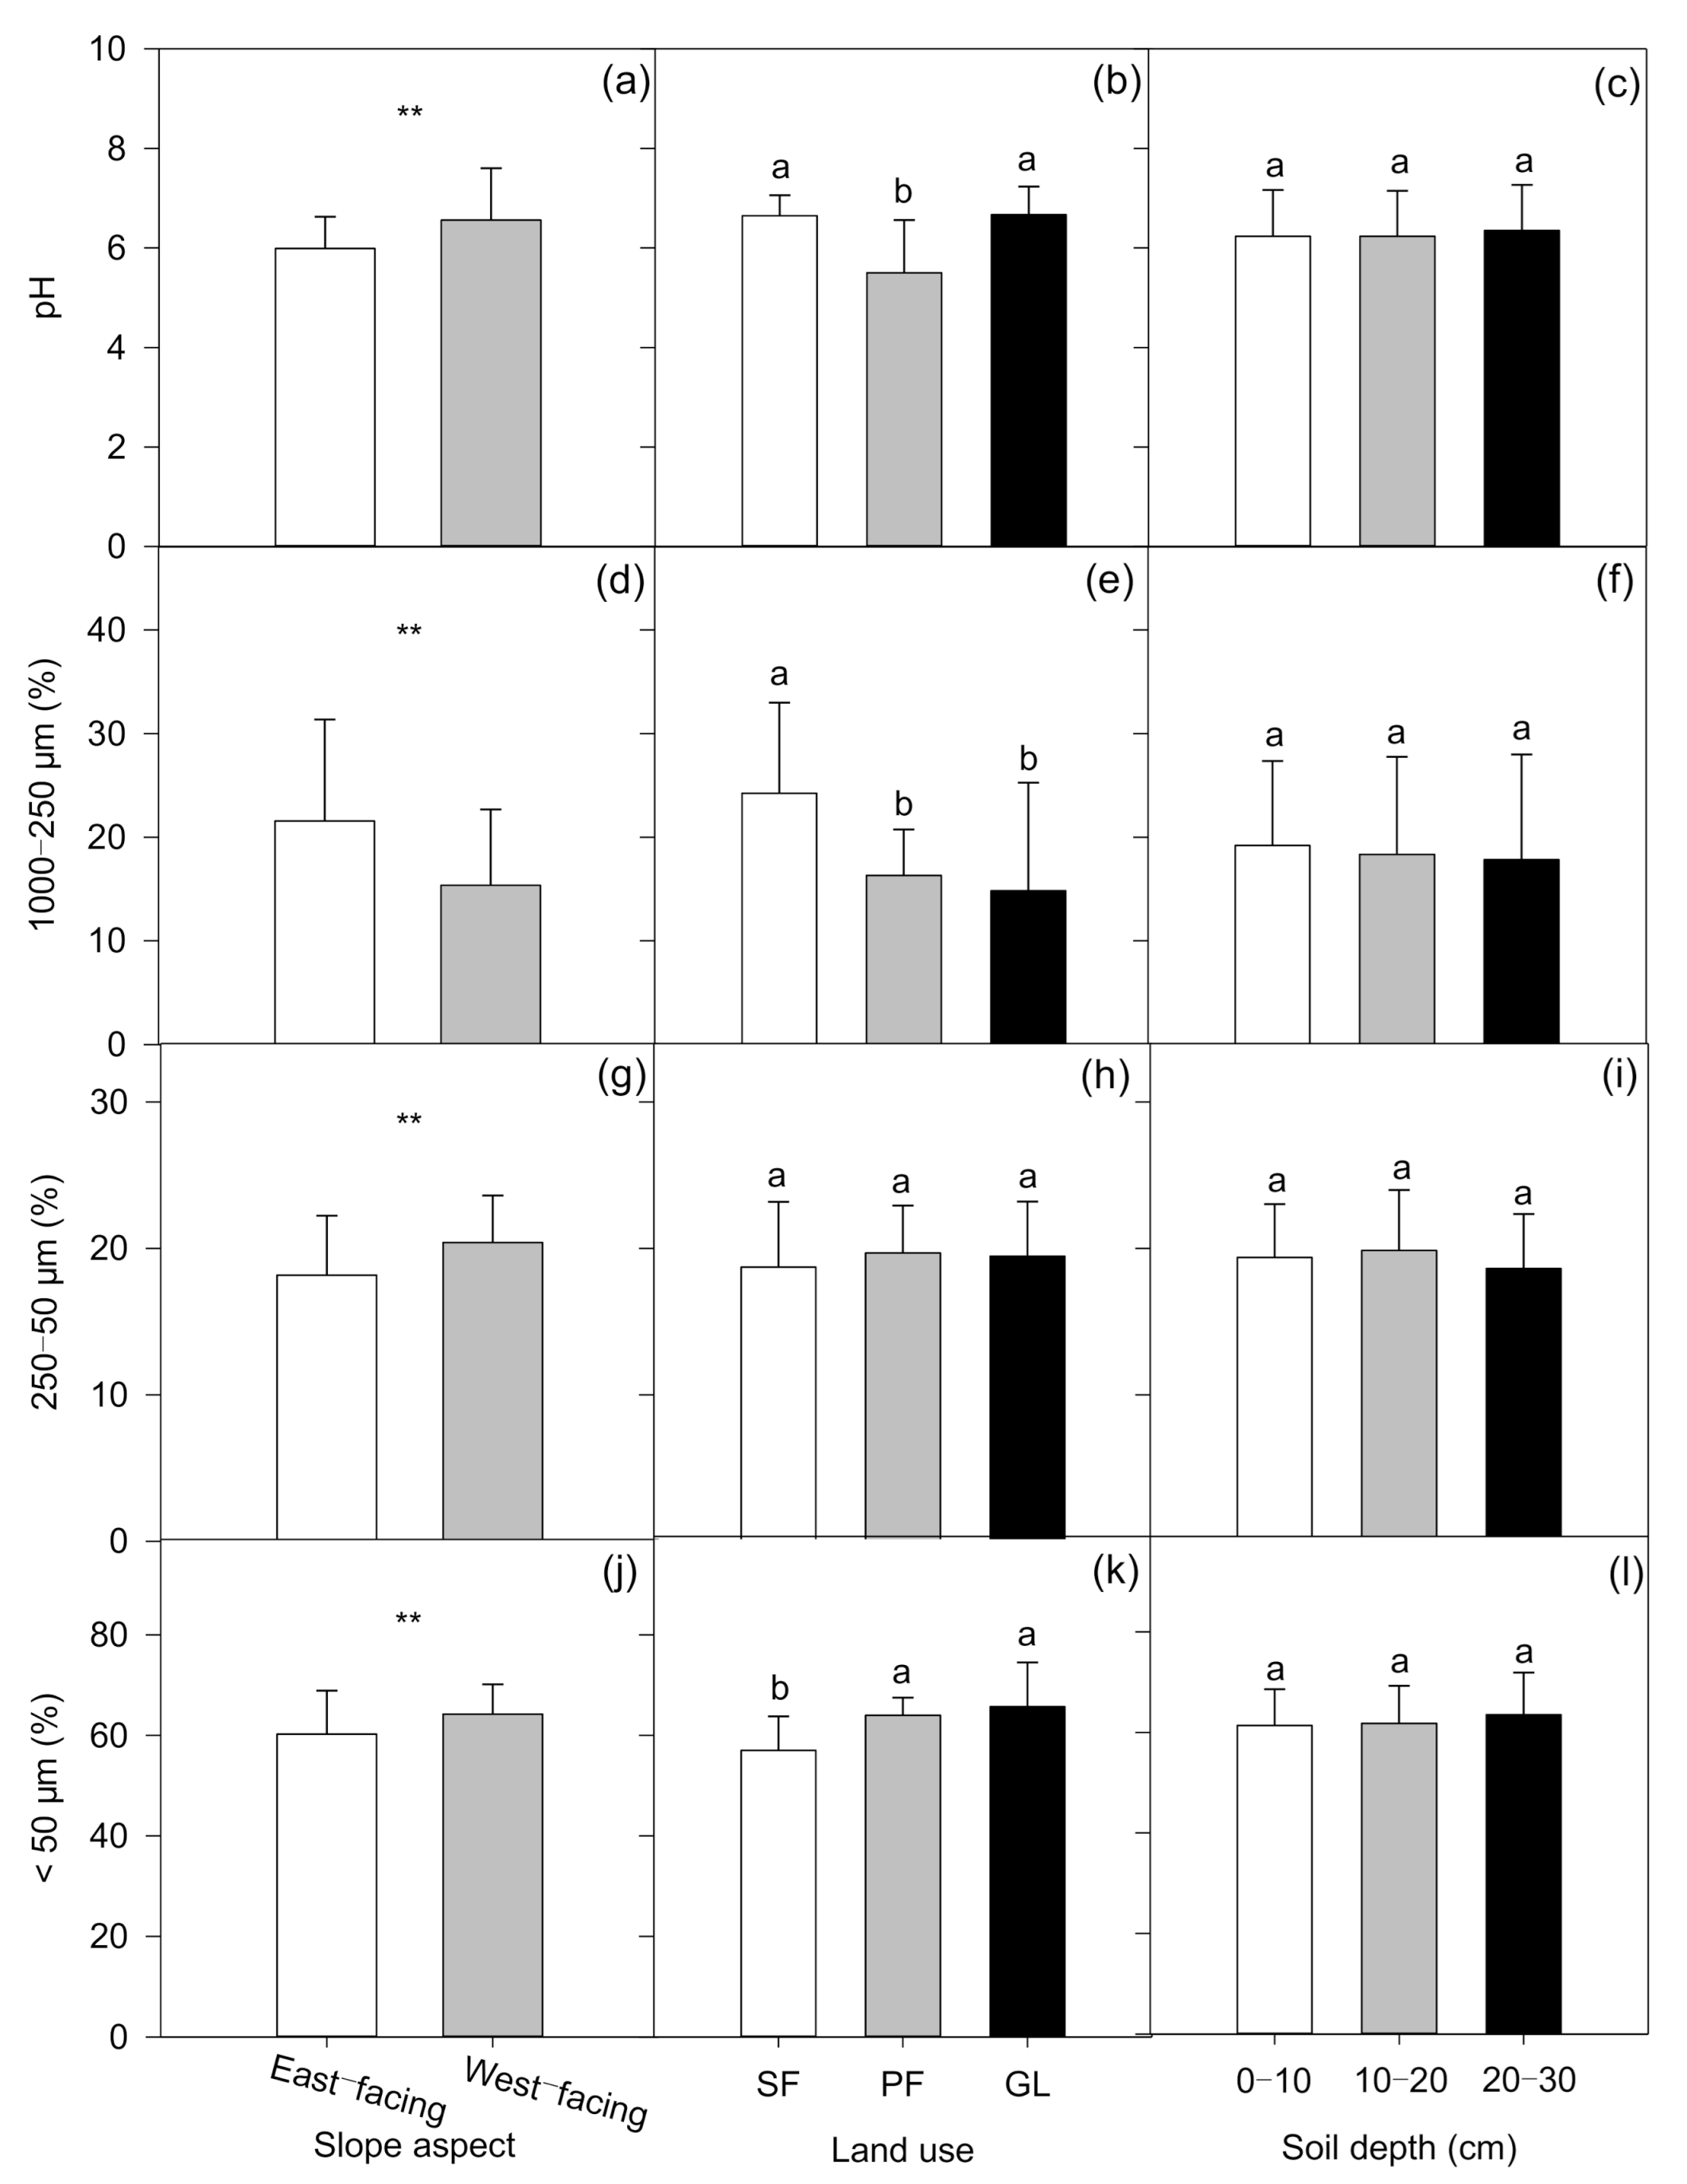
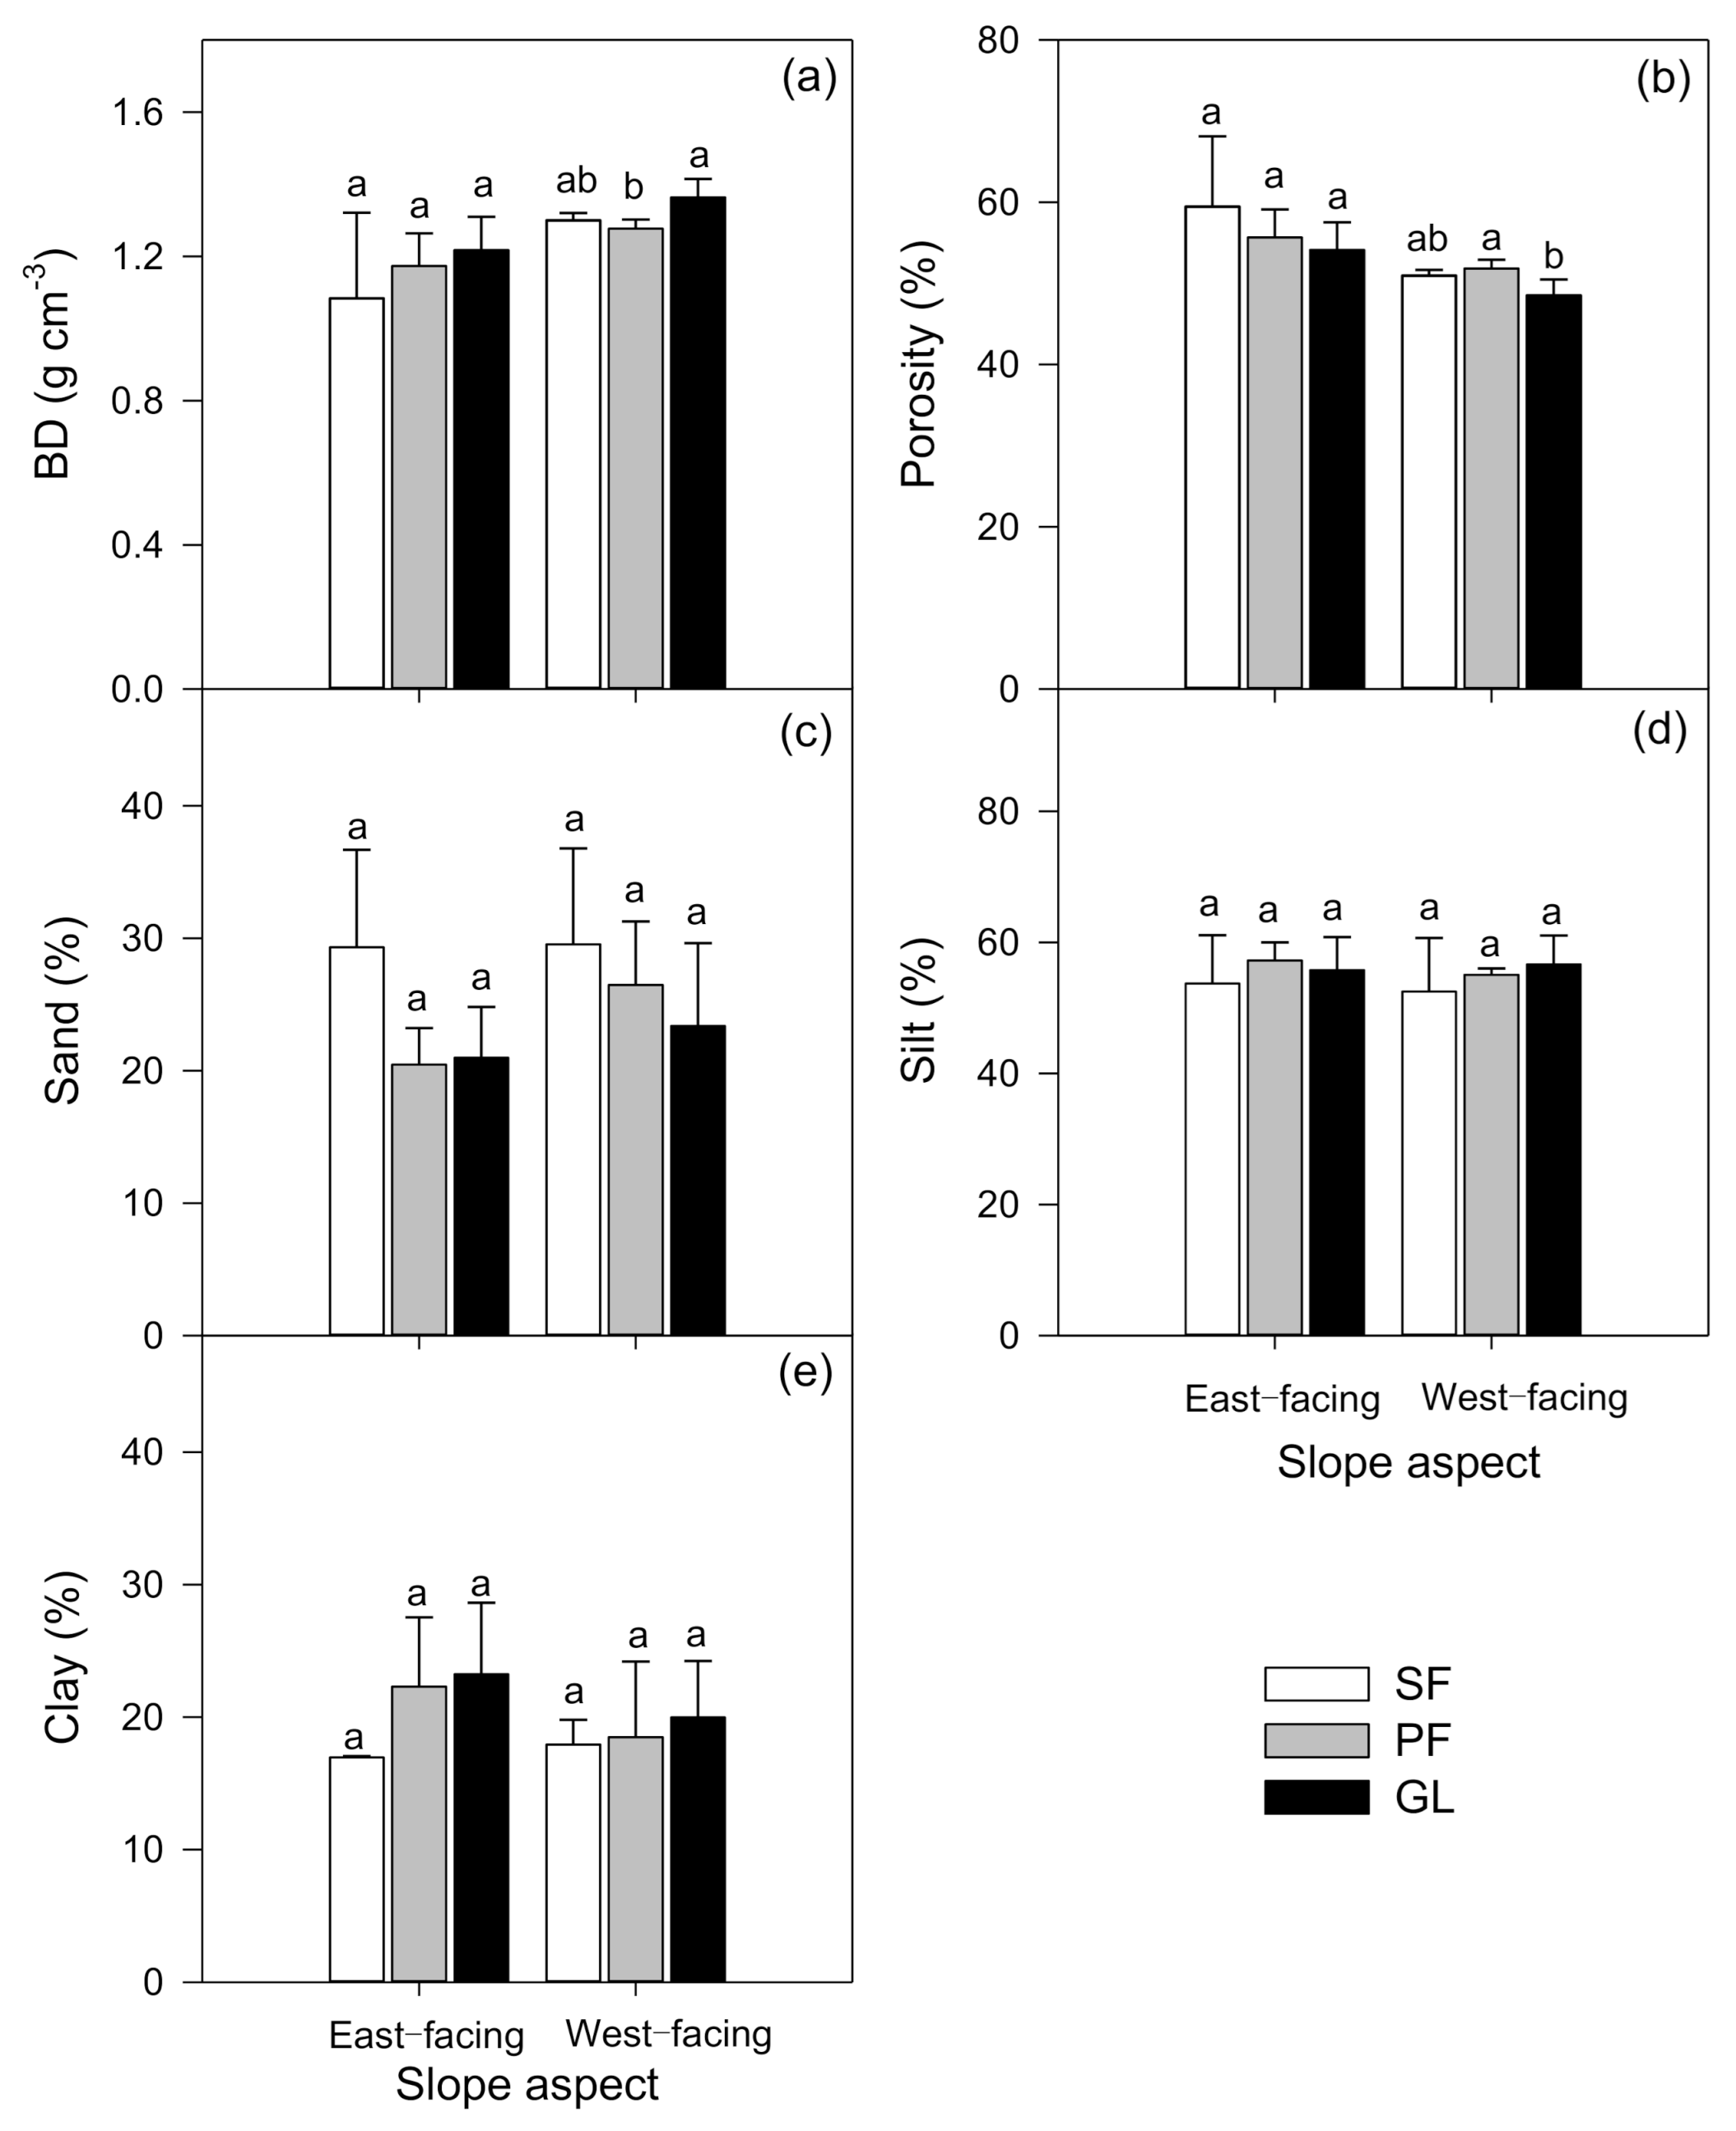
3.3. Selected Soil Physical and Chemical Variables

Soil pH, 1000–250 μm, 250–50 μm, and <50 μm fractions differed significantly with slope aspect (Figure 4a,d,g,j). While soil pH, 1000–250 μm, and <50 μm fractions were affected with land use, and 250–50 μm fractions were not (Figure 4b,e,h,k). Soil pH and three micro-aggregate fractions were not affected by soil depth (Figure 4c,f,i,l). There were no significant interactive effects of slope aspect, land use, and soil depth on soil pH and three micro-aggregate fractions (Supplementary Materials Table S1).
Higher soil BD and lower porosity were found on the west-facing slope compared to those of the eastern aspect, while sand, silt and clay percentages did not differ with slope aspect (Table 2, Figure 5). These variables were also not significantly affected with land use, though soil BD and porosity did differ significantly between PF and GL, and they were not significantly different from SF on the west-facing slope (Table 2, Figure 5). There were no significant interactive effects of slope aspect and land use on soil BD, porosity, sand, silt, and clay percentages (Table 2).

3.4. Relationships between Selected Soil Physicochemical Variables and C, N, and P Traits

Soil pH did not vary significantly with C, N, and P traits (Table 3). The 1000–250 μm fraction was significantly positively correlated with C, N concentrations and C:P, N:P ratios, and the 250–50 μm fraction was significantly negatively correlated with these variables. The <50 μm fraction exhibited significant negative correlations with C concentration and C:P ratio. Soil BD showed a negative relationship with C concentration, while a positive relationship between porosity and C concentration was also found. Soil clay percentage presented a significant negative relationship with C:N ratio. Further, soil C concentration was positively correlated with soil N concentration on the west-facing slope, but was not on the east-facing slope (Figure 6). Soil C:P ratio was positively correlated with N:P ratio on both slope aspects.

4. Discussion

4.1. Effects of Slope Aspect, Land Use, and Soil Depth on C, N, and P Concentrations

Our results indicated that slope aspect significantly affected soil C, N, and P concentrations, showing higher C and N concentrations on the east-facing slope in comparison to the west-facing slope (Figure 2). This was probably because the east-facing slopes received less solar radiation and the darker, moister, and cooler microclimate depressed microbial activities, and thus suppressed the organic matter decomposition, leading to increase in C and N accumulation in soils [13,14,36]. Higher P was found in the relatively more sunlit western slope in this study, which was in contrast to some observations of higher P concentrations in soils of relatively more shaded aspects [12,37], but was similar to other previous findings [38,39]. This suggested that the vegetation on the east-facing slope took up relatively more P for acquiring more abundant above- and/or below-ground biomass [11,40]. Additionally, soil erosion may vary with differences in environmental conditions, such as vegetation density and runoff discharge, in distinct slope aspects [13,41], which could induce losses in C and nutrient elements, and thus cause significant differences in C, N, and P concentrations between slope aspects [42].
Land use did not significantly alter the soil C and N concentrations, supporting the previous findings [10,18,20]. This was probably due to the overlapping of plant species among SF, PF, and GL, resulting in the marginal differences in soil C and N concentrations [43]. Land use differed significantly soil P concentration, showing that PF exhibited the highest soil P concentration in comparison to SF and GL. The reason for this was that the P inputs through fertilization in PF markedly increased the soil P concentration [10], though the P accumulation by plant communities in SF and GL might also contribute to the increase in soil P concentration [43]. Plant communities regulated the soil C, N, and P concentrations through the plant–soil feedbacks [44], which were potentially affected by the slope aspects [13]. However, the responses of plant communities in different land uses to the slope aspects and their influences on soil properties were not detected in this study, and further exploration on this issue was required. Since the changes in soil P concentration are the comprehensive responses to the dynamics of P inputs and outputs [12], the results indicated the potential in reduction of fertilization in the PF in the course of human management activities. Conversely, Liu et al. [24] found that soil P concentration did not differ significantly between land uses in some specified soil layers in an agro-pastoral region of Northwest China. This resulted from the existence of soluble crystal lattices that could conserve most soil P [45].
Meanwhile, soil C and N concentrations varied significantly with soil depth, showing a decreased trend with increasing soil depth, while soil P concentrations were not significantly differed among soil depths. Luo et al. [46] also found soil C and N concentrations were significant higher in the top soil layer and decreased with increasing soil depth, while soil P concentration did not differ significantly among most soil layers among primary broadleaf forest, plantation, and secondary forest in subtropical China. This was likely due to the greater soil nutrient inputs in the top layer increased the C and N concentrations, and the weathering of parent material caused the distinct variations of soil C, N, and P concentrations in response to the downward profile [18]. Further, there were no significant interactive effects of slope aspect, land use, and soil depth on soil C, N, and P concentrations, possibly suggesting the interaction among these three influencing factors counteracted their independent effects on soil C and nutrient concentrations [13,24].

4.2. Effects of Slope Aspect, Land Use, and Soil Depth on C, N, and P Stoichiometry

Soil C:N:P stoichiometry was not significantly affected by independent and interactive slope aspect, land use, and soil depth, except that soil C:P and N:P varied with slope aspect (Supplementary Materials Table S1, Figure 3). Gebrelibanos and Assen [13] reported that soil C:N was not significantly different between slope aspects in the northern highlands of Ethiopia, and the same result was also found in our case. This was probably caused by the proportional shifts in C and N concentrations as these two elements were significantly affected by slope aspect in this study. The proportional shifts in C and N concentrations were also responsible for the slight variation in C:N ratio affected by land use and soil depth [21]. Further, soil P is mainly sourced from weathering of parent material and fertilization, and consumed through plant uptake [12,47], showing the different cycling pathways from soil C and N. This might lead to the decoupling of linkages between soil P and soil C as well as N in the undisturbed sites [9,28], which explained the distinct responses of soil C:P and N:P ratios to slope aspect, land use and soil depth in this study.
Our results showed higher C:N ratio (average 20.4), but lower C:P ratio (average 86) and N:P ratio (average 8.5) in PF soils relative to the averaged ratios (13.4 for C:N, 202.2 for C:P, and 14.1 for N:P) given by Li et al. [28]. This was likely due to the increase in soil P through the fertilization in the PF. Moreover, the current study also found higher C:N ratio (average 21.5), C:P (average 160.5) and lower N:P (average 7.9) in comparison to the Chinese averaged ratios (14.4 for C:N, 136 for C:P, and 9.3 for N:P) in the 0–10 cm soil depth [23]. This suggested that accelerated organic matter accumulation rather than decomposition existed in the study area [48]. Since the N:P ratio was not affected by soil depth, the lower average N:P ratio from three soil depths in comparison to the Chinese average likely meant that the N limitation potentially occurred in the study area, which had been widely reported in other soil ecosystems [5,18,24].

4.3. Effects of Slope Aspect, Land Use, and Soil Depth on Selected Physicochemical Properties and Their Linkages with C, N, and P Traits

Soil pH was significantly less on the east-facing slope than on the relatively more sunlit west-facing slope (Figure 4), implying accelerated leaching occurred on the eastern slope [11]. Markedly lower soil BD and higher porosity were recorded on the east-facing slope (Table 2, Figure 5), which was in support of previous findings [13]. This might be a result of higher soil organic carbon on the relatively more shaded slope [49]. Mohammadi and Motaghian [50] found that aggregate organic carbon was the highest in the meso-aggregate fraction (1000–2000 μm), followed by the micro-aggregate fraction (<1000 μm), and was the lowest in the macro-aggregate fraction (>2000 μm). This result supported our findings that the relative bigger micro-aggregate fraction changed consistently with soil organic carbon, showing profoundly higher 1000–250 μm, and lower 250–50 μm and <50 μm fractions on the relatively more shaded east-facing aspect. This was because the degree of stable micro-aggregate commonly played an important and direct role in reflecting the sequestration of soil organic carbon [51]. Weak variations on sand, silt, and clay percentages between slope aspects were possibly attributed to the slight difference in the parent material of these two slopes [52]. Land use remarkably affected soil pH, 1000–250 μm, and <50 μm fractions, but did not affect other selected soil variables, due largely to the different plant species in each land use that shaped distinct soil properties [10,24,43]. Soil depth solely, and interactively with slope aspect and land use, did not significantly affect selected soil physicochemical properties. This was likely due to the soil formation and later development, such as vertical exchanges of soil water, nutrients, and soil organic matter between soil layers, jointly homogenized these soil traits [22], which overrode the effects of slope aspect and land use on soil variables in this study.
Soil C, N, and P concentrations and their ratios showed similar relationships with selected soil physicochemical properties in each slope aspect (e.g., P concentration versus pH, C:P versus pH, and N:P versus pH), while these relationships shifted when two aspects were synthetically assessed (Table 3). Soil C varied significantly with soil N, but not with soil P (Figure 6). This was in good agreement with previous findings given by Cleveland and Liptzin [9], who suggested that soil C and N increasingly decoupled from soil P as soil organic matter accumulated. Meanwhile, Li et al. [28] also demonstrated that accumulation of soil C and N associated with the increasingly conservative P cycling as a consequence of plant uptake during succession or forest development decouple the linkages between C, N, and P, and simultaneously lead to the increases in C:P and N:P ratios. This might explain the significant relationships between C:P and N:P ratios, but not between other stoichiometric ratios in this study (Figure 6). Additionally, the results were also partially supported by their uniformly close linkages with soil pH, micro-aggregate, BD, and porosity, because soil physical variables are generally associated with chemical indicators due to the processes of soil formation, and thus close links among those properties could be detected in various soil ecosystems [5,36]. These results emphasized that the slope aspect, not land use changes, show a conclusive role in shaping the soil physicochemical features in the study area, as indicated by stronger variations in above relationships among soil physicochemical properties affected by slope aspect. While the land use changes have been demonstrated to strongly alter the soil physical and chemical linkages in other studies [18,24], more data are required to examine the effects of land use changes on these interrelationships among soil C and nutrients and other physicochemical properties for understanding their roles in affecting soil ecosystem functions [10,46].

4.4. Implications

Our results suggest that soil C, N, and P traits, overall, presented marginal differences among three land uses in this study. This was in contrast to the previous studies showing that land use significantly changed the soil C, N, and P concentrations, and thus affected their stoichiometric ratios [17,24,28]. Wang et al. [53] found that soil C and N concentrations were significantly higher in SF than PF and GL, and soil P concentration was not significantly different among these land uses, while C:N:P ratios were significantly different among those three land uses. This was probably attributed to the differences in restoration ages, which could be the major factor affecting the soil C:N:P values [54]. Since soil C, N, and P concentrations and stoichiometry potentially characterized the soil ecosystem structures and functions [55,56], the subtle differences in the C, N, and P changes and interactions and the other soil properties (BD, porosity, sand, silt, clay, and 250–50 μm micro-aggregate) among SF, PF, and GL seemed to indicate the equal effectiveness of these ecological measures for restoring the soil ecosystem in such karst trough valley area. Overall, slope aspect played a more important role in changing soil C, N, and P traits in comparison to land use and soil depth, suggesting that the influences of slope aspect should be strongly taken into account when optimizing the ecological restoration strategies in the karst trough valley area.

5. Conclusions

Soil C and N concentrations were higher on the east-facing slope than on the relatively more sunlit west-facing slope, while soil P concentration showed the opposite trend, leading to significant differences in soil C:P and N:P but not in C:N between two aspects. Soil C and N concentrations were not significantly affected with land use, while soil P concentration was significantly higher in PF than in SF and GL, resulting from the application of fertilizers. Soil C and N concentrations significantly decreased as soil depth increased, but soil P concentration was not significantly different from soil depth. However, both land use and soil depth did not differ in terms of their elemental stoichiometry. There were no significant interactive effects of slope aspect, land use and soil depth on soil C, N, and P concentrations and their stoichiometric ratios. Soil micro-aggregate fractions were, overall, closely linked to C and nutrient traits in this study. The results indicated that SF, PF and GL displayed similar benefits for restoring the soil ecosystem, and slope aspect had more important effects on soil C, N, and P changes in comparison to land use and soil depth. Our results will potentially provide useful information for optimizing sustainable ecological restoration strategies in karst trough valley area.

Supplementary Materials

The following are available online at https://www.mdpi.com/1999-4907/12/2/144/s1, Table S1: Interactive effects of slope aspect, land use and soil depth on C, N, and P concentrations, stoichiometry and pH, micro-aggregates.

Author Contributions

Conceptualization, B.H. and T.L.; methodology, T.L.; software, T.L.; validation, B.H. and J.Z.; formal analysis, T.L. and J.Z.; investigation, J.Z.; resources, B.H.; data curation, T.L.; writing—original draft preparation, T.L.; writing—review and editing, B.H. and Z.C.; visualization, T.L. and J.Z.; supervision, B.H.; project administration, B.H.; funding acquisition, B.H. All authors have read and agreed to the published version of the manuscript.

Funding

This study was funded by the National Natural Science Foundation of China (41771312, 41701246), State Cultivation Base of Eco-agriculture for Southwest Mountainous Land, Southwest University, and Fundamental Research Funds for the Central Universities (SWU118079).

Institutional Review Board Statement

Not applicable.

Informed Consent Statement

Not applicable.

Data Availability Statement

This study did not report any data.

Acknowledgments

We thank Mengdie Feng, Yunfei Bi, and Rongchang Zeng for their assistance in field sampling and laboratory work.

Conflicts of Interest

The authors declare no conflict of interest.

References

  1. Finzi, A.C.; Austin, A.T.; Cleland, E.E.; Frey, S.D.; Houlton, B.Z.; Wallenstein, M.D. Responses and feedbacks of coupled biogeochemical cycles to climate change: Examples from terrestrial ecosystems. Front. Ecol. Environ. 2011, 9, 61–67. [Google Scholar] [CrossRef] [Green Version]
  2. Delgado-Baquerizo, M.; Maestre, F.T.; Gallardo, A.; Bowker, M.A.; Wallenstein, M.D.; Quero, J.L.; Ochoa, V.; Gozalo, B.; Garcia-Gomez, M.; Soliveres, S.; et al. Decoupling of soil nutrient cycles as a function of aridity in global drylands. Nature 2013, 502, 672–676. [Google Scholar] [CrossRef] [PubMed]
  3. Falkengren-Gerup, U.; ten Brink, D.J.; Brunet, J. Land use effects on soil N, P, C and pH persist over 40–80 years of forest growth on agricultural soils. For. Ecol. Manag. 2006, 225, 74–81. [Google Scholar] [CrossRef]
  4. Ramsar. The Ramsar Convention Manual: A Guide to the Convention on Wetlands (Ramsar, Iran, 1971), 6th ed.; Ramsar Convention Secretariat: Gland, Switzerland, 2013; 110p. [Google Scholar]
  5. Wang, W.; Sardans, J.; Zeng, C.; Zhong, C.; Li, Y.; Penuelas, J. Responses of soil nutrient concentrations and stoichiometry to different human land uses in a subtropical tidal wetland. Geoderma 2014, 232, 459–470. [Google Scholar] [CrossRef] [PubMed] [Green Version]
  6. Sariyildiz, T.; Anderson, J.M.; Kucuk, M. Effects of tree species and topography on soil chemistry, litter quality, and decomposition in northeast turkey. Soil Biol. Biochem. 2005, 37, 1695–1706. [Google Scholar] [CrossRef]
  7. Fernández-Romero, M.L.; Lozano-García, B.; Parras-Alcántara, L. Topography and land use change effects on the soil organic carbon stock of forest soils in Mediterranean natural areas. Agric. Ecosyst. Environ. 2014, 195, 1–9. [Google Scholar] [CrossRef]
  8. Elser, J.J.; Fagan, W.F.; Denno, R.F.; Dobberfuhl, D.R.; Folarin, A.; Huberty, A.; Siemann, E.H. Nutritional constraints in terrestrial and freshwater food webs. Nature 2000, 408, 578. [Google Scholar] [CrossRef]
  9. Cleveland, C.; Liptzin, D. C: N: P stoichiometry in soil: Is there a “Redfield ratio” for the microbial biomass? Biogeochemistry 2007, 85, 235–252. [Google Scholar] [CrossRef]
  10. Gao, Y.; He, N.; Yu, G.; Chen, W.; Wang, Q. Long-term effects of different land use types on C, N, and P stoichiometry and storage in subtropical ecosystems: A case study in China. Ecol. Eng. 2014, 67, 171–181. [Google Scholar] [CrossRef]
  11. Kutiel, P. Slope aspect effect on soil and vegetation in a Mediterranean ecosystem. Isr. J. Bot. 1992, 41, 243–250. [Google Scholar]
  12. Sigua, G.C.; Coleman, S.W.; Albano, J.; Williams, M. Spatial distribution of soil phosphorus and herbage mass in beef cattle pastures: Effects of slope aspect and slope position. Nutr. Cycl. Agroecosyst. 2011, 89, 59–70. [Google Scholar] [CrossRef]
  13. Gebrelibanos, T.; Assen, M. Effects of slope aspect and vegetation types on selected soil properties in a dryland Hirmi watershed and adjacent agro-ecosystem, northern highlands of Ethiopia. Afr. J. Ecol. 2013, 52, 292–299. [Google Scholar] [CrossRef]
  14. Åström, M.; Dynesius, M.; Hylander, K.; Nilsson, C. Slope aspect modifies community responses to clear-cutting in Boreal forests. Ecology 2007, 88, 749–758. [Google Scholar] [CrossRef] [Green Version]
  15. Sidari, M.; Ronzello, G.; Vecchio, G.; Muscolo, A. Influence of slope aspects on soil chemical and biochemical properties in a Pinus laricio forest ecosystem of Aspromonte (Southern Italy). Eur. J. Soil Biol. 2008, 44, 364–372. [Google Scholar] [CrossRef]
  16. Chu, H.Y.; Xiang, X.J.; Yang, J.; Adams, J.M.; Zhang, K.P.; Li, Y.T.; Shi, Y. Effects of slope aspect on soil bacterial and arbuscular fungal communities in a boreal forest in China. Pedosphere 2016, 26, 226–234. [Google Scholar] [CrossRef]
  17. Xu, X.F.; Thornton, P.E.; Post, W.M. A global analysis of soil microbial biomass carbon, nitrogen and phosphorus in terrestrial ecosystems. Glob. Ecol. Biogeogr. 2013, 22, 737–749. [Google Scholar] [CrossRef]
  18. Li, T.Y.; Wang, C.Y.; He, B.H.; Liang, C.; Zhang, Y.; Zhang, Y.Q. Soil nutrient concentrations and stoichiometry under different tree-cropping systems in a purple hillslope in southwestern China. Arch. Agron. Soil Sci. 2019, 65, 741–754. [Google Scholar] [CrossRef]
  19. Powers, J.S. Changes in soil carbon and nitrogen after contrasting land-use transitions in Northeastern Costa Rica. Ecosystems 2004, 7, 134–146. [Google Scholar] [CrossRef]
  20. Xu, H.; Qu, Q.; Li, P.; Guo, Z.; Wulan, E.; Xue, S. Stocks and stoichiometry of soil organic carbon, total nitrogen, and total phosphorus after vegetation restoration in the Loess Hilly Region, China. Forests 2019, 10, 27. [Google Scholar] [CrossRef] [Green Version]
  21. Tischer, A.; Potthast, K.; Hamer, U. Land-use and soil depth affect resource and microbial stoichiometry in a tropical mountain rainforest region of southern Ecuador. Oecologia 2014, 175, 375–393. [Google Scholar] [CrossRef]
  22. Kinoshita, R.; Schindelbeck, R.R.; van Es, H.M. Quantitative soil profile-scale assessment of the sustainability of long-term maize residue and tillage management. Soil Tillage Res. 2017, 174, 34–44. [Google Scholar] [CrossRef]
  23. Tian, H.; Chen, G.; Zhang, C.; Melillo, J.M.; Hall, C.A. Pattern and variation of C: N: P ratios in China’s soils: A synthesis of observational data. Biogeochemistry 2010, 98, 139–151. [Google Scholar] [CrossRef]
  24. Liu, X.; Ma, J.; Ma, Z.W.; Li, L.H. Soil nutrient contents and stoichiometry as affected by land use in an agro-pastoral region of northwest China. Catena 2017, 150, 146–153. [Google Scholar] [CrossRef]
  25. Wang, K.L.; Zhang, C.H.; Chen, H.S.; Yue, Y.M.; Zhang, W.; Zhang, M.Y.; Qi, X.K.; Fu, Z.Y. Karst landscapes of China: Patterns, ecosystem processes and services. Landsc. Ecol. 2019, 34, 2743–2763. [Google Scholar] [CrossRef] [Green Version]
  26. Li, D.J.; Wen, L.; Yang, L.Q.; Luo, P.; Xiao, K.; Chen, H.; Zhang, W.; He, X.Y.; Chen, H.S.; Wang, K.L. Dynamics of soil organic carbon and nitrogen following agricultural abandonment in a karst region. J. Geophys. Res. Biogeosci. 2017, 122, 230–242. [Google Scholar] [CrossRef]
  27. Yang, H.; Zhang, P.; Zhu, T.; Li, Q.; Cao, J. The characteristics of soil C, N, and P stoichiometric ratios as affected by geological background in a Karst Graben Area, Southwest China. Forests 2019, 10, 601. [Google Scholar] [CrossRef] [Green Version]
  28. Li, D.J.; Wen, L.; Zhang, W.; Yang, L.Q.; Xiao, K.C.; Chen, H.; Wang, K.L. Afforestation effects on soil organic carbon and nitrogen pools modulated by lithology. For. Ecol. Manag. 2017, 400, 85–92. [Google Scholar] [CrossRef]
  29. Zou, X.G.; Yang, Y.; Xu, G.; Tian, N.; You, X.H.; He, Z.L.; Tian, H.M.; Zeng, Z.Z. Chemical characteristics of surface spring in the rehabilitation area of karst rock desertification: A case study at Laoquan in the Pepper planting area of Ganxi Town, Youyang County, Chongqing City, China. Earth Environ. 2018, 46, 524–533, (In Chinese with Abstract in English). [Google Scholar]
  30. You, X.H.; Yang, Y.; Xu, G.; Zou, X.G.; Zeng, Z.Z. Comparison of the soil moisture variations of inclined slope in Longtan Karst Trough Area, Chongqing, China. Mt. Res. 2019, 37, 53–61, (In Chinese with Abstract in English). [Google Scholar]
  31. Wang, H.S.; Xiong, K.N.; Zhang, F.M. Mechanism study on effects of terrain on soil erosion of Karst slope. Bull. Soil Water Conserv. 2015, 35, 1–7, (In Chinese with Abstract in English). [Google Scholar]
  32. Liu, M.; Han, G.L.; Zhang, Q. Effects of agricultural abandonment on soil aggregation, soil organic carbon storage and stabilization: Results from observation in a small karst catchment, Southwest China. Agric. Ecosyst. Environ. 2020, 288, 106719. [Google Scholar] [CrossRef]
  33. Nelson, D.W.; Sommers, L.E. Total carbon, organic carbon and organic matter. In Methods of Soil Analysis: Part 2 Chemical and Microbiological Properties; Page, A.L., Ed.; ASA Publications: Madison, WI, USA, 1982; pp. 539–577. [Google Scholar]
  34. Institute of Soil Sciences; Chinese Academy of Sciences (ISSCAS). Physical and Chemical Analysis Methods of Soils; Shanghai Science Technology Press: Shanghai, China, 1978. (In Chinese) [Google Scholar]
  35. Jiang, L.; He, Z.S.; Liu, J.F.; Xing, C.; Gu, X.G.; Wei, C.S.; Zhu, J.; Wang, X.L. Elevation gradient altered soil C, N, and P stoichiometry of Pinus taiwanensis Fores on Daiyun Mountain. Forests 2019, 10, 1089. [Google Scholar] [CrossRef] [Green Version]
  36. Qin, Y.Y.; Feng, Q.; Holden, N.M.; Cao, J.J. Variation in soil organic carbon by slope aspect in the middle of the Qilian Mountains in the upper Heihe River Basin, China. Catena 2016, 147, 308–314. [Google Scholar] [CrossRef]
  37. Gelsomino, A.; Badalucco, L.; Landi, L.; Cacco, G. Soil carbon, nitrogen and phosphorus dynamics as affected by solarization alone or combined with organic amendment. Northwest Sci. 2006, 279, 307–325. [Google Scholar] [CrossRef]
  38. Marion, G.M.; Black, C.H. Potentially available nitrogen and phosphorus along a chaparral fire cycle Chronosequence. Soil Sci. Soc. Am. J. 1988, 52, 1155–1162. [Google Scholar] [CrossRef]
  39. Zhang, Q.; Yao, B.H.; Wang, C.; Kang, Y.K.; Guo, H.L.; Yang, J.; Yang, Y.B.; Su, J.H. Soil physical and chemical characteristics and microbial proportions in an alpine meadow with different slopes. Acta Ecol. Sin. 2019, 39, 3167–3174, (In Chinese with Abstract in English). [Google Scholar]
  40. Gong, X.; Brueck, H.; Giese, K.M.; Zhang, L.; Sattelmacher, B.; Lin, S. Slope aspect has effects on productivity and species composition of hilly grassland in the Xilin River Basin, Inner Mongolia, China. J. Arid. Environ. 2008, 72, 483–493. [Google Scholar] [CrossRef]
  41. Beullens, J.; Velde, D.V.D.; Nyssen, J. Impact of slope aspect on hydrological rainfall and on the magnitude of rill erosion in Belgium and northern France. Catena 2014, 114, 129–139. [Google Scholar] [CrossRef] [Green Version]
  42. Wilkinson, M.T.; Humphreys, G.S. Slope aspect, slope length and slope inclination controls of shallow soils vegetated by sclerophyllous heath-links to long-term landscape evolution. Geomorphology 2006, 76, 347–362. [Google Scholar] [CrossRef]
  43. Wang, M.M.; Chen, H.S.; Zhang, W.; Wang, K.L. Influencing factors on soil nutrients at different scales in a karst area. Catena 2019, 175, 411–420. [Google Scholar] [CrossRef]
  44. Mariotte, P.; Mehrabi, Z.; Bezemer, T.M.; De Deyn, G.B.; Kulmatiski, A.; Drigo, B.; Veen, G.G.; van der Heijden, M.G.A.; Kardol, P. Plant-soil feedback: Bridging natural and agricultural sciences. Trends Ecol. Evol. 2018, 33, 129–142. [Google Scholar] [CrossRef] [PubMed] [Green Version]
  45. Withers, P.J.A.; Hodgkinson, R.A. The effect of farming practices on phosphorus transfer to a headwater stream in England. Agric. Ecosyst. Environ. 2009, 131, 347–355. [Google Scholar] [CrossRef]
  46. Luo, X.Z.; Hou, E.Q.; Chen, J.Q.; Li, J.; Zhang, L.L.; Zang, X.W.; Wen, D.Z. Dynamics of carbon, nitrogen, and phosphorus stocks and stoichiometry resulting from conversion of primary broadleaf forest to plantation and secondary forest in subtropical China. Catena 2020, 193, 104606. [Google Scholar] [CrossRef]
  47. Hartmann, J.; Moosdorf, N.; Lauerwald, R.; Hinderer, M.; West, A.J. Global chemical weathering and associated P-release—The role of lithology, temperature and soil properties. Chem. Geol. 2014, 363, 145–163. [Google Scholar] [CrossRef]
  48. Bui, E.N.; Henderson, B.L. C: N: P stoichiometry in Australian soils with respect to vegetation and environmental factors. Plant Soil 2013, 373, 553–568. [Google Scholar] [CrossRef]
  49. Geroy, I.J.; Gribb, M.M.; Marshall, H.P.; Chandler, D.G.; Benner, S.G.; McNamara, J.P. Aspect influences on soil water retention and storage. Hydrol. Process. 2011, 25, 3836–3842. [Google Scholar] [CrossRef]
  50. Mohammadi, J.; Motaghian, M.H. Spatial prediction of soil aggregate stability and aggregate-associated organic carbon content at the catchment scale using Geostatistical techniques. Pedosphere 2011, 21, 389–399. [Google Scholar] [CrossRef]
  51. Pulleman, M.M.; Six, J.; Breemen, N.V.; Jongmans, A.G. Soil organic matter distribution and microaggregate characteristics as affected by agricultural management and earthworm activity. Eur. J. Soil Sci. 2005, 56, 453–467. [Google Scholar] [CrossRef] [Green Version]
  52. Yang, S.Y.; Jansen, B.; Absalah, S.; van Hall, R.L.; Kalbitz, K.; Cammeraat, E.L.H. Lithology—And climate-controlled soil aggregate-size distribution and organic carbon stability in the Peruvian Andes. Soil 2020, 6, 1–15. [Google Scholar] [CrossRef] [Green Version]
  53. Wang, M.M.; Chen, H.S.; Zhang, W.; Wang, K.L. Soil nutrients and stoichiometric ratios as affected by land use and lithology at county scale in karst area, southwest China. Sci. Total Environ. 2018, 619–620, 1299–1307. [Google Scholar] [CrossRef]
  54. Zhao, F.; Sun, J.; Ren, C.J.; Kang, D.; Deng, J.; Han, X.H.; Yang, G.H.; Feng, Y.Z.; Ren, G.X. Land use change influences soil C, N, and P stoichiometry under ‘Grain-to-Green Program’ in China. Sci. Rep. 2015, 5, 10195. [Google Scholar]
  55. McGroddy, M.E.; Daufresne, T.; Hedin, L.O. Scaling of C: N: P stoichiometry in forests worldwide: Implications of terrestrial Redfield-type ratios. Ecology 2004, 85, 2390–2401. [Google Scholar] [CrossRef]
  56. Zhang, Z.C.; Hou, G.; Liu, M.; Wei, T.X.; Sun, J. Degradation induces changes in the soil C: N: P stoichiometry of alpine steppe on the Tibetan Plateau. J. Mt. Sci. 2019, 16, 2348–2360. [Google Scholar] [CrossRef]
Figure 1. Location map of sampling sites. SF, secondary forest; PF, plantation forest; GL, grassland.
Forests 12 00144 g001
Figure 2. Soil C (ac), N (df), and P (gi) concentrations affected by slope aspect, land use and soil depth, respectively. Error bars represent standard deviation of means. “**” marked in the middle indicates significant difference between slope aspects. Different lowercase letters denote significant differences among land uses and soil depths, respectively. SF, secondary forest; PF, plantation forest; GL, grassland.
Forests 12 00144 g002
Figure 3. Soil C:N (ac), C:P (df), and N:P (gi) ratios affected by slope aspect, land use and soil depth, respectively. Error bars represent standard deviation of means. “**” marked in the middle indicates significant difference between slope aspects. “ns” represents no significance. Same lowercase letters denote no significant difference among land uses and soil depths, respectively. SF, secondary forest; PF, plantation forest; GL, grassland.
Forests 12 00144 g003
Figure 4. Soil pH (ac) and relative mass distribution of micro-aggregate fractions: 1000−250 μm (df), 250−50 μm (gi), and <50 μm (jl) affected by slope aspect, land use, and soil depth, respectively. Error bars represent standard deviation of means. “**” marked in the middle indicates significant difference between slope aspects. Different lowercase letters denote significant differences among land uses and soil depths, respectively. SF, secondary forest; PF, plantation forest; GL, grassland.
Forests 12 00144 g004
Figure 5. Soil BD (a), porosity (b), sand (c), silt (d), and clay (e) percentages at 0−20 cm soil depth in different land uses on east−facing and west−facing slopes, respectively. Error bars represent standard deviation of means. Different lowercase letters denote significant differences among land uses in a specified slope aspect. SF, secondary forest; PF, plantation forest; GL, grassland.
Forests 12 00144 g005
Figure 6. Relationships between C, N, and P concentrations and stoichiometry on east-facing and west-facing slopes, respectively. (a) C versus N, (b) C versus P, (c) N versus P, (d) C:N versus C:P, (e) C:N versus N:P, and (f) C:P versus N:P.
Forests 12 00144 g006
Table 1. Basic information of the sampling sites.
AspectLand UseElevation (m)Dominant Plants
East-Facing SlopeSF432–548Pinus massoniana (L.), Populus L., Cunninghamia lanceolata (L.) Hook.
PF433–547Zanthoxylum bungeanum Maxim, Conyza canadensis (L.) Cronq, Eleusine indica (L.) Gaertn.
GL435–546Oxalis corniculata (L.), Ophiopogon bodinieri Levl, Miscanthus sinensis Anderss, Rubus coreanus Miq.
West-Facing SlopeSF382–505Cunninghamia lanceolata (L.) Hook, Liquidambar formosana Hance, Populus L.
PF381–503Zanthoxylum bungeanum Maxim, Conyza canadensis (L.) Cronq, Eleusine indica (L.) Gaertn.
GL380–501Oxalis corniculata (L.), Ophiopogon bodinieri Levl, Miscanthus sinensis Anderss, Eleusine indica (L.) Gaertn.
SF, secondary forest; PF, plantation forest; GL, grassland.
Table 2. Interactive effects of aspect and land use on soil bulk density (BD), porosity, sand, silt, and clay percentages.
SourceSoil BDPorositySandSiltClay
Aspect0.0130.0100.2990.7440.335
Land use0.3430.2990.0990.5440.262
Aspect × land use0.6900.6330.6760.8830.583
Bold value indicates significant difference at the 0.05 level.
Table 3. Pearson correlation coefficients between selected soil physicochemical properties and C, N, and P concentrations and stoichiometry.
VariablepH1000–250 μm250–50 μm<50 μmBDPorositySandSiltClay
C−0.2760.663 **−0.480 *−0.573 *−0.913 *0.906 *−0.043−0.1160.151
N−0.3400.550 *−0.514 *−0.430−0.7970.792−0.2460.0020.391
P−0.321−0.3490.3360.2700.425−0.394−0.0020.137−0.093
C:N0.2760.0280.421−0.1990.092−0.0740.734−0.485−0.832 *
C:P−0.0670.642 **−0.642 **−0.485 *−0.7480.7440.144−0.232−0.066
N:P−0.0930.615 **−0.647 **−0.453−0.7430.7390.071−0.1850.018
**. Correlation is significant at the 0.01 level (2-tailed). *. Correlation is significant at the 0.05 level (2-tailed).
Publisher’s Note: MDPI stays neutral with regard to jurisdictional claims in published maps and institutional affiliations.

