REDD+, RFM, Development, and Carbon Markets

Abstract
: Combining responsible forest management (RFM) experiences with literature reviews and stakeholder discussions allows an assessment of the potential role of RFM in reduced emissions from deforestation and forest degradation and conservation, sustainable forest management and enhancement of carbon stocks (REDD+). RFM contributes to greater carbon storage and biodiversity in forest biomass in comparison to conventional logging and deforestation. Using an adjusted von Thünen model to explain land user behavior in relation to different variables, considering a general forest transition curve and looking at a potential relation between governance and deforestation rates, the authors conclude that reduction of deforestation and forest degradation can only be achieved by a combined approach of increasing forest rent relative to other land uses and reducing transaction costs for forest management and conservation. More than providing an additional income for a privileged few, REDD+ will need to address the barriers that have been identified in RFM over the past 30 years of investment in forest management and conservation. Most of these are of an institutional nature, but also culture and social organization as well as locally specific development trends play a significant role in increasing the potential for application of RFM and REDD+.1. Introduction
Some authors discuss whether ‘trees grow on money’ [1], whether monetary income is the main incentive to maintain or grow trees. Distance to input and output markets have been cited as being main determinants for the difference between land use values between otherwise similar sites [2,3]. However, distance to market is not the only factor determining land rent [1], nor is land rent the only factor influencing land use decisions [4,5]. Yet within the UN Framework Convention on Climate Change (UNFCCC) negotiations money is increasingly the focus. That is, attention is increasingly directed towards who should get what part of the potentially large sums of money that developed countries are committing to mitigating climate change through avoiding deforestation, reducing forest degradation and conserving and enhancing forest carbon stocks (REDD+). Money alone, however, is not enough to save all the forests.
In this article, we examine the potential role responsible forest management (RFM) may have in the context of REDD+. We consider RFM to refer to the stewardship and use of forests and forest lands in a way, and at a rate that, with current knowledge and technology, maintains their biodiversity; productivity; regeneration capacity; vitality and their potential to fulfill, now and in the future, relevant ecological, economic and social functions, at local, national, and global levels, and that does not cause damage to other ecosystems (adapted from http://www.un.org/esa/forests/faq.html). Its application includes the various natural forest management regimes, or combinations of such regimes, as classified according to their objectives [6]. In our analysis of the potential role of RFM in reducing deforestation and forest degradation, we use the conceptual approach initially proposed by von Thünen [7] relating land rent to land use decisions. RFM's role may change, according to development stage of a country, but also according to how such development is measured. Using the forest transition curve, we look at how different forms of measuring development may influence the potential for reducing deforestation and forest degradation. Is income the main driver for change? What other factors affect positive or negative changes in forest cover and tree density? Can REDD+ use the lessons learned from previous RFM efforts to become an efficient and effective mechanism that meets the goals of emissions reduction, while addressing biodiversity conservation and increased local well being? Finally, we discuss briefly how well carbon markets could address the issues related to deforestation and forest degradation.
2. Approach Used
This paper is based on experiences of the authors in forest management and conservation implementation, training and applied research. This has been enriched with information from scientific and technical literature and discussions with many other stakeholders involved. A visit by two of the authors to several ejidos (defined in Box 1) in three southern states of Mexico to assess different options for mitigation activities based on the forest resources, including REDD+, contributed to validating several of the ideas set out in this paper. A first version was presented to the Governance, Decentralization and REDD+ workshop, held in Oaxaca towards the end of August 2010. During and after the workshop further comments were received and incorporated into the final version of the paper.
Ejidos are a form of land possession used in Mexico and some other Mesoamerican countries, where the government gives ownership rights to a group of people that allow them to cultivate the land. In Mexico, a large proportion of the forest land falls under this form of ownership.
3. Results and Discussion
3.1. Responsible Forest Management and REDD+
RFM can contribute to achieving the main objectives of REDD+: reduction of emissions, biodiversity conservation and local development. As part of pilot projects in RFM, reduced impact logging (RIL) practices have been implemented in the Latin American tropics for more than 20 years and many studies have shown their potential to reduce impacts on remaining vegetation by up to 50% [8-15]. RIL techniques clear less area for road infrastructure and kill fewer trees in the process of extraction, thus reducing emissions from degradation by approximately 30% compared with conventional logging practices [15]. In Brazil, RIL techniques have been estimated to avoid emissions by up to 25 tCO2eq·ha−1 at harvesting intensities of up to 30 m3·ha−1 [16].
Payment for environmental services (PES) can increase the potential of RFM to achieve positive results. In Costa Rica, RFM with incentives in the form of PES has reportedly improved land owner control over resources after logging, reduced unauthorized entries and harvests, and improved biodiversity protection [17]. In Guatemala, assigning user rights to communities and timber companies through concessions under strict RFM conditions but with strong financial support has been shown to prevent deforestation [18]. A study comparing community forest management areas with nearby protected areas in Guatemala and Mexico concluded that, if functioning according to plan, these two forms of management are equally able to maintain forest cover [19], although protected areas may not bring the same financial benefits to local communities [20].
Furthermore, the process of certification of RFM can contribute to improved local and national participation, and decision-making, processes [21] and may contribute to improving local livelihoods [22]. Under current market and institutional conditions, only a small part of the Amazon region is suitable for financially attractive management for timber production [23]. However, in northern Bolivia, brazil-nut harvesting and drying for export is the main source of income for thousands of families [24]. In the same area, the economic contribution of forest use is about the same as that of agriculture for many communities [25]. In general, for RFM to benefit local livelihoods, many enabling conditions must be in place [22,26-28]: access to markets for a variety of forest products, absence of agricultural policies that increase agricultural land values relative to forest values, tenure security, communities having and applying their own land use regulations, effective law enforcement, access to new and available knowledge, local capacity, and markets that favor forest products from well-managed forests by paying better prices for such products.
Increased efficiency of resource use throughout the processing chain could further enhance the contribution to local livelihoods and emission reductions. In Guatemala, it was found that in sawmills where output volume in planks was 51% of input volume in round wood, only 14% of the carbon removed from the forest through timber harvesting ended up in sawmill products [29]. Sawmill efficiency is well below that figure in many Latin American countries [16]; offering great opportunities to reduce emissions by improving sawmill efficiency.
Thus, the contribution of RFM to emission reductions, local development and biodiversity conservation varies according to local conditions: If supported by PES or certification schemes, RFM can contribute to achieving the main objectives of REDD+; in order for RFM to contribute to improved livelihoods, certain enabling conditions need to be met; and increasing the efficiency of resource use is key for RFM to contribute to REDD+. At the same time, after more than 30 years of continuous efforts to protect and manage tropical forests, less than 5% are well managed [15] and 23% are protected [30]. Assuming that protected areas achieve their objectives (which is not always the case), 72% of forest remains for other uses. Nearly half of that is under community administration [31]; however, given that even in Mexico, where community forests are relatively advanced, less than 10% are well managed, it is safe to say that unsustainable uses threaten a little more than half of the area's tropical forests. In the next section we will discuss the main reasons for this lack of advancement in RFM and forest conservation.
3.2. Land Rent, RFM and REDD+
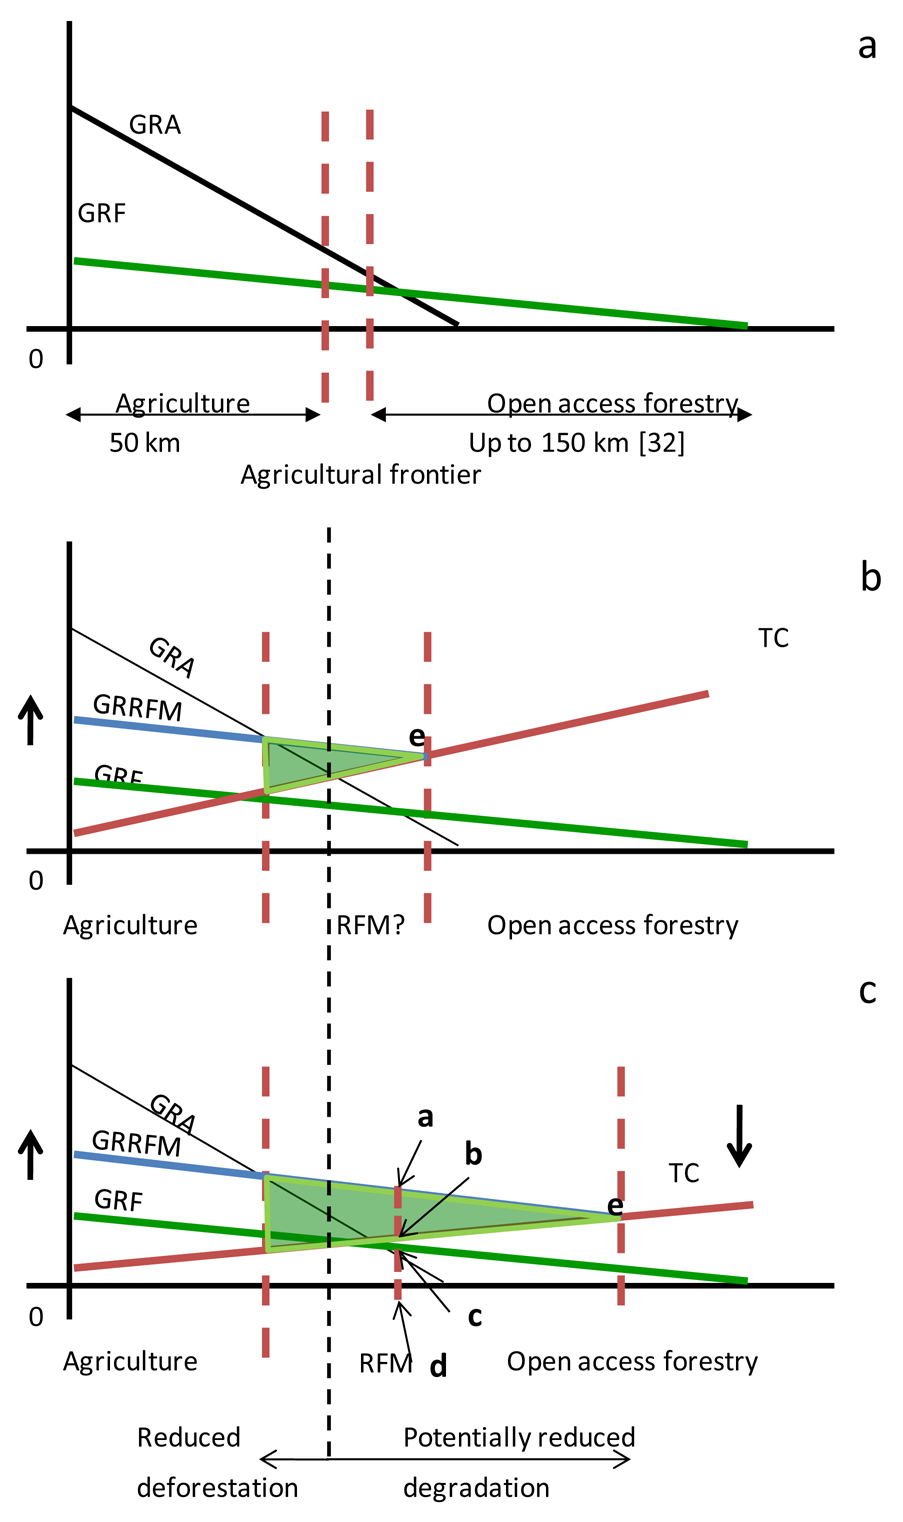
In an analysis of causes of deforestation and forest degradation in the tropics, Angelsen [3] applied the von Thünen model [7] to show the importance of input and output markets and of the prices and policies that affect them. As this model uses the von Thünen assumptions, such as equal suitability of soils, constant and equal discount rates and constant prices, it has only limited use for projecting future deforestation and degradation; however, it helps to explain what effects certain market or policy trends may or may not have on forest land use. Whereas Angelsen [3] includes all costs in the land rent curve, others use the same approach [2,26] adding the transaction costs of forest use (i.e., the costs of ensuring that legal use can be made and that legal rights are respected; costs of training and research) in a separate costs curve, which, as with the land rent curve, depends on the distance to (input) markets. This approach, depicted in Figure 1, demonstrates both the potential economic benefits of land use and the potential extra cost of legal forest use. The transaction cost (TC) curve differs according to land use and scale and intensity of forest management, but for explanatory purposes, we only include a TC-curve that symbolizes the TC for an average forest operation.
In Figure 1, the transaction costs (TC) curve represents the transaction costs for legal, controlled forest use. Wherever the gross rent of forest use (GRF) is higher than the transaction costs and the gross rent of agricultural land use (GRA) is lower, it can be expected that some form of RFM is an economic land use option. This is not the case in Figure 1a, which represents possibly the most common situation in much of the Latin American tropics. Typically, along the main roads are areas where the forest has been converted to agricultural land (mainly pastures), behind which, further from the road, are stretches of land with a dynamic mosaic of agricultural fields with forest patches. Behind these are areas with forest use, both legal and illegal, but without clear measures in place to prevent further forest degradation and possibly deforestation after tree products have been harvested. In the Amazon, for example, 20 years after road building, agricultural land stretched up to 50 km from the highway [32], with a narrow strip (about 6 km [33]) of forest patches; open access forestry then extended as far as another 150 km from the highway [32].
Figure 1b shows how this situation may change if the gross rent of forest management can be increased (GRRFM), for example, by a substantial additional price for products from well-managed forests, or by reduced costs of forest use through increased efficiency and increased social acceptability of the forest operations. Although products from well-managed forests often have to compete on national markets with those of open access forestry and received no additional price for coming from well-managed forests, in some cases costs were reduced while in others monetary benefits were obtained from governmental incentive schemes. The latter was the case, for example, in Costa Rica between 1998 and 2002, although as the transaction costs of the Costa Rican PES scheme were too high for some participants, the option was financially less attractive for them in the short run [17]. Subsidized certification of forest management units had similar results in the Peruvian Amazon [34]. Where differentiation of products, monetary incentives or cost reductions are obtained, the increased gross rent of RFM results in reduced agricultural area (through avoided deforestation, tree planting or restoration of degraded forests), but has little effect on open access forest use.
Figure 1c depicts a situation that combines financial incentives for RFM (through the market or direct subsidies) with lower transaction costs (for example, through subsidized training, subsidized forest inventories or management plans, improved or decentralized administrative processes, improved government control on illegal activities, strengthening of community organization and capacity to negotiate, etc.). In this case, the reduction in transaction costs strengthens the effect of the incentives, resulting in a positive effect both on the forest area and on forest use; although a substantial part of forest use remains uncontrolled. It should be noted here that if the difference between the GRRFM and the TC curves (a – b) is smaller than the distance from GRF to the x-axis (c – d), open access forestry remains financially a more attractive option. This is the case between the lines a – d and point e on Figure 1c and would above all affect the area where reduced degradation could otherwise be achieved.
While normally RFM would not be practiced under those conditions, in Latin America other benefits than higher prices or reduced costs also appear to motivate forest managers to apply RFM. This maybe the case, for example, when the risk and level of punishment for improperly harvested forest products is perceived to be high, when international markets require sourcing of timber from RFM, or when PES is also paid for RFM.
Together, these factors may explain the existence of successful pilot projects but lack of dissemination of good forest management practices, leaving extensive areas for open access forestry. One way to overcome this effect could be through greater control of open access forestry, making its implementation more risky and costly.
Although Angelsen [3] and Louman and Stoian [26] reach a similar conclusion—that forest use largely depends on its competitiveness with other land uses and on distance to market—the different specifications used, lead to different priorities for decreasing deforestation. The first focuses on agricultural producers' perceived benefits from forest conversion [3], suggesting that any policies, measures or changes in markets that reduce land rent for agricultural crops or increase it for forest use, potentially favor forest use (Box 2). The second approach allows us to understand the effect of markets that differentiate products from well-managed forests (represented by the blue GRFM curve in Figure 1b and c): RFM is promoted resulting in a reduction of deforestation without causing increased degradation; whereas a general increase in the value of forest products would increase degradation, represented by an extension of the GRF line to the right, beyond the TC curve (and thus cause additional emissions in that part of the forest). In addition, policies or strategies that help reduce the slope of the transaction cost curve appear to be as important as those that directly decrease agricultural or increase forest land values (Figure 1c), although they probably have a greater effect on reducing degradation than deforestation. Thus, in countries such as Mexico, whose REDD+ Readiness Plan Proposal ( http://www.forestcarbonpartnership.org/fcp/node/74) estimates that degradation is a greater source of emissions than deforestation, REDD+ may be better oriented towards reducing transaction costs for forest use than towards avoiding deforestation and should therefore pay more attention to reducing the TC curve. Their current programs of incentives have proven to be relatively successful, but are expected to become more so if transaction costs were reduced, allowing more communities to access these programs. On the other hand, where deforestation is a greater problem, REDD+ strategies should probably be more directed towards revising agricultural and trade policies that favor agricultural land rent, as suggested by Angelsen [3].
Box 2. Factors that favor agricultural land rent above forest land rent (adapted from [3])
Higher agricultural or livestock product prices
Input subsidies, tax exemptions
Import and export regulations, reducing costs of farm inputs and subsidizing exports
High labor productivity
Few opportunities for off-farm employment (e.g., in services or industrial production)
Migration from city to rural areas
Access to credit for agricultural and livestock production
High interest rates
New technology
Good agricultural site conditions
Differentiated property regime, assigning land rights to “improved” forest lands
Poor law enforcement
High competition for land
Good availability and quality of infrastructure
Examples of how prices and policies have influenced forest conversion in favor of agriculture and livestock abound in Latin America—as do examples of the opposite. In northern Costa Rica, deforestation increased substantially during the 1950s and 1960s, when policies assigned land rights to early settlers in forest cleared areas. This process of rapid deforestation was reversed when beef prices fell in the early 1980s, accompanied by a series of policies directed towards forest protection and reforestation [35] and income from ecotourism. A recent study in northern Costa Rica [36] shows that allocation of agricultural land uses on private lands can still largely be attributed to distance (input and labor) to markets. However, the scattered forest patches throughout the agricultural landscape demand other explanations. PES schemes and legislation that prohibits conversion contribute to the conservation of these forest patches, but in some cases biophysical conditions, history of land use and owners' preferences may be equally important [4].Very few of these patches are being managed for timber production, possibly because of the high transaction costs for this type of land use [37].
3.3. REDD+ and Development
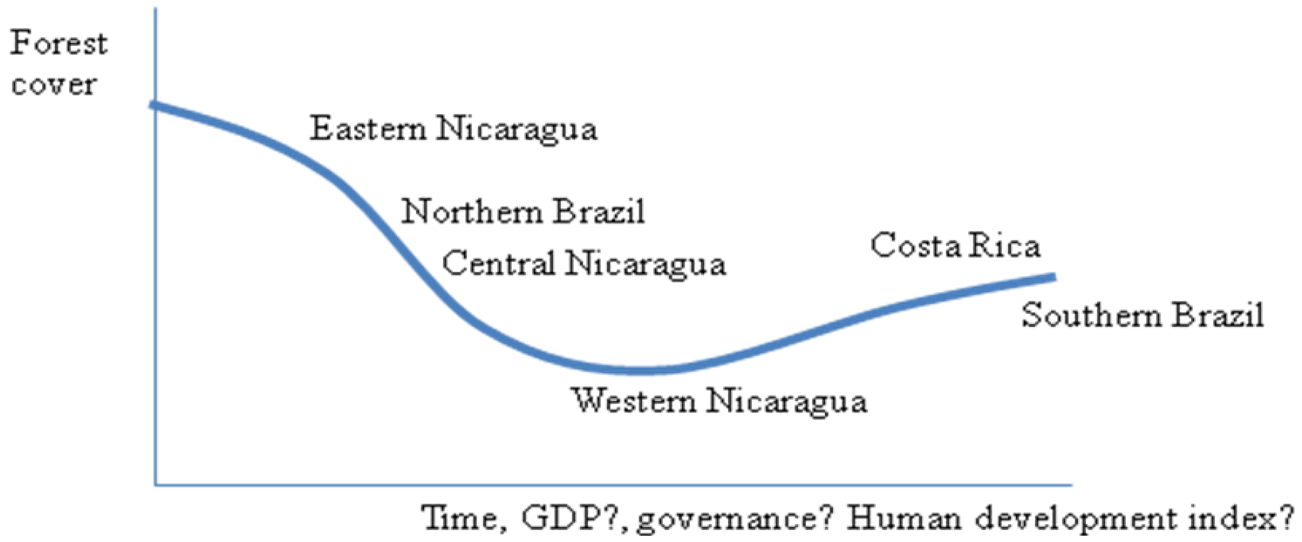
Markets and policies may influence land rent. In addition, the position of a country or region along the forest transition curve (Figure 2) may influence the direction of policies and prices and, therefore, whether land rents rise or fall [3], affecting height and slope of the gross rent curves in Figure 1. The level of development may also influence the height and slope of the TC curve in Figure 1. At the left end of the forest transition curve, access to extensive forest areas prompts forest use and later conversion and private ownership at relatively low costs—a situation that, in Central America, can still be seen in the broad-leafed forests of the eastern coasts of Honduras and Nicaragua, for example. Moving along the curve to the right, access improves; population density increases and government services start to appear. Agricultural land rents rise, forest cover diminishes: the central part of Nicaragua offers a good example of this. Further to the right (and to the west in Nicaragua), land rents start to stabilize, access improves as does local governance (e.g., clearer land rights), reducing the transaction costs to implement forest management, and an agricultural landscape mosaic with forest patches emerges. Such is the case along the Pacific coast of Nicaragua, where this mosaic is enriched by plantations, although very few areas of the original dry tropical forests remain. This may well be an additional reason for recovery: forests become scarce and therefore their value rises [3,27]. A similar gradient can be seen from northern Brazil (Amazon) to the South of Brazil, although further research is needed to confirm in-country application of the forest transition curve. Looking at the northern zone of Costa Rica, for example, we can see that the forest cover is highly dynamic, with priorities moving between plantations, secondary forests and agricultural crops, depending on market and policy pressures, while also strongly influenced by ecological processes. This resembles the cyclic movement within the transition curve discussed by Uriarte et al. [38].
Such complex interactions seem to have determined the history of de- and reforestation in Costa Rica and many other countries [3]. The main question that arises is whether development can be achieved without a reduction in forest cover levels—which fell to 21% in Costa Rica in the 1980s [39]. Does higher forest cover impede development and, if so, can REDD+ reduce the negative impacts of forest cover on development? Or is development necessary to be able to increase forest cover? There is no correct—or even clear—answer to these questions. Different levels of development will exert different pressures on remaining forests. How these are dealt with depends on many factors, including existing and planned livelihood strategies, conflicts or congruence in actors' perceptions of benefits, costs and expectations, risk behavior, mistrust, conservation preference and the support of an institutional framework that integrates economic, social and biophysical factors in their decision-making processes [4,5,38,40,41]. During a recent visit to forest communities in Mexico it appeared that cultural background and level of community organization were also factors affecting forest conservation and management: the indigenous communities in Oaxaca, with a long history of strong organization and implementing territorial planning exercises, managed and conserved large tracks of forest land, without the need of additional incentives. Relatively recent migrants in Chiapas and Mennonite communities in Campeche have little experience in forest management and continue to clear forests for new agricultural fields, while some indigenous groups in Mexico and other countries do not have the strong organizational background that allows them to effectively manage and conserve their forests under market conditions.
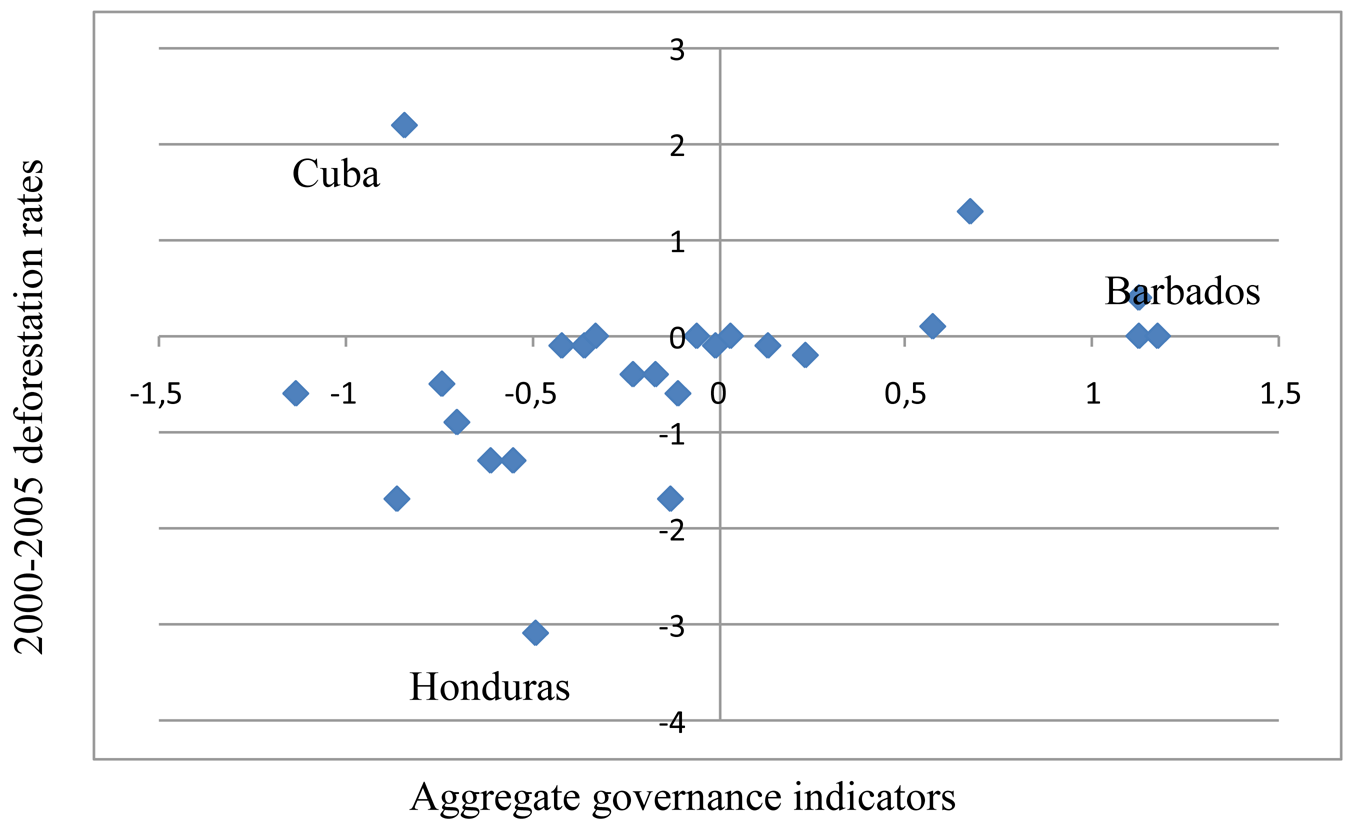
REDD+ mechanisms, therefore, will need to take into account the specific characteristics of the areas and populations where they will be implemented. The position of a country or region along the forest transition curve may be an indication of such local conditions. In analyzing this position and its implications for REDD+ it is important to consider the independent variables used to reflect the ‘development phase’ along the x-axis: time [3,42], gross domestic product per capita [43-45], availability of technical know-how [40], or perhaps something similar to the human development index, which incorporates many (although not all) of the factors that may influence people's willingness to address conservation issues. Several studies [46,47] have studied how governance may influence deforestation rates, coming to a variety of different conclusions. We plotted the Kaufmann–Kraay–Mastruzzi aggregate governance indicators (Figure 3) [48] with rates of deforestation in Latin America [49], suggesting a positive relation, although it is not linear and not consistent across all countries (Figure 3). The lack of consistency of the results of governance–deforestation studies may be due to the indicators used or to changes in their relative importance while a country is progressing along the transition curve. Lopez y Galinato [46] for example used different indicators than Bond et al. [47] or Kaufman et al. [48] and found a negative effect of governance improvement on deforestation in Brazil.
There appears to be an interaction between a number of factors that influence deforestation, and the nature of this interaction varies between countries. Macro-economic measures of development have often been used to explain deforestation [50-51] but have given ambiguous results at best [52], possibly due to the varying nature of the interactions in the case studies compared. Economic growth, for example, has been attributed to explain 100% of deforestation in Malaysia and 98% in Indonesia [46], while the same authors found that in Brazil it only explains 15%, indicating that in Brazil other factors also play an important role in motivating deforestation. These may include factors such as the importance of off-farm employment, as well as the level of availability of land suitable for agriculture, agricultural prices, road density and the level of local wages [46,47,52-54]. To improve understanding of people's and governments' motivations for forest conservation, it is necessary to examine more local scales and perceptions of development. Therefore, the logic of the forest transition curve, plotting forest area against time as originally proposed by Mather [42], is fine to describe what has happened in a country or region, but more detailed studies need to confirm what drivers brought the changes observed over time, in order to be able to reduce deforestation and forest degradation in the future and project the path and speed of change along the curve. For some countries, substituting GDP for time allows plotting forest cover against main driver(s), but for others, a more complex index needs to be used, reflecting locally important drivers, both for deforestation and for restoration of the forest cover.
Drivers for deforestation and restoration differ even within a country. In Mexico, for example, biophysical conditions and land use objectives vary, which may not only mean that different regions are on different parts of the transition curve, but they may also have different curves. Current forest conservation and restoration strategies recognize such differences and stimulate a range of conservation efforts, from plantations for commercial reasons to forest conservation for hydrological services or biodiversity. While incentives are mainly financial, objectives are not all the same and it is unlikely that strategies would have had the same impact if, instead of timber, water, or biodiversity conservation, only the service of carbon sequestration would have been stimulated. REDD+ mechanisms could build on these experiences as long as international financial support is tied to compensating efforts rather than on the purchase of carbon to be used to mitigate the buyer's own emissions. In the first case, Mexico could continue to finance conservation for different reasons, at the same time showing that this results in emission reductions, receiving compensation for their efforts up to an amount related to the measurable emission reduction. In the latter case, Mexico would have to pass carbon-rights on to the buyer, thus being obliged to buy these from the current owners and thus focusing incentives schemes on carbon rather than on other potential benefits of the forests.
3.4. Useful Lessons from RFM for REDD+
To succeed in improving RFM, reducing illegal logging and avoiding deforestation, and thus to achieve the ultimate objective of long-term emission reductions, the design and implementation of REDD+ policies, strategies and activities must build on and learn from previous efforts—which of course depends as much on the policy making and implementation agencies' willingness to learn from the lessons.
In Section 3.1 we argue that RFM has the potential to contribute to the objectives of REDD+, while in Section 3.2 we show that this contribution may be limited due to relatively low land rent of RFM and high transaction costs. This situation may differ according to position of the country or area on the forest transition curve (Section 3.3), with RFM being more likely to occur under conditions that allow its value to increase or its transaction costs to decrease. Perhaps the most important takeaway lesson concerns this difficulty in increasing the forest value and reducing transaction costs and thus spreading examples of good forest management to all relevant actors and tropical forest regions. Therefore, it is necessary to ask how REDD+ strategies will differ from previous RFM and protection strategies and enable widespread implementation of RFM and other emission reduction activities. Louman and Stoian [26] argue that community forest management, combined with stakeholder platform with political relevance, simplified rules, secure land and forest use tenure, and assistance in monitoring and control, business administration and commercialization, is likely to contribute to reducing the transaction costs of RFM (the TC curve in Figure 1), whereas PES, higher prices for certified timber, responsible purchasing policies of government and reduced subsidies to the agricultural sector are likely to contribute to increasing the forest use value (GRRFM in Figure 1) relative to its competing land uses. This combination thus leads to forest conservation and avoided deforestation, particularly in marginal areas.
3.5. REDD+ and Carbon Markets
We now examine briefly the potential contribution of carbon markets, considering both the von Thünen model and the position of a country on the forest transition curve. We do not discuss the capacity of such markets to absorb all the future carbon credits that REDD+ and similar projects may offer.
In the von Thünen model (Figure 1), income from carbon markets could raise the land rent value of forests or agroforestry projects, increasing their attractiveness if the land rent value of agricultural activities is relatively low. This could occur in countries or regions either to the far right of the forest transition curve, or entering the upward slope on the right-hand side [3]. At the same time, in the von Thünen model explicitly showing the TC curve, transaction costs for such projects may push the curve up, although this upward slope may revert to a downward slope due to easier carbon accounting in closed forests than in forest mosaic areas and the agricultural frontier area. Economy of scale is important in transaction costs, because it is easier to prepare carbon sale proposals for large little-disturbed forest areas than for small forest patches. It is of no surprise that most of the proposed REDD+ projects in the Amazon area are well beyond the agricultural frontier, away from immediate deforestation threats. However, it is unlikely that income from carbon markets will be directed towards changes that may lower the TC curve, such as improved administrative procedures or more effective control over forest activities.
Returning to von Thünen, the question arises of how many REDD+ projects would truly fall within the central area of the graph of Figure 1, the agricultural frontier, where, in the absence of REDD+, most deforestation is likely to occur and thus the greatest additionality can be achieved. An examination of some cases in Mexico and Honduras, for example, reveals greatest deforestation in areas where governmental forestry and environmental agencies have least access due to social conflicts and no REDD+ activities are being planned. To avoid deforestation in these areas, it is necessary to consider both the size of payments required to ensure that REDD+ becomes an attractive land use option [23] and the identity of the actors for whom it should become an attractive land use option: our ongoing studies in Costa Rica suggest that in some areas, a change in land use pattern towards more conservative land uses follows changes in ownership of the land.
4. Conclusions
RFM contributes to greater carbon storage and biodiversity in forest biomass in comparison to conventional logging and deforestation. Unfortunately, RFM is only practiced in relatively few cases. Unless RFM becomes more competitive to non-forest land users, either by policies and market strategies that directly raise net income, or by reducing the usually high transaction costs of RFM, it is unlikely that this will change in the future. REDD+ mechanisms and RFM may strengthen each other in that sense. To do so, REDD+ will need to draw on lessons learned from RFM and forest conservation. More than providing an additional income for a privileged few, REDD+ will need to address the barriers that have been identified in RFM. Most of these are of an institutional nature, but also culture and social organization play a significant role in increasing the potential for application of RFM and REDD+. Analysis of future deforestation and forest degradation trends, therefore, will need to explicitly consider these other factors. While deforestation, for example, may be better addressed through agricultural policies, markets and territorial planning, degradation is probably more affected by improving forest governance and lowering the transaction costs of RFM. In addition, these models need to consider locally specific development trends as depicted in the forest transition curve, considering governance as an important indicator of development, although its relation to deforestation may differ per country. Whether the extra costs of preparing countries to implement sustainable REDD+ can be covered by market mechanisms or the currently committed readiness funds still remains to be seen.


Acknowledgments
This paper is the result of discussions with many people involved in issues related to deforestation and forest degradation; too many to mention them all, but we would like to specifically acknowledge Guillermo Navarro and Jorge Rodriquez of CATIE, Salvador Anta of CONAFOR, and German Obando of FUNDECOR who contributed with specific ideas and suggestions to the development of this paper. IFAD and CONAFOR made it possible for us to assess some of the more advanced forest based mitigation programs in tropical regions of Mexico. We also thank CIFOR, the Cooperación Internacional and CONAFOR for creating the opportunity to discuss the paper with a wide range of REDD+ stakeholders during the Oaxaca workshop in August 2010. Last but not least, we thank our reviewers for their useful comments that helped to improve the paper. The content of this paper is, however, the full responsibility of the authors.
References and Notes
- Kanninen, M.; Murdiyarso, D.; Seymour, F.; Angelsen, A.; Wunder, S.; German, L. Do Trees Grow on Money? Forest perspectives 4; CIFOR: Bogor, Indonesia, 2007; p. 61. [Google Scholar]
- Hyde, W.; Amacher, G.; Magrath, W. Deforestation and forest land use: Theory evidence and policy implications. World Bank Res. Observ. 1996, 11, 223–248. [Google Scholar]
- Angelsen, A. Forest Cover Change in Space and Time: Combining the von Thünen and Forest Transition Theories; World Bank Policy Research Working Paper 4117; The World Bank: Washington, DC, USA, 2007; p. 43. [Google Scholar]
- Morse, W.C.; Schedlbauer, J.L.; Sesnie, S.E.; Finegan, B.; Harvey, C.A.; Hollenhorst, S.J.; Kavanagh, K.L.; Stoian, D.; Wulfhorst, J.D. Consequences of environmental service payments for forest retention and recruitment in a Costa Rican Biological Corridor. Ecol. Soc. 2009, 14, p. 23. Available online: http://www.ecologyandsociety.org/vol14/iss1/art23/ (accessed on 20th July 2010). [Google Scholar]
- Wünscher, T. Spatial Targeting of Payments for Environmental Services in Costa Rica: A Site Selection Tool for Increasing Conservation Benefits. Ph.D Thesis, Rheinischen Friedrich Wilhelm Universität, Bonn, Germany, 2008; p. 155. [Google Scholar]
- Innes, J.; Joyce, L.A.; Kellomäki, S.; Louman, B.; Ogden, A.; Parrotta, J.; Thompson, I.; Ayres, M.; Ong, C.; Santoso, H.; Sohngen, B.; Wreford, A. Management for adaptation. In Adaptation of Forests and People to Climate Change. A Global Assessment Report; IUFRO World Series 22; Seppala, R., Buck, A., Katila, P., Eds.; IUFRO: Helsinki, Finland, 2009; pp. 135–185. [Google Scholar]
- Von Thünen, J.H. Der isolierte Staat in Beziehung auf Landwirtschaft und Nationalökonomie. Erster Teil. Zweite vermehrte und verbesserte Auflage: Untersuchungen über den Einfluss, den die Getreidepreise, der Reichtum des Bodens und die Abgaben auf den Ackerbau ausüben; Jena G. Fischer: Rostock, Germany, 1842; (1910 reprint); p. 678. [Google Scholar]
- Uhl, C.; Vieira, I.C.G. Ecological impacts of selective logging in the Brazilian Amazon: A case study from the Paragominas region of the State of Para. Biotropica 1989, 21, 98–106. [Google Scholar]
- Hendrison, J. Damaged Controlled Logging in Managed Tropical Rain Forests in Suriname; Wageningen Agricultural University: Wageningen, The Netherlands, 1990; p. 204. [Google Scholar]
- Johns, J.; Barreto, P.; Uhl, C. Logging damage in planned and unplanned logging operations and its implications for sustainable timber production in the Eastern Amazon. Forest Ecol. Manage. 1996, 89, 59–77. [Google Scholar]
- Ter Steege, H.; Boot, R.G.A.; Brouwer, L.C.; Caesar, J.C.; Ek, R.C.; Hammond, D.S.; Haripersaud, P.P.; van der Hout, P.; Jetten, V.G.; van Kekem, A.J.; et al. Ecology and Logging in a Tropical Rain Forest in Guyana. With Recommendations for Forest Management; Tropenbos Series 14; The Tropenbos Foundation: Wageningen The Netherlands, 1996; p. 123. [Google Scholar]
- Environmentally Sound Forest Harvesting. Testing the Applicability of the FAO Model Code in the Amazon of Brazil, Forest Harvesting Case Study; FAO: Rome, Italy, 1997; p. 78.
- Smith, J.; Applegate, G. Could payments for forest carbon contribute to improved tropical forest management? Forest Policy Econ. 2004, 6, 153–167. [Google Scholar]
- Community Forest Management as a Carbon Mitigation Option; Skutsch, M., Murdiyarso, D., Eds.; CIFOR: Bogor, Indonesia, 2006; p. 125.
- Putz, F.E.; Zuidema, P.A.; Pinard, M.A.; Boot, R.S.A.; Sayer, J.A.; Sheil, D.; Sist, P.; Elias Vanclay, J.K. Improved tropical forest management for carbon retention. PLoS Biol. 2008, 6, e166. [Google Scholar]
- Keller, M.K.; Asner, G.P.; Silva, N.; Palace, M. Sustainability of selective logging of upland forests in the Brazilian Amazon: Carbon budgets and remote sensing as tools for evaluation of logging effects. In Working Forests in the Neotropics; Zarin, D.J., Alavalapati, J.R.R., Putz, F.E., Schmink, M., Eds.; Columbia University Press: New York, NY, USA, 2004; pp. 41–63. [Google Scholar]
- Louman, B.; Garay, M.; Yalle, S.; Campos, J.J.; Locatelli, B.; Villalobos, R.; López, G.; Carrera, F. Efectos del pago por servicios ambientales y la certificación forestal en el desempeno ambiental y socioeconómico del manejo de bosques naturales en Costa Rica; Colección Manejo Diversificado de Bosques Naturales, Publicación no. 30; Serie Técnica, Informe Técnico No. 338; CATIE: Turrialba, Costa Rica, 2005; p. 31. [Google Scholar]
- Carrera, F.; Prins, K. Desarrollo de la política en Concesiones Forestales Comunicaciones en Petén, Guatemala: el aporte de la investigación y experiencia sistematizada del CATIE. Revista Forestal Centroamericana 2002, 37, 33–40. [Google Scholar]
- Bray, D.B.; Duran, E.; Ramos, V.H.; Mas, J.-F.; Velazquez, A.; McNab, R.B.; Barry, D.; Radachowsky, J. Tropical deforestation, community forests, and protected areas in the Maya forest. Ecol. Soc. 2008, 13, p. 56. Available online: http://www.ecologyandsociety.org/vol13/iss2/art56/ (accessed on 19th October 2010). [Google Scholar]
- West, P.; Igoe, J.; Brockington, D. Parks and peoples: The social impact of protected areas. Annu. Rev. Anthropol. 2006, 35, 251–277. [Google Scholar]
- Louman, B.; Campos, J.J.; Schmidt, S.; Zagt, R.; Haripersaud, P. Los procesos nacionales de certificación forestal y su relación con la investigación forestal. Interacciones entre políticas y manejo forestal, casos de Costa Rica y Guyana. Revista Forestal Centroamericana 2002, 37, 41–46. [Google Scholar]
- Smith, J.; Scherr, S.J. Capturing the value of forest carbon for local livelihoods. World Dev. 2003, 31, 2143–2160. [Google Scholar]
- Nepstad, D.; Soares-Filho, B.; Merry, F.; Moutinho, P.; Oliveira Rodrigues, H.; Bowman, M.; Schwartzman, S.; Almeida, O.; Rivero, S. The Costs and Benefits of Reducing Carbon Emissions from Deforestation and Forest Degradation in the Brazilian Amazon; The Woods Hole Research Centre: Falmouth, MA, USA, 2007; p. 26. [Google Scholar]
- Stoian, D. Cosechando lo que cae: la economía de la castana (Bertholletia excelsa H.B.K.) en la Amazonía boliviana. In Productos forestales, medios de subsistencia y conservación. Estudios de caso sobre sistemas de manejo de productos forestales no maderables; Alexiades, M.N., Shanley, P., Eds.; CIFOR: Bogor, Indonesia, 2004; Volume 3, pp. 89–116. [Google Scholar]
- Munoz, A. Ingresos económicos del bosque para indígenas son casi iguales a los de la agricultura. In Hoja de comunicación proyecto Bolfor II; BOLFOR: Santa Cruz de la Sierra, Bolivia, 2007. [Google Scholar]
- Louman, B.; Stoian, D. Manejo forestal sostenible en América Latina: Económicamente viable o utopía. Revista Forestal Centroamericana 2002, 39-40, 25–32. [Google Scholar]
- Sabogal, C.; Lentini, M.; Pokorny, B.; Silva, J.N.M.; Zweede, J.; Veríssimo, A.; Boscolo, M. Manejo florestal empresarial na Amazônia brasileira. Restrições e oportunidades. Relatório síntese; IMAZON: Belén, Brazil, 2006; p. 70. [Google Scholar]
- Smith, J.; Colan, V.; Sabogal, C.; Snook, L. Why policy reforms fail to improve logging practices: The role of governance and norms in Peru. Forest Policy Econ. 2006, 8, 458–469. [Google Scholar]
- Bamaca, E.; Kanninen, M.; Louman, B.; Pedroni, L.; Gomez, M.X. Dinámica del carbono en los residuos forestales producidos durante el aprovechamiento y el aserrío en la Reserva de Biosfera ‘Maya’, Petén, Guatemala. Recursos Naturales y Ambiente 2006, 41, 102–110. [Google Scholar]
- Chape, S.; Blyth, S.; Fish, L.; Fox, P.; Spalding, M. (Compiler) 2003 United Nations List of Protected Areas; UNEP-WCMC, WCPA, IUCN: Gland, Switzerland; Cambridge, UK, 1991; p. 44. Available online: http://www.unep-wcmc.org/wdpa/unlist/2003_UN_LIST.pdf (accessed on 21 July 2010).
- Sunderlin, W.D.; Hatcher, J.; Liddle, M. From Exclusion to Ownership? Challenges and Opportunities in Advancing Forest Tenure Reform; The Rightsand Resources Initiative: Washington, DC, USA, 2008; p. 54. [Google Scholar]
- Brandao, A.O., Jr.; Moreira Souza, C., Jr.; Ferreira Ribeiro, J.G.; Ribeiro Sales, M.H. Desmatamento e estradas não-oficiais da Amazõnia. INPE: Florianópolis, Brazil, 21–26 April 2007; pp. 2357–2364. Available online: http://marte.dpi.inpe.br/col/dpi.inpe.br/sbsr@80/2006/11.15.19.47/doc/2357-2364.pdf (accessed on 23 July 2010. [Google Scholar]
- Chomitz, K.M. At Loggerheads? Agricultural Expansion, Poverty Reduction, and Environment in the Tropical Forests; A World Bank Policy Research Report; The International Bank for Reconstruction and Development The World Bank: Washington, DC, USA, 2007; p. 284. [Google Scholar]
- Arce, J. Avances hacia un manejo forestal sostenible en concesiones con fines maderables: estudio de caso en el departamento de Ucayali, Amazonía Peruana. M.Sc. Thesis, CATIE, Turrialba, Costa Rica, 2006; p. 154. [Google Scholar]
- De Camino, R.; Segura, O.; Arias, L.G.; Pérez, I. Costa Rica Forest Strategy and the Evolution of Land Use Evaluation Country Case Study Series; The World Bank: Washington, DC, USA, 2000; p. 156. [Google Scholar]
- Pitacuar Meneses, M.L. Análisis económico para entender la forma en que se asignan los bosques y otros usos de la tierra en el Corredor Biológico San Juan La selva, Costa Rica. M.Sc. Thesis, CATIE, Turrialba, Costa Rica, 2010; p. 109. [Google Scholar]
- Navarro, G.; Bermúdez, G. Análisis económico del impacto de las restricciones técnicas y legales sobre la rentabilidad del manejo de bosques naturales y su competitividad respeto a otros usos de la tierra en Costa Rica; SINAC-FAO-TCP/COS/3003 (segundo informe): San José, Costa Rica, 2006; p. 57. [Google Scholar]
- Uriarte, M.; Schneider, L.; Rudel, T.K. Land transitions in the tropics. Biotropica 2010, 42, 59–62. [Google Scholar]
- Kleinn, C.; Corrales, L.; Morales, D. Forest area in Costa Rica: A comparative study of tropical forest cover estimates over time. Environ. Monit. Assess. 2002, 73, 17–40. [Google Scholar]
- De Jong, W. Forest rehabilitation and its implications for forest transition theory. Biotropica 2010, 42, 3–9. [Google Scholar]
- Culas, R.J. Deforestation and the environmental Kuznets curve: An institutional perspective. Ecol. Econ. 2007, 61, 429–437. [Google Scholar]
- Mather, A.S. The forest transition. Area 1992, 24, 367–379. [Google Scholar]
- Cropper, M.; Griffiths, C. The interaction of population growth and environmental quality. Am. Econ. Rev. 1994, 84, 250–254. [Google Scholar]
- Rudel, T. Is there a forest transition? Deforestation, reforestation and development. Rural Soc. 1998, 63, 533–552. [Google Scholar]
- Rudel, T.K.; Coomes, O.; Moran, E.; Achard, F.; Angelesen, A.; Xu, J.C.; Lambin, E.F. The forestry transition: Towards a global understanding of land cover change. Glob. Environ. Change 2005, 15, 23–31. [Google Scholar]
- Lopez, R.; Galinato, G.I. Deforestation and forest-induced carbon dioxide emissions in tropical countries: How do governance and trade openness affect the forest-income relationship? J. Environ. Dev. 2005, 14, 73. [Google Scholar]
- Bond, I.; Grieg-Gran, M.; Wertz-Kanounnikoff, S.; Hazlewood, P.; Wunder, S.; Angelsen, A. Incentives to sustain forest ecosystem services. A review and lessons for REDD. In Natural Resource Issues; IIED: London, UK; CIFOR: Bogor, Indonesia; World Resources Institute: Washington, DC, USA, 2009; p. 47. [Google Scholar]
- Kaufmann, D.; Kraay, A.; Mastruzzi, M. Governance Matters VII: Aggregate and Individual Governance Indicators 1996–2007; World Bank Policy Research Working Paper 4654. The World Bank: Washington, DC, USA, 2008; p. 102. Available online: http://papers.ssrn.com/sol3/papers.cfm?abstract_id=1148386 (accessed on 19 October 2010).
- State of the World's Forests 2007; FAO: Rome, Italy, 2007; p. 144.
- Kaimowitz, D.; Angelsen, A. Economic Models of Tropical Deforestation. A Review; CIFOR: Bogor, Indonesia, 1998; p. 139. [Google Scholar]
- Geist, H.J.; Lambin, E.F. What Drives Tropical Deforestation? LUCC report Series no 4; Ciaco: Louvain-la-Nueve, Belgium, 2001; p. 116. [Google Scholar]
- Angelsen, A.; Kaimowitz, D. Rethinking the causes of deforestation: Lessons from economic models. World Bank Res.Observ. 1999, 14, 73–98. [Google Scholar]
- Kaimowitz, D. The prospects for reduced emissions from deforestation and degradation (REDD) in Mesoamerica. Int. Forest. Rev. 2008, 10, 485–495. [Google Scholar]
- Kirby, K.R.; Laurance, W.F.; Albernaz, A.K.; Schroth, G.; Fearnside, P.M.; Bergen, S.; Venticinque, E.M.; Da Costa, C. The future of deforestation in the Brazilian Amazon. Futures 2006, 38, 432–453. [Google Scholar]
© 2011 by the authors; licensee MDPI, Basel, Switzerland. This article is an open access article distributed under the terms and conditions of the Creative Commons Attribution license (http://creativecommons.org/licenses/by/3.0/).
Share and Cite
Louman, B.; Cifuentes, M.; Chacón, M. REDD+, RFM, Development, and Carbon Markets. Forests 2011, 2, 357-372. https://doi.org/10.3390/f2010357
Louman B, Cifuentes M, Chacón M. REDD+, RFM, Development, and Carbon Markets. Forests. 2011; 2(1):357-372. https://doi.org/10.3390/f2010357
Chicago/Turabian StyleLouman, Bastiaan, Miguel Cifuentes, and Mario Chacón. 2011. "REDD+, RFM, Development, and Carbon Markets" Forests 2, no. 1: 357-372. https://doi.org/10.3390/f2010357