Simulation of the Effect of Intensive Forest Management on Forest Production in Sweden

Abstract
: The effects of intensifying the management of 15% of the Swedish forest land on potential future forest production over a 100-year period were investigated in a simulation study. The intensive management treatments, which were introduced over a period of 50 years, were: intensive fertilization of Norway spruce (IntFert); bulking-up Norway spruce elite populations using somatic embryogenesis (SE-seedlings); planting of lodgepole pine, hybrid larch, and Sitka spruce (Contorta, Larch, and Sitka); fertilization with wood ash on peatlands (Wood ash); and conventional fertilization in mature forests (ConFert). Potential sites for applying intensive forest management (IFM) to sites with low nature conservation values were determined with a nature conservation score (NCS). Four different scenarios were simulated: “Base scenario”, which aimed at reducing the negative impact on nature conservation values, “Fast implementation”, “No IntFert” (IntFert was not used), and “Large Forest Companies”, where the majority of plots were selected on company land. Total yields during the 100-year simulation period were about 85–92% higher for the intensive forest management scenarios than for the reference scenario (business as usual). In the “No IntFert” scenario total production was 1.8% lower and in the “Large Forest Companies” scenario total production was 4.8% lower than in the “Base scenario”. “Fast implementation” of IFM increased yield by 15% compared to the “Base scenario”. Norway spruce SE-seedlings and IntFert gave the highest yields, measured as total production during the 100-year simulation period, but relative to the yields in the reference scenario, the highest increases in yield were for Contorta. The “Base scenario” and “No IntFert” gave the highest yields for plots with the lowest NCS, but plots with higher NCS had to be used in the “Fast implementation” and “Large Forest Companies” scenarios. More than half of the effect on future growth of IFM methods was because of increased intensity in the regenerations. It took a relatively long time (40–60 years) for the simulated IFM treatments to result in a significant increase in stem volume production.1. Introduction
Numerous experiments and observations spanning centuries have shown that both silvicultural methods and the choice of tree species can significantly affect forest yield and profitability [1]. Early examples include experiments with new tree species during the 18th century [2], seed transfer trials to identify better adapted and faster growing alternatives to local provenances, and observations of the effects of various forest management practices, such as drainage and fertilization with wood ash [2]. Classical Swedish forest management methods intended to increase forest yield include: (i) the introduction of exotic, fast-growing tree species; (ii) forest fertilization; (iii) drainage of peatlands; and (iv) tree breeding. Larch (Larix spp.) and silver fir (Abies alba Mill.) were introduced early to southern Sweden, but the most widely introduced species was lodgepole pine (Pinus contorta var latifolia Dougl). Forest companies in central and northern Sweden started to plant lodgepole pine on a large scale in the mid-1960s. Until today 600,000 hectares have been regenerated with this species, which is beginning to contribute significantly to the harvests in these parts of the country [3]. Forest fertilization started in the late 1960s, prompted by investigations of the links between nutrition, production, physiology, and ecology in boreal forests [4,5]. Forest fertilization was extensively applied during the 1970s, when more than 200,000 hectares were fertilized annually, but has decreased since then [6]. Drainage was a major activity during the depression in the 1930s, when ditches extending to more than 10,000 km were dug annually to increase the yield of peatlands with existing tree cover or to afforest open peatlands. Thereafter, little drainage was done until the 1980s, when a similar intensity of drainage was used annually [7]. Tree breeding dates back to the 1930s and seed orchards have yielded genetically superior seed material since the 1970s. At present, 80% of the pine seedlings and 50% of the spruce seedlings used in Sweden are genetically improved.
The cited studies, and countless others spanning several centuries, have clearly shown that the production capacity of a site is not constant over time but can be changed by management. The growing crop can be managed to utilize given natural resources more efficiently, but resource availability can also be managed [8-10]. In addition, site productivity may be affected by climatic changes and other large-scale processes such as nitrogen deposition [11].
During the 1990s forest growth was not a major topic of concern in debates about the future in forestry in Sweden. However, in recent years increasing forest growth has again become a concern, mainly due to greater demands for raw material to supply the forest industry, but also partly due to expected increases in the demand for wood for bioenergy. In 2003, the annual cut in Swedish forests reached a level considered close to the sustainable maximum, resulting in a discussion about how to increase future growth and logging opportunities in Swedish forests.
Since then several reports have been published on the effects of increased management intensity on the growth and potential harvest levels of forests in Sweden. The effects of increasing the intensity of conventional forest management methods to enhance forest growth were analyzed, using the Hugin system, by Rosvall et al. [12,13]. The Hugin system is a computerized forest simulation system using National Forest Inventory (NFI) data with assigned utilization and management schemes defined in the scenarios [14]. At a national level, taking into account both legal and economic constraints, they estimated that a 15% increase in growth in the second half of the current century was feasible: 3% from reaching legally approved regeneration targets; 8% and 2% from planting genetically improved seedlings and lodgepole pine, respectively; and 2% from conventional forest fertilization. Treatments to reduce damages to forest stands and regeneration areas could also significantly enhance forest growth. In economic analyses for Holmen Skog AB, Rosvall et al. [15,16] showed that methods such as planting genetically improved seedlings and lodgepole pine were highly profitable without major financial investments. In comparison, other profitable methods such as forest fertilization and forest drainage, incurred high investment costs and would be given less priority under budgetary restrictions.
By extending the simulations to include all possible methods of improving the forest growth, the maximum potential stem volume growth increase in 50 years was estimated to be about 40% on forest land, and a further 5% on abandoned agricultural land [17]. The possible growth increase was reduced to a level called realistic by considering profitability and environmental consequences and that many landowners may have other objectives for their management. The realistic forest growth increases were estimated to be about 20%; 17% from the application of traditional methods (e.g., improved regeneration techniques, conventional forest fertilization, and planting of genetically improved seedlings and lodgepole pine) and only 3% from more radical methods, such as clonal forestry, improved drainage, fertilization of peatlands, repeated fertilization starting in young forests, and afforestation of agricultural land. An important finding was that forest management methods affecting large areas will have a greater influence on Swedish forest production, even if they have limited effects per hectare, than methods that may result in large increases per hectare, but are restricted to a minor part of the total forest area.
Eriksson et al. [18] analyzed the economic effects of forest management methods intended to improve yields, and concluded that intensive fertilization of young Norway spruce stands was not profitable because of the large investments required early in the rotation. The National Board of Forestry presented simulations of future production and harvest levels in Swedish forests under four scenarios during the period between 2010–2110 (SKA-VB 08) [19]. The scenarios were dubbed business as usual (reference scenario), environmental conservation, improved yield, and improved yield combined with environmental conservation. Potential growth at the end of the simulation period in the scenarios varied between 141–186 million m3 year−1. The reference scenario was estimated to have a potential growth of 168 million m3 year−1 while potential growth in the improved yield scenario was estimated to 186 million m3 year−1. The effects of future climate changes on forest production were also considered in the SKA-VB 08 study, and were estimated to increase forest production in the reference scenario by 32%.
In the present study, the effects on potential future forest production of intensifying the management on 15% of the Swedish forest land were investigated during a 100-year period. Intensive forest management (IFM) has been studied and discussed in Atlantic Europe [20], Canada [21-24] and the US [25], but to our knowledge, no study from Sweden has previously been presented in an international journal. The aims of this study were to (i) determine the effects of IFM methods on possible future increases in forest growth (with and without limiting intensive management to sites with low nature conservation values), (ii) assess the time-lag between intensifying forest management and increases in forest yield, and (iii) evaluate the effect of intensified forest production on nature conservation values.
2. Material and Methods
The data used for this study were the same as those used in the yield and harvest simulations in the SKA-VB 08 study and were taken from the National Forest Inventory (NFI) [19]. The database originally consisted of measurements from more than 31,000 plots, representing the total forest land in Sweden, between the years 2002–2006. The same plots were used for the whole 100-year simulation period, so effects of possible reductions in forest land area because of changes in land-use were not accounted for. For each plot, general information such as owner category and location, site properties, and data about the tree layer were available. At the start of the simulation, about 23 million hectares of forest land were available for forest production (Table 1). The forests were dominated by Norway spruce (Picea abies (L.) Karst.) and Scots pine (Pinus sylvestris L.) with Norway spruce dominating in the south and Scots pine in the north of Sweden. Lodgepole pine was mainly present in northern Sweden. Broadleaves covered about 20% of the forest land and the proportion of broadleaves did not differ significantly between the different parts of Sweden. Total growth was about 114 million m3 and about 80% of the growth was harvested. The proportion of harvest in relation to growth was higher in the southern (82.6%) than northern part of Sweden (75.7%; Table 1).
The simulations generated in this study were compared to the reference scenario in SKA-VB 08, which describes the development of the forest land in Sweden under the assumption that forest management will remain as it is today. In addition, the effects of climate change were simulated by a gradual increase of the growth. The effects of climate change were estimated by Bergh et al. [26]. These effects were expressed as period, tree-species, and regionally specific climate change coefficients [26].
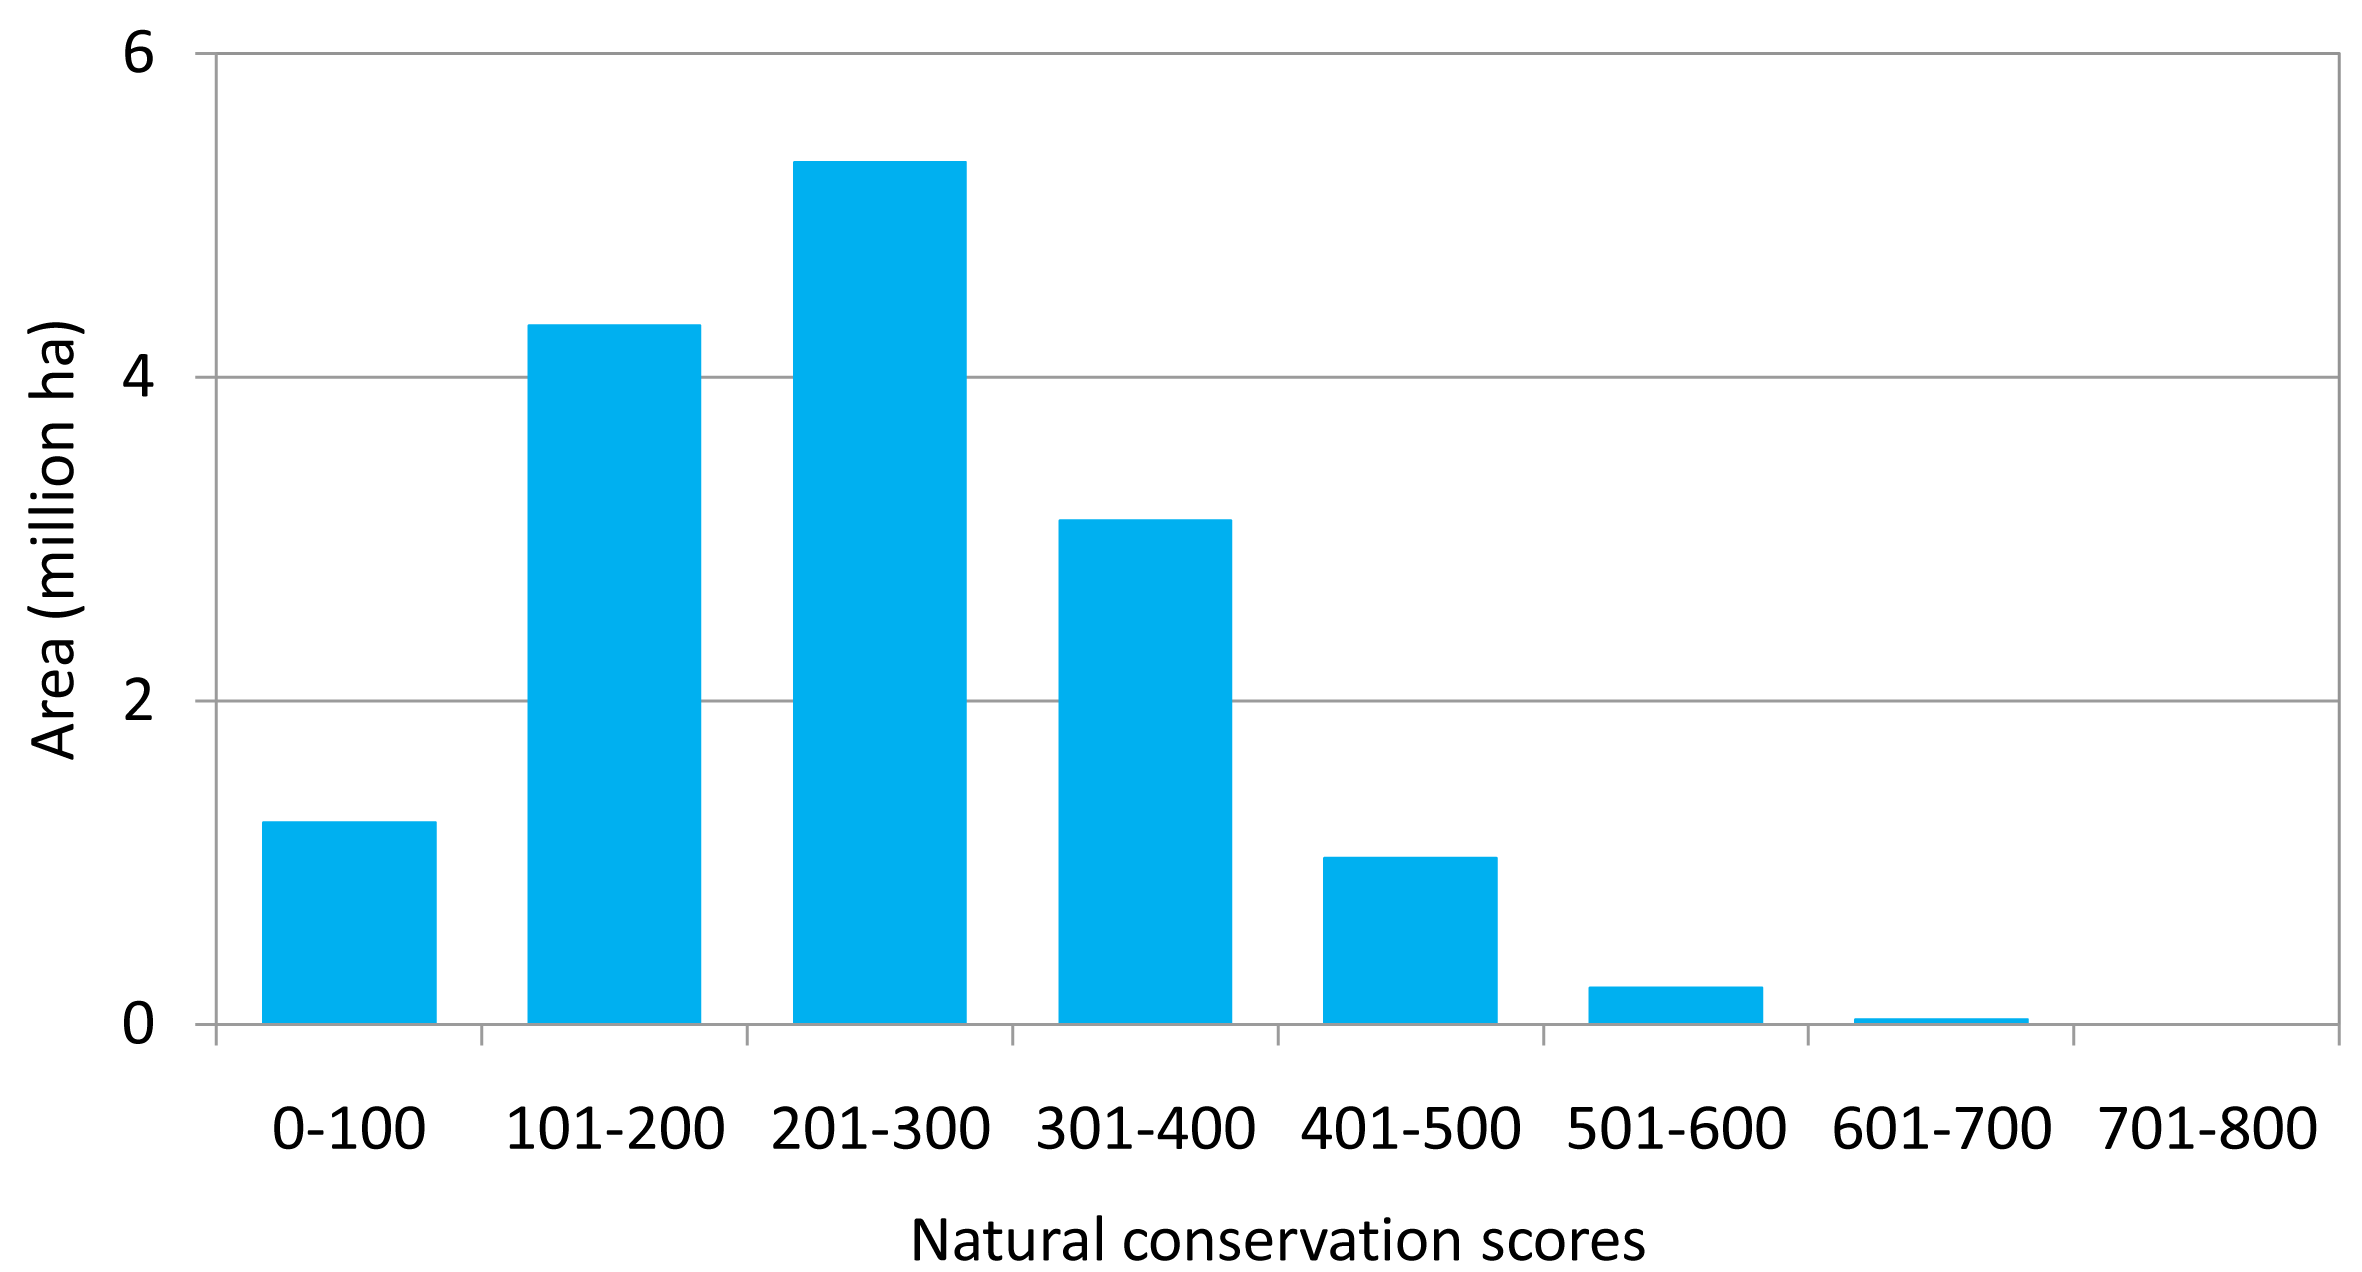
Since a key aim of our study was to assess the effects of allocating IFM methods to sites with low nature conservation values (see above), potential sites for applying them were determined as follows. Firstly, the total forest land available for IFM was reduced by removing plots that had high natural conservation values, according to variables connected to the tree or ground vegetation layers such as old forests (>140 years in the boreal zone and >120 years in the rest of Sweden), forests with high amounts of dead wood (>20 m3 ha−1) and old forests with high amount of broadleaves (>80 years in the boreal zone and >60 years in the rest of Sweden). Plots in nature reserves and other protected areas with high nature conservation values were also removed. In this step, 8.2 million hectares, corresponding to 35% of the forest land in Sweden were set aside because of conservation values. Secondly, the remaining plots were assigned nature conservation scores (NCS), ranging from 0 to 800. The variables used were assumed to correlate to high natural conservation values and included parameters related to stand structure, age, dead wood, large trees, etc. (Table 2). The classification system was further described in [27]. Similar classification methods have been used before [28-30]. Most of the areas remaining after the conservation areas had been removed in step 1 had relatively low NCS (Figure 1); 71.3% had scores below 300 and only 1.7% had scores exceeding 500.
2.1. The Production Estimation System
The growth of Norway spruce and Scots pine stands was estimated using the growth model DT [31]. The empirical growth model (DT) forecasts the stand development from young stands (>5 years) to final harvest, where stand characteristics are calculated with a yearly time step. Calculations are made for growth, height, stem shape, quality, volume in thinning, and final harvests, costs and incomes. By setting stand characteristics for DT, artificial initial conditions are created. The initial condition consists of circular plots with 10 m radius. Stand development is driven by diameter growth calculated according to [32]. Separate functions for Scots pine, Norway spruce, and silver birch (Betula pendula Roth) are used to calculate the growth of individual trees by a five year time step. The diameter and basal area growth of individual trees is adjusted to correspond with the basal area growth of the whole stand derived from ProdMod [33]. Initial basal area values for dominant height (Hdom) at 11 m (the average height of the 100 trees ha−1 with the largest diameter at breast height in each stand) were estimated using functions derived from data from spacing and pre-commercial thinning experiments [34] and fertilization and thinning experiments [35]. All stands had 2,000 stems ha−1 and the basal areas determined with the new basal area functions were site index-specific [36]. The development of each stand was estimated with a thinning program including two thinnings; the first at a Hdom of about 13 m and the second at a Hdom of about 16 m. Both thinnings were from below: the first had a thinning ratio (the ratio between the quadratic mean diameters of removed trees and remaining trees after thinning) of about 0.9–0.95, because of non-selective removal of trees in the strip-roads, and the second had a thinning ratio of about 0.8. To avoid the thinnings excessively affecting net stem volume production, basal area after thinning was higher than recommended in current thinning guidelines. After the second thinning, the development of the stands was simulated until mean annual volume increment culminated, hereafter called growth potential (MAImax). The rotation length was determined as the time when MAI amounted to 95% of MAImax for Norway spruce, Sitka spruce, and hybrid larch, while rotation lengths for Scots pine and lodgepole pine were set as the time when MAImax was reached. To avoid excessive risks of damage by wind and root-rot, the final harvests were earlier for Norway spruce, Sitka spruce, and hybrid larch.
Regression functions with MAImax as dependent variable and site index (SI) as independent variable were estimated for Norway spruce and Scots pine. In addition, regression functions with SI as the dependent variable and MAImax as the independent variable were also estimated. Finally, separate regression functions for total production at total ages of 15–95 years with 10-year intervals were estimated.
2.2. Forest Management Systems
Seven forest management treatments on forest land and planting of hybrid aspen (Populus tremula L. × Populus tremuloides Michx.) and Norway spruce on former agricultural land were simulated. The forest management treatments on forest land were: intensive fertilization of Norway spruce starting in young stands (IntFert); bulking-up Norway spruce elite clones from breeding populations using somatic embryogenesis (SE-seedlings); planting of lodgepole pine, hybrid larch (Larix × eurolepis Henry), and Sitka spruce (Picea sitchenis (Bong.) Carr.) (Contorta, Larch and Sitka, respectively); fertilization with wood ash on peatlands (Wood ash) and conventional fertilization in mature forest stands (ConFert). Fertilization in the IntFert treatment started when the Norway spruce trees were 2.5 m high and was repeated every second year until canopy closure (basal area = 25 m2 ha−1) and every seventh year in the mature forests. Fertilization was stopped 10 years before final harvest. In the ConFert treatment fertilization was applied every tenth year, starting at a Hdom of 10 m, but only when the fertilization response functions indicated that the fertilization response during the following ten year period would exceed 9 m3 ha−1 [37,38].
The increase in production by using Norway spruce SE-seedlings was determined as a percentage increase in production compared with seedlings of the local provenance [39]. The genetic improvement was increased for each ten-year period following the simulated progress in the tree breeding program for the coming 50 years. In the reference scenario, however, a production gain as an effect of genetic improvement in seed orchards was included, so the comparison was between genetic gains in SE-seedlings in relation to normal seed orchard seedlings [36]. Production of Sitka spruce was assumed to be equal to that of Norway spruce SE-seedlings. Production of lodgepole pine was assumed to be 40% higher than for Scots pine without genetic gain. Genetic gain according to [39] was implemented for both Scots pine and lodgepole pine with species-specific coefficients. With the abovementioned levels of increased MAImax, new corrected site indices were calculated with regression functions as described above. Thereafter, total production was calculated for total ages of 15–95 years in steps of 10 years with regression functions using the corrected SI as the independent variable. The production of hybrid larch plantations was estimated from production tables based on data from experiments and commercial plantations in southern Sweden [40].
The effect on net stem volume production of conventional fertilization in mature forests (ConFert) was estimated using regression functions developed by Pettersson [37,38]. If ConFert was combined with either planting of lodgepole pine or Norway spruce SE-seedlings, the effect of using lodgepole pine or Norway spruce SE-seedlings was first determined, and thereafter the effect of fertilization using the new production levels. Fertilization of mature lodgepole pine was assumed to result in the same increase in production as fertilization of Scots pine. For sites suitable for fertilization with wood ash on peatlands, the treatment was assumed to result in a production gain of 25 m3 ha−1 during a ten-year period [7].
In order to simulate the effect of IntFert, data obtained from nutrient optimization experiments in Flakaliden and Asa were used [41,42]. Flakaliden is situated in the north of Sweden (64°07′N 19°27′E) on a relatively infertile site for Norway spruce (SI G22) [43-45], i.e., dominant height at 100 years). Asa is situated in southern Sweden (57°8′N 14°45′E) on a fertile Norway spruce site (G32). Starting values for age, basal area, and SI were determined to ensure that DT estimated growth for fertilized stands in both Flakaliden and Asa appropriately. These starting values were then used to determine total production at the ages of 25–65 years in ten-year intervals, using the thinning program described above for conventional Scots pine and Norway spruce stands. The estimated total production was reduced by 10% to compensate for applying fertilization every second year instead of annually, as was done in the experiments, and for the less evenly spread of fertilizer in operational fertilizations compared to experimental treatments. Production levels for sites with site indices between those of the Flakaliden and Asa sites were assumed to be linearly related to SI. If planting of Norway spruce SE-seedlings was combined with IntFert, a corrected SI based on the use of SE-seedlings was first determined and then the effect of IntFert was determined using the corrected SI.
The effect of climate change on growth was estimated using the same period, tree-species, and regionally specific climate change coefficients as those used in the reference scenario (SKA-VB 08). For each ten-year growth period, an uncorrected growth value was first determined, which was then adjusted by the climate effect, and total production was estimated by adding the adjusted growth value to the yield at the start of the growth period. For lodgepole pine, climate change coefficients for Scots pine were used while the climate change coefficients for Norway spruce were used for Sitka spruce and hybrid larch.
2.3. Scenarios
The following four scenarios were applied to reflect differences in forest management treatments, the rate of implementation of IFM treatments, and forest owner categories.
“Base scenario”: aimed at reducing the effect of the treatments on nature conservation values. All plots chosen for IFM were among those with the lowest nature conservation scores (NCS).
“Fast implementation”: intended to illustrate a scenario in which IFM was implemented as fast as possible. In this scenario, no care was taken to minimize the effect of the management practices on nature conservation values.
“No IntFert”: intended to show the effect of omitting IntFert as an IFM treatment. Other IFM treatments were chosen according to the same criteria as in the “Base scenario”.
“Large Forest Companies”: to assess the effect on future forest production if most sites selected for IFM were situated on land owned by large forest companies. Of the total land set aside for IFM, 70% was allocated to land owned by large forest companies and IntFert was only used on such land.
In all scenarios, 15% of the total forest land in Sweden was used for IFM. Among the plots that remained after removing sites with high nature conservation values, IFM treatments were assigned to plots according to criteria presented in Table 3. Based on these criteria, the potential area was determined for each IFM treatment. Only plots that were available within a 50-year period were selected. A plot was considered available if the existing stand conformed to any of the criteria in Table 3 or the stand was selected for final harvest in the SKA-VB 08 reference scenario. The site properties and stand criteria presented in Table 3 were determined according to literature reviews and inventories of practical experiences [36]. Latitude, longitude and altitude criteria were included because of regeneration problems and risk for damage in the mature stands. Soil texture and soil moisture relate to risk for nutrient leaching (fertilization) and risk for drought.
On plots considered suitable for more than one IFM treatment, the treatments were assigned as follows. Firstly, Larch and Sitka were chosen before other treatments, and plots suitable for both Larch and Sitka were evenly split between the two treatments. Secondly, Contorta was chosen before IntFert and SE-seedlings on plots with site indices for Norway spruce below 22 m, while for plots with higher site indices, IntFert and SE-seedlings were prioritized before Contorta. Fertilization with wood ash on peatlands did not overlap with other treatments. No specific plots were assigned to ConFert. Instead, ConFert was used on plots that were later to be used for other IFM methods. In addition, ConFert was used in combination with SE-seedlings and Contorta.
Afforestation of former agricultural land was added to all four scenarios. The same scenario as was used in SKA-VB 08 was consequently used for all scenarios and 400,000 hectares of former agricultural land was afforested during a 40-year period. During the first 40-year period, 400,000 hectares former agricultural land was assumed to be available for afforestation and IFM. Because hybrid aspen is not tested in the north of Sweden, SE-seedlings of Norway spruce was mainly planted in the north of Sweden and hybrid aspen plantations were assigned to former agricultural land in southern Sweden. Of the total afforested area, 282,000 hectares were planted with hybrid aspen and 118,000 hectares with Norway spruce. Fertilization was not used on agricultural land because site index was assumed to be above the criteria given in Table 3.
In a separate study, the effects of varying the area set aside for IFM were investigated, by assessing growth parameters if 5%, 10%, 20%, or all available forest land was set aside during the 50-year period.
The SKA-VB 08 reference scenario was intended to model the effects of applying current regeneration treatments to suitable plots in Sweden. The effects of applying improved regeneration practices were simulated, by ensuring that 2,000 seedlings per hectare of either Norway spruce or Scots pine (depending on site properties) were well established.
3. Results
3.1. Areas Available for the Intensive Forest Management Treatments
The potential areas for the IFM treatments were highest for IntFert, SE-seedlings and Contorta, while potential areas for Larch, Sitka and Wood ash were lower (Table 4). Suitable plots for IntFert were predominantly found in the central and southern part of north Sweden. Areas suitable for planting lodgepole pine were mainly found in northern Sweden, while areas suitable for planting Norway spruce SE-seedlings were predominantly in southern Sweden. Potential areas for planting hybrid larch and Sitka spruce were entirely located in the south of Sweden due to the restrictions imposed when choosing treatments (Table 3). Small areas suitable for wood ash fertilization of peatlands were found throughout the whole of Sweden.
IntFert, SE-seedlings and Contorta accounted for 86% of the area for IFM in the “Base scenario” (Table 4). “Fast implementation” resulted in almost the same distribution of treatments as in the “Base scenario”. In the “No IntFert” and “Large Forest Companies” scenarios, the loss of the area assigned to the IntFert treatment was compensated by increases in the areas assigned to SE-seedlings and Contorta (Table 4). ConFert was applied to 1.7 million hectares in the “Base scenario” during the studied 100-year period. The corresponding areas were 1.6 million hectares for the “Fast implementation” scenario and 1.9 million hectares for both the “No IntFert” and “Large Forest Companies” scenarios.
If all land available for IFM during the first 50-year period was used, the total area used for IFM would amount to 5.7 million hectares or 24.2% of the forest land in Sweden (Table 5). For each treatment except wood ash fertilization on peatlands, the area used increased linearly with increases in the proportion of the forest land set aside for IFM (Table 5).
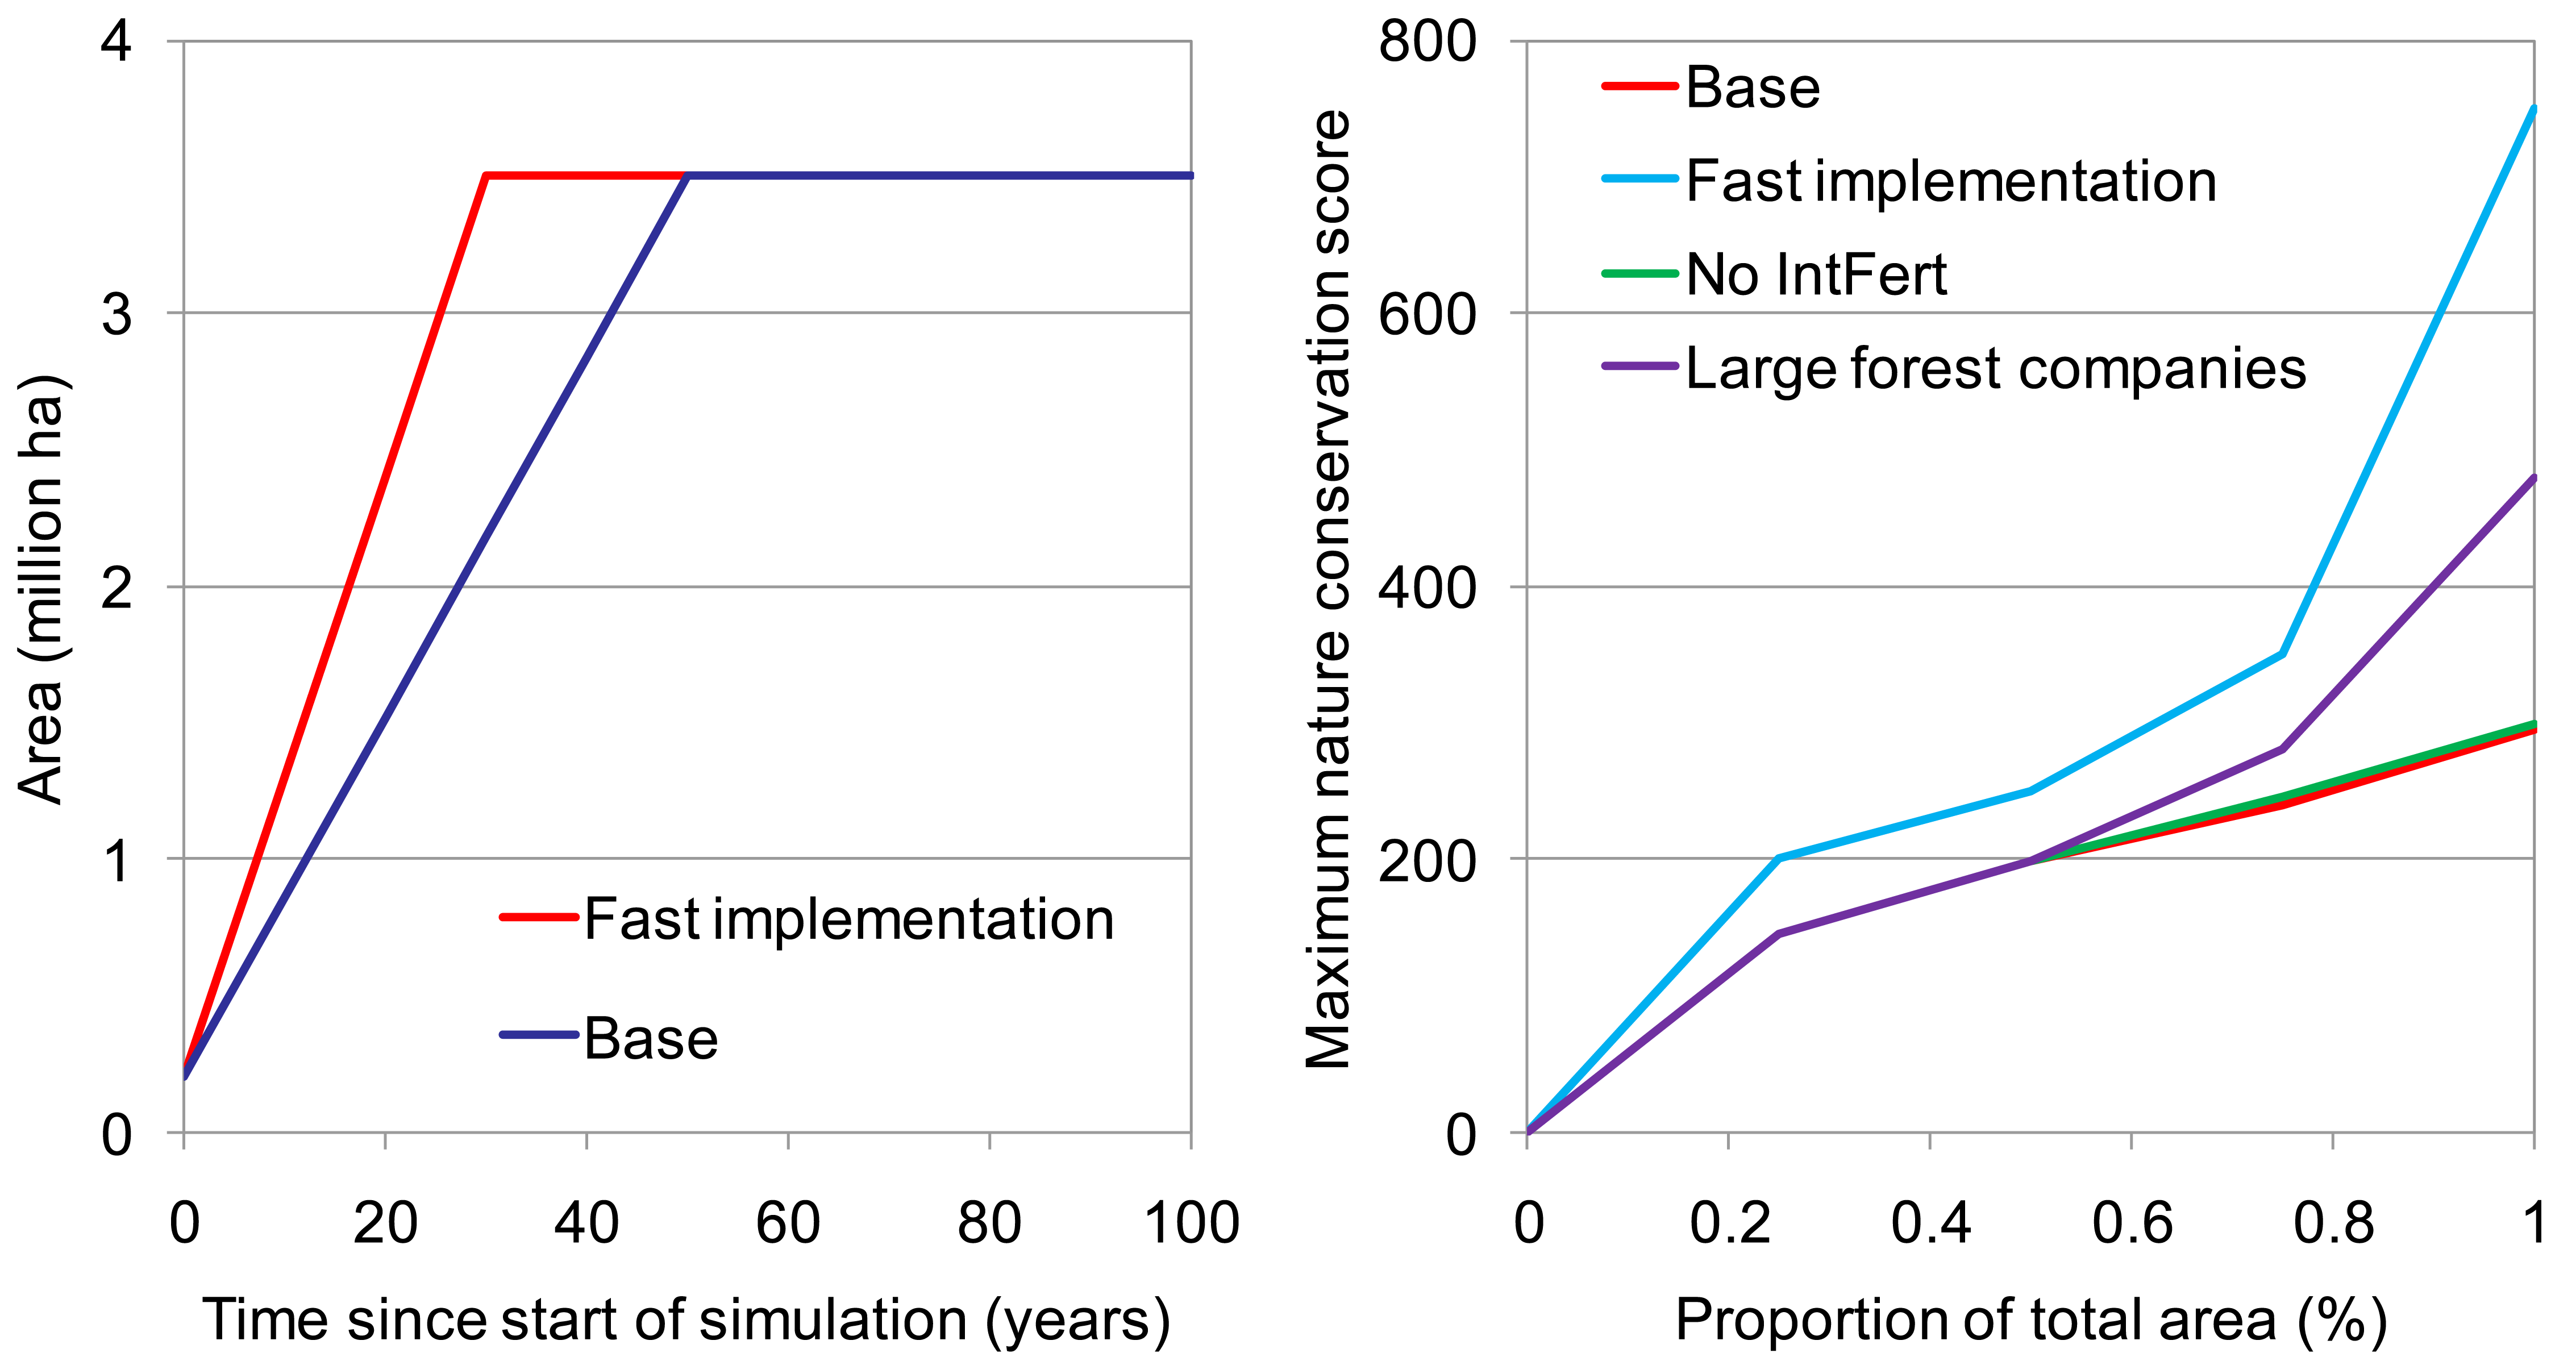
“Fast implementation” resulted in 3.5 million hectares being set aside for IFM 20 years earlier (Figure 2). In “Fast implementation”, at most 121,000 hectares were assigned to IFM during a single year (equivalent to about 52% of the annual available area according to the reference scenario in SKA-VB 08). For the “Base scenario”, the implementation rate was relatively constant over time, at about 65,000 hectares per year. Thus, about 25% of the total final felled area was used for IFM each year during the 50-year implementation period.
In the “Fast development” scenario, more sites with high nature conservation values were used than in other scenarios (Figure 2). In the “Large forest Companies” scenario the nature conservation score (NCS) was 56% higher than in the “Base scenario”. Not using IntFert did not significantly affect the NCS. Plots with high NCS accounted, however, for a small proportion of the total area for IFM.
3.2. Simulated Effects of Intensive Forest Management on Growth and Yield
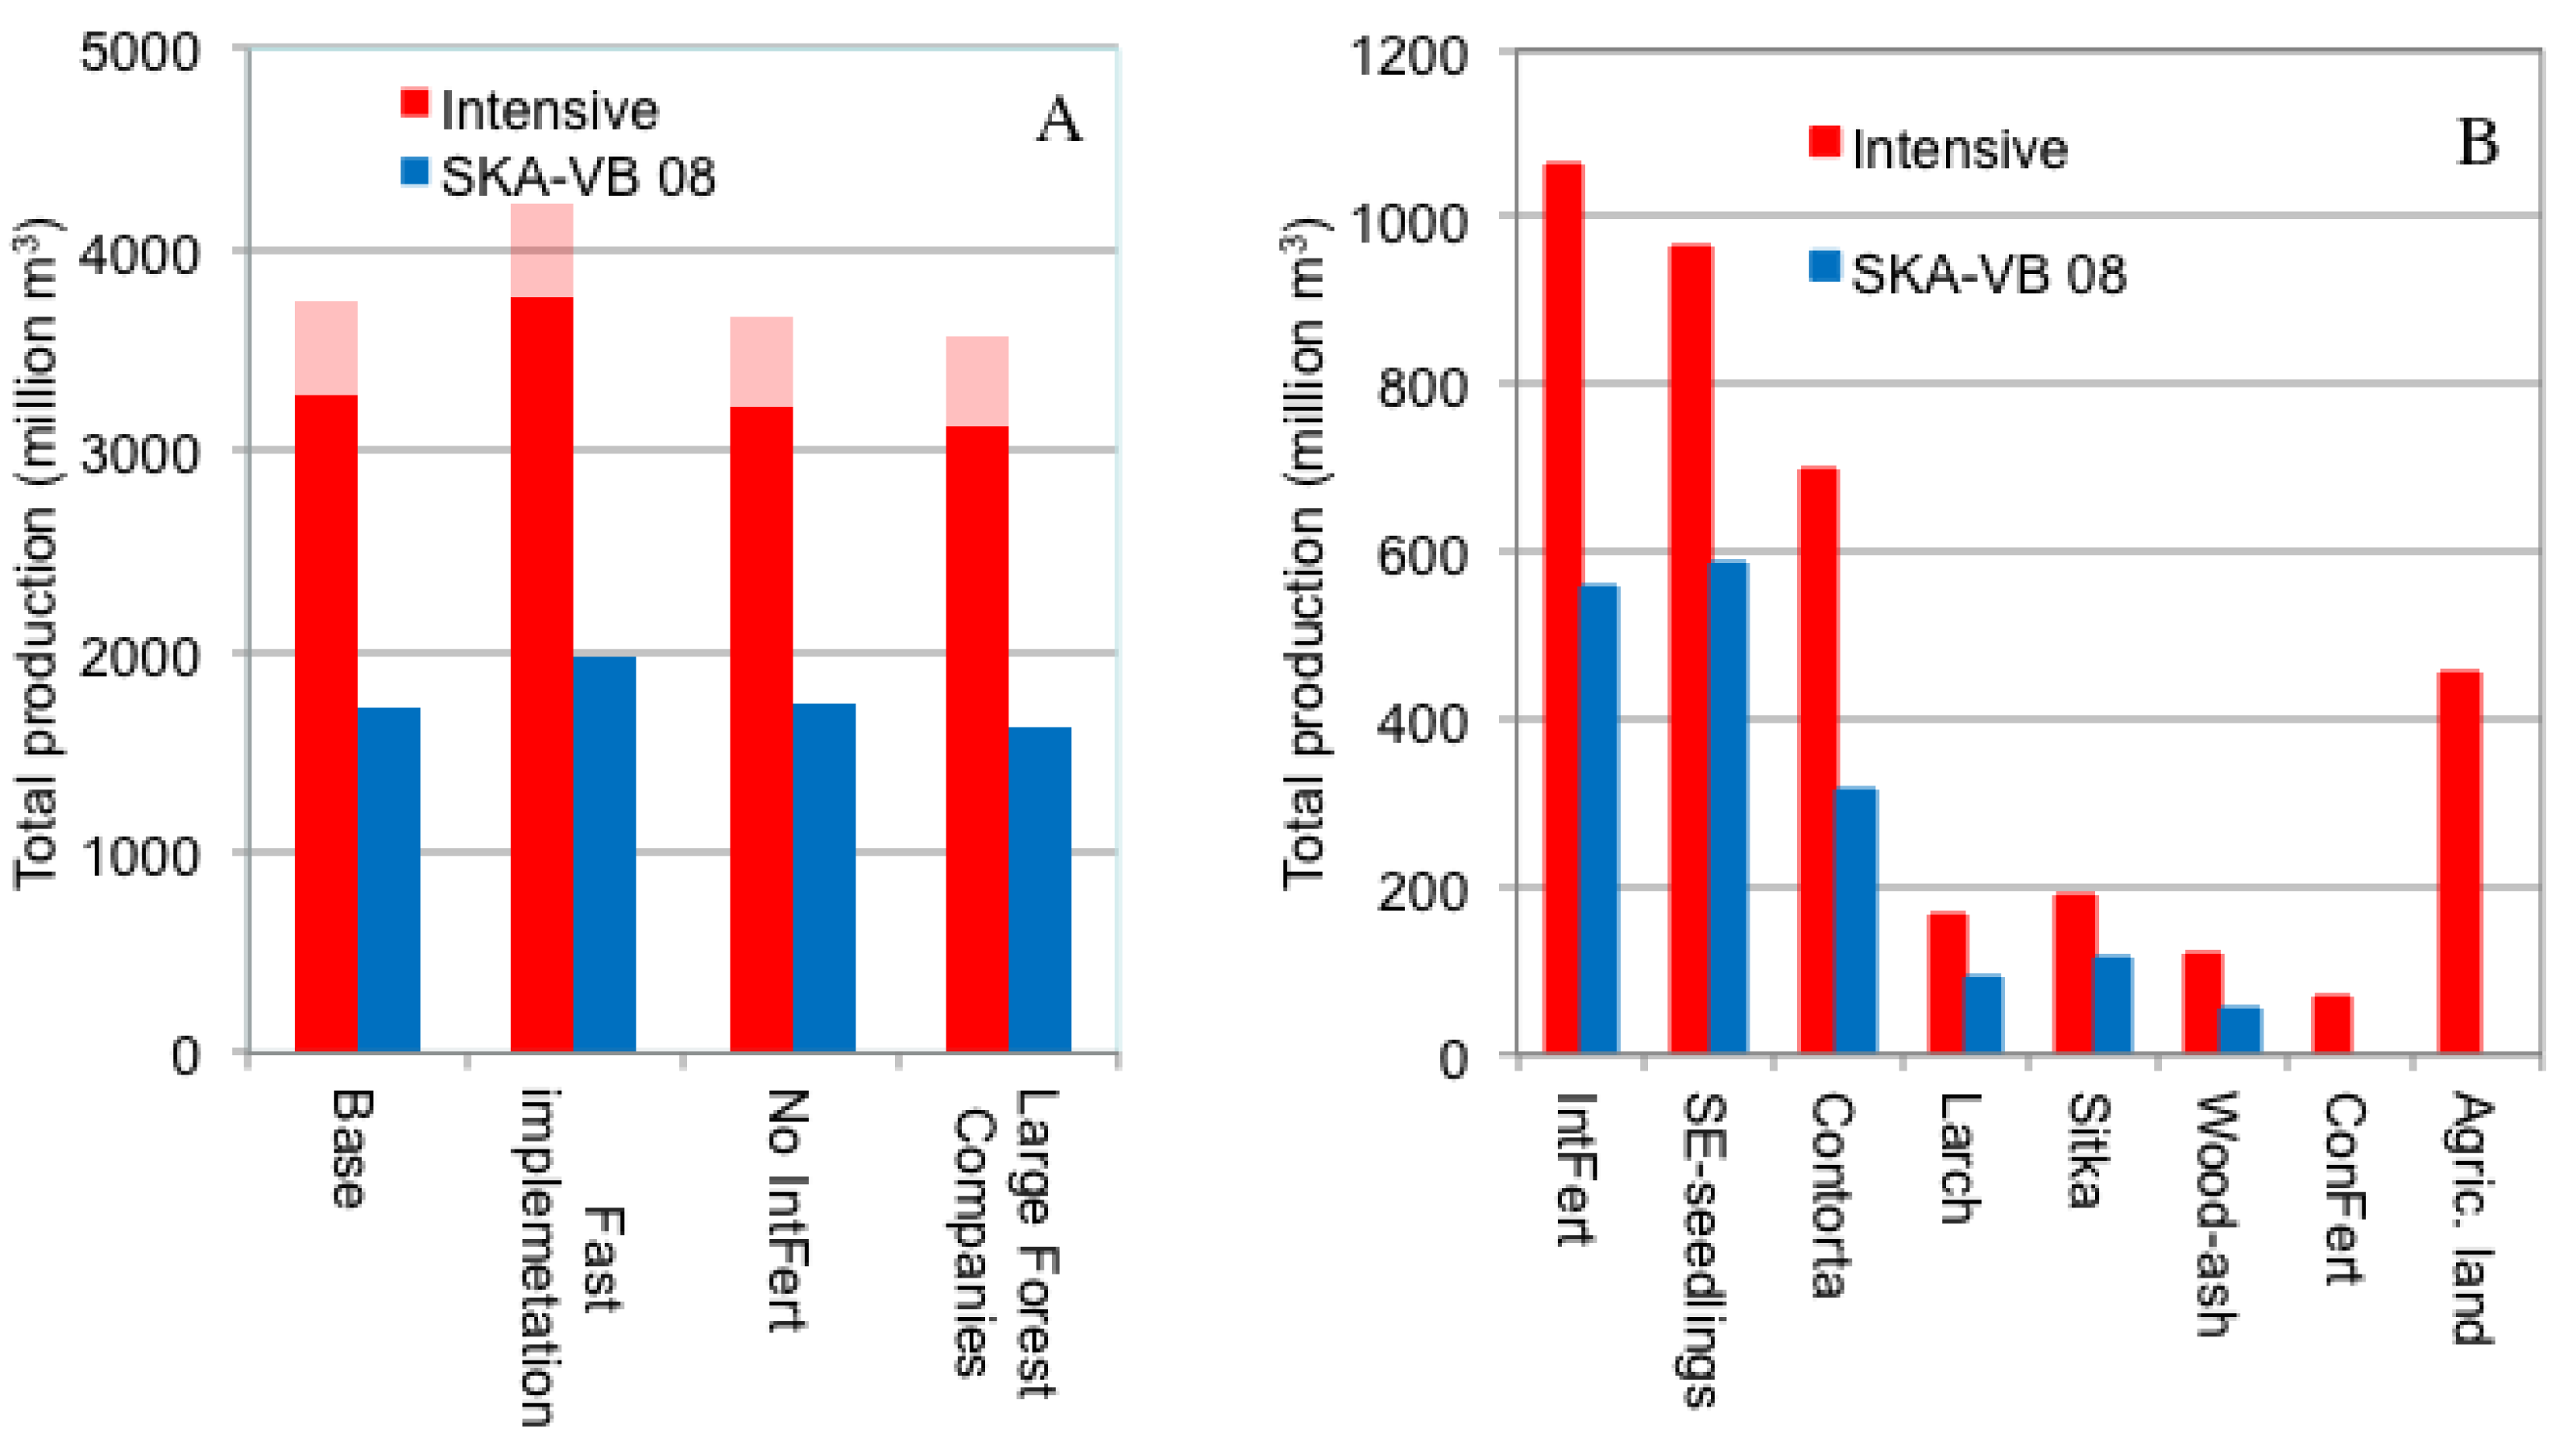
Total yields during the 100-year simulation period were about 85–92% higher for the IFM scenarios than for the SKA-VB 08 reference scenario (Figure 3). In the “No IntFert” scenario, which did not include the IntFert treatment in Norway spruce plantations, total production was 1.8% lower (60 million m3) and in the “Large Forest Companies” scenario, in which most of the intensive forest treatments were applied to company land and IntFert was restricted solely to company land, total production was 4.8% lower than in the “Base scenario” (157 million m3). “Fast implementation” of IFM increased yield by 15% (493 million m3) compared to the “Base scenario” in which plots with low NCS were chosen. The yield from 400,000 hectares of former agricultural land amounted to about 450 million m3 during the 100-year period (Figure 3).
Measured as total production, SE-seedlings and IntFert gave the highest yields during the 100-year simulation period, but relative to the yields in the reference scenario (SKA-VB 08), the highest increases in yield were for Contorta (122%) followed by IntFert (89%; Figure 3). SE-seedlings, Larch and Sitka gave 63–82% higher yields than the reference scenario. Yields were significantly lower on former agricultural land than on forest plots where the treatments SE-seedlings, IntFert, and Contorta were used (Figure 3), but yields on former agricultural land were larger than the contributions from the Sitka, Larch, Wood ash, and ConFert treatments (Figure 3).
The effect of IFM on stem volume production was negligible during the first simulation periods (Figure 4). The highest relative difference in production between the IFM and the reference scenario was found about 55–65 years after the initiation of the simulation. Thereafter, the absolute difference in growth between the reference and IFM scenarios remained relatively stable at about 25–30 million m3 year−1. During the first 10 years, only the IntFert and ConFert treatments resulted in increased growth. During the first 10 years, 218,000 hectares were available for IntFert and contributed about 343,000 m3 to the total yield. ConFert contributed about 1.7 million m3 and wood ash fertilization on peatlands about 349,000 m3. Afforestation of former agricultural land contributed 5–6 million m3 during the last 30–40 years of the simulation. For the other intensive forest treatments, the lag period before the increase in growth started to be pronounced was relatively long (Figure 4).
When the difference between the reference scenario and the IFM scenarios stabilized, after about 50 years, the intensive regeneration contributed about 50% of the improvement in annual stem volume growth (Figure 4). At the beginning of the simulation period, however, the major part of the improvement in annual stem volume growth was an effect of IFM.
The “Base” and “No IntFert” scenarios gave the highest yields for plots with the lowest nature conservation scores (NCS), but plots with higher NCS had to be used in the “Fast implementation” and “Large Forest Companies” scenarios (Figure 5). For the “Base scenario”, more than 80% of the volume was produced on plots with NCS < 300. In contrast, in the “Fast implementation” scenario less than 65% of the volume was obtained from plots with NCS < 300, and a small percentage was from plots with NCS > 700.
4. Discussion
The geographical distribution of the IntFert, SE-seedlings, and Contorta treatments was largely dependent on differences in site fertility. Lodgepole pine was recommended for relatively low fertility sites [36], hence most suitable sites were in the north of Sweden. IntFert, which is suitable for sites with low to medium fertility [42], was mainly applied in central Sweden while SE-seedlings, which are preferably used on fertile sites [46], was mainly applied in the south of Sweden. Hybrid larch and Sitka spruce were only recommended in the most southern part and along the west-coast of Sweden [36]. Among a number of possible foreign tree species, lodgepole pine, Sitka spruce, and hybrid larch were considered having the best overall potentials for cultivation on Swedish forest sites. It should be noted that IFM was implemented during a 50-year period, in which time the climate may change significantly and the criteria for site properties used in this study may not be relevant 20 or 30 years from now [26].
About 80 per cent of the forest land in southern Sweden is owned by small private forest owners, whereas 59% of the forest land in northern Sweden is owned by large forest companies or by Swedish citizens through the state forest company Sveaskog [3]. Therefore, large proportions of potential sites for Norway spruce SE-seedlings will be situated on private forest land, while potential sites for planting lodgepole pine are predominantly situated on land owned by large forest companies or the state. In recent years, the use of improved genetic material has gained interest among private forest owners [46] and it is thus possible that private forest owners might consider planting SE-seedlings if they are available.
Sites for IFM were selected using data from the National Forest Inventory [3]. The advantage of using NFI data for this type of simulation is the good representation of all forest types throughout Sweden. The IFM treatments were, however, assigned to individual stands or plots and no landscape-level restrictions were considered. This is a common limitation of simulations based on NFI data, which raises several problems. Notably, it prevents consideration of factors, such as the distance to wood processing plants and the distribution of land owners that are likely to influence decisions to implement IFM treatments [19,47]. In addition, the NFI data provide no information about the size of individual stands, although treatments such as IntFert and ConFert can only be viably applied to relatively large stands or stands situated adjacent to similar stands. However, the aim of this study was not to assess the practicality of implementing the treatments, but to assess the potential of IFM.
Compared to current forest management methods, future forest production can be almost doubled by using IFM methods at the individual plot level. Total production in Sweden could therefore increase by about one percent with every percent of forest land that is used for IFM, with further additions from forest production on former agricultural land. Afforestation of 400,000 hectares former farmland would increase the total forest production by about 0.4%, which may seem a negligible amount, but 0.4% is equivalent to almost 65% of the production of lodgepole pine in the “Base scenario”. One important lesson to be learnt is, therefore, that no single method will increase future production dramatically [17], but several methods used in combination may still provide substantial overall increases.
In order to allocate 15% of Swedish forest land to IFM within a 50-year period, about 25% of the annual regeneration area has to be assigned for IFM. Our results indicate that assigning this proportion of the regeneration area each year for IFM may be done without resulting in a significant loss of nature conservation values since plots with nature conservation scores >300 were not used in the “Base scenario”. It should, however, be noted that there may not be a one to one relationship between conservation score and biodiversity, since landscape factors have to be considered as well.
Using 25% of the regeneration area each year for IFM would require a large proportion of forest owners to be willing to invest in this type of silviculture, although the dividends would accrue far in the future. It may be unrealistic to assume that small forest owners will invest in fertilization of young stands with a possible income in final harvests only after 40–60 years [16]. However, the “Large Forest Companies” scenario, in which only 30% of the IFM plots (and none of the IntFert plots) were on private forest land, showed that it is possible to gain almost the same increase in production, albeit at the cost of having to use plots with somewhat higher nature conservation scores. It should be noted that also the reference scenario (SKA-VB 08) had lower production for plots selected in the “Large Forest Companies” scenario than for the reference scenario for plots in the “Base scenario” because of lower fertility of the plots that were selected in the former scenario. In addition, the scenario “No IntFert” showed that the IFM treatments are exchangeable. An explanation for this is that the absolute effect on growth of the various IFM methods was relatively similar. Furthermore, a large part of the increased production was the effect of improved regeneration methods (see below) and this was the same for all of the IFM treatments.
It took a relatively long time (40–60 years) for the simulated IFM treatments to result in a significant increase in stem volume production, which was not surprising since they were not fully implemented until 50 years after the start of the simulations. Another reason for the long time-lag in production is that most of the intensive forest plots started as bare ground without tree cover and it takes at least 20–30 years before significant growth can be realized in northern temperate and boreal forest ecosystems, even on very intensively managed plots. The increased production may, of course, be realized sooner if the rate of implementation is faster, as in the “Fast implementation” scenario. However, in this scenario plots with significantly higher nature value scores were used, since a larger proportion of the annually available regeneration area was used. Therefore, it is realistic to assume that it would take at least 50 years to implement IFM on 15% of the Swedish forest land.
Conventional fertilization (ConFert) increased growth within a ten-year period, and was the treatment that most rapidly increased growth and harvest potentials. However, in this study ConFert was used to a relatively small extent since ConFert was applied to plots that were to be subsequently used for other IFM treatments. During the first 20 years, 120,000–160,000 hectares were fertilized annually, compared to slightly less than 100,000 hectares currently fertilized and the 200,000 hectares per year when fertilization was at its peak in the 1970s [6].
All IFM treatments used in this study gave a positive net present value with an interest rate of 2.5% [36]. Some treatments were, however, more capital intensive than others. Simonsen et al. [16] studied the profitability of seven silvicultural treatments to increase forest growth and found that the use of genetically improved material and change of tree species was most profitable. In this study, changing tree species from Scots pine to lodgepole pine was not associated with any extra cost and therefore very profitable. Fertilization in young forests (IntFert) was the most capital intensive. The cost of each fertilization was about 3000 SEK ha−1 and fertilization was repeated up to seven times during a rotation. Thus, even if the net present value of IntFert was positive at 2.5% interest rate, it was significantly lower than change of tree species and planting genetically improved material. Simonsen et al. [16] concluded that forest owners probably tend to first use forest management methods that require low initial investments such as lodgepole pine.
In this study, it was assumed that regeneration of the plots was always successful and resulted in 2000, well established seedlings per hectare. This is probably not a realistic assumption since it is very difficult to achieve in practical forest management [48], but the analysis illustrates the importance of well-established young forests. More than half of the effect on future growth of IFM methods was an effect of increased success of regenerations. This effect was probably dependent on a number of factors. Firstly, the new forest was established without fallow years so the time when there was no production was considerably shorter than in the reference scenario. Secondly, an appropriate tree species was always established on the regeneration area, while this is not always the case in current forest management [49]. Thirdly, in practice not all regeneration areas will reach 2000 seedlings per hectare, but this was probably less important for production than reducing the waiting time and choosing an optimal tree species. Fourthly, the effect of genetic gain was only applied to planted seedlings in the reference scenario, while all seedlings in the IFM scenarios gained from genetic improvement since they were all planted.
In both the reference scenario and our IFM scenarios, the effect of future climate change was estimated by applying climate change coefficients that increased the simulated growth by 10–30%, depending on the period, region, and tree species. This impact of climate change is, inevitably, impossible to validate, but since it was included in both the reference and IFM scenarios, the comparison of absolute growth between them has not been affected. However, if climate change had not been included in the analysis, the relative effect of IFM would have been larger.
Intensive forest management methods can, compared to conventional methods, increase as well as decrease the risk for damage. Based on current knowledge, there are no obvious indications that IntFert leads to a higher risk for damage from insects, fungi or wild animals compared to conventionally managed Norway spruce stands on fertile sites. To reduce the risk for damage following a reduced genetic variation in SE-seedlings, using mixtures of selected and well-tested elite clones are recommended. The risk of introducing new insects or fungi when cultivating exotic tree species, (Contorta, Sitka, and Larch) can be prevented by intensive vitality monitoring and adaptive management. Intensively managed, fast-growing forests involve increased risk of stand stability problems caused by wind and snow damage.
Raw materials (timber, pulp wood, energy assortments) from intensively managed forest stands will probably differ from those of conventionally managed stands. Changed wood properties such as basic density and juvenile wood content will affect pulp processes and strength properties of sawn timber. However, in the future as in the past, industrial processes will most likely adapt to and explore the optimal use of a new raw material with changed properties.
5. Conclusions
Among the studied IFM treatments IntFert, planting of lodgepole pine, and planting of Norway spruce SE-seedlings appear to have the largest potential to increase future growth and harvest potential, mainly because they could be applied to large areas. Planting of lodgepole pine is already an accepted and well-tested method, which in a near future could be scaled up to the proposed levels. More long-term research and testing is needed before IntFert and planting of Norway spruce SE-seedlings can be implemented on a large scale. Other methods which can be applied to more limited areas may have significant effects on the production of specific forests, but will be less important at a national level. If forest managers start to implement IFM today, the effect on increased growth will not be significant for several decades. However, history suggests that it may be worthwhile to have a long-term forest management goal, since standing volumes in Swedish forests have increased dramatically during the last 50–100 years as a result of improved forest management [3]. It can also be concluded that it is probably possible to implement IFM without significantly affecting environment conservation values. The impact on environmental values will, however, depend on the rate of implementation. Faster implementation will result in greater risks of using sites with high environmental values. Another important finding of this study is that the results of regenerations strongly affect future production because the potential growth contributions of both the optimal tree species and genetically improved seedlings will not be realized if large proportions of the regenerations consist of naturally regenerated seedlings.


| Region | Area | Scots pine | Norway spruce | Lodgepole pine | Broad-leaves | Growth | Harvest |
|---|---|---|---|---|---|---|---|
| 1,000 ha | % | % | % | % | million m3 | million m3 | |
| Northern Sweden | 13,166 | 41.7 | 38.4 | 2.0 | 17.9 | 48.2 | 36.5 |
| Southern Sweden | 4,976 | 27.0 | 51.5 | 0.0 | 21.5 | 36.3 | 30.0 |
| Central Sweden | 5,226 | 41.6 | 42.3 | 0.4 | 15.6 | 29.3 | 24.0 |
| Total | 23,369 | 37.3 | 43.3 | 1.0 | 18.4 | 113.8 | 90.5 |
| Indicator | Scores |
|---|---|
| Tree layer | 100 = fully layered/several layers, 50 = two layers, 0 = one layer |
| Uneven age | 100 = not even-aged, 0 = even-aged |
| Gaps | 100 = several gaps, 50 = some gaps, 0 = no gaps |
| Ground structure | 100 = very uneven, 50 = fairly even, 0 = very even |
| Rare shrubsa | 100 = present, 0 = not present |
| Large trees | dbh 100 = >40 cm, 50 = >30 cm, 0 = <30 cm |
| Ratio of broadleaves | 100 = 10/10, 90 = 9/10….0 = 0/10 |
| Ratio of aspen (Populus tremula L.) | 100 = 10/10, 90 = 9/10….0 = 0/10 |
| Ratio of valuable broadleavesb | 50 = 5/10, 40 = 4/10, 30 = 3/10, 20 = 2/10, 10 = 1/10, 0 = 0/10 |
| Volume dead wood | 1 point for every 0.2 m3 of dead wood ha−1 (max 100) |
| Ditching | 100 = no ditches, 0 = ditches |
aSorbus aucuparia L., Corylus avellana L., Lonicera xylosteum L., Daphne mezereum L.bValuable broadleaves include French elms (Ulmus glabra Huds., U. laevis Pall., U. minor Mill.), common ash (Fraxinus excelsior L.), common hornbeam (Carpinus betulus L.), European beech (Fagus sylvatica L.), wild cherry (Prunus avium L.), lime (Tilia cordata Mill., T. platyphyllos Scop.), maple (Acer platanoides L., A. campestre L.).
| Critera Latitude, °N | IntFert | SE-seedlings | Contorta | Larch <58 | Sitka <59 | Wood ash | ConFert |
|---|---|---|---|---|---|---|---|
| Longitude, °E | >13°30′ if Lat. >57 | ||||||
| Altitude, m asl. | <600 m if Lat. >62° | <300 m | |||||
| Soil type and texture | Sandy-silty till and finer | Sandy-silty till and coarser | Peat | Sandy-silty till and finer | |||
| Soil depth | Not shallow | Not shallow | |||||
| Soil moisture | Mesic | Mesic–moist | Dry–mesic | Mesic | Mesic | ||
| Peat soils | No | No | No | No | No | Yes | No |
| Bottom or field layer vegetation | Not lichens | Bilberry and poorer | Not rich herbaceous vegetation | Not rich herbaceous vegetation or grass | |||
| SI [43–45] | G20–30 | >G26 | >G28 | >G28 | 16–30 | ||
| Other | Young spruce stands | ||||||
| Scenario | IntFert | SE-seedlings + IntFert | SE-seedlings | Contorta | Larch | Sitka | Wood ash | Total |
|---|---|---|---|---|---|---|---|---|
| Potential | 0.04 | 1.74 | 1.34 | 1.89 | 0.17 | 0.22 | 0.25 | 5.66 |
| Base scenario | 0.03 | 1.02 | 0.85 | 1.12 | 0.11 | 0.15 | 0.23 | 3.50 |
| Fast implementation | 0.04 | 1.02 | 0.76 | 1.20 | 0.11 | 0.15 | 0.23 | 3.51 |
| No IntFert | 0 | 0 | 1.51 | 1.48 | 0.13 | 0.16 | 0.23 | 3.50 |
| Large Forest Companies | 0.02 | 0.77 | 0.88 | 1.43 | 0.08 | 0.11 | 0.21 | 3.51 |
| Proportion (%) | IntFert | SE-seedlings + IntFert | SE-seedlings | Contorta | Larch | Sitka | Wood ash | Total |
|---|---|---|---|---|---|---|---|---|
| 5 | 0.02 | 0.28 | 0.31 | 0.33 | 0.04 | 0.05 | 0.13 | 1.17 |
| 10 | 0.02 | 0.64 | 0.59 | 0.72 | 0.07 | 0. 10 | 0.20 | 2.34 |
| 20 | 0.04 | 1.40 | 1.11 | 1.54 | 0.15 | 0.19 | 0.25 | 4.67 |
| 24.2 (all) | 0.04 | 1.74 | 1.34 | 1.89 | 0.17 | 0.22 | 0.25 | 5.66 |
Acknowledgments
This study was financially supported by the Swedish government and by Future Forests, a multi-disciplinary research program supported by the Foundation for Strategic Environmental Research (MISTRA), the Swedish Forestry Industry, the Swedish University of Agricultural Sciences (SLU), Umeå University, and the Forestry Research Institute of Sweden (Skogforsk). Lena Gustafsson helped when constructing the nature conservation scores. The authors would also like to thank Sune Linder and an anonymous referee for valuable suggestions, which have improved the paper.
References and Notes
- Wahlgren, A. Skogsskötsel: Handledning vid uppdragande, vård och föryngring av skog; Norstedt: Stockholm, Sweden, 1914; p. 728. [Google Scholar]
- Kardell, L. Svenskarna och Skogen. Del 2. Från baggböleri till naturvård; Skogsstyrelsen: Jönköping, Sweden, 2004; p. 302. [Google Scholar]
- Forestry Statistics 2010. Official Statistics of Sweden (in Swedish with English summary and tables); Swedish University of Agricultural Sciences: Umeå, Sweden, 2010.
- Tamm, C.-O. Nitrogen in Terrestrial Ecosystems—Questions of Productivity, Vegetational Changes, and Ecosystem Stability; Ecological Studies 81; Springer-Verlag: Berlin, Germany, 1991; p. 115. [Google Scholar]
- Enander, K.G. Ekologi, skog och miljö. Vetenskap och idéer under 300 år; Report 4; Swedish University of Agricultural Sciences, Department of Forest Ecology and Management: Umeå, Sweden, 2007; p. 262. [Google Scholar]
- Lindkvist, A.; Kardell, Ö.; Nordlund, C. Intensive forestry as progress or decay? An analysis of the debate about forest fertilization in Sweden, 1960–2010. Forests 2011, 2, 112–146. [Google Scholar]
- Hånell, B. Möjlighet till höjning av skogsproduktionen i Sverige genom dikesrensning, dikning och gödsling av torvmarker. In Skogsskötsel för ökad tillväxt. Faktaunderlag till MINT-utredningen; Fahlvik, N., Johansson, U., Nilsson, U., Eds.; Swedish University of Agricultural Sciences: Uppsala, Sweden, 2009; p. 28. [Google Scholar]
- Fox, T.R.; Jokela, E.J.; Allen, H.L. The development of pine plantation silviculture in the southern United States. J. Forest. 2007, 105, 337–347. [Google Scholar]
- Nilsson, L.-O.; Wiklund, K. Nitrogen uptake in a Norway spruce stand following ammonium sulphate application, fertigation, irrigation, drought and nitrogen-free-fertilisation. Plant Soil 1994, 164, 221–229. [Google Scholar]
- Nilsson, L.-O. Manipulation of conventional forest management practices to increase forest growth—Results from the Skogaby project. Forest. Ecol. Manage. 1997, 91, 53–60. [Google Scholar]
- Eriksson, H.; Johansson, U. Yields of Norway spruce (Picea abies (L.) Karst.) in two consecutive rotations in southwestern Sweden. Plant Soil 1993, 154, 239–247. [Google Scholar]
- Rosvall, O.; Jacobsson, S.; Karlsson, B.; Lundström, A. Ökad produktion—trots ökad naturvård? Skogforsk: Uppsala, Sweden, 2004. [Google Scholar]
- Rosvall, O.; Jacobsson, S.; Karlsson, B.; Lundström, A. Ökad avverkningspotential med intensivare skogsskötsel; Skogforsk: Uppsala, Sweden, 2004. [Google Scholar]
- Lundström, A.; Söderberg, U. Outline of the Hugin system for long-term forecasts of timber yields and possible cut. In Large-Scale Forestry Scenario Models: Experiences and Requirements; Päivinen, R., Roihuvuo, L., Siitonen, M., Eds.; EFI: Joensuu, Finland, 1996; pp. 63–77. [Google Scholar]
- Rosvall, O.; Normark, E. Ökad tillväxt och virkesproduktion i Holmens skogar. Den fullständiga utredningen; Holmen skog: Örnsköldsvik, Sweden, 2006. [Google Scholar]
- Simonsen, R.; Rosvall, O.; Gong, P.; Wibe, S. Profitability of measures to increase forest growth. Forest. Policy Econ. 2010, 12, 473–482. [Google Scholar]
- Rosvall, O. Produktionspotentialen är betydligt högre än dagens tillväxt. Kungl. Skogs-och Lantbruksakad. Tidskr. 2007, 4, 13–30. [Google Scholar]
- Eriksson, L.; Gullberg, T.; Woxblom, L. Skogsbruksmetoder för privatskogsbrukaren; Swedish University of Agricultural Sciences, Department of Forest Products: Uppsala, Sweden, 2008; p. 201. [Google Scholar]
- Skogliga konsekvensanalyser 2008—SKA-VB 08; Skogsstyrelsen: Jönköping, Sweden, 2008; p. 146.
- Mason, W.L.; Perks, M.P. Sitka spruce (Picea sitchensis) forests in Atlantic Europe: Changes in forest management and possible consequences for carbon sequestration. Scand. J. Forest. Res. 2011. in press. [Google Scholar]
- Bell, F.W.; Douglas, G.P.; Wester, M.C. Is intensive forest management a misnomer? An Ontario-based discussion of terminology and an alternative approach. Forest. Chron. 2006, 82, 662–674. [Google Scholar]
- Carmean, W.H. Intensive plantation management for good-site forest land in northwest Ontario. Forest. Chron. 2007, 83, 41–53. [Google Scholar]
- McPherson, S.; Bell, F.W.; Leach, J.; Street, P.; Stinson, A. Applying research for enhanced productivity on the Canadian Ecology Centre—Forestry research partnership forests. Forest. Chron. 2008, 84, 653–665. [Google Scholar]
- Park, A.; Wilson, E.R. Beautiful plantations: Can intensive silviculture help Canada to fulfill ecological and timber production objectives? Forest. Chron. 2007, 83, 825–839. [Google Scholar]
- Allen, H.L.; Fox, T.R.; Campell, R.G. What is ahead for intensive pine plantation silviculture in the South? South. J. Appl. Forest. 2005, 29, 62–69. [Google Scholar]
- Bergh, J.; Nilsson, U.; Kjartansson, B.; Karlsson, M. Impact of climate change on the productivity of silver birch, Norway spruce and Scots pine stands in Sweden and economic implications for timber production. Ecol. Bull. 2010, 53, 185–196. [Google Scholar]
- Lundström, A.; Glimskär, A. Definitioner, tillgängliga arealer och konsekvensberäkningar. Faktaunderlag till MINT-utredningen; Swedish University of Agricultural Sciences: Uppsala, Sweden, 2009; p. 31. [Google Scholar]
- McElhinny, C.; Gibbons, P.; Brack, C.; Bauhus, J. Forest and woodland stand structural complexity: Its definition and measurement. Forest. Ecol. Manage. 2005, 218, 1–24. [Google Scholar]
- Whitman, A.A.; Hagan, J.M. An index to identify late-successional forest in temperate and boreal zones. Forest. Ecol. Manage. 2007, 246, 144–154. [Google Scholar]
- Lundström, J.; Öhman, K.; Perhans, K.; Rönnkvist, M.; Gustafsson, L. Cost-effective age structure and geographical distribution of boreal forest reserves. J. Appl. Ecol. 2010, 48, 133–142. [Google Scholar]
- Nilsson, U.; Fahlvik, N. Ekonomisk analys av praktisk produktionsoptimering i gran-planteringar. In Slutrapport för Fiberskogsprogrammet; Bergh, J., Oleskog, G., Eds.; Swedish University of Agricultural Sciences, Southern Swedish Forest Research Centre: Alnarp, Sweden, 2006; pp. 106–129. [Google Scholar]
- Elfving, B. Grundytetillväxtfunktioner för enskilda träd, baserade på data från riksskogstaxeringens permanenta provytor; Swedish University of Agricultural Sciences, Department of Silviculture: Umeå, Sweden, 2004. [Google Scholar]
- Ekö, P.M. A Growth Simulator for Swedish Forests Based on Data from the National Forest Survey (in Swedish with English summary); Swedish University of Agricultural Sciences, Department of silviculture: Umeå, Sweden, 1985; p. 224. [Google Scholar]
- Karlsson, K.; Ulvcroona, T. Field experiment data available for studies of pre-commercial thinning. Skog Trä 2010, 2, 1–33. [Google Scholar]
- Nilsson, U.; Agestam, E.; Ekö, P-M.; Elfving, B.; Fahlvik, N.; Johansson, U.; Karlsson, K.; Lundmark, T.; Wallentin, C. Thinning of Scots pine and Norway spruce monocultures in Sweden—Effects of different thinning programmes on stand level gross and net stem volume production. Stud. Forest. Suec. 2010, 219, 1–46. [Google Scholar]
- Fahlvik, N.; Johansson, U.; Nilsson, U. Skogsskötsel för ökad tillväxt. Faktaunderlag till MINT-utredningen; Swedish University of Agricultural Sciences: Uppsala, Sweden, 2009; p. 116. [Google Scholar]
- Pettersson, F. Predictive Functions for Impact of Nitrogen Fertilization on Growth over Five Years; Skogforsk: Uppsala, Sweden, 1994; p. 56. [Google Scholar]
- Pettersson, F. Predictive Functions for Total Response in Growth to Nitrogen Fertilization, Duration and Distribution over Time; Skogforsk: Uppsala, Sweden, 1994; p. 56. [Google Scholar]
- Rosvall, O.; Wennström, U. Förädlingseffekter för simulering med Hugin i SKA 08; Skogforsk: Uppsala, Sweden, 2008; p. 38. [Google Scholar]
- Larsson-Stern, M. Aspects of Hybrid Larch (Larix × eurolepis Henry) as a Potential Tree Species in Southern Swedish Forestry. Licentiate Thesis, Swedish University of Agricultural Sciences, Southern Swedish Forest Research Centre, Alnarp, Sweden, 2003; p. 28. [Google Scholar]
- Bergh, J.; Linder, S.; Lundmark, T.; Elfving, B. The effect of water and nutrient availability on the productivity of Norway spruce in northern Sweden. Foest. Ecol. Manage. 1999, 119, 51–82. [Google Scholar]
- Bergh, J.; Linder, S.; Bergström, J. The potential production for Norway spruce in Sweden. Forest. Ecol. Manage. 2005, 204, 1–10. [Google Scholar]
- Hägglund, B. Site Index Curves for Norway Spruce in Northern Sweden (in Swedish with English summary); Report 21; Royal College of Forestry, Department of Forest Yield Research: Stockholm, Sweden, 1972; p. 298. [Google Scholar]
- Hägglund, B. Site Index Curves for Norway Spruce in Northern Sweden (in Swedish with English summary); Report 24; Royal College of Forestry, Department of Forest Yield Research: Stockholm, Sweden, 1973; p. 49. [Google Scholar]
- Hägglund, B. Site Index Curves for Norway Spruce in Northern Sweden (in Swedish with English summary); Report 31; Royal College of Forestry, Department of Forest Yield Research: Stockholm, Sweden, 1974; p. 54. [Google Scholar]
- Karlsson, B.; Rosvall, O. Ökad tillgång och användning av förädlade plantor. Slutrapport—Uppdrag om förbättrat växtodlingsmaterial; Skogforsk: Uppsala, Sweden, 2008. [Google Scholar]
- Norfolk, C.J.; Erdle, T.A. Selecting intensive timber management zones as part of a land allocation strategy. Forest. Chron. 2005, 81, 245–255. [Google Scholar]
- Nilsson, U.; Luoranen, J.; Kolström, T.; Örlander, G.; Puttonen, P. Reforestation with planting in northern Europe. Scand. J. Forest. Res. 2010, 25, 283–294. [Google Scholar]
- Ackzell, L.; Elfving, B.; Lindgren, D. Occurrence of naturally regenerated and planted main crop plants in plantations in boreal Sweden. Forest. Ecol. Manage. 1994, 65, 105–113. [Google Scholar]
© 2011 by the authors; licensee MDPI, Basel, Switzerland. This article is an open access article distributed under the terms and conditions of the Creative Commons Attribution license (http://creativecommons.org/licenses/by/3.0/).
Share and Cite
Nilsson, U.; Fahlvik, N.; Johansson, U.; Lundström, A.; Rosvall, O. Simulation of the Effect of Intensive Forest Management on Forest Production in Sweden. Forests 2011, 2, 373-393. https://doi.org/10.3390/f2010373
Nilsson U, Fahlvik N, Johansson U, Lundström A, Rosvall O. Simulation of the Effect of Intensive Forest Management on Forest Production in Sweden. Forests. 2011; 2(1):373-393. https://doi.org/10.3390/f2010373
Chicago/Turabian StyleNilsson, Urban, Nils Fahlvik, Ulf Johansson, Anders Lundström, and Ola Rosvall. 2011. "Simulation of the Effect of Intensive Forest Management on Forest Production in Sweden" Forests 2, no. 1: 373-393. https://doi.org/10.3390/f2010373