Assessing Seven Decades of Carbon Accumulation in Two U.S. Northern Hardwood Forests

Abstract
: Forests play a key role in the global carbon cycle, and programs aimed at mitigating greenhouse gas emissions through the protection and enhancement of forest carbon stocks are growing in number. Adding greenhouse gas mitigation as a management objective presents managers with a considerable challenge, because data and guidelines are scarce. Long-term inventory datasets have the potential to serve as a useful resource, providing data on carbon accumulation over time, as well as offering insight on strategies for managing forests for the objective of climate mitigation in the face of changing climate and disturbance regimes. We present long-term estimates of carbon accumulation developed from biometric measurements from two northern hardwood forests in the northeastern USA. The Bartlett Experimental Forest in central New Hampshire, USA, stored an estimated net average annual 0.53 tC/ha/yr between 1932–2001, for an increase of 50% in carbon stock per unit area; there were significant differences in accrual rates between age classes (38% for old unmanaged stands and 78% for younger unmanaged stands). The Kane Experimental Forest in northwestern Pennsylvania, USA, exhibited a 140% increase in carbon stored per unit area between 1932 and 2006, with an average annual accumulation rate of 0.89 tC/ha/yr. While both forests have experienced management activity and natural disturbances and differ in species composition, the average age of the forests is an important factor driving the differences in net accumulation rates.1. Introduction
The role of forests in the global carbon cycle continues to gain increased attention in the scientific and policy communities. A number of recent reports [1-3] present estimates of forest carbon stocks from various regions around the world, and entities ranging from private corporations to non-governmental organizations are implementing projects designed to mitigate greenhouse gas emissions by protecting and enhancing forest carbon stocks (for a searchable database of planned and active projects, see the Forest Carbon Portal [4]). The importance of forests as a climate mitigation tool is highlighted by the REDD+ Programme of the United Nations (Reducing Emissions from Deforestation and Forest Degradation [5]).
The future mitigation potential of forests is not well characterized: forest carbon stock is a result of a number of factors such as weather variability, site conditions, successional processes, and natural and anthropogenic disturbances. Projections based on growth and yield models necessarily include the assumption that future growth will be similar to past growth, a premise that may not be warranted in the face of potential climate change and multiple stressors [6]. Much insight has been gained through the use of process-based forest simulators, but these models may not accurately reflect the myriad interactions between factors that influence forest growth, or account for possible alterations of ecosystem processes from increasing carbon dioxide concentrations and the effects of climate change. Recent work, however, has begun to explore the effects on the magnitude and direction of forest carbon stock changes under scenarios representing a variety of possible future conditions [7].
Long-term measurement records, where available, provide data on forest carbon accumulation over time and may help managers assess the climate mitigation potential of their lands, devise management strategies to maintain or increase that potential, and suggest tactics for management geared toward adaptation to climate change. While forest dynamics have been well studied, such research has often been geared toward characterizing stand development and successional changes and often relies heavily on chronosequence designs. Examples of long-term experiments where the original inventory plots have been re-surveyed are few and often do not include estimates of biomass or volume, though detailed information on successional processes is included [8-10]. A notable exception is Spetich and Parker [11], who report changes in biomass in an old-growth deciduous forest over six decades based on data from repeated measurements of permanent sample plots. At a national level, relatively long-term estimates of forest carbon accumulation have been constructed using a combination of national forest inventory data and models. However, sampling designs in the surveys may have been altered over time or portions of the inventory may be the result mostly of modeling based on initial conditions calculated from current data, complicating the ability to draw inferences at finer scales [12-15]. However, the results have proven useful for national planning and reporting purposes and the detection of regional trends.
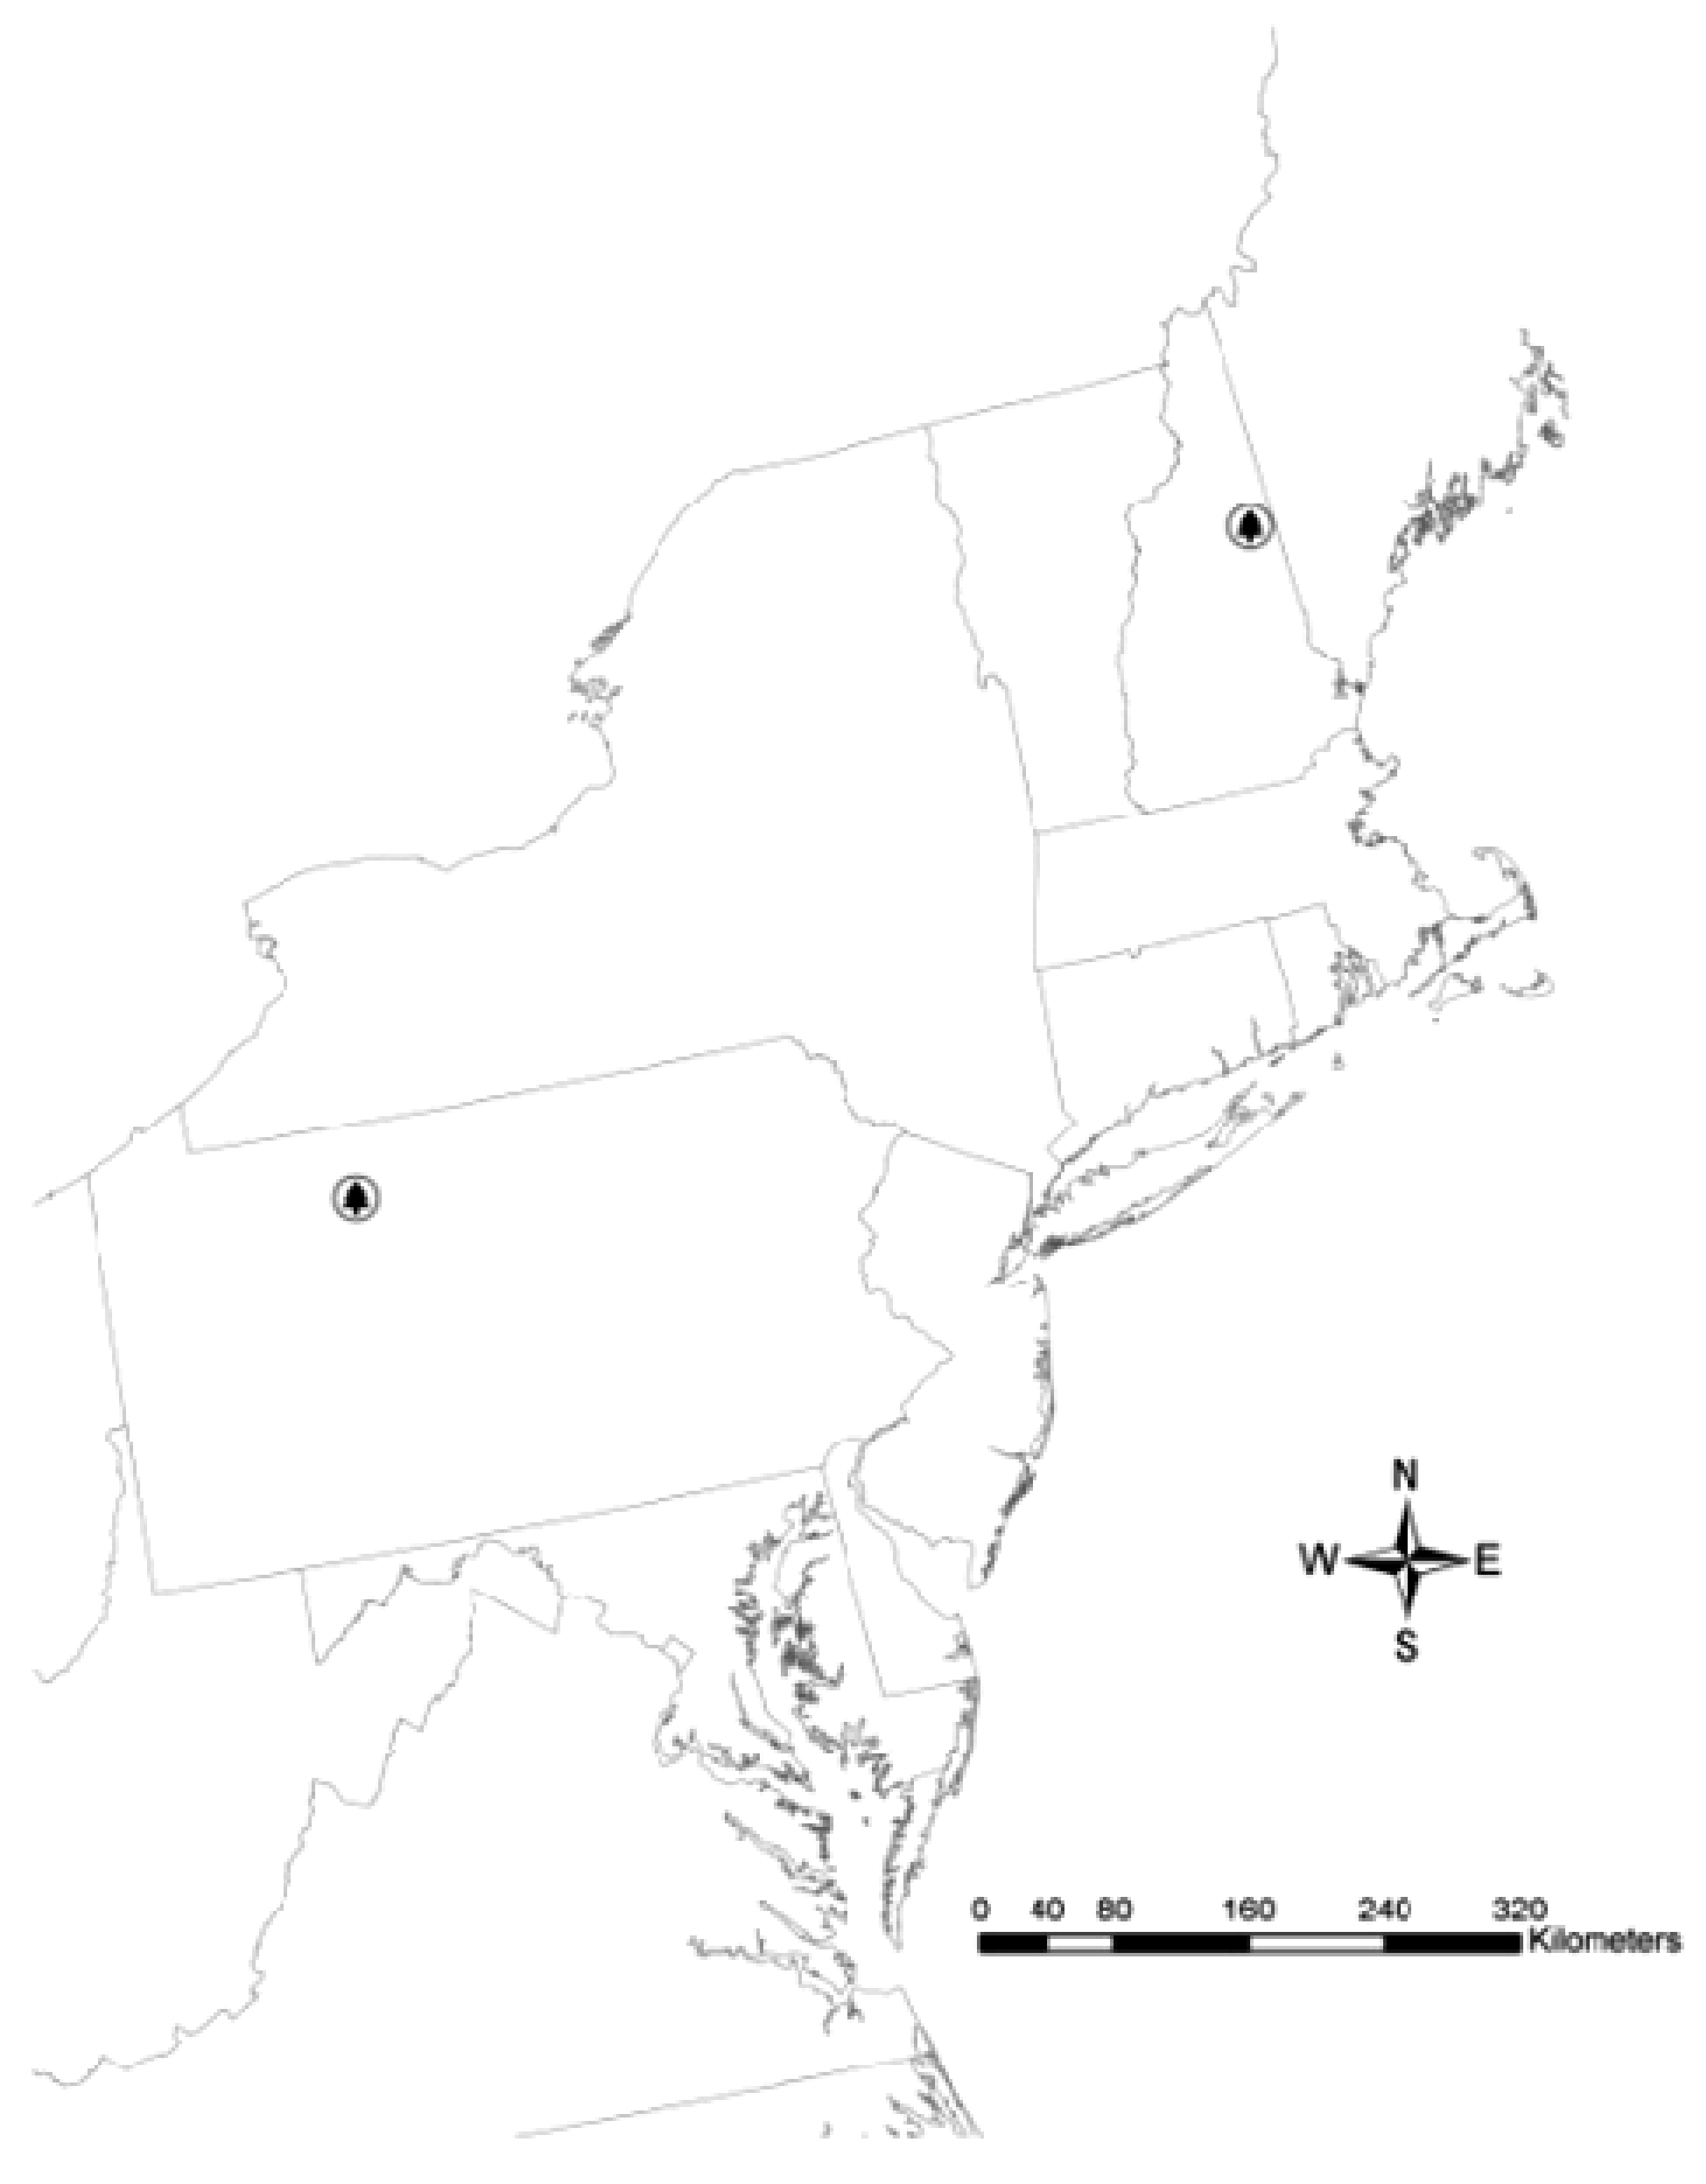
The USDA Forest Service maintains a network of Experimental Forests and Ranges [16]. Many of these areas are the site of long-term research, testing a variety of management practices, and locations were chosen to represent important forest types in each region. We examined the available records, and chose those forests which had a long history of measurements on a systematic grid, and which were comparable. This study utilizes data from two forests meeting these criteria in the northeastern USA: the Bartlett Experimental Forest (BEF) in central New Hampshire, and the Kane Experimental Forest (KEF) in northwestern Pennsylvania (Figure 1). These forests present the opportunity for a detailed examination of the response of forests to the extensive harvesting that occurred at the turn of the 20th century across the landscape of the northeastern USA. The objectives of this study are to: (1) develop empirically based estimates of aboveground biomass carbon stocks and long-term accumulation rates; and (2) explore the data for patterns and trends that can provide insight on managing northern hardwoods with climate mitigation added to the list of more traditional management objectives.
2. Experimental Section
The Bartlett Experimental Forest (BEF) is located in the White Mountains of central New Hampshire, USA. BEF was established in 1931, and was chosen because it represented the “typical” northern hardwood conditions found in the New England region. The northern hardwood type currently covers 13.6 million hectares in the northeastern USA, with 914 million metric tons of carbon in aboveground live trees, about 38% of the aboveground live tree carbon in the northeast (CarbonOnLine Estimator, [17]). While many of the stands are northern hardwoods, mixed hardwood/softwood stands are present, as are hemlock-dominated softwood stands. Basic site details are given in Table 1. At the time of the first available measurements, BEF was 1052 ha; the forest has since been expanded in area to meet ongoing research needs. In years 1931–1932 a systematic grid of square inventory plots, generally 0.1 ha in size and intended to be permanent, was established and all stems >3.8 cm diameter at breast height (d.b.h.) were tallied by species. Individual stems were not marked and numbered. The plots were re-measured in 1932, 1991, and 2002. In this study, data from 424 of the 444 available plots were used; this is the subset of plots that were measured in both 1932 and 2002 (and represents a systematic sample; scattered plots were not re-measured in 2002 for operational reasons). Of these plots, 46% were in stands that had not been subjected to widespread harvesting (though some selective cutting did occur) by the time BEF was established, and were considered to be all-aged primary forests. The remainder of the plots were located in stands that had been harvested in the 1890's, and were largely even-aged and approximately 40 years old at the time the inventory plots were installed. Over the years, about 55% of the BEF area has had various silvicultural treatments applied ranging from single tree selection and thinning to group selection and clearcuts, as designed research activities. About 45% of the forest area has received no treatment since the Forest was established. Major natural disturbance events include a hurricane in 1938 and a widespread outbreak of beech bark disease in the 1940's.
The Kane Experimental Forest (KEF) is located in northwestern Pennsylvania, USA, on the Allegheny Plateau. KEF was established in 1932, and represents the Allegheny hardwood forest, a subtype of northern hardwoods where >25% of basal area is Prunus serotina; Acer rubrum and Acer saccharum also predominate. This forest type has high economic value to the region and produces some of the highest quality black cherry veneer in the world. Basic site characteristics are provided in Table 1 and approximate geographic locations are shown in Figure 1. At the time of the first measurements used in this study, KEF was 703 ha in size and has since been expanded to meet research needs. In 1932 a systematic grid of 0.04 ha square inventory plots was established. Although internal documents indicate the intent was to cover the entire forest with the grid, original data sheets and maps from the 1940's clearly indicate that only the eastern, more disturbed half of the forest was inventoried in 1932 (approximately 57% of the area). All stems >10 cm d.b.h. were tallied by species on the 0.04 ha plot; stems 2.5–10 cm d.b.h. were tallied by species on a 2 m wide strip within the main plot. In 2006 the original permanent inventory plots were re-located and the grid was expanded to cover the entire forest. All stems >2.5 cm d.b.h. were tallied by species, though individual trees were not tagged and marked. Only data from the 75 plots that were tallied in both 1932 and 2006 are used in this study; these correspond to the eastern portion of KEF. At the time that KEF was established, this portion of the forest had been subjected to extensive harvesting, including removals for “chemical wood.” Industries in the area included sawmills as well as tanneries and distillation plants that produced acetic acid and other chemicals from wood. This resulted in areas with near complete removals of most species and diameter classes, because stands were cut for sawtimber, hemlock bark, and distillation feedstock. Records reveal some scattered larger stems, but the majority of the plots were roughly 5–25 years old at the time KEF was established. Since establishment, much of KEF has had treatments applied as part of research studies, varying in intensity from thinning to group selection to clearcutting. Significant natural disturbances include ice storms in 1936 and 1950 and a severe wind event in 2003, as well as long-term moderate to severe grazing pressures from a large population of white-tailed deer. For a detailed history of the Allegheny hardwood forest, see Marquis [18].
For each forest, only data from plots that were measured during the initial tally and the most recent tally were used for computations; records for both forests were kept by plot number, so the exact plots could be matched over time. Biomass was calculated from the inventory records using the generalized biomass equations of Jenkins et al. [19]; these national equations result in consistent estimates across sites, because the same equations are used regardless of geographic region. Biomass was converted to carbon by multiplying by 0.5. Although the equations could provide biomass estimates in coarse roots, this study focuses on only aboveground live tree carbon due to the greater uncertainty and coarser species resolution in the root equations.
3. Results and Discussion
These two study forests were in very different conditions in 1932, at the time they were designated as Experimental Forests. While widespread harvesting was common in both Pennsylvania and New Hampshire, and indeed throughout the eastern USA, the presence of a chemical wood industry in Pennsylvania resulted in a much more complete harvest where small diameter stems were removed. Additionally, intensive harvesting continued somewhat later in time on the Allegheny Plateau than in the White Mountains. Photographs and inventory data reveal that the portion of the KEF for which we have early records was comprised largely of small stems typical of young stands; in 1932 71% of the carbon in aboveground live biomass was contained in stems 2.5–30.2 cm (1–12 in.) d.b.h. (Table 2). For BEF this d.b.h. range represents 52% of aboveground live tree carbon, reflecting the different condition of this forest, which retained many older stands in 1932 and where intensive harvesting ended earlier. Over the seventy years since initial measurements, the forests have developed in a manner that reflects initial conditions, disturbance history, and site quality. The proportion of carbon in small stems (2.5–9.9 cm d.b.h.) has dropped from 18 to 4% at KEF and 8 to 4% BEF, while the proportion in the largest stems (over 45.7 cm d.b.h.) has increased from 6 to 47% at KEF and 13 to 24% at BEF (Table 2). The smaller proportion of carbon in large diameter stems at BEF may be the result of site quality; site index is lower at BEF and topography is generally more rugged.
The distribution of carbon across species has also changed over time, reflecting successional processes and disturbance regimes. Notable changes at KEF, as shown in Table 3, include a doubling of the proportion of carbon in red maple (Acer rubrum) and a 50% reduction in the proportion in sugar maple (Acer saccharum). Sugar maple decline is a concern on the Allegheny Plateau, and several drought years led to increased mortality of this species [20]. At BEF, the proportion of carbon in early successional species also declined (Table 3), while that of Eastern hemlock (Tsuga canadensis) increased. Despite outbreaks of beech bark disease in the 1940's, the proportion of carbon in American beech (Fagus grandifolia) biomass does not show a large decrease, dropping from 33 to 29%.
Recent investigations at BEF based on the data set used here have demonstrated similar patterns, and concluded that changes in species composition at BEF reflect successional processes rather than a response to natural or anthropogenic disturbances, including management treatments [21,22]. It is also worth noting that over the roughly 70-year period the number of species listed in the inventory records decreased slightly for both forests, with white ash (Fraxinus americana) no longer recorded on measurement plots at KEF, and gray birch and black ash (Betula populifolia and Fraxinus nigra) lacking in the most recent plot tallies from BEF.
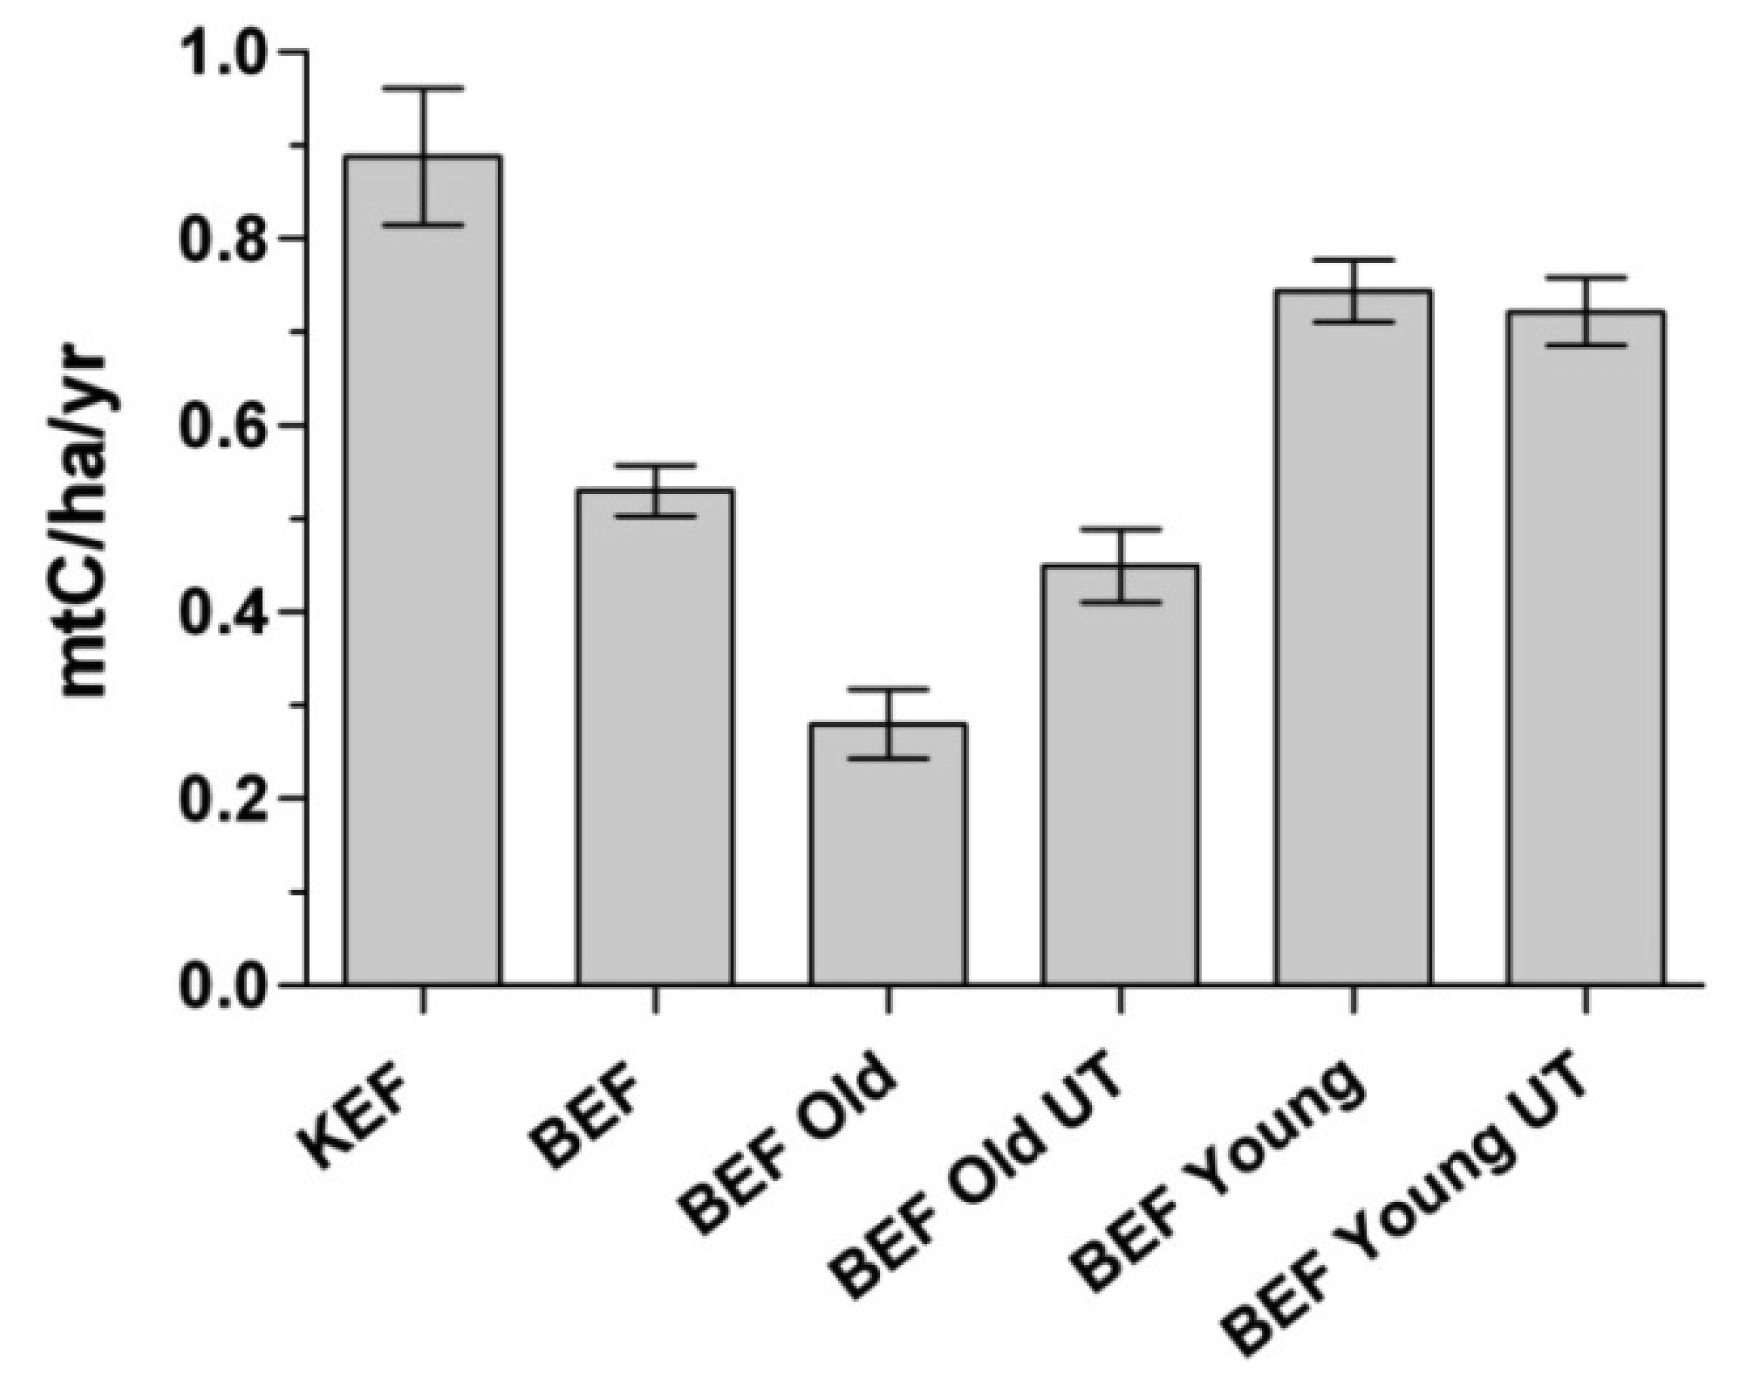
As expected from the initial characteristics of each forest, KEF and BEF had different carbon densities (carbon per ha) at the time of establishment and have exhibited different rates of carbon accumulation, although both forests have similar carbon densities at present (Table 4). KEF had a net gain of 65 tC/ha during the period from 1932–2006, for an increase of 140% and a rate of average annual change of 0.89 tC/ha/yr. From 1932–2002 BEF showed a net gain of 38 tC/ha, or about a 50% increase and an average annual change of 0.53 tC/ha/yr. These values include all plots that were tallied at both points in time; plots were not separated into groups based on age or treatment history. As shown in Table 2, these two forests represented different stages of development, and the differences in carbon accumulation rates are likely the consequence of the predominance of younger age classes at KEF, as well as differences in site quality. Since BEF was comprised of stands that were primary forest (that is, predominantly undisturbed) as well as stands that were in the early phase of the understory re-initiation stage of development at the time of the first measurements, we can use maps and other records to group inventory records and further explore the influence of stand age on aboveground live carbon stocks and stock change rates. In 1932, the old stands at BEF had a mean carbon density of 88 tC/ha, while the young (∼40 years old at time of initial measurement) stands contained about 67 tC/ha (Table 4). Comparing rates of average annual change, the young stands accumulated 0.74 tC/ha/yr, a value closer to that shown at KEF, while the old stands added 0.28 tC/ha/yr. The continued accumulation of carbon in the older stands studied here is consistent with the results of Lichstein et al. [23] who found that in the absence of major disturbance aboveground biomass in forests generally stabilized or increased during the later stages of stand development.
At both experimental forests a number of management treatments of varying intensity were applied to numerous stands. At BEF, we can remove the influence of past management actions by calculating carbon stocks for young and old stands that have not received any silvicultural treatments. Figure 2 shows the rates of average annual carbon accumulation for the BEF inventory plots that were old growth or young in 1932, as well as the rates for old plots and young plots that have been untreated since 1932. The difference in rates of carbon accumulation between old and young untreated plots, while not as large as the overall difference between young and old plots, is still significant (p < 0.0001, Mann-Whitney test), suggesting that stand age is a key factor in carbon accumulation. Unmanaged plots that were old in 1932 had a 38% increase in carbon stocks over 70 years, while young untreated plots increased by 78%. Using the 1991 data we can compare rates from 1991–2001 for the untreated areas; younger plots increased carbon stocks by 5.5% while older plots had a 1% increase for the same time period. While there are mixed results in the literature on the role of older forests as active carbon sinks, this study is not intended to specifically address that question. However, these results indicate that the primary forest stands at BEF have continued to accumulate carbon over time.
The average annual rates of carbon accumulation shown in Figure 2 are lower than shorter-term estimates for northern hardwood types, e.g., Barford et al. [24]. There are often differences between long and short-term measurements, since inventory-based approaches yield estimates of net carbon accumulation, which over long time periods reflect all of the disturbances and climatic variability that have occurred. While Barford et al. [24] report a carbon accumulation rate of 1.6 t/ha/yr for a northern hardwood forest in Massachusetts based on biometric measurements over an eight year period, Spetich and Parker [11] found that an oak-hickory forest in Indiana stored carbon at an average rate of 0.4 t/ha/yr over 60 years and Johnson and Strimbeck [25] report an average carbon accumulation rate of 0.89 t/ha/yr over 33 years in northern hardwood stands in Vermont. These results illustrate that both short and long-term studies are necessary to develop the clear understanding of forest carbon dynamics necessary to manage these sinks to their full potential.
4. Conclusions
The long-term data presented here are site-specific illustrations of the phenomenon of recovery from widespread intensive harvesting that characterizes the larger landscape of the region. Both forests have demonstrated a significant net increase in live aboveground biomass carbon over the past seventy years, with a 140% increase in carbon per area at KEF and a 50% increase at BEF. These results parallel those shown at the regional and national scales; forests are a major carbon sink in North America, with estimates for 2008 showing that forest ecosystems in the conterminous USA sequestered carbon at a rate of 191.8 million metric tons per year [26]. This figure is even larger if carbon in harvested wood products is included. The strength of the sink is due to increases in carbon density per unit area as forests mature, as well as gains in the amount of forestland converted from prior land uses; in the northeastern USA forestland has increased by 43% between 1907–1997 [27].
While both forests have experienced management activity and natural disturbances and differ in species composition, the average age of the forests at the time of the first measurements is an important factor driving the differences in net accumulation rates. The study sites demonstrate typical patterns of forest development, with an increasing proportion of biomass in the larger diameter classes over time. This basic pattern of forest dynamics, shown here at a local level, mirrors the larger picture present across the landscape. With a high proportion of larger stems, older stands represent a considerable standing stock of sequestered carbon while young fast-growing stands have a high rate of carbon accumulation but low stocks. The current state of the forest carbon sink in the northeast USA reflects these development processes and the legacy of prior land use. As forests across the region transition out of the recovery phase, managers and policymakers face considerable challenges in addressing the objective of managing for greenhouse gas mitigation in a landscape where forest carbon stocks are high but rates of change are slowing.


| Bartlett Experimental Forest | Kane Experimental Forest | |
|---|---|---|
| Location | Carroll County, NH | Elk County, PA |
| Coordinates | 44°2′39″ N; 71°9′56″ W | 41°35′52″N; 78°45′58″W |
| Date established | 1932 | 1932 |
| Forest type | Northern hardwood | Allegheny hardwood |
| Area (at time of establishment) | 1052 ha | 703 ha |
| Average annual temperature | 6.9 °C | 6.1 °C |
| Average annual precipitation | 1270 mm | 1140 mm |
| Elevation | 207–914m | 549–640 m |
| Soil orders | Spodosols | Inceptisols, Ultisols |
| Site index (50 years) | Acer saccharum; 19.8 m (65 ft) | Prunus serotina; 22.8 m (75 ft) |
| Inventory design | Systematic; 0.1 ha square plots | Systematic; 0.04 ha square plots |
| Natural disturbance history | 1938 hurricane; 1940's beech bark disease | Ice storms: 1936, 1950; wind event 2003 |
| Bartlett Experimental Forest | Kane Experimental Forest | |||
|---|---|---|---|---|
| 1932 | 2002 | 1932 | 2006 | |
| 2.5–9.9 cm (1–3.9 inches) | 8% | 4% | 18% | 4% |
| 10–30.2 cm (4–11.9 inches) | 44% | 30% | 53% | 19% |
| 30.3–45.7 cm (12–18 inches) | 35% | 42% | 24% | 30% |
| >45.7 cm (>18 inches) | 13% | 24% | 6% | 47% |
| Bartlett Experimental Forest | Kane Experimental Forest | ||||
|---|---|---|---|---|---|
| 1932 | 2002 | 1932 | 2006 | ||
| Fagus grandifolia | 33% | 29% | Prunus serotina | 27% | 32% |
| Betula alleghaniensis | 16% | 8% | Acer rubrum | 14% | 28% |
| Acer saccharum | 12% | 11% | Acer saccharum | 14% | 7% |
| Acer rubrum | 12% | 17% | Fagus grandifolia | 13% | 12% |
| Betula papyrifera | 9% | 4% | Tsuga canadensis | 11% | 14% |
| Tsuga canadensis | 7% | 18% | Betula lenta, B. alleghaniensis 1 | 19% | 5% |
| Picea rubens | 5% | 6% | Prunus pensylvanica | 0.7% | 0.3% |
| Fraxinus americana | 2% | 3% | Liriodendron tulipifera | 0.6% | 1.3% |
| Populus tremuloides | 1.5% | Magnolia acuminata | 0.4% | 0.4% | |
| Abies balsamea | 0.8% | Acer pensylvanicum | 0.2% | ||
| Pinus strobus | 1.7% | ||||
| Acer pensylvanicum | 0.7% | ||||
| 98.3% | 98.4% | 99.7% | 99.9% 2 | ||
1B. lenta and B. alleghaniensis were tallied separately in 1932, but the two species were not differentiated in the 2006 inventory, and so have been combined for both years;2Totals may not sum exactly due to rounding.
| Bartlett Experimental Forest | Kane Experimental Forest | |||
|---|---|---|---|---|
| 1932 | 2002 | 1932 | 2006 | |
| Overall | 77 (1.3) | 114 (1.6) | 46 (1.7) | 111 (5.5) |
| 424 | 424 | 75 | 75 | |
| Old stands (in 1932) | 88 (1.5) | 107 (2.5) | ||
| 197 | 197 | |||
| Young stands (in 1932) | 67 (1.8) | 119 (2) | ||
| 227 | 227 | |||
Acknowledgments
The author would like to thank Linda Heath, Susan Stout, and Bill Leak for their helpful feedback on the manuscript, and Cori Weldon, Harry Steele, Bill Leak, and Mariko Yamasaki for assistance with historic inventory records. Special thanks to Elizabeth LaPoint for preparing the map. The author would like to thank three anonymous reviewers for their timely and helpful comments.
References
- Dixon, R.K.; Brown, S.; Houghton, R.A.; Solomon, A.M.; Trexler, M.C.; Wisniewski, J. Carbon pools and flux of global forest ecosystems. Science 1994, 263, 185–190. [Google Scholar]
- Malhi, Y.; Baldocchi, D.D.; Jarvis, P.G. The carbon balance of tropical, temperate, and boreal forests. Plant Cell Environ. 1999, 22, 715–740. [Google Scholar]
- Keith, H.; Mackey, B.G.; Lindenmayer, D.B. Re-evaluation of forest biomass carbon stocks and lessons from the world's most carbon-dense forests. Proc. Natl. Acad. Sci. USA 2009, 106, 11635–11640. [Google Scholar]
- Forest Carbon Portal. Washington DC USA, 2011. Available online: http://www.forestcarbonportal.com/projects (accessed on 22 June 2011).
- UN REDD Programme. 2011. Available online: http://www.un-redd.org/ (accessed on 22 June 2011).
- Galik, C.S.; Jackson, R.B. Risks to forest carbon offset projects in a changing climate. Forest Ecol. Manag. 2009, 257, 2209–2216. [Google Scholar]
- Metsaranta, J.M.; Dymond, C.C.; Kurz, W.A.; Spittlehouse, D.L. Uncertainty of 21st century growing stocks and GHG balance of forests in British Columbia, Canada resulting from potential climate change impacts on ecosystem processes. Forest Ecol. Manag. 2011, 262, 827–837. [Google Scholar]
- Whitney, G.G. Fifty years of change in the arboreal vegetation of Heart's Content, an old-growth hemlock-white pine-northern hardwood stand. Ecology 1984, 65, 403–408. [Google Scholar]
- Woods, K.D. Long-term change and spatial pattern in a late-successional hemlock-northern hardwood forest. J. Ecol. 2000, 88, 267–282. [Google Scholar]
- Pinheiro, N.R.; Goebel, P.C.; Hix, D.M. Forty-two years of change in an old-growth and second-growth Beech-Maple forest of north central Ohio. General Technical Report NRS-P-24. Proceedings of 16th Central Hardwood Forest Conference; Jacobs, D.F., Michler, C.H., Eds.; US Department of Agriculture, Forest Service, Northern Research Station: Newtown Square, PA, USA, 2008; pp. 202–212. [Google Scholar]
- Spetich, M.A.; Parker, G.R. Distribution of biomass in an Indiana old-growth forest from 1926–1992. Am. Midl. Nat. 1998, 139, 90–107. [Google Scholar]
- Kurz, W.A.; Apps, M.J. A 70-year retrospective analysis of carbon fluxes in the Canadian forest sector. Ecol. Appl. 1999, 9, 526–547. [Google Scholar]
- Smith, J.E.; Heath, L.S. Carbon stocks and projections on public forestlands in the United States, 1952–2040. Environ. Manag. 2004, 33, 433–442. [Google Scholar]
- Liski, J.; Lehtonen, A.; Palosuo, T.; Peltoniemi, M.; Eggers, T.; Muukkonen, P.; Makipaa, R. Carbon accumulation in Finland's forests 1922–2004—An estimate obtained by combination of forest inventory data with modelling of biomass, litter and soil. Ann. Forest Sci. 2006, 63, 687–697. [Google Scholar]
- Rautiainen, A.; Wernick, I.; Waggoner, P.E.; Ausubel, J.H.; Kauppi, P.E. A national and international analysis of changing forest density. PLoS one 2011, 6, e19577. [Google Scholar]
- Adams, M.B.; Loughry, L.; Plaugher, L. Experimental forests and ranges of the USDA Forest Service; General Technical Report NE-321; US Department of Agriculture, Forest Service, Northern Research Station: Newtown Square, PA, USA, 2004. [Google Scholar]
- Van Deusen, P.; Heath, L.S. COLE web applications suite. 2011. Available online: http://www.ncasi2.org/COLE/ (accessed on 22 June 2011). [Google Scholar]
- Marquis, D.A. The Allegheny Hardwood Forests of Pennsylvania; General Technical Report NE-15; US Department of Agriculture, Forest Service, Northeast Forest Experiment Station: Broomall, PA, USA, 1975. [Google Scholar]
- Jenkins, J.C.; Chojnacky, D.C.; Heath, L.S.; Birdsey, R.A. National-scale biomass estimators for United States tree species. Forest Sci. 2003, 49, 12–35. [Google Scholar]
- Horsley, S.B.; Long, R.P.; Bailey, S.W.; Hallett, R.A.; Hall, T.J. Factors associated with the decline disease of sugar maple on the Allegheny Plateau. Can. J. Forest Res. 2000, 30, 1363–1378. [Google Scholar]
- Leak, W.B.; Yamasaki, M. Seventy-Year Record of Changes in the Composition of Overstory Species by Elevation on the Bartlett Experimental Forest; Research Paper NRS-13; US Department of Agriculture, Forest Service, Northern Research Station: Newtown Square, PA, USA, 2010. [Google Scholar]
- Leak, W.B.; Smith, M.-L. Sixty years of management and natural disturbance in a New England forested landscape. Forest Ecol. Manag. 1996, 81, 63–73. [Google Scholar]
- Lichstein, J.W.; Wirth, C.; Horn, H.S.; Pacala, S.W. Biomass chronosequences of United States forests: Implications for carbon storage and forest management. In Old Growth Forests: Function, Fate, and Value; Wirth, C., Gleixner, G., Heimann, M., Eds.; Springer: Berlin, Germany, 2009; pp. 301–341. [Google Scholar]
- Barford, C.C.; Wofsy, S.C.; Goulden, M.L.; Munger, J.W.; Pyle, E.H.; Urbanski, S.P.; Hutrya, L.; Saleska, S.R.; Fitzjarrald, D.; Moore, K. Factors controlling long- and short-term sequestration of atmospheric CO2 in a mid-latitude forest. Science 2001, 294, 1688–1691. [Google Scholar]
- Johnson, A.H.; Strimbeck, G.R. Thirty-three year changes in above- and below-ground biomass in northern hardwood stands in Vermont. General Technical Report NE-214. Proceedings of 1995 Meeting of the Northern Global Change Program, Pittsburgh, PA, USA, 14–16 March 1995; Hom, J., Birdsey, R.A., O'Brian, K., Eds.; US Department of Agriculture, Forest Service, Northeastern Forest Experiment Station: Radnor, PA, USA, 2008; pp. 169–174. [Google Scholar]
- Heath, L.S.; Smith, J.E.; Skog, K.E.; Nowak, D.J.; Woodall, C.W. Managed forest carbon estimates for the US greenhouse gas inventory, 1990–2008. J. Forest 2011, 109, 167–173. [Google Scholar]
- Birdsey, R.A.; Lewis, G.M. Current and historical trends in use, management, and disturbances of US forestlands. In The Potential of US Forest Soils to Sequester Carbon and Mitigate the Greenhouse Effect; Kimble, J.M., Heath, L.S., Birdsey, R.A., Lal, R., Eds.; CRC Press: New York, NY, USA, 2003; pp. 15–34. [Google Scholar]
- Conflict of Interest: The author declares no conflicts of interest.
© 2011 by the authors; licensee MDPI, Basel, Switzerland. This article is an open access article distributed under the terms and conditions of the Creative Commons Attribution license (http://creativecommons.org/licenses/by/3.0/).
Share and Cite
Hoover, C.M. Assessing Seven Decades of Carbon Accumulation in Two U.S. Northern Hardwood Forests. Forests 2011, 2, 730-740. https://doi.org/10.3390/f2030730
Hoover CM. Assessing Seven Decades of Carbon Accumulation in Two U.S. Northern Hardwood Forests. Forests. 2011; 2(3):730-740. https://doi.org/10.3390/f2030730
Chicago/Turabian StyleHoover, Coeli M. 2011. "Assessing Seven Decades of Carbon Accumulation in Two U.S. Northern Hardwood Forests" Forests 2, no. 3: 730-740. https://doi.org/10.3390/f2030730