Potential Trade-Offs Between Nature-Based Tourism and Forestry, a Case Study in Northern Finland

Abstract
: Forestry, as a large industry, has significant impacts on the quality of nature-based tourism landscapes in boreal forests. In Finland, the rapid growth of nature-based tourism has expanded outdoor recreation activities from protected areas into timber production forests; this is particularly so in northern Finland. This paper focuses on assessing balanced local net impacts of three alternative land-use scenarios, in which the level of integration between nature-based tourism (NBT) and traditional forestry is varied. The study is located in northern Finland in the area between two top-rated tourist resorts, Ylläs and Levi. The results of the case study support the idea of an eligible integration between NBT and forestry, which takes into account scenic qualities of forested landscapes by restricting traditional management practices. In our case, the increased number of tourists (due to a more attractive forest environment) offset the losses accrued in forestry (due to restricted forest management).1. Introduction
Forests in general provide many functions, producing, e.g., recreational services [1,2] timber [3], biodiversity [4] and carbon sinks [5]. Decisions concerning the management of forests unavoidably involve trade-offs between these alternative uses. Forested landscapes provide policymakers as well as practitioners multiple management objectives that include the production of an array of both marketed goods and non-marketed ecosystem services, forest externalities [6]. Nature-based tourism, as an example of forest externality, has an increasing role in Finnish Lapland. Nature-based tourism is a rather wide concept that covers activities that people do while on holiday and which focus on engagement with nature and usually includes an overnight stay. The nature experiences offered within program services may contain motorized or non-motorized activities and include various types of natural environments, often combined with knowledge of local cultures [7-11]. The trade-off between tourism use and timber production in this study deals with all year-round tourism. The various types of forest-based tourism activities (walking, hiking, mounting-biking, cross country skiing, snow shoeing, husky and reindeer safaris) are less influenced by forest management in winter due to snow cover but affect particularly regeneration cuttings to decrease recreational and scenic values of forest environments in summer [11]. Most people use the recreation and hiking trails for different kind of activities in winter and summer. Therefore, the quality of the forest environment along the trails as well as long distance views seen from the trail and from viewing points needs to be addressed while enhancing the quality of the forest environment for recreation and nature-based tourism [12].
A deeper understanding of synergies and conflicts between nature-based tourism and forestry are needed in land-use planning and natural resource management. Moreover, it is important to conduct assessments that reveal the trade-offs between alternative land-use policies with respect to the effects on the local economy.
The demand for nature-based tourism has created new economic opportunities within regions rich in natural amenities, such as northern Europe. In Finnish Lapland, tourism is already as important employer providing approximately 4,300 man-years per annum [7,8]. Therefore, nature-based tourism in both of its forms, i.e., non-consumptive and consumptive tourist activity [1], has an important role in tourism in Finnish Lapland [7], especially in the municipalities with large tourist resorts. Although tourism has been growing fast, traditional forestry concentrating on timber production still plays a crucial role in Finnish Lapland, generating a gross revenue worth approximately 220 million euro and providing 3,500 man-years per annum [8]. The total impact of tourism in Finnish Lapland encompasses 377 million euro of gross revenue per annum [8]. The position of tourism sector in Finnish Lapland resembles many other areas around the world with peripheral location in relation to national centers [9,13].
Besides tourism entrepreneurs, private land owners as well as the government make up an important part of the supply of nature-based tourism in the Nordic countries. Private landowners are often encouraged by governmental authorities to diversify into tourism instead of agricultural or forestry activities [14]. In Lapland, the state is typically the key landowner responsible for providing most of the protected or other nature areas with infrastructure for outdoor recreation and tourism. The relatively fast development of tourism resorts in Finnish Lapland has expanded tourism use from protected areas into timber production forests; in turn this has created the demand to modify current forest management regimes aimed mainly at timber production.
As landscape quality is one of the pull factors of Nordic nature-based tourism, it is important to understand people's experiences and perceptions of the holiday environment. In nature-based tourism areas, the natural environment needs to meet the expectations of clients. Recreational opportunities located in scenic landscapes form the base for tourism attractions within or near nature-based tourism destinations. In these areas, maintaining or enhancing amenity values of forests may be a key objective to guide forest management decisions [15].
Forestry, as a large industry, has significant impacts on the quality of nature-based tourism landscapes in boreal forests. The landscape preference studies show that traditional forestry management, in particular regeneration practices, have a large impact on landscape values [16-20]. On the other hand, management changes including small-scale management practises may cause loss in timber values and job opportunities, which need to be compensated for with increased income and employment from the tourism sector.
The main focus of this study was to determine how many more tourists per annum would compensate for the loss in annual timber revenues. To achieve the goal we applied the input-output, I-O analysis [21,22] to value the trade-offs between nature-based tourism and traditional forestry. In the calculations we emphasized local effects on (a) value added and (b) employment assessed by regional input-output analysis [22]. The framework consisted of three alternative land-use scenarios, where the level of integration between NBT and forestry was changed. Tree growth, thinning and final cuttings of alternative land-use scenarios were based on stand projections produced by a stand simulator [3,23].
There were three reasons for applying the I-O analysis—despite some of its shortcomings [24]. Firstly, we had the existing input-output tables for Lapland Region. Secondly, there were already suitable model applications of input-output analysis for calculating adequate assessments for the study purpose. Thirdly we focused on local effects, not nationwide welfare analysis. Finally we did not estimate the demand for nature-based tourism as such, rather we evaluated whether the increased number of tourists (due to more attractive forest environment) would be feasible, given the current tourism demand in Lapland.
2. Experimental Section
2.1. Study Area
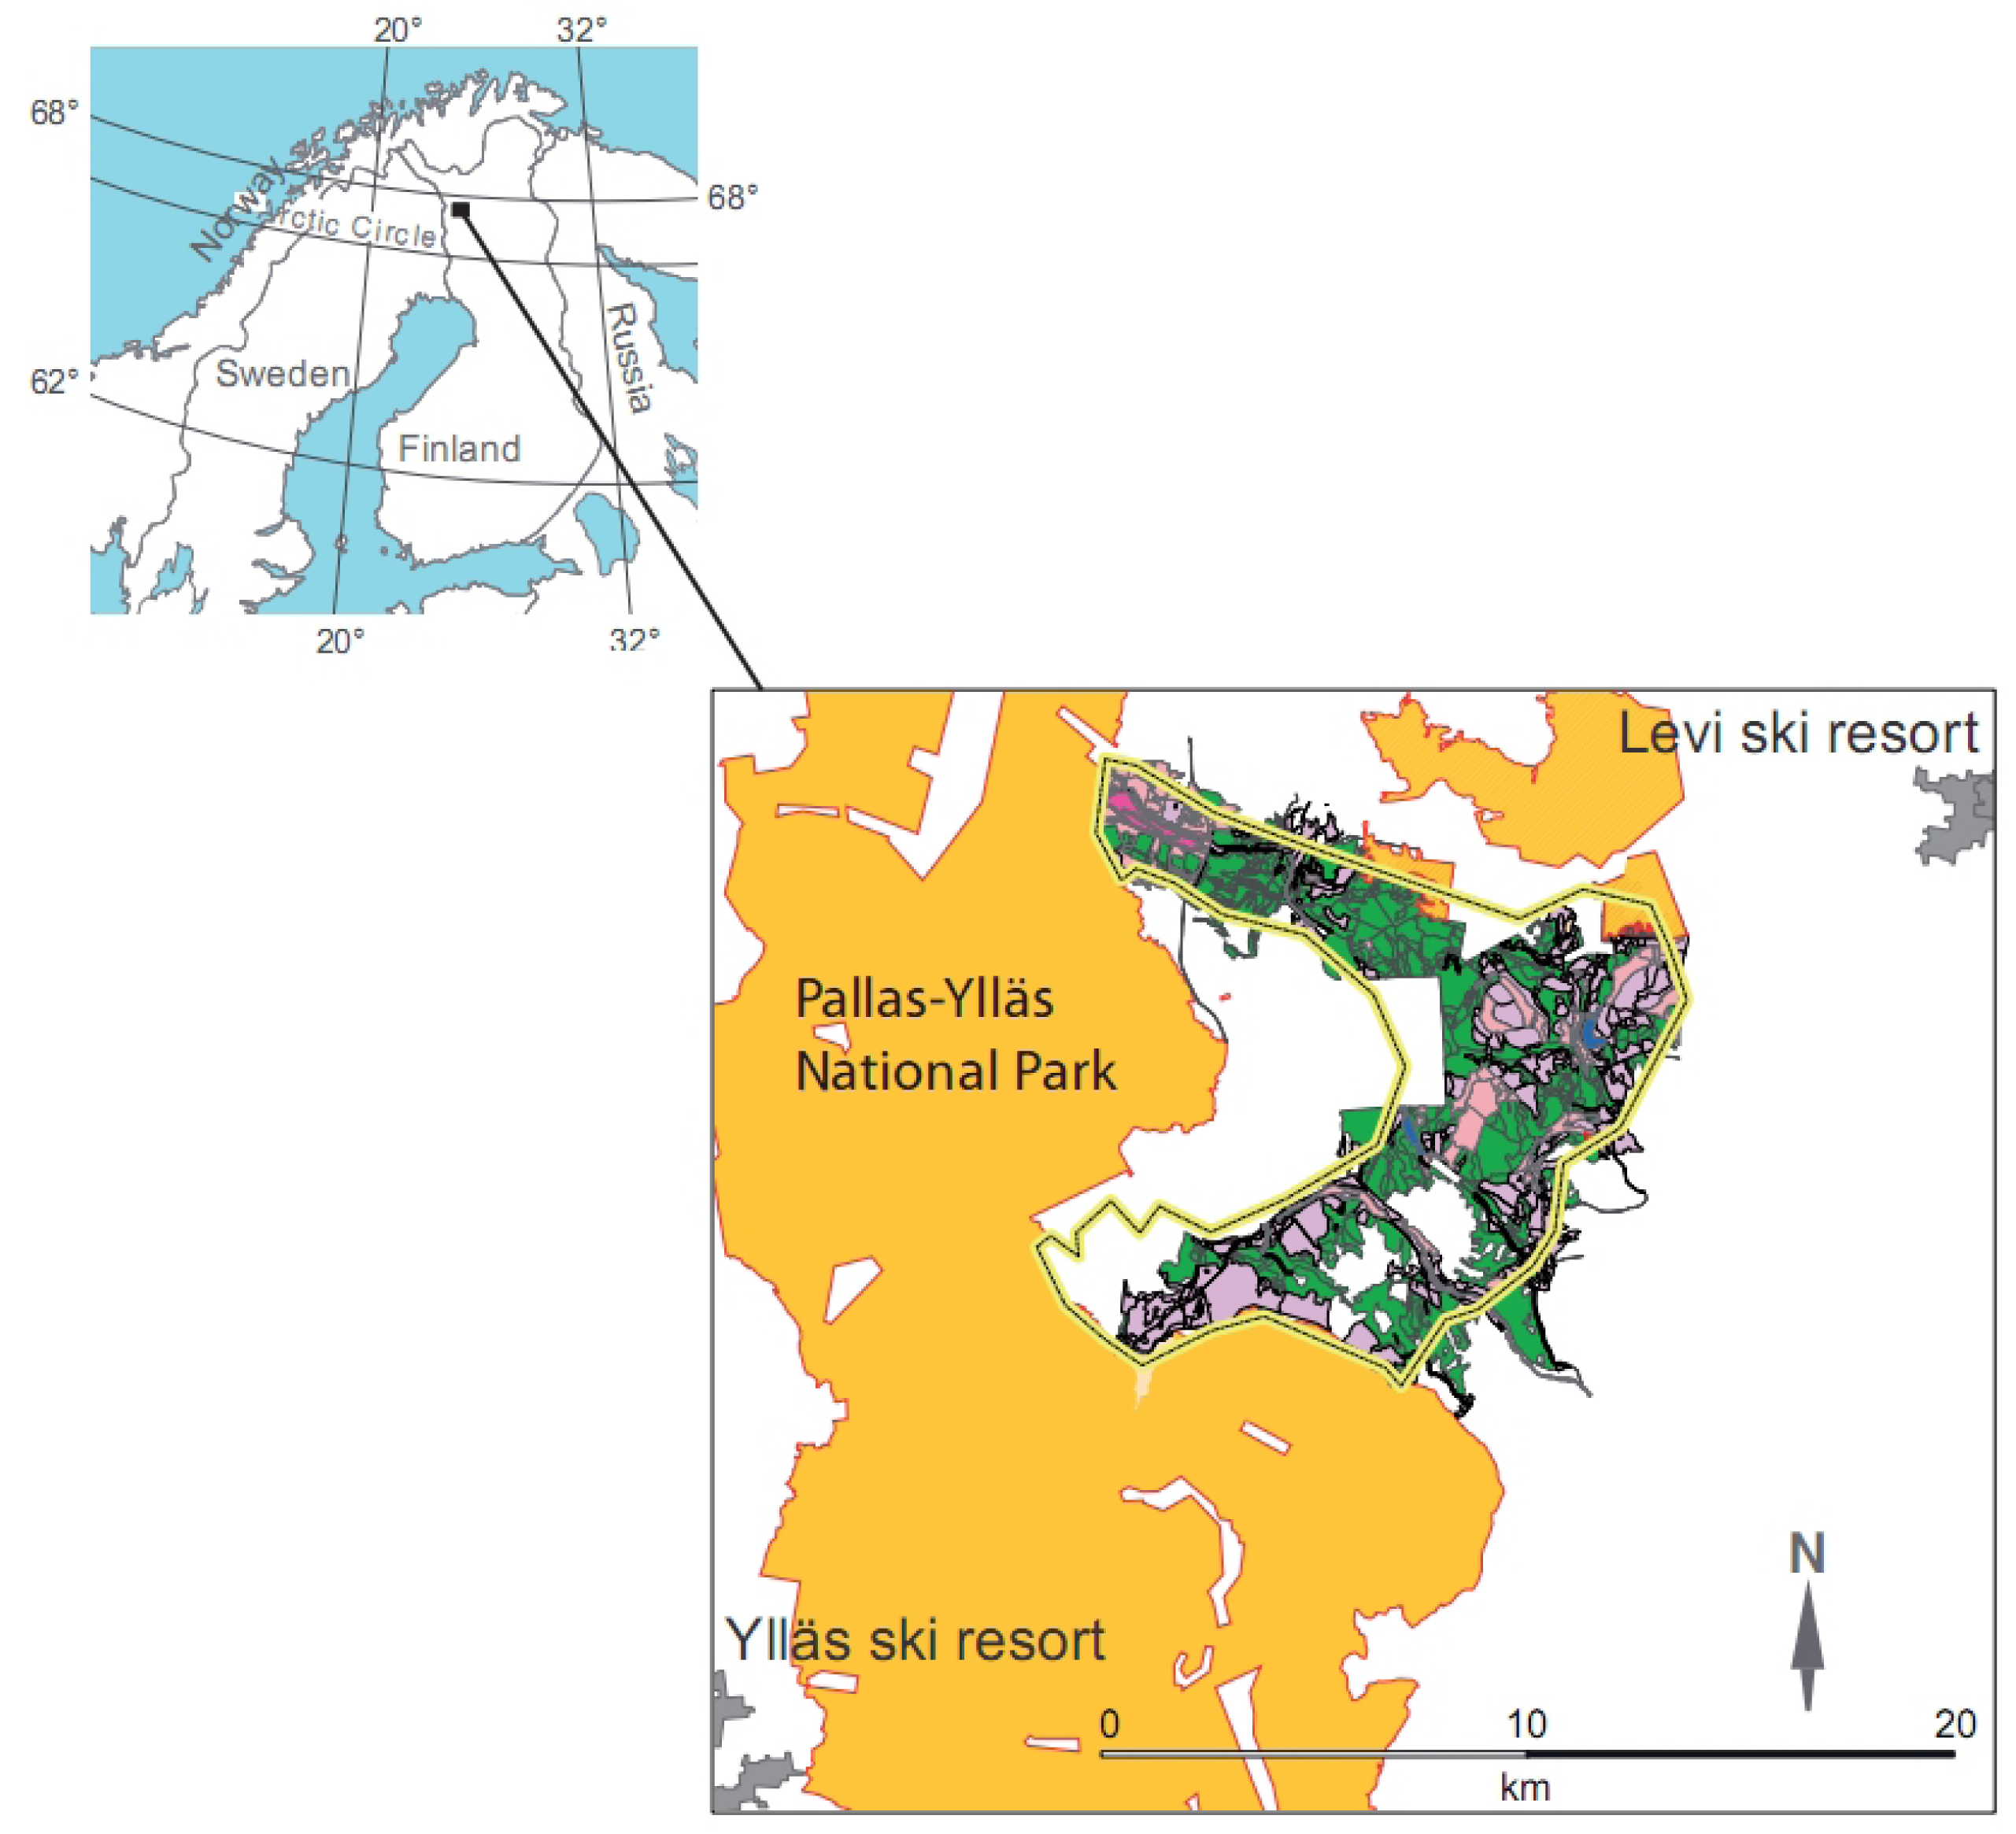
The center of the study area is located within the Kätkä-Aakenus mountain area in Fell Lapland, northern Finland (Figure 1). It consists of 7,800 ha of state owned land area, of which 5,600 ha is forestland between two top-rated tourist resorts, Ylläs and Levi (Figure 1). Kätkä-Aakenus mountain area includes forests, forested hills and mainly barren fells, ranging from 300 to 900 m above sea level. The average annual mean temperature sum is about 760 d.d. (degree days) indicating harsh growth conditions near timberline [25]. Approximately 1,700 ha are pine dominated, 500 ha spruce dominated and the rest of the forest land area consists of mixed stands in which the proportions of coniferous trees (pine or spruce) vary as well as the proportions of broadleaved tree species (mainly birch). Of the total forest land area (5,600 ha), as much as 3,400 ha include various kinds of conserved species which partially limits the forest management of mostly intermediate thinning and final cuttings. Furthermore, 675 ha are strictly conserved by various laws (either national or European Community Statutes). According to the last forest inventory, the total growing stock of the forestland area is app. 381,400 m3, corresponding to an average of 68.5 m3/ha. The total area of recommended immediate final cuttings (mature and old-growth stands) is high, 2,180 ha corresponding to 39% of the total forest land area (Table 1). The above-mentioned characteristics of the forest land area (see Table 1) adequately represent the average growth conditions prevailing in northern Finland [26,27].
The impact of tourism in the Fell Lapland region as a whole is significant. In 2006, there were over 800,000 registered overnights (one third of them being foreigners) together in Ylläs and Levi tourist resorts, and the turnover in the accommodation and restaurant business was 74 million euro [7]. The natural environment within the region provides vast recreational opportunities for tourists. The Ylläs tourist resort is located nearby the extensive Pallas-Ylläs National Park, which is the most visited national park in Finland with more than 400,000 visits annually [28]. Levi tourist resort is surrounded partly by private forest as well as state owned forests in which the key goal is wood production.
2.2. Methods
2.2.1. Stand Projections and the Application of Input-Output Analysis
Alternative land-use scenarios were produced by individual stand projections that were based on the MOTTI stand simulator. MOTTI is a stand-level growth simulator including specific distance-independent tree-level models for predicting, e.g., natural regeneration, growth and mortality, as well as effects of management on tree growth [29]. It is designed to simulate stand development under alternative management regimes and growth conditions in Finland [23,29,30] with separate models for peatland trees available [29,31]. Furthermore, the user can define different parameters of the simulations—such as management schedule, stumpage prices, unit costs for silvicultural measures and discount rate. The performance of the MOTTI simulator has been assessed in young Scots pine stands by Ahtikoski et al. [32], Huuskonen and Ahtikoski [33] and Huuskonen [34], and in mixed stands by Hynynen et al. [29]. Mäkinen et al. [35] evaluated the reliability of the growth predictions in intensively managed Scots pine stands. The results indicate that the MOTTI simulator can be applied as a tool to compare stand management alternatives in Finnish conditions. In this study the number of intermediate thinnings was restricted to two (2) since the time horizon was only 30 years. In harsh growth conditions more than two intermediate thinnings within a 30-year time horizon is practically unattainable, given the average rotation period exceeding well over 100 years. Further, common silvicultural measures (such as soil preparation, planting, direct sowing, tending of sapling stand and forest drainage) were allowed, the intensity of the measures depending on the land-use scenario.
In general, input-output, I-O analyses are quite widely applied in assessing economic impacts of tourism [36-38]. However, the impact of tourism on economic activity in the state or nation as a whole cannot be tackled with local input-output analysis [24]. Nevertheless, local effects on value added and employment can be determined by using input-output analysis [24]. Another aspect favoring the use of input-output analysis in this connection is there are no existing ready-made computable general equilibrium (CGE) models available [24,39], or in the existing partial equilibrium models, the tourism sector is not incorporated [40,41].
Input-output analysis originates from the results of the input-output model and input-output tables (method), which were initially developed by Leontief [42]. Typically I-O analysis has been used for assessing the impact of a change in the demand conditions for industries of the economy. The basic relationships in this model are often written in matrix notation, which are presented in an appendix.
2.2.2. Specific Features of the Input-Output Analysis
The input-output tables of Lapland Region [43] were used for the I-O analysis we made for two industry groups, namely “Forestry and related manufacturing” and “Tourism”. For Forestry and related manufacturing we sum up impacts of the following industries: “Forestry, logging and related service activities”, “Manufacture of pulp, paper and paper products” and “Manufacture of wood and of products of wood and cork, except furniture”. We assess the direct demand of tourism with tourism satellite accounts (TSA) and input-output tables of Lapland for 2002 [43,44]. The TSA is weighted with the output/employment of all tourism-related industries by the ratio of tourism expenditures to total expenditures for each industry [45-48].
To determine the individual tourist income, we first derived the average duration of registered tourist overnight stays (including both domestic and foreign tourists who have stayed in hotels or in other registered accommodation) from sub-county database sources [49] resulting in 3.7 days per tourist. To this value we applied the average visitor expenditure of €64.8/day in the region [49]. Having estimated the average consumption of each tourist (3.7 days × €64.8/day), we also had to evaluate how much was spent on accommodation and how much of the total price of a package tour spilled over [50]. The figures of accommodation and spillovers of the package tours were based on a recent report [49]; they were €40/day and €72.8/day, respectively. Finally, we estimated that each tourist would generate a direct income of €660 during his/her visit in the Levi and Ylläs region (3.7 × (64.8 + 40 + 72.8). This figure corresponds well with the latest study on the subject in that region [47], and it is assumed to generate multiplier effects according to the latest regional input-output tables [43].
For simplicity we calculated the accumulative value added (millions of euro) and accumulative employment (person-years) for the next 30 years. By this procedure (i.e., assessing accumulative values) we avoid problematic details such as the decision of social discount rate (for the social discount rate, see Stiglitz [51]) without changing anything of substance. Technically, in forming the accumulative values for value added and employment, we summed up the results of each five-year period of stand projections associated with alternative land-use scenarios. One should note that there were minor differences between land-use scenarios with respect to the patterns of when each five-year period's value added or employment was at its peak or lowest point. In summing up, these minor differences between land-use scenarios evened out since we did not take into account the time by discounting.
2.2.3. Land-Use Scenarios and Tourists' Preferences
The dependence between particular land-use scenario and recreation demand (expressed as the amount of tourists) cannot be tackled directly here since there are no studies in similar conditions which could link different forest management schedules (land-use scenarios) to changes in tourist flows, or alternatively in tourist expenditures [50]. The link between forest management practices and the recreation environment is, however, studied particularly in landscape preferences studies [12,17-20,52]. The results suggest that in maintaining long-distance scenes, for example, the delineation of cutting areas should be fit into landscape structure avoiding artificial and geometric forms. Moreover, large and visible regeneration units should be avoided in management in order to sustain the forested appearance of the area [20]. The impact of thinnings is often considered to be positive due to improved visibility and walkability within the forest stand. Natural regeneration preserving seed trees on the site is a better-accepted management method both in near-view and long-distance scenes [12,18,52]. Moreover, a recent study suggests that in relatively flat landscapes, professionally designed regeneration cuttings help in opening up long-distance views, which are appreciated by foreign tourists [12]. In this study we assumed a positive relationship between maintaining long-distance scenes as well as near view and the amount of tourists indicating that the better the long-distance scene and near-view are maintained in the landscape, the higher the influx of visitors.
2.2.4. Land-Use Scenarios
Three different land-use scenarios were applied in the study region within the time span of 30 years. These alternative land-use scenarios represented alternative outlooks on the practices of natural resources management (forest stand management), and in the following the three scenarios are described in detail.
Business-As-Usual, BAU. In this scenario the wood production possibilities in state owned forests are exploited with the magnitude that corresponds to practical forestry during the past decade in the study region. This scenario closely resembles to maximum sustainable yield, which is commonly referred to in the literature [53,54]. However, the BAU scenario does not exactly correspond to maximum sustainable yield, since there have been some adjustments in practical forestry in the study region. These adjustments have involved clearcutting areas as well as intensive thinnings. The adjustments have resulted in app. 20% less timber production per annum than would have occurred if pure maximum sustainable yield had been applied in the state owned forests. In this scenario the quality of forest recreation environment is an external outcome of forest management focusing on timber production. Technically, all of the forest land area (5,600 ha) is managed according to the latest silvicultural recommendations [55]. This scenario is the baseline to which the other two scenarios (2 and 3) are compared.
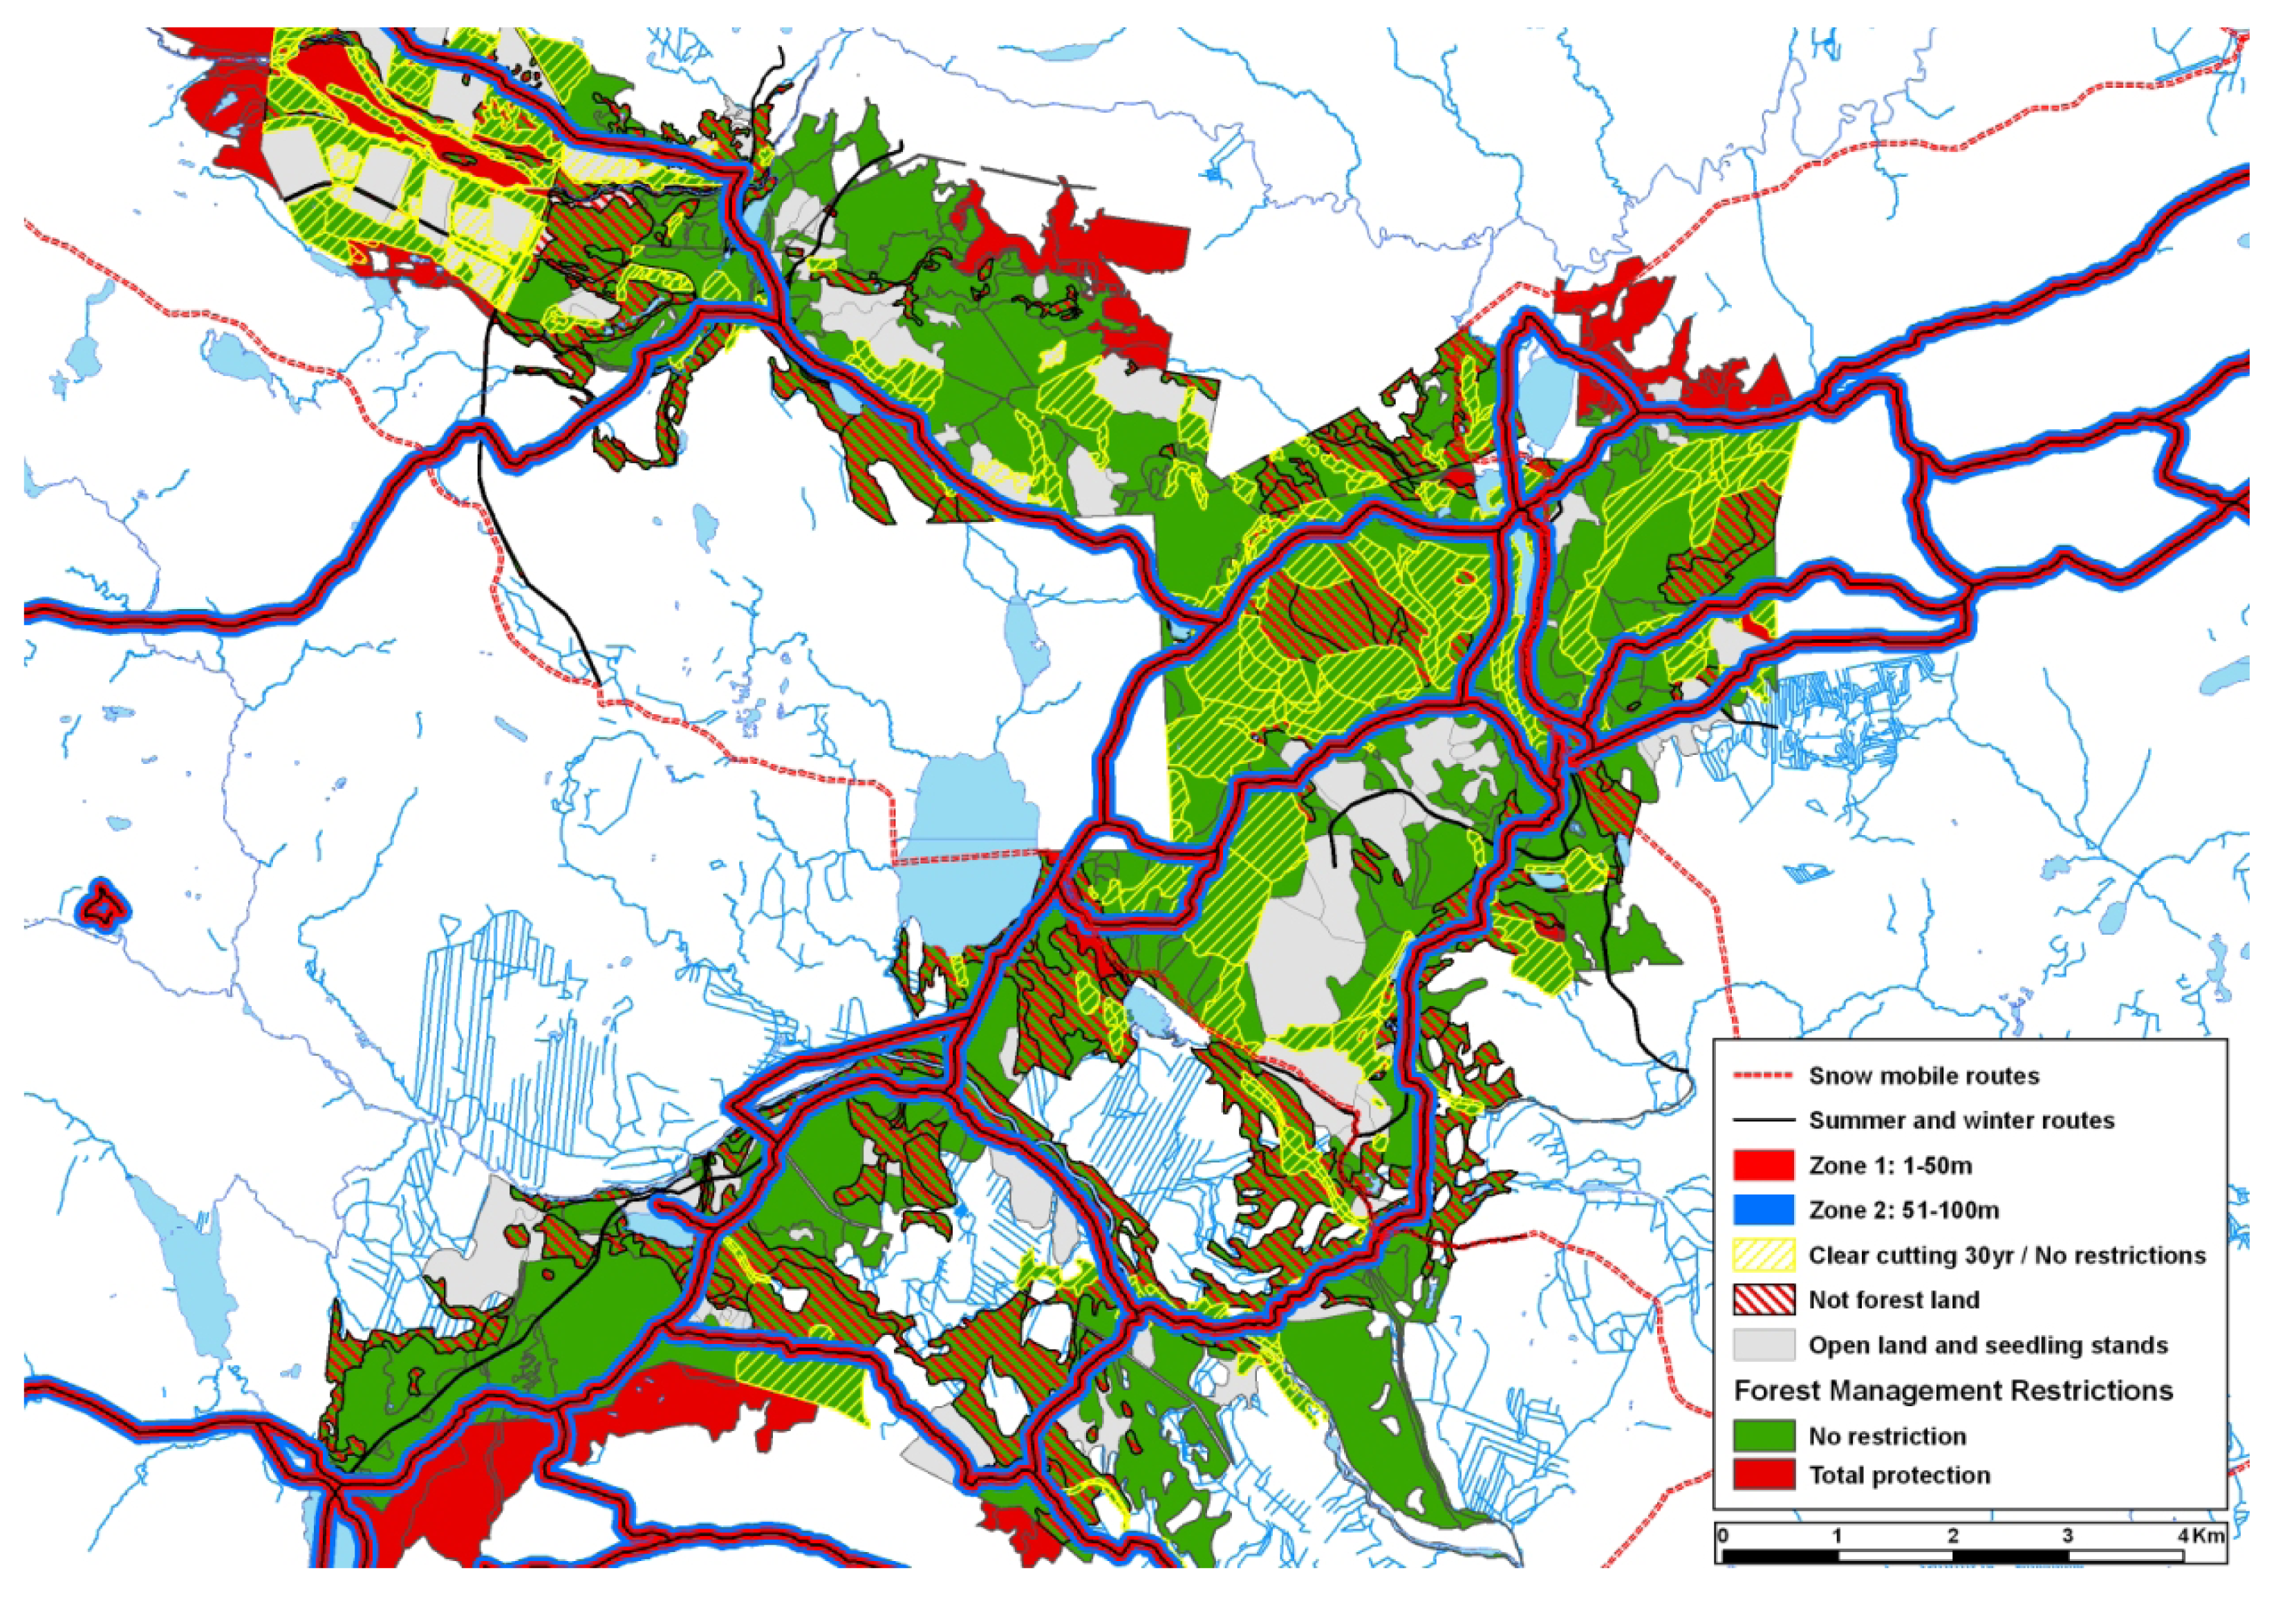
Nature-Based Tourism A, NBTA. In this scenario the nearby environment along the trails for outdoor recreation is restricted from intensive forest management using specific buffer zones. An adequate width of the buffer zones was determined by a field visit in 2008. The first buffer zone follows the trail so that within a range of 50 m from both sides of the trail, forest management was not allowed at all. In the other buffer zone representing 50 m to 100 m from both sides of the trail, only a narrow range of management methods such as seed tree cuttings and thinnings were allowed, i.e., no clear cuttings at all (Figure 2). In summary, this land-use scenario only limits forest management along the trails for outdoor recreation, leaving other areas opened for the forest management aiming at wood production. This scenario would allure more tourists into the study region due to a more attractive forest environment than in scenario 1, BAU. Restricting forest management only along the trails used for outdoor recreation, resulted in that altogether 940 ha (representing 17%) of forestland was under restricted forest management in the study region.
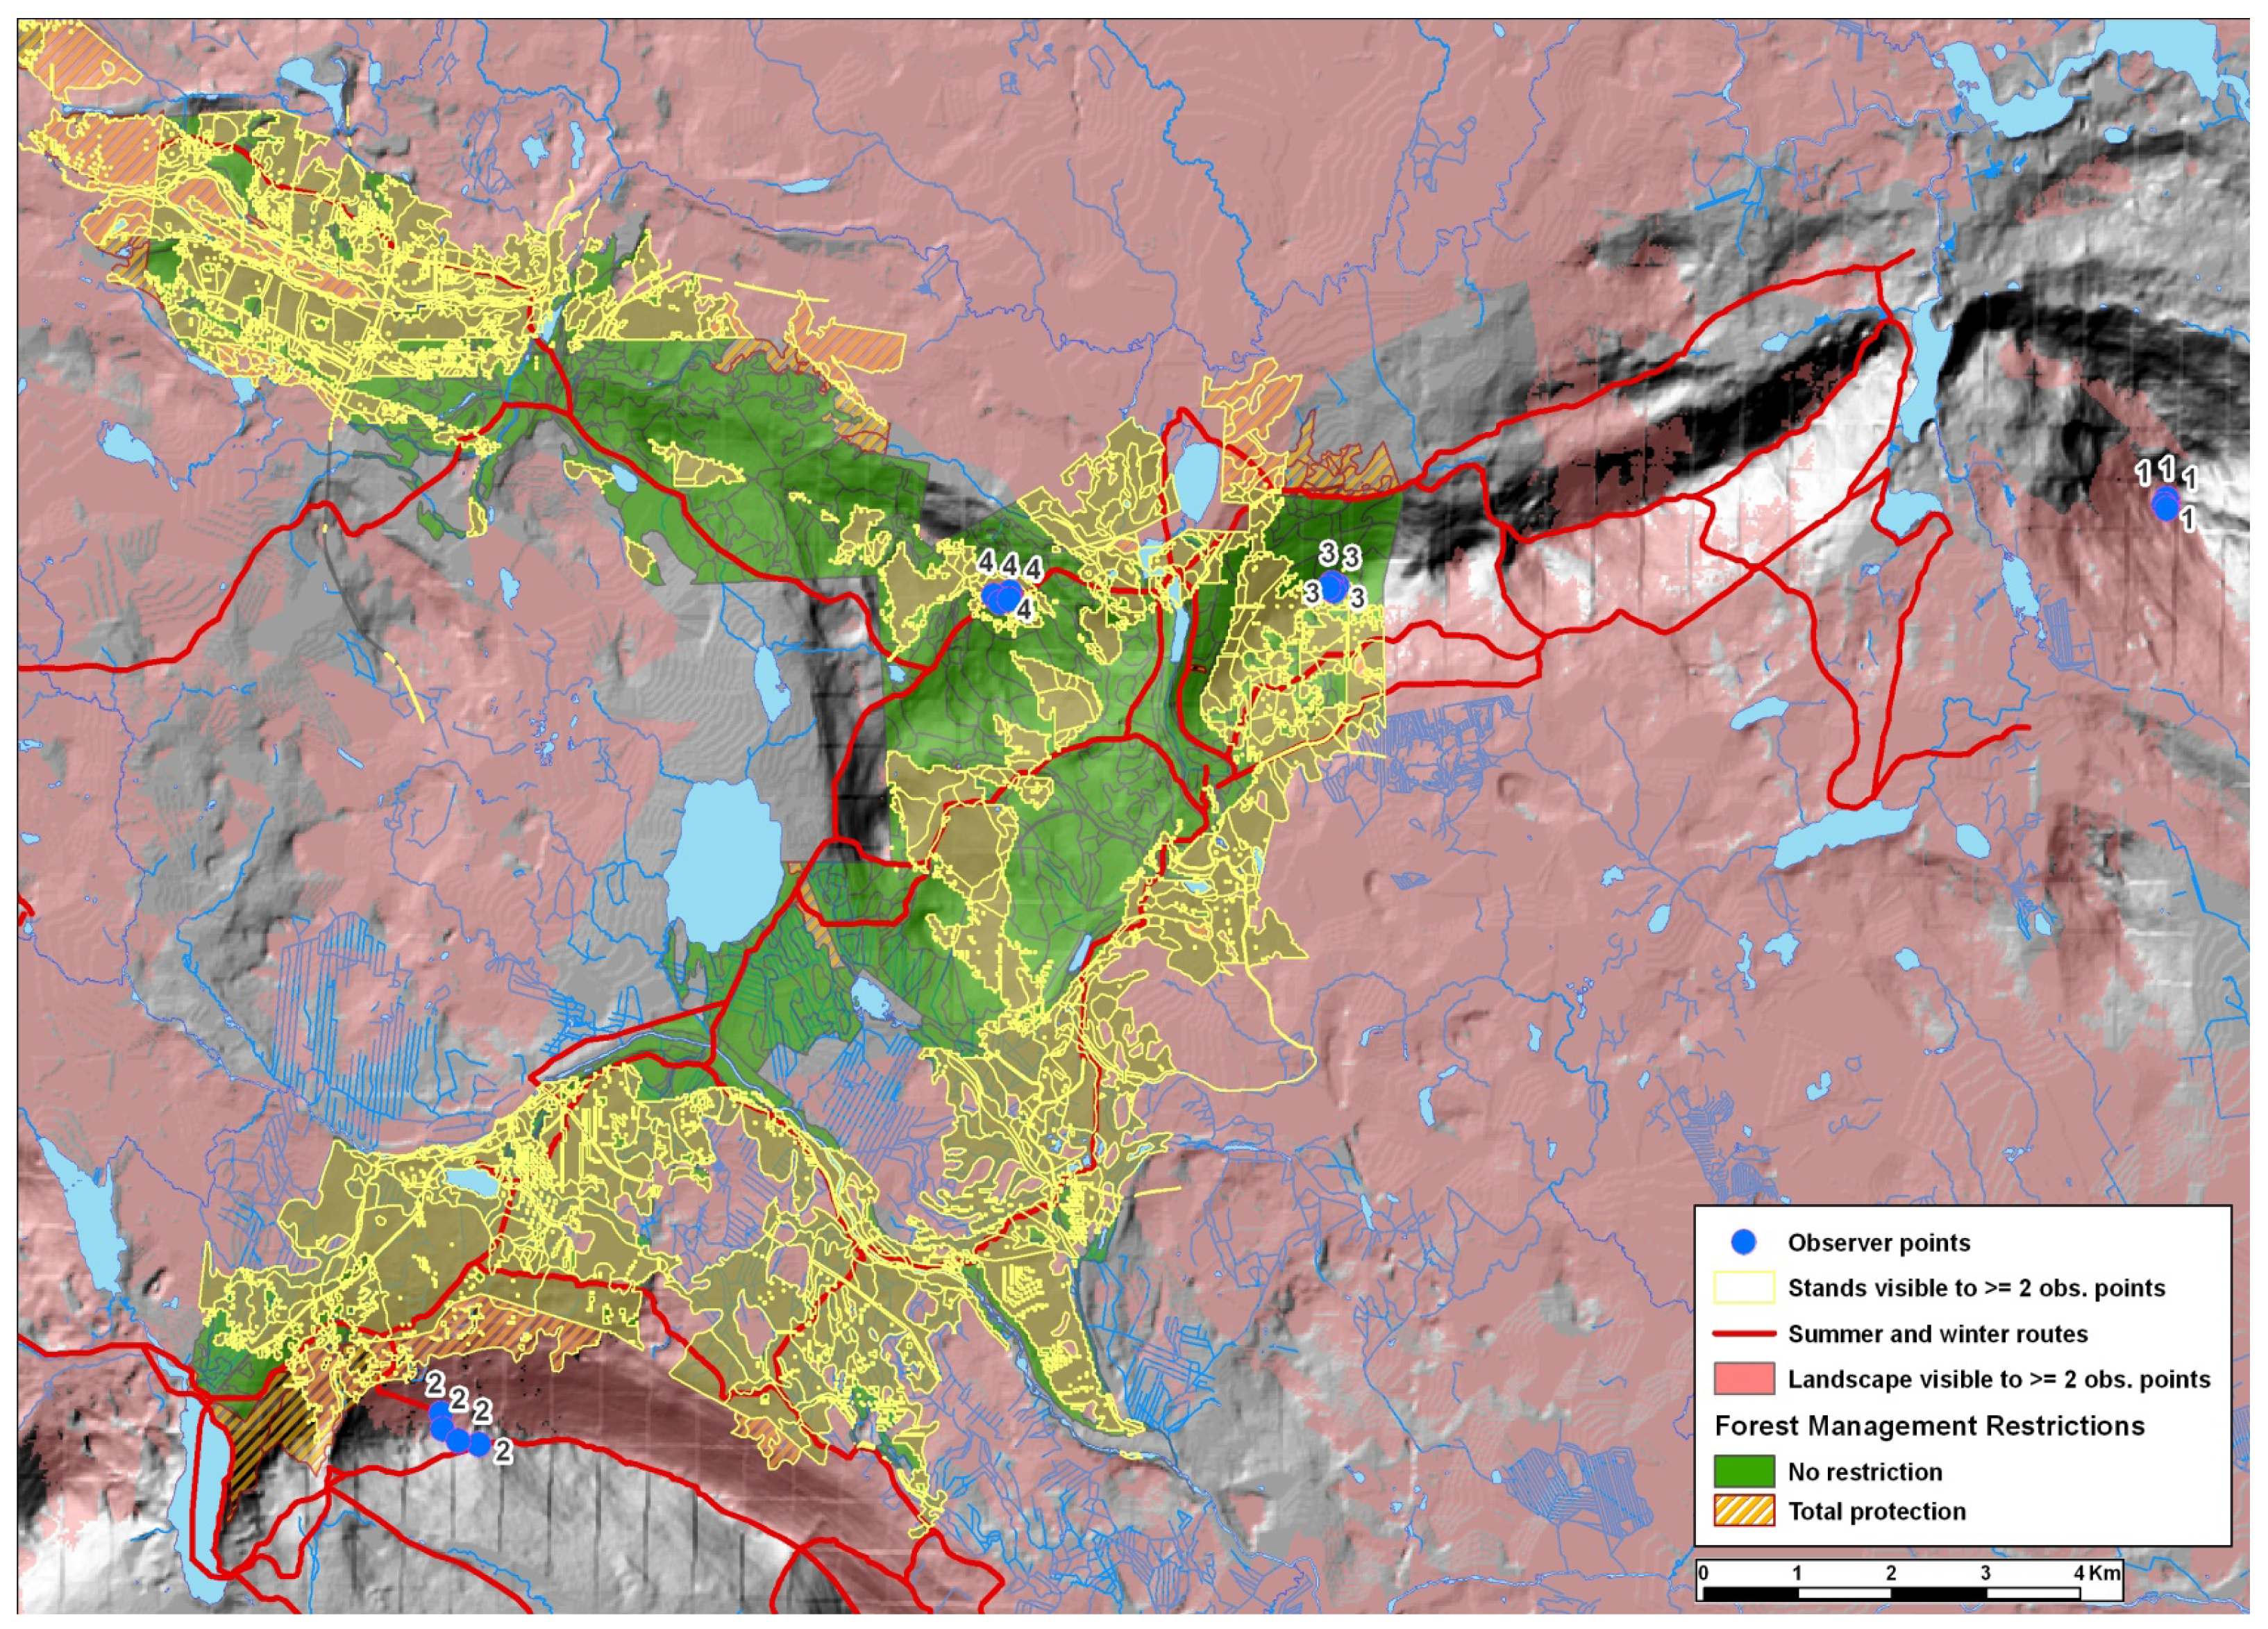
Nature-Based Tourism B, NBTB. Landscape along the trails as well as key landscape views within the area are secured by restricting forest management. First, a field visit was conducted to locate the main viewpoints of the case study region. Second, a visual sensitivity analysis by GIS (with four observer points) was applied to determine sensitive landscape areas, i.e., areas where any intensive forest management practices would be visible for larger user groups. The criterion was that the landscape view has to be seen at least from two out of the four observer points simultaneously (Figure 3). The idea of identifying key landscape views was to secure an image of forested landscape in the areas that would be critical for outdoor recreation experiences if the number of visitors were to increase in the future. This scenario, compared to scenario 2 (Nature-base tourism A), represents a significantly higher level of integration of nature-based tourism into forest management practices. This scenario also allures more tourists than scenario 1, BAU. In this scenario 3,400 (61%) ha became restricted from forest management.
As an overview of the land-use scenarios we present a table (Table 2), which includes annual cutting removals and silvicultural intensity associated with each scenario. Finally, for each land-use scenario the simulated stand projections (MOTTI stand simulator) within the next 30 years were converted into silvicultural measures (expressed as ha, and further in euro), thinnings (first m3, then euro) and final cuttings (m3, euro), and these values were fed into the input-output analysis.
3. Results and Discussion
The statistics reveal that registered overnights in Lapland have almost doubled from 1990 to 2008 (the value for 2008 being 2,348,430 overnights), and particularly the share of Fell Lapland has increased during that time period [7] Overall increase in tourism in the resorts of Ylläs and Levi has been rapid during the 2,000 s. For example, registered overnight stays in Levi increased from 2002 to 2008 from about 250,000 per annum to about 350,000 per annum. In Ylläs, respectively, the growth was even bigger, from about 130,000 per annum in 2002 to almost 350,000 per annum in 2008. After that, due to economic recession, the annual number of overnight stays has remained in about the same level [7,56]. However, there are many factors that influence tourism demand. The quality of the forest environment that has been of interest here is only one of them. Thus, straight-forward comparisons between the amounts of increased tourists here (due to more attractive landscape views) and the general statistics described above are misleading, since magnitudes of this study context and overall figures are quite different. Furthermore the general statistics only provide a perspective to the overall framework, nothing else. Rather, one should evaluate the results of this study by questioning how feasible the amounts of increased tourists (associated with alternative land-use scenarios) are with respect to each other and to the losses in annual timber revenues, i.e., traditional forestry.
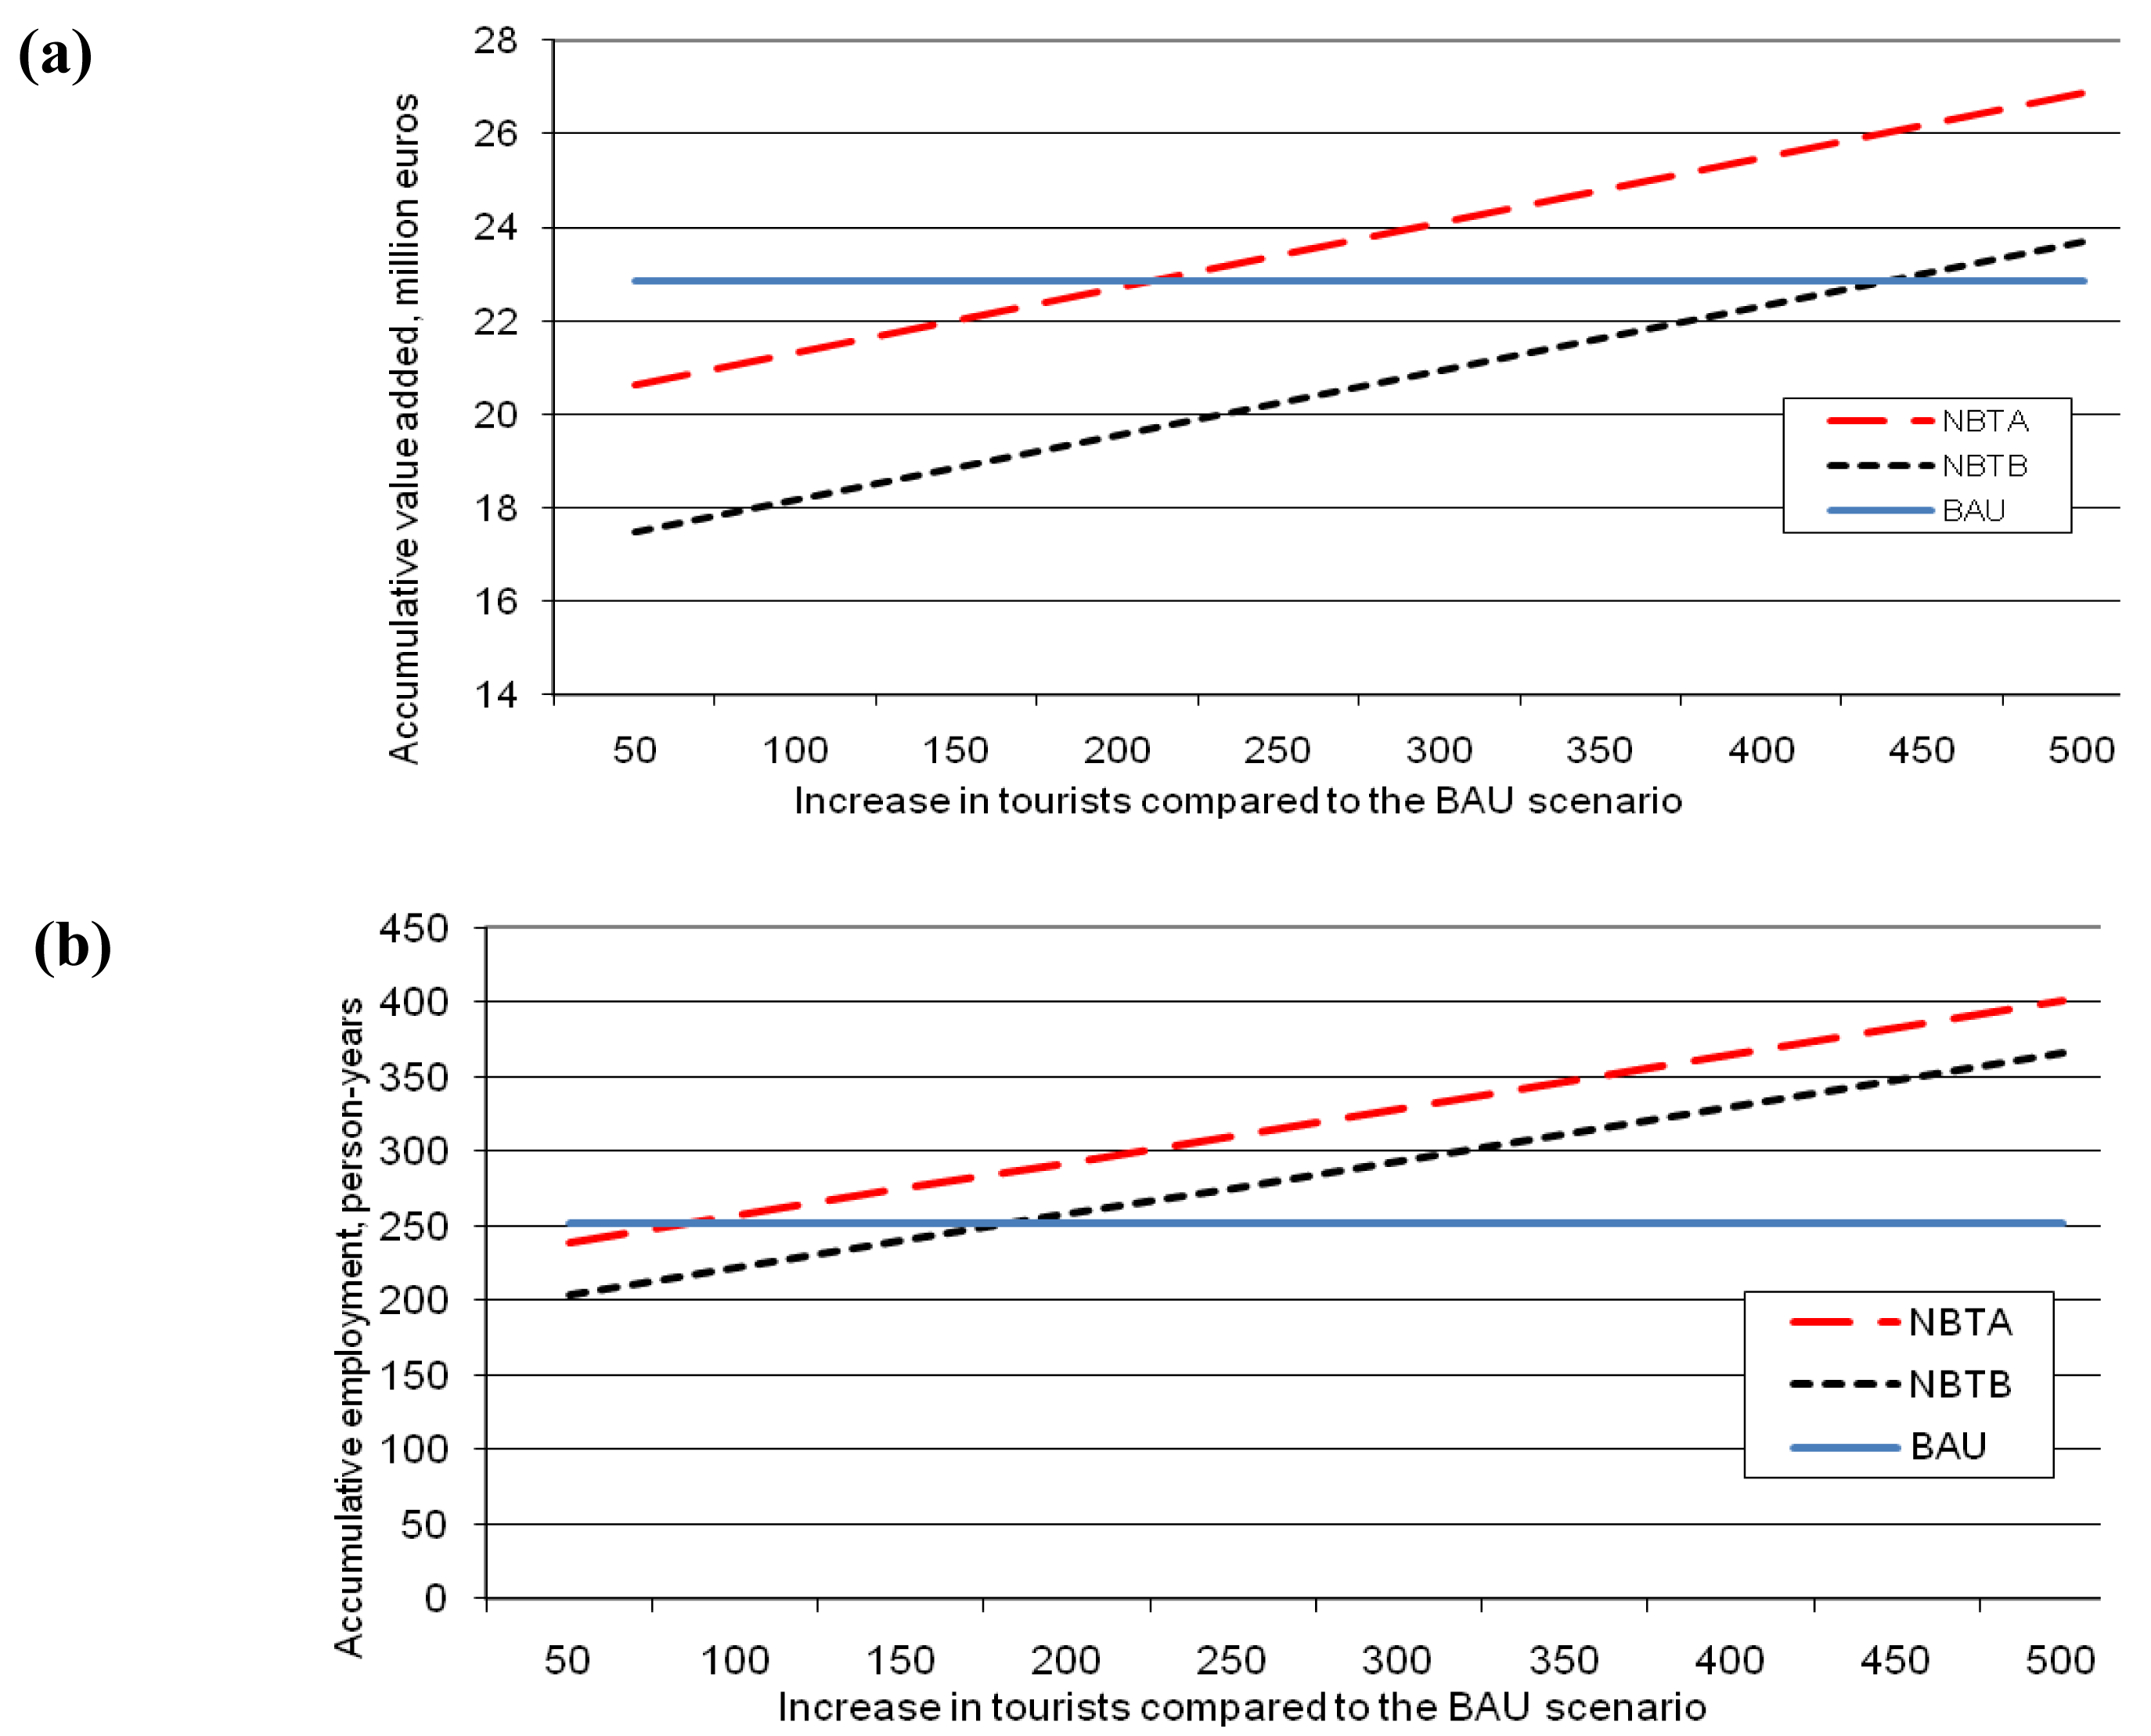
When the amount of increased tourists per annum was less than 211 tourists, then the Business-as-usual scenario (BAU) outperformed in accumulative value added (time span 30 years) the other two scenarios, Nature-based tourism A and Nature-based tourism B [Figure 4(a)]. If more than 211 tourists per annum would be allured to the study region due to a more aesthetic landscape, then Nature-based tourism A would perform better than the Business-as-usual scenario with respect to accumulative value added [Figure 4(a)]. Further, if the amount of increased tourists would exceed 440 tourists, then also Nature-based tourism B scenario would outperform the Business-as-usual scenario in accumulative value added [Figure 4(a)]. The difference between Nature-based tourism B (NBTB) and Nature-based tourism A (NBTA) with respect to accumulative value added can be interpreted by the fact that more significant losses in accumulative value added of forestry are associated with NBTB than with NBTA. This is because distinctively larger areas are restricted from forest management in land-use scenario NBTB than in NBTA (3,400 ha vs. 940 ha). Stated differently, in NBTB local economy will produce as much value added as in land-use scenario BAU only when a relatively large increase in recreation (tourist) demand takes place. Only then the increased tourist demand would compensate for the losses of the forestry sector associated with NBTB.
Accumulative employment (time span 30 years) for the Business-as-usual scenario was 252 person-years, and 88 more tourists per annum would be required for Nature-based tourism A to break-even with the BAU scenario [Figure 4(b)]. For Nature-based tourism B, 184 more tourists per annum would be required to break-even with the BAU scenario with respect to accumulative employment [Figure 4(b)]. When comparing the results between accumulative value added [Figure 4(a)] and employment [Figure 4(b)], it can be seen that the values of more tourists per annum are considerably lower with accumulative employment than with accumulative value added. One of the reasons for this is the fact that nature-based tourism itself seems to generate more places of employment than forestry for the same value added—at least in the study region (Fell Lapland). This can be interpreted by saying that the productivity of various activities associated with nature-based tourism is less than the productivity of forestry, particularly in logging [57]. There are several reasons for this, but the most critical one is the fact that currently forestry is in most parts highly mechanized, and one employee in forestry can generate more value added than one employee working in business related to nature-based tourism.
We demonstrated how the value added and employment of integrating nature-based tourism and forestry can be calculated through an application of combining stand projections and regional input-output, I-O analysis. We applied I-O analysis despite the fact that it has been also criticized. First, traditional I-O analysis assumes that there is a free, unrestricted flow of resources to different parts of the economy. The other two drawbacks related to the I-O analysis are: assumption of using inputs in fixed proportions (ignoring changes in relative prices) and absence of feedback effects, mechanisms from and to other sectors in the economy [24]. In spite of these drawbacks, it is acknowledged that estimating the economic impacts of tourism growth in certain contexts—such as small regional economies or sub-state regions—the I-O analysis is valid methodology to be applied [24]. Further, we focused on estimating only local effects on value added and employment, and for this purpose traditional I-O analysis fits well. In our case we consider that the assumption of freely available resources is quite reasonable since labor and capital can eloquently flow to the study region from other areas in Finland [24]. The next goal would be to extend our analysis to the regional or even national scale, which requires that we apply a CGE model (or partial equilibrium model). Prior to that we need to incorporate the tourism sector into the CGE model by e.g., utilizing the existing tourism satellite accounts (TSAs) of Finland.
Another issue related to the study context should be discussed in detail. Namely, the relation between a particular land-use alternative (forest management) and the tourist demand was based on previous studies on forest preferences of visitors and the impact of different management practices on the scenic and recreational value of forest stands in the Nordic countries. The earlier studies in the Nordic countries suggest that large and visible regeneration units should be avoided in management in order to sustain the forested appearance of the area [20]. Furthermore, we made an on-site questionnaire among 50 randomly chosen visitors in the study area in addition to 30 tourism entrepreneurs [58], and the findings of the on-site questionnaire were in solid accordance with earlier studies in the Nordic countries. Further, a critical issue is which scenario (NBTA or NBTB) would more likely to allure the required increase in the amount of tourists so that the losses in forestry would be fully compensated for at the local level. It seems that NBTB scenario is more “safe” in that respect, since this scenario might even create a good reputation among tourists being a procedure which provides excellent recreation possibilities. On the other hand, the NBTB scenario requires considerably more tourists than the NBTA scenario to break even with the losses in forestry, and furthermore the NBTB scenario requires higher investments (in a form of losses in timber production), which can be considered to be a risk factor. However, the ratio between actual, real nature-based tourists and those who just prefer walking along the trails remains unsettled in this study context. Stated differently, more knowledge on the link between particular forest management and overall tourism demand in the region is called for. Thus, further studies on the tourism demand would reveal whether equal-size increases in tourists would be achievable with distinctively different management scenarios (and thus considerably different timber production losses).
The most critical issue with respect to interpreting the results was whether the required increases in the amounts of tourists to compensate the losses of forestry are realistic. There is no straightforward answer to that, but we can outline the question by observing the past history of the development of tourism in Lapland. As stated before, the share of Fell Lapland of Lapland tourism has increased during the 1990s and 2000s [7]. The research looking at the attraction factor for nature-based tourism, stresses the importance of landscape and environmental quality for choosing a holiday destination [15,17,20,59]. Indirectly, together with other factors, aesthetic and recreational functions of forests can promote tourism and enhance economic development in rural areas. Viewed in this fashion it can be argued that the increases in the amounts of tourists associated with nature-based tourism A and B scenarios (NBTA and NBTB) can as well be interpreted as decreases in the amount of tourists associated with the Business-as-usual scenario (BAU)—the local impacts on value added and employment are identical whether we determine the increases or decreases. Finally, the possible gainers of the shift of management practices towards improving forest quality for tourism would be tourism entrepreneurs and rural population (not dependent on forestry activities) as well as tourists using the forest area. In Lapland, landscape and recreation values of state owned forests managed by Metsähallitus are increasingly important for the surrounding communities in nature-based tourism use. Metsähallitus, however, tries to integrate different forest uses in an optimal way in order to maximize the total benefits of forests for the society. Therefore assessing the benefits and costs of different management regimes is important information in the forest planning and policy processes.
4. Conclusions
The main results support the idea of integrating forestry and nature-based tourism in regions where tourism is established—such as the area in between Ylläs and Levi tourist resorts in northern Finland. Large-scale tourism creates enough demand in the service branch and also in other lines of business so that this increased demand can in principle compensate for the possible losses in forestry at the local level. According to our analyses, reasonable increases in the numbers of tourists would compensate for the losses in forestry—at least, when these increases are compared to the total tourism demand in the area. Further, the applied two different levels of integration (NBTA and NBTB) represent relevant options for local decision-makers.
What are the implications of this study for practical management decision-making? It can be argued that this study has addressed that tourism can actually generate real economic value for regions which also provide a wealth of ecosystem services. From the practical decision-making point of view, one easy-to-apply means to generate real economic value is to integrate nature-based tourism with traditional forestry in areas which possess solid local tourism demand. In such integration the costs of providing the adequate landscape quality for tourists are simply determined in a form of extra tourists needed to compensate for the losses in forestry. Currently, private forest owners are not rewarded directly for the production of forest externalities (landscape quality including sufficient recreation possibilities) resulting in that they are less willing to decide on forest management regimes that aim at improved landscape or other environmental values. In the future, a development of market-based methods to enhance the provision of amenity benefits in private lands should be developed and adapted to meet the needs of various regions in Europe. These types of approaches are currently developed in a large project NEWFOREX (New ways to Value and Market Forest Externalities) funded by the European Union under the 7th Framework Programme for Research and Technological Development.
Appendix. Principles of Our Input-Output Analysis
The Leontief's basic model is the starting point to the input-output analysis. The matrix equation of the model is
We use this basic model to assess impacts of increased tourism, because new tourists bring the new final demand to a local economy. Restrictions on traditional forest management reduce the procurement of logs and pulpwood. Therefore the outputs of forestry and related manufacturing industries also decrease. We estimated the impacts of reduced outputs with an output-to-output model or a total flow model [3,4].
Szyrmer [5] derived a total flow (TF) matrix to capture the multiplier effects of a unit of output as a substitute for a unit of final demand. He generated this total flow matrix from the inverse of the Leontief matrix in the following way:
It is possible to define the absolute gross effects of industries by multiplying a diagonal matrix composed of the outputs of all industries (X̂) by the total flow matrix (TF) to obtain an analytical matrix of outputs [7].
The diagonal cells of the matrix R indicate the outputs of different industries, and the off—diagonal column cells indicate the direct and indirect output requirements of the industry represented by the row concerned with respect to the output of the industry denoted by the column.
The sum of a column in the matrix R indicates the total gross outputs associated with that industry in the economy (the industry's own output and the direct and indirect output requirements of other industries = the total gross effects of the industry concerned). The absolute gross impacts cannot be added together, however, because the sum of these sums is more than the total output of the whole economy, due to the fact that the calculations of gross impacts count some of the requirements for intermediates more than once. The gross impacts of an output analysis therefore have to be calculated industry by industry [3,5,8].
The method for the calculation of the net effect is used to assess net impacts of the reduced outputs of forestry and related manufactured industries. In general the net effects of industries (NX) are defined in Equation (4)
Summing both sides of Equation (4) gives
Thus the total gross output X in the economy and the sum of the net effects of industries are equivalent. This means that no overestimated net output effects or double counting of intermediates exist.
Double counting cross-impacts of forestry and related manufactured industries were eliminated by the calculation of the net effects. For instance, impacts of forest industries on forestry are included in the output of forestry, and therefore these must be subtracted from the gross impacts of forestry. In the same way, all cross-impacts among forestry and related manufacturing industries are eliminated.
Finally the calculation of the impacts in value added and employment from the impacts of outputs is made by coefficients of value added and employment. The effects of output on the value added in an industry, VAE, are obtained by multiplying the analysis matrix R by the diagonal matrix w, which consists of the value-added coefficients:
If the employment L in each industry is known, the effects of total output on employment can be obtained. Employment coefficients for individual industries can be obtained by dividing employment in each industry by the total output of that industry, X. Using a matrix notation:
The analytical matrix for employment is obtained by multiplying the diagonal matrix of employment coefficients by the total output matrix R:
- Ten Raa, T. The Economics of Input-Output Analysis; Cambridge University Press: New York, NY, USA, 2006. [Google Scholar]
- Miller, R.E.; Blair, P.D. Input-Output Analysis. Foundations and Extensions; Prentice-Hall: Englewood Cliffs, NJ, USA, 2009. [Google Scholar]
- Milana, C. Direct and indirect requirements for gross output in input-output analysis. Metroeconomics 1985, 28, 283–292. [Google Scholar]
- Steinback, S.R. Using ready-made regional input-output models to estimate backward-linkage effects of exogenous output shocks. The Review of Regional Studies 2004, 34, 57–71. [Google Scholar]
- Szyrmer, J. Input-output coefficients and multipliers from a total-flow perspective. Environ. Plann. 1992, A24, 921–937. [Google Scholar]
- Knuuttila, M.; Vatanen, E.; Jansik, C. Finnish food industry in 1989-2002: An output-oriented input-output analysis. Acta Agr. Scand. C Food Econ. 2007, 2007, 217–228. [Google Scholar]
- Vatanen, E. Puunkorjuun ja puunkuljetuksen paikallistaloudelliset vaikutukset Juvan, Keuruun ja Pielisen Karjalan seutukunnissa. Metsäntutkimuslaitoksen tiedonantoja 825 2001, 73, in Finnish. [Google Scholar]
- Heimler, A. Linkages and vertical integration in the Chinese economy. Rev. Econ. Statistics 1991, 73, 261–267. [Google Scholar]


| Category by development classes | Proportion of the total land area (%) | Average volume, m3/ha (standard deviation, S.D.) | Biological age, yrs (S.D.) | Dominant height, m (S.D.) |
|---|---|---|---|---|
| Seedling stand | 18% | 12.3 (16.5) | 17 (14.2) | 3.6 (3.4) |
| Young stand | 43% | 69.9 (39.0) | 53 (36.3) | 9.4 (5.8) |
| Mature stand | 28% | 87.9 (37.2) | 115 (82.2) | 9.8 (6.7) |
| Old-growth stand (a) | 11% | 76.9 (48.2) | 158 (39.4) | 13.5 (3.8) |
(a)Here, old-growth stand is described only by biological age. Stands older than 140 years belong to this category.
| Land-use scenario | Annual cutting removal (m3) | Silvicultural intensity (a) |
|---|---|---|
| (1) Business-as-usual, BAU | 4,960 | 100.0% |
| (2) Nature-based tourism A | 4,360 | 75.0% |
| (3) Nature-based tourism B | 3,710 | 39.0% |
(a)Silvicultural intensity in this connection means that total acreage of silvicultural measures (such as soil preparation for cultivation, planting, direct sowing, tending of sapling stand, forest drainage and fertilization) was summed up for the next 30 years, and the acreage representing BAU scenario was set to 100%.
References and Notes
- Shafer, E.L.; Choi, Y. Forging nature-based tourism policy issues: A case study in Pennsylvania. Tourism Manage. 2006, 27, 615–628. [Google Scholar]
- Shrestha, R.K.; Stein, T.V.; Clark, J. Valuing nature-based recreation in public natural areas of the apalachicola river region, Florida. J. Environ. Manage. 2007, 85, 977–985. [Google Scholar]
- Hynynen, J.; Ahtikoski, A.; Siitonen, J.; Sievänen, R.; Liski, J. Applying the MOTTI simulator to analyse the effects of alternative management schedules on timber and non-timber production. Forest Ecol. Manag. 2005, 207, 5–18. [Google Scholar]
- Ranius, T.; Ekvall, H.; Jonsson, M.; Bostedt, G. Cost-efficiency of measures to increase the amount of coarse woody debris in managed norway spruce forests. Forest Ecol. Manag. 2005, 206, 119–133. [Google Scholar]
- Venn, T.J. Financial and economic performance of long-rotation hardwood plantation investments in Queensland, Australia. Forest Policy Econ. 2005, 7, 437–454. [Google Scholar]
- Nalle, D.J.; Montgomery, C.A.; Arthur, J.L.; Polasky, S.; Schumaker, N.H. Modeling joint production of wildlife and timber. J. Environ. Econ. Manag. 2004, 48, 997–1017. [Google Scholar]
- Lapin Matkailutilastollinen Vuosikirja 2008. In Tourism Facts in Lapland, Statistical Review 2008. The Regional Council of Lapland; Lapin Liitto: Rovaniemi, Finland, 2009; (in Finnish with English summary).
- Keskimölö, A.; Pirkonen, J. Lapin Metsäohjelma 2006-2010 [Lapland forestry program for 2006-2010]; Forestry Centre Lapland: Tornio Printing House: Tornio, Finland, 2006; in Finnish. [Google Scholar]
- Hall, C.M.; Boyd, S. Nature-based tourism in Peripheral Areas: Introduction. In Nature-Based Tourism in Peripheral Areas. Development or Disaster? Hall, C.M., Boyd, S., Eds.; Channel View Publications: Clevedon, UK, 2005; pp. 3–17. [Google Scholar]
- Silvennoinen, H.; Tyrväinen, L. The Demand for nature based tourism in Finland and environmental expectations of the clients. In Outdoor Recreation 2000; Sievänen, T., Ed.; Working papers of the Finnish Forest Research Institute: Vantaa, Finland, 2001; pp. 112–127. [Google Scholar]
- Tyrväinen, L.; Tuulentie, S. The future of nature based tourism. Futura 2009, 28, 46–54. [Google Scholar]
- Tyrväinen, L.; Hallikainen, V.; Silvennoinen, H. Impacts of forest management on landscape quality in nature based tourism areas in Northern Finland. Can. J. For. Res. 2010. submitted. [Google Scholar]
- Hakkarainen, M.; Tuulentie, S. Tourism's role in rural development of Finnish lapland: Interpreting national and regional strategy documents. Fennia 2008, 186, 3–13. [Google Scholar]
- Fredman, P.; Tyrväinen, L. Frontiers in nature-based tourism (Editorial). Scand. J. Hosp. Tour. 2010, 10, 2–14. [Google Scholar]
- Tyrväinen, L.; Buchecker, M.; Vuletic, D.; Degenhart, B. Evaluating the economic and social benefits of forest recreation and nature tourism. In European Forest Recreation and Tourism: A Handbook; Bell, S., Simpson, S., Tyrväinen, L., Sievänen, T., Pröbstl, U., Eds.; Taylor and Francis Group: London, UK, 2008; pp. 35–64. [Google Scholar]
- Ribe, R.G. The aesthetics of forestry: What has empirical preference research taught us? J. Environ. Manage. 1989, 13, 55–74. [Google Scholar]
- Tyrväinen, L.; Silvennoinen, H.; Nousiainen, I.; Tahvanainen, L. Rural tourismin Finland: Tourists' expectation of landscape and environment. Scand. J. Hosp. Tour. 2001, 1, 133–149. [Google Scholar]
- Silvennoinen, H.; Pukkala, T.; Tahvanainen, L. The effect of cuttings on the scenic beauty of a tree stand. Scand. J. Forest Res. 2002, 17, 263–273. [Google Scholar]
- Karjalainen, E. The Visual Preferences for Forest Regeneration and Field Afforestation—Four Case Studies in Finland. Ph.D. Dissertation, Faculty of Biosciences, University of Helsinki, Helsinki, Finland, 2006; Dissertationes Forestales 31. [Google Scholar]
- Bell, S.; Apostol, D. Designing Sustainable Forest Landscapes; Taylor and Francis: London, UK, 2008. [Google Scholar]
- Ten Raa, T. The Economics of Input-Output Analysis; Cambridge University Press: New York, NY, USA, 2006. [Google Scholar]
- Miller, R.E.; Blair, P.D. Input-Output Analysis. Foundations and Extensions; Prentice-Hall: Englewood Cliffs, NJ, USA, 2009. [Google Scholar]
- Salminen, H.; Lehtonen, M.; Hynynen, J. Reusing legacy FORTRAN in the MOTTI growth and yield simulator. Comput. Electron. Agr. 2005, 49, 103–113. [Google Scholar]
- Dwyer, L.; Forsyth, P.; Spurr, R. Evaluating tourism's economic effects: New and old approaches. Tourism Manage. 2004, 25, 307–317. [Google Scholar]
- Varmola, M.; Hyppönen, M.; Mäkitalo, K.; Mikkola, K.; Timonen, M. Forest management and regeneration success in protection forests near the timberline in finnish lapland. Scand. J. Forest Res. 2004, 19, 424–441. [Google Scholar]
- Hiltunen, V.; Paalamo, P.; Rautiainen, M.; Vaara, I. Länsi-Lapin luonnonvarasuunnitelma, kausi 2006–2015; Metsähallituksen metsätalouden julkaisuja 58; Edita Prima Ltd: Rovaniemi, Finland, 2006; in Finnish. [Google Scholar]
- Ihalainen, A. Finnish Statistical Yearbook of Forestry; Finnish Forest Research Institute: Vammalan Kirjapaino Oy, Vammala, Finland, 2008; (in Finnish with English summary). [Google Scholar]
- Rosqvist, P. Metsahällituksen Luontopalvelut. Upeimman Luontomme Hoitaja. Vuosikertomus 2010 [Annual Report 2009 of Natural Resources of Metsähallitus]; Metsähallitus: Vantaa, Finland, 2010; in Finnish. [Google Scholar]
- Hynynen, J.; Ojansuu, R.; Hökkä, H.; Siipilehto, J.; Salminen, H.; Haapala, P. Models for Predicting Stand Development in MELA System; Research Papers 835; Finnish Forest Research Institute: Vantaa, Finland, 2002; p. 116. [Google Scholar]
- Matala, J.; Hynynen, J.; Miina, J.; Ojansuu, R.; Peltola, H.; Sievänen, R.; Väisänen, H.; Kellomaki, S. Comparison of a physiological model and a statistical model for prediction of growth and yield in boreal forests. Ecol. Model. 2003, 161, 95–116. [Google Scholar]
- Hökkä, H.; Salminen, H. Utilizing information on site hydrology in growth and yield modeling: Peatland models in the MOTTI stand simulator. Hydrology and Management of Forested Wetlands, Proceedings of the International Conference, New Bern, NC, USA, 8–12 April 2006; pp. 302–309.
- Ahtikoski, A.; Päätalo, M.; Niemistö, P.; Karhu, J.; Poutiainen, E. Effect of alternative thinning intensities on the financial outcome in silver birch (Betula Pendula Roth) stands: A case study based on long-term experiments and MOTTI stand simulations. Baltic For. 2004, 10, 46–55. [Google Scholar]
- Huuskonen, S.; Ahtikoski, A. Ensiharvennuksen ajoituksen ja voimakkuuden vaikutus kuivahkon kankaan männiköiden tuotokseen ja tuottoon. Metsätieteen aikakauskirja 2005, 12, 99–115, in Finnish. [Google Scholar]
- Huuskonen, Saija. Nuorten männiköiden kehitys—taimikonhoito ja ensiharvennus [The Development of Young Scots Pine Stands—Precommercial and First Commercial Thinning]. Ph.D. Dissertation, Faculty of Agriculture and Forestry, University of Helsinki, Helsinki, Finland, 2008; Dissertationes Forestales 62; in Finnish. [Google Scholar]
- Mäkinen, H.; Hynynen, J.; Isomäki, A. Intensive management of scots pine stands in Southern Finland: First empirical results and simulated further development. Forest Ecol. Manag. 2005, 215, 37–50. [Google Scholar]
- Archer, B.; Fletcher, J. The economic impact of tourism in the seychelles. Ann. Tourism Res. 1996, 23, 32–47. [Google Scholar]
- Frechtling, D.C.; Horvath, E. Estimating the multiplier effects of tourism expenditures on a local economy through a regional input-output model. Journal of Travel Research 1999, 37, 324–332. [Google Scholar]
- Tyrrell, T.J.; Johnston, R.J. The economic impacts of tourism: A special issue. Journal of Travel Research 2006, 45, 3–7. [Google Scholar]
- Dwyer, L.; Forsyth, P.; Ray, S. Assessing the economic impacts of events: A computable general equilibrium approach. Journal of Travel Research 2006, 45, 67–82. [Google Scholar]
- Kallio, A.M.I.; Hänninen, R.; Vainikainen, N.; Luque, S. Biodiversity value and the optimal location of forest conservation in Southern Finland. Ecol. Econ. 2008, 67, 232–243. [Google Scholar]
- Kallio, A.M.I. Accounting for uncertainty in a forest sector model using Monte-Carlo simulation. Forest Policy Econ. 2010, 12, 9–16. [Google Scholar]
- Leontief, W.W. The Structure of American Economy 1919–1939; Oxford University Press: New York, NY, USA, 1951. [Google Scholar]
- Regional Accounts, Input-Output Tables of Lapland Reflecting the Year 2002. Database Selection from Online Regional Branch Economics. Statistics Finland: Helsinki, Finland, 2006. Available online: http://pxweb2.stat.fi/database/StatFin/kan/apt/apt_fi.asp (accessed on 14 November 2010).
- Konttinen, J. Matkailun satelliittitilinpito ja aluetaloudelliset vaikutukset. KTM rahoitetut tutkimukset 4/2005 [Tourism Satellite Accounts, Regional Impacts]; Kauppa-ja teollisuusministeriö: Edita Publishing Ltd: Helsinki, Finland, 2005; in Finnish. [Google Scholar]
- Smeral, E. Tourism satellite accounts: A critical assessment. Journal of Travel Research 2006, 45, 92–98. [Google Scholar]
- Spurr, R. Tourism satellite accounts. In International Handbook on the Economics of Tourism; Dwyer, L., Forsyth, P., Eds.; Edward Elgar Publishing: Cheltenham/Camberley, UK, 2006; pp. 283–299. [Google Scholar]
- Vatanen, E.; Hyppönen, M. Pallas-yllästunturin kansallispuiston investointien vaikutukset tunturi-lapin paikallistalouteen. Maaseudun Uusi Aika 2008, 16, 24–41, in Finnish. [Google Scholar]
- Bonn, M.; Harrington, J. A comparison of three economic impact models for applied hospitality and tourism research. Tourism Econ. 2008, 14, 769–789. [Google Scholar]
- Lappi, Elämänvoimaa. Matkailustrategia 2007-2010. In Julkaisu A22/2008 [Lapland—Vitality for Life. Lapland Tourism Strategy 2007–2010]; Lapin Liitto: Rovaniemi, Finland, 2008; in Finnish. [Google Scholar]
- Alpizar, F. The pricing of protected areas in nature-based tourism: A local perspective. Ecol. Econ. 2006, 56, 294–307. [Google Scholar]
- Stiglitz, J.E. Discount rates: The rate of discount for benefit-cost analysis and the theory of the second best. In Cost-Benefit Analysis, 2nd ed.; Layard, R., Glaister, S., Eds.; Cambridge University Press: New York, NY, USA, 1996; pp. 116–159. [Google Scholar]
- Ribe, R.G. Aesthetic perceptions of green-tree retention harvests in vista views: The interaction of cut level, retention pattern and harvest shape. Landscape Urban Plan. 2005, 73, 277–293. [Google Scholar]
- Boston, K.; Bettinger, D. The economic impact of green-up constraints in the Southeastern United States. Forest Ecol. Manag. 2001, 145, 191–202. [Google Scholar]
- Ortiz, M.; Wolff, M. Qualitative modeling for the Caete mangrove estuary (North Brazil): A preliminary approach to an integrated eco-social analysis. Estuar. Coast. Shelf S. 2004, 61, 243–250. [Google Scholar]
- Hyvän metsänhoidon suositukset. In Silvicultural recommendations for Finland; Metsätalouden Kehittämiskeskus Tapio: Helsinki, Finland, 2006; in Finnish.
- Lapin matkailustrategia 2011-2014 [Lapland's tourism strategy for 2011-2014]. Lapin Liitto: Rovaniemi, Finland, 2011. Available online: http://www.lapinliitto.fi/c/document_library/get_file?folderId=349619&name=DLFE-9598.pdf (accessed on 19 September 2011).
- An Online Statistics on Productivity in Different Branches of Industry at Year 2007; Statistics Finland: Helsinki, Finland, 2007. Available online: http://www.stat.fi/index_en.html (accessed on 4 July 2010).
- Hallikainen, V.; Koivumaa, J. Matkailijoiden ja matkailuyrittäjien käsityksiä metsätalouden vaikutuksesta Aakenus-Kätkä—alueeseen matkailuympäristön; Lapin Liitto: Rovaniemi, Finland, 2007; in Finnish. [Google Scholar]
- Järviluoma, J. Nature for Tourists. Survey of the Role of Nature as a Tourist Attraction Attribute in Four Tourist Centres in Lapland. Ph.D. Dissertation, Faculty of Social Sciences, University of Lapland, Rovaniemi, Finland, 2006; Acta Universitatis Lappoensis. p. 96. [Google Scholar]
- Conflict of Interest: The authors declare no conflict of interest.
© 2011 by the authors; licensee MDPI, Basel, Switzerland. This article is an open access article distributed under the terms and conditions of the Creative Commons Attribution license (http://creativecommons.org/licenses/by/3.0/).
Share and Cite
Ahtikoski, A.; Tuulentie, S.; Hallikainen, V.; Nivala, V.; Vatanen, E.; Tyrväinen, L.; Salminen, H. Potential Trade-Offs Between Nature-Based Tourism and Forestry, a Case Study in Northern Finland. Forests 2011, 2, 894-912. https://doi.org/10.3390/f2040894
Ahtikoski A, Tuulentie S, Hallikainen V, Nivala V, Vatanen E, Tyrväinen L, Salminen H. Potential Trade-Offs Between Nature-Based Tourism and Forestry, a Case Study in Northern Finland. Forests. 2011; 2(4):894-912. https://doi.org/10.3390/f2040894
Chicago/Turabian StyleAhtikoski, Anssi, Seija Tuulentie, Ville Hallikainen, Vesa Nivala, Eero Vatanen, Liisa Tyrväinen, and Hannu Salminen. 2011. "Potential Trade-Offs Between Nature-Based Tourism and Forestry, a Case Study in Northern Finland" Forests 2, no. 4: 894-912. https://doi.org/10.3390/f2040894