Site Index Curves for Young Hybrid Larch Growing on Former Farmland in Sweden

Department of Energy and Technology, Swedish University of Agricultural Sciences, Uppsala 75007, Sweden
Forests 2012, 3(3), 723-735; https://doi.org/10.3390/f3030723
Submission received: 7 May 2012
/
Revised: 27 June 2012
/
Accepted: 13 August 2012
/
Published: 21 August 2012
Abstract
:Site index (SI) curves for H20 (dominant height at 20 years total age) were constructed for hybrid larch (Larix × eurolepis Henry) growing in 26 stands on former farmland in southern and central Sweden (Latitude 56–60° N.). The mean total age of the stands was 23 ± 10 (range 17–49) years; the mean diameter at breast height (ob) was 16 (7–34) cm; the mean height was 14 (8–29) m; and the stands had a mean density of 993 (266–2195) stems ha−1. A model derived by Cieszewski (2001) performed best for the data. The model explained 99% of the observed variation in height development. No apparent bias across the range of predicted site indices was found. SI was examined in relation to soil types. Multiple samples were available for three soil types: light clay, medium clay and till. There were no significant differences between these soil types with respect to the choice of SI curve.
Keywords:
farmland; hybrid larch; Larix × eurolepis Henry; site index; soil types; top height; total age1. Introduction
Larch is an important species in the boreal forest. Most larch forests are found in the Northern hemisphere, and they are most widely distributed in Siberia and Canada [1]. Of the 16 larch species that exist, European larch (Larix decidua Miller) and Siberian larch (Larix siberica Ledeb) are the main species in Sweden, although Siberian larch is the only indigenous larch species in the country. European larch was introduced in the 18th century [2]. Larch plantations cover only small areas, representing <0.1% of the growing stock [3]. However, in the past 20–30 years, planting hybrid larch on former farmland has become more common.
At the beginning of the 1900s the first larch hybrid (Larix × eurolepis Henry) was found on the Dunkfeld estate in Scotland [4,5]. “Dunkfeld larch” is a hybrid between European larch and Japanese larch (Larix kœmpferi (Lamb.) Carr). This hybrid grows best on soils containing 70%–80% silt and with a pH of 5.0–6.0 [6]. Larch grows more rapidly than Scots pine (Pinus sylvestris L.) and on the same soil types and under the same site conditions [7]. Hybrid larch is a fast growing tree species. It has been shown to grow rapidly during the initial 20–30 years of a rotation. However, studies have shown that hybrid larch stands planted on sites previously occupied by Norway spruce (Picea abies (L.) Karst) infested by root rot (Heterobasidion annosum L.) are severely damaged by the root rot [8]. According to Vollbrecht and Stenlid [8], the main reason is the fast growth of young larch. Timber from larch is expected to be durable when used as an external construction material. At present, timber prices are high, leading to a high timber expectation value for hybrid larch compared with other larch and spruce species in Sweden [7].
Site index curves are widely used by foresters for site quality characterization and to estimate potential productivity [9]. The use of site index curves is based on the fact that there is a correlation between stand height and total volume production [10] and that, on high quality sites, height growth is good [11,12]. Site index has historically been defined as the top height of a stand at a specified age [12]. The top height is the arithmetic mean height of the 100 trees ha−1 with the greatest diameters [9]. Heights of individual trees can be measured easily and the average height growth of the dominant trees is less affected by thinning operations [11,12] and also less affected by stand density [13].
Traditionally, the site index base age selected is lower than the rotation age. However, modern dynamic equations allow for the use of any age as a base or reference age, linking ages directly to heights without converting the actual measurement to a fixed-base-age site index. Dynamic equations must fulfill specific requirements, as described by [14]: (1) they must pass through the origin; (2) the height must equal the site index (SI) at the base age; (3) they must be base age invariant curves; and (4) they must have a separate upper height asymptote. Cieszewski and Bailey [15] presented the Generalized Algebraic Difference Approach method (GADA), which is widely used when constructing index curves: [16,17,18,19,20,21,22,23,24,25].
Reports of site index curves for hybrid larch under Nordic conditions and especially for farmland sites are sparse. Various studies of the growth and yield of larch have been undertaken during the past century. Schober [26] constructed yield tables for European larch. In a study on Siberian larch, Wiksten [27] presented height development curves and yield production for southern and northern Sweden. Siberian larch (50–60 years old) grew at the same rate as Scots pine in southern Sweden but much more rapidly than Scots pine in northern Sweden. Tree volume functions and tables for European and Siberian larch in Finland were developed by Vuokila [28]. Ekö et al. [29] studied the growth pattern of hybrid larch grown in plantations in southern Sweden and produced a yield table. Site index curves for European and Japanese larch in Norway have been reported by Wielgolaski [30] and the growth and yield of hybrid larch have been studied by Ekö et al. [29] who presented a yield table representing the age range 15–45 years. The peak mean annual increment, 13 m3 ha−1 year−1, occurred at the age of 35 years.
As interest in planting and managing hybrid larch on former farmland is increasing in Sweden and there are now plantations older than 20 years, there is a need for site index curves for planning future management and forecasting stand production. Currently, no site index curves for hybrid larch growing under Swedish conditions are available. In the present study, models for the construction of SI curves are tested. The model chosen may be a first step towards prediction of stand volume production.
The objective of this paper is to present SI curves for young hybrid larch growing on former farmland in Sweden. The data originate from 26 localities, ranging in latitude from 55° to 60° N. Soils in the study were grouped into three main physical types and SI is reported in relation to these.
2. Materials and Methods
2.1. Study Site
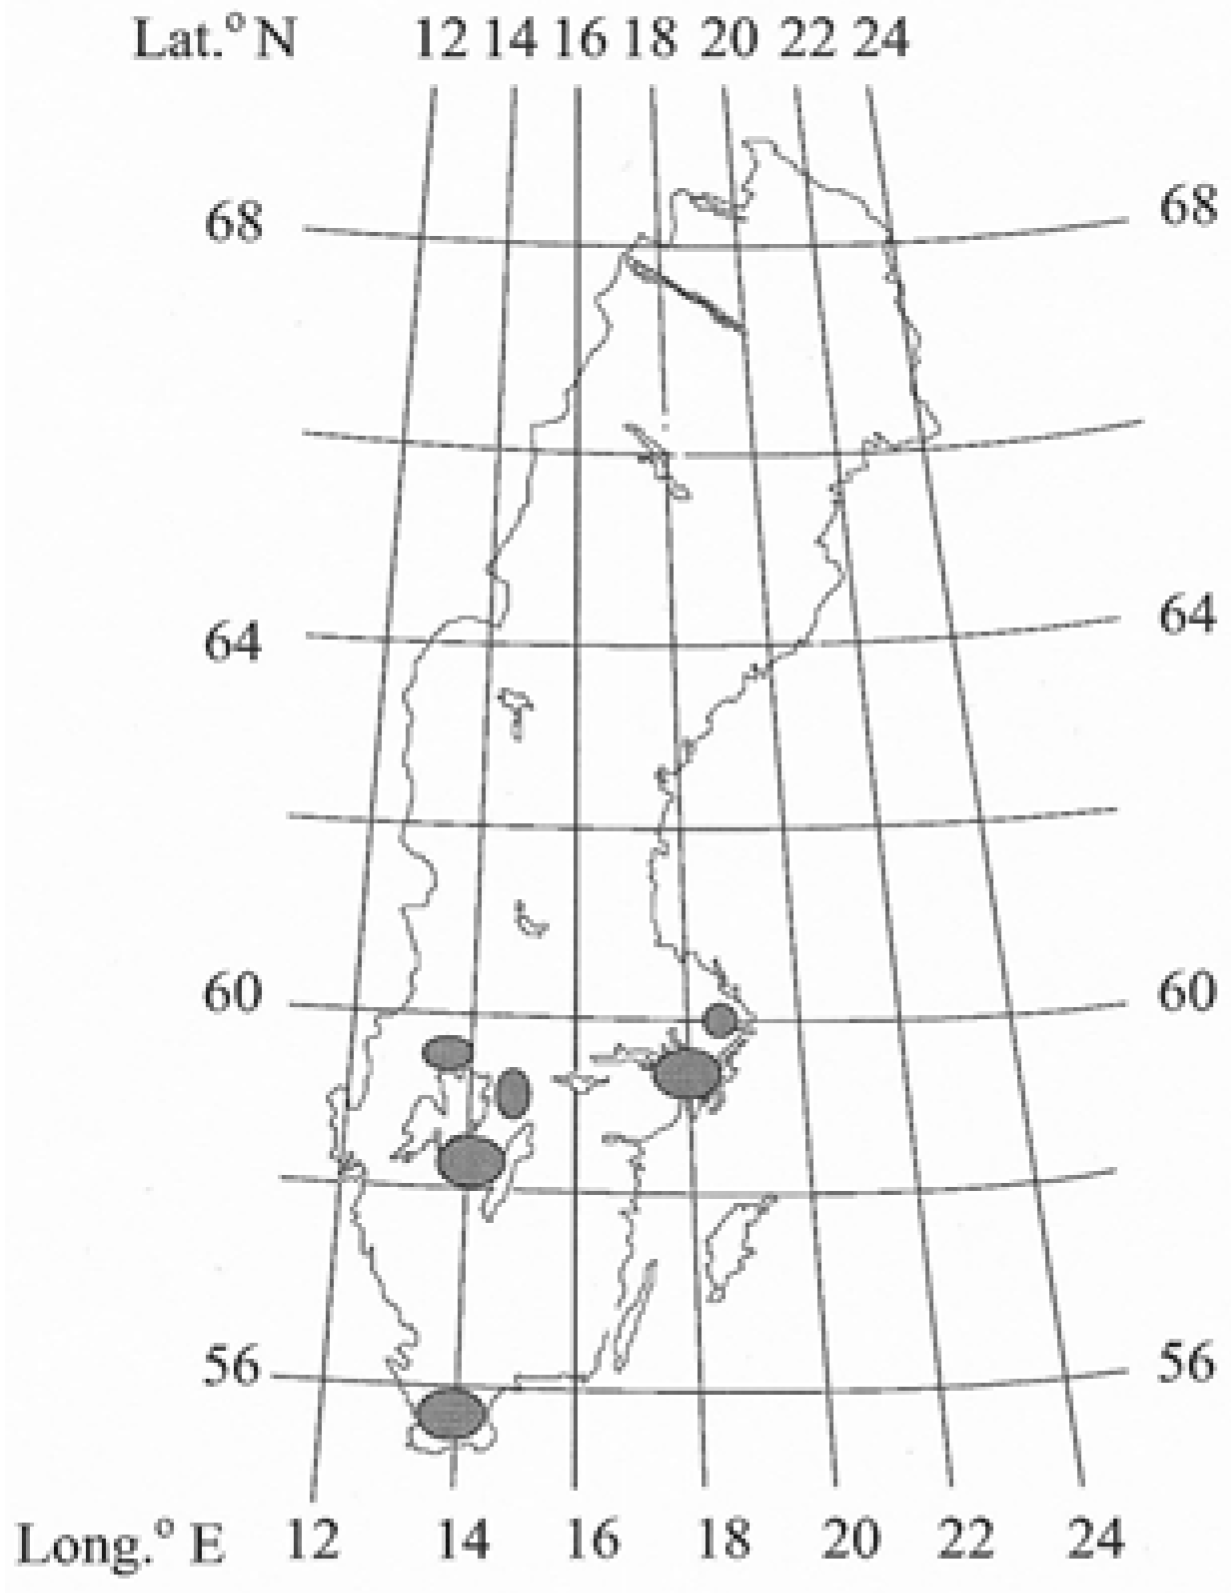
Data from 26 locations ranging from 55° to 60° N and altitudes from 5 to 230 m a.s.l. in Sweden were used (Figure 1 and Table 1). The stands were planted with 1-2-year-old rooted seedlings (containerized) of hybrid larch. As the planting of hybrid larch has only been practiced for a short time, most of the stands were young: about 20 years old. Some of the older stands (>20 years old) had been thinned. Some of the stands were less dense than expected as a result of damage by wild game and the presence of dense vegetation during the initial establishment period. The stands included in the study were all free from visible severe damage caused by wild game. The total age of the trees in the stands ranged from 17 to 49 years (Table 1). The area of the planted stands ranged from 0.04 to 0.22 ha. A sampling plot of varying sizes was marked out in the centre of each stand, at least 3 m from any edge in order to avoid edge effects of factors such as wind, open areas, ditches and shading by adjacent stands. The mean number of stems per hectare was based on the number of stems counted within the plots. The diameter at breast height (DBH) of all larches in the plot was measured by cross callipering (Table 1), and the arithmetic mean diameter was calculated for each stand. In order to determine the mean height of the hybrid larch, a statistical regression model was constructed for each stand. Overall, the mean DBH was 16.4 ± 7.3 (6.7–33.9) cm and the mean height 14.2 ± 5.5 (7.9–28.6) m.
Figure 1.
Locations of the sampled hybrid larch trees growing on former farmland in Sweden.


Table 1.
Summary statistics for height, age, diameter, stem number and basal area for stands and plots.
| Variable | Unit | No. localities/plots | Mean | SD | Min. | Max. |
|---|---|---|---|---|---|---|
| Stand characteristics | ||||||
| Stand size | m2 | 26 | 1197 | 158 | 465 | 2374 |
| Height | m | 26 | 14.2 | 5.5 | 7.9 | 28.6 |
| Age | years | 26 | 23 | 10 | 17 | 49 |
| Diameter | cm | 26 | 16.4 | 7.3 | 6.7 | 33.9 |
| Stem number | stems ha−1 | 26 | 993 | 557 | 266 | 2165 |
| Basal area | m2 ha−1 | 26 | 18.1 | 9.5 | 4.3 | 35.7 |
| Plot characteristics | ||||||
| Plot size | m2 | 42 | 753 | 464 | 400 | 2200 |
| Height | m | 42 | 14.3 | 3.2 | 8.0 | 27.8 |
| Diameter | cm | 42 | 18.4 | 4.1 | 7.6 | 36.4 |
The height and diameter of 9 trees in two subsample plots each in each stand were measured. The two subsample plots (3 trees by 3 rows close to each other) were systematically located: e.g., the first measured tree was the fifth tree in the third row. The other subsample plot was positioned diagonally opposite to the first plot within the stand. A regression model for each stand describing the relationship between height and diameter was then constructed. The rooting depth was >30 cm in all cases.
Fries [31] recommended that up to three trees should be sampled when estimating the site index, so we sampled one to three dominant trees from each of the 26 stands. Sampled trees should be free from damage, have a straight stem and a single leader and not be infested by fungi (rot). The trees chosen for sampling (42 trees) were all felled. The mean height of the sampled trees was 14.3 ± 3.2 (8.0–27.8) m and the mean diameter 18.4 ± 4.1 (7.6–36.4) cm (Table 1). Cores from the stem were then taken at points representing 1, 10, 20, 30, 50, 70, and 90% of the tree height and at breast height, i.e., 1.3 m. In all cases, documentation was available providing information on tree age. The total age is the sum of the age of the seedlings (1–2 years) at the time of planting and the documented age of the stand.
2.2. Soil Sampling
Two soil samples were taken at random in each stand to a depth of 30 cm and the mean texture of the sampled layer was determined. Soils were classified in the field as tills or sediments [32] according to Ekström [33] and then by particle size in the laboratory. The particle size distribution was determined using a mechanical sieving method (English and German standard), and soil types were classified as follows: (a) sediments-gravel (2–20 mm), coarse sand (0.2–2 mm), fine sand (0.02–0.2 mm), silt (0.002–0.02 mm), or clay (<0.002 mm); (b) tills-gravel, sandy, fine sandy, or silty; and (c) organogenic soils-moorland peat or moss peat. Although the soil samples contained particles of different sizes, their type designation was based on the most frequent particle size present, and this was combined with one or two prefixes associated with other less frequent soil particle sizes Clay soils were then classified based on their percentage clay, as follows: light clay (13%–29%), medium clay (30–40%), heavy clay (41%–60%), and till clay (13%–60%). The soil profile was analyzed and the mineral soil type recorded for all stands. Of the 26 stands, nine were on light clay, seven on till soils (sandy silty tills and light clay tills) and eight on medium clay soils. The mean site index (H20) for hybrid larch stands growing on each specific soil type was calculated.
2.3. Construction of Site Index Curves
In an area of artificial regeneration, where all trees are of the same age and the total age is known, the use of top height over total age is preferable [17]. According to Monserud [13] and Newberry [34] the height of the trees as an index of age is either observable or can be estimated with reasonable accuracy for each plot in a stem analysis study. The age at the height of coring might provide a slight underestimate. This underestimate will amount to half the height of felling level [35]. But this underestimate is of minor importance [16] and was not taken into consideration in the present study.
A data set was collected for each hybrid larch, comprising height–age data pairs. Initial data were grouped pair wise incorporating all possible pairs; both “forwards” and “backwards” [16,36,37]. The initial step involved producing height/age for each stand. Then the reference age, A1 was replaced with 20 years.
For all models below the abbreviations used are: H1 = Height at index age (H20), m; H2 = Height at total age, m; A1 = Reference age for site index, years; A2 = Tree age, years. The models tested were:
![Forests 03 00723 i001]() where β0, β1 are parameters.
where β0, β1 are parameters.- • A Hossfield-based model proposed by Cieszewski and Bella [39]:
![Forests 03 00723 i002]() where D = β0/Kβ1; R = [(H1 − D)2 + 4 × β0 × H1/A1β1]0.5 K; β0, β1 are parameters.
where D = β0/Kβ1; R = [(H1 − D)2 + 4 × β0 × H1/A1β1]0.5 K; β0, β1 are parameters. - • A model derived by Cieszewski [40] (Equation (21)):
![Forests 03 00723 i003]() where P = Z0 × (Z02 + (2 × β1 × H1)/A1β0)0.5; Z0 = H1 − β2 β0; β1, β2 are parameters.
where P = Z0 × (Z02 + (2 × β1 × H1)/A1β0)0.5; Z0 = H1 − β2 β0; β1, β2 are parameters.


2.4. Statistical Analysis
The data were analyzed by nonlinear regression using the SAS/STAT system for personal computers [41]. A measure of the goodness of fit of the nonlinear regressions was based on the coefficient of determination [42]:

Where SSE is the sum of squares of the error terms; and SST is the total sum of squares.
The performance of each of the models was evaluated using mean error (ME), mean absolute error (MAE), mean percentage of absolute error (MAPE), root mean squared error (RMSE) and residual plots. According to Parresol et al. [43] MAE provides a clear distinction between models examined.


where Yi and Ŷi are observed and predicted values of heights (Y).
Throughout this paper, means in statistical tests are presented along with their standard error, SE. As the curve profiles differed even though results of the statistical tests were similar, visual examinations were important when deciding which model to recommend. Therefore the residuals for the models (age versus residuals and predicted height versus residuals) and the fitted curves for different site indices were overlaid onto the observed values (age and height) and examined visually. The validity of a model can be assessed using an independent data set [44]. However this validation procedure was not possible here as the number of available stands was restricted. Instead, the predictive capacity of the model was examined using a “leave-one-out cross validation” procedure. Data points for the entire experiment were omitted one at a time and the parameters were estimated using the reduced data set [24].
Data represent repeated measurements from individual plots and serial correlation may be present. Since the aim of the present study was to choose the most appropriate model for practical use in predicting height and site index and no apparent bias was observed, the problem of autocorrelation is likely to be small. Indeed, autocorrelation would not affect parameter estimates, which is the most important part of the work described herein. From a practical point of view the autocorrelation problem is generally ignored when using models for predicting height and site index [13,16,17,21,25,44,45,46]. Adame et al. [19] reported that the shapes of site index curves for rebollo oak (Quercus pyrenaica Willd) were different with and without correction for autocorrelation. If the residuals are corrected for autocorrelation in the data, problems may be hidden within the model and lead to misinterpretation of any observed trends [47]. According to Kozak [48], autocorrelation does not seriously affect prediction capabilities. Based on these observations, the autocorrelation was not corrected for in the present study.
3. Results
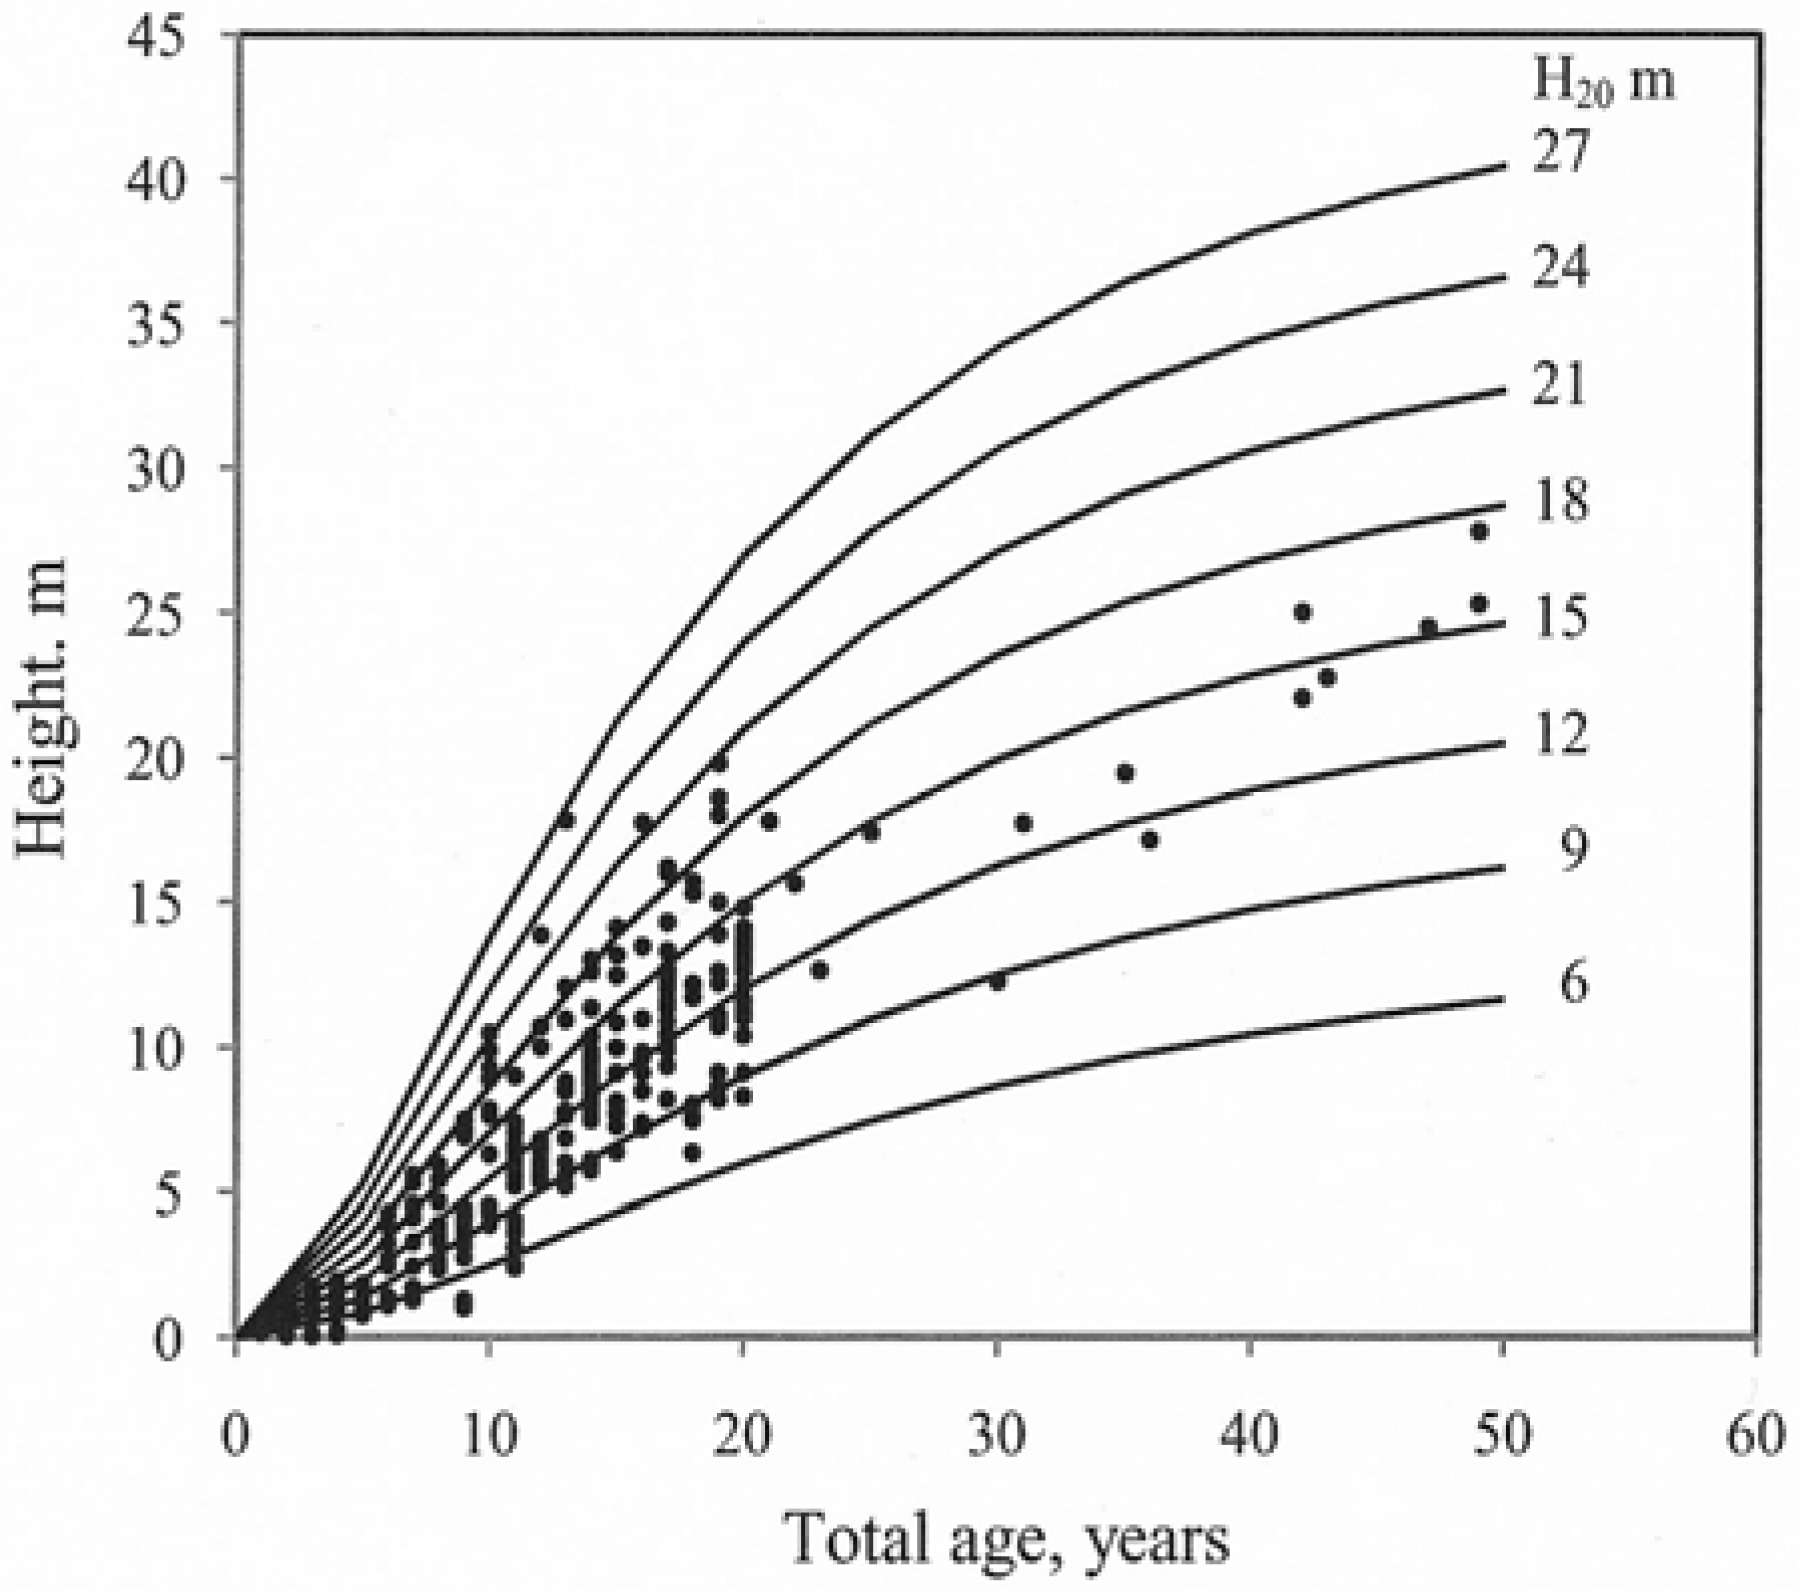
Parameter estimates for models 1–3 were determined on the basis of the data set (Table 2). The coefficient of determination (R2) for all models indicated a good correlation, 98%–99%, between the fitted curves and the estimated values. Further information about the parameter estimations is given in Table 2. The height predictions using Model (3) had the lowest RMSE (0.90 m). The fitted curves for different site indices overlaid onto the observed values (age and height) were examined visually (Figure 2).
| Model | Number of difference | Parameters | Parameter estimates | Se | Rmse M | R2 | Me M | Mae M | Mape % | Rmse 1 M | |
|---|---|---|---|---|---|---|---|---|---|---|---|
| Total age | |||||||||||
| 1 | 3024 | β0 | −0.0205 | 0.0010 | 1.18 | 0.98 | 0.07 | 0.79 | 12.73 | 1.18 | |
| β1 | 1.5520 | 0.0183 | |||||||||
| 2 | 3024 | β0 | 238.4000 | 6.1271 | 1.22 | 0.98 | −0.03 | 0.83 | 13.46 | 1.22 | |
| β1 | 1.4072 | 0.0129 | |||||||||
| K | 1.8257 | 0.0456 | |||||||||
| 3 | 3024 | β0 | 1.7187 | 0.0127 | 0.90 | 0.99 | 0.07 | 0.66 | 10.69 | 0.90 | |
| β1 | 4857.4000 | 9.7000 | |||||||||
| β2 | 24.9287 | 0.3240 | |||||||||
1 Root mean square of the cross-validation procedure.
Figure 2.
Site index curves (H20) for hybrid larch growing at different locations (lattitude 55° to 60° N.) n = 26 stands. Total age.
Figure 2.
Site index curves (H20) for hybrid larch growing at different locations (lattitude 55° to 60° N.) n = 26 stands. Total age.

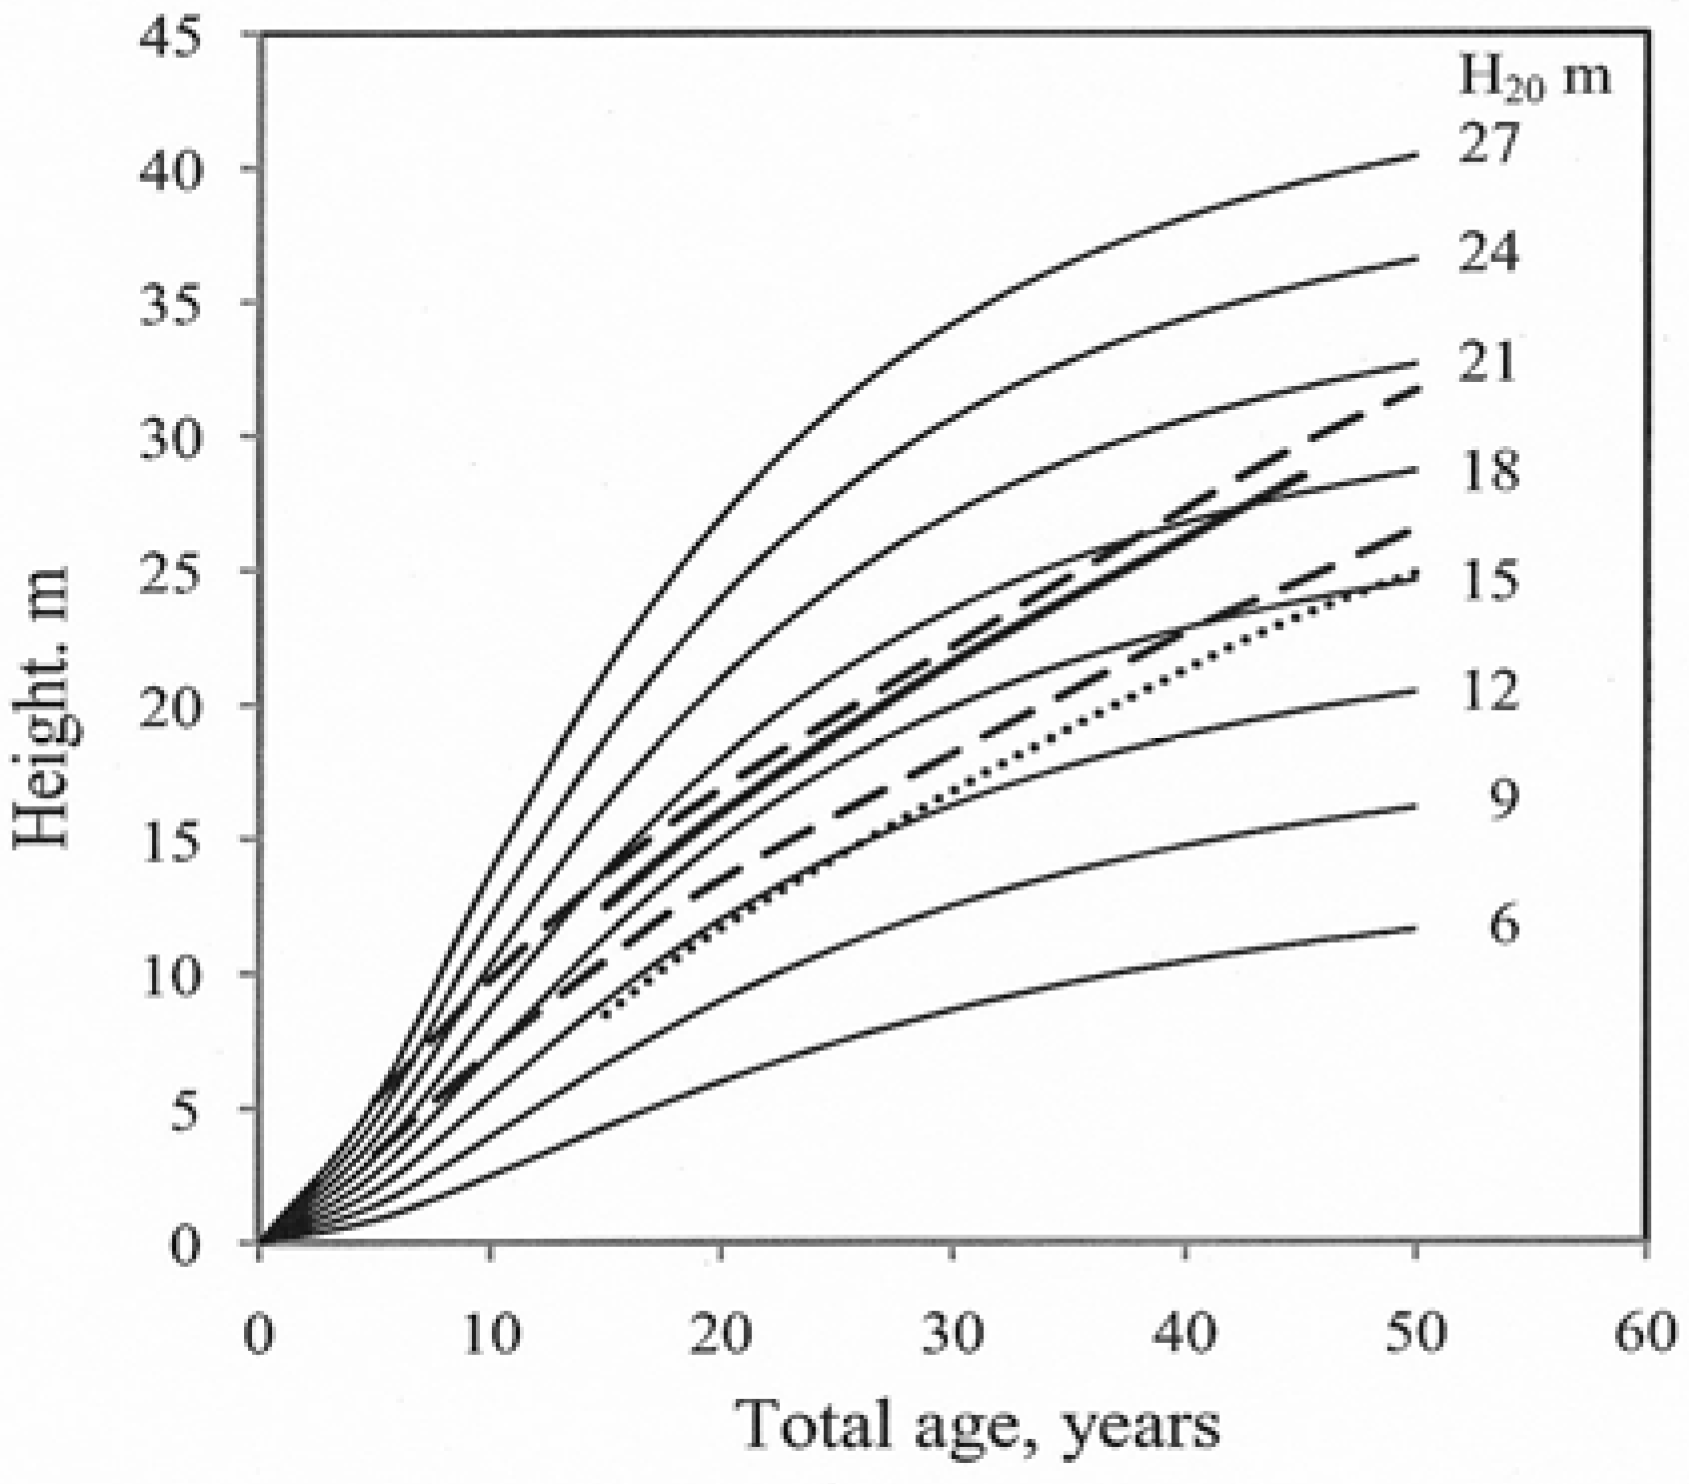
Model (3) fitted the data from the sampled trees well and the curves reflected the observed data throughout the entire age interval for which data were available. Height growth decreased with increasing age. The growth curves for models (1) and (2) did not follow the typical decrease in height growth with increasing age. The residuals for the tested models (age vs. residuals and predicted height vs. residuals) were examined visually. Model (3) exhibited the best fit (Figure 3).
Figure 3.
Residuals of the site growth models for hybrid larch.
Average differences (MRES) between the observed and predicted tree heights were calculated for five age classes: 1–10, 11–20, 21–30, 31–40 and >40 years. Models (1) and (2) underestimated the height for age classes 31–40 and >40 years. Model (3) produced reasonable predictions and its performance was similar for all the age classes examined (Table 3).
| MRES for Models | ||||
|---|---|---|---|---|
| Age class | Number of observation | 1 | 2 | 3 |
| 1–10 | 1575 | −0.24 | −0.35 | −0.12 |
| 11–20 | 1323 | 0.36 | 0.29 | 0.28 |
| 21–30 | 45 | 0.24 | 0.06 | 0.02 |
| 31–40 | 27 | 0.65 | 0.57 | −0.21 |
| >40 | 54 | 1.73 | 0.91 | 0.60 |
| Total | 3024 | 0.07 | −0.03 | 0.07 |
There were small differences in ME for the models, −0.03 to 0.07 m, with the lowest value (−0.03) for model (2) (Table 2). MAE ranged between 0.66 and 0.83 m, with model (3) exhibiting the best performance. The accuracy (MAPE) of the tested models ranged between 10.69% and 13.46% with the best value for model (3), see Table 2. In the “leave-one-out-cross-validation” analyses RMSE was the same as for the fitted models (Table 2).
The mean SI (H20) for hybrid larch growing on specific soil types was calculated. The site index means for these soil types were: light clay 13.4 ± 3.0 m, medium clay 13.4 ± 3.3 m and till 13.1 ± 3.7 m. A t-test (LSD) indicated that there were no significant differences between the soil types. The different site locations had no impact on the results of the analysis.
4. Discussion
Site index should be assessed in young stands, but it can be difficult to estimate site index with any reliability [49]. In fact, in young stands site index estimates are highly variable and most researchers recommend that site index should be estimated for trees >20 years old, thus avoiding large prediction errors [14,50,51]. Most of the hybrid larches used in this study were planted at the end of the 1980s and the mean age was 23 ± 10 (17–49) years. The height curves for the stands examined represent the site index and the growth of the sampled trees and are related to the site productivity.
When estimating SI, height growth, especially for the tallest trees, should not have been influenced by thinning operations or by extreme competition, which reduces the mean height [9]. However, some of the hybrid larch stands studied had not been thinned even though the stands were dense. In contrast, stem number in some stands was low as a result of damage caused by wildlife. The sampled stems from these stands were carefully examined: the stem should not have had any visible signs of older gnawing damage; the annual ring width should have exhibited a “normal” development without groups of narrow rings followed by broader rings.
The collected data were suitable for constructing curves representing ages up to 50–60 years. Most of the stands were >11 m tall when they were 20 years old. The results of the constructed functions showed that model 3 fitted the data well. But models (1) and (2) had high asymptotes and the approach to get an asymptote parallel to age axis failed. They did not indicate a decrease in height development by increasing age. In the present study RMSE for model (3) was 0.90 m and the “leave-one-out cross validation” value was 0.93 m. In a study on the RMSE level related to the choice of base age, [37] found that RMSE decreased with increasing base age e.g., 1.7 m at <20 years to 0.8 m at 35–40 years. The RMSE value of 0.90 m in the present study seems to be within the range mentioned above.
Available data were restricted with regard to both the number of stands and the variation in stand age. Furthermore there was variation among the unmanaged stands (≈20 years old) with respect to stem number and growth capacity. The main reasons might be a lack of fencing or variable quality fencing, especially during the first five years after planting, and poor or no soil preparation at the site before planting. The tree height within a stand growing on former farmland is more uniform than on forest land. However, the standard deviations (SD) for hybrid larch diameter and height found in the present study show that there are differences between trees within stands (164 ± 73 mm and 14.2 ± 5.5 m respectively) and between the top heights of trees (184 ± 41 mm and 14.3 ± 3.2 m respectively).
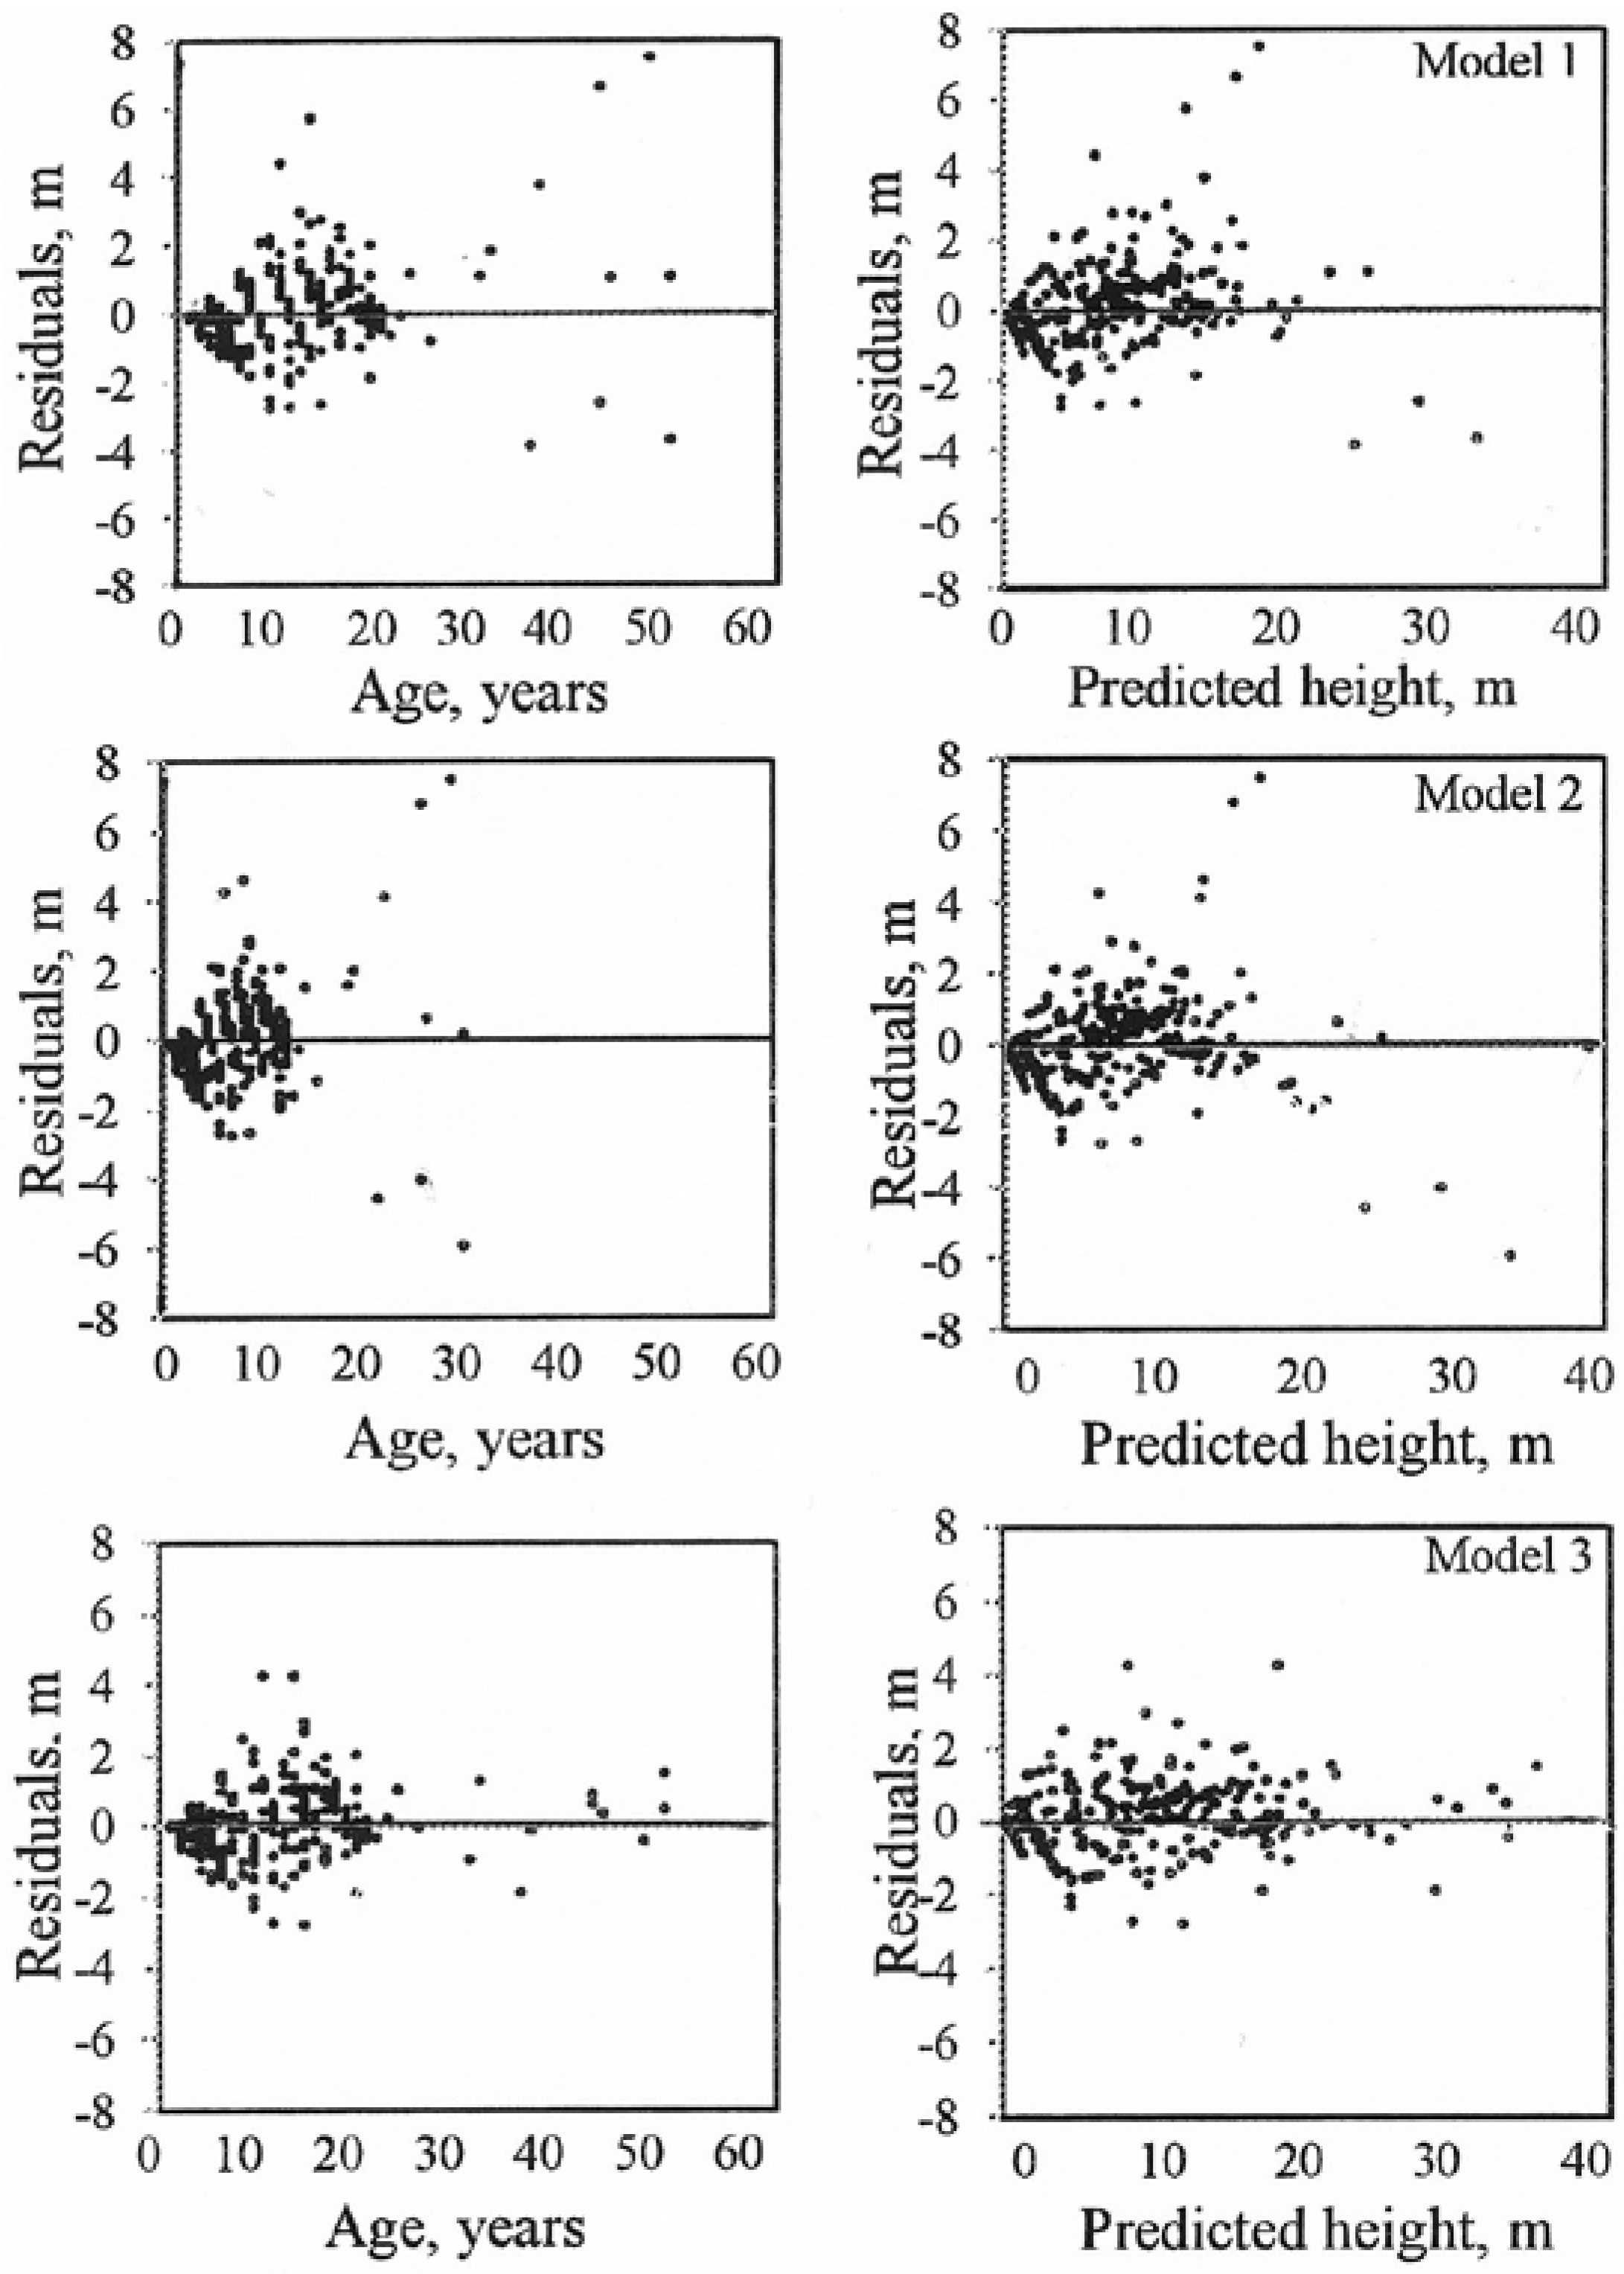
There are few reports presenting the results of site index studies of hybrid larch. The site index curves in the present study were compared with a calculated curve for the estimated top heights of hybrid larch growing on farmland in Sweden [7] corresponding to H20 = 16–18 m for the age interval 15–45 years (Figure 4). There are some studies reporting site indexes for Japanese larch. In a Danish study the site “Bon. B” corresponds to H20 = 12 m [52], indicating a faster growth in older stands than found in the present study. In a Norwegian study, with H40 = 26 and 29 m, representing H20 = 14 and 17 m respectively, the curve indicates faster growth than in the present study [30] of Figure 4.
Figure 4.
Site index for hybrid larch. The lines represent values for the top heights of hybrid larch growing on former farmland in Sweden reported by Larsson-Stern (2005) “ ![Forests 03 00723 i009]() ”, site index for Japanese larch in Norway reported by Wielgolaski et al. (1993), H40 = 26 and 29 m “
”, site index for Japanese larch in Norway reported by Wielgolaski et al. (1993), H40 = 26 and 29 m “ ![Forests 03 00723 i010]() ” and for Japanese larch in Denmark (Andersen, 1950), Bon B, “
” and for Japanese larch in Denmark (Andersen, 1950), Bon B, “ ![Forests 03 00723 i011]() ”.
”.
 ”, site index for Japanese larch in Norway reported by Wielgolaski et al. (1993), H40 = 26 and 29 m “
  ” and for Japanese larch in Denmark (Andersen, 1950), Bon B, “
  ”.
”.
Figure 4.
Site index for hybrid larch. The lines represent values for the top heights of hybrid larch growing on former farmland in Sweden reported by Larsson-Stern (2005) “ ![Forests 03 00723 i009]() ”, site index for Japanese larch in Norway reported by Wielgolaski et al. (1993), H40 = 26 and 29 m “
”, site index for Japanese larch in Norway reported by Wielgolaski et al. (1993), H40 = 26 and 29 m “ ![Forests 03 00723 i010]() ” and for Japanese larch in Denmark (Andersen, 1950), Bon B, “
” and for Japanese larch in Denmark (Andersen, 1950), Bon B, “ ![Forests 03 00723 i011]() ”.
”.
”, site index for Japanese larch in Norway reported by Wielgolaski et al. (1993), H40 = 26 and 29 m “ ” and for Japanese larch in Denmark (Andersen, 1950), Bon B, “ ”.
5. Conclusions
This first Swedish site index, developed for hybrid larch growing on former farmland, can be recommended for practical use. However the proposed site index model should be revised and improved as soon as more data and information are available. When planted on former farmland, hybrid larch has the potential to achieve good early growth. In the present study most stands were growing on sediments (light-medium clay soils). However it is important to undertake appropriate soil treatment to facilitate the establishment of seedlings and to fence the plantation to avoid damage by wildlife.
Acknowledgements
E. Temnerud, L. Hedman, L.B. Hjelm and M. Johansson measured and cut stands. M. Johansson carried out the tree ring analyses in the laboratory. Linguistic revision was made by Sees-Editing Ltd UK. All of the above are gratefully acknowledged. Skogssällskapet foundation provided financial support.
Conflict of Interest
The authors declare no conflict of interest.
References
- Schmidt, W.C. Around the world with Larix: An introduction. In Ecology and Management of Larix Forests: A Look Ahead, Proceedings of an International Symposium, Whitefish, MT, USA, 5–9 October 1992; USDA Forest Service: Golden, CO, USA; pp. 6–10.
- Schotte, G. Lärken och dess betydelse för svensk skoghushållning (in Swedish). Medd. Stat. Skogsförsöksanst. 1917, 922, 13–14. [Google Scholar]
- Swedish Forest Agency, Swedish Statistical Yearbook of Forestry 2011; Swedish Forest Agency: Jönköping, Sweden, 2011.
- Cook, D.B. Characteristics of dunkfeld larch and its parent species. J. For. 1946, 80, 844–845. [Google Scholar]
- Dallimore, W.; Jackson, A.B.; Harrison, S.G. A Handbook of Conifer and Ginkgoaceae, 4th ed; St. Martins Press: New York, NY, USA, 1967; p. 729. [Google Scholar]
- Rawinski, J.J.; Bowler, J.A.; Noste, N.V. Soil Properties Related to Coniferous Seedling Height Growth in Southern Wiscounsin; Research Note NC-254; United States Department of Agriculture (USDA), North Central Forest Experiment Station: Saint Paul, MN, USA, 1992; p. 3. [Google Scholar]
- Larsson-Stern, M. Aspects of Hybrid Larch (Larix × eurolepis A. Henry) as a Potential Tree Species in Southern Swedish Forestry. Ph.D. Dissertation, Swedish University of Agricultural Sciences, Uppsala, Sweden, 2003. [Google Scholar]
- Vollbrecht, G.; Stenlid, J. Transfer of the P-type of Heterobasidion annosum form old-growth stumps of Picea abies and Larix × eurolepis. Eur. J. For. Path. 1999, 29, 153–159. [Google Scholar] [CrossRef]
- Hägglund, B. Evaluation of forest site productivity. Commonw. For. Bur. For. Abstr. 1981, 42, 515–527. [Google Scholar]
- Beamont, J.-F.; Ung, C.H.; Bernier-Cardou, M. Relating site index to ecological factors in black spruce stands: Tests of hypothesis. For. Sci. 1999, 45, 484–491. [Google Scholar]
- Bailey, R.L.; Clutter, J.L. Base-Age invariant polymorphic site curves. For. Sci. 1974, 20, 155–159. [Google Scholar]
- Clutter, J.L.; Fortson, J.C.; Pienaar, L.V.; Brister, G.H.; Bailey, R.L. Timber Management: A Quantitative Approach; John Wiley & Sons.: New York, NY, USA, 1983; pp. 30–62. [Google Scholar]
- Monserud, R.A. Height growth and site index curves for inland Douglas-fir based on stem analysis data and forest habitat types. For. Sci. 1984, 30, 945–965. [Google Scholar]
- Borders, B.E.; Bailey, R.L.; Ware, K.D. Slash pine site index from a polymorphic model by joining (splining) nonpolynomial segments with an algebraic difference method. For. Sci. 1984, 30, 411–423. [Google Scholar]
- Cieszewski, C.J.; Bailey, R.L. Generalize algebraic difference approach: Theory based deviation of dynamic site equations with polymorphism and variable asymptotes. For. Sci. 2000, 46, 116–126. [Google Scholar]
- Eriksson, H.; Johansson, U.; Kiviste, A. A site-index model for pure and mixed stands of Betula pendula and Betula pubescens in Sweden. Scand. J. For. Res. 1997, 12, 49–156. [Google Scholar]
- Elfving, B.; Kiviste, A. Construction of site index equations for Pinus sylvestris L. using permanent plot data in Sweden. For. Ecol. Manag. 1997, 98, 125–134. [Google Scholar] [CrossRef]
- Trincado, G.V.; Kiviste, A.; von Gadow, K. Preliminary site index models for native roble (Nothofagus oblique) and rauli (N. Alpine) in Chile. J. For. Sci. 2002, 32, 322–333. [Google Scholar]
- Adame, P.; Cañellas, I.; Roig, S.; del Río, M. Modeling dominant height growth and site index curves rebollo oak (Quercus pyrenaica Willd). Ann. For. Sci. 2006, 63, 629–940. [Google Scholar]
- De Santos-Posadas, H.M.; Montero-Mata, M.; Kanninen, M. Dynamic dominant height growth curves for Terminalia Amazonia (Gmel). Excell in Costa Rica. Artícul. Agrociencia. 2006, 40, pp. 521–532. Available online: http://www.citeulike.org/group/15200/article/9308792 (accessed on 17 August 2012).
- Diéguez-Aranda, U.; Burkhart, H.E.; Amateis, R.L. Dynamic site model for loblolly pine (Pinus taeda L.) plantations in the United States. For. Sci. 2006, 52, 262–272. [Google Scholar]
- Diéguez-Aranda, U.; Grandaz-Arias, J.A.; Álvarez-Gonzáles, J.G.; Gadow, K.V. Site quality curves for birch stands in North Western Spain. Silva Fenn. 2006, 40, 631–644. [Google Scholar]
- Kiveste, A.; Kiveste, K. Algebraic difference equations for stand height, diameter, and volume depending on stand age and site factors for Estonian state forests. Math. Comput. For. Nat. Res. Sci. 2009, 1, 67–77. [Google Scholar]
- Nord-Larsen, T.; Meilby, H.; Skovsgaard, J. Site specific height growth models for six common tree species in Denmark. Scand. J. For. Res. 2009, 24, 194–204. [Google Scholar] [CrossRef]
- Diaz-Marato, I.J.; Fernández-Parajes, J.; Vila-Lameiro, P.; Baracala-Pérez, E. Site index model for natural stands of rebollo oak (Quercus pyrenaica Willd.) in Galicia, NW Iberian Peninsula. Cienc. For. St. Maria 2010, 20, 57–68. [Google Scholar]
- Schober, R. Ertragstafel Fűr Europäische Lärche. Grűnberg in Hessen (in German); Im Selbstverlag des Verfassers: Grünber, Germany, 1946. [Google Scholar]
- Wiksten, Å. Några exempel på den sibiriska lärkens (Larix sibirica Lebed) produktionsförmåga i Sverige (in Swedish). Medd. från Stat. Skogsforskn. Inst. 1962, 51, 43. [Google Scholar]
- Vuokila, Y. Lehtikuusen kuutioimisyhtälöt ja-taulukot (in Swedish). Commun. Inst. For. Fenn. 1960, 51, 89. [Google Scholar]
- Ekö, P.M.; Larsson-Stern, M.; Albrektsson, A. Growth and yield of hybrid larch (Larix × eurolepis A. Henry) in Southern Sweden. Scand. J. For. Res. 2004, 19, 320–328. [Google Scholar] [CrossRef]
- Wielgolaski, F.M. Growth Studies in Plantations of Larix decidua Mill. and L. Kaempferi Carr. in Western Norway. I. Site-Index curves; Norsk Institutt for Skogforskning: Aas, Norway, 1993. [Google Scholar]
- Fries, J. Vårtbjörkens produktion i svealand och södra norrland (in Swedish). Stud. For. Suec. 1964, 14, 303. [Google Scholar]
- Johansson, T. Biomass equations for determining fractions of pendula and pubescent birches growing on abandoned farmland and some practical implications. Biomass Bioenergy 1999, 16, 223–238. [Google Scholar] [CrossRef]
- Ekström, G. Klassifikation av Svenska Åkerjordar (in Swedish); Geological Survey of Sweden: Stockholm, Sweden, 1929; pp. 1–161. [Google Scholar]
- Newberry, J.D. A note on Carmean’s estimate of height from analysis data. For. Sci. 1991, 37, 368–369. [Google Scholar]
- Carmean, W.H. Site index curves for upland oaks in the Central States. For. Sci. 1972, 18, 109–120. [Google Scholar]
- Borders, B.E.; Bailey, R.L.; Clutter, M.L. Forest growth models: Parameter estimations using real growth series. In Forest Growth Modeling and Prediction; General Technical Report NC-120; Ek, A.R., Shirley, S.R., Burk, T.E., Eds.; U.S. Department of Agriculture, Forest Service, North Central Forest Experiment Station: Newtown Square, PA, USA, 1988; pp. 660–667. [Google Scholar]
- Goelz, J.C.G.; Burk, T.E. Development of a well behaved site index equation: Jack pine in north central Ontario. Can. J. For. Res. 1992, 22, 776–784. [Google Scholar] [CrossRef]
- Richards, F.J. A flexible growth function for empirical use. J. Exp. Bot. 1959, 10, 290–300. [Google Scholar] [CrossRef]
- Cieszewski, C.J.; Bella, I.E. Polymorphic height and site index curves for Lodgepole pine in Alberta. Can. J. For. Res. 1989, 19, 1151–1160. [Google Scholar] [CrossRef]
- Cieszewski, C.J. Three models of deriving advanced dynamic site equations demonstrated on inland Douglas-fir site curves. Can. J. For. Res. 2001, 31, 165–173. [Google Scholar] [CrossRef]
- SAS, Version 9.1, SAS Institute Inc.: Cary, NC, USA, 2006.
- Zar, J.H. Biostatistical Analysis; Prentice-Hall: Englewood Cliffs, NJ, USA, 2009. [Google Scholar]
- Parresol, B.R.; Hotvedt, J.E.; Cao, Q.V. A volume and taper prediction system for bald cypress. Can. J. For. Res. 1987, 17, 250–259. [Google Scholar] [CrossRef]
- Kozak, A.; Kozak, R. Does cross validation provide additional information in the evaluation of regression models? Can. J. For. Res. 2003, 33, 976–987. [Google Scholar] [CrossRef]
- Rayner, M.E. Site index and dominant height growth curves for regrowth karri (Eucalyptus diversicolor F. Muell) in South-Western Australia. For. Ecol. Manag. 1991, 44, 261–283. [Google Scholar] [CrossRef]
- Wang, M.; Rennolls, K.; Borders, B.E. Base-Age invariant site index models from a generalized algebraic parameter prediction approach. For. Sci. 2008, 54, 625–632. [Google Scholar]
- Nord-Larsen, T. Developing dynamic site index curves for European beech (Fagus sylvatica L.) in Denmark. For. Sci. 2006, 52, 173–181. [Google Scholar]
- Kozak, A. Effect of multicollinearity and auto correlation on the variable-exponent taper equations. Can. J. Res. 1997, 27, 619–629. [Google Scholar] [CrossRef]
- Huang, S. Development of compatible height and site index models for young and mature stands within an ecosystem-based management framework. In Empirical and Process Based Models for Forest Trees and Stand Growth Simulation; Amaro, A., Tomé, M., Eds.; Empirical and Process Based Models for Forest Trees and Stand Growth Simulation: Oeiras, Portugal, 1997; pp. 61–98. [Google Scholar]
- Devan, J.S.; Burkhart, H.E. Polymorphic site index equations for loblolly pine based on a segmented polynomial differential model. For. Sci. 1982, 28, 544–555. [Google Scholar]
- Carmean, W.H.; Lenthall, D.J. Height growth and site-index curves for jack pine in north central Ontario. Can. J. For. Res. 1989, 19, 215–224. [Google Scholar] [CrossRef]
- Andersen, M. Form factor investigations and yield tables for Japanese larch in Denmark. Forstlige Forsøgsvœsen i Dan. 1950, 19, 331–410. [Google Scholar]
© 2012 by the authors; licensee MDPI, Basel, Switzerland. This article is an open-access article distributed under the terms and conditions of the Creative Commons Attribution license (http://creativecommons.org/licenses/by/3.0/).
Share and Cite
MDPI and ACS Style
Johansson, T. Site Index Curves for Young Hybrid Larch Growing on Former Farmland in Sweden. Forests 2012, 3, 723-735. https://doi.org/10.3390/f3030723
AMA Style
Johansson T. Site Index Curves for Young Hybrid Larch Growing on Former Farmland in Sweden. Forests. 2012; 3(3):723-735. https://doi.org/10.3390/f3030723
Chicago/Turabian StyleJohansson, Tord. 2012. "Site Index Curves for Young Hybrid Larch Growing on Former Farmland in Sweden" Forests 3, no. 3: 723-735. https://doi.org/10.3390/f3030723