Article

Spatial Analysis of Conservation Priorities Based on Ecosystem Services in the Atlantic Forest Region of Misiones, Argentina

by
Andrea E. Izquierdo
1,2,* and
Matthew L. Clark
3
1
CONICET, Institute of Regional Ecology (IER), National University of Tucumán, Casilla de correo 34, Yerba Buena 4107, Tucumán, Argentina
2
Center for Atlantic Forest Investigation (CeIBA), Bertoni 85-N3370BFA, Puerto Iguazú, Misiones, Argentina
3
Center for Interdisciplinary Geospatial Analysis, Department of Geography and Global Studies, Sonoma State University, Rohnert Park, CA 94928, USA
*
Author to whom correspondence should be addressed.
Forests 2012, 3(3), 764-786; https://doi.org/10.3390/f3030764
Submission received: 11 June 2012 / Revised: 31 July 2012 / Accepted: 13 August 2012 / Published: 27 August 2012

Abstract

:
Understanding the spatial pattern of ecosystem services is important for effective environmental policy and decision-making. In this study, we use a geospatial decision-support tool (Marxan) to identify conservation priorities for habitat and a suite of ecosystem services (storage carbon, soil retention and water yield) in the Upper Paraná Atlantic Forest from Misiones, Argentina—an area of global conservation priority. Using these results, we then evaluate the efficiency of existing protected areas in conserving both habitat and ecosystem services. Selected areas for conserving habitat had an overlap of carbon and soil ecosystem services. Yet, selected areas for water yield did not have this overlap. Furthermore, selected areas with relatively high overlap of ecosystem services tended to be inside protected areas; however, other important areas for ecosystem services (i.e., central highlands) do not have legal protection, revealing the importance of enforcing existing environmental regulations in these areas.

1. Introduction

Traditionally, conservation prioritization has focused on habitat for species, considering endemic or endangered species distributions, and their threats or pressures [1,2,3]. More recently, conservationists and land managers have become interested in other aspects of conservation aside from biodiversity and habitat, such as the goods and services that benefit people that are provided by ecological systems [4,5,6]. Our ability to assess synergies between both conservation goals—ecosystem services and biodiversity/habitat—could help to achieve both simultaneously, providing a “win-win” network of priority areas that conserve biotic diversity and ecological function while supporting the well-being of human society [4].
The creation and effective management of a protected area system is one of the ways to achieve these dual biotic and human-focused goals [7,8]. However, although ecosystem services have entered the land-use decision-making process [9], they have rarely been a central goal in the design and/or management of protected areas which have been mostly located on the basis of idiosyncratic opportunities, such as land price, political expediency or scenic beauty [10,11]. Other environmental policies aim to achieve a balance between conservation and land conversion necessary for the production of food and other goods. These apparently diametrically-opposed goals [12,13] have encouraged two approaches for achieving greater efficiency of land use, known as land sparing [14,15,16] and land sharing [17,18]. The land sparing approach attempts to separate high-yield farming land in some areas, with protected areas for nature conservation in others; on the other hand, land sharing integrates both objectives on the same land by using wildlife-friendly farming methods.
Whatever the approach, including ecosystem services in environmental policies and decision-making requires a minimum knowledge of their spatial pattern and interactions [19]. Although some global analyses explore the spatial patterns of multiple ecosystem services in conservation priorities [20,21], available data for these assessments are often incomplete [21,22]. Finer-scale studies (e.g., state/province, municipality/county), where actual conservation investments typically occur, are essential yet often non-existent [21]. Our study, focused in the state/province of Misiones in Argentina, provides an example of how a network of protected areas can be designed to incorporate multiple, overlapping ecosystem services.
Our study uses Marxan, a tool for selecting optimal sites for conservation [23]. The Marxan analysis aims to achieve representation of conservation targets while considering human impacts. The ability to spatially quantify this interaction provides a basis for strategic planning and fosters debate on conservation needs. Examples of conservation targets used in Marxan are species occurrences [24,25], ecological systems or habitats [24,26,27], and ecosystem services [28]. Here we use Marxan to identify conservation priorities for habitat and a suite of ecosystem services, with site selection optimized for an efficient solution in a dynamic landscape. We have two main objectives:
  • (1) To identify priority areas for conservation of ecosystem services and habitat, and to analyze their spatial overlap.
  • (2) To analyze the efficiency of existing protected areas and other important lands in conserving areas with high overlap of ecosystem services and habitat.

2. Material and Methods
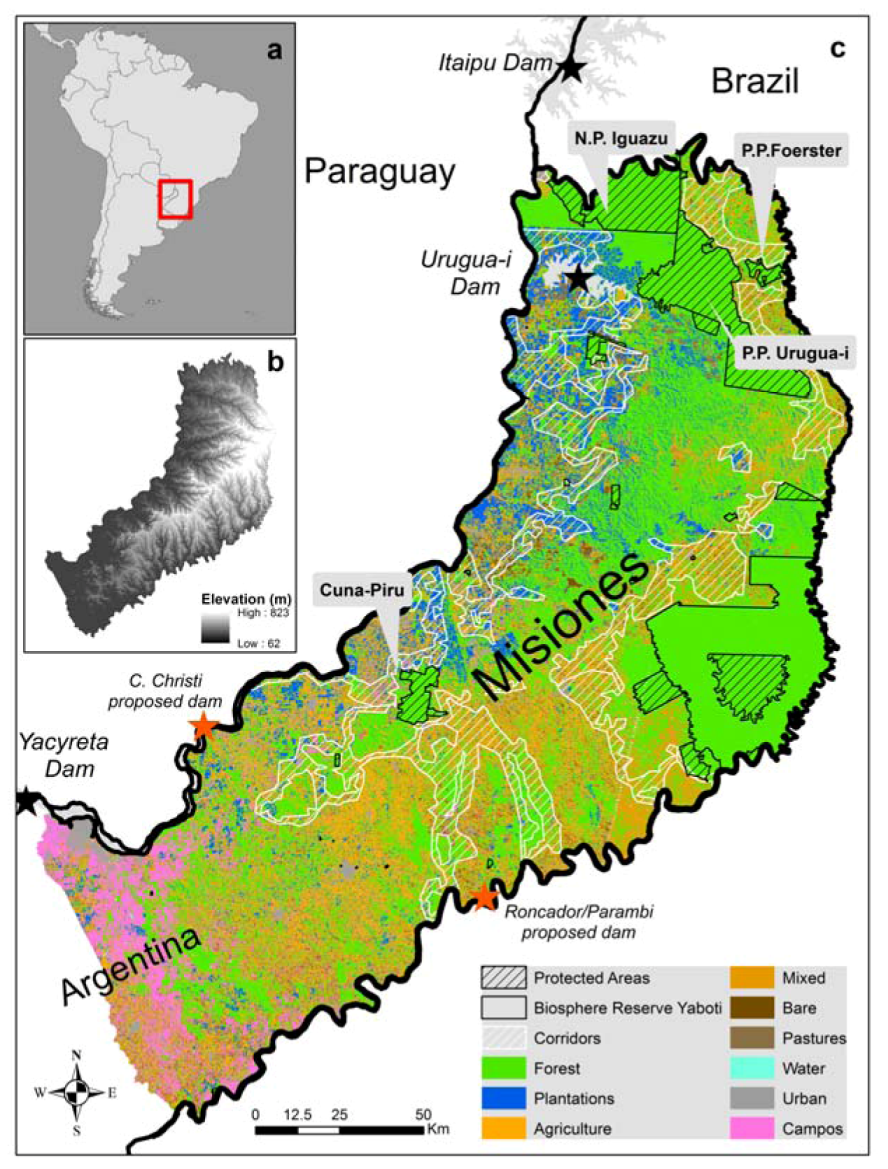
2.1. Study Area

This study was conducted in the province of Misiones (29,801 km2) in northeast Argentina (Figure 1). The climate in Misiones is subtropical humid without a marked dry season. Precipitation occurs year round, reaching an annual average of 2000 mm. The average annual temperature is 21 °C. The provincial territory contains 800 tributary streams of the Paraná and Uruguay rivers, which are the main rivers of the Del Plata watershed, and the northern boundary follows the Iguazú River which includes the famous Iguazú waterfalls.
Figure 1. Study area including: (a) location of Misiones in South America; (b) Misiones’ topography; and (c) land-use/land-cover, protected areas and biological corridors.
Forests 03 00764 g001
Misiones includes the largest remaining continuous area of Atlantic Forests (~10,000 km2) within the Upper Paraná Atlantic Forest ecoregion [29]. This is an ecoregion of global importance for conservation due to its high level of biodiversity and endemism. The ecoregion as a whole is classified as “endangered” due to relatively high levels of habitat loss and lack of adequate protection [30], placing it on Conservation International’s Hotspots list [31,32] and World Wildlife Fund (WWF) “Global 200” list of ecoregions for conservation priority [33]. Although socioeconomic factors have driven increased deforestation in Misiones in the last decades [34,35], economic development in the province has lagged behind most of the other Argentinean provinces [36], leaving a relatively large portion of its area still covered by forests (~49%). Misiones has acquired a “green” profile as it is the Argentine province with the largest percent of protected territory (~17%), although these protected areas have different levels of effective management. Since the creation of the Iguazú National Park as the first protected area in Misiones in 1934, 67 new protected areas have been created in the province under different jurisdictions. In addition, other initiatives and legal tools have been developed in the province to support conservation and sustainable development. For example, in 1985 the Ministry of Ecology and Renewable Natural Resources of Misiones (MERNR) was created and oversaw the creation of the Urugua-I Provincial Park in 1988, the largest protected area in Misiones (840 km2) and established as “environmental compensation” for the reservoir created by the construction of the Urugua-I dam . The area under protection was also strongly expanded by the creation of the Yaboti Biosphere Reserve in 1993, which includes a provincial park as a core protected area with no development and various private properties as buffer areas, with a total area of 268 km2; this area alone represents 52% of the current protected area in the province. However, the capacity of law enforcement varies among the administrations within the province and, as a consequence, among protected areas [37]. In addition, other initiatives and legal tools are being used in the province to support conservation and sustainable development, such as Green Corridor Provincial Law 3631 and the Landscape Planning Provincial Law, known as the “Ordenamiento Territorial” for Misiones. The Green Corridor Law promotes sustainable development in the area between the National Park Iguazú and Cuña-Pirú Valley to prevent the isolation of protected areas. The Landscape Planning Law is a provincial ratification to the National Law 23,331 (known as the “Forest Law”) which intended to regulate the protection, enrichment, restoration, utilization, and management of native forests and the environmental services they produce. The Landscape Planning Law categorizes remnant forest in three classes: category I or “red”—areas where no productive activities are permitted (224 km2); category II or “yellow”—areas where sustainable activities are allowed if no forest cover is lost (967 km2); and, category III or “green”—areas of low conservation value, which can be converted to other uses (448 km2).
In addition to native forests, Misiones includes four major land-use classes: modern agriculture, forest plantations, subsistence agriculture, and pastures [34]. Modern agriculture is mainly dominated by perennial crops, particularly yerba mate and tea. Forest plantations are mainly Pinus and Eucalyptus. Between 1973 and 2006, the area in forest plantations increased from 1 to 11% of the province, replacing native forests, agriculture and pastures [34]. Subsistence agriculture (i.e., mixed use) is carried out by small producers mainly dominated by tobacco and annual crops. Cattle grazing occurs in native grasslands in the southwestern departments and in pastures created in previously forested areas in the central and northern departments [34]. In addition, cattle grazing occurs within forests, which involves the clearing of the understory to enhance grass productivity. Another important human activity impacting natural ecosystems is infrastructure development. Although important negative impacts associated with dam construction has been shown [38,39], the existence of flowing rivers in the Atlantic Forests region has made it attractive for dam development, with hundreds of dams constructed and proposed over the past 50 years [38]. Dams are built principally for hydropower, water storage, flood control or recreation. There are currently two dams in Misiones’ rivers downstream, Urugua-I and Yacyretá, and two others have been proposed, Corpus Christi and Roncador/Parambi. Other important dams exist upstream on the Paraná (e.g., Itaipú) and Iguazú Rivers, and the Garabi dam is proposed downstream of the Uruguay River.

2.2. MARXAN Analysis

We used the Marxan 2.43 conservation decision support software to select a network of priority conservation areas [40]. The Marxan analysis aims to achieve representation of conservation targets (i.e., species occurrences, ecological systems, and physical features) while also factoring in human impacts to the landscape and existing land-use scenarios. Marxan uses a heuristic algorithm to select portfolios of planning units according to conservation targets, goals, and other various software settings. This analysis involves the definition of: (1) conservation targets, in our case habitat and ecosystem services (i.e., carbon storage, soil retention, and water yield); (2) desired conservation goals for each ecosystem service; (3) spatial units of analysis, or “planning units”; (4) a cost surface, which in our case represents accumulated threats to ecosystem services.

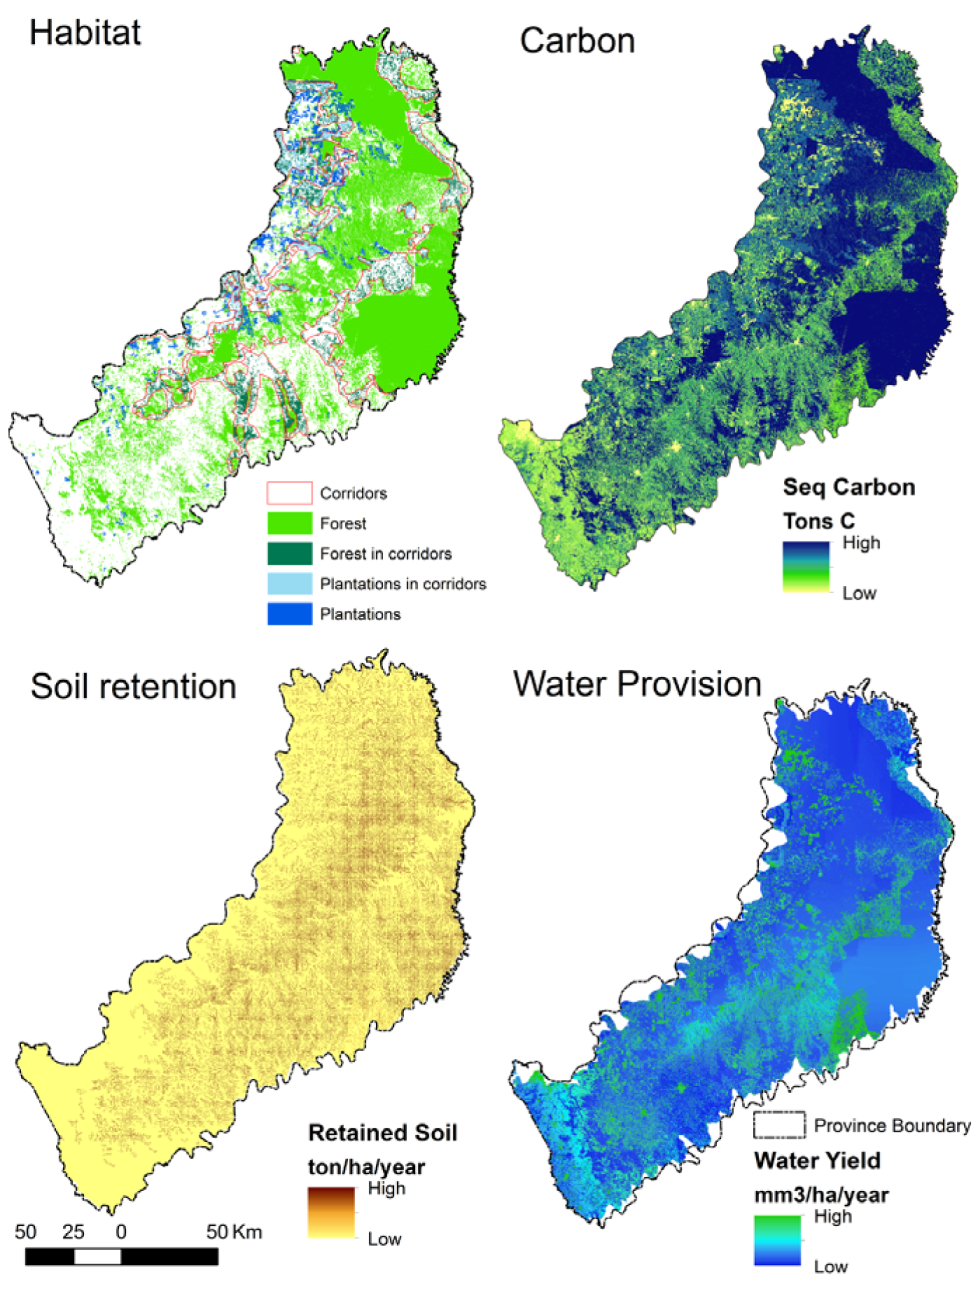
2.2.1. Selection and Model of the Conservation Targets

In preparation for our Marxan analysis, we characterized and mapped habitat and the following three ecosystem services: carbon storage, soil retention, water yield. Although the evaluation of ecosystem services is rising, especially since the publication of the Millennium Ecosystem Assessment in 2005 [5], there is currently no agreed upon definition of ecosystem services [41]. In this work, we considered ecosystem services as the benefits people obtain from ecosystems [5] However, we conceptualize habitat as separate from ecosystem services as it provides the platform for supporting biodiversity yet not utilized actively or passively to produce human well-being [41].
Whereas past conservation analysis has historically focused on habitat and biodiversity, we view our inclusion of ecosystems services an important update to the conservation planning process, as it acknowledges the reality that conservation measures often need to meet multiple scientific, social and economic goals. The three ecosystem services considered were selected because they are some of the most important services provided by forests, and they are found in schemes of Payments for Ecosystem Services (PES). As such, we considered that knowing where these services are provided informs where management interventions should be concentrated. In addition, including these services we are considering global ecosystem services (i.e., carbon storage, biodiversity) and local services (i.e., soil retention and water yield) in one integrated analysis. These last two services were selected due to the high value to local population. First, the Misiones’ soil is recognized as “erodible” [42,43,44] by its characteristics and climate conditions (i.e., deep red soils, combining characteristics of highly weathered materials together with a significant degree of clay illuviation and with stony horizons close to the saprolite exposures due to intense rainfall). As a result, erosion control is one of the main principles of soil management in the province [42,43,44]. Second, although rainfall is high and there is no dry season, water yield is recognized in this work as an ecosystem service mainly because of its potential benefits to hydropower production. Much of the electricity in Brazil, Paraguay and Argentina takes place in the Upper Parana Atlantic Forest rivers where there are two of the largest dams of the world (Itaipú y Yacyretá) [45]. In Misiones, the Urugua-i dam receives water from a large watershed completely within province and provides hydroelectric energy to 45% of the province, while Yacyreta provide 22% of electric demand and 60% hydroelectric energy of Argentina. Because the region is over the Guarani aquifer, a water reserve estimated on the order of 45,000 km3, the main source of water supply for human consumption is groundwater [46]. While the threats of dam construction on biodiversity and ecosystem processes are recognized [38,39], we considered water yield an ecosystem service because hydropower is the main use of water in Misiones [46].
To characterize habitat for native (i.e., pre-colonization) plant and animal species, we used a land-use/land-cover map from [34], which was updated for 2009 by the lead author using the same image processing methods. The 30-m land-cover map (Figure 1c) was based on a supervised, maximum likelihood classification method. This map included the classes: forest, campos (native grassland), plantation (Pinus spp. and Eucalyptus spp.), pastures, agriculture, mixed use (i.e., subsistence agriculture), built-up areas and water, and had an overall map accuracy of 87.3% (see [34] for methodological details). In this study, we considered habitat to be forest and plantations and sub-divided these two classes into four habitat classes: forest, forest in biological corridors, plantations and plantations in biological corridor. The rest of the Misiones landscape was considered matrix in our analyses. To locate the areas in biological corridors we used polygons proposed in the Biodiversity Vision, an expert-driven plan by the World Wildlife Fund for this area [28]. We included plantations as habitat based on previous research that showed the importance for this cover to fauna, such as jaguars, pumas [2,3], brocket deer [47], ocelots [48] and birds [49].
To characterize carbon storage, soil retention and water yield, we used the model Integrated Valuation of Ecosystem Services and Tradeoffs 1.005 (InVEST, [50]). For carbon, we estimated the amount of carbon currently stored in the landscape based on the 2009 land-cover map as input and stocks derived for four carbon pools: aboveground biomass, belowground biomass, soil, and dead organic matter. We parameterized the different carbon pools for the forest class based the values in Gasparri et al., 2008 [51]. Agricultural classes (i.e., agriculture, mixed use, pastures) were parameterized based on carbon storage data from the Intergovernmental Panel on Climate Change’s (IPCC) 2006 in the Agriculture, Forestry and Other Land Use (AFOLU) sector [52]. Carbon storage for plantations was parameterized based on data in Houghton 2005 [53].
For soil retention, the InVEST model estimates the capacity of a land parcel to retain sediment based on the Universal Soil Loss Equation (USLE) [54]. The rate of soil retention is a function of the area’s land cover, soil type, rainfall intensity, and topography. The model estimates how much of the sediment eroded on all pixels will be trapped by downstream cover based on the ability of cover in each parcel to capture and retain sediment, and then it determines the total sediment load exported that reaches the stream from each pixel on the landscape. Total sediment retention is equal to the sum of the sediment removed by the pixel itself and the sediment removed through the filtration path. We parameterized the biophysical factors based on local published information and experts’ comments, mainly by the National Institute of Agricultural Technology (INTA) and National University from Misiones, and references published in FAO [55]. We validated the model comparing the total sediment exported to the outlet of the main five watersheds from Misiones with data of INTA at interest points [56].
Finally, we estimated the absolute annual water yield across the landscape, calculated in InVEST as the difference between precipitation and actual evapotranspiration on each land pixel. This metric indicates how much water yield there is from each parcel of land, which can be used to determine which parcels are most important to total annual water yield. The model is based on an approximation of the Budyko curve [57] and annual average precipitation. First, it determines the annual average evapotranspiration based on annual reference evapotranspiration, soil depth and plant available water content. Then, annual water yield is determined by annual average evapotranspiration and precipitation. We parameterized the water yield model as follows: annual average precipitation based on layers from the World Climate website [58] potential evapotranspiration using the annual evapotranspiration layer from the “Global map of monthly reference evapotranspiration”; and, plant available water content using a global layer of “maximum soil moisture”. These last two layers were from the FAO GeoNetwork Spatial Data Portal [59]. The soil depth was calculated using the Soil Atlas of Argentina [60]. The final ecosystem service maps are shown in Figure 2. To validate the model, we calculated the water yield to the watershed level and compared these annual average yield estimates to observed streamflow data [61].
Figure 2. Maps of the analyzed ecosystem services.
Forests 03 00764 g002
The InVEST models have recognized limitations and simplifications. The main limitations could be that: (1) all InVEST models are highly sensitive to the types of LULC classes available in input maps, including spatial resolution and accuracy; (2) the carbon cycle is oversimplified in InVEST, as it assumes fixed storage levels by LULC type without considering gains or losses of carbon over time or between LULC types; (3) a major limitation of the soil retention model is that the USLE method has only been verified in flatter areas; and (4) the water yield model is based on annual averages, which neglects extremes and does not consider the temporal dimensions of water supply. In spite of these limitations, we considered the InVEST suite of models to be useful for our application as they require relatively little data input and its products can inform decisions related to natural resource management [50]. In addition, some of these limitations could have minor impact in Misiones due to its topography and climatic characteristics. While the province does not have uniformly flat topography, slopes are not severe and forests are mainly in higher elevations. Furthermore, Misiones does not have much seasonality, with precipitation well-distributed over the year. Finally, our analysis it is not intended for devising detailed management plans for each ecosystem services, but rather for evaluating synergies in the Misiones’s landscape.

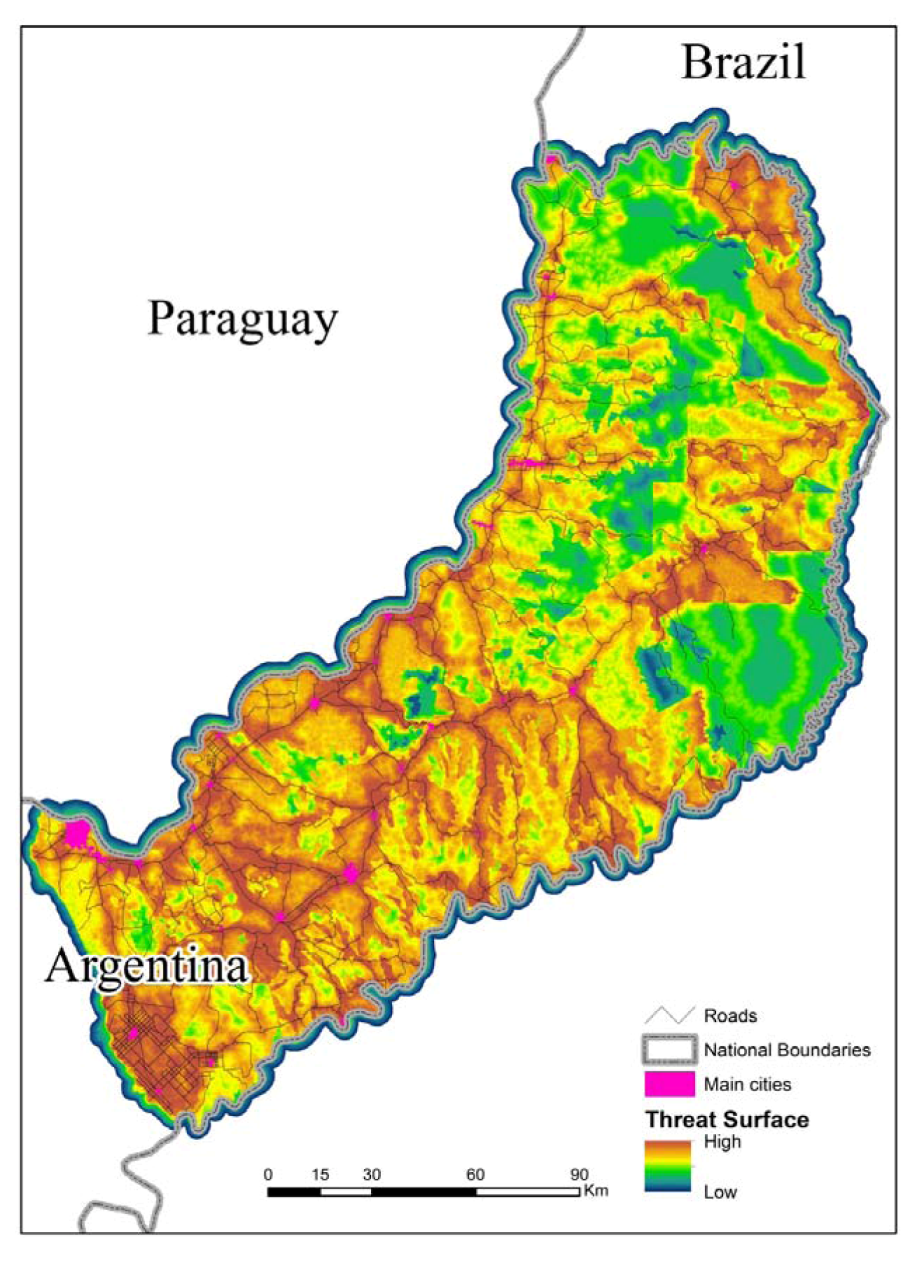
2.2.2. Other Parameterization of Marxan Analysis

Ideally, Marxan parameters should be set with reference to literature; however there is often a lack of needed information in many parts of the world, including Misiones. Common practice is to consult experts and stakeholders as well as perform experimental model runs [40]. In our case, due to academic character of our analysis, we based the selection and foundation/basis of each parameter on a combination of literature review and the lead author’s expertise in the region. We view our analysis as a one scenario in using Marxan with ecosystem service targets, and recognize the need to model other scenarios with different parameters set by consensus among experts/stakeholders on other studies.
As the minimal analytical unit, or planning unit (PU), we used a grid of 50 ha hexagons (n = 58,480). This PU size was chosen as it is roughly the average size of the rural properties in Misiones [62]. Ecosystem services were summarized for each PU as the total area of habitat type, tons of carbon, tons per hectare per year of retained soil, and mm3/hectare per year of water yield. To set our goals for ecosystem services, we explored different networks of PUs that could reach the goal of conserving a percentage of total target values (i.e., 10%, 30%, 50% and 75%) [63]. Although existing legal frameworks or political commitments may contain general target goals, these did not exist for our ecosystem services for Misiones, and thus we selected the same goal for all ecosystem services. After experimentation following [63], and based in the lead author’s expertise for Misiones, we selected a goal 50% for all services; for example, the habitat goal was set to select a network of PUs to reach 50% of total area of each habitat type found in all PUs across Misiones, and for carbon the goal was set to select PUs capturing 50% of total tons of Carbon across Misiones.
A spatial raster model of threats, or threats surface, of 30 × 30m resolution was developed with Protected Area Tools [64] using threat types and their corresponding risk elements (Table 1). In developing the threat surface, decisions regarding risk element intensity values and influence distances were made by. The main threat types and their relative weights were based on expertise from a WWF team in Atlantic Forest [65], which considered threats to habitat for native plants and animals. They classified the main threats onto a scale from low to high. Considering a scale from 0 to 100, we estimated the intensity value of each risk element using the threat rankings from WWF as a guide (Table 1: Intensity): high threats had a value >75, medium threats >25 to <75 and low threats <25. For some risk elements, intensity value decreased linearly with distance from the element (Table 1: Distance). Each risk element was modeled using parameters in Table 1 at a 30-m pixel size and summed for each threat type. Finally, the threat types were weighted and summed to produce the final threat surface (Figure 3).
Figure 3. Combined threat surface.
Forests 03 00764 g003
Table 1. Elements and parameters of the threat surface based on WWF threat types and associated weights.
Threat typesWeight’s WWF teamMapped elementsParameters
IntensityDistance (m)
Frontiers expansionHighSoil agriculture suitability1
• Suitable soil1000
• Medium suitability500
• Unsuitable soil250
Agricultural practices2
• Subsistence farming (tobacco and other annual crops)802000
• Industrial crops (yerba and tea)501000
• Pastures
• Forest Plantations501000
• Fire frequency
  Low (1–3)10100
  Medium (4–9)25100
  High(10–16)50100
Extractive activities
  • • Timber
  • • NTFPs7
  • • Firewood
  • • Hunting
High to mediumHighways and roads3
• Highways paved753000
• Highways unpaved503000
• Roads253000
Main rivers4753000
Density rural population5
• Low density (0–5 people/km2)250
• Medium density (5–10)750
• High density (10–19)1000
Housing & urban areasLowUrban areas6
• 2000–5000 people103000
• 5000–10,000 people153000
• >10,000 people253000
1 Soil agriculture suitability: this factor considers the agriculture ability of soil, according to the classification of soil types obtained from “edaphic charts” issued by the Province of Misiones. The categories assigned were established based on the suitability of each soil type for agriculture practices, with: 1) suitable soil: Ultisol (typical red soil) and Alfisol without rocks; 2) medium suitability: Incept and Entisol with moderate rockiness where it is only possible to plant forage crops; and 3) unsuitable soil: extremely rocky, making the use of machinery impracticable; 2 Agriculture practices: mapped based on land use cover map updated for 2009 (see Methods). We calculated fire frequency by cell in a 50-ha grid using data from FIRMS [66] 3 Highways and roads: modified gDATA [67] 2009; 4 Rivers: Only main rivers considered, not streams; 5 Density rural population: the departmental rural population was estimated from the known population of National Census 2010 and the known changes in distribution from the last five censuses. In estimating population density, we subtracted the protected land by department, thus estimating the real pressure over land; 6 Urban areas: based on the 2009 land-use/land-cover map, considering the urban nucleus with >2000 inhabitants in the census 2010, which are “urban population”; 7 Non-timber Forest Products.

2.3. Marxan Analysis and Summary

The Marxan tool seeks to find the optimal network of PU’s that reach the specified conservation goals for targets in the study area while minimizing cost, as tallied from the selected PUs. In our study, habitat and ecosystem services were conservation targets, conservation goals were 50% of each target, and cost was the PU’s summed threat from the threat surface. We ran Marxan with the following parameters: 100 runs; boundary length modifier (BLM) of 100; 1,000,000 iterations with 10,000 temperature thresholds. The BLM is a parameter that controls the level of planning unit aggregation in the selected network by weighting the boundary length in the total solution cost [40]. A larger BLM causes Marxan to minimize boundary cost by finding compact, aggregated groups of planning units in the solution. We determined the BLM using a method described in Game and Grantham, 2008 [40]. The Penalty Factor (PF) is the importance a user puts on each target meeting its goal and it also influences the selection of planning units by ensuring that goals are met .As such, the PF can be thought of as way of distinguishing the relative worth of different conservation targets and how important it is to have them fully represented [40]. We defined PF for each target by experimenting in an interactive fashion with different scenarios based in methodology described in Game and Grantham, 2008 [40]., with our final setting at: 5 for the three ecosystem services from InVEST; and for habitat, 10 for forest in biological corridors, 5 for forest, 4 for plantations, and 2 for plantations in biological corridors. The “Status Layer” or “Status Identifier” is an optional input in Marxan that provides a scenario where the planning units that are protected areas or special interest areas are to be “locked in” or fixed in the final PU network solution [40]. We did not use this option, and so the PUs selected in our solutions are included because of their efficiency in reaching the target goals and with the minimal costs.
The Marxan analysis produces two outputs for PUs: (1) the summed solution and (2) the best solution. The summed solution is the sum of the number of times PUs are included in all solutions from the total runs of the software, which is a measure of the each PU’s “irreplaceability”—in our case ranging from 0 to 100 (low to high irreplaceability). The best solution includes only the PUs selected in the run with the lowest total cost (i.e., threat). To test the spatial distribution and overlap of the priority sites for each combination of targets, we calculated Spearman’s correlations between the “irreplaceability” across all planning units.
To evaluate the contribution of existing protected areas, management zones and potential biological corridors in conserving habitat and ecosystem services, we tallied the targets within PUs selected by Marxan’s best-solution, and we calculated the percentage of services occurring in existing protected areas (System of Natural Protected Areas of Misiones), the Biosphere Reserve Yaboti, biological corridors, as well as the rest of provincial territory (i.e., the matrix).

3. Results and Discussion

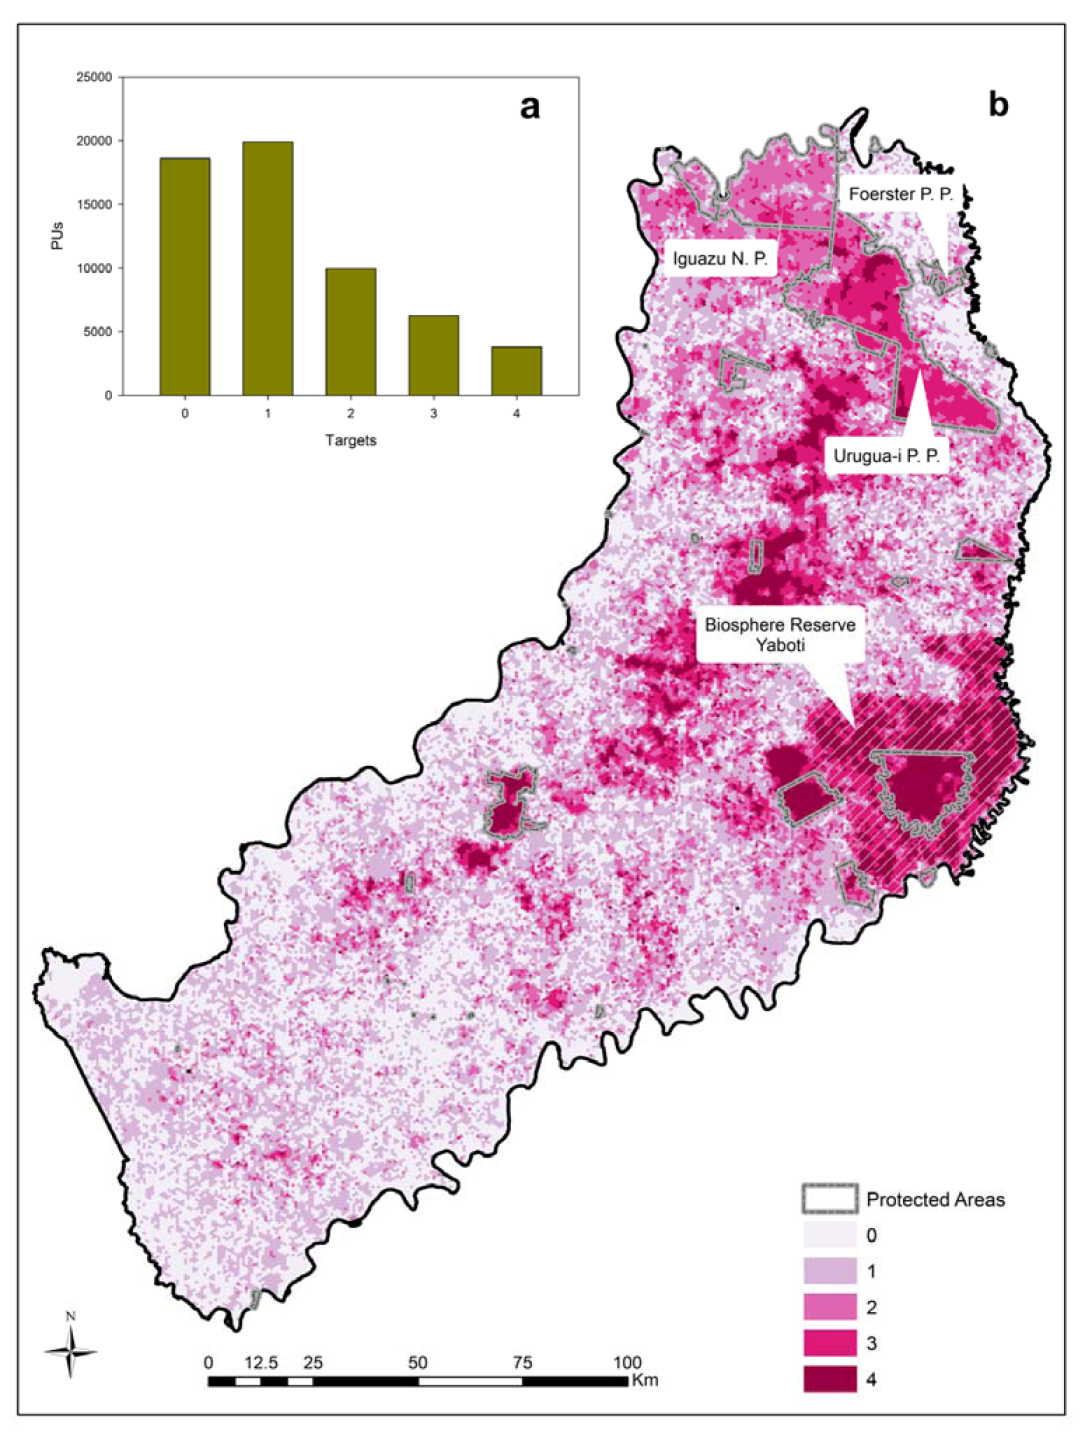
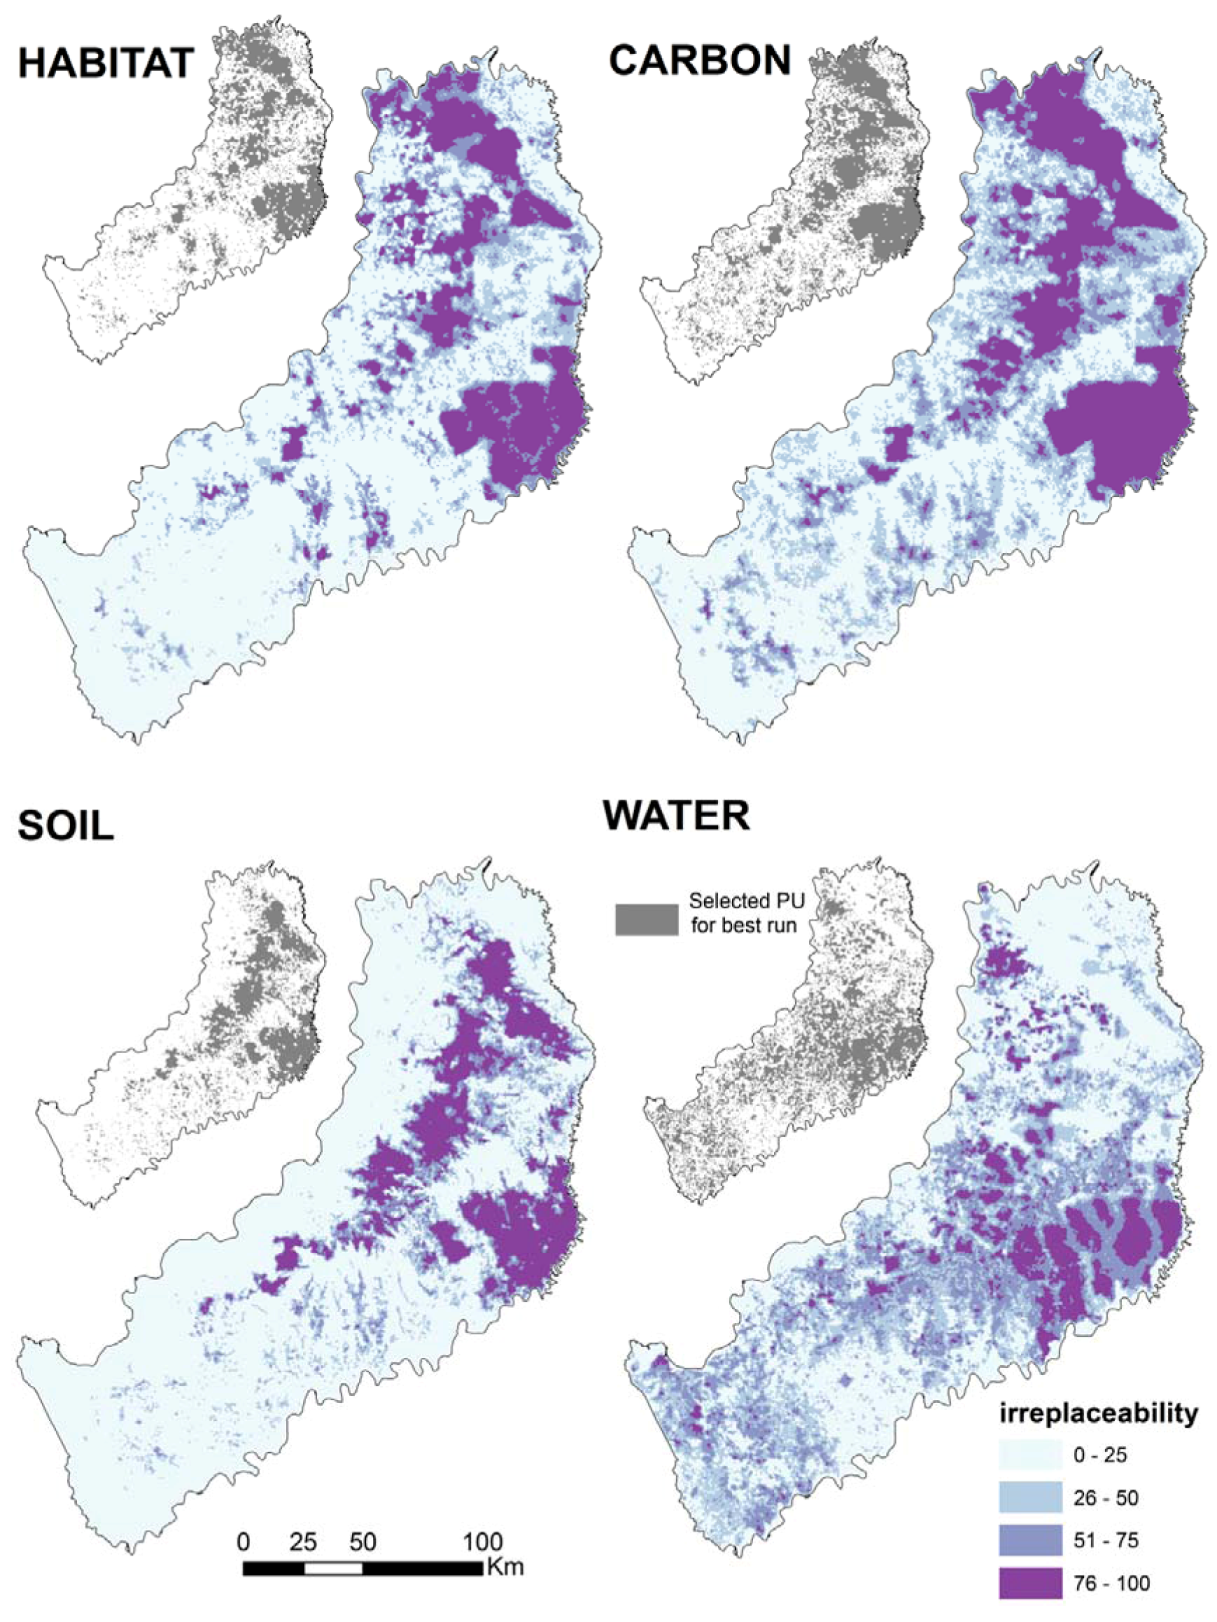
3.1. Priority Areas for Conservation of Ecosystem Service, and Their Overlap.

The network of planning units selected by Marxan for carbon and water were much patchier than the networks for habitat and soil, considering both the best and summary solutions (Figure 4).
Figure 4. The Marxan summary solutions (irreplaceability, color tones) and the best solution (gray) of planning units (50-ha hexagons) for habitat and ecosystem services (i.e., conservation targets).
Forests 03 00764 g004
This result was expected because spatial connectivity of selected PUs was favored by habitat due to our inclusion of biological corridors in the penalty factor, while PU connectivity of soil retention was influenced by topography, where high values were concentrated in mountainous areas. Beyond that, the Marxan solutions show the importance of the largest remnants of native forest in Misiones and their role in providing ecosystem services (Figure 1, Figure 4). The prioritized planning units for targets differ among themselves (Figure 4), showing areas where they overlap completely (i.e., a “win-win” situation) to areas with no overlap. Although protected areas were not considered in the Marxan solutions, PUs in these areas were often selected, particularly for habitat and carbon. The solutions for all four targets included the central highlands and Yabotí region as prioritized areas (Figure 4), which are not protected, yet can be considered win-win areas in providing multiple ecosystem services. Both areas are included in the Green Corridor and have a “yellow” category in Misiones’s Landscape planning document. Nevertheless, some studies have shown that the relatively low protection levels in these regions have historically had negative effects on biodiversity [2,3]. The Iguazú National Park and its surrounding areas in the north of Misiones were not selected for water and soil retention (Figure 4). This could be due to the relatively lower elevation and less precipitation of the North region, factors which lead to lower levels of modeled soil retention and water yield than the other areas in the province. Although these protected areas and connecting corridors were not ideal in terms of complete overlap of services, they encompass relatively high levels of native habitat and carbon stocks, and provide other ecosystem services not considered in this study (e.g., tourism opportunities near Iguazú Falls and Puerto Iguazú). One important landscape function of the northwest region is the connection with the Brazilian Iguaçu National Park across from Iguazú Falls, which contains the largest remnant Upper Paraná Atlantic Forest patch in Brazil and also provides high levels of protection for biodiversity [2,3].
Considering correlation of planning unit irreplaceability among targets as a measure of spatial similarity, carbon and habitat were the most similar, followed by soil and habitat, and carbon and soil (Table 2). This was expected because habitat and carbon were both very dependent on the land cover map. On the other hand, the selected network for soil retention is related to topography, where steeper areas also had remnants of forest cover. The irreplaceable of PUs for water conservation had little overlap with those from the other targets, with correlation of 0.17, −0.09, and −0.10 with soil retention, habitat and carbon, respectively (Table 2). The spatial incongruence between the PU network for water yield and the other three PU networks can be explained by the positive relationship between forested areas and habitat and carbon, and negative relationship between forested areas and the water availability due to increasing evapotranspiration. The region of Yabotí has benefited from high average precipitation in last decades, which explains its high value in water yield despite being mostly forested.
Table 2. Spearman’s ranked correlations of irreplaceable (summed solution) planning units among the conservation targets (ecosystem services and habitat).
TargetsHabitatCarbonSoilWater
Habitat1
Carbon0.891
Soil0.680.601
Water−0.09−0.100.171
Spearman’s correlation value indicate the extent to which summary solutions chose the same planning units (1.0 indicates perfect correlation and −1.0 indicates perfect negative correlation)
Figure 5 summarizes the provision of habitat and ecosystem services by each PU. The map shows the sum of the best solutions from the four targets, with a value of 4 indicating complete overlap of all targets (Figure 5b).
Figure 5. (a) Number of planning units selected by Marxan best solutions with 0 to 4 overlapping conservation targets; and (b) number of targets chosen by MARXAN best solutions.
Forests 03 00764 g005
The “hotspots” of multiple overlapped targets reveals the effectiveness of the largest protected areas (i.e., Urugua-I and Iguazú National Parks) and Yabotí. As mentioned, Yabotí is a Biosphere Reserve with specific rules for sustainable management and where multiple uses are permitted. Other hotspots do not have any legal protection in the province. For example, the central highlands conserve many ecosystem services simultaneously (Figure 4), yet all PUs with 3 to 4 selected targets are in the “red” or “yellow” categories of the Landscape Planning Law, showing the importance of taking efficient management decisions in the yellow category, in particular. The Iguazú and Urugua-I National Parks are important regions, with relatively high levels of protection, yet they tended to have PUs with only 2–3 selected ecosystem services. However, these national parks have other important functions. For example, Iguazú National Park, a natural UN world heritage [68] (hich has the famous Iguazú water falls recently selected as one of the natural wonders of world [69] (This is an important tourist resource, not only for the province but for the country as a whole. Iguazú N.P. and Los Glaciares in Patagonia are the two main national parks that, with their revenue, support the other 32 National Parks and Reserves and 6 Natural Monuments in Argentina.
Although the majority of protected areas were efficient in terms of incorporating best-solution planning units with multiple ecosystem services, this analysis revealed some less-efficient protected areas. For example, the Foerster Provincial Park in the northeast of Misiones is a protected area with a poor design in terms of its convoluted shape (i.e., more edge to interior habitat) and its location in a region disconnected from other large protected areas, and under increased threat due to fast land-use changes near its borders [70]. This has led to Foerster P.P. to suffer the biological consequences of isolation and degradation. The surrounding threats are the main reason why the protected area was not selected by the Marxan analyses, despite its forested area (Figure 3). For this reason, biota and fauna in Foerster P.P. depends on the connection with Urugua-I P.P., where there are significant conservation efforts [71]. However, this result also requires land planners to consider the costs and benefits of protecting this area, and whether there are other non-protected regions with more potential benefits (e.g., highland region) [72].

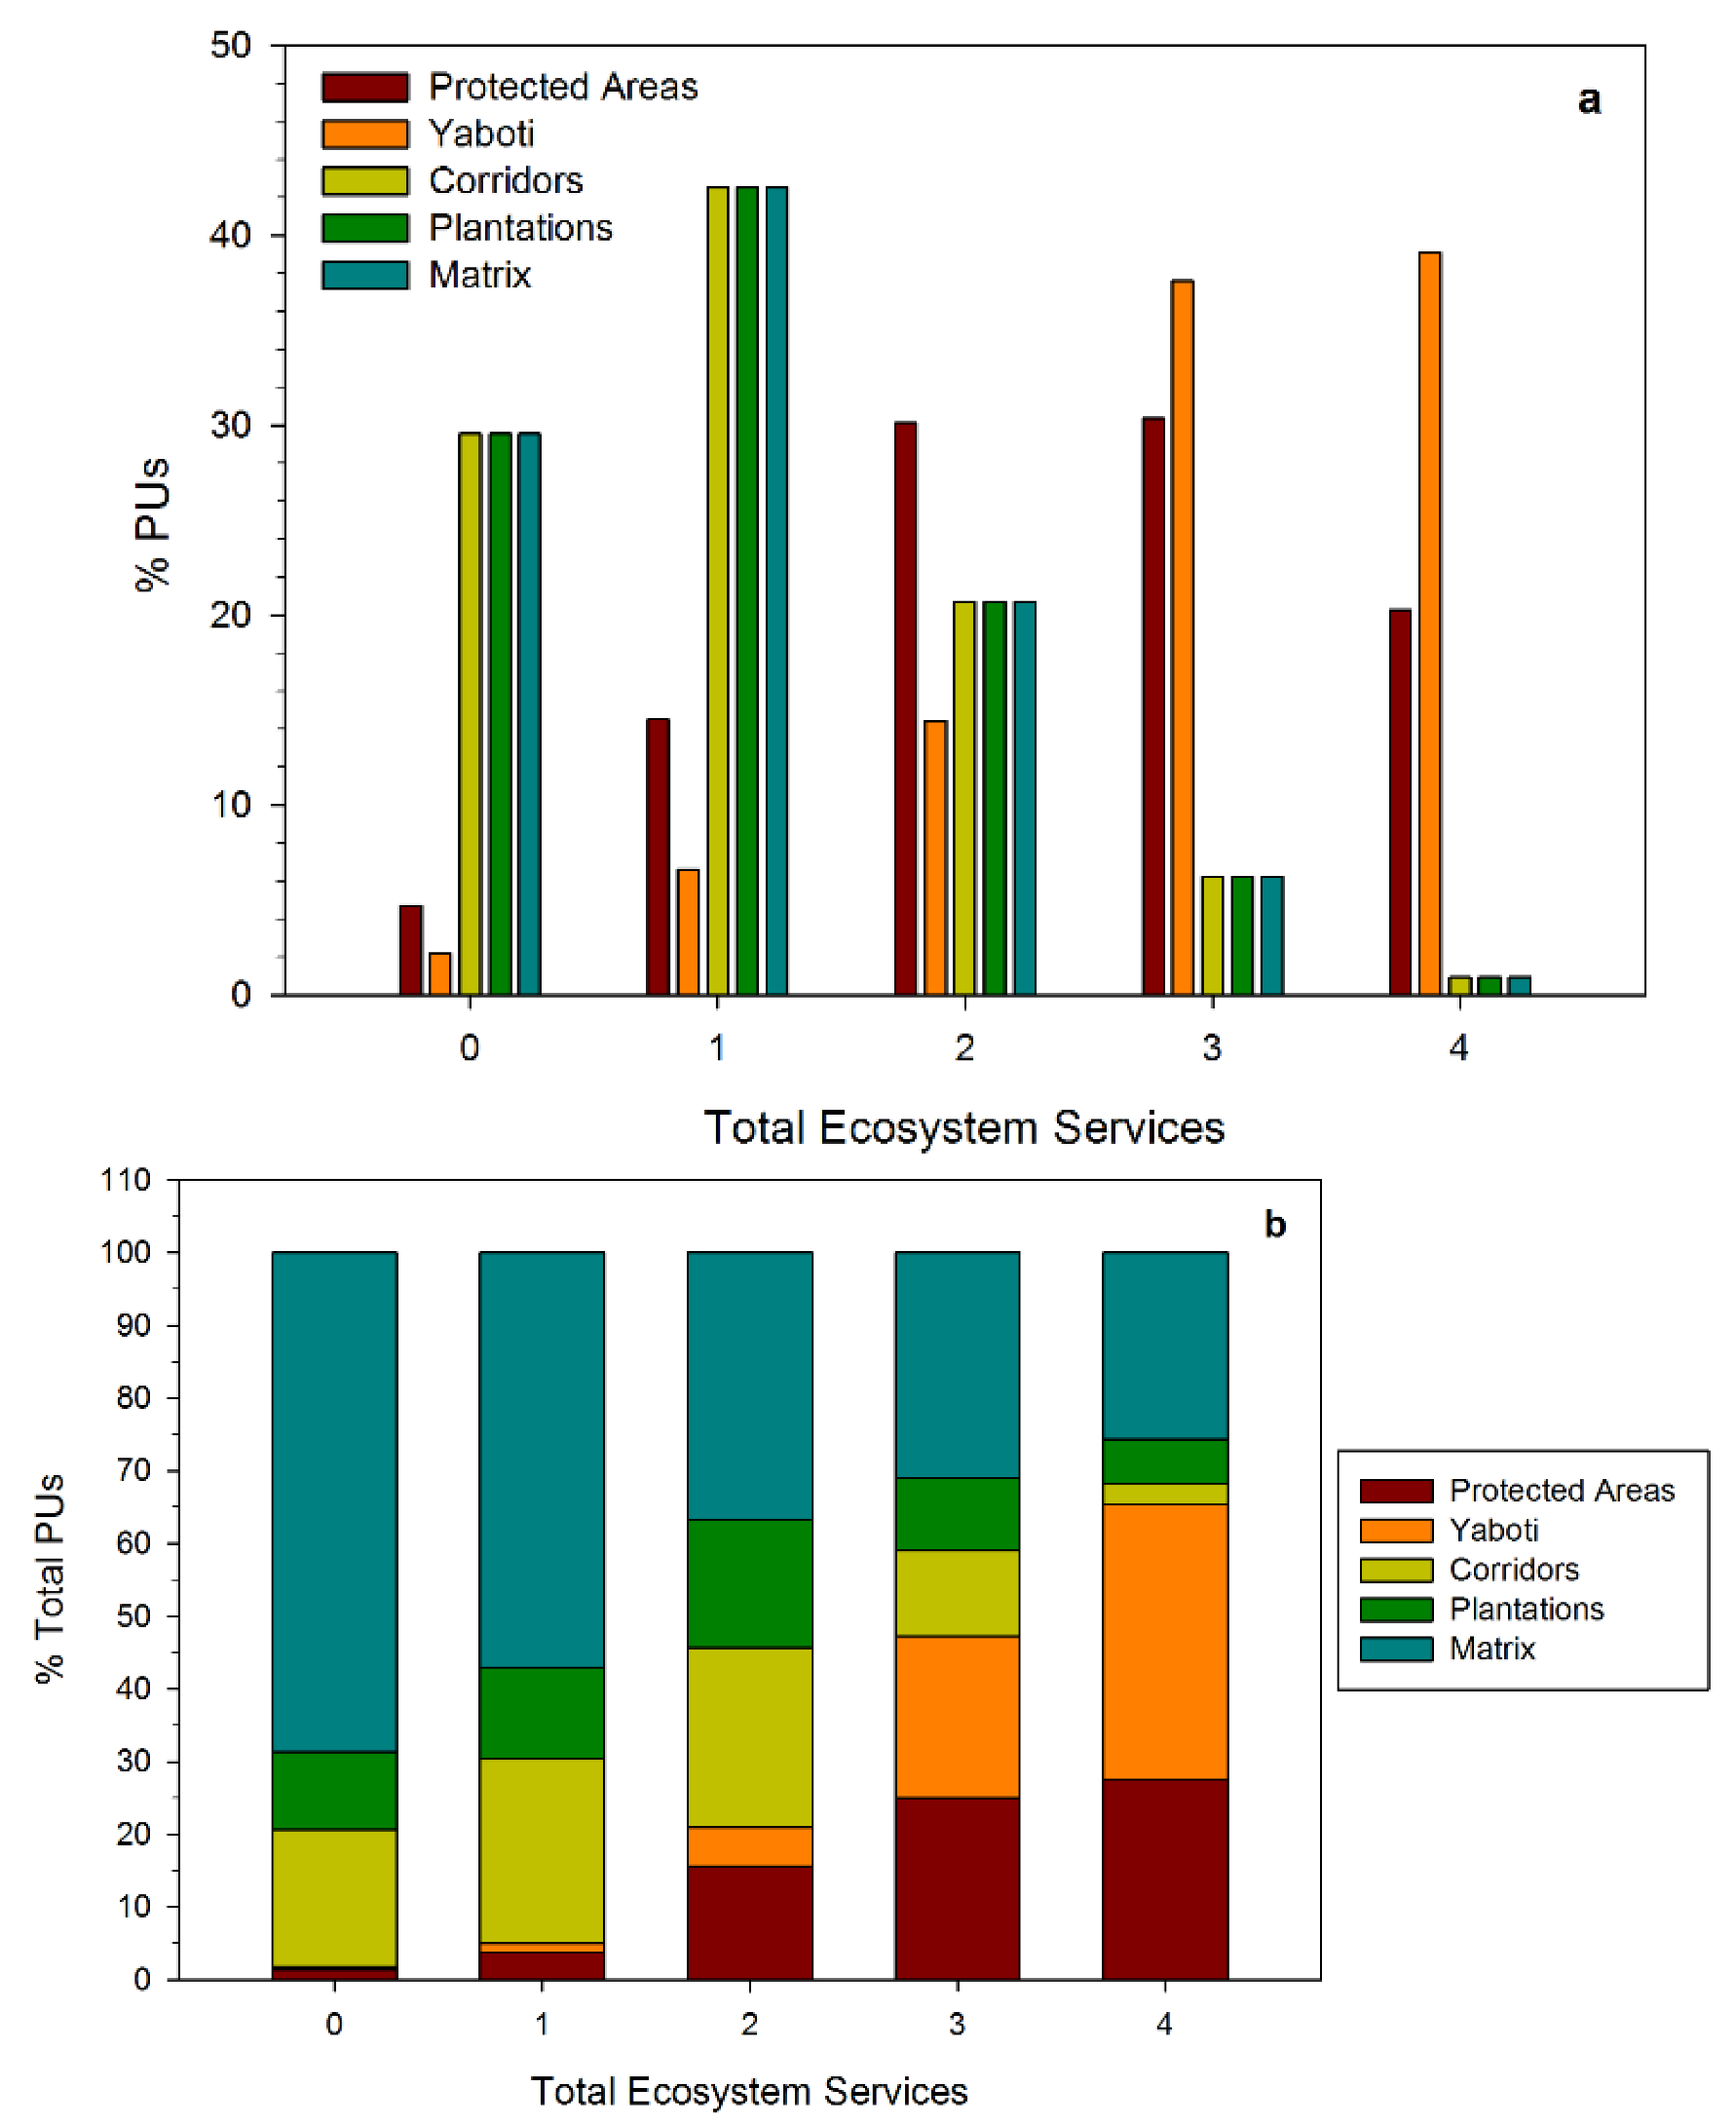
3.2. Ecosystem Services Provided by Landscape Components: Protected Areas, Areas of Conservation Interest, and the Matrix

Of the total PUs in Misiones (58,480), 32% had none of our conservation targets selected by the Marxan best solutions, while other PUs provided one (34%), two (17%), three (11%) and four (6%) targets selected by best solutions, respectively (Figure 5a).
The majority of PUs within Protected Areas and Yabotí had 2–3 and 3–4 targets selected by the Marxan best solutions, respectively (Figure 6a). In other areas of conservation interest, biological corridors and plantations, and in the surrounding matrix, the majority of best-solution PUs contained no ecosystem services. These results lend support to existing protected areas in Misiones, and particularly the Yabotí Biosphere Reserve, as these areas were selected repeatedly by Marxan for sustaining multiple targets. Of the selected PUs, 27.5% of those that provide four (1,044 PUs) and 25% of those that provide three (1,563 PUs) targets, respectively, were inside protected areas (Figure 6b). Similarly, 38% (1,432) of the selected PUs with four and 22% (1,379) with three targets, respectively, were inside Yabotí (Figure 6b). As a Biosphere Reserve, Yabotí include a core protected area (i.e., Esmeralda P.P. of 316 km2) and a buffer area of private proprieties of 2,050 km2 which must conform to the United Nations multiple-use management principles. Currently, many conflicts exist between provincial government and land owners, who exert political pressure for more flexible laws or revised land conversion permits. However, our results show that this is a priority area for conservation of ecosystem services. In addition, the area is a critically important for providing habitat for many threatened species [2,3,66]. Finally, it was created on the territory of 15 of the Mbyá-Guaraní indigenous groups [73], providing community resources and opportunities for cultural preservation. Our results thus provide important information that should be considered in formulating holistic management decision in Yabotí.
Figure 6. Based on the Marxan best solutions for all targets (a) percentage of planning units within each region of the Misiones landscape (i.e., Protected Area, Yabotí, etc.) that provide zero through all four targets; and (b) within different total target categories, percentage of best-solution planning units from each region of the landscape.
Forests 03 00764 g006
Although there is widespread agreement on the importance of conserving natural areas for species habitat and associated ecosystem services, achieving these dual goals is often absent from the planning and design of protected areas or multi-use zones, and once established, the funding for management of these areas is almost always inadequate. It is estimated that the Argentinean investment in national parks is currently$8.5/ha, with ~60% coming from governmental funds [74]. At the province level, the investment is less well known. While private initiatives are very heterogeneous in objectives and financing, some private reserves have an estimated $20 to $440/ha/year in operating costs [75]. However, other private reserves do not invest in management and only maintain the reserves “on paper”. A major reason for the underfunded state of protected areas is that the benefits to society are often grossly underestimated, and the immediate and maintenance costs of protection appear larger in comparison. Understanding and quantifying ecosystem services provided by areas in a landscape can play a key role in increasing the efficiency of conservation investments and in attracting additional funding. One key example is the economic valuation of carbon storage in response to global climate change. Voluntary markets and international initiatives, such as the United Nations Reduce Emissions from Deforestation and forest Degradation (REDD) program [76], seek to pay credit nations for maintaining their carbon stored in vegetation (i.e., not deforesting). Argentina is not currently a REDD participant, yet has developed a national readiness plan to join when funding permits. As REDD or other valuation mechanisms mature, there is a clear opportunity in Misiones to receive payments for its carbon stored in forests – money that could be deployed to strengthen and expand forest protection, as well as build political commitment to multiple conservation goals.
Our Marxan-based analysis selects areas that conserve the most ecosystem services at the lowest threat. Another analytical approach is to differentiate areas with perceived or historical risk of deforestation in the conservation planning process [77], and include these in programs of Payments for Environmental Services (PES) as a tool for conserving natural resources [78]. This approach could be considered contradictory with our Marxan-based analytical approach, i.e. select areas with least risk instead of greatest risk. However our analysis permits the identification of general priority areas across the region that may require different tools for conservation, one of which could be PES. For example, Yabotí and zones of Urugua-I P.P. are identified as a priority area for conservation of multiple ecosystem services by our analysis. While Urugua-I P.P. is a Protected Area with problems related to effective management, Yabotí is an area of intensive pressure for land conversion. A better and effective management policy could be the way to conserve Urugua-I, and a PES could be a tool for conservation in Yabotí.
Well-managed protected areas or areas under effective PES programs alone may not be sufficient for long-term species conservation. These areas need connectivity through the matrix to support wide-ranging species, gene flow and future migration routes in the face of climate change. In Misiones, an independent analysis identified areas of critical connectivity as biological corridors [29]; however, since these corridors span degraded habitat and matrix lands, they lack the overlapping ecosystem services (Figure 6) that would give them priority in our proposed planning process. How can conservation prioritization include ecosystem services without sacrificing the broader spatial context or other long-term considerations? There is a serendipitous example in Misiones. A local conservation non-governmental organization (Conservación Argentina) is working to recover matrix lands between Foerster P.P. and Urugua-I P.P., with the main goal of providing connecting habitat for species migrating between protected areas—a single ecosystem service. Although our analyses do not select Foerster as a priority area, mainly due to surrounding threats and isolation, other considerations could be reason for conserving this protected area. In the case of carbon, increasing biomass in these forests could provide additional economic value and revenues, such as through REDD-type initiatives, thus sustaining corridor reforestation efforts and elevating these areas in priority over time. Thus, planners and decision-makers should thus be mindful of broader landscape considerations, such as connectivity, and seek ways to boost their social and economic valuation through time.

4. Conclusions

Our results for Misiones, Argentina showed that the selected areas for conserving habitat, carbon and soil ecosystem services, with minimal threat, tended to overlap. However, this overlap of services does not coincide with selected areas for water yield, indicating that there are trade-offs involved in providing all services at the province scale. Furthermore, selected areas with relatively high overlap of ecosystem services tended to be inside Protected Areas and the Yabotí Biosphere Reserve, while other important areas for ecosystem services (i.e., central highlands) do not have legal protection. All regions with high overlapping prioritized ecosystem services were included in the areas of restricted or sustainable land use, showing the importance and necessity of enforcing regulations in these areas.
The present work provides important planning and policy information in a global priority region for conservation [18,19,20,21]. It is the first analysis to simultaneously evaluate the role of protected areas and other important lands of Misiones in providing ecosystem services and habitat for biodiversity. We provide evidence that shows how existing protected areas provide multiple ecosystem services—beyond just species habitat and tourism—and helps to identify additional areas for conservation that support species while meeting societal needs.

Conflict of Interest

The authors declare no conflict of interest.

Acknowledgments

This study was funded by a postdoctoral grant from CONICET and an alumni grant form EFN-WWF to Izquierdo. Previous analysis was developed with financial support of Fundación Vida Silvestre Argentina (FVSA). Clark’s participation was funded in part by U.S. National Science Foundation grant #0709645. We thank Carlos De Angelo and three anonymous reviewers for their comments.

References

  1. Brooks, T.M.; Mittermeier, R.A.; da Fonseca, G.A.B.; Gerlach, J.; Hoffmann, M.; Lamoreux, J.F.; Mittermeier, C.G.; Pilgrim, J.D.; Rodrigues, A.S.L. Global biodiversity conservation priorities. Science 2006, 313, 58–61. [Google Scholar]
  2. Paviolo, A.; de Angelo, C.D.; di Blanco, Y.E.; di Bitetti, M.S. Jaguar Pantheraonca population decline in the Upper Paraná Atlantic Forest of Argentina and Brazil. Oryx 2008, 42, 554–561. [Google Scholar] [CrossRef]
  3. Paviolo, A.; di Blanco, Y.E.; de Angelo, C.D.; di Bitetti, M.S. Protection affects the abundance and activity patterns of pumas in the Atlantic Forest. J. Mammal. 2009, 90, 926–934. [Google Scholar] [CrossRef]
  4. Daily, G.C. Nature’s Services: Societal Dependence on Natural Ecosystem Services, 1st ed; Island Press: Washington, DC, USA, 1997. [Google Scholar]
  5. Millennium Ecosystem Assessment (MEA). Ecosystems and Human Well-Being: Biodiversity Synthesis; World Resource Institute: Washington, DC, USA, 2005. Available online: http://www.millenniumassessment.org/documents/document.354.aspx.pdf (accessed on 13 August 2012).
  6. Turner, W.R.; Brandon, K.; Brooks, T.M.; Costanza, R.; da Fonseca, G.A.B.; Portela, R. Global conservation of biodiversity and ecosystem services. BioScience 2007, 57, 868–873. [Google Scholar] [CrossRef]
  7. Pimm, S.L.; Russell, G.J.; Gittleman, J.L.; Brooks, T.M. The future of biodiversity. Science 1995, 269, 347–350. [Google Scholar]
  8. Rodriguez, A.S.L.; Akçakaya, H.R.; Andelman, S.J.; Bakarr, M.I.; Boitani, L.; Brooks, T.M.; Cjanson, J.S.; Fishpool, L.D.C.; da Fonseca, G.A.B.; Gaston, K.J.; Hoffmann, M.; Marquet, P.A.; Pilgrim, J.D.; Pressey, R.L.; Schipper, J.; Secrest, W.; Stuart, S.N.; Underhill, L.; Waller, R.W.; Watts, M.E.J.; Yan, X. Global gap analysis: Priority regions for expanding the global protected-area network. BioScience 2004, 54, 1092–1100. [Google Scholar]
  9. Bailey, N.; Lee, J.C.; Thompson, S. Maximizing the natural capital benefits of habitat creation: Spatially targeting native woodland using GIS. Landsc. Urban Plan. 2006, 75, 227–243. [Google Scholar] [CrossRef]
  10. Margules, C.R.; Pressey, L.R. Systematic conservation planning. Nature 2000, 405, 243–253. [Google Scholar] [CrossRef]
  11. Izquierdo, A.E.; Grau, H.R. Agriculture adjustment, land-use transition and protected areas in Northwestern Argentina. J. Environ. Manag. 2009, 90, 858–865. [Google Scholar] [CrossRef]
  12. Waggoner, P.E.; Ausubel, J.H. How much feeding more and wealthier people will encroach on forests? Popul. Dev. Rev. 2001, 27, 239–257. [Google Scholar]
  13. Grau, H.R.; Gasparri, N.I.; Aide, T.M. Land use efficiency: Balancing food production and nature conservation in neotropical dry forests of NW Argentina. Glob. Chang. Biol. 2008, 14, 985–997. [Google Scholar] [CrossRef]
  14. Balmford, A.; Green, R.E.; Scharlemann, J.P.W. Sparing land for nature: Exploring the potential impact of changes in agricultural yield on the area needed for crop production. Glob. Chang. Biol. 2005, 11, 1594–1605. [Google Scholar] [CrossRef]
  15. Grau, H.R.; Aide, T.M. Globalization and land-use transitions in Latin America. Ecol. Soc. 2008, 13. Available online: http://www.ecologyandsociety.org/vol13/iss2/art16/ (accessed on 13 August 2012).
  16. Phalan, B.; Onial, M.; Balmford, A.; Green, R.E. Reconciling food production and biodiversity conservation: Land sharing and land sparing compared. Science 2011, 333, 1289–1291. [Google Scholar] [CrossRef]
  17. Matson, P.A.; Vitousek, P.M. Agricultural intensification: Will land spared from farming be land spared for nature? Conserv. Biol. 2006, 20, 709–710. [Google Scholar] [CrossRef]
  18. Perfecto, I.; Vandemeer, J. Biodiversity conservation in tropical agroecosystems. Ann. N. Y. Acad. Sci. 2008, 1134, 173–200. [Google Scholar] [CrossRef]
  19. Daily, G.C.; Kareiva, P.M.; Polasky, S.; Ricketts, T.H.; Tallis, H. Mainstreaming natural capital into decisions. In Natural Capital: Theory and Practice of Mapping Ecosystem Services, 1st; Kareiva, P., Tallis, H., Ricketts, T.H., Daily, G.C., Polasky, S., Eds.; Oxford University Press: Oxford, UK, 2010; pp. 3–14. [Google Scholar]
  20. Bruner, A.G.; Gullison, R.E.; Balmford, A. Financial costs and shortfalls of managing and expanding protected-area Systems in developing countries. BioScience 2004, 54, 1119–1126. [Google Scholar] [CrossRef]
  21. Naidoo, R.; Bamford, A.; Costanza, R.; Fisher, B.; Green, R.E.; Lehner, B.; Malcom, T.R.; Ricketts, T.H. Global mapping of ecosystem services and conservation priorities. Proc. Natl. Acad. Sci. USA 2008, 105, 9495–9500. [Google Scholar]
  22. Balmford, A.; Gaston, K.J.; Blyth, S.; James, A.; Kapos, V. Global variation in terrestrial conservation costs, conservation benefits, and unmet conservation needs. Proc. Natl. Acad. Sci. USA 2003, 100, 1046–1050. [Google Scholar]
  23. Ball, I.R.; Possingham, H.P.; Watts, M. Spatial Conservation Prioritisation: Quantitative Methods and Computational Tools; Moilanen, A., Wilson, K.A., Possingham, H.P., Eds.; Oxford University Press: Oxford, UK, 2009; p. 185. [Google Scholar]
  24. Airame, S.; Dugan, J.E.; Lafferty, K.D.; Leslie, H.; McArdle, D.A.; Warner, R.R. Applying ecological criteria to marine reserve design: A case study from the California Channel Islands. Ecol. Appl. 2003, 13, 170–184. [Google Scholar] [CrossRef]
  25. Jenkins, C.N.; Giri, C. Protection of mammal diversity in Central America. Conserv. Biol. 2008, 22, 1037–1044. [Google Scholar] [CrossRef]
  26. Fraschetti, S.; D’Ambrosio, P.; Micheli, F.; Pizzolante, F.; Bussotti, S.; Terlizzi, A. Design of marine protected áreas in a human-dominated seascape. Mar. Ecol. Prog. Ser. 2009, 375, 13–24. [Google Scholar] [CrossRef]
  27. Loss, S. Marxan analyses and prioritization of conservation areas for the central interior ecoregional assessment. BC J. Ecosyst. Manag. 2009, 12, 88–97. [Google Scholar]
  28. Chan, K.M.A.; Shaw, M.R.; Cameron, D.R.; Underwood, E.C.; Daily, G.C. Conservation planning for ecosystem services. PLoS Biol. 2006, 4, 2138–2152. [Google Scholar]
  29. Di Bitetti, M.S.; Placci, G.; Dietz, L.A. A Biodiversity Vision for the Upper Paraná Atlantic Forest Eco-Region: Designing a Biodiversity Conservation Landscape and Setting Priorities for Conservation Action; World Wildlife Fund: Washington, DC, USA, 2003; p. 156. [Google Scholar]
  30. Hoekstra, J.M.; Boucher, T.M.; Ricketts, T.H.; Roberts, C. Confronting a biome crisis: Global disparities of habitat loss and protection. Ecol. Lett. 2005, 8, 23–29. [Google Scholar]
  31. Myers, N.; Mittermeier, R.A.; Mittermeier, C.G.; da Fonseca, G.A.B.; Kent, J. Biodiversity hotspots for conservation priorities. Nature 2000, 403, 853–858. [Google Scholar]
  32. Mittermeier, R.A.; Robles-Gil, P.; Hoffmann, M.; Pilgrim, J.D.; Brooks, T.M.; Mittermeier, C.G.; Lamoreux, J.L.; Fonseca, G. Hotspots Revisited: Earth’s Biologically Richest and Most Endangered Terrestrial Ecoregions; CEMEX: Mexico City, Mexico, 2005; p. 392. [Google Scholar]
  33. Olson, D.M.; Dinerstein, E.; Wikramanayake, E.D.; Burgess, N.D.; Powell, G.V.N.; Underwood, E.C.; D’amico, J.A.; Itoua, I.; Strand, H.E.; Morrison, J.C.; Loucks, C.J.; Allnutt, T.F.; Ricketts, T.H.; Kura, Y.; Lamoreux, J.F.; Wettengel, W.W.; Hedao, P.; Kassem, K. Terrestrial Ecoregions of the world: A new map of life on earth. BioScience 2001, 51, 933–938. [Google Scholar]
  34. Izquierdo, A.E.; de Angelo, C.D.; Aide, T.M. Thirty years of human demography and land-use change in the Atlantic Forest of Misiones, Argentina: An evaluation of the forest transition model. Ecol. Soc. 2008, 13. Available online: http://www.ecologyandsociety.org/vol13/iss2/art3/ (accessed on 13 August 2012).
  35. Izquierdo, A.E.; Grau, H.R.; Aide, T.M. Implications of rural-urban migration for conservation of the Atlantic Forest and urban growth in Misiones, Argentina (1970–2030). AMBIO J. Hum. Environ. 2011, 40, 298–309. [Google Scholar] [CrossRef]
  36. Gasparri, N.I.; Grau, H.R. Patrones regionales de deforestación en el subtrópico argentino y su contexto ecológico y socioeconómico (in Spanish). In Situación Ambiental Argentina; Brown, A.D., Martinez, O.U., Acerbi, M., Corchera, J., Eds.; Fundación Vida Silvestre: Buenos Aires, Argentina, 2006; pp. 442–446. [Google Scholar]
  37. Giraudo, A.R.; Krauczuk, E.; Arzamendia, V.; Povedano, H. Critical analysis of protected areas in the Atlantic Forest of Argentina. In The Atlantic Forest of South America. Center for Applied Biodiversity Science; Galindo-Leal, C., de Gusmao, C.I., Eds.; Island Press: Washington, DC, USA, 2003; pp. 245–261. [Google Scholar]
  38. Fahey, C.; Langhammer, P.F. The effects of dams on biodiversity in the Atlantic Forest. In The Atlantic Forest of South America. Center for Applied Biodiversity Science; Galindo-Leal, C., de Gusmao, C.I., Eds.; Island Press: Washington, DC, USA, 2003; pp. 413–425. [Google Scholar]
  39. Fearnside, P.M. Hydroelectric dams in the Brazilian Amazon as sources of “green-house” gases. Environ. Conserv. 1995, 22, 7–19. [Google Scholar] [CrossRef]
  40. Game, E.T.; Grantham, H.S. Marxan User Manual: For Marxan Version 1.8.10.; University of Queensland: St. Lucia, Australia; Pacific Marine Analysis, 2008; Research Association: Vancouver, Canada. [Google Scholar]
  41. Fisher, B.; Turner, R.K.; Morling, P. Defining and classifying ecosystem services for decision making. Ecol. Econ. 2009, 68, 643–653. [Google Scholar] [CrossRef]
  42. Instituto Nacional de Tecnología Agropecuaria (INTA), Informe edafologico de la Provincia de Misiones, Republica Argentina (in Spanish); INTA: Corrientes, Argentina, 1964; p. 70.
  43. Lasserre, R.; Ríos, M.A. Evaluación de los Recursos del Suelo del Área de Frontera de la Provincia de Misiones (in Spanish); INTA: Corrientes, Argentina, 1983; p. 69. [Google Scholar]
  44. Ligier, H.D. Caracterización Geomorfológica y Edáfica de la Provincia de Misiones. Informe Para la Fundacion Vida Silvestre Argentina; INTA: Corrientes, Argentina, 2000. [Google Scholar]
  45. Placci, G.; DiBitetti, M.S. Situación ambiental de la ecorregion del Bosque Atlantico del Alto Parana (Selva Parananense). In Situación Ambiental Argentina; Brown, A.D., Martinez, O.U., Acerbi, M.C.J., Eds.; Fundación Vida Silvestre: Buenos Aires, Argentina, 2006; pp. 197–210. [Google Scholar]
  46. Facetti, J.F. The guaraní aquifer: A regional environmenal service. In The Atlantic Forest of South America. Center for Applied Biodiversity Science; Galindo-Leal, C., de Gusmao, C.I., Eds.; Island Press: Washington, DC, USA, 2003; pp. 325–327. [Google Scholar]
  47. Di Bitetti, M.S.; Paviolo, A.; Ferrari, C.; de Angelo, C.D.; di Blanco, Y.E. Differential responses to hunting in two sympatric species of brocket deer (Mazama americana and M. nana). Biotropica 2008, 40, 636–645. [Google Scholar] [CrossRef]
  48. Di Bitetti, M.S.; Paviolo, A.; de Angelo, C.D. Density, habitat use and activity patterns of ocelots (Leopardus pardalis) in the Atlantic Forest of Misiones, Argentina. J. Zool. 2006, 270, 153–163. [Google Scholar]
  49. Zurita, G.A.; Rey, N.; Varela, D.M.; Villagra, M.; Belock, M.I. Conversion of the Atlantic Forest into native and exotic tree plantations: Effects on bird communities from the local and regional perspectives. For. Ecol. Manag. 2006, 235, 164–173. [Google Scholar] [CrossRef]
  50. Tallis, H.T.; Ricketts, T.; Nelson, E.; Ennaanay, D.; Wolny, S.; Olwero, N.; Vigerstol, K.; Pennington, D.; Mendoza, G.; Aukema, J.; Foster, J.; Forrest, J.; Cameron, D.; Lonsdorf, E.; Kennedy, C. InVEST 1.005 Beta User’s Guide; The Natural Capital Project: Stanford, CA, USA, 2010. [Google Scholar]
  51. Gasparri, N.I.; Grau, H.R.; Manghi, E. Carbon pools and emissions from deforestation in extra-tropical forests of Northern Argentina between 1900 and 2005. Ecosystems 2008, 11, 1247–1261. [Google Scholar] [CrossRef]
  52. IPCC Guidelines for National Greenhouse Gas Inventories; Institute for Global Environmental 73 Strategies (IGES): Hayama, Japan, 2006. Available online: http://www.ipcc-nggip.iges.or.jp/public/2006gl/vol4.html (accessed on 13 August 2012).
  53. Houghton, R.A. Tropical deforestation as a source of greenhouse gas emissions. In Tropical Deforestation and Climate Change; Moutinho, P., Schwartzman, S., Eds.; Instituto de Pesquisa Ambiental da Amazonia and Environmental Defense: Belem, Brazil, 2005. [Google Scholar]
  54. Wischmeier, W.H.; Smith, D. Predicting Rainfall Erosion Losses: A Guide to Conservation Planning; US Department of Agriculture: Washington, DC, USA, 1978. [Google Scholar]
  55. Erosion Control as a Response to Various Erosion Processes; Natural Resources Management and Environment Department (FAO): Rome, Italy, 1996. Available online: http://www.fao.org/ (accessed on 13 August 2012).
  56. National Agricultural Technology Institute (INTA), Argentina. Available online: http://inta.gob.ar (accessed on 13 August 2012).
  57. Zhang, L.; Dawes, W.R.; Walker, G.R. Response of mean annual evapotranspiration to vegetation changes at catchment scale. Water Resour. Res. 2001, 37, 701–708. [Google Scholar] [CrossRef]
  58. Hijmans, R.J.; Cameron, S.E.; Parra, J.L.; Jones, P.G.; Jarvis, A. Very high resolution interpolated climate surfaces for global land areas. Int. J. Climatol. 2005, 25, 1965–1978. [Google Scholar] [CrossRef]
  59. United Nations Food and Agriculture Organization (FAO). GeoNetwork Spatial Data Portal. Available online: http://www.fao.org/geonetwork (accessed on 13 August 2012).
  60. National Agricultural Technology Institute (INTA), Atlas de Suelos de la República Argentina (in Spanish); INTA: Buenos Aires, Argentina, 1990.
  61. Integrated Hydrologic Data Base (BDHI). Available online: http://www.hidricosargentina.gov.ar/AccesoBDHI.html (accessed on 15 August 2012).
  62. National Institute of Statistics and Censuses (INDEC), Censo Nacional Agropecuario (in Spanish); INDEC: Buenos Aires, Argentina, 2002.
  63. Ardron, J.A.; Possingham, H.P.; Klein, C.J. Marxan Good Practices Handbook, Version 2; Pacific Marine Analysis and Research Association: Victoria, Canada, 2010. [Google Scholar]
  64. Schill, S.; Raber, G. Protected Area Tools (PAT) for ArcGIS 9.3TM, Version 3.0 User Manual and Tutorial; The Nature Conservancy: Arlington, VA, USA, 2009. [Google Scholar]
  65. World Wildlife Foundations (WWF)/Fundación Vida Silvestre Argentina (FVSA), Atlantic Forests, Ecoregional Action Plan (EAP) 2020: Zero-Deforestation Landscape; Working paper for WWF/FVSA: Washington, DC, USA, 2011.
  66. NASA Fire Information for Resource Management System (FIRMS), MODIS Hotspot/Active Fire Detections. Available online: http://earthdata.nasa.gov/firms (accessed on 15 August 2012).
  67. Digital Chart of the World (DCW) by the United States Defense Mapping Agency (DMA). Available online: http://www.diva-gis.org/gData (accessed on 15 August 2012).
  68. Available online: http://whc.unesco.org/en/statesparties/ar (accessed on 15 August 2012).
  69. New7Wonders Foundation. Available online: http://www.n7w.com (accessed on 15 August 2012).
  70. Balmford, A.; Green, R.; Phalan, B. What conservationists need to know about farming. Proc. Royal Soc. 2012, 279, 2714–2724. [Google Scholar] [CrossRef]
  71. Conservación Argentina Home Page. Available online: http://www.conservacion.org.ar/Nuestros-proyectos-corredor.htm (accessed on 15 August 2012).
  72. Giraudo, A.; Povedano, H. Threats of extinction to flagship species in the Interior Atlantic Forest. In The Atlantic Forest of South America: Center for Applied Biodiversity Science; Galindo-Leal, C., de Gusmao, C.I., Eds.; Island Press: Washington, DC, USA, 2003; pp. 181–193. [Google Scholar]
  73. Alcobe, F. Bosques de Alto Valor de Conservación-Yabotí, Informe Para Nativa, Misiones, Argentina. Personal communication, 2009.
  74. Bovarnick, A.; Fernández-Baca, J.; Galindo, J.; Negret, H. Sostenibilidad Financiera de las Áreas Protegidas en América Latina y el Caribe: Guía Para la Política de Inversión (in Spanish); Unite Nations Development Program and the Nature Conservancy: Arlington, VA, USA, 2010. [Google Scholar]
  75. Varela, D.D.; Jaramillo, M. Conservación Argentina, Puerto Iguazú (N3370FSC) and Fundación Vida Silvestre Argentina (FVSA), Misiones, Argentina. Personal communication, 2011.
  76. Angelsen, A.; Brown, S.; Loisel, C.; Peskett, L.; Streck, C.; Zarin, D. Reducing Emissions from Deforestation and Forest Degradation (REDD): An Options Assessment Report; Meridian Institute: Washington, DC, USA, 2009. [Google Scholar]
  77. Alix-Garcia, J.; de Janvry, A.; Sadoulet, E. The Role of Calibrated compensation and risk in designing payments for environmental services. Environ. Dev. Econ. 2008, 13, 375–394. [Google Scholar]
  78. Mayrand, K.; Paquin, M. Payments for Environmental Services: A Survey and Assessment of Current Schemes; Unisfera International Center: Montréal, Canada, 2004. Available online: http://www.cec.org/files/PDF/ECONOMY/PES-Unisfera_en.pdf (accessed on 13 August 2012).

