Article

The Contribution of Managed and Unmanaged Forests to Climate Change Mitigation—A Model Approach at Stand Level for the Main Tree Species in Bavaria

1
Bavarian State Institute of Forestry, Hans-Carl-von-Carlowitz-Platz 1, 85354 Freising, Germany
2
Technical University of Munich, Institute of Silviculture, Hans-Carl-von-Carlowitz-Platz 2, 85354 Freising, Germany
*
Author to whom correspondence should be addressed.
Forests 2013, 4(1), 43-69; https://doi.org/10.3390/f4010043
Submission received: 5 November 2012 / Revised: 26 December 2012 / Accepted: 27 December 2012 / Published: 14 January 2013
(This article belongs to the Special Issue The Role of Forests for Carbon Capture and Storage)

Abstract

:
Forestry-based carbon sequestration projects demand a comprehensive quantification of the different climate change mitigation effects. In our study, we modeled a life cycle of managed pure stands consisting of the four main tree species in Bavaria (spruce, pine, beech and oak). For spruce and beech, an unmanaged stand was additionally integrated in order to analyze the differences in climate change mitigation effects compared to the managed stands. We developed a climate change mitigation model, where stand development and silvicultural treatments including harvested timber volumes were conducted using the tree growth model Silva 2.3. The harvested wood products (HWP), including their substitution effects were calculated with a subsequent model. For unmanaged beech forests, we compiled measured data from the literature, and Bavarian strict forest reserves for validating our model results. The results for the managed stands reveal that spruce provides the highest total climate change mitigation effects. After a simulation period of 180 years, one hectare leads to a mean mitigation benefit of 13.5 Mg CO2 ha−1 year−1. In comparison, results for pine, beech and oak reveal lesser benefits with 10.1 Mg CO2 ha−1 year−1, 9.1 Mg CO2 ha−1 year−1 and 7.2 Mg CO2 ha−1 year−1, respectively. However, these results assume current growing conditions. Considering climate change, it is very likely that spruce will not be suitable in several regions of Bavaria in the future. Furthermore, excessive disturbances could affect spruce more drastically than the other tree species. In that case, the order could change and beech could exceed spruce. Thus the results cannot be seen as a general recommendation to establish spruce stands in order to achieve optimal climate change mitigation benefits. Nevertheless, results for spruce illustrate that high increment and especially wood use in long-lived products is crucial for high climate change mitigation effects. Mitigation effects in unmanaged spruce and beech stands do not differ in the first decades from their managed counterparts, but are below them in the long term with a total climate change mitigation benefit of 8.0 Mg CO2 ha−1 year−1 and 7.2 Mg CO2 ha−1 year−1, respectively. These differences are mainly caused by the missing substitution effects in the unmanaged stands. However, the precise dimensions of substitution effects still remain uncertain and the lack of data should be reduced via additional life cycle assessments for more products and product classes. However, neglecting substitution effects in climate change mitigation models leads to severe underestimations of the mitigation effects in managed forests.

Graphical Abstract

1. Introduction

On a global scale, forests play a key role in climate change as they accumulate carbon in living forest biomass, deadwood, forest floor and mineral soil. They can act as carbon sinks or sources, depending on the relation of carbon accumulation and carbon loss through decomposition, respiration or harvesting [1,2]. Due to these effects, forests and forest management are incorporated in the Kyoto Protocol [3,4]. However, until now, harvested wood products (HWP) have not been considered [5]. Yet as a result of the climate conference in Durban in 2011, HWP are intended to be included in forest carbon accounting in the next commitment period [6].
Besides the mechanisms of the Kyoto Protocol, in which human-induced carbon sources or removals in nationwide forests or carbon sequestration by Clean Development Mechanism (CDM) or Joint Implementation (JI) forest projects can be accounted for, a voluntary carbon market has been established. The idea of this market is that companies, private persons, or others, contribute financially to climate projects with the aim of compensating their own Greenhouse Gases (GHG) emissions voluntarily. Hence, besides large-scale surveys regarding the contribution of forests to national GHG inventories (e.g., [7] for Germany, [8] for the USA), the interest in the comprehensive climate change mitigation effects of single forest stands, including harvested wood products (HWP) and their benefits in avoiding fossil fuel emissions, increases. A growing number of providers for voluntary afforestation or reforestation projects have appeared in the last few years, but the quantification of all climate change mitigation effects, especially for managed forests, often remains uncertain. In many cases, only the development of the forest biomass is integrated in calculations to quantify the climate change mitigation benefits which are generated within a project. This approach, which solely considers the forest ecosystem, can lead to underestimations because harvested wood has additional climate change mitigation effects [9].
In general, all climate change mitigation benefits generated by a forest can be summarized by carbon accumulation in living biomass, forest soil and deadwood. In the case of managed forests, additional positive effects can be achieved. The carbon storage can be extended in wood products, especially in long-lived products, thereby substituting other materials which are produced with higher fossil fuel energy input (material substitution). Moreover, fossil fuels can be directly replaced by fuel wood (energy substitution). Both the substitution of energy-intensive materials and fossil fuels lead to less and irreversible GHG emissions [10,11]. The most important requirement in order to gain all these positive effects in managed forests is the practice of sustainable forest management. If forest management is not sustainable, e.g., if wood is harvested without accounting for rejuvenation, or land use is changed after deforestation, negative climate effects like a less future carbon sequestration in the area can arise. According to e.g., Hofer et al. [12], it can be concluded that sustainable forest management leads to carbon offset in the forests on the one hand, and avoids GHG emissions by using wood products and fuel wood, on the other. Since the function of forests as carbon sinks and sources is commonly accepted, there exist a plentitude of studies about forests and their role in the carbon cycle on a worldwide or continental level [13,14] and for managed [15,16] and unmanaged forests [17]. Furthermore, several studies on a regional [18,19,20,21] or national level [7,22] which include all climate change mitigation effects (often excluding soil carbon) are available as well as many experimental studies on a stand level [23,24]. However, the latter only partially contains the wood product sector and substitution effects. Additionally, there are only a few studies which consider the whole life cycle of a forest from planting to the end of the rotation (e.g., [9]). Comprehensive models including all climate change mitigation effects should be developed in order to have a holistic overview within a defined time period as a base for specific forest climate projects. Furthermore, it has to be ascertained, which tree species create the best benefits regarding climate change mitigation under the same site conditions for different regions or countries.
Additionally, there is in discussion whether unmanaged forests have higher contributions to climate change mitigation than managed forests because of their potential of carbon sequestration in living biomass, deadwood and soil, even in old-growth forests [25]. Depending on the stage of development, and without considering excessive natural disturbances like wind throw or insects, one can deduce that unmanaged forests have positive benefits regarding climate change for at least several decades, or even centuries, as shown in e.g., [17]. The question is: Do managed forests have a higher potential in the long term? Therefore, the aim of the present study was to answer the following questions:
  • (1) What is the entire contribution of a stand (per hectare) to climate change mitigation within a time period of 180 years?
  • (2) What are the differences between the four main tree species in Bavaria regarding climate change mitigation aspects?
  • (3) Is the contribution of an unmanaged stand to climate change mitigation higher than a managed stand?
For questions (1) and (2), a managed pure stand for each of the four main tree species in Bavaria (beech, oak, spruce and pine) under the same site conditions for the same simulation period was modeled, and all climate change mitigation effects were analyzed. Due to poor parameterization data for unmanaged oak and pine stands, only unmanaged stands of spruce and beech were modeled in order to answer question (3).

2. Methods

Virtual stands were generated, aiming to describe the development of a whole stand life cycle. All model calculations regarding stand development and timber volume production were conducted using the forest growth model Silva 2.3 [26]. A deadwood and HWP model was developed using Microsoft Excel and, for the summary of all results, STATISTICA 9.1 was used.
Living biomass, deadwood stocks, timber volume and HWP were calculated for each model period (in a five-year time period). Due to the fact that Silva is a statistical model, four model runs over a time period of 180 years were conducted for every stand, where the mean values of the runs for each parameter (e.g., growing stock, harvested timber volume) were taken. After four runs, it can be assured that the variability of the results has been considered. More runs would be too time consuming. The simulation period of 180 years ensures that, for all four tree species, at least one rotation is taken into account. Additionally, our reforestations are based on an area with former forest use and, thereby, constant soil carbon storage is assumed. In order to simplify the calculations and to demonstrate an optimized development, possible disturbances caused for example by insects or windstorms as well as possible changes regarding air temperature or precipitation as a consequence of climate change are not considered in the model but discussed in section 4.

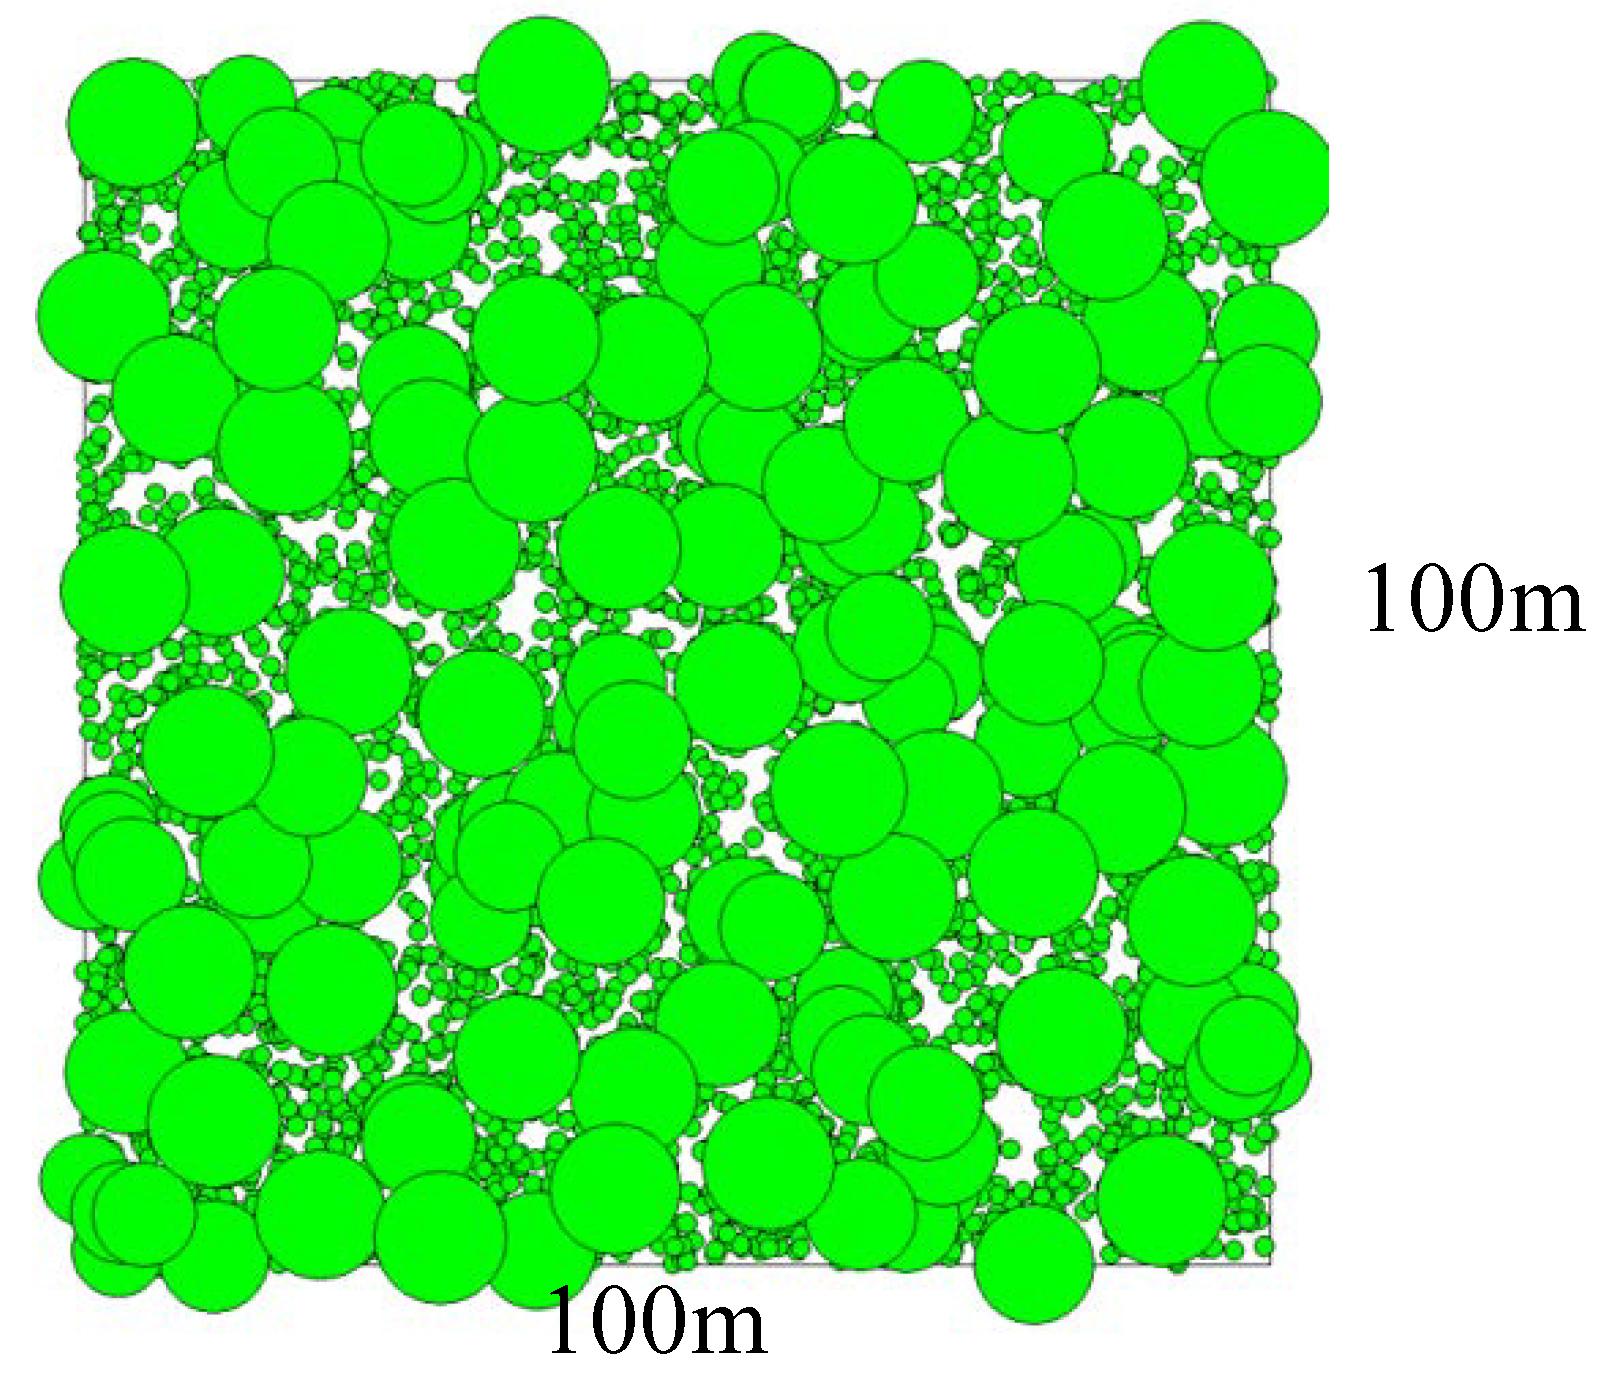
2.1. The Modeled Forest Stands

For each of the four main tree species in Bavaria, Common beech (Fagus sylvatica), Sessile oak (Quercus petraea), Norway spruce (Picea abies) and Scots pine (Pinus sylvestris), a pure even-aged stand (one ha) with 5,000 plants (equally distributed) was generated (age: 15 years; dbh: 7 cm; tree height: 7 m). Starting with the same input data for all stands allows a better comparison between the tree species, even if a smaller number of saplings are commonly required to establish, for example, a new spruce forest. All four modeled stands have the same site characteristics: 480 m above sea level, 469 mm precipitation and 14.7 °C mean temperature in the growing season, an average soil moisture and nutrient availability and are without exposition and slope. The site is classified as “Oberbayerisches Tertiärhügelland” (one of the spacious physical forest regions in Bavaria according to the Bavarian State Institute of Forestry). Following these characteristics, a good site quality can be assumed.
At the beginning of the simulation, skidding lines were installed every 25 m at stand age of 15 years in the managed stands. The silvicultural interventions followed established rules (selected tree thinning with a subsequent final cutting) with treatment intervals every five or ten years and different rotations, depending on development stage and tree species, (stand characteristics see Table 1): for spruce 100–120 years, pine 120–150 years, beech 130–160 years, and, oak 140–180 years, were assumed (final cutting period). To fulfill the requirements of a sustainable management, an additional regeneration layer (about 5000 trees) was established under the adult tree layer when the final cutting began and the growing stock of the initial generation is meant to be harvested within the next decades. This ensures a continuous change from one generation to the next without having gaps with open field characteristics during the final cutting period or an area without any regrowth at the end of one rotation (see Figure 1).
Table 1. Stand characteristics of the modeled stands at selected points of the 180-year simulation period, where BA is the basal area, GS the growing stock (standing gross volume over bark), h100 the top height (mean height of the 100 biggest trees), d100 the mean diameter of the 100 biggest trees, m the managed and um the unmanaged stands. At 180 years, the subsequent beech stand is 55, the oak stand 40, the spruce stand 75 and the pine stand 50 years old. The grey area indicates a new rotation.
beechoaksprucepine
mummmumm
40 yearsN (trees ha−1)10681082733185420901778
BA (m² ha−1)24.624.518.745.057.131.2
GS (m³ ha−1)141139134327428221
h100 (m)13.513.416.016.717.117.6
d100 (cm)19.719.620.223.423.019.3
80 yearsN (trees ha−1)316441190613928608
BA (m² ha−1)25.536.317.447.372.930.2
GS (m³ ha−1)3164492476501,016387
h100 (m)25.325.127.730.330.530.4
d100 (cm)37.937.137.842.839.432.4
120 yearsN (trees ha−1)151252992147450310
BA (m² ha−1)29.343.620.49.364.026.8
GS (m³ ha−1)524770374251,159454
h100 (m)34.534.233.99.240.539.1
d100 (cm)54.653.051.39.950.741.1
180 yearsN (trees ha−1)6831129461802321037
BA (m² ha−1)25.937.811929.159.727.1
GS (m³ ha−1)20286421.34041,290233
h100 (m)17.043.214.630.050.821.8
d100 (cm)25.367.419.741.664.324.8
Figure 1. The managed beech stand 125 years after planting containing a dominant tree layer and a regeneration layer in the understory. The figure is generated by Silva 2.3.
Forests 04 00043 g001
As a reference for the beech and spruce stand, a scenario without any treatments during the whole simulation period was modeled in order to illustrate climate change mitigation benefits in an unmanaged even-aged forest. Due to an insufficient database of unmanaged oak and pine stands for the validation of the model results (see section 2.5.), these two species were not considered. In the unmanaged stands, natural mortality, mainly caused by competition between the single trees as described in [26], is the only factor that reduces the living biomass carbon pool.

2.2. Carbon and Biomass Estimation

The modeled growing stock (m³) was converted into total stand biomass (Mg) using our own expansion factors based on tree-specific aboveground biomass equations from [27] and root/shoot factors for belowground biomass from [28] (see Table 2). The conversion from biomass into carbon was calculated using the common factor of 0.5, assuming that the carbon content of each tree and tree compartment is similar [29]. For the deadwood pool, the remaining deadwood mass of each period and the same carbon conversion factor of 0.5 were used to estimate the total carbon storage.
Table 2. Biomass equations and root/shoot (r/s) factors used in this study; AB=aboveground biomass.
biomass equationr/s
Norway spruceAB = 0.067 × D1.938 × H0.6380.22
Scots pineAB = 0.058 × D2.034 × H0.6370.20
Common beechAB = 0.037 × D2.108 × H0.7700.18
Sessile oakAB = 0.044 × D2.096 × H0.7120.22

2.3. Deadwood Stock Simulation

After tree dieback, carbon is not released immediately into the atmosphere, but stored in deadwood for some time, depending on the specific decomposition rates of each tree species. The decay of deadwood was calculated using a simple exponential first order model (Equation 1) following [30]. In the managed stands, the same equation was used as in the unmanaged stands. The deadwood input consisted of logging residuals and natural mortality.
Forests 04 00043 i001
with D(t) as deadwood mass at time t, D(t0) as initial dead wood mass (calculated by deadwood volume and tree specific wood density, for spruce 0.377 Mg m³, for pine 0.431 Mg m³, for beech 0.554 Mg m³ and for oak 0.56 Mg m³) and k as species specific decay rate using 0.106 for hardwood and 0.053 for softwood [30]. The decay rates used in the model indicate an average decomposition compared to other decay rates found in the literature as they are shown e.g., in [31].

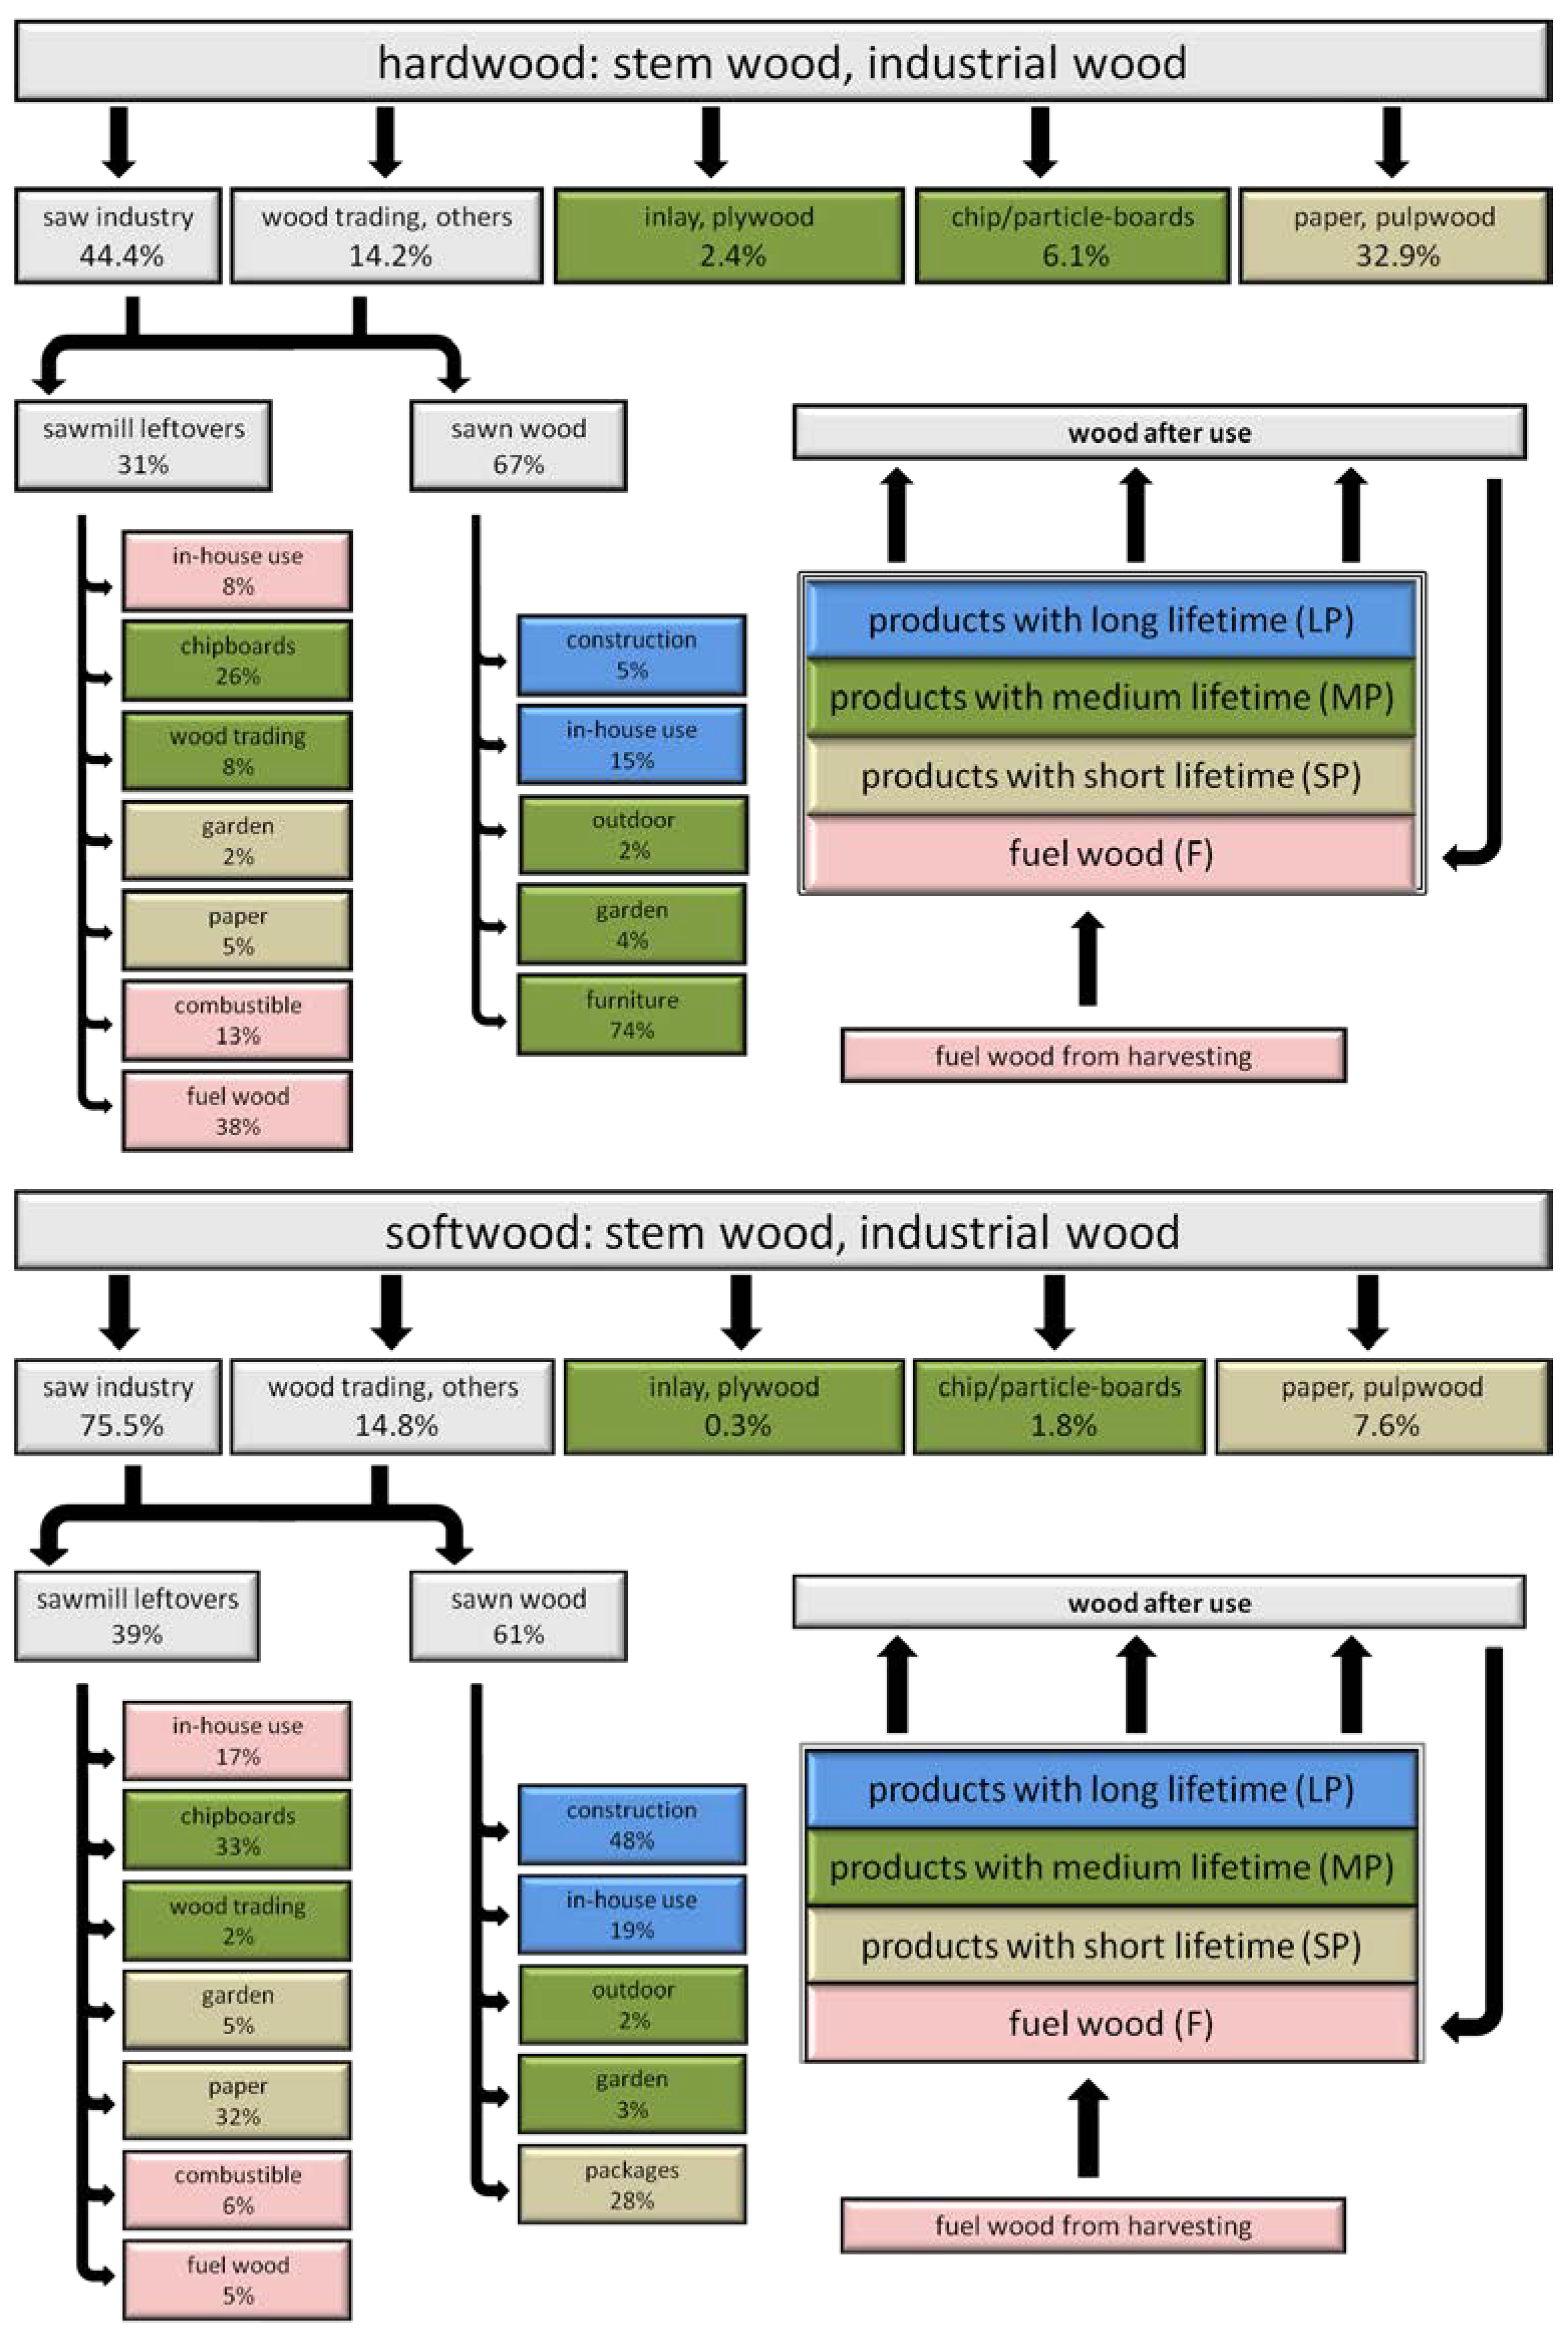
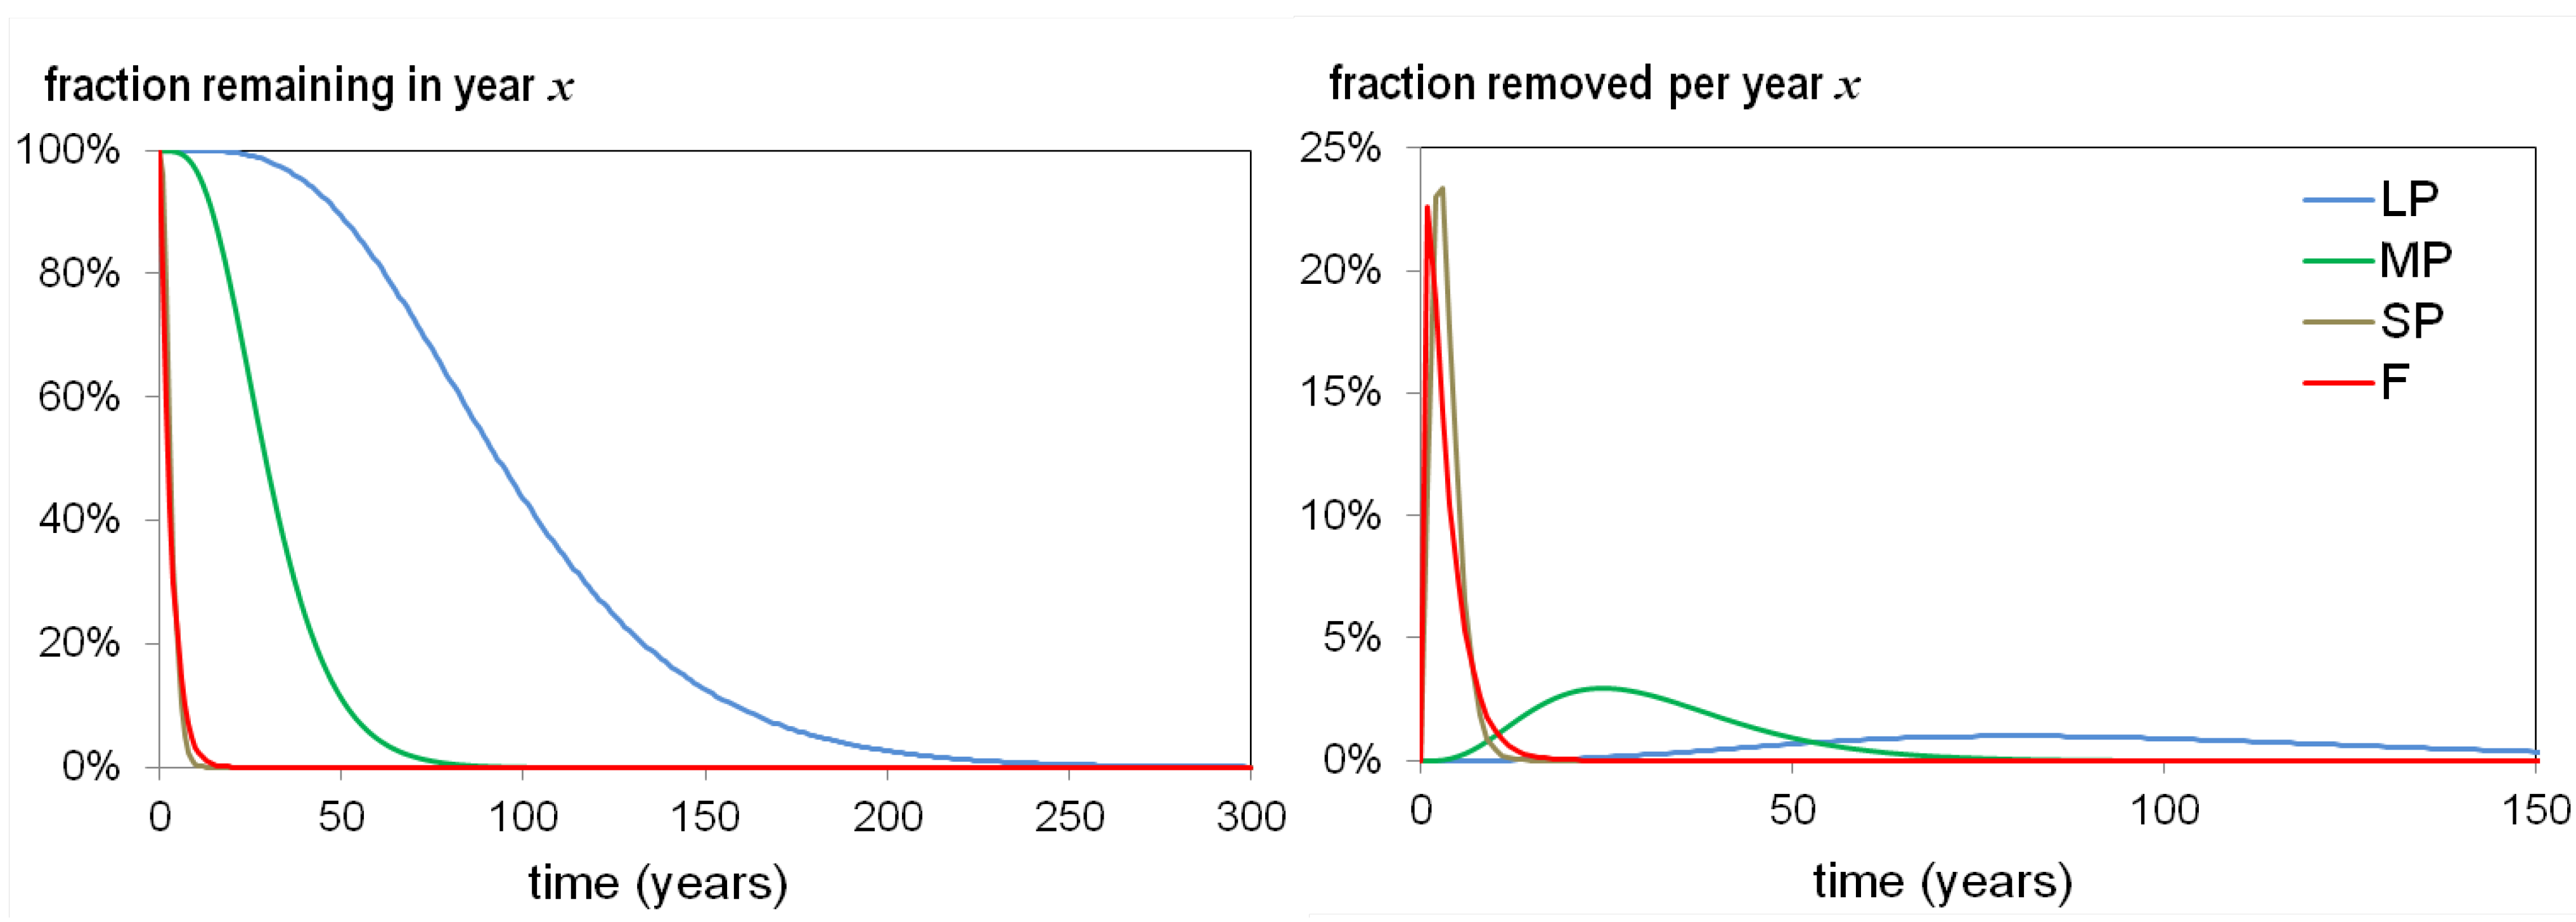
2.4. Timber Volume and Wood Use

Timber volume of each model period is distributed by the mid-diameter of the logs in different assortments (e.g., stem wood or industrial wood). Timber volume is converted into biomass by tree-specific wood densities and enters into the HWP. Carbon input into HWP is influenced by the time of harvesting, the timber volume and the wood use. Carbon output depends on the mean residence time of every single product class. Thus, the total carbon stock in the HWP at time t is calculated by the difference between input and output in every model period.
The residence time for the HWP was estimated by a distributed approach using a Gamma function as described in [32] where the amount of wood leaving the HWP pool in every model period after use was calculated following Equation 2.
Forests 04 00043 i002
with Г(p) as a Gamma distribution function, x as decay and k, θ as parameters of the distribution. The parameters used for the model are presented in Table 3.
Table 3. The parameters of the Gamma-distributed equation with amax as year with maximum decay and a95% as year where 95% of the initial amount is decayed; amax and a95% are own estimations based on literature; k and θ are the parameters of the Gamma function.
amaxa95%kθ
HWP with long lifetime (LP) (construction)801805.1519.30
HWP with middle lifetime (MP) (outdoor area wood, garden, chip boards, furniture)15403.685.42
HWP with short lifetime (SP) (paper, pulpwood, packages, pallets)383.51.00
fuel wood (F)191.313.50
For the transition from wood as a raw material to wood in use, the timber volume is classified by lifetime into one of the four defined product classes as shown in Table 3.
The distribution of the timber volume (stem wood and industrial wood) into wood products, which is the basis for allocating all timber volume into product classes, was carried out according to the “Forestry and wood cluster study” for Bavaria [33] which contains wood material flows for primary wood processing of the year 2006 in Bavaria (Figure 2). Thus, for every model period, the same wood material flow is assumed. The amount of wood which is directly dedicated to fuel wood was derived according to logging statistics for Bavaria for every tree species. Hence, referring to the years 2006/2007, the part of the total harvested wood directly used as fuel wood was 50% for beech, 54% for oak, 17% for spruce and 27% for pine [34,35].
Figure 2. Wood material flow for softwood and hardwood (stem and industrial wood) in Bavaria in 2006 (figure derived from data of [33]).
Forests 04 00043 g002
In contrast to the simple exponential first order model proposed by the IPCC [36] as a default method, the Gamma-distributed decay rate does not depend on the total amount of wood but on the time since entry into the HWP. Long-lived wood products are especially expected not to decompose at a high rate in the first years of use [32]. The difference between the exponential first order model and the Gamma distribution model can be illustrated by the following example: if in the year x, one hundred buildings with a certain amount of wood are constructed, it is likely that, for example, in the year x + 10 almost all one hundred buildings are still in use (if construction errors can be excluded). Using an exponential decay, a certain amount of wood would leave the HWP pool within the first 10 years, while the decay in the first years following a Gamma distribution is almost zero. Removed and remaining fractions with time for each product class are shown in Figure 3.
Studies about residence time for wood in use are available for different regions or countries, but the results vary widely [37]. Residence times for wood products are still uncertain due to several reasons, such as special socioeconomic aspects, or regional or temporal trends in furniture or in construction [19]. Once a wood product leaves the HWP, it was considered in the model as fuel wood without any further material purposes. Wood flow into landfills is not considered because German regulations regarding used wood prohibit their storage in landfills since 2003.
Figure 3. Fraction remaining and removed with time for the four different wood product classes; LP=products with long lifetime, MP=products with medium lifetime; SP=products with short lifetime, F=fuel wood.
Forests 04 00043 g003

2.5. Substitution Effects of Wood Use

Climate change mitigation effects of HWP are not only based on carbon storage, but also on substitution effects when wooden products replace materials produced with higher energy input (e.g., steel or concrete) or when the use of fuel wood avoids fossil fuel consumption. Many studies claim that these substitution effects are the main contribution of forest management to climate change mitigation and even more important than the carbon storage itself [38,39]. However, substitution rates vary a lot between different studies. In case of material substitution, values range from 0.7 Mg CO2 m−3 [22] to more than 1.0 Mg CO2 m−3 [40]. Some authors like Sathre and O’Connor [37] found even higher rates within a Meta analysis. One reason for this high variability is that these rates depend on several criteria: On the one hand, wood quality and the type of wood product are important and, on the other hand, substitution rates strongly depend on the specific products the wooden products are compared to [38]. These criteria are influenced by system boundaries, the country-specific consumer behavior, or the time of simulation. Nevertheless, substitution rates should be taken into account in order to avoid severe underestimations of climate change mitigation potential of managed forests. In this study, a conservative approach was defined using 0.7 Mg CO2 m−3 [22] for material substitution. In case of energy substitution, a rate of 0.675 Mg CO2 m−3 [4] was assumed. An overview of the whole model approach is shown in Figure 4.
Figure 4. The model approach; LP= products with long lifetime, MP=products with middle lifetime, SP=products with short lifetime, F=fuel wood.
Forests 04 00043 g004

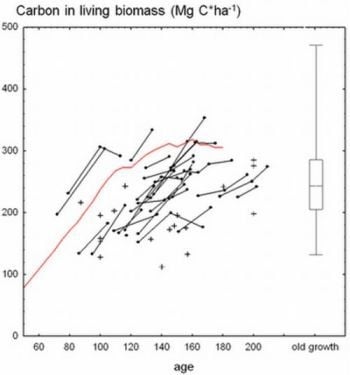
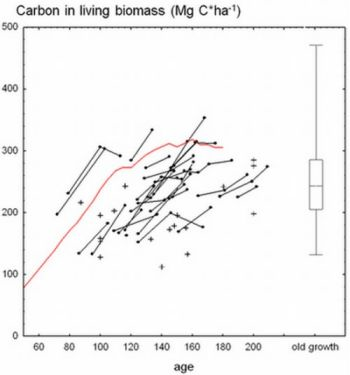
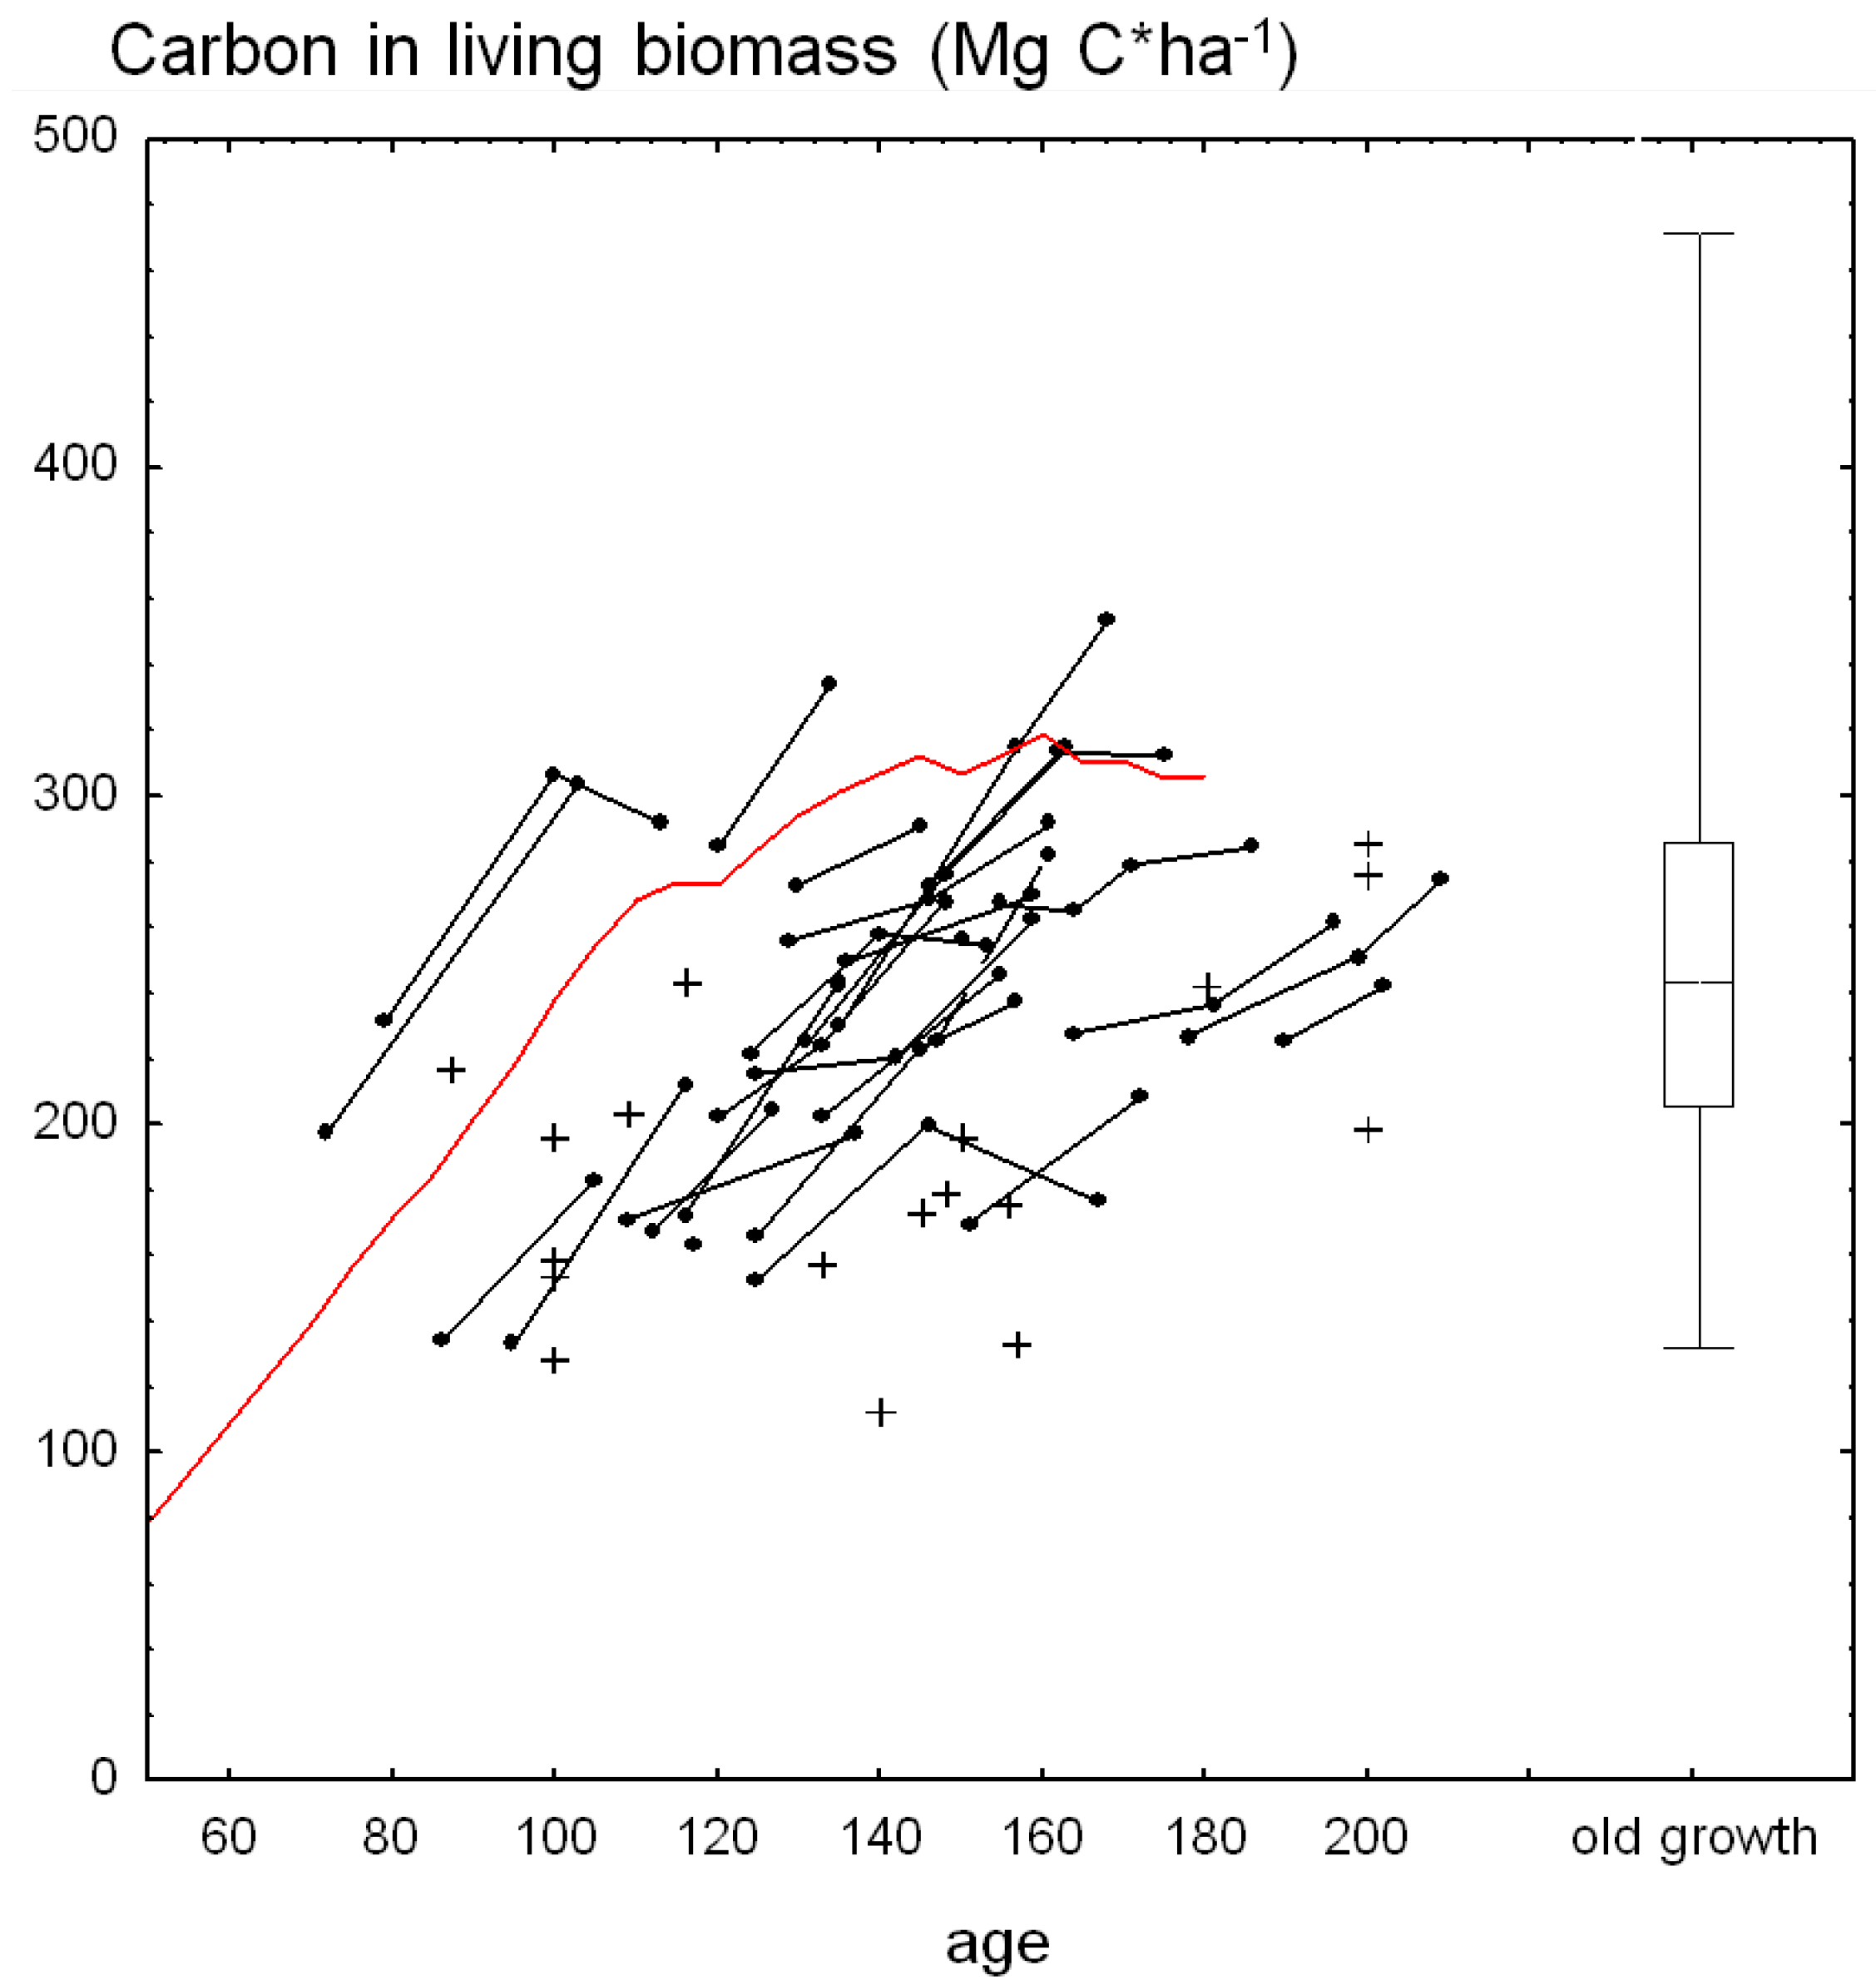
2.6. Evaluation of the Results for the Unmanaged Beech Stand

The development of biomass and deadwood in Silva simulations for the unmanaged beech stand was evaluated with literature data for comparable unmanaged stands with specified age and data from the unmanaged Bavarian strict forest reserves. The first 135 reserves were installed in 1978 [41] and up to 2012, the number grew to 160 with a total area of 7066 ha. Before management ended, they were all more or less intensively harvested forests. The major parts of the reserves are covered with native tree species in accordance with the site condition. With the designation of a reserve, any intervention is forbidden except safeguard obligation and protection against bark beetle and pests [42]. Permanent representative plots of about one hectare were installed in most of the reserves and DBH over 7 cm of all trees; a sample of tree heights and deadwood are repeatedly measured at most plots. Based on DBH and height, growing stocks (m³ ha−1) were calculated and transformed into Mg C ha−1 by expansion factors as described in section 2.2.
Besides age-dependent development of carbon storage in unmanaged forests, questions arise concerning a potential maximum stock of living biomass and deadwood in natural, unmanaged forests within the existing growing conditions in Bavaria. Due to natural mortality, tree-specific age restriction, and competition for light, nutrients and available space, forests are generally restricted in biomass accumulation, and a carbon stock limit is reached within a specific period of time. In order to get an impression of possible maximum carbon stocks, comparable data from studies in temperate, mid-European old-growth forests without age specification were added to the comparison (see references of Figure 9). In the present study, beech is being discussed due to its special importance for Bavarian forests.

3. Results

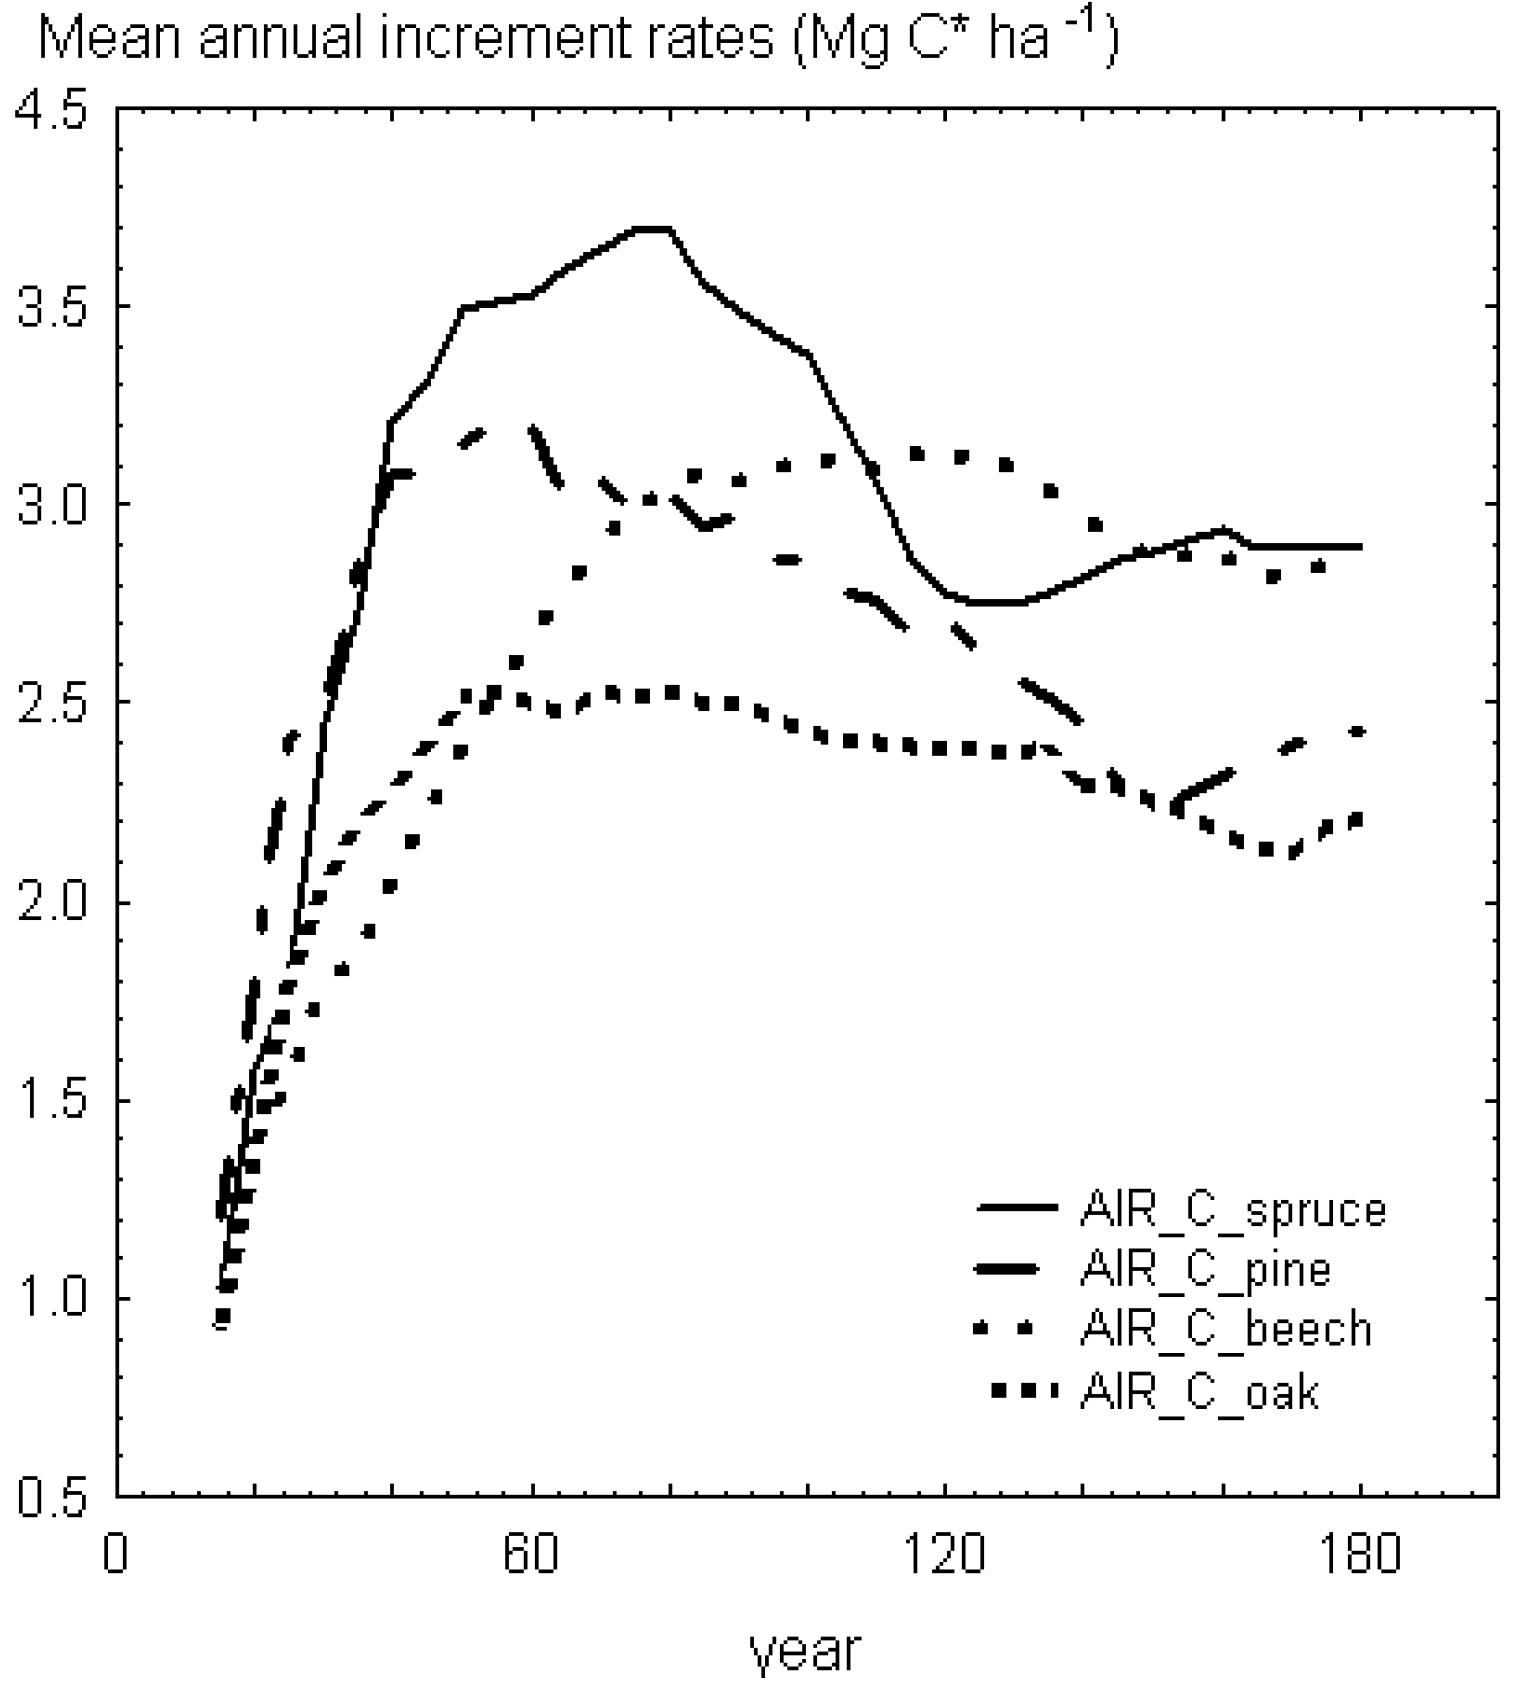
3.1. Carbon Storage in Forest Biomass and Timber Volume in the Managed Stands

In the managed stands, the carbon stock in forest biomass (living biomass and dead wood) vary a great deal between tree species and the moment of simulation (Figure 5).
Figure 5. All climate change mitigation effects (Mg Cha−1) in the managed stand for spruce, pine, beech and oak, with carbon in living biomass and deadwood; m_sub is the substitution effect via material use of wood, e_sub is the substitution effect of fuel wood and E_sub after use is the use for fuel wood after material use.
Forests 04 00043 g005
For spruce, highest carbon storage in forest biomass is 181.2 Mg C ha−1 after 80 years, for pine 163.4 Mg C ha−1 after 120 years, for beech 202.0 Mg C ha−1 after 125 years and oak 176.1 Mg C ha−1 after 135 years. Due to the higher growth potential of spruce in comparison with the other tree species, its highest carbon storage is reached considerably earlier, although it must be noted that highest maximum carbon stock is achieved in beech stand, caused by a longer rotation and the ability to sustain high increment rates of the single tree in older growth stages.
The deadwood fraction is generally low in all managed stands compared to the living biomass with the highest amounts of deadwood for spruce after 115 years (7.4 Mg C ha−1), for pine after 160 years (8.4 Mg C ha−1), for beech after 155 years (9.0 Mg C ha−1) and for oak after 170 years (5.4 Mg C ha−1). The mean ratio of deadwood stock to the total forest biomass over the simulation period of 180 years is about 3.7% (3.8 Mg C ha−1) for spruce, 4.2% for pine (4.6 Mg C ha−1), 3.0% for beech (2.9 Mg C ha−1) and 2.3% for oak (2.1 Mg C ha−1). The main reason for the lower deadwood fraction of beech and oak is the faster decay rate of hardwood. The general low deadwood amounts in all stands are explained by a low amount of remaining wood after harvesting. Nevertheless, these deadwood amounts are within the range, for example, for managed beech stands reported by [23] and somewhat higher than the mean carbon stock of deadwood in Bavaria (2 Mg C ha−1), calculated on the basis of the national forest inventory in 2002 [43].
To compare carbon sequestration potential, mean annual total increment rates (AIR) can also be regarded, comprising living biomass, deadwood and timber volume. The AIR of beech is clearly lower than spruce after 80 years, but after 180 years on the same level due to higher wood density and a good increment in higher age classes (Figure 6). Thus, it can be assumed that within the whole simulation period of 180 years and under the given silvicultural treatments and same site characteristics, the carbon sequestration potential in beech stands is on the same level as in spruce stands.
Figure 6. Mean annual increment rates (AIR) (Mg Cha−1) for spruce, pine, beech and oak in the managed stands.
Forests 04 00043 g006

3.2. Carbon Storage in HWP and Substitution Effects in the Managed Stands

Highest carbon storage in HWP varies between 113.5 Mg C ha−1 for spruce after 115 years and 54.6 Mg C ha−1 for oak after 170 years (Figure 5). In general, HWP stock increases after planting and decreases at the end of the first rotation when lesser amounts of timber volume enter the HWP-pools. After the simulation period of 180 years, HWP storage varies between 72.8 Mg C ha−1 (spruce) and 52.7 Mg C ha−1 (oak). Substitution effects steadily increase with time and reach the highest values at the end of the simulation period with 467.4 Mg C ha−1 for spruce, 339.6 Mg C ha−1 for pine, 344.0 Mg C ha−1 for beech, and 251.0 Mg C ha−1 for oak.

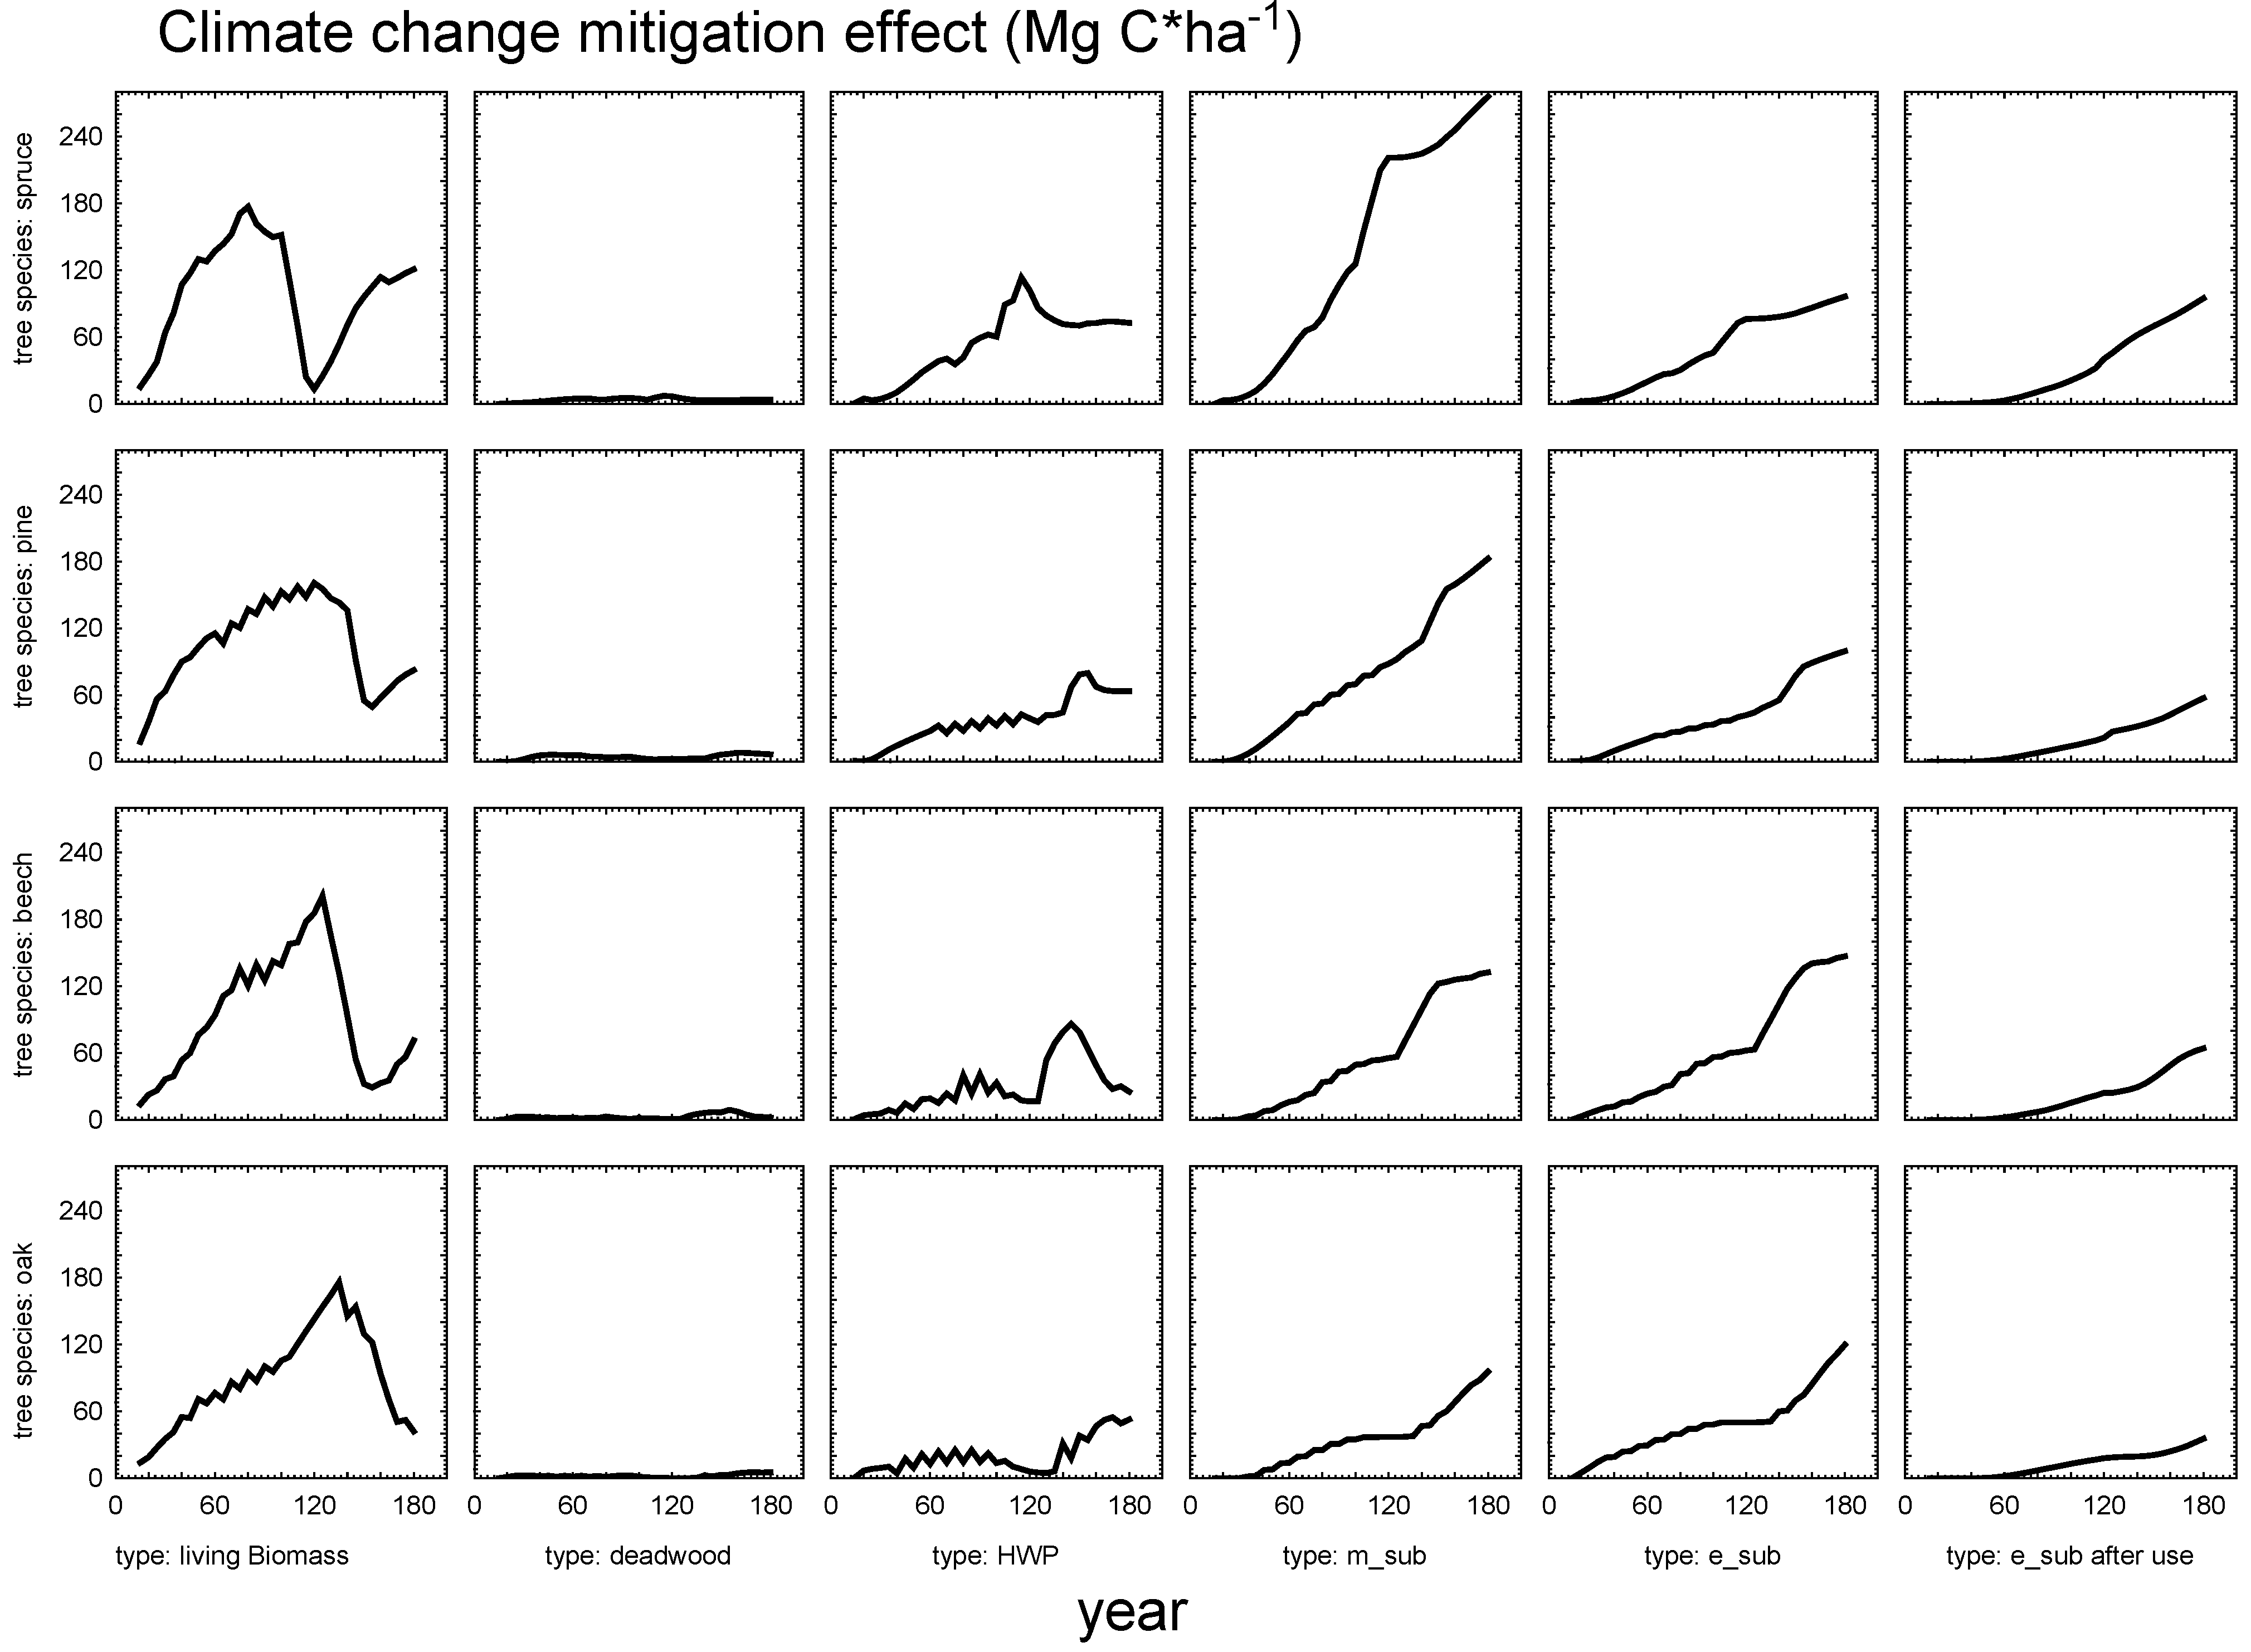
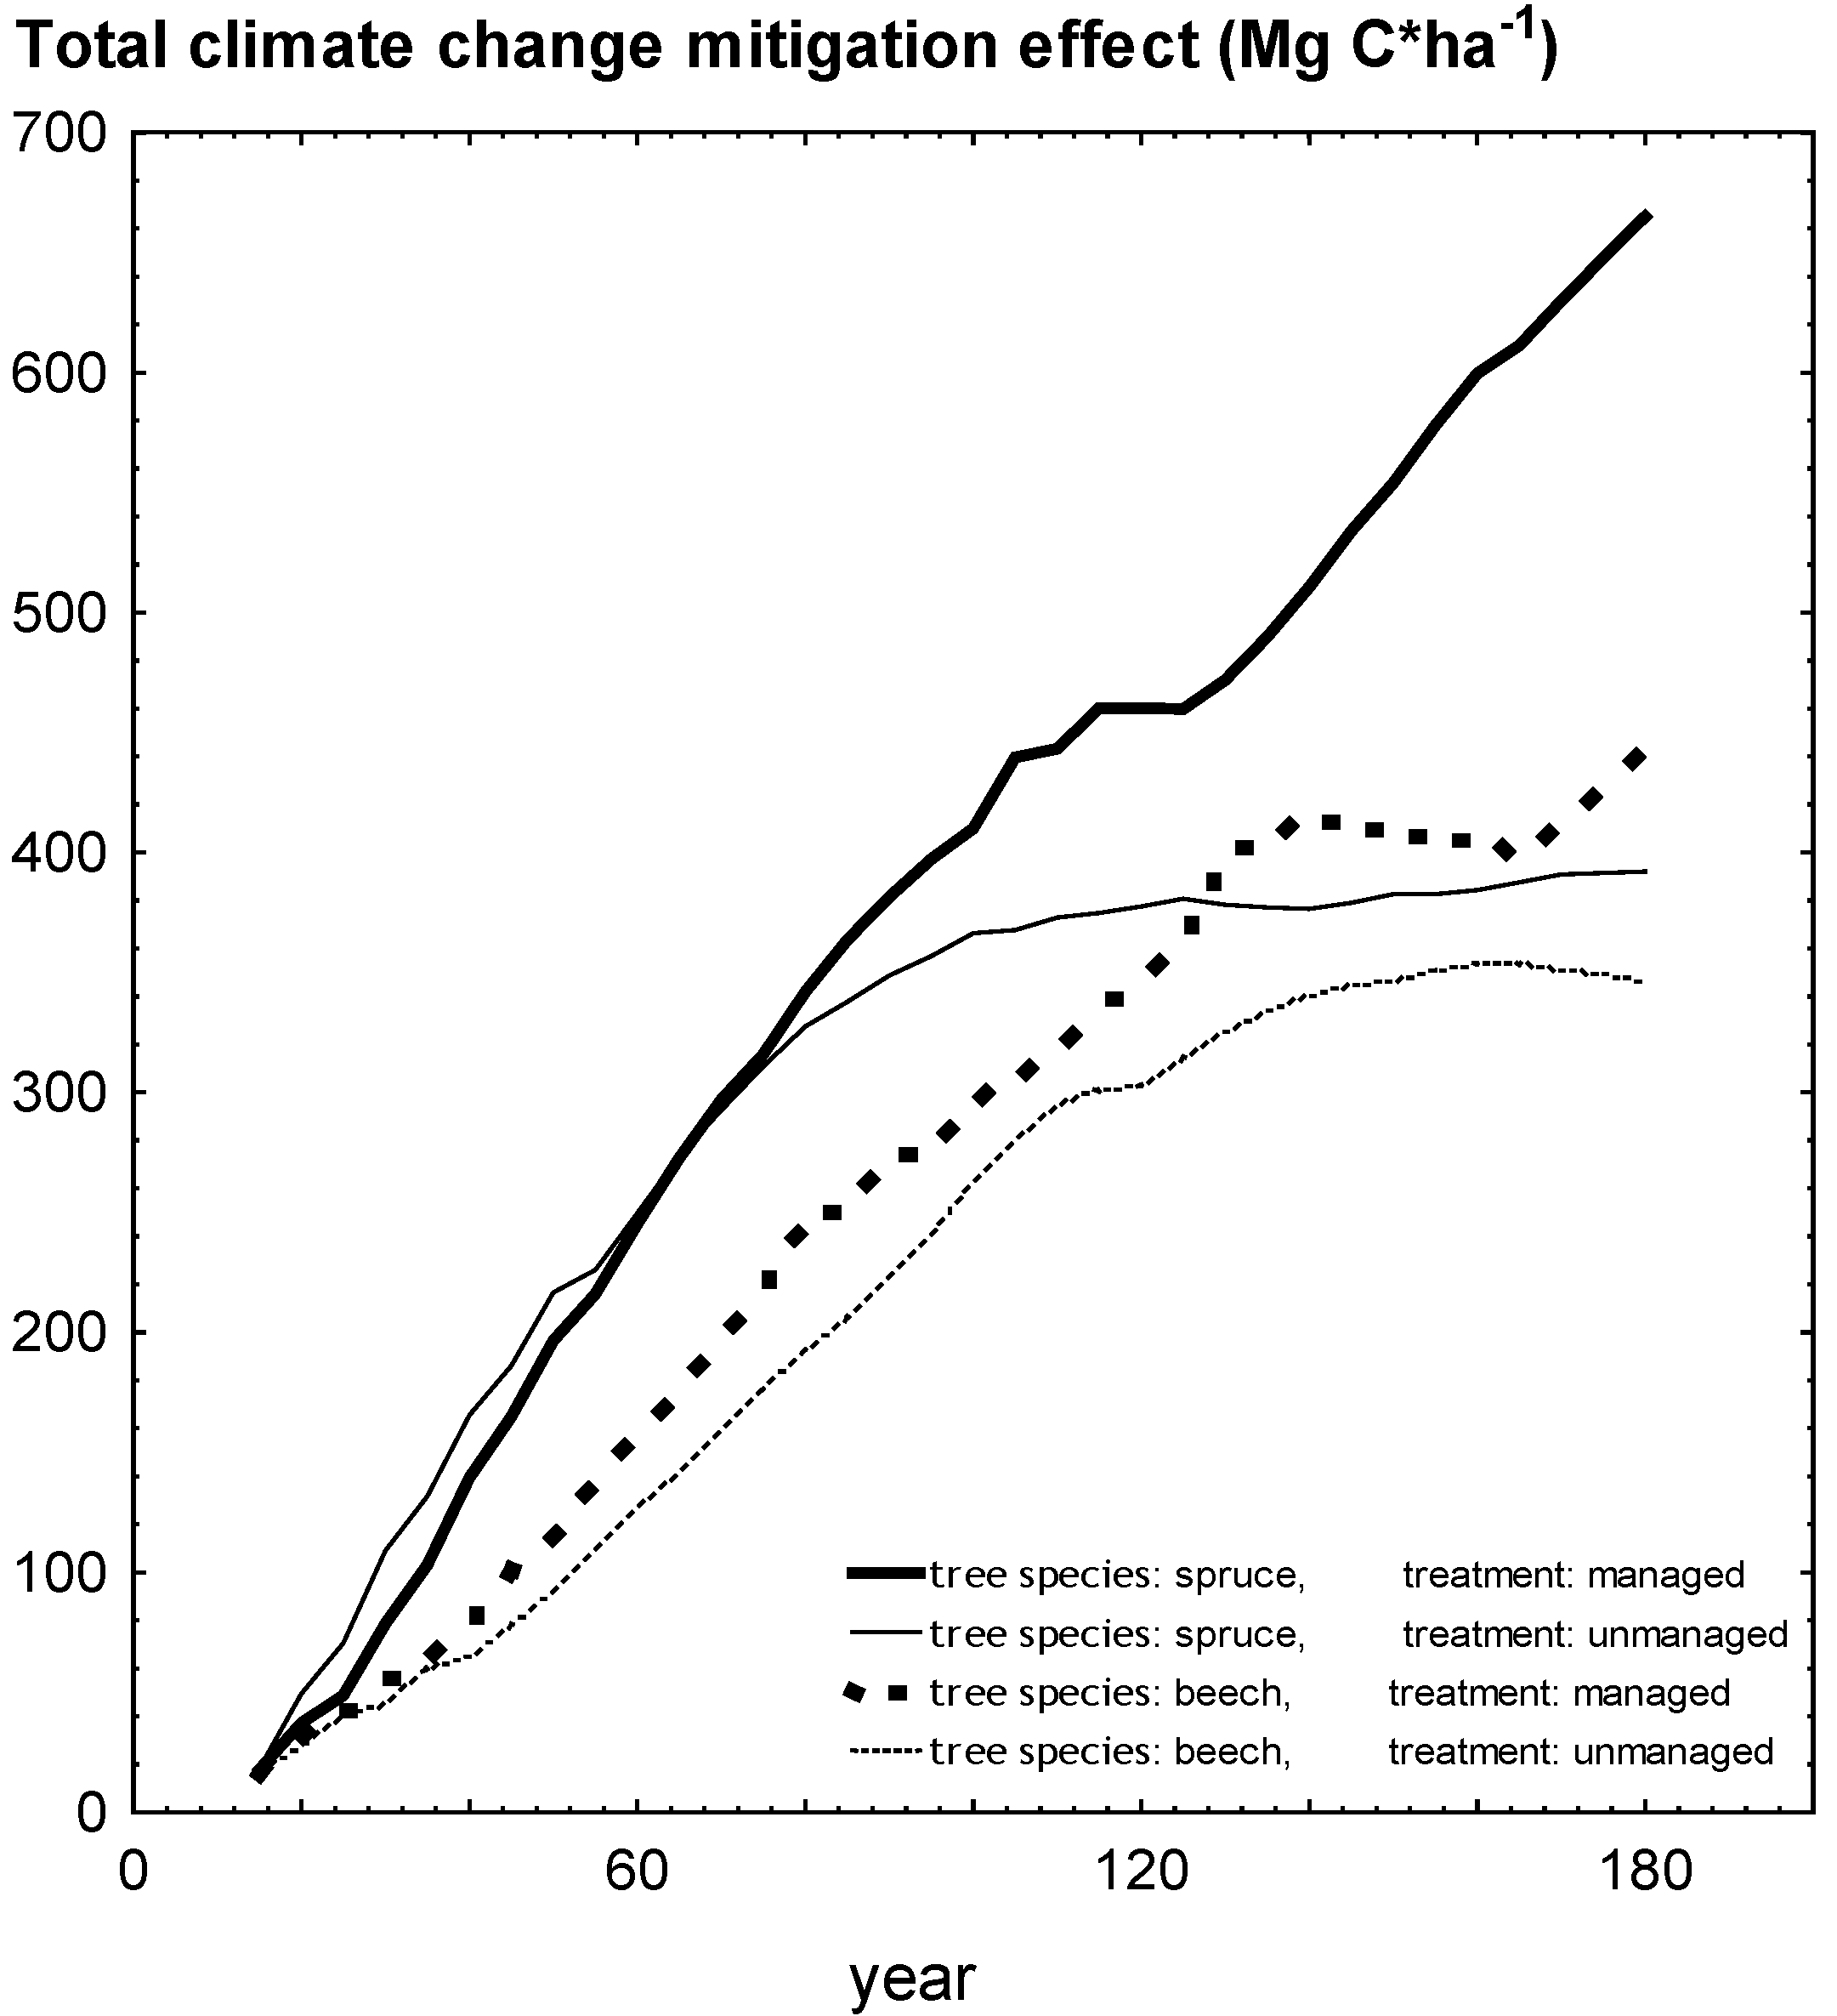
3.3. Total Climate Change Mitigation Effects in the Managed Stands

After 180 years, the model simulation resulted in a total climate change mitigation benefit between 351.2 Mg C ha−1 and 665.0 Mg C ha−1, where spruce had highest and oak lowest total effects. Mean total annual mitigation rates after 180 years, including all single mitigation factors, are highest in spruce with 3.69 Mg C ha−1 year−1, and lowest in oak with 1.95 Mg C ha−1 year−1. This total annual rate consists of the compensation of emissions via sequestration in living biomass, deadwood and HWP on the one hand, where the sequestration rates vary between 1.09 Mg C ha−1 year−1 for spruce, and 0.55 Mg C ha−1 year−1 for oak. On the other hand, the avoidance of emissions via wood use contributes with rates between 2.60 Mg C ha−1 year−1 for spruce and 1.40 Mg C ha−1 year−1 for oak (Table 4). The results show that over the long term, substitution effects are more important than the emission compensation via carbon sequestration. The ratio between compensation and avoidance (via substitution effects) after 180 years lies between 0.29 for beech and 0.45 for pine. Expressed in CO2-units, it can be stated that one hectare of reforestation leads to a climate change mitigation benefit between 7.2 (oak) and 13.5 Mg CO2 ha−1 year−1 (spruce).
Table 4. Mean annual sequestration and substitution rates and mean annual total mitigation effects (TME) after 180 years, where biomass is living biomass and deadwood, m_sub is the substitution effect via material use of wood, e_sub is the substitution effect of fuel wood and E_sub after use is the use for fuel wood after material use; all values are in Mg ha−1 year−1; TME in the unmanaged stands consists of carbon in living biomass and deadwood.
managedunmanaged
sprucepinebeechoaksprucebeech
biomass0.690.500.410.262.181.92
HWP0.400.350.140.29--
compensation1.090.850.550.552.181.92
m_sub1.531.020.740.53--
e_sub0.540.550.820.67--
e_sub after use0.530.320.360.20--
avoidance2.601.891.921.40--
TME3.692.742.471.952.181.92

3.4. Climate Change Mitigation Effects in the Unmanaged Stands

Contrary to managed forests, unmanaged forests generate climate change mitigation effects only by emission compensation with carbon sequestered in living biomass and dead wood. Under the assumption of absent disturbances, carbon storage in total forest biomass is remarkably higher than in managed forests. At the end of the simulation period of 180 years, the carbon storage is 392.0 Mg C ha−1 in the spruce stand and 345.7 Mg C ha−1 in the beech stand (Figure 7). Due to a better growth potential of spruce in the first decades, beech has only 71% of the mitigation effect of spruce after 100 years. After 180 years, the difference decreases and beech has 88% of the mitigation effect of spruce.
Figure 7. Climate change mitigation effects (Mg C ha−1) for spruce and beech in the unmanaged stands.
Forests 04 00043 g007
Unlike in the managed forests, deadwood fraction in the unmanaged forests contributes much more to the whole carbon sequestration in forest biomass. In spruce, 10.3% and in beech, 11.5% of the total carbon stock is stored in deadwood at the end of the simulation period of 180 years (Figure 7). This means that the contribution of deadwood to the total biomass pool is about four times higher than in the managed stands. The differences between managed and unmanaged stands in reference to deadwood is clearer when comparing the total amounts, where after 180 years, carbon storage is 40.4 Mg C ha−1 in spruce stand and 39.7 Mg C ha−1 in beech. Total mean annual mitigation rates vary between 1.95 Mg C ha−1 year−1 for beech and 2.19 Mg C ha−1 year−1 for spruce (Table 4).
In the first 60 years, total biomass increment in the unmanaged spruce stand exceeds climate change mitigation effects by wood use and substitution effects in the managed stands (Figure 8). From the year 80 onwards, the biomass sequestration rate in the unmanaged stand falls below the storage in long-lived HWP and its accompanying substitution effects in the managed stand. In the long term, higher average total climate change mitigation rates can be recognized (3.69 Mg C ha−1 year−1, 2.19 Mg, respectively).
Figure 8. Total climate change mitigation effects (Mg C ha−1) for spruce and beech in the managed und unmanaged stands.
Forests 04 00043 g008
For beech, results are similar after 180 years, although the managed stand has slightly higher benefits from the first year of simulation (Figure 8). In contrast to spruce, the differences between the two strategies are minor in the long term due to a less effective wood use of beech where more wood immediately enters the energy sector.
The validation of the living biomass development in the model for the beech stand, where the model results were compared with real measured data from Bavarian strict forest reserves and data from literature for unmanaged stands with age specification (total n = 47) shows that, over the whole 180 years, the modeled carbon stock development is in most cases slightly higher than the measured data (Figure 9), indicating that the model does at least not underestimate the carbon stock development. Figure 9 starts in the late pioneer stage with an age of 60 years because younger unmanaged stands are not available. In the first 100 years, the modeled living biomass (red line in Figure 9) is in between the scatter of the data from the forest reserves and from other literature. However, with increasing age, the model generates more biomass than most of the measured stands. In general, the carbon stock of the model is rather high due to good growing conditions regarding site quality, and a stock of 300 Mg C ha−1 is reached within the first 140 years of development. After about 140 years, the living biomass stock seems to reach a maximum where biomass increase and decrease changes with time on a high carbon stock level.
Figure 9. Carbon stock in living biomass (Mg C ha−1) in the unmanaged stand for beech; the red line indicates the Silva model result, the dots the forest reserves of Bavaria where black lines show the development of a single stand, the crosses are other carbon stocks from literature [44,45,46,47,48,49] and the box-plot indicate the mean carbon stock in living biomass of old-growth forests without any age specification with standard deviation (box) and minimum and maximum (whiskers) from the literature [49,50,51,52,53,54].
Forests 04 00043 g009
The literature study regarding old-growth beech forests without any age specification shows a mean carbon stock of 251 Mg C ha−1 (SE = 8.2; SD = 69.8; n = 72) with the highest stocks of 471 Mg C ha−1 (a small area maximum in the optimum phase of Slovakian beech stands according to [53] and a minimum of 125 Mg C ha−1 (Slovakian beech stands according to [52]) (Figure 9).

4. Discussion

4.1. The Model Assumptions

The assumptions in the model are associated with some uncertainties. There is still a lack of knowledge, especially regarding the substitution of energy-intensive materials with wood products and therefore reliable substitution factors. For construction wood, substitution factors from the literature for material purposes vary widely between 0.7 t CO2 m−3 [22] and more than 1.0 t CO2 m−3 [40]. Sometimes even higher factors are reported, for example in [37], which confirms the existing uncertainties in this issue. However, if substitution effects are not considered in the calculations, climate change mitigation benefits would be strongly underestimated for managed forests. Substitution mainly depends on the comparison between different products within a certain product type. By using life-cycle assessments for products, energy input or GHG emissions can be detected over the whole life span of a single (wood) product [55,56]. However, further studies should diminish uncertainties regarding substitution effects of wood use with e.g., Carbon Footprint techniques. In addition, consumer behavior and new technologies can change the use of wood in the future. Therefore, wood material flow could be different from period to period, which would lead to different climate change mitigation effects.
Disturbances which are not included in the simulations can strongly influence the results. Possible effects of disturbances are discussed in section 4.5.
Another important simplification is that possible changes in growth rates due to climate change are not considered in the model. In Bavaria, spruce especially will be affected in the future due to a high sensitivity to changes in temperature [57]. However, climate change impacts are still not well known, and some sites could even be more appropriate in the future than today, e.g., in higher elevated sites of the Bavarian Alps. Thus, climate change will not lead automatically to worse growing conditions in all parts of Bavaria. Although there are still regions with or without small to medium risks, spruce will widely be endangered [58] and future spruce forests are likely to be reduced to much smaller areas. Our results assuming best climate change mitigation effects of spruce compared to the other main species in Bavaria is only valuable for sites which are still suitable for spruce and without limitations in temperature and precipitation in the future.

4.2. Climate Change Mitigation Effects in the Managed Stands

Forest management has several effects on carbon mitigation: early thinnings with the focus on the upper canopy increase single trees as well as stand stability [59], and decrease the risk of carbon losses due to natural hazards, especially wind throw [60]. Thinnings from above remove higher stem volumes and allow wood products with longer mean resistance times (MRT) [19]. Tree dimension and MRT of wood products also increase with the length of rotation. Simultaneously, however, high trees and large growing stocks raise the risk of mortality and wind throw, especially for spruce [61,62]. In contrast, shorter rotations for biomass production and direct energy use lead to minor mitigation effects [63]. Long-term regeneration by shelterwood systems avoid erosion and soil carbon losses and enable the establishment of uneven-aged stands with the highest stability [64,65,66]. Finally, forest management enables early selection of tree species adapted to climate change, thereby increasing tree resistance against climate extremes [67].
Our model simulations of managed stands followed best silvicultural practice rules for Bavarian state forests, aiming at stable and productive stands. Differences in the tree species’ specific risks were not considered. Especially the single-tree survival probability of spruce decreases markedly after 100 years [61,62]. To maximize climate change mitigation effects, silvicultural strategies with optimized tree species composition, rotation length and harvesting intervals have to be developed.

4.3. Climate Change Mitigation Effects in the Unmanaged Stands

Following old-growth phases defined by [17], our 180-year simulation ends just before the early old-growth stage starts. It is not clear whether the relation between living biomass increment and mortality lead to further increase or decrease, especially when the stand enters the late old-growth stadium after about 400 years. Although Silva parameter values are derived from a large dataset with good biological plausibility regarding the model assumptions [26], unmanaged stands older than 180 years are rare and not involved in the model calibration and, therefore, the accuracy for unmanaged stands older than 180 years is surely lower than in younger stands.
The comparison of the model carbon stock in living biomass with carbon stocks from old-growth forests shows that a maximum could be reached after 150 years in the model regarding the high stock of about 300 Mg C ha−1. At this time, annual mortality is merely compensated by annual increment rates. The mean of the old-growth living carbon stocks considered in this study is 251 Mg C ha−1, which could perhaps be seen as an overall maximum mean carbon stock for larger beech-dominated forest areas. There is no doubt that forest stands are able to hold much higher carbon stocks on a small scale, as the analyzed literature shows, but to derive possible maximum carbon stocks for larger areas, carbon stocks for different site qualities and, in particular, for different development stages need to be included. The highest old-growth carbon stocks were found in a magnitude of 470 Mg C ha−1 which means a growing stock of about 1300 m3 ha−1. These stocks could be seen as very high and possible upper limit for beech stands [54].
Mund and Schulze [23] conducted a similar study (in parts with the same literature sources) where carbon stocks between 75 Mg C ha−1 (stands with less favorable site conditions) and more than 300 Mg C ha−1 (favorable site conditions) were shown for beech-dominated unmanaged stands and primary forests. Their findings are consistent with our findings regarding biomass stocks in unmanaged beech stands (see Figure 9), and an overall maximum mean carbon stock in living biomass of about 250 to 300 Mg C ha−1 for middle-European beech-dominated forests for larger areas could be estimated, especially for site conditions in Bavaria (which are predominantly favorable regarding soil quality or climatic characteristics).
Modeled deadwood carbon stocks for beech are higher than most results from the literature. The reasons for this might be that the decay rates applied in this study are too low, or that the definition of deadwood differs in the studies from literature. All deadwood >7 cm DBH is considered in the model, whereas often only >20 cm DBH is measured as, for example, in the national German forest inventory from 2002 [68]. Furthermore, the modeled deadwood stocks contain all dead wood biomass, including amounts with advanced decay which usually cannot be measured directly in the forest. A literature review from [23] gives deadwood stocks in unmanaged German beech forests between 1.4 and 30.8 Mg C ha−1 and, in non-European forests, such as South American Nothofagus stands, up to 149 Mg C ha−1, although the latter ones are not comparable with Bavarian site conditions. Wirth and Lichtstein [17] show deadwood stocks in temperate broadleaved (among others Nothofagus and Fagus) which range between 10 and 90 Mg C ha−1 at the age of 200 years. Christensen et al. [69] describe deadwood stocks for beech stands in central and eastern Europe between 9 and 552 m³ ha−1 (130 m³ ha−1 on average), where the estimated carbon stock is between 1.4 and 82.8 Mg C ha−1 (19.5 Mg C ha−1 on average, assuming an average wood density of 0.3 Mg m−3). Hence, deadwood data from literature vary significantly, depending on site characteristics, time without harvesting, or the life stage of the single stand. However, compared with measured dead wood stocks for European beech forests, the model results seem to be high, but still within the range of various studies.

4.4. Comparison between Managed and Unmanaged Stands

As a result of our study, and as described in other studies (e.g., [70]), carbon sequestration in biomass and HWP in managed stands does not reach the biomass sequestration of unmanaged stands, mainly due to wood-use regimes where especially hardwood is often used for energy purposes or for wood products with a short life span. Nevertheless, in the long term, managed beech and spruce forests have higher total climate change mitigation benefits, which are basically caused by their substitution effects, and less by the in situ carbon storage in forest and wood products. However, facing climate change, wood use can especially contribute to the reduction of fossil raw material.
To our knowledge, other studies comparing managed and unmanaged strategies on a stand level, including all possible effects, are rare. Köhl et al. [4] conclude that unmanaged stands have minor total climate change mitigation effects than managed stands, which is in accordance with our findings. In addition, Hennigar et al. [9] confirm the importance of including wood products into the carbon calculations for forests, where maximizing wood products and substitution results in higher total carbon effects than maximizing forest carbon. There exist some studies on a regional and national level with modeled mitigation effects ongoing from an actual state of the forests, including forest biomass and HWP as shown in e.g., [71] for Thuringia or [12] for Switzerland. Both studies show that a sustainable management with efficient wood use should be favored regarding total climate change mitigation benefits in comparison with a low-intensity management or without management. However, all forest carbon pools as well as every HWP pool depends on the relation between input and output. With increasing size, each pool tends to reach a maximum storage with no further climate change mitigation effects at a certain moment. Even substitution effects end if fossil fuels are completely replaced by renewable energies without GHG emissions. Generally, the source of energy has to be considered if climate change mitigation effects, especially substitution effects, of forests for entire regions are calculated and the actual energy mix of the respective region has to be taken into account.

4.5. Possible Effects of Disturbances on the Results

Disturbances like wind throw, snow breakage and insects can influence the comparison between tree species and between managed and unmanaged stands. Especially pure spruce stands are very vulnerable to natural hazards. It is not very likely that unmanaged spruce stands reach the age of 180 years without any damage. Höllerl and Bork [60] calculated the influence of calamities on the mitigation effects of 120-year-old pure spruce stands. They found that, depending on the hazard risk and the intensity of salvage logging, disturbances reduce climate change mitigation effects of managed stands by 2.5% to 13%. In the worst case, the reduction can be 5% to 26%. In unmanaged stands, the negative effect of disturbances can even be higher. The reduction varies between 2.7% and 20.8% on average, in the worst-case scenario between 5.5% and 41.5%. Transferred to the results showed in Figure 8, disturbances would increase the difference between managed and unmanaged spruce stands. Assuming the worst-case scenarios of Höllerl and Bork [60], and assuming that beech is not affected by hazards, disturbances could even change the comparison results of spruce and beech. In this case, the mitigation effects of a spruce stand could be lower as the mitigation effects of a beech stand.

4.6. Soil Carbon Sequestration

Soil organic carbon was not considered in our model. We assume a reforestation on former forest land with constant soil carbon storage or afforestation with the same initial carbon losses after land-use change [72,73] for the different tree species. In the modeled period of 180 years, climate and general soil properties remain the same, but tree species and management could influence litterfall, rhizodeposition and wood residues related to thinning or mortality on the input side and the biotic and abiotic factors for decomposition of soil organic matter on the output side. Hence, differences in soil carbon accumulation are expectable, even if the direction of changes caused by tree species and management are discussed controversially [74]. Spruce tend to accumulate more carbon in the forest floor than beech [75], thereby likely increasing their climate change mitigation effect. Soil carbon decrease generated by forest harvesting mostly appears within the first years after intervention, but long term negative effects in sustainable forest regimes are rarely detected (e.g., [76,77,78]), especially mineral soil layers are significantly not negatively affected [79].
Our own analysis based on a soil inventory (second German Soil Condition Survey) with 372 systematically distributed samples in Bavaria did not reveal any significant relations between stand age, growing stock, and carbon stocks in forest soils, which also confirms the assumption of constant carbon stocks in sustainable managed forests. Significant differences were only detected between tree species (hardwood vs. softwood) in the forest floor, but down to a depth of 100 cm, these total soil carbon stock differences are less than 10%. Moreover, in our model, intensive harvesting periods with high timber volume followed by changes in light availability or other microclimatic changes which could lead to an enhanced microbiological decomposition and a subsequent long-term carbon release were not conducted.
Various carbon models show nearly constant soil carbon stocks, as for example in Hennigar et al. [9], where modeling over a period of 200 years results in a constant soil carbon stock of about 150 Mg ha−1 in different management regimes. Results from another carbon stock model as described in [63] also indicate a nearly constant soil carbon stock in managed beech and spruce stands over 300 years. Therefore, under a sustainable forest management, the assumption of negligible changes in soil carbon stock over the whole model period seems to be justifiable, especially compared to the dimension of climate change mitigation benefits of biomass increment, wood use and substitution of fossil fuels.
For unmanaged forest soils, some studies report generally higher carbon stocks than in managed forests (e.g., [80]). Others show the potential to sequester carbon even in older life stages [81] although the results differ from carbon sink to carbon source between the single study sites and a clear trend is not shown. Luyssaert et al. [25] report a mean annual old-growth sequestration rate of 1.3 ± 0.8 Mg C ha−1 year−1 in roots and soil organic matter. In contrast, Schlesinger [82] report a long-term average organic carbon accumulation in forest soils of only 0.007 to 0.12 Mg C ha−1 year−1 derived from carbon stocks developed in several thousand years on new land surfaces with little or no organic matter after glacier retreat or volcanic eruption. However, it is still intensively in discussion, if there will be a theoretic steady state of soil carbon storage [83]. Due to our model simulation time period of 180 years, old-growth stadium is still not reached, and negligible soil carbon stock changes seems to be tolerable.

5. Conclusions

Analyzing the annual climate change mitigation benefits of the different tree species in the managed stands over an simulation period of 180 years, it can be stated that, depending on the tree species, one hectare forest on a site with good growing conditions compensates the annual emissions of about 1–2 persons, referring to the actual (2009) energy-related average GHG-emission rate for Bavaria of about 6.5 Mg CO2 year−1 per person [84]. Excluding excessive disturbances, mitigation effects rank with spruce > beech > pine > oak. However, these results assume current growing conditions. Considering climate change and natural calamities, it is very likely that spruce will not be suitable in several regions of Bavaria in the future. Furthermore, excessive disturbances could affect spruce harder than the other tree species. In that case, the order could change and beech could exceed spruce. So the results cannot be seen as general recommendation to establish spruce stands in order to achieve optimal climate change mitigation benefits. Effective wood use in products with long life spans and their simultaneous substitution effects are crucial for high climate change mitigation effects. Especially for hardwood, a high part of timber volume enters immediately the energy sector in Bavaria and wood use should be optimized. Regarding climate change mitigation aspects, wood use in cascades with long-term carbon storage in products and simultaneous material substitution effects, and a subsequent final energy use with energy substitution effects, should be favored. The use of wood in cascades enables the joining of all possible climate change mitigation effects. In contrast, wood use only for energy leads to an insufficient utilization of wood, especially if wood assortments are adequate for other material purposes. Therefore, new wood product technology, as described for example in [85], should be applied to improve wood use and enhance total climate change mitigation effects. The importance of substitution effects increases with time. In the long term, the avoidance of emissions via wood use becomes the most important climate change mitigation factor. The reason is that forest biomass, as well as harvested wood products (HWP), have upper storage limits which depend on individual treatment regimes and HPW-input and -output rates. In contrast, when a substitution effect appears, this effect cannot be lost over time as long as a significant amount of fossil fuel and raw materials are used. However, substitution effects can only be accounted for if leakage effects do not appear and the saved energy is not used elsewhere, e.g., in less efficient process technologies.
Unmanaged forests also contribute to climate change mitigation and the differences compared to the managed stands are not significant in the first decades. In the long term, unmanaged forests have smaller climate change mitigation effects than managed forests, if (I) a sustainable management is assumed, and (II) the forested area remains forest in the long term without any long-lasting carbon losses in soil carbon, and (III) the harvested wood is used efficiently. Hence, the decision if a forest area should be converted into a forest reserve does not depend mainly on climate change mitigation aspects. Other factors, including biodiversity, the demand for wood or further ecosystem services, should be taken into account. However, due to the long European settlement and land-use history, stands in a late old-growth stadium are rare, the database regarding unmanaged forests in central Europe is still poor, and long simulation periods are needed to understand carbon dynamics in living biomass and deadwood over the long term. Moreover, the behavior of soil carbon in unmanaged forests is still not clear. Although slight trends towards carbon sequestration with increasing stand age are shown in various studies, a general trend is not manifested.
Our results show that climate change mitigation effects of single stands vary over the years. Hence, climate change mitigation rates of every tree species are dynamic and change with the length of the simulation period and the specific point of time when the climate change mitigation effects are estimated. Also, different harvesting schedules or silvicultural treatments could change the comparison results for the different tree species. The importance of substitution effects increase with time due to irreversible benefits while carbon sequestration in biomass and wood products denote only temporal climate change mitigation effects.

Acknowledgments

Many thanks to Anne Holstein in helping us with the literature study. This work is part of the project “Die Kohlenstoffbilanz der Bayerischen Forst- und Holzwirtschaft” (KLIP 22) and financed by the Bavarian State Ministry of Food, Agriculture and Forestry.

Conflict of Interest

The authors declare no conflict of interest.

References

  1. Houghton, R.A.; Hackler, J.L.; Lawrence, K.T. The U.S. carbon budget: Contributions from land-use change. Science 1999, 285, 574–578. [Google Scholar] [CrossRef]
  2. Nabuurs, G.J.; Thürig, E.; Heidema, N.; Armolaitis, K.; Biber, P.; Cienciala, E.; Kaufmann, E.; Mäkipää, R.; Nilsen, P.; Petritsch, R.; et al. Hotspots of the European forests carbon cycle. For. Ecol. Manag. 2008, 256, 194–200. [Google Scholar] [CrossRef]
  3. Schöne, D.; Schulte, A. Forstwirtschaft nach Kyoto: Ansätze zur Quantifizierung und betrieblichen Nutzung von Kohlenstoffsenken. Forstarchiv 1999, 70, 167–176. [Google Scholar]
  4. Köhl, M.; Frühwald, A.; Kenter, B.; Olschofsky, K.; Köhler, R.; Köthke, M.; Rüter, S.; Pretzsch, H.; Rötzer, T.; Makeschin, F.; et al. Potential und Dynamik der Kohlenstoffspeicherung in Wald und Holz: Beitrag des deutschen Forst- und Holzsektors zum Klimaschutz. vTI Agric. For. Res. Sonderheft 2009, 327, 103–109. [Google Scholar]
  5. Ellison, D.; Lundblad, M.; Petersson, H. Carbon accounting and the climate politics of forestry. Environ. Sci. Policy 2011, 14, 1062–1078. [Google Scholar] [CrossRef]
  6. Wold, C. The durban package and the goals of pacific small island developing states. American society of international law. Insights 2012, 16, 6. [Google Scholar]
  7. Oehmichen, K.; Demant, B.; Dunger, K.; Grüneberg, E.; Hennig, P.; Kroiher, F.; Neubauer, M.; Polley, H.; Riedel, T.; Rock, J.; et al. Inventurstudie 2008 und Treibhausgasinventar Wald; Sonderheft; Johann-Heinrich von Thünen-Institut: Hamburg, Germany, 2010; p. 343. [Google Scholar]
  8. Woodbury, P.B.; Smith, J.E.; Heath, L.S. Carbon sequestration in the U.S. forest sector from 1990 to 2010. For. Ecol. Manag. 2007, 241, 14–27. [Google Scholar] [CrossRef]
  9. Hennigar, C.R.; MacLean, D.A.; Amos-Binks, L.J. A novel approach to optimize management strategies for carbon stored in both forests and wood products. For. Ecol. Manag. 2008, 256, 786–797. [Google Scholar] [CrossRef]
  10. Dias, A.C.; Louro, M.; Arroja, L.; Capela, I. Comparison of methods for estimating carbon in harvested wood products. Biomass Bioenergy 2009, 33, 213–222. [Google Scholar] [CrossRef]
  11. Werner, F.; Taverna, R.; Hofer, P.; Richter, K. Greenhouse gas dynamics of an increased use of wood in buildings in Switzerland. Clim. Change 2006, 71, 319–347. [Google Scholar]
  12. Hofer, P.; Taverna, R.; Werner, F. Nutzung des geernteten Holzes—Substitution und Senkenwirkung. Schweiz. Z. Forstwes. 2008, 159, 288–295. [Google Scholar] [CrossRef]
  13. Pan, Y.; Birdsey, R.A.; Fang, J.; Houghton, R.; Kauppi, P.E.; Kurz, W.A.; Phillips, O.L.; Shvidenko, A.; Lewis, S.L.; Canadell, J.G.; et al. A large and Persistent carbon Sink in the world’s forests. Science 2011, 333, 988–993. [Google Scholar] [CrossRef]
  14. Luyssaert, S.; Ciais, S.L.; Piao, S.; Schulze, E.D.; Jung, M.; Zaehle, S.; Schelhass, M.J.; Reichstein, M.; Churkina, G.; Papale, D.; et al. The European carbon balance. Part 3: Forests. Glob. Change Biol. 2010, 16, 1429–1450. [Google Scholar] [CrossRef]
  15. Fürstenau, C.; Badeck, F.; Lasch, P.; Lexer, M.; Lindner, M.; Mohr, P.; Suckow, F. Multiple-use forest management in consideration of climate change and the interests of stakeholder groups. Eur. J. For. Res. 2007, 126, 225–239. [Google Scholar] [CrossRef]
  16. Krug, J.; Köhl, M. Bedeutung der Deutschen Forstwirtschaft in der Klimapolitik. AFZ/Der Wald 2010, 17, 30–33. [Google Scholar]
  17. Wirth, C.; Lichtstein, W. The Imprint of Species Turnover on Old-Growth Forests Carbon Balances- Insights From a Trait-Based Model of Forest Dynamics. In Old-Growth Forests. Function, Fate and Value; Wirth, C., Gleixner, G., Heimann, M., Eds.; Ecological Studies 207. M; Springer Verlag: Berlin Heidelberg, Germany, 2009; pp. 81–110. [Google Scholar]
  18. Pistorius, T.; Zell, J. Die Dynamik der Kohlenstoffvorräte in Baden-Württemberg zwischen 1987 und 2002. Veränderungen in der Waldbiomasse und Modellierung der Holzproduktspeicher. AFJZ 2005, 176, 111–120. [Google Scholar]
  19. Profft, I.; Mund, M.; Weber, G.E.; Weller, E.; Schulze, E.D. Forest management and carbon sequestration in wood products. Eur. J. For. Res. 2009, 128, 399–413. [Google Scholar] [CrossRef]
  20. Schulz, C.; Klein, D. Wald nutzen heißt Klimaschutz maximieren. LWF vergleicht verschiedene Nutzungsstrategien unter Klimaschutzaspekten. LWF Aktuell 2011, 85, 51–53. [Google Scholar]
  21. Moore, P.T.; DeRose, R.J.; Long, J.N.; van Miegroet, H. Using silviculture to influence carbon sequestration in southern appalachian spruce-fir forests. Forests 2012, 3, 300–316. [Google Scholar] [CrossRef]
  22. Hofer, P.; Taverna, R.; Werner, F.; Kaufmann, E.; Thürig, E. CO2-Effekte der Schweitzer Wald- und Holzwirtschaft. Szenarien zukünftiger Beiträge zum Klimaschutz; Bundesamt für Umwelt, BAFU: Bern, Switzerland, 2007; p. 102. [Google Scholar]
  23. Mund, M.; Schulze, E.D. Impacts of forest management on the carbon budget of European beech (Fagus sylvatica) forests. AFJZ 2006, 177, 47–63. [Google Scholar]
  24. Höllerl, S.; Neuner, M. Kohlenstoffbilanz des Wald- und Holzsektors bewirtschafteter und unbewirtschafteter Bergmischwälder der Bayerischen Alpen. Forstarchiv 2011, 82, 142–154. [Google Scholar]
  25. Luyssaert, S.; Schulze, E.D.; Börner, A.; Knohl, A.; Hessenmöller, D.; Law, B.E.; Ciais, P.; Grace, J. Old-growth forests as global carbon sinks. Nature 2008, 455, 213–215. [Google Scholar]
  26. Pretzsch, H.; Biber, P.; Ďurský, J. The single tree-based stand simulator SILVA: Construction, application, evaluation. For. Ecol. Manag. 2002, 162, 3–21. [Google Scholar]
  27. Zell, J. Methoden für die Ermittlung, Modellierung und Prognose der Kohlenstoffspeicherung in Wäldern auf Grundlage permanenter Großrauminventuren. PhD Dissertation, University of Freiburg i. Brsg, Freiburg i. Brsg, Germany, 2008; p. 152. [Google Scholar]
  28. Offenthaler, I.; Hochbichler, E. Estimation of root biomass of Austrian forest tree species. Austrian J. For. Sci. 2006, 123, 65–86. [Google Scholar]
  29. Burschel, P.; Kürsten, E.; Larson, B.C. Die Rolle von Wald und Forstwirtschaft im Kohlenstoffhaushalt. Eine Betrachtung für die Bundesrepublik Deutschland; Schriftenreihe. Forstwissenschaftliche Fakultät der Universität München und die Bayerische Forstliche Versuchs- und Forschungsanstalt: München, Germany, 1993; p. 135. [Google Scholar]
  30. Wirth, C.; Schulze, E.D.; Schwalbe, G.; Tomczyk, S.; Weber, G.; Weller, E. Dynamik der Kohlenstoffvorräte in den Wäldern Thüringens; Abschlussbericht zur 1. Phase des BMBF-Projektes, Modelluntersuchung zur Umsetzung des Kyoto-Protokolls. Thüringer Landesanstalt für Wald, Jagd und Fischerei: Gotha, Germany, 2004; p. 309. [Google Scholar]
  31. Rock, J.; Badeck, F.W.; Harmon, M.E. Estimating decomposition rate constants for European tree species from literature sources. Eur. J. For. Res. 2008, 127, 301–313. [Google Scholar] [CrossRef]
  32. Marland, E.S.; Stellar, K.; Marland, G.H. A distributed approach to accounting for carbon in wood products. Mitig. Adapt. Strateg. Glob. Change 2010, 15, 71–91. [Google Scholar]
  33. Röder, H.; Steinbeis, E.; Borchert, H.; Wellhausen, K.; Mai, W.; Kollert, W.; Jentsch, A.; Woest, A.; Weber-Blaschke, G.; Fiedler, S. Cluster Forst und Holz in Bayern; Ergebnisse der Clusterstudie 2008; Pöhry Forest Industry Consulting GmbH: Freising, Germany, 2008; p. 175. [Google Scholar]
  34. BMELV Holzmarktbericht. Abschlussbericht für die Forst- und Holzwirtschaft des Wirtschaftsjahres 2006. Anlage 1. Available online: http://www.bmelv-statistik.de/de/fachstatistiken/forst-und-holzwirtschaft/ (accessed on 19 September 2012).
  35. BMELV Holzmarktbericht. Abschlussbericht für die Forst- und Holzwirtschaft des Wirtschaftsjahres 2007. Anlage 1. Available online: http://www.bmelv-statistik.de/de/fachstatistiken/forst-und-holzwirtschaft/ (accessed on 19 September 2012).
  36. Chapter 12. Harvested Wood Products. In IPCC Guidelines for National Greenhouse Gas Inventories, 33 ed; Institute for Global Environmental Strategies: Hayama, Japan, 2006.
  37. Sathre, R.; O’Connor, J. A Synthesis of Research on Wood Products & Greenhouse Gas Impacts; Technical Report No. TR-19R, 2nd ed; FPInnovations: Vancouver, Canada, 2010; p. 117. [Google Scholar]
  38. Ingerson, A. Wood Products and Carbon Storage: Can Increased Production Help Solve the Climate Crisis? Wilderness Society: Craftsbury Common, VT, USA, 2009; p. 39. [Google Scholar]
  39. Lindner, M.; Karjalainen, T. Carbon inventory methods and carbon mitigation potentials of forests in Europe: A short review of recent progress. Eur. J. For. Res. 2007, 126, 149–156. [Google Scholar] [CrossRef]
  40. Reid, H.; Huq, S.; Inkinen, A.; MacGregor, J.; Macqueen, D.; Mayers, J.; Murray, L.; Tipper, R. Using Wood Products to Mitigate Climate Change—A Review of Evidence and Key Issues for Sustainable Management; International Institute for Environment and Development: London, UK, 2004; p. 90. [Google Scholar]
  41. Dietrich, H.; Jahn, H.C.; Jahn, G.; Wachter, H.; Anschütz, R.; Wagner, A. Berichte aus den Bundesländern zur Auswahl, Einrichtung und Bestandeserfassung der Naturwaldreservate. Natur und Landschaft 1980, 55, 134–143. [Google Scholar]
  42. Meyer, P.; Bücking, W.; Gehlhar, U.; Schulte, U.; Steffens, R. Das Netz der Naturwaldreservate in Deutschland: Flächenumfang, Repräsentativität und Schutzstatus im Jahr 2007. Forstarchiv 2007, 78, 188–196. [Google Scholar]
  43. Klein, D.; Schulz, C. Wälder und Holzprodukte als Kohlenstoffspeicher. Eine Betrachtung der Klimaschutzleistung der Wälder in Bayern. LWF Aktuell 2011, 85, 40–43. [Google Scholar]
  44. Tabaku, V.; Meyer, P. Lückenmuster albanischer und mitteleuropäischer Buchenwälder unterschiedlicher Nutzungsintensität. Forstarchiv 1999, 70, 87–97. [Google Scholar]
  45. Hessenmöller, D.; Schulze, E.D.; Großmann, M. Bestandesentwicklung und Kohlenstoffspeicherung des Naturwaldes “Schönstedter Holz” im Nationalpark Hainich. AFJZ 2008, 179, 209–219. [Google Scholar]
  46. Meyer, P. Totholzuntersuchungen in nordwestdeutschen Naturwäldern: Methodik und erste Ergebnisse. Forstwiss. Centralbl. 1999, 118, 167–180. [Google Scholar] [CrossRef]
  47. Meyer, P.; Menke, N.; Nagel, J.; Hansen, J.; Kawaletz, H.; Paar, U.; Evers, J. Entwicklung eines Managementmoduls für Totholz im Forstbetrieb; Abschlussbericht des von der Deutschen Bundesstiftung Umwelt geförderten Projekts; Nordwestdeutsche Forstliche Versuchsanstalt: Göttingen, Germany, 2009; p. 110. [Google Scholar]
  48. Müller-Using, S.; Bartsch, N. Totholzdynamik eines Buchenbestandes (Fagus silvatica L.) im Solling. Nachlieferung, Ursache und Zersetzung von Totholz. AFJZ 2003, 174, 122–130. [Google Scholar]
  49. Brang, P.; Heiri, C.; Bugmann, H. Waldreservate. 50 Jahre natürliche Waldentwicklung in der Schweiz. Eidgenössische Forschungsanstalt für Wald, Schnee und Landschaft WSL. Birmersdorf, ETH: Zürich, Switzerland, 2011; p. 272. [Google Scholar]
  50. Saniga, M.; Schütz, J.P. Dynamik des Totholzes in zwei gemischten Urwäldern der Westkarpaten im pflanzengeographischen Bereich der Tannen-Buchen- und Buchenwälder in verschiedenen Entwicklungsstadien. Schweiz. Z. Forstwes. 2001, 152, 407–416. [Google Scholar] [CrossRef]
  51. Korpel, S. Ergebnisse der Urwaldforschung für die Waldwirtschaft im Buchen-Ökosystem. AFZ/Der Wald 1992, 21, 1148–1152. [Google Scholar]
  52. Drößler, L.; von Lüpke, B. Bestandesstruktur, Verjüngung und Standortfaktoren in zwei Buchenurwald-Reservaten der Slowakei. AFJZ 2007, 178, 121–135. [Google Scholar]
  53. Drößler, L.; Meyer, P. Waldentwicklungsphasen in zwei Buchen-Urwaldreservaten in der Slowakei. Forstarchiv 2006, 77, 155–161. [Google Scholar]
  54. Trotsiuk, V.; Hobi, M.L.; Commarot, B. Age structure and disturbance of the relic virgin beech forest Uholka (Ukranian Carpathians). For. Ecol. Manag. 2012, 265, 181–190. [Google Scholar] [CrossRef]
  55. Werner, F.; Richter, F. Wooden building products in comparative LCA. A literature review. Int. J. LCA 2007, 12, 470–479. [Google Scholar]
  56. Rüter, S.; Diederichs, S. Ökobilanz-Basisdaten für Bauprodukte aus Holz; Arbeitsbericht; Institut für Holztechnologie und Holzbiologie: Hamburg, Germany, 2012; p. 304. [Google Scholar]
  57. Kölling, C.; Knoke, T.; Schall, P.; Ammer, C. Überlegungen zum Risiko des Fichtenanbaus in Deutschland vor dem Hintergrund des Klimawandels. Forstarchiv 2009, 80, 42–54. [Google Scholar]
  58. Kölling, C.; Beinhofer, B.; Hahn, A.; Knoke, T. Wie soll die Forstwirtschaft auf neue Risiken im Klimawandel reagieren? AFZ/Der Wald 2010, 5, 18–22. [Google Scholar]
  59. Smith, D.M.; Larson, B.C.; Kelty, M.J.; Ashton, P.M.S. The Practice of Silviculture; Applied Forest Ecology: New York, NY, USA, 1997; p. 352. [Google Scholar]
  60. Höllerl, S.; Bork, J. Die Kohlenstoffspeicherung von bewirtschafteten und unbewirtschafteten Fichtenbeständen unter Berücksichtigung von Ausfallrisiken—Aussagen nicht nur über Bestände der montanen Zone. Forstarchiv 2013. submitted. [Google Scholar]
  61. König, A. Abgrenzung von Sturmschadensrisikoklassen und Entwicklung von risikoorientierten Endnutzungsstrategien für den bayerischen Staatswald. Abschlussbericht, Projekt H8. Bayerische Landesanstalt für Wald und Forstwirtschaft: Freising, Germany, 1996; p. 54. [Google Scholar]
  62. Beinhofer, B. Zum Einfluss von Risiko auf den optimalen Zieldurchmesser der Fichte. Forstarchiv 2007, 78, 117–124. [Google Scholar]
  63. Böttcher, H.; Freibauer, A.; Scholz, Y.; Ciais, V.G.; Mund, M.; Wutzler, T.; Schulze, E.D. Setting priorities for land management to mitigate climate change. Carbon Balance Manag. 2012, 7, 18. [Google Scholar]
  64. Schütz, J.P. Der Plenterwald und WEITERE Formen Strukturierter und Gemischter Wälder; Parey Buchverlag: Berlin, Germany, 2001; p. 207. [Google Scholar]
  65. Dvorák, L.; Bachmann, P.; Mandallaz, D. Sturmschäden in ungleichförmigen Beständen. Schweiz. Z. Forstwes. 2001, 152, 445–452. [Google Scholar] [CrossRef]
  66. O'Hara, K.L. Multiaged forest stands for protection forests: Concepts and applications. For. Snow Landsc. Res. 2006, 80, 45–56. [Google Scholar]
  67. Spittlehouse, D.L.; Stewart, R.B. Adaption to climate change in forest management. BC J. Ecosyst. Manag. 2003, 4, 1–11. [Google Scholar]
  68. BMELV, Survey Instructions for the 2nd National Forest Inventory (2001–2002). Federal Ministry of Food, Agriculture and Consumer Protection: Bonn, Germany, 2006; p. 107.
  69. Christensen, M.; Hahn, K.; Mountford, E.P.; Ódor, P.; Standovár, T.; Rozenbergar, D.; Diaci, J.; Wijdeven, S.M.J.; Meyer, P.; Winter, S.; et al. Dead wood in European beech (Fagus sylvatica) forests reserves. For. Ecol. Manag. 2005, 210, 267–282. [Google Scholar] [CrossRef]
  70. Nunery, J.S.; Keeton, W.S. Forest carbon storage in the northeastern United States: Net effects of harvesting frequency, post-harvest retention, and wood products. For. Ecol. Manag. 2010, 259, 1363–1375. [Google Scholar] [CrossRef]
  71. Profft, I.; Arenhövel, W.; Seiler, M. Wald & Holz-Potential für den Klimaschutz in Thüringen. In Mitteilungen der Thüringer Landesanstalt für Wald, Jagd und Fischerei; Thüringer Landesanstalt für Wald, Jagd und Fischerei: Gotha, Germany, 2007; pp. 42–65. [Google Scholar]
  72. Murty, D.; Kirschbaum, M.F.; McMurtrie, R.E.; McGilvray, H. Does conversion of forest to agricultural land change soil carbon and nitrogen? A review of the literature. Glob. Change Biol. 2002, 8, 105–123. [Google Scholar] [CrossRef]
  73. Schulze, E.D.; Freibauer, A. Carbon unlocked from soils. Nature 2005, 437, 205–206. [Google Scholar]
  74. Jandl, J.; Lindner, M.; Vesterdal, L.; Bauwens, B.; Baritz, R.; Hagedorn, F.; Johnson, D.W.; Minkkinen, K.; Byrne, K.A. How strongly can forest management influence soil carbon sequestration? Geoderma 2007, 137, 253–268. [Google Scholar] [CrossRef]
  75. Borken, W.; Beese, F. Soil respiration in pure and mixed stands of European beech and Norway spruce following removal of organic horizons. Can. J. For. Res. 2005, 35, 2756–2764. [Google Scholar] [CrossRef]
  76. Knoepp, J.D.; Swank, W.T. Forest management effects on surface soil carbon and nitrogen. Soil. Sci. Soc. Am. J. 1997, 61, 928–935. [Google Scholar]
  77. Johnson, D.W.; Knoepp, J.D.; Swank, W.T.; Shan, J.; Morris, L.A.; van Lear, D.H.; Kapeluck, P.R. Effects of forest management on soil carbon: Results of some long-term resampling studies. Environ. Pollut. 2002, 116, 201–208. [Google Scholar] [CrossRef]
  78. Klein, D.; Fuentes, J.P.; Schmidt, A.; Schmidt, H.; Schulte, A. Soil organic carbon as affected by silvicultural and exploitative interventions in Nothofagus pumilio forests of the Chilenian Patagonia. For. Ecol. Manag. 2008, 255, 3549–3555. [Google Scholar] [CrossRef]
  79. Nave, L.E.; Vance, E.D.; Swanston, C.W.; Curtis, P.S. Harvest impacts on soil carbon storage in temperate forests. For. Ecol. Manag. 2009, 259, 857–866. [Google Scholar]
  80. Schulp, C.J.E.; Nabuurs, G.J.; Verburg, P.H.; de Waal, R.W. Effect of tree species on carbon stocks in forest floor and mineral soil and implications for soil carbon inventories. For. Ecol. Manag. 2008, 256, 482–490. [Google Scholar] [CrossRef]
  81. Gleixner, G.; Tefs, C.; Jordan, A.; Hammer, M.; Wirth, C.; Nueske, A.; Telz, A.; Schmidt, U.E.; Glatzel, S. Soil Carbon Accumulation in Old-Growth Forests. In Old-Growth Forests. Function, Fate and Value; Ecological Studies 207. M; Springer Verlag: Berlin Heidelberg, Germany, 2009; pp. 231–266. [Google Scholar]
  82. Schlesinger, W. Evidence from chronosequence studies for a low carbon-storage potential of soils. Nature 1990, 348, 232–234. [Google Scholar] [CrossRef]
  83. Reichstein, M.; Ågren, G.I.; Fontaine, S. Is There a Theoretical Limit to Soil Carbon Storage in Old-Growth Forests? A Model Analysis with Contrasting Approaches. In Old-Growth Forests. Function, Fate and Value. Ecological Studies 207. M; Wirth, C., Gleixner, G., Heimann, M., Eds.; Springer Verlag: Berlin Heidelberg, Germany, 2009; pp. 267–279. [Google Scholar]
  84. StMUG, Klimaprogramm Bayern 2020; Bavarian State Ministry of the Environment and Public Health: Bavarian, Germany, 2009; p. 48.
  85. Schmidt, M.; Glos, P. Forstlicher Hoffnungsträger: Brettschichtholz aus Buche. LWF Aktuell 2010, 7, 15–17. [Google Scholar]

