Canopy Structural Changes Following Widespread Mortality of Canopy Dominant Trees


Abstract
:1. Introduction
2. Experimental Section
2.1. Site Description and Experimental Design
2.2. Forest Accelerated Succession ExperimenT (FASET)
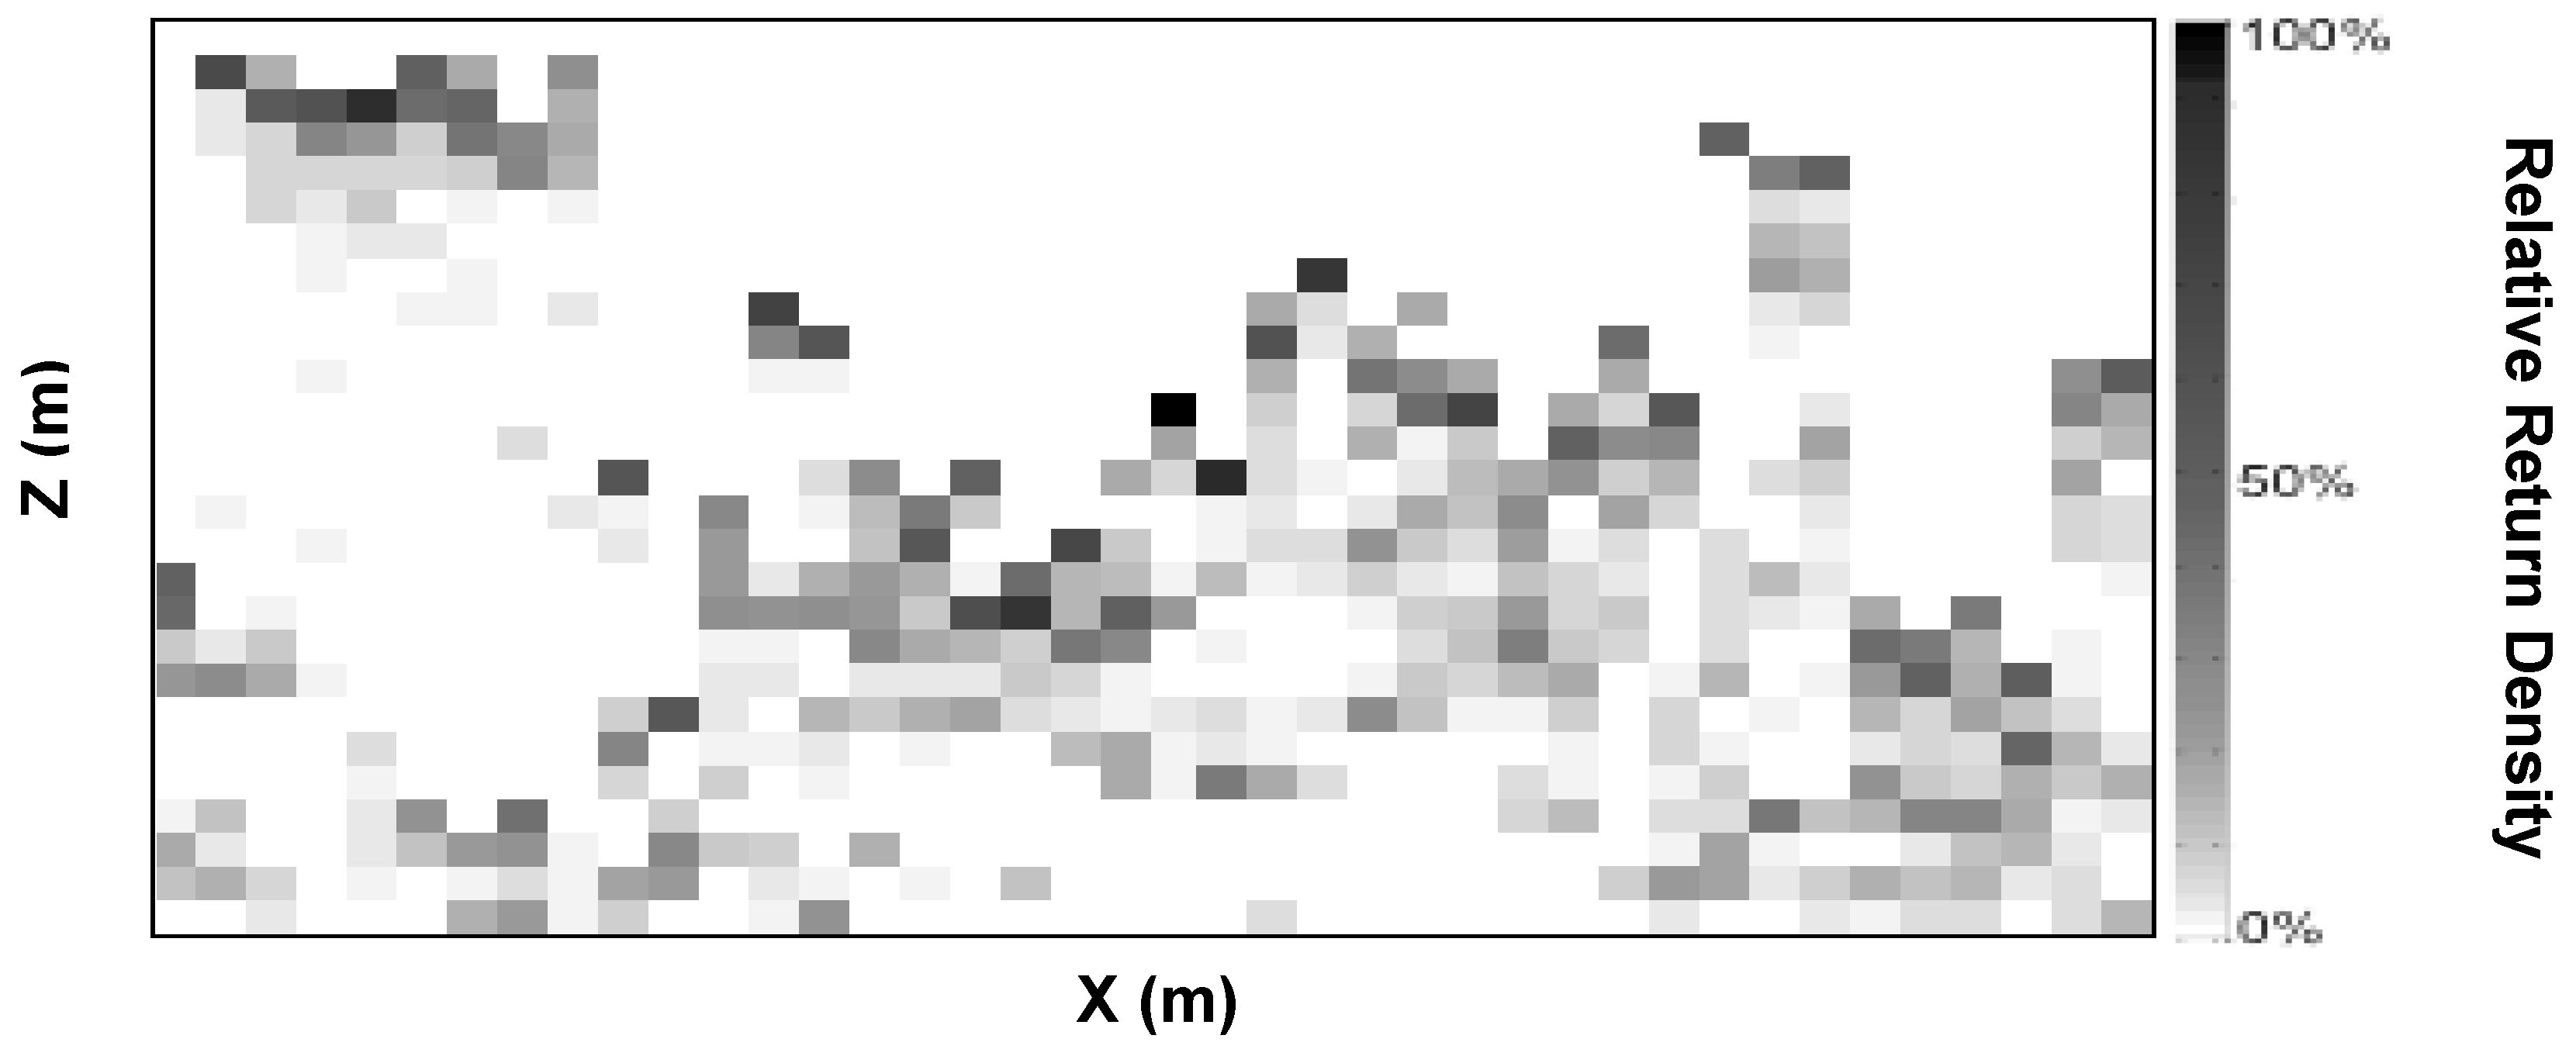
2.3. Canopy Structure (Portable Canopy Lidar)


| Parameter name | Parameter description | Transect statistic: | Column statistic: | Bin statistic: | Weighted by: |
|---|---|---|---|---|---|
| Clumping Index | Degree of foliar clumping | Mean | ln(mean gap frac.) | NA | NA |
| Porosity | Ratio of bins with no leaf area to total number of bins | Empty: total bins | NA | NA | NA |
| Sky Frac. | Transect mean of column ratio of sky hits relative to total leaf returns | Mean | sky : total hits | NA | NA |
| Sky Frac. Var. | Transect variability of column ratio of sky hits relative to total leaf returns | SD | sky : total hits | NA | NA |
| Rugosity | Transect variability of column variability of leaf density | SD | SD | Height | Return count |
| TopRug | Transect variability of column maximum canopy height | SD | Max height | >1 return | NA |
| meanStd | Transect mean of column variability of leaf height | Mean | SD | Height | NA |
| height2 | Transect variability of column mean leaf height | SD | Mean | Height | NA |
| Mean Leaf Ht. | Transect mean of column mean leaf height | Mean | Mean | Height | NA |
| modeEl | Transect mean of | Mean | Mode | Height | Return count |
| mode2 | Transect mean of squared column leaf height mode | Mean | Mode | Height | (Return count)2 |
| Mean Canopy Ht. | Transect mean of column maximum canopy height | Mean | Max height | >1 return | NA |
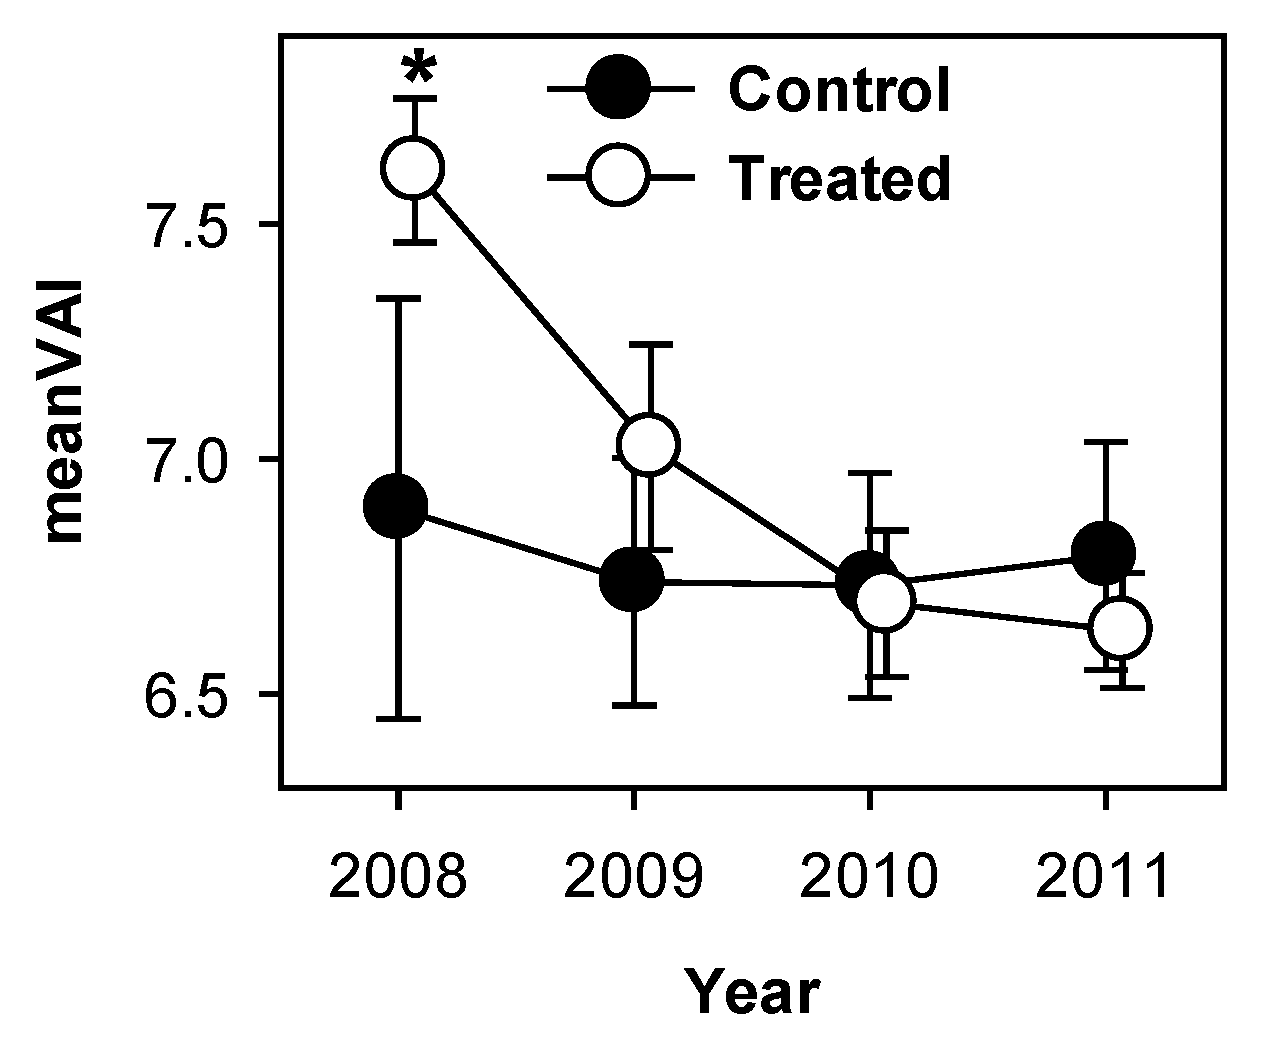
| meanVAI | Transect mean of column return count | Mean | Sum | Return count | NA |
| Gap fraction | Transect proportion of 1m2 bins at a given height with 0 canopy returns. | Empty : total bins | Height | Return count | NA |
2.4. Statistical Analysis
3. Results
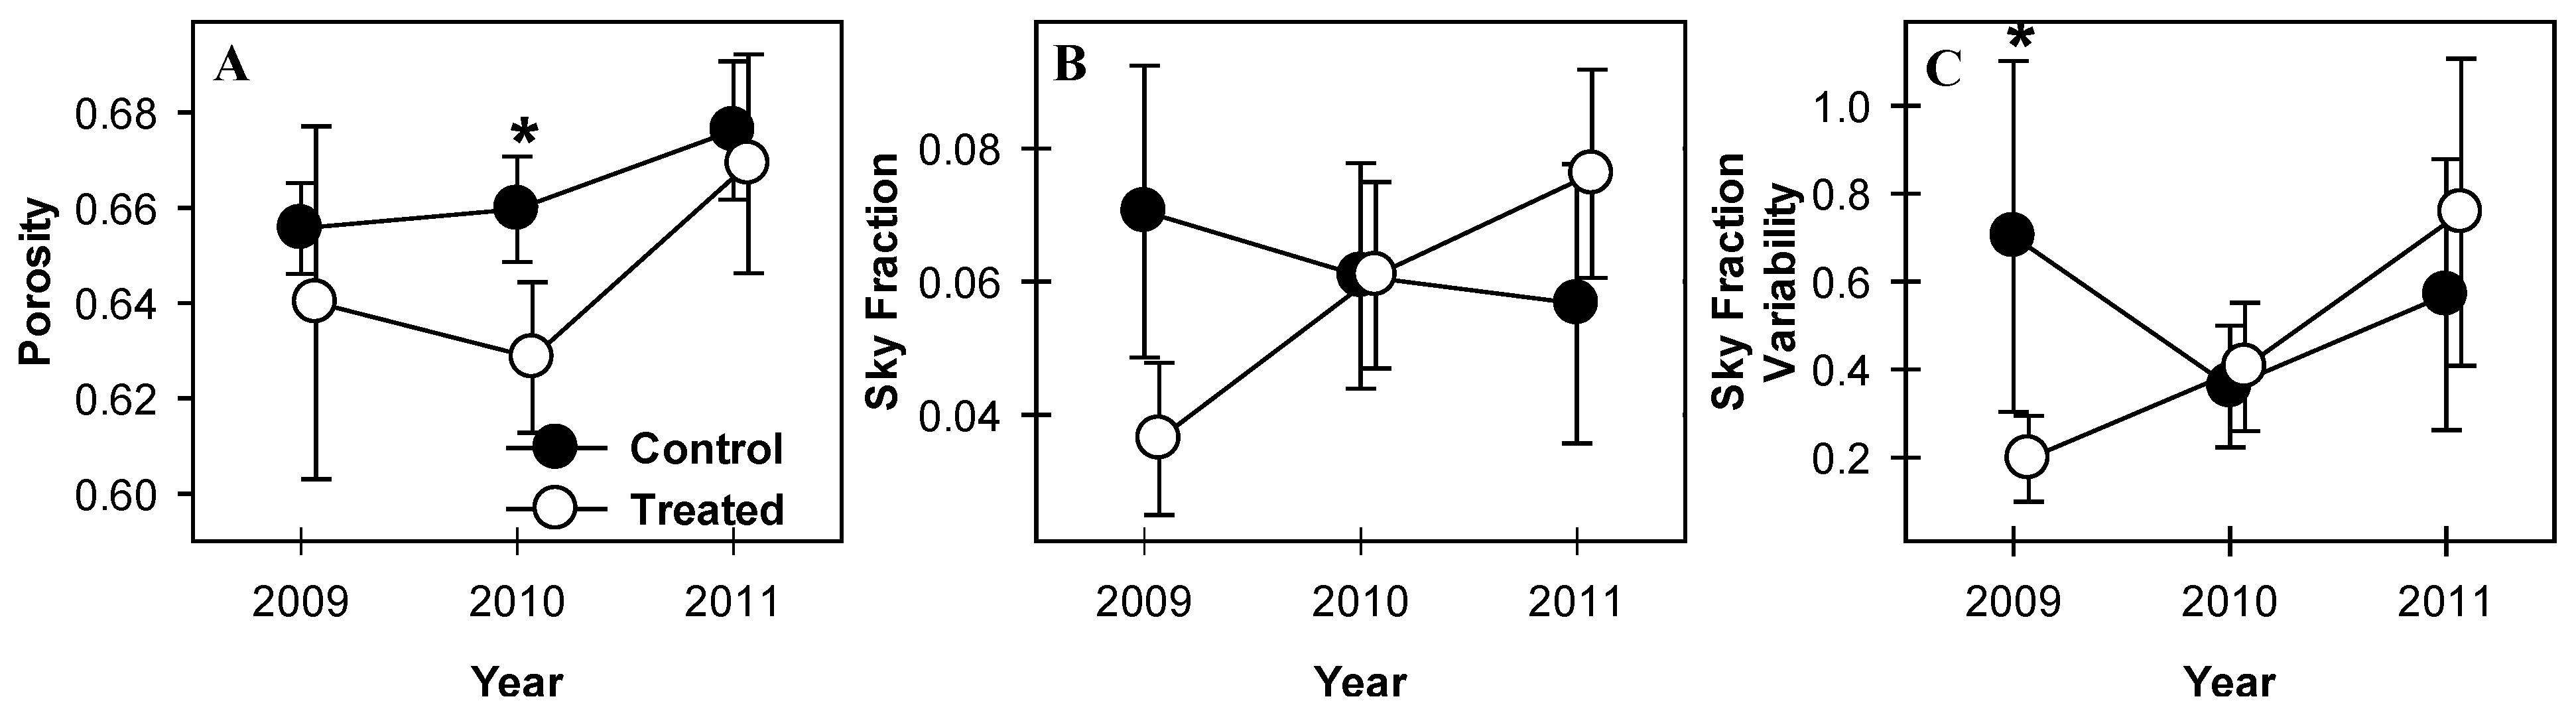
3.1. Canopy Openness


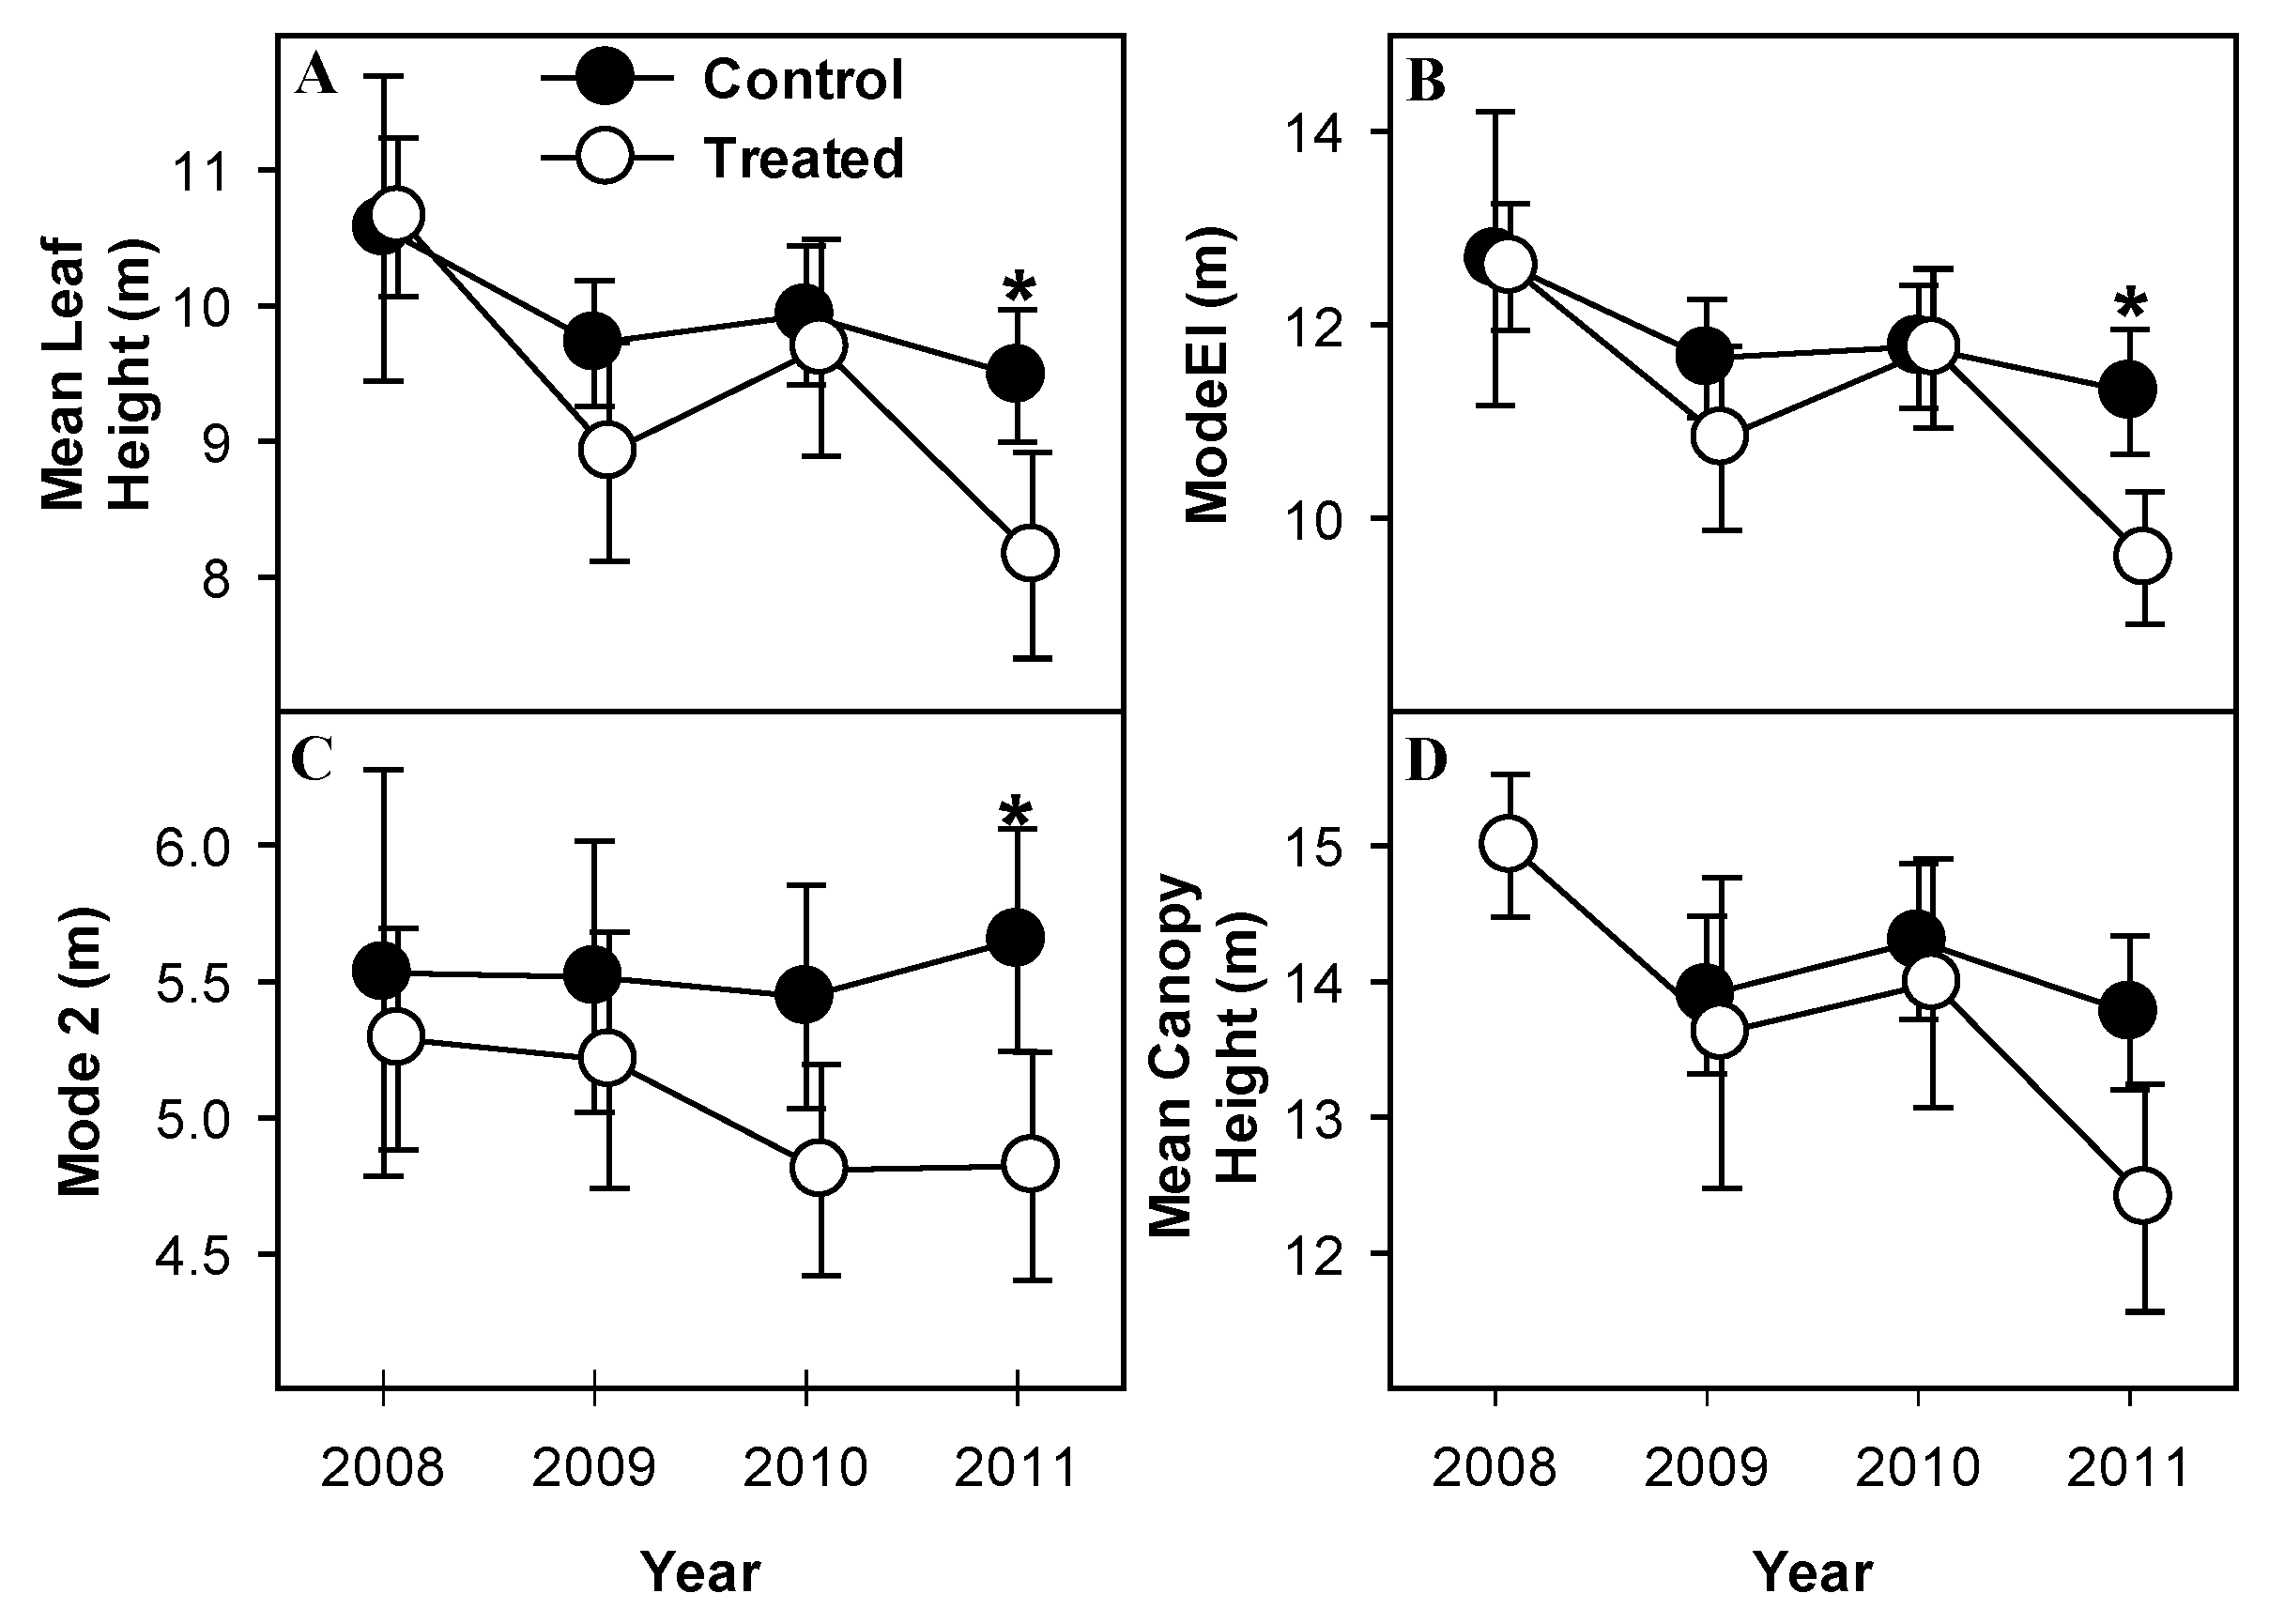
3.2. Foliage Height and Density

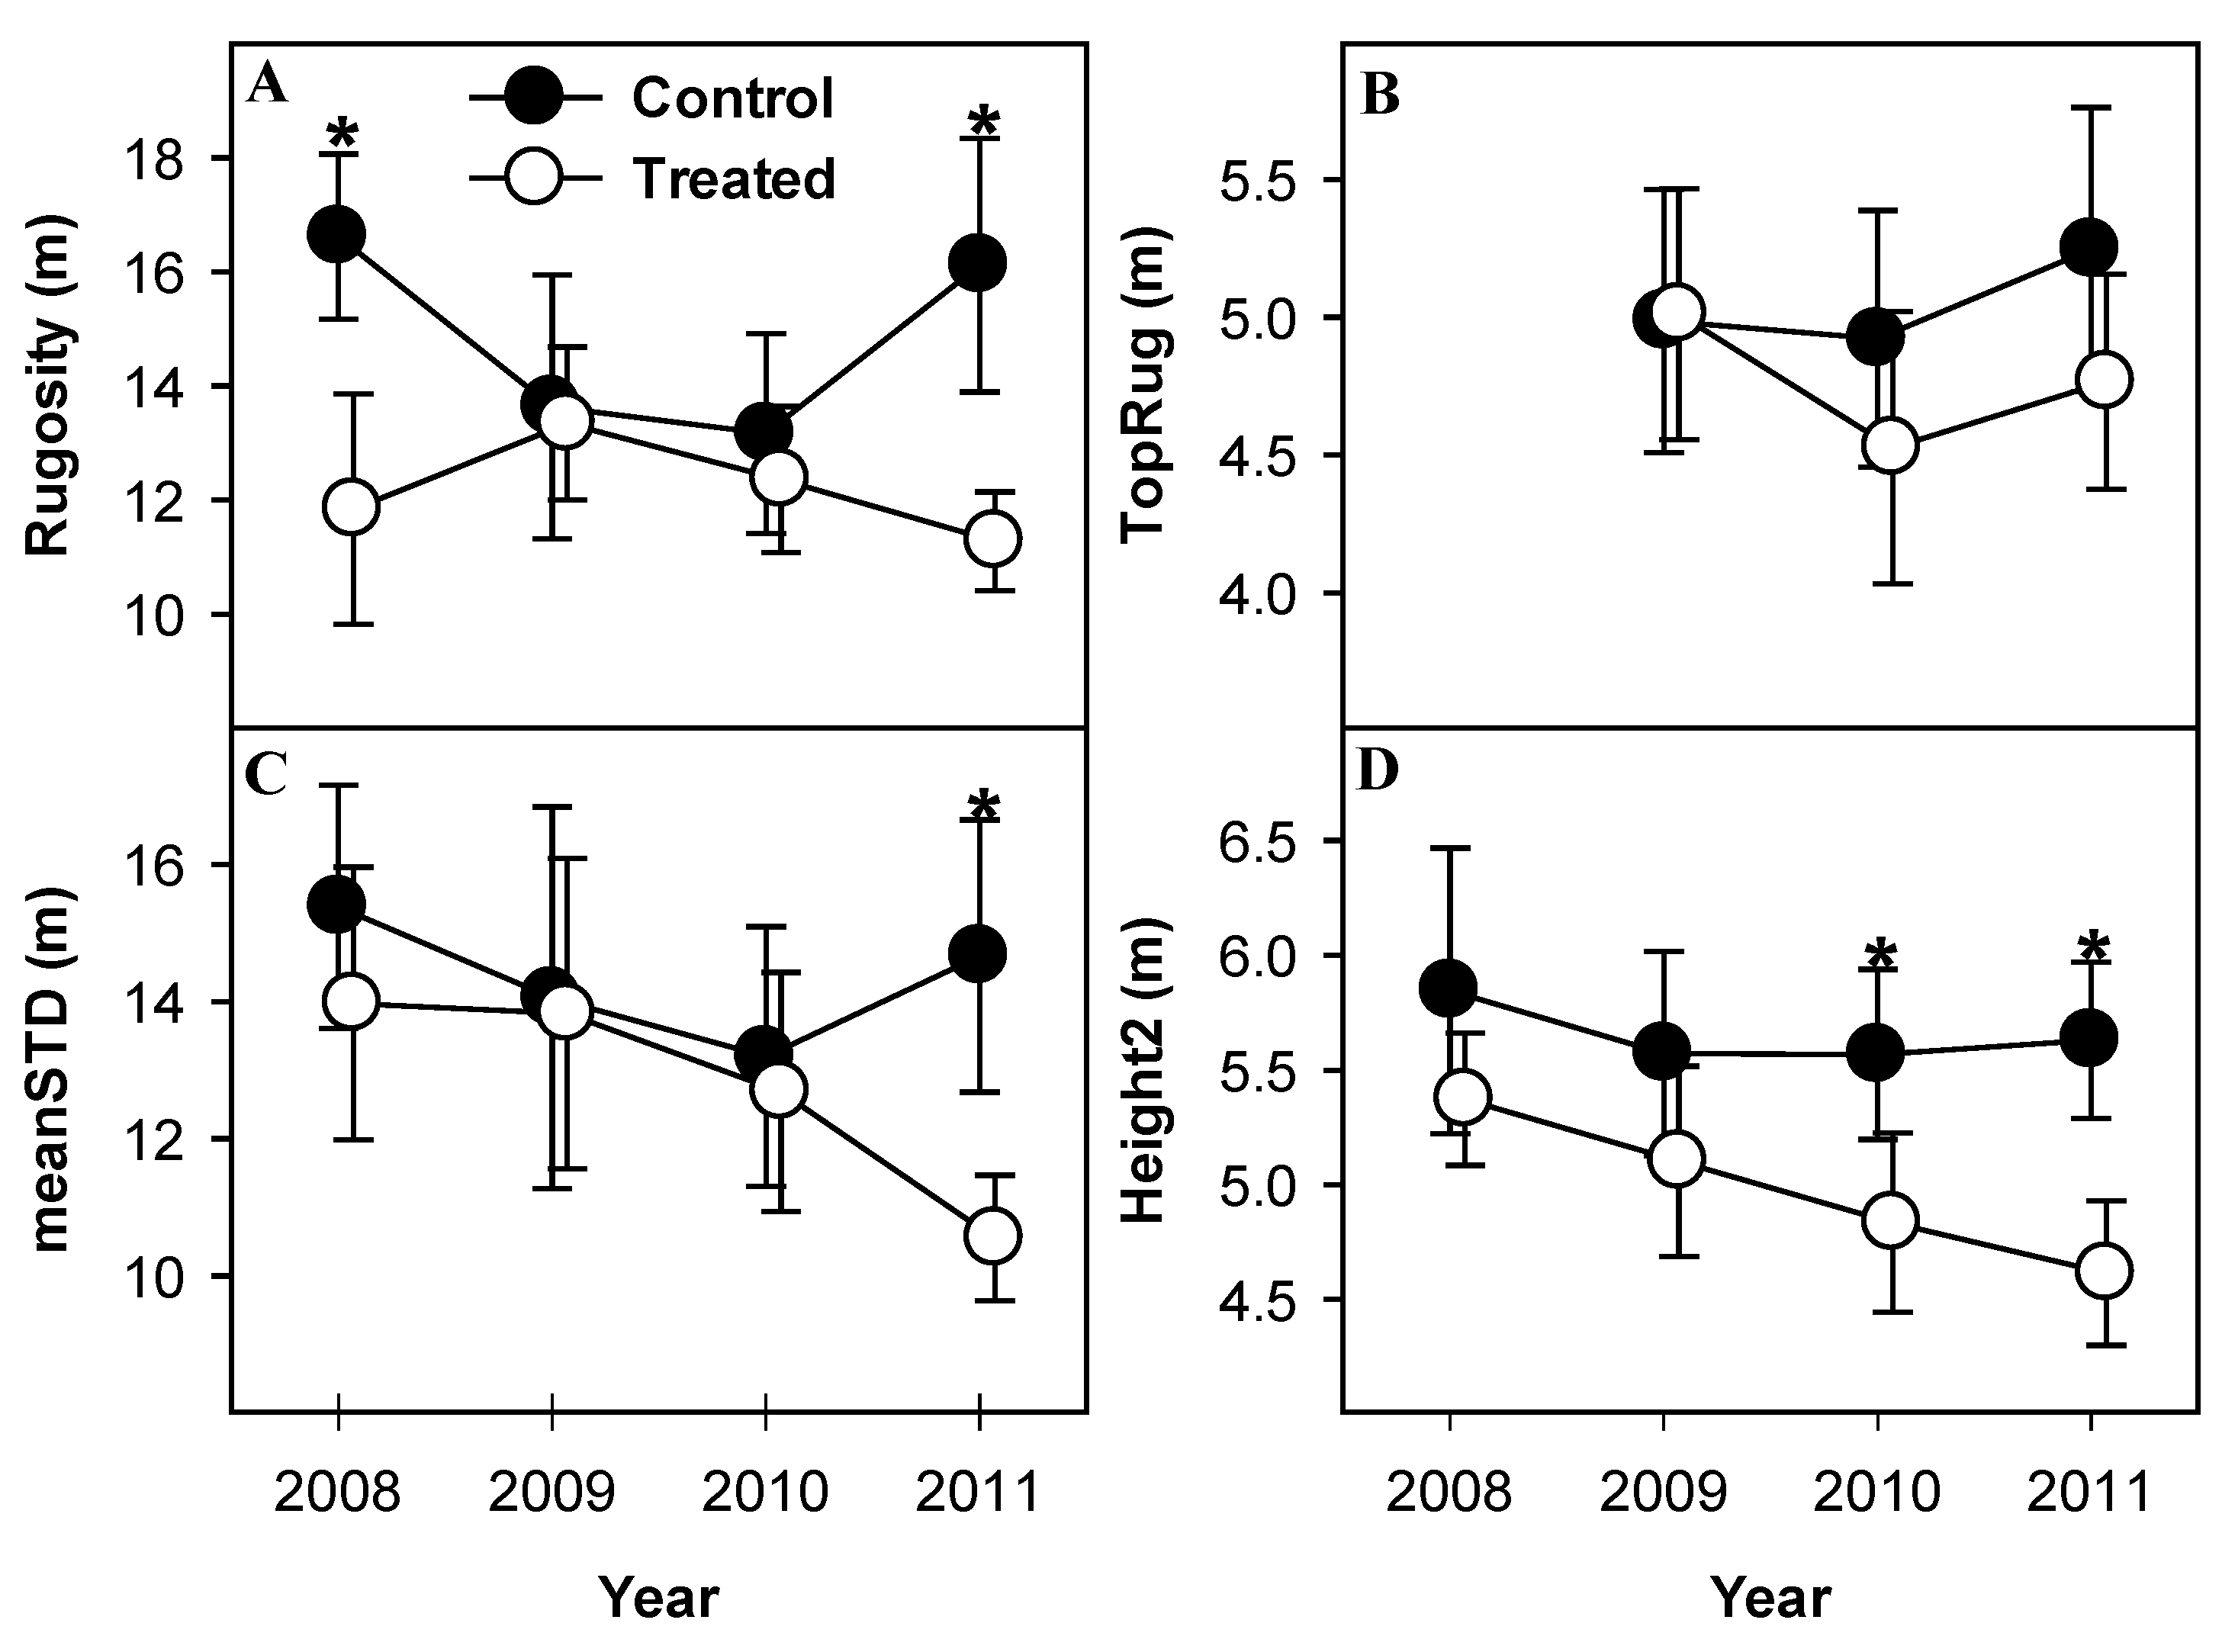
3.3. Canopy Structural Heterogeneity

4. Discussion
4.1. Type, Rate, and Magnitude of Canopy Structural Changes
4.2. Functional Consequences
5. Conclusions
Acknowledgments
Conflict of Interest
References
- Valverde, T.; Silvertown, J. Canopy closure rate and forest structure. Ecology 1997, 78, 1555–1562. [Google Scholar] [CrossRef]
- Parker, G.G.; Harding, D.J.; Berger, M.L. A portable LIDAR system for rapid determination of forest canopy structure. J. Appl. Ecol. 2004, 41, 755–767. [Google Scholar] [CrossRef]
- Brown, M.J.; Parker, G.G. Canopy light transmittance in a chronosequence of mixed-species deciduous forests. Can. J. For. Res. 1994, 24, 1694–1703. [Google Scholar] [CrossRef]
- Vanderwel, M.C.; Coomes, D.A.; Purves, D.W. Quantifying variation in forest disturbance, and its effects on aboveground biomass dynamics, across the eastern United States. Glob. Change Biol. 2013, 19, 1504–1517. [Google Scholar] [CrossRef]
- Canham, C.D. Growth and canopy architecture of shade-tolerant trees—Response to canopy gaps. Ecology 1988, 69, 786–795. [Google Scholar] [CrossRef]
- Duursma, R.A.; Mäkelä, A. Summary models for light interception and light-use efficiency of non-homogeneous canopies. Tree Physiol. 2007, 27, 859–870. [Google Scholar] [CrossRef]
- North, M.; Chen, J.Q.; Oakley, B.; Song, B.; Rudnicki, M.; Gray, A.; Innes, J. Forest stand structure and pattern of old-growth western hemlock/douglas-fir and mixed-conifer forests. For. Sci. 2004, 50, 299–311. [Google Scholar]
- Ishii, H.T.; Tanabe, S.; Hiura, T. Exploring the relationships among canopy structure, stand productivity, and biodiversity of temperature forest ecosystems. For. Sci. 2004, 50, 342–355. [Google Scholar]
- Ishii, H.; Asano, S. The role of crown architecture, leaf phenology and photosynthetic activity in promoting complementary use of light among coexisting species in temperate forests. Ecol. Res. 2010, 25, 715–722. [Google Scholar] [CrossRef]
- Bradshaw, G.A.; Spies, T.A. Characterizing canopy gap structure in forests using wavelet analysis. J. Ecol. 1992, 80, 205–215. [Google Scholar] [CrossRef]
- Parker, W.C.; Dey, D.C. Influence of overstory density on ecophysiology of red oak (Quercus rubra) and sugar maple (Acer saccharum) seedlings in central Ontario shelterwoods. Tree Physiol. 2008, 28, 797–804. [Google Scholar] [CrossRef]
- Chiang, J.-M.; Brown, K.J. The effects of thinning and burning treatments on within-canopy variation of leaf traits in hardwood forests of southern Ohio. For. Ecol. Manag. 2010, 260, 1065–1075. [Google Scholar] [CrossRef]
- Goudiaby, V.; Brais, S.; Grenier, Y.; Berninger, F. Thinning effects on jack pine and black spruce photosynthesis in eastern boreal forests of Canada. Silva Fenn. 2011, 45, 595–609. [Google Scholar]
- Moreno-Gutierrez, C.; Barbera, G.G.; Nicolas, E.; de Luis, M.; Castillo, V.M.; Martinez-Fernandez, F.; Querejeta, J.I. Leaf δ18O of remaining trees is affected by thinning intensity in a semiarid pine forest. Plant Cell Environ. 2011, 34, 1009–1019. [Google Scholar] [CrossRef]
- Forest Inventory and Analysis (FIA) Forest Inventory Data Online (FIDO). Available online: http://apps.fs.fed.us/fido/ (accessed on 3 July 2013).
- Albert, D.A.; Minc, L.D. The Natural Ecology and Cultural History of the Colonial Point Red Oak Stands; University of Michigan Biological Station: Pellston, MI, USA, 1987. [Google Scholar]
- Karamanski, T.J. Deep Wood Frontier—A History of Logging in Northern Michigan; Wayne State University Press: Detroit, MI, USA, 1989. [Google Scholar]
- Gough, C.M.; Vogel, C.S.; Hardiman, B.; Curtis, P.S. Wood net primary production resilience in an unmanaged forest transitioning from early to middle succession. For. Ecol. Manag. 2010, 260, 36–41. [Google Scholar] [CrossRef]
- Nave, L.E.; Gough, C.M.; Maurer, K.D.; Bohrer, G.; Hardiman, B.S.; Le Moine, J.; Munoz, A.B.; Nadelhoffer, K.J.; Sparks, J.P.; Strahm, B.D.; et al. Disturbance and the resilience of coupled carbon and nitrogen cycling in a north temperate forest. J. Geophys. Res. Biogeosci. 2011, 116. [Google Scholar] [CrossRef]
- Frelich, L.E.; Reich, P.B. Spatial patterns and succession in a Minnesota southern-boreal forest. Ecol. Monogr. 1995, 65, 325–346. [Google Scholar] [CrossRef]
- Edenius, L.; Ericsson, G.; Kempe, G.; Bergström, R.; Danell, K. The effects of changing land use and browsing on aspen abundance and regeneration: A 50-year perspective from Sweden. J. Appl. Ecol. 2011, 48, 301–309. [Google Scholar] [CrossRef]
- Korb, J.E.; Fule, P.Z.; Stoddard, M.T. Forest restoration in a surface fire-dependent ecosystem: An example from a mixed conifer forest, southwestern Colorado, USA. For. Ecol. Manag. 2012, 269, 10–18. [Google Scholar] [CrossRef]
- Caspersen, J.P.; Pacala, S.W.; Jenkins, J.C.; Hurtt, G.C.; Moorcroft, P.R.; Birdsey, R.A. Contributions of land-use history to carbon accumulation in U.S. forests. Science 2000, 290, 1148–1151. [Google Scholar] [CrossRef]
- Pregitzer, K.S.; Euskirchen, E.S. Carbon cycling and storage in world forests: Biome patterns related to forest age. Glob. Change Biol. 2004, 10, 2052–2077. [Google Scholar] [CrossRef]
- Puettmann, K.J.; Coates, K.D.; Messier, C. A Critique of Silviculture: Managing for Complexity; Island Press: Washington, DC, USA, 2009. [Google Scholar]
- Gough, C.M.; Hardiman, B.S.; Nave, L.E.; Bohrer, G.; Maurer, K.D.; Vogel, C.S.; Nadelhoffer, K.J.; Curtis, P.S. Sustained carbon uptake and storage following moderate disturbance in a great lakes forest. Ecol. Appl. 2013, 23. in press. [Google Scholar]
- Gough, C.M.; Vogel, C.S.; Schmid, H.P.; Su, H.B.; Curtis, P.S. Multi-year convergence of biometric and meteorological estimates of forest carbon storage. Agric. For. Meteorol. 2008, 148, 158–170. [Google Scholar] [CrossRef]
- Pan, Y.; Chen, J.M.; Birdsey, R.; McCullough, K.; He, L.; Deng, F. Age structure and disturbance legacy of North American forests. Biogeosciences 2011, 8, 715–732. [Google Scholar] [CrossRef]
- Tardy, S.W. Soil Survey of Cheboygan County, Michigan; General Books: New York, NY, USA, 1991. [Google Scholar]
- Nave, L.E.; Vogel, C.S.; Gough, C.M.; Curtis, P.S. The contribution of atmospheric nitrogen deposition to net primary productivity in a northern hardwood forest. Can. J. For. Res. 2009, 39, 1108–1118. [Google Scholar] [CrossRef]
- Schmid, H.P.; Su, H.B.; Vogel, C.S.; Curtis, P.S. Ecosystem-atmosphere exchange of carbon dioxide over a mixed hardwood forest in northern lower Michigan. J. Geophys. Res. 2003, 108. [Google Scholar] [CrossRef]
- Hardiman, B.S.; Bohrer, G.; Gough, C.M.; Vogel, C.S.; Curtis, P.S. The role of canopy structural complexity in wood net primary production of a maturing northern deciduous forest. Ecology 2011, 92, 1818–1827. [Google Scholar] [CrossRef]
- Hardiman, B.S.; Gough, C.M.; Halperin, A.; Hofmeister, K.L.; Nave, L.E.; Bohrer, G.; Curtis, P.S. Maintaining high rates of carbon storage in old forests: A mechanism linking canopy structure to forest function. For. Ecol. Manag. 2013, 298, 111–119. [Google Scholar] [CrossRef]
- Kucharik, C.J.; Norman, J.M.; Gower, S.T. Measurements of branch area and adjusting leaf area index indirect measurements. Agric. For. Meteorol. 1998, 91, 69–88. [Google Scholar] [CrossRef]
- Gonsamo, A.; Walter, J.-M.N.; Pellikka, P. Sampling gap fraction and size for estimating leaf area and clumping indices from hemispherical photographs. Can. J. For. Res. 2010, 40, 1588–1603. [Google Scholar] [CrossRef]
- Kneeshaw, D.D.; Harvey, B.D.; Reyes, G.P.; Caron, M.N.; Barlow, S. Spruce budworm, windthrow and partial cutting: Do different partial disturbances produce different forest structures? For. Ecol. Manag. 2011, 262, 482–490. [Google Scholar] [CrossRef]
- Ford, C.R.; Elliott, K.J.; Clinton, B.D.; Kloeppel, B.D.; Vose, J.M. Forest dynamics following eastern hemlock mortality in the southern Appalachians. Oikos 2012, 121, 523–536. [Google Scholar] [CrossRef]
- Parker, G.G. Structure and Microclimate of Forest Canopies. In Forest Canopies: A Review of Research on a Biological Frontier; Lowman, M., Nadkarni, N., Eds.; Academic Press: San Diego, CA, USA, 1995; pp. 73–106. [Google Scholar]
- Kneeshaw, D.D.; Bergeron, Y. Canopy gap characteristics and tree replacement in the southeastern boreal forest. Ecology 1998, 79, 783–794. [Google Scholar] [CrossRef]
- Parker, G.G.; Russ, M.E. The canopy surface and stand development: Assessing forest canopy structure and complexity with near-surface altimetry. For. Ecol. Manag. 2004, 189, 307–315. [Google Scholar] [CrossRef]
- Walcroft, A.S.; Brown, K.J.; Schuster, W.S.F.; Tissue, D.T.; Turnbull, M.H.; Griffin, K.L.; Whitehead, D. Radiative transfer and carbon assimilation in relation to canopy architecture, foliage area distribution and clumping in a mature temperate rainforest canopy in New Zealand. Agric. For. Meteorol. 2005, 135, 326–339. [Google Scholar] [CrossRef]
- Niinemets, Ü. Photosynthesis and resource distribution through plant canopies. Plant Cell Environ. 2007, 30, 1052–1071. [Google Scholar] [CrossRef]
- Mori, A.; Niinemets, Ü. Plant responses to heterogeneous environments: Scaling from shoot modules and whole-plant functions to ecosystem processes. Ecol. Res. 2010, 25, 691–692. [Google Scholar]
- Lemoine, D.; Jacquemin, S.; Granier, A. Beech (Fagus sylvatica L.) branches show acclimation of xylem anatomy and hydraulic properties to increased light after thinning. Ann. For. Sci. 2002, 59, 761–766. [Google Scholar]
- Quentin, A.G.; Beadle, C.L.; O’Grady, A.P.; Pinkard, E.A. Effects of partial defoliation on closed canopy Eucalyptus globulus Labilladiere: Growth, biomass allocation and carbohydrates. For. Ecol. Manag. 2011, 261, 695–702. [Google Scholar] [CrossRef]
- Ogunjemiyo, S.; Parker, G.; Roberts, D. Reflections in bumpy terrain: Implications of canopy surface variations for the radiation balance of vegetation. IEEE Geosci. Remote Sens. Lett. 2005, 2, 90–93. [Google Scholar] [CrossRef]
- Luyssaert, S.; Schulze, E.D.; Boerner, A.; Knohl, A.; Hessenmoeller, D.; Law, B.E.; Ciais, P.; Grace, J. Old-growth forests as global carbon sinks. Nature 2008, 455, 213–215. [Google Scholar] [CrossRef]
© 2013 by the authors; licensee MDPI, Basel, Switzerland. This article is an open access article distributed under the terms and conditions of the Creative Commons Attribution license (http://creativecommons.org/licenses/by/3.0/).
Share and Cite
Hardiman, B.S.; Bohrer, G.; Gough, C.M.; Curtis, P.S. Canopy Structural Changes Following Widespread Mortality of Canopy Dominant Trees. Forests 2013, 4, 537-552. https://doi.org/10.3390/f4030537
Hardiman BS, Bohrer G, Gough CM, Curtis PS. Canopy Structural Changes Following Widespread Mortality of Canopy Dominant Trees. Forests. 2013; 4(3):537-552. https://doi.org/10.3390/f4030537
Chicago/Turabian StyleHardiman, Brady S., Gil Bohrer, Christopher M. Gough, and Peter S. Curtis. 2013. "Canopy Structural Changes Following Widespread Mortality of Canopy Dominant Trees" Forests 4, no. 3: 537-552. https://doi.org/10.3390/f4030537