Article

Foliage and Litter Chemistry, Decomposition, and Nutrient Release in Pinus taeda

1
School of Agriculture and Natural Resources, Abraham Baldwin Agricultural College, 2802 Moore Hwy Box 8, Tifton, GA 31793, USA
2
Department of Forest Resources and Environmental Conservation, Virginia Polytechnic Institute & State University, 228 Cheatham Hall (0324), Blacksburg, VA 24061, USA
*
Author to whom correspondence should be addressed.
Forests 2013, 4(3), 595-612; https://doi.org/10.3390/f4030595
Submission received: 3 May 2013 / Revised: 9 June 2013 / Accepted: 1 July 2013 / Published: 17 July 2013

Abstract

:
Following fertilization of forest plantations, high accumulations of nutrients in the forest floor creates the need to assess rates of forest floor decomposition and nutrient release. The study site was a 25-year old experimental loblolly pine plantation in the North Carolina Sandhills Region. Soluble and insoluble N, P, carbohydrate and phenol-tannin fractions were determined in foliage and litter by extraction with trichloroacetic acid. The long-term forest floor decomposition rate and decomposition and nutrient release in an experiment simulating removal of the overstory canopy were also determined. In litter, insoluble protein-N comprised 80%–90% of total-N concentration while soluble inorganic- and organic-P comprised 50%–75% of total-P concentration explaining forest floor N accumulations. Fertilization did not increase soluble carbohydrates in litter and forest floor decomposition rates. Loblolly pine forest floor decomposing in environmental conditions simulating removal of the overstory canopy was greatly accelerated and indicated 75% mass loss and release of 80% of the N pool within one year. This could result in a loss of substantial quantities of N at harvest due to low N uptake by seedlings in the newly planted next rotation suggesting management of the forest floor at harvest is essential to conserve site N capital in these N limited systems.

1. Introduction

Growth of forest plantations in the southeastern U.S. is often limited by the availability of nitrogen (N) and phosphorus (P) [1,2]. Fertilization with N and P has been found to increase the growth of loblolly pine (Pinus taeda L.) growing on sandy soils common to the region [3]. On sandy soils, fertilization can result in greater accumulations of N in the forest floor relative to the mineral soil [4]. In a previous study at the site investigated in this study, the forest floor accumulated N following fertilization while there was little change in mineral soil N [5]. In contrast, P tended to accumulate in both the forest floor and the mineral soil [5].
Nitrogen has been found to be immobilized during decomposition of the loblolly pine Oi horizon and released in only modest amounts from the Oe horizon [6]. Other studies that examined loblolly pine Oi horizon decomposition and nutrient release have also found immobilization of N during decomposition in closed canopy stands [7,8]. In contrast to N, P was released from decomposing forest floor horizons likely increasing the supply of P to trees [6]. The increase in litter P following fertilization was in soluble fractions [9] which readily leached from the forest floor [10]. These studies suggest that N is slowly released from the forest floor through biotic decomposition processes while P release proceeds at a faster rate due to leaching.
In a loblolly pine litter decomposition study, while fertilization increased concentrations of N, P, potassium (K), calcium (Ca), and magnesium (Mg), this increase in endogenous nutrient availability did not increase the decomposition rate [8]. Higher endogenous N availability was also found to not increase the decomposition rate of lodgepole pine (Pinus contorta var. latifolia Engelm.) litter [11]. Decomposition has been suggested in a number of studies [12,13,14,15] to be increased by higher availability of soluble carbon (C) sources rather than by higher nutrient availability. Specifically, the growth of fungal hyphae on litter was suggested to be dependent on the availability of soluble carbohydrates [12]. Additions of soluble C have been suggested to produce a positive priming effect on decomposition [13,14,15] where a fraction of this C is used to produce additional enzymes, stimulating decomposition [13]. Soluble C was not higher in fertilized foliage and litter in a number of studies [9,16,17] suggesting fertilization may not increase forest floor decomposition rates by this mechanism.
We sought to investigate fertilization effects on litter C, N, and P fractions with the potential to alter loblolly pine litter decomposition and N and P cycling. Our hypotheses were: (1) Fertilization increases litter N in the insoluble fraction and litter P in the soluble fraction; and (2) Fertilization does not increase the rate of forest floor decomposition since soluble C is not increased. Hypotheses were tested with a soluble and insoluble fractionation of foliage and litter C, N, and P and by measuring forest floor decomposition rates. Nutrient release from the forest floor decomposing in a simulated disturbance environment was also determined in order to quantify potential nutrient release following a disturbance such as thinning or harvesting.

2. Experimental Section

2.1. Site Description

The Southeast Tree Research and Education Site (SETRES) was established in 1985 in order to investigate the effects of irrigation and fertilization on loblolly pine growing on an infertile sandy soil. The site was located in the Sandhills Region in Scotland Co., NC, 17 km north of Laurinburg, NC (34°54ʹN, 79°28ʹW). Mean annual precipitation was 120 cm and the mean minimum and maximum temperatures were 10.4 °C in January and 23.6 °C in July, respectively. Prior to planting of loblolly pine in 1985, the site was a native longleaf pine (Pinus palustris Mill.) forest. The stand was 25-years old when sampling began for this study. The soil was mapped as the Wakulla series; a siliceous, thermic Psammentic Hapludult.
The experimental design at SETRES was a 2 × 2 factorial randomized complete block with 4 blocks (n = 4, N = 16) with fertilization and irrigation treatments. In 1992, 50 × 50 m treatment plots containing interior 30 × 30 m measurement plots were established. Prior to initial treatment application, plots were thinned and competing vegetation was controlled. Treatments included fertilization, no addition and optimal foliar nutrition based on target foliar nutrient concentrations (1.3% N, 0.10% P, 0.35% K, 0.12% Ca, 0.06% Mg, >12 ppm B) [18], and irrigation, no addition and addition of 2.5 cm water week−1 March to November resulting in an approximate annual application of 90 cm. Fertilization began in March 1992 and irrigation began in April 1993 and continues to the present. Fertilization was conducted each spring with a broadcast surface application of various fertilizer sources including granular urea, boron-coated urea, ammonium sulfate, diammonium phosphate, triple super phosphate, potassium chloride, dolomitic lime, Epsom salts, calcium sulfate, and borax [19]. Total N and P applications from 1992 to 2010 were 1490 kg·ha−1 and 168 kg·ha−1, respectively. Nutrient additions significantly increased tree growth [3,18] with volume increased by 100% after 13 years of fertilization [19].

2.2. Sampling

2.2.1. Foliage and Litter Solubility Indices

Foliage samples were collected in mid-August 2010 from the upper 1/3 of the canopy at 3 randomly selected trees within each plot. Samples were collected from the first flush of the previous year’s growth. Litter was collected on 24 October, 2010. Litter samples were obtained by collecting subsamples from existing litterfall traps (8 m2·plot−1) that are part of ongoing studies at the site. Litter collection was timed to obtain a sample no more than one week after the litter had fallen in order to minimize possible leaching of soluble fractions. Foliage and litter samples were oven-dried at 60 °C for approximately 1 week and ground using a Thomas-Wiley Model 4 mill (Thomas Scientific, Swedesboro, NJ, USA).

2.2.2. Long-Term Forest Floor Decomposition

At SETRES, litterfall has been collected since 1992 as part of on-going studies at the site. Total litterfall mass from 1992 to 2007 was provided [20]. Forest floor mass in 2008 was taken from a previous study at SETRES [5]. The difference between total litterfall since study initiation and the mass of the forest floor in 2008 was used to estimate the long-term forest floor decomposition rate.

2.2.3. Simulated Disturbance Forest Floor Decomposition

A litterbag decomposition experiment designed to replicate environmental conditions likely to occur following thinning or harvesting was also conducted. Litterbags (20 × 30 cm) were constructed of white nylon mesh with a 2 mm opening. Loblolly pine forest floor Oi and Oe horizons were collected in each plot in early May 2009. Beginning in late May 2009, litterbags containing approximately 100 g of air-dried forest floor material were placed on the mineral soil surface in an open area with no overstory canopy adjacent to the experimental plots replicating the layout of the plots. Samples were not bulked by treatment. Litterbags were anchored with pin flags. Four replicates were prepared for each of the 16 plots resulting in 64 total litterbags. One litterbag representing each of the 16 plots was collected and destructively sampled every 3 months for one year. The final litterbags were sampled in May 2010. Remaining mass and C, N, P, K and Ca concentrations were determined at each sampling interval. Samples were oven-dried at 60 °C for 5 days prior to mass determination and then ground using a Thomas-Wiley Model 4 mill (Thomas Scientific, Swedesboro, NJ, USA) prior to chemical analysis.

2.3. Chemical Analysis

2.3.1. Foliage and Litter Solubility Indices

Fractionation of soluble and insoluble N, P, and C fractions in foliage and litter was conducted [9,21]. In brief, total-N concentration in the litter was determined by dry-combustion with a Vario MAX CN analyzer (Elementar, Hanau, Germany). Total-P in the litter was determined by dry-ashing at 500 °C followed by dissolution with 6 N HCl. Phosphorus in solution was analyzed with inductively-coupled plasma atomic emission spectrophotometry (ICP-AES) on a Varian Vista MPX (Varian, Palo Alto, CA, USA). A sequential cold 0.30 M trichloroacetic acid (TCA) and hot 0.15 M TCA extraction was performed on duplicate 0.30 g samples to extract soluble N, P, carbohydrates, and phenols. The insoluble, residual concentration was calculated as the total concentration minus the total soluble fraction concentration. Throughout this paper, insoluble and residual were used interchangeably. To fractionate soluble inorganic- and organic-N and -P, soluble total-P and -N in the extracts were determined by H2SO4/H2O2 digestion and analysis with ICP-AES and the indophenol blue method [22], respectively. Inorganic-N and -P in the extracts were determined with the indophenol blue method and the procedure of Murphy and Riley [23], respectively. Similar to the results of Polglase et al. [9], initial analysis revealed inorganic-N to be an insignificant component and was dropped from further analysis. The soluble organic-P fraction was calculated as the total soluble-P fraction minus the soluble inorganic-P fraction. Carbohydrates were determined by the procedure of Dubois et al. [24] and were expressed as glucose equivalents. Carbohydrates were reported as soluble sugar, soluble starch, and the sum of these two fractions, total soluble carbohydrate. Phenols were determined by the Prussian blue method [25] and were expressed as tannic acid equivalents. Phenols were reported as soluble phenol, soluble tannin, and the sum of these two fractions, total soluble phenol + tannin. Nitrogen, P, carbohydrates, and phenols determined with colorimetric methods were analyzed with a Spectronic 20D+ spectrophotometer (Milton Roy, Ivyland, PA, USA). Organic-P soluble in cold TCA is phytate- and other ester-P while organic-P soluble in hot TCA is phytate- and nucleic acid-P [26]. Organic-N soluble in cold TCA is amino acid-N while organic-N soluble in hot TCA is nucleic acid-N [26]. Residual N is protein-N [26]. Carbohydrates and phenols soluble in cold TCA represent soluble components while in hot TCA, soluble carbohydrates represent starches and soluble phenols represent tannins [26].

2.3.2. Simulated Disturbance Forest Floor Decomposition

Total-C and -N were determined by dry combustion with a Vario MAX CNS analyzer (Elementar, Hanau, Germany). Total-P, K, and Ca were determined by dry-ashing at 500 °C and dissolution in 6 N HCl. Total-P, K, and Ca in solution were analyzed with inductively-coupled plasma atomic emission spectrophotometry (ICP-AES) on a Varian Vista MPX (Varian, Palo Alto, CA, USA).

2.4. Statistical Analysis

2.4.1. Foliage and Litter Solubility Indices

Treatment effects on N, P, and C fractions were assessed with a general linear model (PROC GLM, SAS Institute Inc., Cary, NC, USA). The following model structure was used:
Forests 04 00595 i001
where: yijk is the dependent variable associated with ith block (α), with the jth irrigation level (β), and the kth fertilizer (γ) level, (βγ)jk is the interaction effect between the jth irrigation and kth fertilizer levels, and εijk is the error associated with this observation.

2.4.2. Long-Term Forest Floor Decomposition

In order to provide a comparison of the forest floor decomposition rate under the overstory canopy and following overstory canopy removal, the long-term decay rate constant (k·year−1) [27] and mean residence time for 99% mass loss (MRT99), defined as 5/k, for the forest floor at SETRES were calculated using total litterfall mass from long-term measurements (1992 to 2007) and total forest floor mass in 2008 determined in a previous study [5]. Fertilization and irrigation effects on k and MRT99 were assessed with a general linear model (PROC GLM, SAS Institute Inc., Cary, NC, USA). The model was similar to that shown above.

2.4.3. Simulated Disturbance Forest Floor Decomposition

The proportion of nutrients released was calculated following the method of Schlesinger and Hasey [28]. Nutrient content released was estimated by multiplying the proportion released from each litterbag with mass of the Oi + Oe horizons for each block/treatment combination. Treatment effects on proportion of mass remaining and nutrient proportion and content released were assessed with repeated measures ANOVA [29] using the PROC MIXED procedure (SAS Institute Inc., Cary, NC, USA). The following model structure was used:
Forests 04 00595 i002
where: yijk is the dependent variable (proportion of mass remaining, the decay rate (k), and nutrient proportion and content released) observed in the ith block (α), at time Tl, for the jth irrigation level (β), and the kth fertilizer (γ) level, and εijkl is the error associated with this observation. Interactions between treatments and time and the treatments were included in the model. A first order auto-regressive structure was used to take into account the repeated measures from the same block-treatment combination. Block was considered a random effect in the model, while time was a continuous variable.
Litterbag proportion of mass remaining was fit to an exponential regression model to derive the decay constant (k) using the PROC NLINMIX procedure (SAS Institute Inc., Cary, NC, USA) in order to account for repeated measures using a first order auto-regressive structure. The following model structure was used:
Forests 04 00595 i003
where yij = proportion of litter remaining in sample from plot i at time j, T (in years) is the time since incubation started, k is the rate of decomposition (year−1), and εij is the error associated with the regression.

3. Results and Discussion

3.1. Results

3.1.1. Foliage and Litter Solubility Indices

3.1.1.1.Nitrogen

Fertilization increased all N fractions and irrigation decreased nucleic-N in foliage (Table 1). In litter, residual protein-N and total-N were higher in fertilized treatments suggesting amino- and nucleic-N were largely re-translocated prior to senescence (Table 1).
Table 1. Mean loblolly pine foliage and litter nitrogen fraction concentrations in control (Ct), irrigation (I), fertilization (F), and fertilization × irrigation (F×I) treatments. Coefficients of variation are shown in parentheses. Soluble amino-N is cold 0.30M trichloroacetic acid (TCA) extractable and soluble nucleic-N is hot 0.15M TCA extractable. Residual N is insoluble, protein-N and was calculated as the difference between total soluble-N and total-N. Statistically significant p-values are shown in bold for the effects of fertilization (F), irrigation (I), and their interaction (F×I).
CtIFFIFIF × I
Soluble Amino-N g·kg−1p-value
Foliage0.351(6.5)0.309(18.6)0.468(25.5)0.464(15.6)0.00850.58960.6524
Litter0.267(24.2)0.275(27.5)0.279(7.7)0.279(19.3)0.77590.88660.8866
Soluble Nucleic-N g·kg−1
Foliage1.01(8.0)0.910(9.8)1.22(13.5)1.13(12.0)<0.00010.01220.7828
Litter 0.317(24.7)0.286(19.8)0.377(23.7)0.308(17.4)0.22310.14760.5507
Residual N g·kg−1
Foliage7.67(6.8)7.62(3.6)10.34(7.4)10.87(4.4)<0.00010.38530.3078
Litter2.55(9.5)2.74(6.1)3.99(4.9)3.46(15.1)0.00010.34070.0605
Total-N g·kg−1
Foliage9.03(5.8)8.84(4.0)12.03(12.5)12.37(3.8)<0.00010.67790.3138
Litter3.13(5.0)3.30(7.9)4.64(6.5)4.04(12.7)0.00020.29340.0741
Indicates statistical analysis performed on log transformed data.
The residual, protein-N fraction contributed 80%–90% of total-N concentration for both unfertilized and fertilized loblolly pine foliage and litter. Foliar total-N concentration was >12.0 g·kg−1 in fertilized treatments and approximately 9.0 g·kg−1 in unfertilized treatments. Litter total-N concentration was approximately 50% of foliar total-N concentration in unfertilized treatments. In fertilized treatments, litter total-N concentration was approximately 30% of foliar total-N concentration suggesting greater translocation.

3.1.1.2. Phosphorus

Fertilization increased foliar inorganic-P, organic-P, and total-P (Table 2). In litter, fertilization increased the soluble inorganic- and organic-P fractions (Table 2). Residual- and total-P were also higher in fertilized treatments (Table 2).
Table 2. Mean loblolly pine foliage and litter phosphorus fraction concentrations in control (Ct), irrigation (I), fertilization (F), and fertilization × irrigation (F×I) treatments. Coefficients of variation are shown in parentheses. Cold and hot TCA soluble inorganic-P and organic-P fractions were pooled. Residual-P was calculated as the difference between total TCA soluble-P and total-P. Statistically significant p-values are shown in bold for the effects of fertilization (F), irrigation (I), and their interaction (F×I).
CtIFFIFIF × I
Total Soluble Inorganic-P mg·kg−1p-value
Foliage257.2(8.6)245.1(5.7)300.5(9.9)313.6(6.4)0.00120.96920.3200
Litter66.90(8.0)71.35(2.3)84.08(6.3)91.50(8.9)<0.00010.01390.4650
Total Soluble Organic-P mg·kg−1
Foliage130.2(21.1)115.7(29.1)386.3(39.6)284.3(15.2)0.00060.19210.3170
Litter47.55(28.4)28.65(61.4)73.70(29.3)71.90(45.2)0.00680.32470.4118
Residual-P mg·kg−1
Foliage368.6(13.6)324.9(21.6)269.9(65.6)409.5(7.8)0.89690.38690.1161
Litter51.15(33.5)60.63(30.7)98.93(13.0)75.50(8.7)0.00090.30650.0309
Total-P mg·kg−1
Foliage755.9(4.0)685.6(9.4)956.7(7.9)1007.3(5.4)<0.00010.72720.0542
Litter165.6(6.4)160.6(8.5)256.7(5.2)238.9(12.5)<0.00010.25420.5129
Foliar total-P was approximately 700 mg·kg−1 and 975 mg·kg−1 for unfertilized and fertilized treatments, respectively. In contrast to N where insoluble, residual-N comprised 80%–90% of total-N concentration in foliage and litter (Table 1), soluble inorganic- and organic-P comprised 50%–75% of total-P concentration (Table 2). Litter total-P concentration was approximately 25% of foliar total-P concentration.

3.1.1.3. Soluble Carbohydrate

Foliar soluble carbohydrate fractions did not differ among treatments (Table 3). In litter, soluble sugar and total soluble carbohydrate were highest in the FI treatment and lowest in the F treatment (Table 3). Litter total soluble carbohydrate concentration was approximately 65% of foliar total soluble carbohydrate concentration.
Table 3. Mean loblolly pine soluble carbohydrate fraction concentrations in control (Ct), irrigation (I), fertilization (F), and fertilization × irrigation (F×I) treatments. Coefficients of variation are shown in parentheses. Soluble sugar is cold 0.30M TCA extractable and soluble starch is hot 0.15M TCA extractable. Statistically significant p-values are shown in bold for the effects of fertilization (F), irrigation (I), and their interaction (F×I).
CtIFFIFIF × I
Soluble Sugar g·kg−1p-value
Foliage58.65(13.0)61.30(5.9)67.55(7.3)65.60(12.9)0.09720.92400.5350
Litter34.58(5.2)36.20(6.0)33.75(7.2)40.73(12.1)0.17870.00800.0642
Soluble Starch g·kg−1
Foliage52.88(5.2)55.68(5.4)55.35(19.4)50.98(3.9)0.70020.78480.2319
Litter41.00(8.2)40.03(5.8)37.38(8.5)39.93(1.5)0.23980.60750.2641
Total Soluble Carbohydrates g·kg−1
Foliage111.45(8.6)116.98(2.8)122.90(10.4)116.53(8.5)0.33650.93920.3006
Litter75.60(5.8)76.20(5.1)71.10(3.8)80.68(5.8)0.99500.02790.0463

3.1.1.4. Soluble Phenol and Tannin

Results indicated a trend for fertilization to decrease soluble phenol and tannin fractions in foliage and litter (Table 4). Foliar soluble tannin and total soluble phenol + tannin were higher in unfertilized treatments (Table 4). Litter soluble phenol, soluble tannin, and total soluble phenol + tannin concentration were also higher in unfertilized treatments (Table 4). Litter total soluble phenol concentration was 61% to 77% of foliar total soluble phenol concentration.
Table 4. Mean loblolly pine soluble phenol and tannin fraction concentrations in control (Ct), irrigation (I), fertilization (F), and fertilization × irrigation (F×I) treatments. Coefficients of variation are shown in parentheses. Soluble phenol is cold 0.30M TCA extractable and soluble tannin is hot 0.15M TCA extractable. Statistically significant p-values are shown in bold for the effects of fertilization (F), irrigation (I), and their interaction (F×I). Indicates statistical analysis performed on log transformed data.
CtIFFIFIF × I
Soluble Phenol g·kg−1p-value
Foliage8.75(16.6)9.20(14.4)7.95(14.9)7.68(8.7)0.05550.87230.5104
Litter 7.25(9.9)7.23(13.6)5.15(16.9)6.90(11.7)0.01380.05010.0429
Soluble Tannin g·kg−1
Foliage16.25(6.8)17.15(9.8)12.68(6.8)13.15(4.0)0.00010.26340.7208
Litter10.03(12.6)9.83(13.6)6.80(9.4)8.30(16.1)0.00250.28690.1729
Total Soluble Phenol + Tannin g·kg−1
Foliage25.00(9.7)26.35(10.4)20.63(8.6)20.80(1.9)0.00040.42910.5394
Litter17.30(10.7)17.05(13.5)11.90(10.7)15.18(13.3)0.00420.14760.0980

3.1.2. Long-Term Forest Floor Decomposition

The decay rate constant determined for the forest floor decomposing under the overstory canopy, using long-term litterfall measurements from 1992 to 2007 and forest floor mass in 2008 determined in a previous study [5], was not affected by fertilization (p = 0.3511) or irrigation (p = 0.3578). The decay rate constant (k) was 0.021 year−1 ± 0.0083 (site mean) indicating a MRT99 of 238 months. Mean total litterfall mass from long-term litterfall measurements of the unfertilized (Ct and I) and fertilized (F and FI) treatments was 40 ± 4.6 Mg·ha−1 and 73 ± 8.8 Mg·ha−1, respectively. Mean forest floor mass in 2008 of the unfertilized and fertilized treatments was 25 ± 5.0 Mg·ha−1 and 42 ± 9.1 Mg·ha−1, respectively.

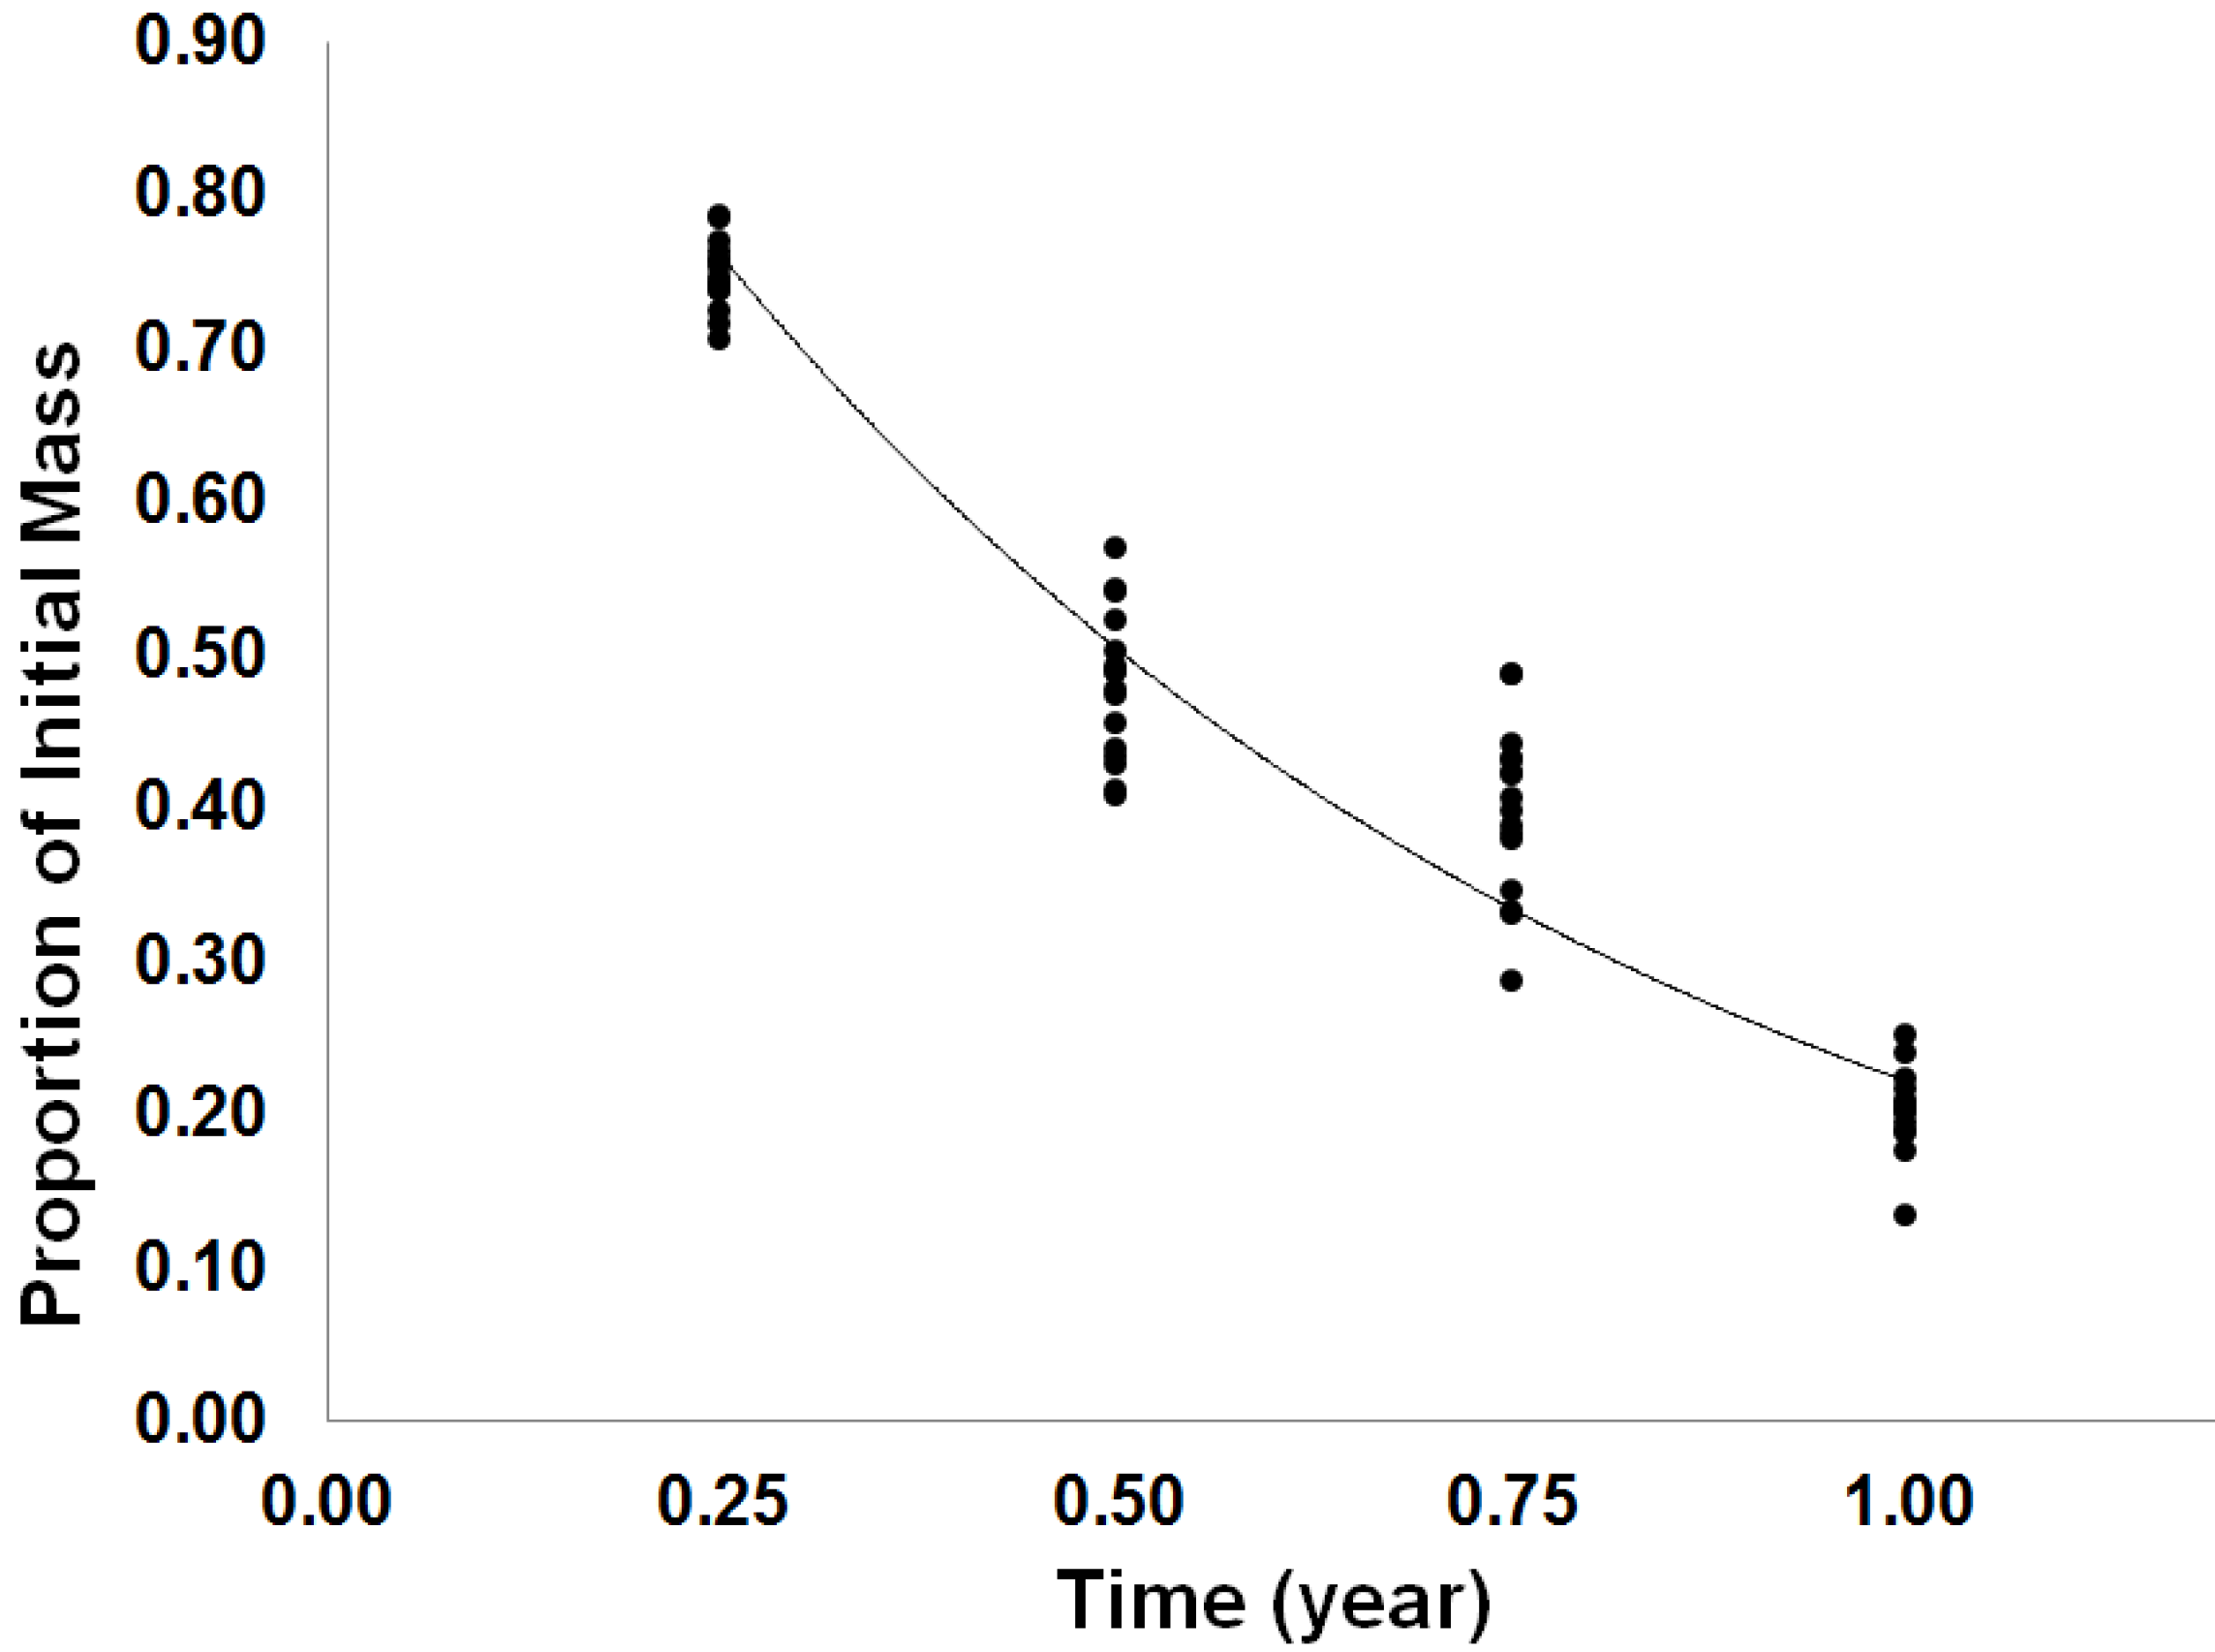
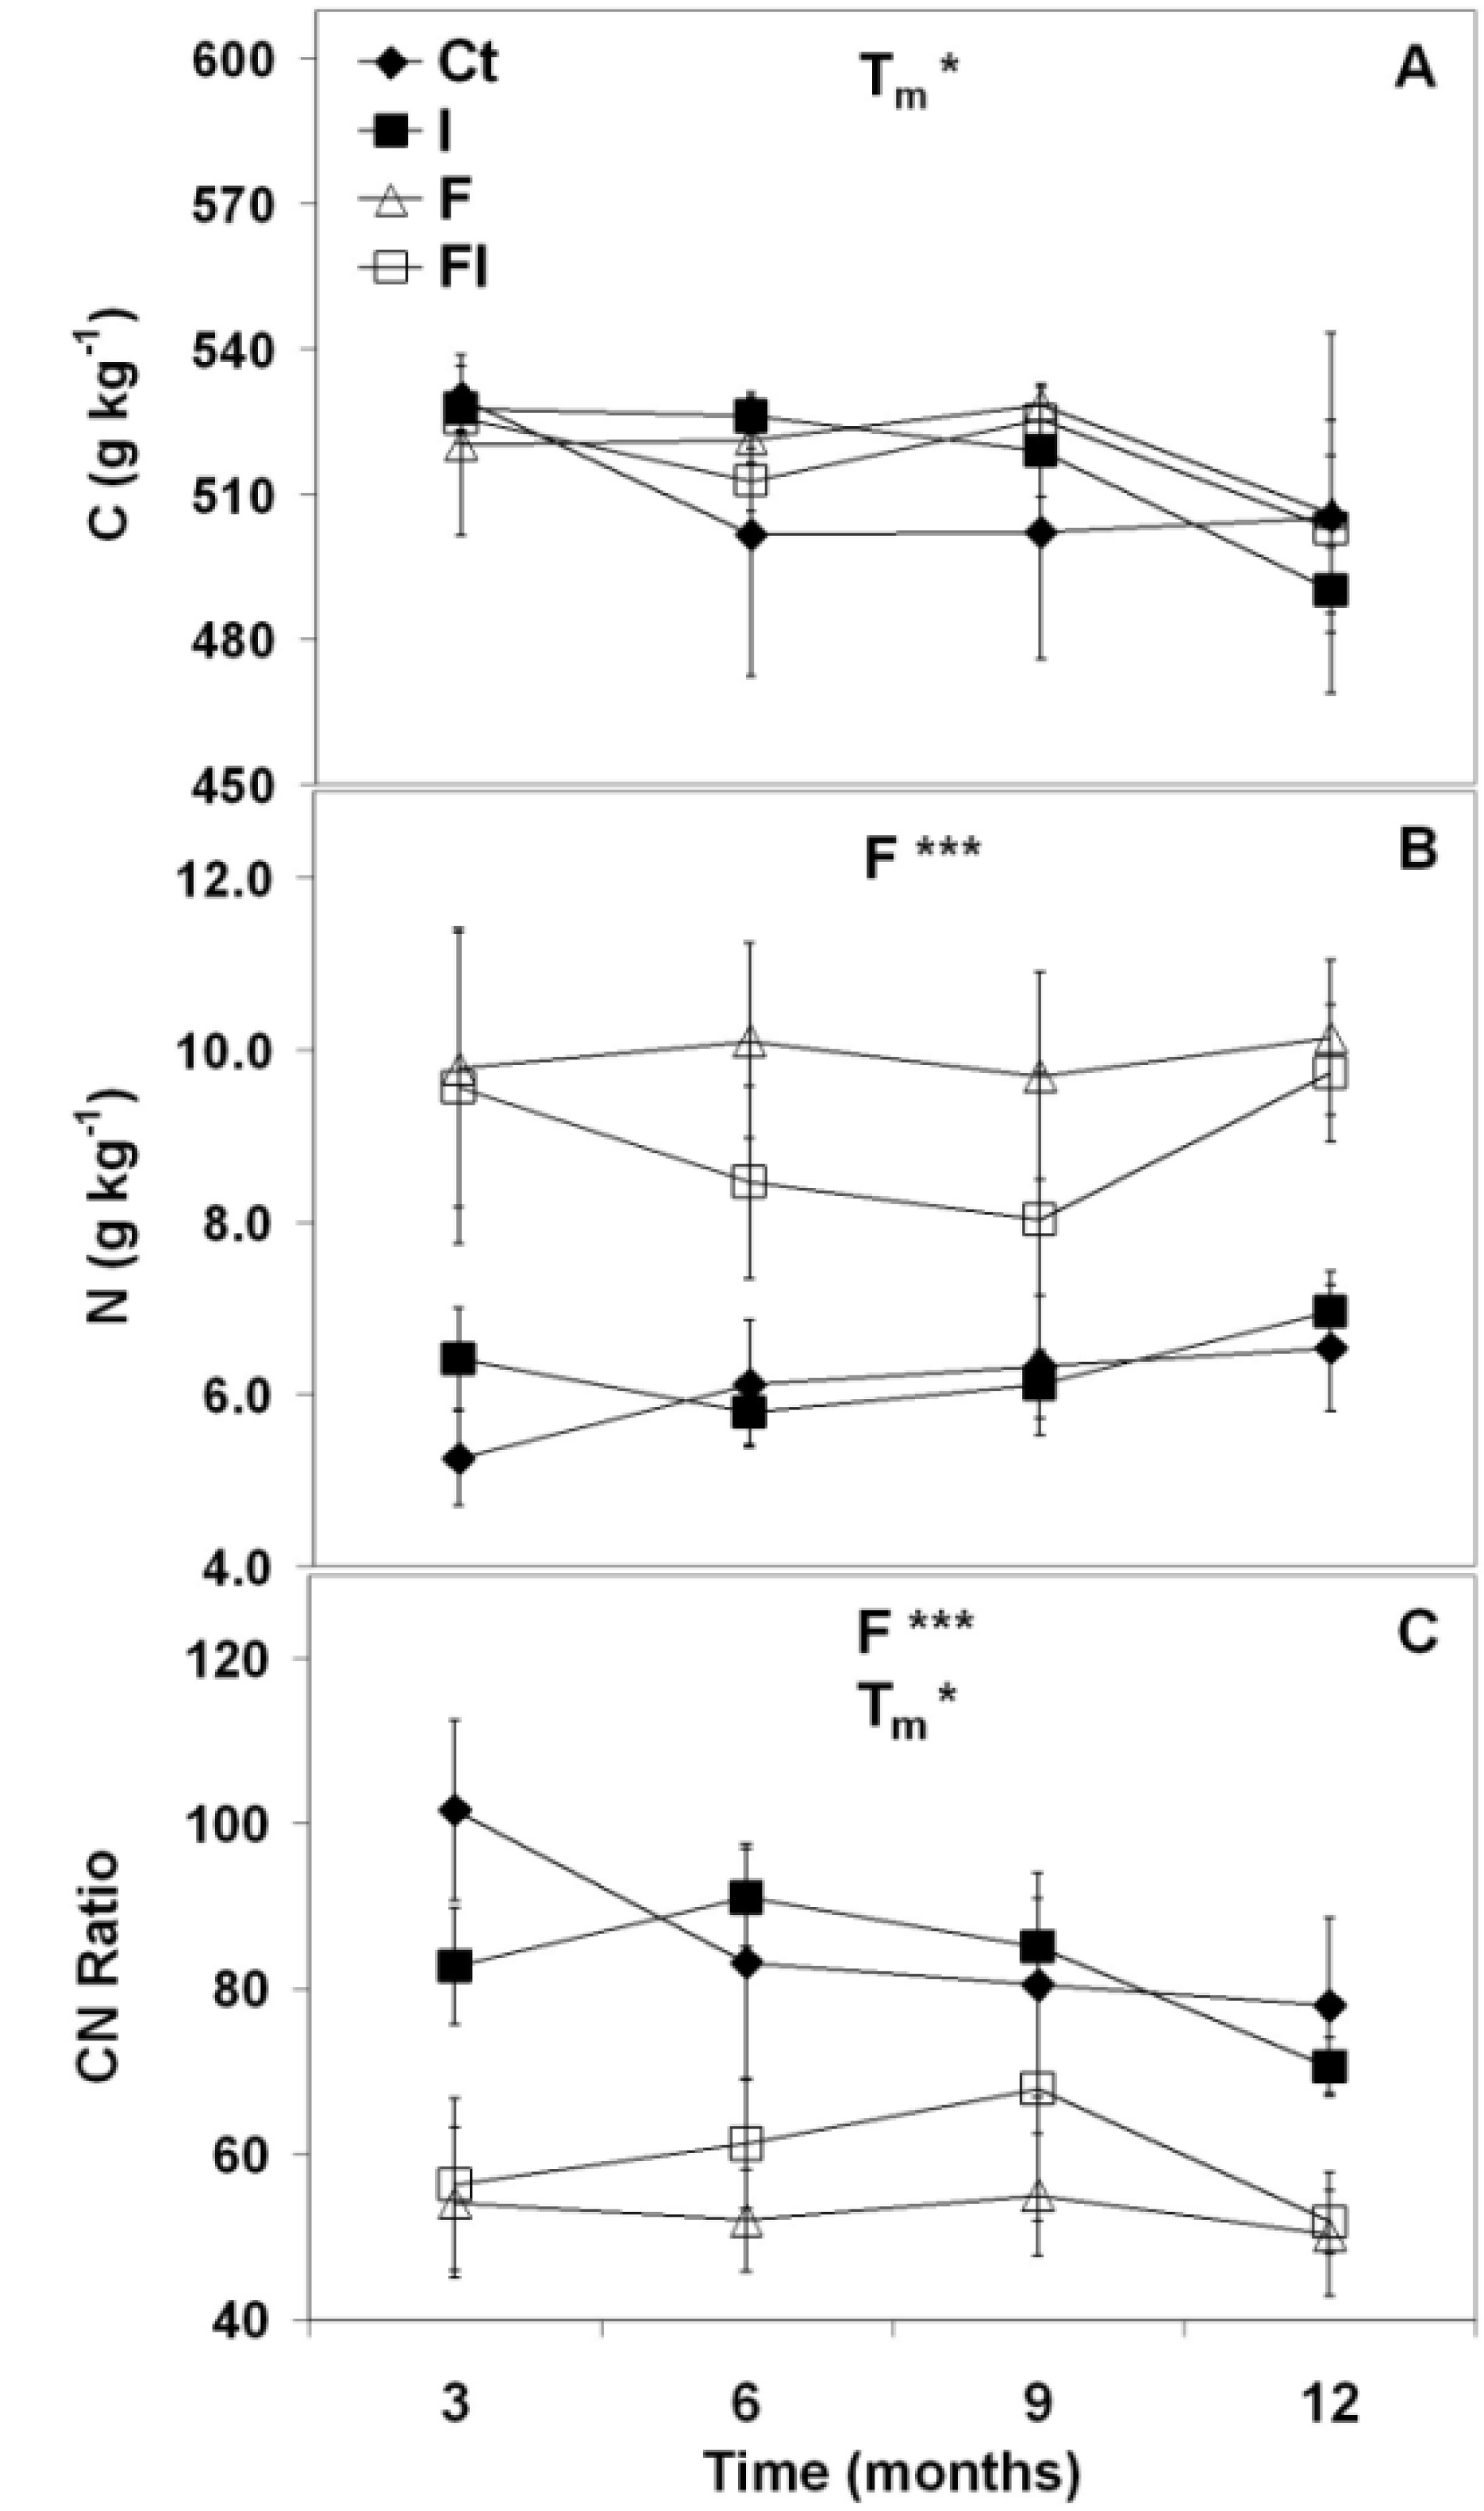
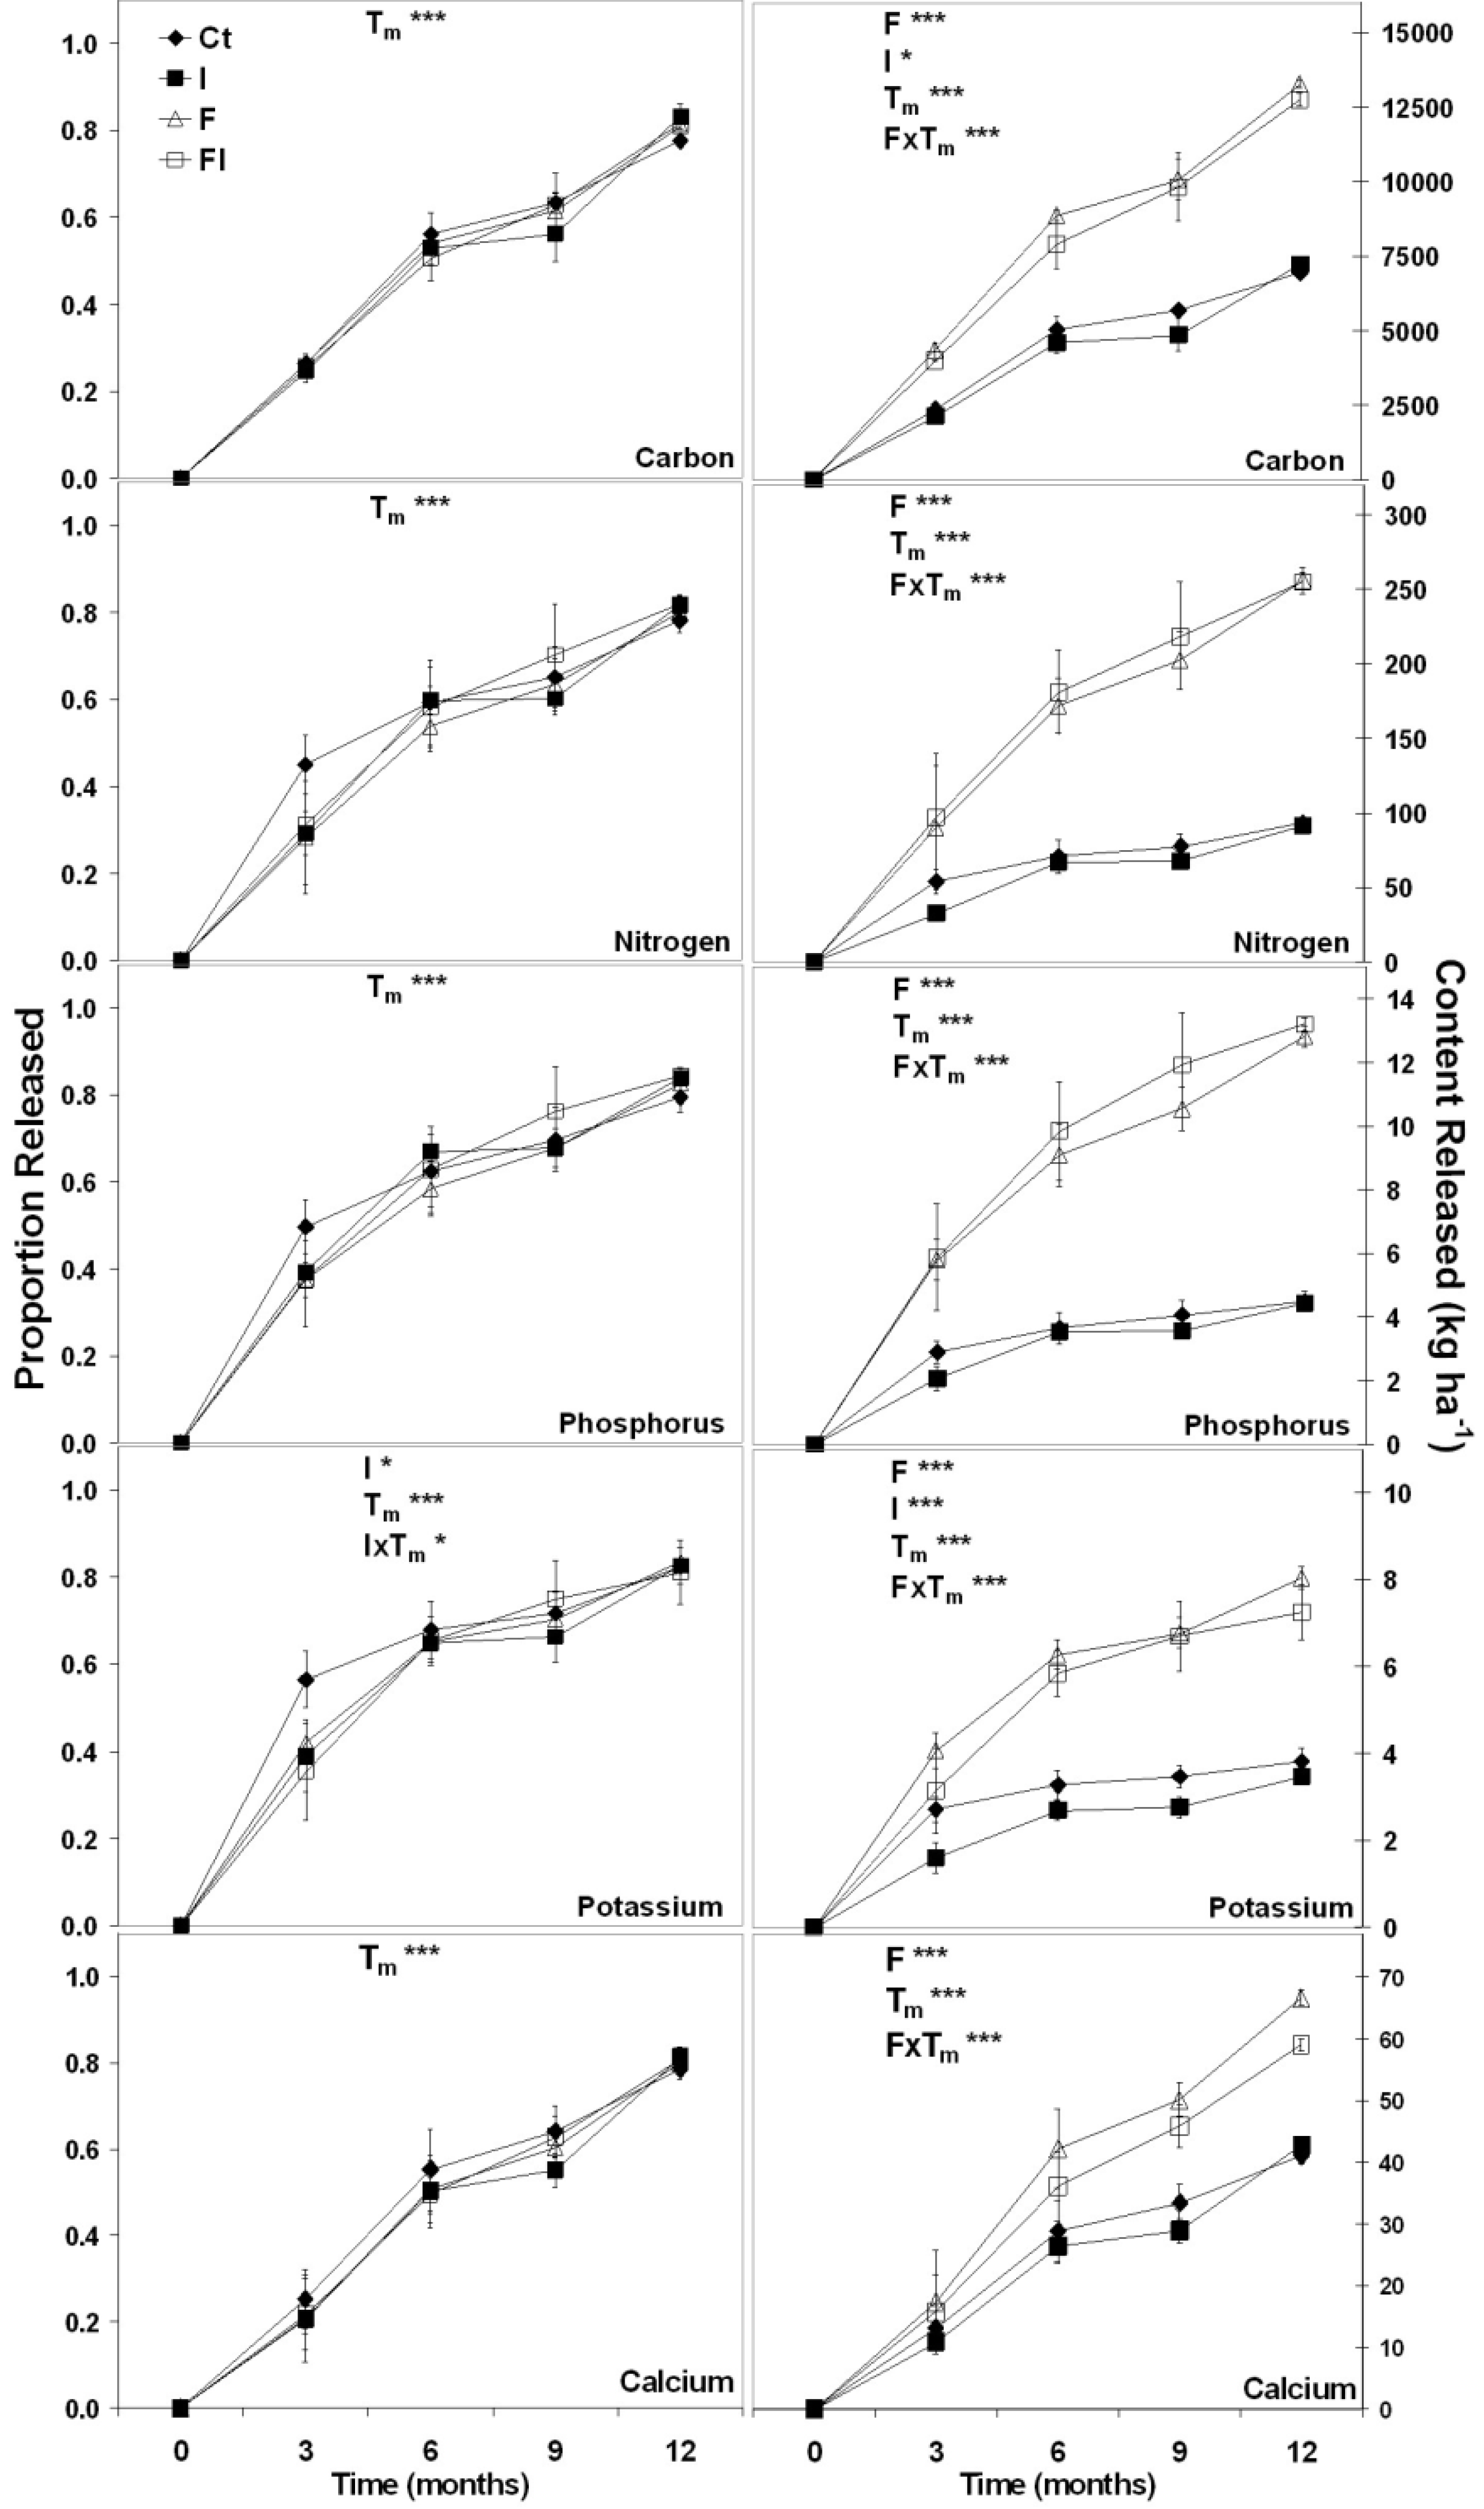
3.1.3. Simulated Disturbance Forest Floor Decomposition

The proportion of mass remaining varied only with time and was not affected by any treatment or interaction (Table 5). Since no treatment effects were found, all data were fit to one exponential decay model (Figure 1). Litterbags lost approximately 50% mass within 6 months and after 1 year of decomposition, approximately 25% of the initial mass was remaining (Figure 1). The decay rate constant for the experiment was k·year−1 = 1.371 (R2 = 0.89). The 95% confidence interval for k ranged from 1.306 to 1.436. This decay rate constant indicated an MRT99 of 3.6 years or 43 months. Comparison of the long-term forest floor decomposition rate (238 months) with the rate in a simulated disturbance environment (43 months) indicated removal of the overstory canopy greatly accelerated decomposition.
Table 5. F-Statistic and p-value for treatment and interaction effects on the proportion of mass remaining for the simulated disturbance forest floor decomposition experiment. Statistically significant p-values are shown in bold for the effects of fertilization (F), irrigation (I), time (Tm), and their interactions.
EffectProportion Mass Remaining
F-Statisticp-Value
F0.730.3973
I0.120.7356
Tm637.43<0.0001
Tm × F0.010.9348
Tm × I0.220.6451
Tm × I0.850.3616
Tm × F × I0.010.9058
Figure 1. The proportion of initial mass remaining as a function of time in years for the simulated forest floor decomposition experiment. Data were pooled by treatment due to no difference in decomposition among treatments. Also shown is the exponential decay regression line.
Forests 04 00595 g001
Carbon concentration of the forest floor litterbags decreased over time from approximately 525 g·kg−1 at 3 months to 500 kg·kg−1 at 12 months (Figure 2A). Litterbag N concentration was higher in F and FI treatments and did not vary with time during decomposition (Figure 2B). The CN ratio fluctuated over time (Figure 2C) generally indicating no large difference among 3 and 12 months with the exception of the Ct and I treatments where the CN ratio appeared to have decreased.
Figure 2. Mean litterbag C concentration (A), N concentration (B), and CN ratio (C) for forest floor Oi and Oe horizon material from May 2009 to May 2010 for the simulated forest floor decomposition experiment. Error bars represent 1 standard deviation. Main and interaction effects were significant at p < 0.05 (*), 0.001 (**), and 0.0001 (***). Effects: fertilization (F), irrigation (I), and time (Tm).
Forests 04 00595 g002
The proportion of C, N, P, and Ca released did not differ among treatments with the exception of an irrigation effect in the proportion of K released in month 3 (Figure 3). Since the decomposition rate and proportion of nutrients released were not affected by fertilization, fertilization effects on nutrient contents released occurred simply as a function of higher nutrient concentrations in the forest floor of fertilized treatments. At the end of the 1 year decomposition period, C content released as the mean of unfertilized and fertilized treatments was 7.1 and 13.0 Mg·ha−1, respectively (Figure 3). Nitrogen content released from unfertilized and fertilized treatments was 92 and 255 kg·ha−1, respectively (Figure 3). Phosphorus content released from unfertilized and fertilized treatments was 4.5 and 13.0 kg·ha−1, respectively (Figure 3). Potassium content released from unfertilized and fertilized treatments was 3.7 and 7.7 kg·ha−1, respectively (Figure 3). Calcium content released from unfertilized and fertilized treatments was 41.9 and 62.9 kg·ha−1, respectively (Figure 3). The proportion of C, N, and Ca released (Figure 3) appeared to mirror mass loss (Figure 1) while the proportion of P and K released (Figure 3) proceeded faster than mass loss implying some leaching of P and K. For example, after 0.25 years of incubation, the litterbags lost approximately 20%–30% mass (Figure 1). The proportion of C, N, and Ca released was within this range while the proportion of P and K released was higher, ranging from 30%–60% (Figure 3).
Figure 3. Mean litterbag C, N, P, K, and Ca proportion (left panels) and content (right panels) released from forest floor Oi and Oe horizon material from May 2009 to May 2010 for the simulated forest floor decomposition experiment. Error bars represent 1 standard deviation. Main and interaction effects were significant at p < 0.05 (*), 0.001 (**), and 0.0001 (***). Effects: fertilization (F), irrigation (I), and time (Tm).
Forests 04 00595 g003

3.2. Discussion

Results supported our hypothesis that fertilization increases litter N in the insoluble fraction and litter P in the soluble fraction and were consistent with results of a previous study [9]. It is important to note that insoluble-N and soluble-P comprised the majority of total-N and -P in unfertilized treatments as well. This suggests that fertilization only serves to magnify the residual-N and soluble-P trends that would otherwise be present without fertilization. Results were also consistent with those of a previous study [9] where residual-N comprised the majority of litter total-N in a study where litter N was not elevated by fertilization.
At SETRES, P fertilizer was last applied in 2002, 8 years prior to sampling in this study. Fertilization was found to double mineral soil Mehlich 3 extractable-P content [5]. Results suggest that this mineral soil pool supplied higher P to the trees as evidenced by sustained elevated P concentrations in foliage. The allocation of at least 50% of litter P in soluble fractions suggests that P will be readily released from the litter into the mineral soil. The high proportion (80%–90%) of litter N in the residual fraction suggests the opposite for N. A sustained growth response to P fertilization has been observed in numerous studies [30,31,32,33,34]. Results suggest this sustained growth response to P fertilization could be due to efficient cycling of P from the mineral soil into the foliage and then, release from the litter back into the soil to begin the cycle again. Our results regarding N and P cycling were in agreement with processes outlined by Switzer and Nelson [35] who proposed that while N cycling was predominantly biochemical, cycling within the plant and through forest floor decomposition, P cycling was biogeochemical, biochemical with the addition of cycling through the mineral soil.
The forest floor decomposition rate was not increased by fertilization supporting our hypothesis. This was consistent with prior studies that reported higher endogenous nutrient availability did not increase decomposition rates [8,11]. Our observation of no difference in decomposition rates among unfertilized and fertilized forest floors may have resulted from no difference in litter soluble carbohydrates. It is important to note however, that soluble phenols were higher in unfertilized litter. Decomposition was suggested by a number of studies [12,13,14,15] to be increased by higher soluble C availability and our results appeared to support these studies in terms of soluble carbohydrates.
Fertilization was also found to not increase the forest floor decomposition rate in a simulated disturbance environment. This appeared to provide further support for our hypothesis. However, this may not have been related to the effects of soluble C availability on heterotrophic decomposition. Rather, decomposition without an overstory canopy may shift the dominant decomposition process from biotic to abiotic with abiotic decomposition being photochemical mineralization that is aided by lignin due to preferential absorption of photon energy by the large lignin molecules [36]. In a previous study at SETRES, foliar lignin concentration was not altered by fertilization [37]. Other studies that examined decomposition of various plant materials without an overstory canopy concluded that photodegradation [38,39] and photochemical mineralization [40] from ultraviolet (UV) radiation increased decomposition. These studies offer a plausible explanation for the differences in trends of N accumulations during decomposition of loblolly pine litter among under canopy litterbag studies [7,8] and our study where litterbags were decomposed without an overstory canopy and N concentration did not vary with time. In general, under canopy decomposition is dominated by biotic processes where an accumulation of N is observed over time [7,8,41] and mass loss becomes asymptotic when labile C sources are depleted leaving only the more recalcitrant lignin C sources [42,43]. Degradation of lignin then begins when lignin concentrations increase to 30% [42]. Accumulations of N under biotic decomposition have been suggested to result from an increase in fungal biomass N [44,45]. Differences in the dominant decomposition process likely resulted in the greatly accelerated mass loss (MRT99 = 43 months) when loblolly pine forest floor was decomposed without an overstory canopy compared to our estimate of mass loss under the canopy (MRT99 = 238 months) and MRT99 estimates from previous studies of approximately 150 months [7,8].
Based on our results, a quick release of nutrients from the decomposing forest floor would be expected to occur following removal of the overstory canopy at harvest. However, other studies suggest our results may be specific to the southeastern U.S., more specifically, a latitudinal and hence, solar radiation effect on abiotic decomposition processes. In contrast to our results from a loblolly pine plantation in NC, a release of nutrients was not observed in a mixed boreal forest for 3–4 years following clearcutting [46]. In another boreal forest clearcut study, Pacific silver fir (Abies amabilis [Dougl.] Forbes), western hemlock (Tsuga heterophylla [Raf.] Sarg.), and western red cedar (Thuja plicata Donn.) forest floor mass and N content did not differ from the uncut site until 6 years after harvesting [47]. In another similar study in British Columbia, Western hemlock forest floor lost approximately 5% mass 1 year after harvest and fresh litter lost approximately 25% mass [48]. In a study of red pine (Pinus resinosa Sol. ex. Aiton) litter in Michigan, after 2 years canopy removal did not alter decomposition and nutrient release [49].
Quick release of nutrients from the decomposing forest floor may also occur following canopy removal from thinning [50]. However, whether this occurs is dependent upon the size of the canopy gap created by thinning. In a review of studies examining the influence of the forest canopy on nutrient cycling, Prescott [50] found that single tree thinning does not increase N availability while canopy gaps from 0.07 ha to 0.25 ha and a removal of 15 trees did increase N availability. This suggests the potential for a mid-rotation thinning to result in increased nutrient availability at a time when canopy expansion can occur and tree demand is relatively high. Further studies are warranted that investigate the influence of different thinning regimes on increases in nutrient availability from forest floor decomposition and the consequent effects on tree growth.

4. Conclusions

Nitrogen and P are the most growth limiting nutrients in southeastern U.S. forest plantations and represent the highest fertilizer cost. Efficient management of site N and P capital is therefore, essential. Studies suggest that management of site P capital is much less of an issue relative to N. In acidic soils across of range of textures, fertilization resulted in an accumulation of P in the mineral soil suggesting increased site P availability and a potential long-term improvement in tree growth from higher P nutrition [5,30,31,32,33,34]. However, on sandy mineral soils, fertilization with N mainly resulted in increases in forest floor N compared to mineral soil N [4,5]. Our results suggest that the forest floor N pool that has accumulated over the life of the stand will be quickly released following harvest. On sandy mineral soils, this accelerated decomposition and N mineralization can potentially result in a loss of a substantial amount of site N capital. Nitrification and losses of N through nitrate leaching can be prevalent following harvest [51]. The 255 kg·N·ha−1 released within 1 year of harvest from the fertilized forest floor represents a substantial amount of N particularly for N poor sites creating the need for management strategies to minimize loss of this N. Slash retention and incorporating the forest floor into the mineral soil by disking has been found to lead to retention of N following harvest by inhibiting decomposition [52]. Overall, this study and our findings suggest that further studies are also warranted that address the retention of accumulated forest floor N following harvest by investigating similar site preparation techniques across a gradient of inherent site conditions and soils.

Acknowledgments

Funding for this research was provided by the National Science Foundation’s Center for Advanced Forestry Systems, the Forest Productivity Cooperative, and Virginia Polytechnic Institute & State University.

Conflict of Interest

The authors declare no conflict of interest.

References

  1. Allen, H.L. Forest fertilizers: Nutrient amendment, stand productivity, and environmental impact. J. For. 1987, 85, 37–46. [Google Scholar]
  2. Fox, T.R.; Jokela, E.J.; Allen, H.L. The development of pine plantation silviculture in the southern US. J. For. 2007, 105, 337–347. [Google Scholar]
  3. Albaugh, T.J.; Allen, H.L.; Dougherty, P.M.; Kress, L.W.; King, J.S. Leaf-area and above- and belowground growth responses of loblolly pine to nutrient and water additions. For. Sci. 1998, 44, 317–328. [Google Scholar]
  4. Miller, H.G. Forest fertilization: Some guiding concepts. Forestry 1981, 54, 157–167. [Google Scholar] [CrossRef]
  5. Kiser, L.C.; Fox, T.R. Soil accumulation of nitrogen and phosphorus following annual fertilization of loblolly pine and sweetgum on sandy sites. Soil Sci. Soc. Am. J. 2012, 76, 2278–2288. [Google Scholar] [CrossRef]
  6. Polglase, P.J.; Comerford, N.B.; Jokela, E.J. Nitrogen and phosphorus release from decomposing needles of southern pine plantations. Soil Sci. Soc. Am. J. 1992, 56, 914–920. [Google Scholar] [CrossRef]
  7. Piatek, K.B.; Allen, H.L. Are forest floors in mid-rotation loblolly pine stands a sink for nitrogen and phosphorus? Can. J. For. Res. 2001, 31, 1164–1174. [Google Scholar] [CrossRef]
  8. Sanchez, F. Loblolly pine needle decomposition and nutrient dynamics as affected by irrigation, fertilization, and substrate quality. For. Ecol. Manag. 2001, 152, 85–96. [Google Scholar] [CrossRef]
  9. Polglase, P.J.; Jokela, E.J.; Comerford, N.B. Phosphorus, nitrogen, and carbon fractions in litter and soil of southern pine plantations. Soil Sci. Soc. Am. J. 1992, 56, 566–572. [Google Scholar] [CrossRef]
  10. Polglase, P.J.; Comerford, N.B.; Jokela, E.J. Leaching of inorganic phosphorus from litter of southern pine plantations. Soil Sci. Soc. Am. J. 1992, 56, 573–577. [Google Scholar] [CrossRef]
  11. Prescott, C.E. Does N availability control rates of litter decomposition in forests? Plant Soil 1995, 168–169, 83–88. [Google Scholar] [CrossRef]
  12. Osono, T.; Ono, Y.; Takeda, H. Fungal ingrowth on forest floor and decomposing needle litter of Chamaecyparis obtusa in relation to resource availability and moisture condition. Soil Biol. Biochem. 2003, 35, 1423–1431. [Google Scholar] [CrossRef]
  13. Schimel, J.P.; Weintraub, M.N. The implications of exoenzyme activity on microbial carbon and nitrogen limitation in soil: A theoretical model. Soil Biol. Biochem. 2003, 35, 549–563. [Google Scholar] [CrossRef]
  14. Kalbitz, K.; Meyer, A.; Yang, R.; Gerstberger, P. Response of dissolved organic matter in the forest floor to long-term manipulation of litter and throughfall inputs. Biogeochemistry 2007, 86, 301–318. [Google Scholar] [CrossRef]
  15. Klotzbucher, T.; Kaiser, K.; Guggenberger, G.; Gatzek, C.; Kalbitz, K. A new conceptual model for the fate of lignin in decomposing plant litter. Ecology 2011, 92, 1052–1062. [Google Scholar] [CrossRef]
  16. Adams, M.B.; Allen, H.L.; Davey, C.B. Accumulation of starch in roots and foliage of loblolly pine (Pinus taeda L.): Effects of season, site and fertilization. Tree Physiol. 1986, 2, 35–46. [Google Scholar] [CrossRef]
  17. Balsberg-Pahlsson, A. Influence of nitrogen fertilization on minerals, carbohydrates, amino acids, and phenolic compounds in beech (Fagus sylvatica L.) leaves. Tree Physiol. 1992, 10, 93–100. [Google Scholar] [CrossRef]
  18. Albaugh, T.J.; Allen, H.L.; Dougherty, P.M.; Johnsen, K.H. Long term growth responses of loblolly pine to optimal nutrient and water resource availability. For. Ecol. Manag. 2004, 192, 3–19. [Google Scholar] [CrossRef]
  19. Albaugh, T.J.; Allen, H.L.; Fox, T.R. Nutrient use and uptake in Pinus taeda. Tree Physiol. 2008, 28, 1083–1098. [Google Scholar] [CrossRef]
  20. Albaugh, T.J.; North Carolina State University, Raleigh, NC, USA. Personal Communication, 2008.
  21. Kedrowski, R.A. Extraction and analysis of nitrogen, phosphorus, and carbon fractions in plant material. J. Plant Nutr. 1983, 6, 989–1011. [Google Scholar] [CrossRef]
  22. Keeny, D.R.; Nelson, D.W. Nitrogen–Inorganic Forms. In Methods of Soil Analysis Part 2, 2nd ed.; Page, A.L., Ed.; Agronomy Monograph: Madison, WI, USA, 1982; Volume 9, pp. 643–698. [Google Scholar]
  23. Murphy, J.; Riley, J.P. A modified single solution method for the determination of phosphate in natural waters. Anal. Chim. Acta 1962, 27, 31–36. [Google Scholar] [CrossRef]
  24. Dubois, M.; Giles, K.A.; Hamilton, J.K.; Rebers, P.A.; Smith, F. Colorimetric method for determination of sugar and related substances. Anal. Chem. 1956, 28, 350–356. [Google Scholar] [CrossRef]
  25. Price, M.L.; Butler, L.G. Rapid visual estimation and spectrophotometric determination of tannin content of sorghum grain. J. Agric. Food Chem. 1977, 25, 1268–1273. [Google Scholar] [CrossRef]
  26. Chapin, F.S., III; Kedrowski, R.A. Seasonal changes in nitrogen and phosphorus fractions and autumn retranslocation in evergreen and deciduous taiga trees. Ecology 1983, 64, 376–391. [Google Scholar] [CrossRef]
  27. Olson, J.S. Energy storage and the balance of producers and decomposers in ecological systems. Ecology 1963, 44, 322–331. [Google Scholar] [CrossRef]
  28. Schlesinger, W.H.; Hasey, M.M. Decomposition of chaparral shrub foliage: Losses of organic and inorganic constituents from deciduous and evergreen leaves. Ecology 1981, 62, 762–774. [Google Scholar] [CrossRef]
  29. Littell, R.C.; Henry, P.R.; Ammerman, C.B. Statistical analysis of repeated measures data using SAS Procedures. J. Anim. Sci. 1998, 76, 1216–1231. [Google Scholar]
  30. Ballard, R. Effect of first rotation phosphorus applications on fertilizer requirements of second rotation pine. N. Z. J. For. Sci. 1978, 8, 135–145. [Google Scholar]
  31. Gentle, S.W.; Humphreys, F.R.; Lambert, M.J. Continuing response of Pinus radiata to phosphate fertilizers over two rotations. For. Sci. 1986, 32, 822–829. [Google Scholar]
  32. Comerford, N.B.; McLeod, M.; Skinner, M. Phosphorus form and bioavailability in the pine rotation following fertilization: P fertilization influences P form and potential bioavailability to pine in the subsequent rotation. For. Ecol. Manag. 2002, 169, 203–211. [Google Scholar] [CrossRef]
  33. Crous, J.W.; Morris, A.R.; Schole, M.C. The significance of residual phosphorus and potassium fertilization in countering yield decline in a fourth rotation of Pinus patula in Swaziland. South. Hemisph. For. J. 2007, 69, 1–8. [Google Scholar] [CrossRef]
  34. Everett, C.J.; Palm-Leis, H. Availability of residual phosphorus fertilizer for loblolly pine. For. Ecol. Manag. 2009, 258, 2207–2213. [Google Scholar] [CrossRef]
  35. Switzer, G.L.; Nelson, L.E. Nutrient accumulation and cycling in loblolly pine (Pinus taeda L.) plantation ecosystems: The first twenty years. Soil Sci. Soc. Am. J. 1972, 36, 143–147. [Google Scholar] [CrossRef]
  36. Austin, A.T.; Ballare, C.L. Dual role of lignin in plant litter decomposition in terrestrial ecosystems. Proc. Natl. Acad. Sci. USA 2010, 107, 4618–4622. [Google Scholar] [CrossRef]
  37. Booker, F.L.; Maier, C.A. Atmospheric carbon dioxide, irrigation, and fertilization effects on phenolic and nitrogen concentrations in loblolly pine (Pinus taeda) needles. Tree Physiol. 2001, 21, 609–616. [Google Scholar] [CrossRef]
  38. Austin, A.T.; Vivanco, L. Plant litter decomposition in a semi-arid ecosystem controlled by photodegradation. Nature 2006, 442, 555–558. [Google Scholar] [CrossRef]
  39. Brandt, L.A.; King, J.Y.; Hobbie, S.E.; Milchunas, D.G.; Sinsabaugh, R.L. The role of photodegradation in surface litter decomposition across a grassland ecosystem precipitation gradient. Ecosystems 2010, 13, 765–781. [Google Scholar] [CrossRef]
  40. Brandt, L.A.; Bohnet, C.; King, J.Y. Photochemically induced carbon dioxide production as a mechanism for carbon loss from plant litter in arid ecosystems. J. Geophys. Res. 2009, 114. [Google Scholar] [CrossRef]
  41. Vogt, K.A.; Grier, C.C.; Meier, C.E.; Keyes, M.R. Organic matter and nutrient dynamics in forest floors of young and mature Abies amabilis stands in western Washington, as affected by fine-root input. Ecol. Monogr. 1983, 53, 139–157. [Google Scholar] [CrossRef]
  42. Berg, B.; Staaf, H. Decomposition rate and chemical changes of Scots pine needle litter. II. Influence of chemical composition. Ecol. Bull. 1980, 32, 373–390. [Google Scholar]
  43. Melillo, J.M.; Aber, J.D.; Linkins, A.E.; Ricca, A.; Fry, B.; Nadelhoffer, K.J. Carbon and nitrogen dynamics along the decay continuum: Plant litter to soil organic matter. Plant Soil 1989, 115, 189–198. [Google Scholar] [CrossRef]
  44. Berg, B.; Soderstrom, B. Fungal biomass and nitrogen in decomposing Scots pine needle litter. Soil Biol. Biochem. 1979, 11, 339–341. [Google Scholar] [CrossRef]
  45. Tian, X.J.; Sun, S.C.; Ma, K.P.; An, S.Q. Behavior of carbon and nutrients within two types of leaf litter during 3.5 year decomposition. Acta Bot. Sin. 2003, 45, 1413–1420. [Google Scholar]
  46. Jerabkova, L.; Prescott, C.E.; Kishchuk, B.E. Effect of variable-retention harvesting on soil nitrogen availability in boreal mixedwood forests. Can. J. For. Res. 2006, 36, 3029–3038. [Google Scholar] [CrossRef]
  47. Martin, W.L.; Bradley, R.L.; Kimmins, J.P. Post-clearcutting chronosequence in the BCcoastal western hemlock zone: I. Changes in forest floor mass and N storage. J. Sustain. For. 2002, 14, 1–22. [Google Scholar]
  48. Titus, B.D.; Prescott, C.E.; Maynard, D.G.; Mitchell, A.K.; Bradley, R.L.; Feller, M.C.; Beese, W.J.; Seely, B.A.; Benton, R.A.; Senyk, J.P.; et al. Post-harvest nitrogen cycling in clearcut and alternative silvicultural systems in a montane forest in coastal British Columbia. For. Chron. 2006, 82, 844–859. [Google Scholar]
  49. Kim, C.; Sharik, T.L.; Jurgensen, M.F. Canopy cover effects on mass loss, and nitrogen and phosphorus dynamics from decomposing litter in oak and pine stands in northern Lower Michigan. For. Ecol. Manag. 1996, 80, 13–20. [Google Scholar] [CrossRef]
  50. Prescott, C.E. The influence of the forest canopy on nutrient cycling. Tree Physiol. 2002, 22, 1193–1200. [Google Scholar] [CrossRef]
  51. Vitousek, P.M.; Matson, P.A. Mechanisms of nitrogen retention in forest ecosystems: A field experiment. Science 1984, 225, 51–52. [Google Scholar]
  52. Fox, T.R.; Burger, J.A.; Kreh, R.E. Effects of site preparation on nitrogen dynamics in the southern Piedmont. For. Ecol. Manag. 1986, 15, 241–256. [Google Scholar] [CrossRef]

